project management road trip for the project management
TRANSCRIPT


Project Management Road Trip for the Project Management Professional:Your Key to PMP Certification and Understanding the PMBOK Fourth Edition
© Copyright 2009 by J. Alex Sherrer
ALL RIGHTS RESERVEDVersion 2010.02.06
Visit Project Management Road Trip on the Internet at http://www.PMRoadTrip.com
“PMI,” “PMP,” “Project Management Professional” and “PMBOK” are registered certification marks ofthe Project Management Institute, Inc. in the United States and other nations.
“Project Management Road Trip” is a registered trademark of Joel Alex Sherrer.
Although the author has made every effort to ensure accuracy and completeness of information containedin this book, he can assume no responsibility for errors, inaccuracies, omissions, or inconsistenciescontained herein.

TABLE OF CONTENTS
8.0 Project Quality Management ............................................................................................... 221-262Overview ................................................................................................................................ 2238.1 Plan quality ....................................................................................................................... 231Quality planning tools ............................................................................................................. 2348.2 Perform quality assurance ................................................................................................. 2438.3 Perform quality control ..................................................................................................... 247Quality control tools ............................................................................................................... 251Chapter summary.................................................................................................................... 259Exam summary ....................................................................................................................... 260


CHAPTER 8: QUALITY MANAGEMENT 8
Project Management Road Trip® 221 8: Quality Management
The Project QualityManagement processesensure that the project'sdeliverables meet therequirements for which theproject has been undertaken,as well as making sure theproject's processes alignwith the qualityrequirements of theperforming organization.
8.0 Project quality management

CHAPTER 8: QUALITY MANAGEMENT 8
Project Management Road Trip® 222 8: Quality Management
Keywords
Accuracy Affinity diagram Attribute sampling Brainstorming Benchmarking Cause and effect diagram Common cause Continuous improvement Control chart Control limits Cost of quality Cost-benefit analysis Crosby Deming Design of experiments Flowchart Force field analysis Grade Histogram Inspection Ishikawa ISO 9000 Juran Marginal analysis Matrix diagram Mutually exclusive
Nominal group technique Pareto chart Precision Prevention Process analysis Process improvement plan Quality Quality assurance Quality audits Quality baseline Quality checklists Quality control Quality management plan Quality metrics Rule of Seven Run chart Scatter diagram Shewhart Six Sigma Special cause Standard deviation Statistical sampling Statistically independent Tolerances Total Quality Management Variable sampling

CHAPTER 8: QUALITY MANAGEMENT 8
Project Management Road Trip® 223 8: Quality Management
Project Quality Management is comprised of three processes:
Plan Quality: Establish and plan for meeting project quality requirements.
Perform Quality Assurance: Ensure the project is meeting the requirements established in theproject quality management plan.
Perform Quality Control: Make sure the deliverables are meeting their quality requirements.
Activities performed in the project quality management processes ensure the project’s product, service,or result meets the requirements for which the project was undertaken, the expectations of the customer,and that the project’s activities are efficiently executed. Because a project is only one component of largerendeavors, quality management has to stretch beyond the project’s boundaries, so project qualitymanagement is concerned not just on the deliverables the project is creating but on the management of theproject itself and of the processes used by the activities performed within the project. While productquality improvement efforts primarily benefit the customer through lower product costs, benefits fromprocess improvements are reaped by the performing organization both within and outside the projectthrough better work processes.
Overview
CHAPTER 8: QUALITY MANAGEMENT 8
Project Management Road Trip® 224 8: Quality Management
The blunt reality of business is that basic customersatisfaction is no longer adequate for businesses toremain successful. Basic satisfaction simply means thatthey might use your services in the future --unless abetter offer comes up. Satisfaction is little more thanthe absence of dissatisfaction, and there's no glory injust squeaking by.3
Craig Cochran, author of Customer Satisfaction: Tools, Techniquesand Formulas for Success and The Continual Improvement Process.
Quality management and project quality management complement each other in that they both stress:
Customer satisfaction: Quality is all about meeting the expectations and requirements of thecustomer and stakeholders and creating a product that fulfills those needs and is fit for itsintended use.
Prevention: Quality is achieved by planning, designing, and building it into a product or processfrom the inception.
Management responsibility: It’s up to the project team to ensure the success of quality effortsbut it is up to organizational management to provide the financial resources needed for qualityefforts to succeed.
Continuous improvement: Quality and process improvement relies on the ongoing plan-do-check-act cycle.
But before we can jump into these processes and what they do, we need to first make sure we understandjust what quality and grade refer to. Quality is "the degree to which a set of inherent characteristics fulfillrequirements"1 while grade is "a category assigned to products or services having the same functional usebut different technical characteristics."2
We generally think of quality as embodying a superior property, such as this brand of laundry detergent isbetter quality than another brand. But grade is separate from quality, and the two are often mistakenlyconfused. Grade is largely determined by characteristics while quality is based on meeting expectations,so we can have a low-grade product that is high quality or vice-versa a high-grade product that is lowquality.
Because quality is based solely on fulfillinga customer's explicit and implicitrequirements, different customers will havea different view of what quality is. Forexample, if we have only $10 to spend on abouquet of flowers then our expectationsare probably in the neighborhood of a lowergrade of flowers, such as a bouquet ofdaisies. But on the other hand, if we'rewilling to spend $100 then we're probablygoing into the flower shop looking for high-grade flowers like long-stemmed roses. Let’s imagine that webought both, but after only one day the roses faded and began to droop; however, the daisies lasted for awhole week. We probably expected the roses to last longer than a day, so they failed to live up to ourquality expectations while the daisies exceeded our expectations. So the lower grade product was highquality, and the higher grade product failed our expectations, and so was of lower quality.
The difference between grade and quality is important because it's the responsibility of the projectmanagement team in collaboration with the stakeholders to determine what the required levels of bothwill be and then developing a plan for quality that ensures those requirements are met while ending upwith a product, service, or result that is fit for the customer’s intended use.
Quality overview

CHAPTER 8: QUALITY MANAGEMENT 8
Project Management Road Trip® 225 8: Quality Management
Phillip B. Crosby was a businessman and authorwho wrote 12 books on quality. His first book in1979, Quality Is Free, was widely read and popularin the 1980s. His book included DIRFT (do it rightthe first time) and four major principles:
quality is "conformance to requirements" the system of quality is prevention the performance standard is zero defects the measurement of quality is the price of
nonconformance
Armand V. Feigenbaum wrote the 1951 book,Quality Control: Principles, Practice, andAdministration. He was the first to write aboutquality costs as the costs of prevention, appraisal,and internal and external failure.5
William Edwards Deming developed new samplingtechniques while working on the 1940 U.S. census.He was later involved in the 1951 Japanese Census,and it was in Japan that he began to train engineers,managers, and scholars in statistical process controland quality concepts.
Deming's primary message to Japanese companieswas that improving quality will reduce expenseswhile increasing productivity and market share.4 Inthe post-WWII environment, Japanese industryeagerly adopted Deming's processes. The qualityof Japanese products drastically improved over thedecades, and by the late 1970s U.S. companiessought Deming out to help them turn around theirown quality problems.
Kaoru Ishikawa pioneered quality managementprocesses at the Kawasaki shipyards in Japan. He'sbest known for the cause-and-effect diagram thatbears his name (Ishikawa diagram), but hiscontributions to quality management also includeinvolving senior management in quality efforts andshowing the importance of the seven basic qualitytools. Ishikawa also expanded Deming's Plan-Do-Check-Act Cycle into six elements6:
Quality pioneers
Crosby
Feigenbaum
Ishikawa
Deming
CHAPTER 8: QUALITY MANAGEMENT 8
Project Management Road Trip® 226 8: Quality Management
…TQM is not some passing fad; many companieswhich could benefit have yet to give the plan a realtrial. Some proponents of TQM may only be makinghalf-hearted efforts or doing what could best bedescribed as PQM, or "Partial Quality Management."9
Daiv Russell, management and marketing consultant with EnvisionConsulting.
Joseph Juran was one of the most enthusiasticadvocates of quality. His 1951 handbook QualityControl Handbook excited many post-World War IIJapanese companies. In 1954 Juran met with manyJapanese companies and started courses in qualitymanagement.
While Deming was seen as focusing more onstatistical quality control, Juran focused on trainingmanagers for quality. He's often seen asintroducing the human element into qualitymanagement, and he developed the "Juran trilogy,"which is a management approach consisting ofthree processes: planning, control, andimprovement.7
Walter A. Shewhart was a statistician and isreferred to as the father of statistical qualitycontrol8. Shewhart introduced the concept ofmodern process quality control while working withWestern Electric to improve the reliability of BellTelephone's transmission systems.9
Gen'ich Taguchi was a statistician who workedwith Walter A. Shewhart in the mid-1950s.Taguchi concentrated on quantifying losses fromprocess variations, and he introduced a number ofinnovations used in design of experiments (DOE).
The PMBOK project quality processes are compatible with other quality management approaches. It'snecessary for the project team to have a general understanding of different quality managementapproaches for a couple of reasons. The first is because when projects are performed for externalcustomers, the customer may require project quality management to align with its own organizationalpractices. The second is that when a performing organization doesn't have a formal quality managementmethodology or there are multiple methodologies in place because several organizations are involved inthe project, it's up to the project team to develop their own quality policy for the project.
Overview: TQM embeds awareness of and participation in quality activities throughout all of anorganization’s processes and its business, management, and culture. TQM aims to provide increasedcustomer satisfaction at ever lower costs.
History: Armand Fiegenbaum introducedthe concept of Total Quality Control in his1951 book, Quality Control: Principles,Practice, and Administration. Over time,Fiegenbaum's idea evolved through theefforts of W. Edwards Deming, JosephJuran, Phillip B. Crosby, and KaoruIshikawa into Total Quality Management.TQM continues to evolve and is embedded in other management practices.
Quality management and process improvement approaches
Juran Shewhart
Taguchi
Total Quality Management (TQM)

CHAPTER 8: QUALITY MANAGEMENT 8
Project Management Road Trip® 227 8: Quality Management
...we require all our IT people to be trained inSix Sigma and to be Six Sigma green belts...Ifyou think about what IT people do in our model,they are project leads and business analysts. SixSigma is about leading projects, doing analysisand process improvement.10
Gail Farnsley, CIO, Cummins
Philosophy:Five basic principles involved in TQM
1. Management commitment2. Employee empowerment3. Fact-based decision-making4. Continuous improvement5. Customer focus
Main TQM Elements Deming's Plan-Do-Check-Act Cycle drives the TQM process. Quality must be managed. Everyone is a customer to someone, and is a supplier to
somebody. Processes, not people, are the problem. Everyone within an organization is responsible for quality. Problems must be prevented and not just fixed. Quality improvements must be continuous. Quality goals are based on requirements and can't be
compromised. Life-cycle costs are what should be considered and not front-end
costs. Management must lead and support quality efforts.
Overview: Six Sigma focuses on continuous effortsto remove the causes of defects and varianceswithin processes. Efforts are driven by quantifiableand measureable results and passionate leadership.In Six Sigma, a defect is anything that can lead tocustomer dissatisfaction. Six Sigma is also inspiredby Deming's Plan-Do-Check-Act Cycle.
History: Six Sigma was first conceived andformulated by Bill Smith at Motorola.11 Though originally used in the manufacturing sector, Six Sigma isused in all types of businesses.
Philosophy: There are two core methods of Six Sigma. One for improving existing processes or productsand a second for creating new processes or products.
Six Sigma

CHAPTER 8: QUALITY MANAGEMENT 8
Project Management Road Trip® 228 8: Quality Management
...many organizations like to think of themselves asunique. So how does ISO 9001:2000 allow for thediversity...The answer is that ISO 9001:2000 laysdown what requirements your quality system mustmeet, but does not dictate how they should be metin any particular organization. This leaves greatscope and flexibility for implementation in differentbusiness sectors and business cultures, as well as indifferent national cultures.12
International Standards Organization, ISO 9000 Essentials
Overview: The International Standards Organization developed the ISO 9000 to help make sure thatcompanies follow their own proscribed processes.The ISO 9000 standard can be used by anycompany or industry. What we collectivelyrefer to as ISO 9000 actually contains threequality standards: ISO 9000:2005, ISO9001:2000, and ISO 9004:2000. ISOcertification (e.g., ISO 9001) is not a guaranteein itself of compliance to quality processes.
History: The first ISO 9000 version wascompleted in 1987 and has undergone severalrevisions.
Philosophy: The ISO 9000 standard has eight principles: Customer focus Leadership Involvement of people Process-based approach
System approach to management Continual improvement Factual approach to decision making Mutually beneficial supplier relationships
Overview: Failure mode and effect analysis looks for potential or actual defects in a process or productand studies their consequences.
History: FMEA was originally used in the military in the 1940s, used by NASA in the 1960s, and byFord Motor Company in the 1970s13. The updated FMEA procedures published in the MIL-STD-1629Adocument are those generally accepted in both military and commercial industries.
Philosophy: FMEA starts with a process diagram and a thorough analysis. Actual or potential failures arethen identified and their severity, number of occurrences, and how likely they are to be detected arelogged onto a matrix. Failures are then ranked by risk, and actions are identified to mitigate or preventfailures and improve early detection.
Overview: QFD aims to link the needs of the customer with all production components, such as design,development, engineering and manufacturing. Quality Function Deployment uses elements of systemsthinking, psychology, and epistemology to uncover explicit and unspoken customer needs and identifyingbusiness opportunities.
History: QFD was started by professors Shigeru Mizuno and Yoji Akao in Japan in the 1960s14. Thoughoriginally developed for manufacturing industries, QFD was adopted by in the 1980s by other industries,including software development and service industries.
ISO 9000
Failure Mode and Effect Analysis (FMEA)
Quality Function Deployment (QFD)

CHAPTER 8: QUALITY MANAGEMENT 8
Project Management Road Trip® 229 8: Quality Management
Philosophy: In very general terms, QFD followsfour phases to develop a house of quality. TheHOQ is matrix that represents the relationshipsbetween items in the matrix, and includes “rooms,”such as customer requirements, technicalrequirements, and targets.
Overview: CMMI® provides a framework that focuses on improving business processes by establishingbest practices and then appraising those organizations on a maturity level from one to five. A highermaturity level indicates that an organization’s practices are more likely to be efficient and quality-focused.
History: CMMI® was developed by a consortium of experts from Carnegie Mellon University, industry,and the U.S. government. There are currently three CMMI models that have been released between 2006and 2009.
Philosophy: Organizations undergo appraisals to determine their CMMI compliance and be awarded amaturity level rating.
1. Initial: The procedures for managing the process are reactive in nature rather than proactive.
2. Managed: The process is managed through isolated projects or similar efforts.
3. Defined: The process is tailored towards organizational needs rather than just being focused onisolated projectized objectives.
4. Quantitatively Managed: The process is aggressively measured and controlled.
5. Optimizing: There are concerted and ongoing efforts focused on improving the process.
Capability Maturity Model Integration (CMMI®)

CHAPTER 8: QUALITY MANAGEMENT 8
Project Management Road Trip® 230 8: Quality Management
There is not a single best quality methodology that applies to all organizations, and each company willhave its own unique approach based on its priorities, culture, industry, and environment. And just like aproject management methodology, it doesn't simply spring up overnight. It takes the commitment ofsenior management and ongoing efforts by everyone to reach a high quality management maturity level.Each organization will be at different maturity stages, which impacts what organizational processes andprocedures the project team can draw from in developing its project quality policy.
Many mature quality management organizations will have a quality management system (QMS), whichis the set of quality policies, procedures, and processes, that is thoroughly integrated into thedevelopment, production, manufacture, and service of its products. A QMS is a required element of ISOcertification.
In his 1979 book, Quality is Free, Phillip Crosby used the Quality Management Maturity Grid (QMMG)to show the traits and characteristics of organizations as they proceed from a low to a high maturity level.In the accompanying illustration, the QMMG levels are shown side-by-side with the main efforts inproject quality management. In Crosby’s model, companies proceed from a level of uncertainty (notknowing that quality problems exist) to a level of certainty (knowing not just that quality problems existbut what causes them).
Organizational quality

CHAPTER 8: QUALITY MANAGEMENT 8
Project Management Road Trip® 231 8: Quality Management
The Plan Qualityprocess determines whatquality standards areapplicable to the project,and how the qualityrequirements will bemet.
This process isperformed by theproject managementteam using several keyoutputs from otherproject managementprocesses. Qualityplanning is usuallydone in parallel withother project planningprocesses because theunderlying approach isthat quality is planned,designed, and builtinto the project and notsomething that isadded on later.
8.1 Plan quality

CHAPTER 8: QUALITY MANAGEMENT 8
Project Management Road Trip® 232 8: Quality Management
The common assumption is that continuousimprovement is small scale and that innovation isdiscontinuous and large scale. Yet there is nological reason to associate the term innovation withlarge-scale discontinuous change...Put more bluntly,there is plenty of innovation that occurs in thecourse of continuous improvement.15
Robert Cole, University of California-Berkley
This process is performed by the project management team, and it's done in parallel with other projectplanning processes because the underlying approach is that quality is planned, designed, and built into theproject and not something that is added on later.
The Plan Quality process results in:
quality metrics quality checklists the project quality baseline the process improvement plan the project quality management plan.
Quality metrics are the specific quality goals the project must meet and how the quality control processeswill confirm compliance. Quality metrics can include any type of applicable measurement, includingdefect rates, bug rates, failure rates, up-time, reliability, and coverage area.
Quality checklists are documents that outline the key steps that must be performed as part of qualitycontrol. Checklists are "to-do" lists that ensure that everything is performed and in the correct order. Thequality checklists that will be used later during the quality control process are developed here.
The project quality baseline is the agreed upon level of quality requirements the project must meet. It'sthe quality objectives of the project and the subsequent plan for achieving those objectives. In otherwords, the quality baseline is the current project quality management plan which itself reflects allapproved changes affecting quality.
The process improvement plan is integral to quality management's focus on continual improvement, andit details the steps that will be taken to analyze the project processes and eliminate waste and improve theefficiency of processes. This is accomplished by streamlining processes and eliminating non-value addedactivities, which will occur during the Perform Quality Assurance process.
Continuous improvement: benefits the customer by providing a more
cost efficient project deliverable
benefits the project by facilitating moreproductive processes
benefits the project team by reducinginefficient activities thus allowing the teammembers to focus on value-added efforts
benefits the performing organization beyond theproject life cycle through lower costs and a better use of resources.
Process improvement plan
CHAPTER 8: QUALITY MANAGEMENT 8
Project Management Road Trip® 233 8: Quality Management
Processes are interrelated sets of activities involving people, systems, and information, whose purpose isto achieve some kind of result. Processes drive all business functions, from manufacturing a product toback-office functions like accounts payable, and the great number of processes involved in a projectprecludes each and every one from being fully analyzed. The project team needs to establish the logicbehind what processes will be fully analyzed.
The process improvement plan will include:
Process characteristics and boundaries:A description of the process.What the policies are behind the process (what its purpose is, when it's to be performed, and whyit's needed).The roles involved in the process, including the process owner and process stakeholders.The starting and ending points of the process.The information or data it requires.The process inputs and outputs.The activities involved in the processIts relationships or dependencies to other processes.
Process configuration:A visual rendering, such as a flowchart, process map, or activity diagram, of the processillustrating all major systems, components, relationships, and process interfaces.
Process metrics:The measurements that will be performed against the process. Compiling measurements against aprocess can often be tedious and difficult, so whenever possible it's best to incorporate someautomatic means of measurement collection within the process.
Process improvement goals:The specific goals for process improvements, including what the targets will be and how will theybe measured.
The quality management plan is part of the project management plan, and the quality activities in it areexecuted during the Perform Quality Assurance process. The quality management plan establishes theproject's quality policy and describes how the project team will implement that policy through continualimprovement activities, quality assurance activities, and quality control activities. The performingorganization's quality policy is the foundation upon which the project's quality management plan is built.The project scope statement provides the deliverable requirements, and since quality is about fulfilling thecustomer’s requirements, the scope statement and stakeholder register are the source for those needs andexpectations.
Organizations with a mature quality management approach will likely have a quality department that canprovide assistance to the project management team. But there are two common challenges the projectmanagement team may face when beginning quality planning. The first is that the performingorganization may not have quality policy, and the second situation is when there are several organizationsinvolved in project activities and each has its own quality policy. In either of these situations, it's up to theproject management team to draft an agreeable quality policy for the project. This means that the projectmanagement team needs to have a good knowledge of overall quality management and its application tothe type of project being undertaken. When no organizational quality policy exists, developing a project
Quality management plan

CHAPTER 8: QUALITY MANAGEMENT 8
Project Management Road Trip® 234 8: Quality Management
quality policy can take some time, but the extra effort can also benefit subsequent projects by providing agrowing library of templates that they can draw from.
Once drafted the quality management plan undergoes some approval process. The acceptance of thequality management plan establishes the quality baseline for the project. This baseline is what level ofquality the project and its product, service, or result will meet. The project's size, scope, complexity, andapplication area are some factors that determine how extensive and formal the approval needs to be. Onsome projects this may involve only the project management team while on others the customer,stakeholder, and company management might be involved.
Quality planning tools help to determine both the content of and activities that will be taken whileimplementing the process improvement and project quality management plans. These tools also havemany uses beyond quality and can be used for product analysis, process analysis, alternativesidentification, and risk analysis.
Quality planning tools
Qualityplanningtools
Cost of quality
Cost-benefit analysis
Benchmarking
Brainstorming
Statistical sampling
Control charts
Design of experiments
Affinity diagrams
Force field analysis
Nominal group technique
Matrices
Flowcharting

CHAPTER 8: QUALITY MANAGEMENT 8
Project Management Road Trip® 235 8: Quality Management
A widely used and accepted rule of thumb in theconstruction industry suggests that a qualityproblem costing $100 to fix in the field would costonly $10 to fix if discovered during design and costjust $1 to have been prevented in the first place.16
Richard Smith, Is An Ounce of Prevention Really Worth a Poundof Cure
Quality involves costs, and the cost of qualityquantifies this cost. The cost of quality has twomain components –the cost of conforming toquality requirements and the cost of notconforming to quality requirements.
Cost of Good Quality (cost of conformance)Prevention Costs Quality management activities, such as
training and process documentation, andchecklist development.
Appraisal Costs Quality assurance activities, like appraisals
and audits Quality control activities, like testing and
inspections.
Cost of Poor Quality (cost of nonconformance)Internal Failure Costs Failures found by the project team,
including the costs related to rejects,rework, delays, shortages, scrap, and otherinefficiencies.
External Failure Costs Failures found by the customer, including
costs related to warranties, returns, lostsales, and lost good will
Many conformance costs are easy to measure sincethey can be tracked and quantified, but much of thecosts of nonconformance can be difficult todetermine, such as lost sales or a tarnished reputationdue to poor quality.
Cost of quality

CHAPTER 8: QUALITY MANAGEMENT 8
Project Management Road Trip® 236 8: Quality Management
To benchmark effectively, it isn't always necessaryto find a similar company or one within the sameindustry. "It's a matter of understanding that evencompanies or industries that are different can havesimilar core processes or common characteristics."17
Brian Andes, Director of Business Process Improvement,Tenneco, Inc.
As it relates to quality, cost-benefit analysis helps to determine the appropriate trade-off between qualityand the cost to achieve that level of quality. The goal of meeting the quality requirements is to reducecosts through less rework and higher productivity, but there are costs associated with meeting the qualityrequirements, and what we want to find is the agreeable level between quality requirements and the costsassociated with meeting those requirements. And just as we avoided gold-plating the scope, we likewisewant to avoid gold-plating the qualityrequirements. Exceeding the customer'squality requirements results in quality costsincurred by the project that provide no realbenefit to the customer.
Another purpose of cost-benefit analysis isrelated to continual improvement. As westrive for improving products and processes,we don't want to exceed a point beyond whichthe costs of the improvements aren't offset bythe anticipated increase in revenue (sales orprofits). This type of analysis is calledmarginal analysis.
Benchmarking compares similar processes between different organizations, helping to generate ideas forimprovement and to provide a measurementbasis by helping the organization determinewhat the "standard" is. Benchmarking can alsohelp process reengineering by introducing newapproaches to existing processes.
Technique:
Identify the process, problem or issue to beaddressed.
Benchmarking doesn't have to be formal to be effective --it can be as simple as sharing practices withothers through a PMI chapter meeting.
Find other companies that have a similar process, including researching public information on whatcompanies have a reputation for "best in breed."
Approach personnel from those companies --share the current process and ask them how they handleit. If applicable, survey trade group members (such as through newsgroups, user groups, or onlinecommunity forums).
Incorporate the new ideas learned and brainstorm to develop a new strategy for the process, problem,or issue.
Implement the new process or practice, and follow up by measuring the results and adjusting theprocess as needed.
Cost-benefit analysis
Benchmarking

CHAPTER 8: QUALITY MANAGEMENT 8
Project Management Road Trip® 237 8: Quality Management
Brainstorming is a general term applied to a large number of different techniques in which groupmembers spontaneously share ideas, often to find alternative approaches and solutions to problems. Toget a better pool of ideas to choose from, brainstorming sessions should include a diverse group because amix of participants with different backgrounds, experiences, and skills.
Technique:A facilitator poses an objective to the group. The facilitator wants to encourage participants to thinkbroadly about the problem and not focus too narrowly on ideas or solutions, and during the first part ofthe session, there shouldn't be any evaluation or criticism of any ideas mentioned. The facilitator shouldrecord all suggestions. After sufficient time has elapsed, the group turns towards categorizing, combining,and refining the list, and then analyzing the revised list of ideas. Eventually the suggestions will benarrowed down further and prioritized, ending up with an action plan.
Statistical sampling is a general term that applies to many different statistical techniques that look at asubset of a population in order to determine a measurement sampling. Depending upon the industry orproject area, significant knowledge about probability and statistical techniques may be required by theproject team.
A control chart is a type of run chart that isused to determine whether a process is incontrol or out of control. A run chart is a linegraph that displays measurements taken overtime, and with the addition of upper and lowercontrol limits, the chart shows at what pointsin time measurements exceeded thresholds,which aids in finding the root causes ofanomalies.
Brainstorming
Statistical sampling
Control charts

CHAPTER 8: QUALITY MANAGEMENT 8
Project Management Road Trip® 238 8: Quality Management
Traditional experimentation usually involves changing one factor at a time and then analyzing the result.But that is time consuming and it doesn’t take into account the interplay that may be going on betweenmultiple factors. Design of experiments is a statistical method that can help make processes and productsmore efficient by mathematically simulating changes all at once to the variables affecting the process. Theresults can then be viewed to see how the changed factors not only influence the end result but how thefactors relate to each other.
A flowchart is agraphical representationof a process. There are alot of differentflowchartingapproaches, but they allshow the sequencing ofactivities, relationships,branches, and decisionpoints in a process.
Flowcharts help everyone to better understand a process by seeing it broken up into small, step-by-stepcomponents.
An affinity diagram helps peopleaddress complex issues throughbrainstorming and datacategorization. Affinity diagramscan be used to generate ideas,identify issues, and findrelationships between factorscontributing to an issue. Oncecategories are established, theaffinity diagram can be used toprioritize items and develop anaction plan.
Design of experiments
Flowcharting
Affinity diagrams

CHAPTER 8: QUALITY MANAGEMENT 8
Project Management Road Trip® 239 8: Quality Management
Technique:
Identify the topic, problem, or issue.
Choose a group facilitator.
Brainstorm to generate ideas, potential solutions, or contributing factors.
Sort the items into similar categories without too much initial thought.
As themes begin to emerge, create "header" categories that establish the unifying relationshipsbetween items in the columns.
Continue finding ideas and categorizing them until ideas are exhausted and the columns aregrouped into categories agreed upon by the group.
Construct the final affinity diagram.
Developed by social psychologist Kurt Lewin18, force field analysis aidsin visualizing the pro and con forces involved in an issue or situation. Thepremise behind this technique is that a situation is held in equilibrium bytwo sets of opposing forces. Driving forces are those striving for change,and restraining forces are those desiring the status quo. A situation canchange only when the strength of the driving forces exceeds the restrainingforces. By concentrating on the core factors giving strength to therestraining forces, the desired change can proceed.
Nominal group technique (NGT) is a brainstorming derivative developed by Van de Ven and Delbecq19
that involves not only group brainstorming but individualized brainstorming. It's useful for new groupswhere the members aren't yet familiar with each other, the issue is controversial, or there are groupmembers who are more vocal than others. NGT starts out with each individual privately generating ideaswhich are then discussed with the group.
Technique:
Choose a group facilitator.
Make sure the topic or issue is clearly understood.
Allow several minutes for the group members to privately write down as many ideas as possible.
Force field analysis
Nominal group technique

CHAPTER 8: QUALITY MANAGEMENT 8
Project Management Road Trip® 240 8: Quality Management
Taking turns, each individual states his or her ideas to the group. At this point there is no discussionfrom the group on the idea. The idea presented can be from the person's list or a new one he or shejust thought of.
As ideas are presented, the facilitator writes the ideas down on a common list that's visible to all.
Keep this up until all ideas are exhausted.
Each idea is then discussed by the group. Wording may be changed or ideas stricken from the list ifall of the group members agree. The facilitator needs to keep the discussion relevant, healthy, andobjective during this step.
From the modified list, the ideas are prioritized by some form of secret balloting.
The items with the highest votes can then be used for further prioritization or as action items.
Matrices are rows and columns of data, typically thought of as spreadsheets. Matrices are versatile toolsthat help analysis, decision-making, and prioritization. A matrix diagram shows relationships betweenfactors, causes, and objectives and a prioritization matrix provides a way of scoring or ranking actions.
8.1 Process decomposition
Matrices
CHAPTER 8: QUALITY MANAGEMENT 8
Project Management Road Trip® 241 8: Quality Management
Inputs
Scope baselineThe scope baseline is the approved project scope statement, WBS, and WBS dictionary. The baselineincorporates all approved changes. It's very important for quality planning because it describes theacceptance criteria, and includes other details that may directly impact quality and grade levels, suchas technical specifications of materials.
Stakeholder registerThe stakeholder register identifies all project stakeholders and contains attributes such as the person'sname, title, position, project interest, expectations, and influence. Meeting customer and stakeholderexpectations is necessary for quality.
Schedule baselineThe schedule baseline is the approved project schedule. It has the start and finish dates for all projectactivities, which impact quality requirements.
Risk registerThe risk register is a comprehensive list of all threats and opportunities the project faces. It alsocontains supplementary data about each risk, including its impact, probability, risk response, budget,risk owner, and contingency and fallback plans. Risks likely impact the project’s qualityrequirements.
Enterprise environmental factorsFactors outside the project boundaries that affect quality planning can include regulations andindustry standards and guidelines.
Organizational process assetsThe project’s quality policy is directly related to the organization’s quality policy, and may includethe quality methods of other organizations, such as the customer. Policies, procedures, and templatesmay also be available for the project team. Lessons learned and historical information from pastprojects is also considered during quality planning.
Tools and Techniques
Cost-benefit analysisCost-benefit analysis: Cost-benefit analysis helps determine the appropriate trade-off between qualityand the cost to achieve that level of quality.
Cost of qualityThe cost of quality quantifies the cost of adhering to the expected level of quality in the deliverables.It is a time and financial determination based on the needed level of quality the deliverable mustmeet.
Control chartsControl charts are types of run charts that are used to determine whether processes are in control orout of control by comparing measurements taken over time.
BenchmarkingBenchmarking compares processes between different organizations, helping to generate ideas forimprovement and to provide a measurement basis by helping the organization determine what the"standard" is.
Design of experimentsDesign of experiments is a statistical method that can help make processes and products moreefficient by mathematically simulating changes all at once to the variables affecting the process.
CHAPTER 8: QUALITY MANAGEMENT 8
Project Management Road Trip® 242 8: Quality Management
Statistical samplingStatistical sampling is a general term that applies to a number of different and industry-specifictechniques that look at a subset of a population in order to determine a measurement sampling.
FlowchartingFlowcharts are graphical representations of a process, showing sequential activities, branches, anddecision points within the process.
Proprietary quality management methodologiesThese include specific methodologies like Six Sigma, Lean, Quality Function Deployment, andCMMI® among many others.
Additional quality planning toolsAdditional tools, such as brainstorming, affinity diagrams, force field analysis, matrix diagrams, andnominal group techniques, help to define the project’s quality requirements and plan for the project’squality management activities..
Outputs
Quality management planThe quality management plan is a component of the project management plan. The qualitymanagement plan details the quality policy of the project, including how the project managementteam will address quality assurance, quality control, and continuous improvement for the project.
Quality metricsQuality metrics are the specific quality goals the project must meet and how the quality controlprocesses will confirm compliance. Quality metrics can include any type of applicable measurement,including defect rates, bug rates, failure rates, up-time, reliability, and coverage area.
Quality checklistsQuality checklists are documents that outline the key steps that must be performed as part of qualitycontrol. Checklists are to-do lists that ensure that everything is performed and in the correct order.
Process improvement planThe process improvement plan is a subsidiary plan of the project management plan. It describes howprocesses will be analyzed to find and remove non-value added activities.
Project document updatesDocuments that are likely to be updated during the Plan Quality process include the stakeholderregister and the responsibility assignment matrix for quality activities.

CHAPTER 8: QUALITY MANAGEMENT 8
Project Management Road Trip® 243 8: Quality Management
The Perform Quality Assurance process executes the quality management plan and the processimprovement plan, and by doing so ensures that the project's quality processes are aligned with the plans.The premise behind quality assurance is that if the quality of the project processes are improved then thequality of the deliverables will be subsequently improved. The performing organization and project teamreap the benefits gained by process improvements and the customer benefits through lower-costs anddeliverables more likely to meet its need.
Thus quality assurance is focused on the processes and not the quality of the deliverables. This isimportant for us to remember: quality assurance is concerned with quality processes while quality controlis concerned with quality deliverables. Another way for us to remember this is that Perform QualityAssurance is an executing process while Perform Quality Control is a monitoring and control process.
Since QA relies on the quality management plan, its activities can't begin until the quality planningprocesses are well underway. Quality assurance activities are performed by the project management team,but in organizations with an established quality policy, QA activities may be overseen by personnel fromanother business unit that’s responsible for the organization’s quality policy.
8.2 Perform quality assurance

CHAPTER 8: QUALITY MANAGEMENT 8
Project Management Road Trip® 244 8: Quality Management
It isn't always just massive failures that we need toworry about. It's the near misses that should reallykeep us up at night. Quality audits are needed tofind the causes of the near disasters that wereaverted, which very often are not known outside ofa few people.
Work performance information and quality control measurements are used in the quality assuranceprocess to look for prevention and process improvements opportunities. Any process changes or processimprovements uncovered by QA activities will result in change requests or requested corrective actions,which if approved might result in updates to the quality management plan, process improvement plan, andto the project quality baseline.
Process analysis is a generalized tool categorization that involves techniques which examine the project'sprocesses, looking for any non-value added activities (inefficiencies). Process analysis techniquesimplement the continuous improvement plan. Exactly what techniques are used depends upon the type ofprocess, but the techniques used to reengineer processes will be the same ones used to develop the processimprovement plan (section 8.1), and will also include data collection and its subsequent analysis.
Quality audits ensure that the project is complying with its own quality policy. If it helps, we can thinkof quality audits as having a similar purpose to financial or accounting audits. Both are independentreviews to determine whether appropriate controls, policies, processes, and procedures are beingfollowed. Quality audits are best performed by people from outside the project. Audits can result inrecommended improvements to bring the project in better compliance with quality policies. Fororganizations with a quality management system, the audit also determines the effectiveness of the QMS.
Since auditing is primarily about interviewing and collecting data, the project team can expect a lot ofquestions and requests for documentation during a quality audit. We need to keep in mind that an audit isnot about pointing out personal faults but is instead about making sure the processes and procedures areappropriately linked to the quality policy and are having the intended benefits.
Quality audits may be very broad or focused onlyon specific items. Audits are sometimes calledvertical or horizontal audits. A vertical auditfocuses on a particular function or single processwhile a horizontal audit follows a completeprocess from start to end, usually through severalfunctional areas within the project or organization.
Quality audits can also be required for contractualor regulatory obligations, and in those cases theparty to perform the audit is usually specifiedin the contract or regulation. In other casesquality audits may be performed by aconsultant or a member of the performingorganization's quality department, or thecustomer may also perform quality audits of
Process analysis
Quality audits

CHAPTER 8: QUALITY MANAGEMENT 8
Project Management Road Trip® 245 8: Quality Management
the project. But in organizations without a quality department or people formally trained in qualitymanagement, the project management team will need to fill this role. While this destroys the independentnature of an audit, it's much better for this process to be performed as objectively as possible by theproject management team than for it not to be performed at all.
Inputs
Project management planThe quality management plan and the process improvement plan are key to quality assurance.
Quality metricsQuality metrics are the specific quality goals the project must meet and how the quality controlprocesses will confirm compliance. Quality metrics can include any type of applicable measurement,including defect rates, bug rates, failure rates, up-time, reliability, and coverage area.
Work performance informationWork performance information is any data that can be considered related to the work which producesthe project deliverables. Examples are schedule and progress status information, budget and coststatus, quality status, estimates to complete, resource utilization information, and lessons learned.
Quality control measurementsThe measurements from quality control activities are used in QA to evaluate and analyze theeffectiveness of the project’s quality policy.
8.2 Process decomposition
CHAPTER 8: QUALITY MANAGEMENT 8
Project Management Road Trip® 246 8: Quality Management
Tools and Techniques
Plan Quality and Perform Quality Control tools and techniquesAny of the tools from the Plan Quality (8.1) and Perform Quality Control (8.3) processes are alsouseful as part of performing quality assurance.
Quality auditsQuality audits are independent reviews to determine whether appropriate controls, policies, processes,and procedures are being followed for quality management. Audits ensure that the project iscomplying with its own quality policy.
Process analysisProcess analysis is a generalized tool categorization that involves techniques which examine theproject's processes, looking for any non-value added activities (inefficiencies). Process analysistechniques implement the continuous improvement plan.
Outputs
Organizational process assets updatesQuality assurance activities can result in updates to organizational quality standards.
Change requestsQuality assurance can result in recommended improvements, which are treated as changes andcoordinated through integrated change control for review.
Project management plan updatesQuality assurance activities and approved changes relating to quality can impact several componentsof the project management plan, including the quality management plan, schedule management plan,and cost management plan.
Project document updatesAudits, training materials, checklists, and process documentation are usually impacted by qualityassurance activities.
CHAPTER 8: QUALITY MANAGEMENT 8
Project Management Road Trip® 247 8: Quality Management
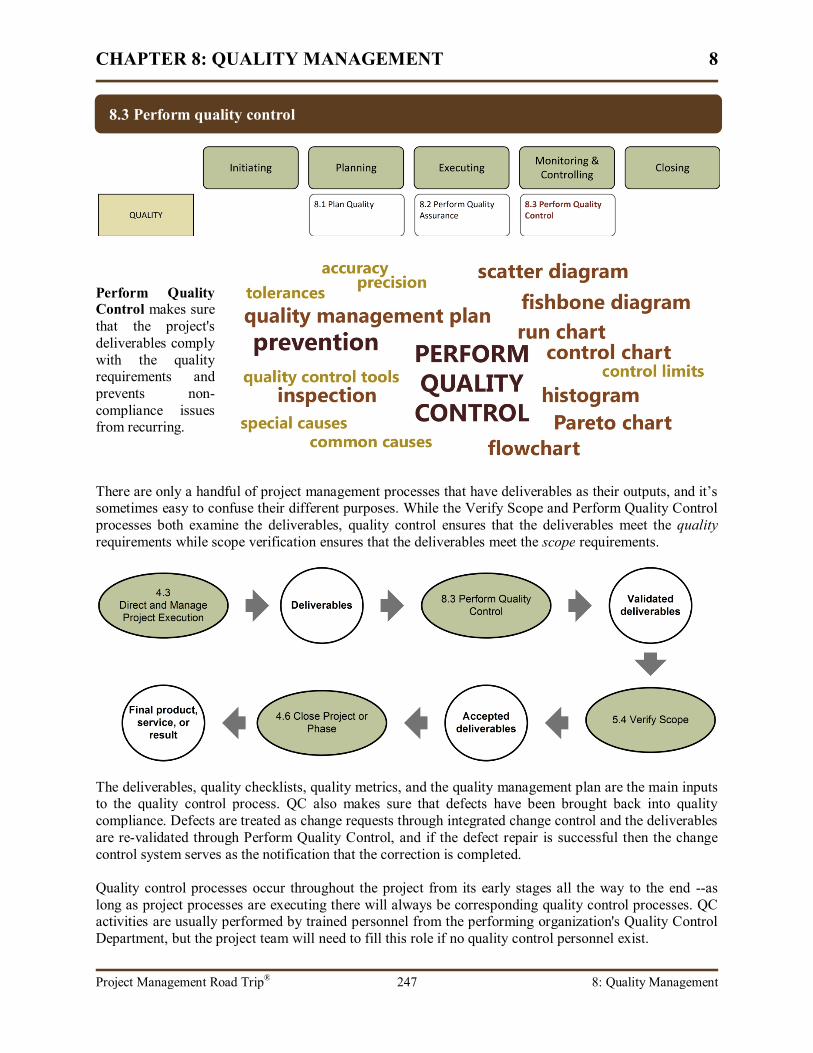
Perform QualityControl makes surethat the project'sdeliverables complywith the qualityrequirements andprevents non-compliance issuesfrom recurring.
There are only a handful of project management processes that have deliverables as their outputs, and it’ssometimes easy to confuse their different purposes. While the Verify Scope and Perform Quality Controlprocesses both examine the deliverables, quality control ensures that the deliverables meet the qualityrequirements while scope verification ensures that the deliverables meet the scope requirements.
The deliverables, quality checklists, quality metrics, and the quality management plan are the main inputsto the quality control process. QC also makes sure that defects have been brought back into qualitycompliance. Defects are treated as change requests through integrated change control and the deliverablesare re-validated through Perform Quality Control, and if the defect repair is successful then the changecontrol system serves as the notification that the correction is completed.
Quality control processes occur throughout the project from its early stages all the way to the end --aslong as project processes are executing there will always be corresponding quality control processes. QCactivities are usually performed by trained personnel from the performing organization's Quality ControlDepartment, but the project team will need to fill this role if no quality control personnel exist.
8.3 Perform quality control

CHAPTER 8: QUALITY MANAGEMENT 8
Project Management Road Trip® 248 8: Quality Management
One approach to determining the root cause of a problem is to keepasking "why" at least five times:
1. Why did the concrete crack? Because the mix wasn't right.2. Why wasn't the mix right? Because it came from a different supplier.3. Why was a different supplier used? Because it was a rush order.4. Why was it a rush order? Because the order wasn't on the dailyschedule.5. Why wasn't the order on the daily schedule? Because the order hadbeen misplaced.
The project team will need to have a general understanding of statistical quality control and terminologyso that they can work with and properly evaluate the quality control outputs.
Prevention keeps non-compliance issues from happening in the first place. While it's good to catch adefect before it gets into the hands of the customer, it's even better to prevent the defect from occurring atall. Prevention of errors is always preferable to reliance on inspection, and this philosophy is the basis ofthe PMBOK's project qualitymanagement and of qualitymanagement in general.Prevention activities involvelooking at processes forfactors that can potentiallylead to defects, and whendefects are detected,determining the root causesso that those factors can bemitigated. Unfortunately, notall defects can be definitivelyprevented, but we still need to investigate and understand the reasons for the failure.
Quality control terminology
Prevention
Qualitycontrolterminology
Prevention
Inspection
Accuracy
Precision
Tolerances
Special causes
Attributes sampling
Statistical sampling
Statistically independent
Mutually exclusive
Standard deviation
Variable sampling
Common causes Sigma values

CHAPTER 8: QUALITY MANAGEMENT 8
Project Management Road Trip® 249 8: Quality Management
Inspection activities are the testing, measurement, review, and examination of the deliverable todetermine whether it's in compliance with the quality requirements. The inspection methods used willdiffer depending upon the deliverable types. For example, the inspection methods employed againstsoftware will be different than those performed for a medical device. Inspection is meant to keep thedefect out of the hands of the customer, and when non-compliance issues are found, the root cause isdetermined so that it can be prevented in the future.
Accuracy describes how close a measurement is to its true value while precision describes howrepeatable the measure is and how many significant digits it’s measured in. Though we often use the twoterms interchangeably, in the scientific and statistical realms, they describe different characteristicsbecause a measurement can be accurate and precise, precise but not accurate, or accurate but not precise.
To help us understand their difference, let’s assume that we’ve taken measurements of our bodytemperature at different intervals throughout the day using two types of oral thermometers –one is aregular analog thermometer and the second is a digital thermometer. If we’re healthy, our bodytemperature is 98.7 F (37.0 C), so this is our measurement baseline. Here are our measurements:
1st Reading 2nd Reading 3rd Reading 4th Reading 5th ReadingAnalog 98.7 98.7 99.7 98.8 98.7Digital 98.743 98.735 98.712 98.760 98.684
All the measurements from our digital thermometer are clustered very close together, so they are preciseas are our 1st, 2nd, 4th, and 5th measurements from the analog thermometer. However, the third readingfrom the analog thermometer is not precise since it’s outside the cluster of all the other readings. Our thirdmeasurement from the analog thermometer looks to be an anomaly since it’s a full degree off from thedigital reading. Either we misread the analog thermometer or the procedure we used to take themeasurement was flawed, but that temperature reading is inaccurate.
Tolerances are the acceptable variations in limits, such as a fluorescent light bulb should burn between4000 and 5000 continuous hours. They define the maximum variations from a nominal value that areacceptable because they will have a negligible effect on the quality level.
A special cause is an unusual event outside of the process that leads to a measurable change in theprocess (such as an increase in production downtime). Though unusual, special causes are consideredpreventable. For example, a backup generator failed to start up during a power failure. The failure of thebackup generator can be prevented in the future through regular mechanical maintenance and operationaltests.
Inspection
Accuracy and precision
Tolerances
Special and common causes

CHAPTER 8: QUALITY MANAGEMENT 8
Project Management Road Trip® 250 8: Quality Management
A common cause is a normal event within the process that leads to a measurable change in the process(such as an increase in production downtime). Common causes result in rare, but tolerable variations.Even if it were possible to remove all possible common causes from a process, the effort to do so wouldusually be cost prohibitive. Common causes are thus generally considered as non-preventable andaccepted as part of the process.
For example, let’s imagine that about one screw out of every 50,000 from a supplier is misthreaded.When a manufacturing process encounters one of these misthreaded screws, it causes a jam in themachine which must be manually removed. The jam would result in a measurable change in the process(seen as decrease in production), but since it would be cost prohibitive to have all screws individuallyinspected before they were used in the manufacturing process this is considered an unpreventable cause.
Control limits are the upper and lower limitsset for a process, usually at three standarddeviations from the mean, and determinewhether a process is in control or out ofcontrol. Control limits are used with controlcharts.
Statistical sampling is a broad term that involves choosing random, representative samples for testingrather than testing each individual deliverable. There are many different sampling techniques that canapply to different disciplines, industries, and deliverables. The main key for this technique is to makesure that the sample collected is representative of the whole population. When properly sampled, thismethod takes less time that measuring the whole population.
Attribute sampling of the deliverable results in it either passing if it conforms to requirements or failingif it does not, while variable sampling passes or fails based on an overall degree of conformity to therequirements. For example, a bicycle inner tube either holds air or it leaks, in which case that inner tubewould fail through attribute sampling. Contrast that to a food manufacturing process in which a samplebag from an entire production run of batch of potato chips is tested for overall weight, crispness, taste,texture, and color. If the sample bag chosen is within tolerances for those characteristics then the entirebatch passes.
Control limits
Sampling
CHAPTER 8: QUALITY MANAGEMENT 8
Project Management Road Trip® 251 8: Quality Management
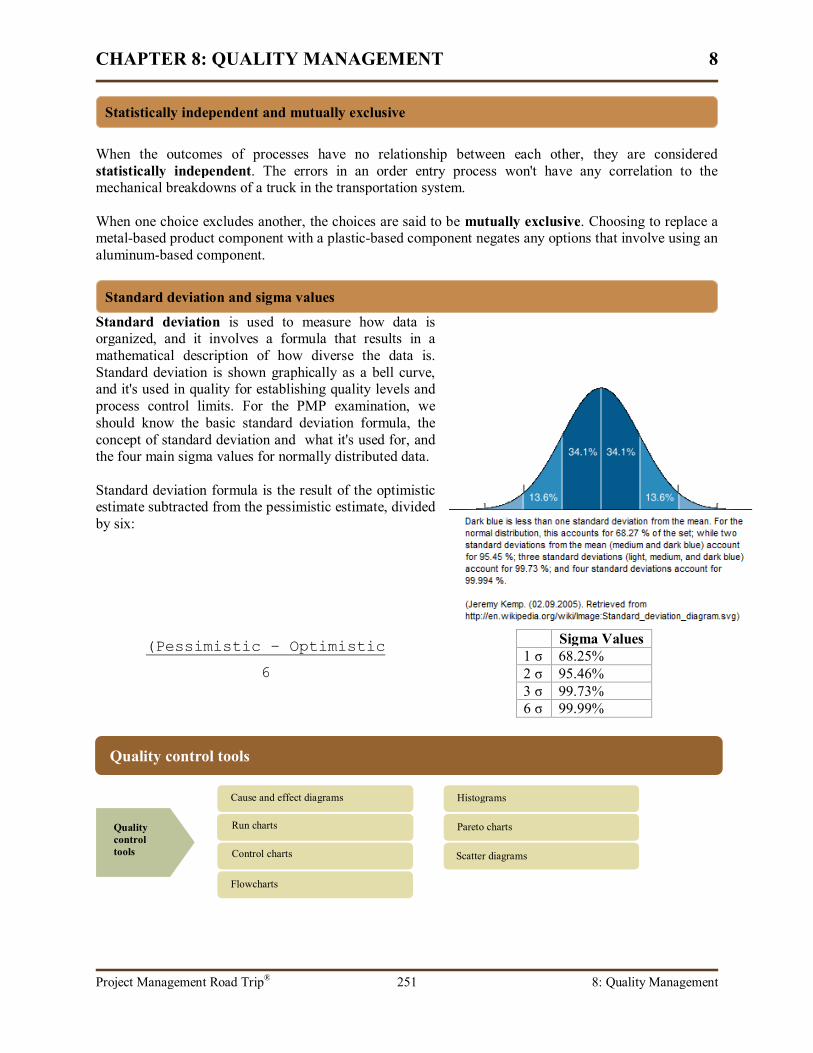
When the outcomes of processes have no relationship between each other, they are consideredstatistically independent. The errors in an order entry process won't have any correlation to themechanical breakdowns of a truck in the transportation system.
When one choice excludes another, the choices are said to be mutually exclusive. Choosing to replace ametal-based product component with a plastic-based component negates any options that involve using analuminum-based component.
Standard deviation is used to measure how data isorganized, and it involves a formula that results in amathematical description of how diverse the data is.Standard deviation is shown graphically as a bell curve,and it's used in quality for establishing quality levels andprocess control limits. For the PMP examination, weshould know the basic standard deviation formula, theconcept of standard deviation and what it's used for, andthe four main sigma values for normally distributed data.
Standard deviation formula is the result of the optimisticestimate subtracted from the pessimistic estimate, dividedby six:
(Pessimistic – Optimistic
6
Sigma Values1 σ 68.25%2 σ 95.46%3 σ 99.73%6 σ 99.99%
Quality control tools
Statistically independent and mutually exclusive
Standard deviation and sigma values
Qualitycontroltools
Cause and effect diagrams
Run charts
Control charts
Flowcharts
Histograms
Pareto charts
Scatter diagrams

CHAPTER 8: QUALITY MANAGEMENT 8
Project Management Road Trip® 252 8: Quality Management
A cause and effect diagram shows what factors can be contributing to an issue or problem. It's alsoknown as a fishbone diagram or an Ishikawa diagram (named after Kaoru Ishikawa).
Technique:
Identify the problem or issue, and place it as the "head" of the fishbone.
Pose the problem or issue as a question to the group and explore the contributing causes andfactors.
As broad categories become known evident, add them as side branches to the categories.
As possible contributing factors within categories are found, add these as underlying branchesbeneath the categories.
Further question the group on contributing factors because there may be more details and factorsinvolved.
When the diagram is completed, the group can use it to validate assumptions, prioritize actions toeliminate contributing factors, and develop an action plan.
A run chart is a line graph that displaysmeasurements over time. Run charts aresometimes also referred to as run-sequence plots.Run charts help to detect trends or changes inoutput, performance, or quality, and once achange is detected then they can also be used tohelp determine the exact timing of when thechange occurred.
Cause and effect diagrams
Run charts

CHAPTER 8: QUALITY MANAGEMENT 8
Project Management Road Trip® 253 8: Quality Management
A control chart is a type of run chart that is used to determine whether a process is in control or out ofcontrol. The control chart is also known as the Shewhart chart, named after Walter Shewart who firstdeveloped them in the 1920s. If a process is in control, the chart can be used to accurately determine
future performance.
Control charts use upper controllimits (UCL) and lower controllimits (LCL), which arecollectively known as naturalprocess limits. As data iscollected on the run chart, if themeasures fall within the upperand lower control limits then theprocess is considered to be incontrol. Measurements outside the
control limits mean the process is out of control and the cause needs to be found. An in control processdoesn't imply neither an efficient nor a quality process. In fact, the Rule of Seven states that if there areseven consecutive measurements that fall on one side of the mean then there's an assignable cause thatneeds investigated because something has changed in the process. The rule of seven applies even if themeasurements are still within the control limits.
A flowchart graphicallyillustrates the steps, sequences,and decision points in aprocess. It can be helpful fordefining the logic and flow in anew process, but it's alsohelpful to diagram existingprocesses to look forcontention or relationships inthe process.
Control charts
Flowcharts

CHAPTER 8: QUALITY MANAGEMENT 8
Project Management Road Trip® 254 8: Quality Management
A histogram is a column chart that shows acollection of measurements grouped intocategories, and it helps identify trouble-spots.For example, a histogram could show thenumber of help desk support calls over aperiod of time grouped by the days of theweek.
A Pareto chart is a histogram chart showingthe values in descending order. By illustratingthe data in this manner, the chart can be used tohone in on the factors causing the biggestimpact. The chart is named after Pareto's 80/20rule, and in the case of a Pareto chart, it helpsus find the 20% of the factors that are likelycausing 80% of the problems.
A scatter diagram is a graph that uses Cartesiancoordinates to display values for two variables. Byviewing the plotted measurements for both variables, arelationship, if one exists, can be determined. Forexample, a scatter diagram that plots inclement weatheras one variable and late deliveries as another variablemight show that there's a relationship between badweather and delivery delays.
Histogram
Parteto chart
Scatter diagram

CHAPTER 8: QUALITY MANAGEMENT 8
Project Management Road Trip® 255 8: Quality Management
Inputs
Project management planThe quality management plan describes how quality control processes will be performed and whatlevels of quality must be met.
Quality metricsQuality metrics are the specific quality goals the project must meet and how the quality controlprocesses will confirm compliance. Quality metrics can include any type of applicable measurement,including defect rates, bug rates, failure rates, up-time, reliability, and coverage area.
Quality checklistsQuality checklists are documents that outline the key steps that must be performed as part of qualitycontrol. Checklists are "to-do" lists that ensure that everything is performed and in the correct order.
Work performance measurementsThese are performance measurements that are communicated to stakeholders, and include items suchas planned versus actual performance for the schedule, cost, and quality.
Approved change requestsApproved changes from integrated change control can impact quality control activities. Deliverablesthat initially fail quality control and need reworked are technically change requests, so thosedeliverables may also be resubmitted to quality control as an approved change request.
DeliverablesQuality control is performed against the deliverables.
Organizational process assetsThe organization may have defect reporting or other procedures that must be followed.
8.3 Process decomposition

CHAPTER 8: QUALITY MANAGEMENT 8
Project Management Road Trip® 256 8: Quality Management
Tools and Techniques
Cause and effect diagramsA cause and effect diagram shows what factors can be contributing to an issue or problem. It's alsoknown as a fishbone diagram or an Ishikawa diagram.
Control chartsA control chart is a type of run chart that is used to determine whether a process is in control or out ofcontrol. The control chart is also known as the Shewhart chart, named after Walter Shewart who firstdeveloped them in the 1920s. If a process is in control, the chart can be used to accurately determinefuture performance.
FlowchartingA flowchart graphically illustrates the steps, sequences, and decision points in a process.
HistogramA histogram is a column chart that shows a collection of measurements grouped into categories, and ithelps identify trouble-spots.
Pareto chartA Pareto chart is a histogram chart showing the values in descending order. By illustrating the data inthis manner, the chart can be used to hone in on the factors causing the biggest impact.
Run chartA run chart is a line graph that displays measurements over time. Run charts are sometimes alsoreferred to as run-sequence plots, and they help to detect trends or changes in output, performance, orquality.
Scatter diagramA scatter diagram is a graph that uses Cartesian coordinates to display values for two variables. Byviewing the plotted measurements for both variables, a relationship, if one exists, can be determined.
Statistical samplingStatistical sampling is a broad term that involves choosing random, representative samples for testingrather than testing each individual deliverable.
InspectionInspection activities are the testing, measurement, review, and examination of the deliverable todetermine whether it's in compliance with the quality requirements. The inspection methods used willdiffer depending upon the deliverable types.
Approved change request reviewDeliverables that initially failed quality control are submitted to integrated change control as changerequests. If approved for correction, this review ensures that the rework performed has been done asrequested.

CHAPTER 8: QUALITY MANAGEMENT 8
Project Management Road Trip® 257 8: Quality Management
Outputs
Quality control measurementsThese are the measurements and results from activities that make sure the deliverables meet thequality requirements.
Validated changesAny approved changes (such as rework) are re-validated to make sure the change was implemented asrequested.
Validated deliverablesValidated deliverables have been checked to ensure that they meet the quality requirements.
Organizational process assets updatesLessons learned, completed checklists, root-cause analysis and other quality control activities result inupdates to organizational process assets.

CHAPTER 8: QUALITY MANAGEMENT 8
Project Management Road Trip® 258 8: Quality Management
1. American Society for Quality. (2000). Retrieved from http://www.asq.org/.
2. International Organization for Standardization. (1994). ISO 8402. Quality Management and Quality Assurance.Geneva: ISO Press, 1994.
3. Cochran, Craig. (2008). Measuring Service Quality. QualityDigest, March, 2008. Retrieved fromhttp://www.qualitydigest.com/mar08/articles/03_article.shtml.
4. Deming, W.E. (1950). Lecture to Japanese Management. Translation by Teruhide Haga. Retrieved fromhttp://deming.eng.clemson.edu/pub/den/deming_1950.htm.
5. American Society for Quality (n.d.). A. V. Feigenbaum: Laying the foundations of modern quality control.Retrieved from http://www.asq.org/about-asq/who-we-are/bio_feigen.html.
6. Ishikawa, K. (1985). What is Total Quality Control? Prentice-Hall: Englewood Cliffs, NJ.
7. Wikipedia (n.d.). Joseph M. Duran. In Wikipedia, The Free Encyclopedia. Retrieved fromhttp://en.wikipedia.org/wiki/Joseph_M._Juran.
8. Wikipedia (n.d.). Walter A. Shewhart. In Wikipedia, The Free Encyclopedia. Retrieved fromhttp://en.wikipedia.org/wiki/Shewhart.
9. Russel, Daiv. (n.d.). 5 Tips to Jump From Partial Quality Management to Total Quality Management. Retrievedfrom PositiveArticles.com at http://www.positivearticles.com/Article/5-Tips-to-Jump-From-Partial-Quality-Management-to-Total-Quality-Management/41588.
10. Marsan, Carolyn. (2007). Six Sigma Slashes IT Costs by Millions. NetworkWorld, October 8, 2007, pps. 24, 30.Retrieved from http://www.networkworld.com/news/2007/100807-your-take-cummins.html.
11. Anonymous. (n.d.). About Motorola University: The Inventors of Six Sigma. Retrieved fromwww.motorola.com/content/0,,3079,00.html.
12. International Standards Organization (n.d.). ISO 9000 Essentials. Retrieved fromhttp://www.iso.org/iso/iso_catalogue/management_standards/iso_9000_iso_14000/iso_9000_essentials.htm.
13. Herman, Rich. (July 28, 2007). FMEA - Basics of failure mode and effect analysis. Retrieved fromhttp://www.articlesbase.com/business-articles/fmea-basics-of-failure-mode-and-effects-analysis-189710.html.
14. QFD Institutue. (n.d.). What is QFD? Retrieved from http://www.qfdi.org/what_is_qfd/what_is_qfd.html.
15. Cole, R. (2001). From Continuous Improvement to Continuous Innovation", Quality Management Journal, Vol.8 No.4, pp.7-20.
16. Smith, Richard, AIA. (2004). (referring to Burstein & Stasioski). The Cost of Quality: Is "An Ounce ofPrevention" Really Worth A Pound of Cure?" Retrieved fromhttp://www.aia.org/nwsltr_pm.cfm?pagename=pm_a_20050722_quality.
17. Feltus, Anne. (1994). Exploding the Myths About Benchmarking. Continuous Journey, April/May 1994, pps 10-15. Retrieved fromhttp://www.emeraldinsight.com/Insight/html/Output/Published/EmeraldFullTextArticle/Pdf/2300050103_ref.html.
18. Lewin K. (1943). Defining the Field at a Given Time. Psycholoical Review. 50:292-310. Republished inResolving Social Conflicts & Field Theory in Social Science, Washington, D.C.: American PsychologicalAssociation, 1997.
19. Van de Ven, A., & Delbecq, A.L. (1971). Nominal Versus Interacting Group Processes for Committee Decision-Making Effectiveness. Academy of Management Journal, 14, 203-212.
References

CHAPTER 8: QUALITY MANAGEMENT 8
Project Management Road Trip® 259 8: Quality Management
The Project Quality Management knowledgearea includes the processes that make sure thedeliverables meet the customer's requirements.Fully understanding both the explicit andimplicit requirements are important becausequality is based solely on fulfilling thecustomer’s expectations. Another importantfacet of the quality approach is that theprocesses involved in the deliverables should becontinually improved, which will result in aproduct of lower cost to the customer. PMI'sapproach to project quality is compatible withmodern quality programs, including Six Sigmaand Total Quality Management. The ISO 9000standard helps companies establish a frameworkfor their quality processes.
The Plan Quality process establishes the projectquality management plan, the processimprovement plan, quality checklists, andquality metrics. The organization's qualitypolicy, if one exists, serves as the basis for theproject quality management plan. The projectscope statement and stakeholder register areneeded during quality planning because theycontain the expectations and specific acceptancecriteria the deliverables must meet. The projectmanagement team will establish the quality,grade, tolerances, control limits, accuracy, andprecision requirements. There are several toolsand techniques that will assist during qualityplanning, and these include cost of quality, cost-benefit analysis, benchmarking, design ofexperiments, affinity diagrams, force fieldanalysis, nominal group technique, and matrixdiagrams.
The Perform Quality Assurance processexecutes the quality management plan and theprocess improvement plan. Quality assuranceactivities are focused on the processes and not
the deliverables. Measurements from the qualitycontrol process and work performanceinformation are used to look for preventionopportunities and process improvements.Process analysis is a technique that looks fornon-value added activities within processes, andquality audits are a means of making sure thatthe project is following the quality policy.
Perform Quality Control is concerned withmaking sure that the deliverables meet thequality requirements. Perform Quality Controlresults in validated deliverables. When a non-compliance issue is found, its root cause needsto be determined so that it can be prevented fromhappening again. Special causes are unusualevents that are usually preventable, whilecommon causes are normal events within theprocess that are usually not preventable. Sigmavalues are related to standard deviation thevalues for 1-, 2-, 3-, and 6- sigma are 68.25%,95.46%, 99.73%, and 99.99%.
There are seven main tools of quality control.The cause and effect diagram looks like afishbone, and it shows what factors arecontributing to an issue or problem. The runchart is a line graph that displays measurementsover time, and can help detect changes in aprocess. The control chart is a type of run chartthat has upper and lower control limits, and it'sused to determine whether a process is incontrol or out of control. Flowcharts graphicallyshow the steps, sequences, and decision points ina process, and a histogram is a bar chart thatshows categorized measurements. A Paretochart is a bar chart showing the categorizedmeasurements in descending order, so that thecauses of the greatest problems can be addressedfirst. A scatter diagram can show if there's arelationship between two measurements.
Chapter summary

CHAPTER 8: QUALITY MANAGEMENT 8
Project Management Road Trip® 260 8: Quality Management
Quality is "the degree to which a set of inherent characteristics fulfill requirements."
Quality management stresses prevention over inspection.
The project management knowledge area relies heavily on Deming's Plan-Do-Check-Act cycle.
Quality management is concerned both with deliverables and processes.
Grade is a category assigned to products having the same functional characteristics but differenttechnical characteristics.
Continuous improvement, also known as Kaizen, stresses ongoing process improvement throughincremental changes.
ISO-9000 is a quality management framework that ensures companies follow their own qualitypolicy.
Total Quality Management (TQM) is an organizational quality approach that involves everyonebeing focused on quality.
Six Sigma is an organizational quality approach that improves quality through an emphasis onquantifying and measuring.
The Plan Quality process establishes the quality management plan and the process improvementplan.
Accuracy, precision, quality and grade levels, metrics, and checklists are established in the PlanQuality process.
The quality management plan is based on the organization's quality policy.
It's up to the project management team to establish the project quality policy.
The quality management plan describes the project's quality policy and how it will beimplemented.
Quality metrics are the specific goals and how they will be measured.
The cost of quality includes the costs associated with good quality and poor quality.
Design of experiments is a statistical method of identifying the optimum conditions for a productor process.
Cost-benefit analysis ensures that the benefits of quality activities exceed the costs of qualityactivities.
The Perform Quality Assurance process executes the project management plan and the continualimprovement plan.
Quality assurance looks at processes.
Process analysis is used to remove non-value added activities.
Quality audits make sure that the project is complying with its own quality policy.
The Perform Quality Assurance process relies on the project quality management plan and theprocess improvement plan.
Exam summary
CHAPTER 8: QUALITY MANAGEMENT 8
Project Management Road Trip® 261 8: Quality Management
Quality control measurements, quality metrics, and work performance information is used by thePerform Quality Assurance process.
The Perform Quality Control process ensures that the deliverables meet the quality requirements.
Quality control is primarily concerned with the project's deliverables.
Prevention of quality problems in the first place is always preferable.
The deliverables, quality metrics, checklists, and quality management plan are the main inputs tothe quality control process.
Special causes are unusual events that can be prevented.
Common causes are normal events that can't be prevented.
Attribute sampling results in either a pass or fail of the deliverable.
Variable sampling uses a representative sample rather than looking at each unit.
The 1-, 2-, 3-, and 6-sigma values in a normally distributed data set are: 68.25%, 95.46%,99.73%, and 99.99%.
The seven basic tools of quality are: cause and effect diagram; run chart; control chart; flowchart;histogram; Pareto chart; and scatter diagram.
A cause and effect diagram is also known as a fishbone or Ishikawa diagram. It shows factors thatare contributing to a problem or issue.
A run chart displays measurements over time.
A control chart shows measurements over time and has upper and lower control limits. Itidentifies whether a process is in control or out of control.
The Rule of Seven says that if there are seven consecutive measurements on one side of the meanthat there's an assignable cause that needs investigated.
A flowchart gives a graphical representation of all the steps in a process.
A histogram is a column chart.
A Pareto chart is a column chart that's grouped in descending order. It can be used to focus on the20% of the issues causing 80% of the problems.
A scatter diagram shows whether there's a relationship between two variables.
CHAPTER 8: QUALITY MANAGEMENT 8
Project Management Road Trip® 262 8: Quality Management