project miguel laso - core.ac.uk · ... street lighting, ... 2 boilers (200kw each one) 400kw...
TRANSCRIPT

1
Miguel Laso Martínez
Final paper minor
Pécs, 2014. 11. 26
Responsible teacher: Mr George Elmer
Pollack Mihály Faculty of Engineering and
Information Technology, University of Pécs
Design of photovoltaic systems

2
INDEX
1- INTRODUCTION ….........................................................................................................3
2- HIGHER EDUCATION INSTITUTE ...................................................................................4
2.1- INTRODUCTION .....................................................................................................4
2.2- ANALYSIS OF LOADS ..............................................................................................4
2.3- STUDY OF THE CHARACTERISTICS OF THE INSTALLATION .................................... 8
2.4- DESIGN OF THE INSTALLATION ............................................................................ 11
2.4.1- FIXED SYSTEM ......................................................................... ............. 11
2.4.2- TRACKING SYSTEM ................................................................................16
2.5- CONCLUSIONS ......................................................................................................20
3- OFFICE ..........................................................................................................................21
3.1- INTRODUCTION .....................................................................................................21
3.2- ANALYSIS OF LOADS ..............................................................................................21
3.3- STUDY OF THE CHARACTERISTICS OF THE INSTALLATION.....................................24
3.4- DESIGN OF THE INSTALLATION..............................................................................26
3.5- CONCLUSIONS........................................................................................................28
4- SUPERMARKET .............................................................................................................29
4.1- INTRODUCTION .....................................................................................................29
4.2- ANALYSIS OF LOADS ..............................................................................................29
4.3- STUDY OF THE CHARACTERISTICS OF THE INSTALLATION ....................................32
4.4- DESIGN OF THE INSTALLATION..............................................................................34
4.4.1- FIXED SYSTEM.........................................................................................34
4.4.2- TRACKING SYSTEM .................................................................................38
4.5- CONCLUSIONS........................................................................................................42
5- CHURCH ....................................................................................................................... 43
5.1- INTRODUCTION .....................................................................................................43
5.2- ANALYSIS OF LOADS ..............................................................................................44
5.3- STUDY OF THE CHARACTERISTICS OF THE INSTALLATION.....................................47
5.4- DESIGN OF THE INSTALLATION..............................................................................48
5.5- CONCLUSIONS .......................................................................................................52
6- COMPARISON OF THE CONSUMPTIONS........................................................................53
7- REFERENCES ..................................................................................................................55
3
1-INTRODUCTION
Photovoltaic (PV) harvesting of solar energy is based on capturing sunlight and transforming it
into electricity. This type of electricity generation does not pollute the environment as much as
other types of energy production, that is why nowadays some engineers would like to improve
it.
To carry out this change we use solar cells made of semiconductor materials (Silicon) in which
it is artificially created a permanent electric field. These cells are connected in series or parallel
forming a solar panel responsible for supplying voltage and current needed to meet the
demand.
We can divide this energy in two big groups:
- Installations connected to the electric grid: This is a normal form to obtain
electricity. The installation provides the energy generated to the grid, as the power
plants, nuclear or hydroelectricity. Photovoltaic panels are usually located on big
buildings and in big fields.
- Isolated installations: they provide energy only for an individual installation. Energy
generated from photovoltaic conversion is used to cover small electricity
consumption in the same place where the demand occurs. Nowadays it is an
alternative form to obtain electricity than the traditional way of connecting the PV
installation to the grid. It is useful for places without electric grid, street lighting,
agricultural applications or air and sea traffic signs.
As other forms of energy production, solar plants have some advantages and disadvantages:
- There are not emissions of pollutants to the atmosphere.
- The silicon is abundant.
- There is no necessity for large power lines.
- It is not noisy.
- It is not necessary to use fuel.
- For large installations connected to the grid, it is necessary a big land area.
- Sometimes it is necessary a government grant because an individual installation is
expensive.
- There is not much maintenance, so it is cheap.
The main objective of this project is to design and compare the installations for a higher
education institute of the University of Pécs (Hungary), an office building, a supermarket and a
church. I will also analyze if it is better a fix or a mobile system.

4
2-HIGHER EDUCATION INSTITUTE
2.1 - INTRODUCTION
I am going to analyze the Pollack Mihály Faculty of Engineering and Information Technology of
the University of Pécs (Hungary). This building is located in Boszorkány Street, 2, Pécs
(Hungary).
The building has four different floors:
- Floor -1: offices. This floor is smaller than the rest.
- Floor 0: main entrance, lobby, offices, classrooms, coffee shop and print room.
- Floor 1: offices and classrooms.
- Floor 2: offices and classrooms.
Each floor has different loads because they do not have the same rooms or the same uses. In
the point 2.2 (Analysis of loads) I am going to calculate all the loads together, without
depending on the floor.
The roof is flat, so the system will be easily installed. On the roof there are some chimneys and
air extraction systems, so I need study the available area.
Finally I am going to design a tracking system because the conditions of the roof permit it.
2.2- ANALYSIS OF LOADS
I divide the loads into four different sections.
A- HEATING – AIR COOLING
I assume that the heating system of the faculty has two big boilers for all the building, an
installation pump and different resistors. Also I suppose that the air cooling is a small
system only for specific office (management and meeting room). We see this in Table 1.
Table 1. Heating related consumers at the faculty
Description Total power
2 boilers (200kW each one) 400kW
Installation pump 20kW
Resistors 15kW
Air cooling system 50kW
Total 485kW
5
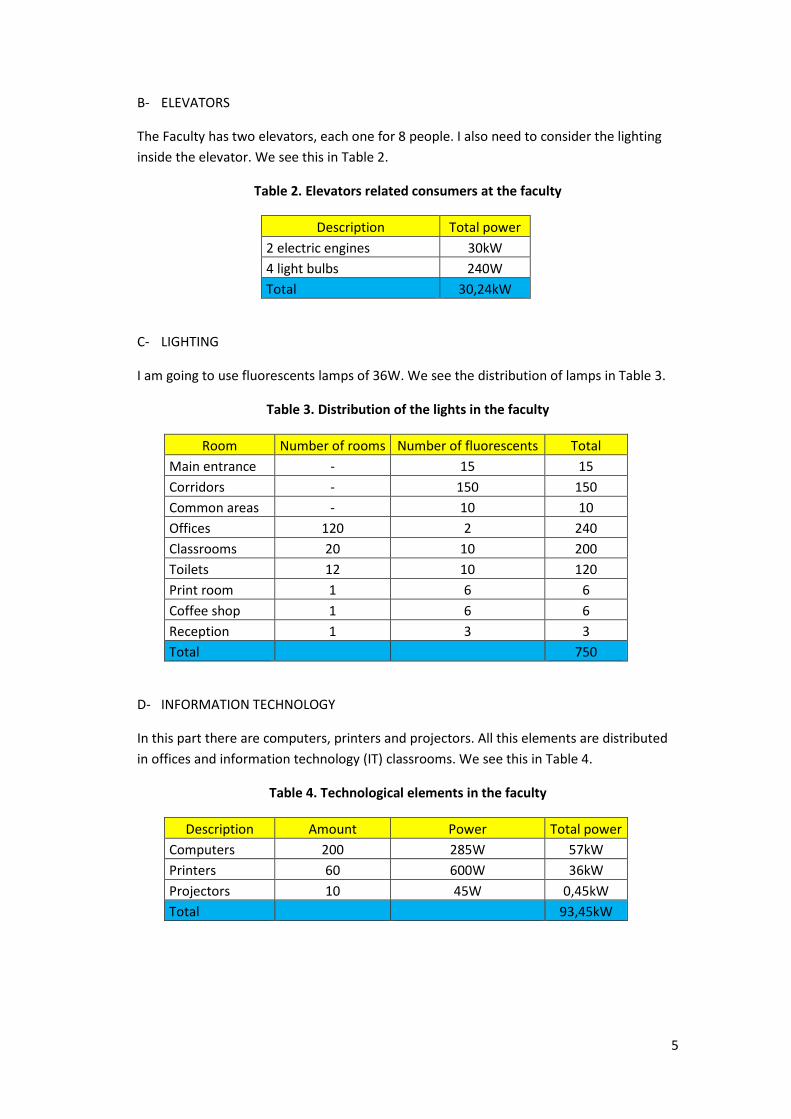
B- ELEVATORS
The Faculty has two elevators, each one for 8 people. I also need to consider the lighting
inside the elevator. We see this in Table 2.
Table 2. Elevators related consumers at the faculty
Description Total power
2 electric engines 30kW
4 light bulbs 240W
Total 30,24kW
C- LIGHTING
I am going to use fluorescents lamps of 36W. We see the distribution of lamps in Table 3.
Table 3. Distribution of the lights in the faculty
Room Number of rooms Number of fluorescents Total
Main entrance - 15 15
Corridors - 150 150
Common areas - 10 10
Offices 120 2 240
Classrooms 20 10 200
Toilets 12 10 120
Print room 1 6 6
Coffee shop 1 6 6
Reception 1 3 3
Total
750
D- INFORMATION TECHNOLOGY
In this part there are computers, printers and projectors. All this elements are distributed
in offices and information technology (IT) classrooms. We see this in Table 4.
Table 4. Technological elements in the faculty
Description Amount Power Total power
Computers 200 285W 57kW
Printers 60 600W 36kW
Projectors 10 45W 0,45kW
Total 93,45kW
6
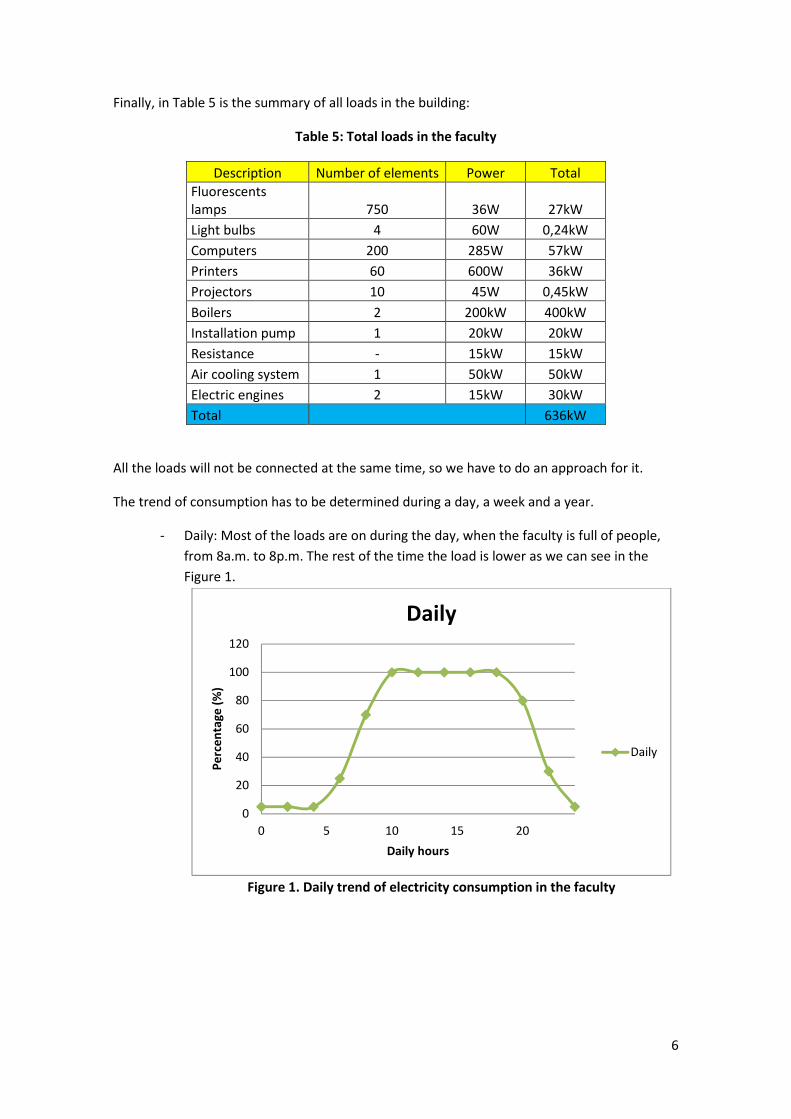
Finally, in Table 5 is the summary of all loads in the building:
Table 5: Total loads in the faculty
Description Number of elements Power Total
Fluorescents
lamps 750 36W 27kW
Light bulbs 4 60W 0,24kW
Computers 200 285W 57kW
Printers 60 600W 36kW
Projectors 10 45W 0,45kW
Boilers 2 200kW 400kW
Installation pump 1 20kW 20kW
Resistance - 15kW 15kW
Air cooling system 1 50kW 50kW
Electric engines 2 15kW 30kW
Total 636kW
All the loads will not be connected at the same time, so we have to do an approach for it.
The trend of consumption has to be determined during a day, a week and a year.
- Daily: Most of the loads are on during the day, when the faculty is full of people,
from 8a.m. to 8p.m. The rest of the time the load is lower as we can see in the
Figure 1.
Figure 1. Daily trend of electricity consumption in the faculty
0
20
40
60
80
100
120
0 5 10 15 20
Pe
rce
nta
ge
(%
)
Daily hours
Daily
Daily
7
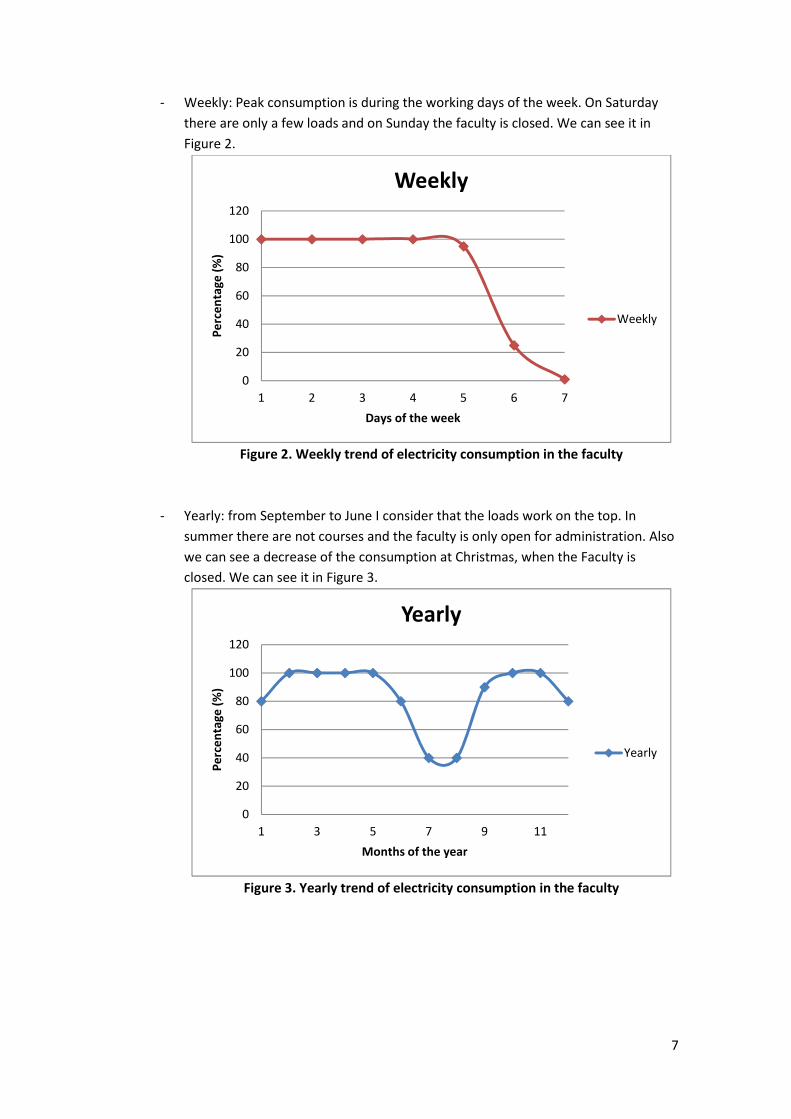
- Weekly: Peak consumption is during the working days of the week. On Saturday
there are only a few loads and on Sunday the faculty is closed. We can see it in
Figure 2.
Figure 2. Weekly trend of electricity consumption in the faculty
- Yearly: from September to June I consider that the loads work on the top. In
summer there are not courses and the faculty is only open for administration. Also
we can see a decrease of the consumption at Christmas, when the Faculty is
closed. We can see it in Figure 3.
Figure 3. Yearly trend of electricity consumption in the faculty
0
20
40
60
80
100
120
1 2 3 4 5 6 7
Pe
rce
nta
ge
(%
)
Days of the week
Weekly
Weekly
0
20
40
60
80
100
120
1 3 5 7 9 11
Pe
rce
nta
ge
(%
)
Months of the year
Yearly
Yearly

8
2.3-STUDY OF THE CHARACTERISTICS OF THE INSTALLATION
Once the trend of loads connected is known, I need the solar radiation reaching our
photovoltaic panels, in this case in Pécs (Hungary). I am going to use the Photovoltaic
Geographical Information System (PVGIS, http://re.jrc.ec.europa.eu/pvgis/). We only have to
use the Europe map and follow Pécs, this software gives us the solar radiation for all the
inclinations we want. Due to we only want the best option for a fixed system we tick the
option “optimize slope” and I obtain that 35º is the correct inclination.
The radiations obtained are written in Table 6:
Table 6: Radiation in Pécs for 35º
Radiation kWh/día/m2
J F M A M Jn Jl A S O N D
35º 1,47 2,23 3,37 4,08 4,27 4,39 4,53 4,31 3,51 2,93 1,73 1,16
The loads of each period of the year are different because different systems are connected.
Because of this I am going to analyze the loads in 3 periods.
1- July and August
During this period of time the faculty is only open for coming to the secretary to solve
problems with the documents. There are not courses and it only opens in the morning. The
staff does not need all the fluorescents, computers and printers. Air cooling system is
connected too. We see this in Table 7.
Table 7. Analysis of loads in period 1 in the faculty
July - August
Description Number of elements Power Hours Total (kWh)
Fluorescents lamps 200 36W 5 36
Light bulbs 4 60W 5 1,2
Computers 40 285W 3 34,2
Printers 10 600W 2 0,9
Air cooling system 1 50kW 2 100
Electric engines 2 15kW 1 30
Total
202,3
The faculty needs 202.3kWh each day but I am going to modify a bit this amount due to
possible incidents in the system. I am going to consider that the efficiency of the inverter is
90% and we add a 10% more of amount.
�� =�� · ��
��
=110 · 202.3
90= 246.89��ℎ

9
Where:
- G1 is the energy with correcting factors.
- T1 is the energy without correcting factors.
- E0 is the percentage increase.
- Ei is the efficiency of the inverter.
2- January, February, March, November and December
During this period of time the building is open all the day, so the common loads are bigger
than in the summer case. Also the heating elements are needed. It is important to explain that
the heating system usually works at 40-50% of its power but it get its peak at the beginning to
reach the selected temperature. I can estimate that the installation pumps works about the
60% of the full time that the installation is working. We see this in Table 8.
Table 8. Analysis of loads in period 2 in the faculty
January - February- March - November - December
Description Number of elements Power Hours Total (kWh)
Fluorescents lamps 750 36W 8 216
Light bulbs 4 60W 10 2,4
Computers 200 285W 3 171
Printers 60 600W 0,5 18
Projectors 10 45W 1 0,45
Boilers 2 200kW 4 1600
Installation pump 1 20kW 4 60
Resistance - 15kW 4 60
Electric engines 2 15kW 3 90
Total
2217,85
I need to increase a bit the total amount with the same approximation I did in the other case.
�� =�� · ��
��
=110 · 2217.85
90= 2709.5��ℎ
10
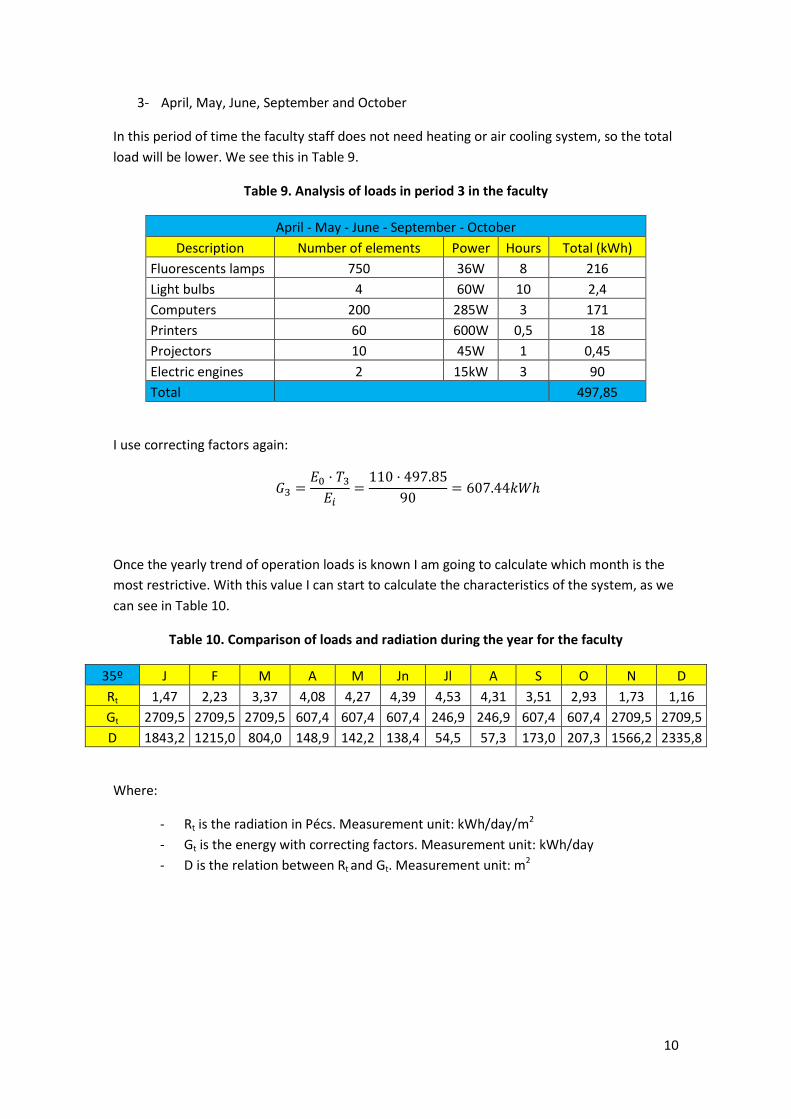
3- April, May, June, September and October
In this period of time the faculty staff does not need heating or air cooling system, so the total
load will be lower. We see this in Table 9.
Table 9. Analysis of loads in period 3 in the faculty
April - May - June - September - October
Description Number of elements Power Hours Total (kWh)
Fluorescents lamps 750 36W 8 216
Light bulbs 4 60W 10 2,4
Computers 200 285W 3 171
Printers 60 600W 0,5 18
Projectors 10 45W 1 0,45
Electric engines 2 15kW 3 90
Total
497,85
I use correcting factors again:
�� =�� · ��
��
=110 · 497.85
90= 607.44��ℎ
Once the yearly trend of operation loads is known I am going to calculate which month is the
most restrictive. With this value I can start to calculate the characteristics of the system, as we
can see in Table 10.
Table 10. Comparison of loads and radiation during the year for the faculty
35º J F M A M Jn Jl A S O N D
Rt 1,47 2,23 3,37 4,08 4,27 4,39 4,53 4,31 3,51 2,93 1,73 1,16
Gt 2709,5 2709,5 2709,5 607,4 607,4 607,4 246,9 246,9 607,4 607,4 2709,5 2709,5
D 1843,2 1215,0 804,0 148,9 142,2 138,4 54,5 57,3 173,0 207,3 1566,2 2335,8
Where:
- Rt is the radiation in Pécs. Measurement unit: kWh/day/m2
- Gt is the energy with correcting factors. Measurement unit: kWh/day
- D is the relation between Rt and Gt. Measurement unit: m2
11
The loads of this building are huge for only a photovoltaic system, so I also need connect it to
the electric grid. The contribution of solar cells will be only a bit of the needed energy, so I will
calculate the maximum number of panels that I can install and after that I will obtain the
percentage of contribution.
It is known that the roof of the building is flat and very big, so I am going to analyze a fixed
system and a tracking system and compare which one is better.
2.4- DESIGN OF THE INSTALLATION
2.4.1- FIXED SYSTEM
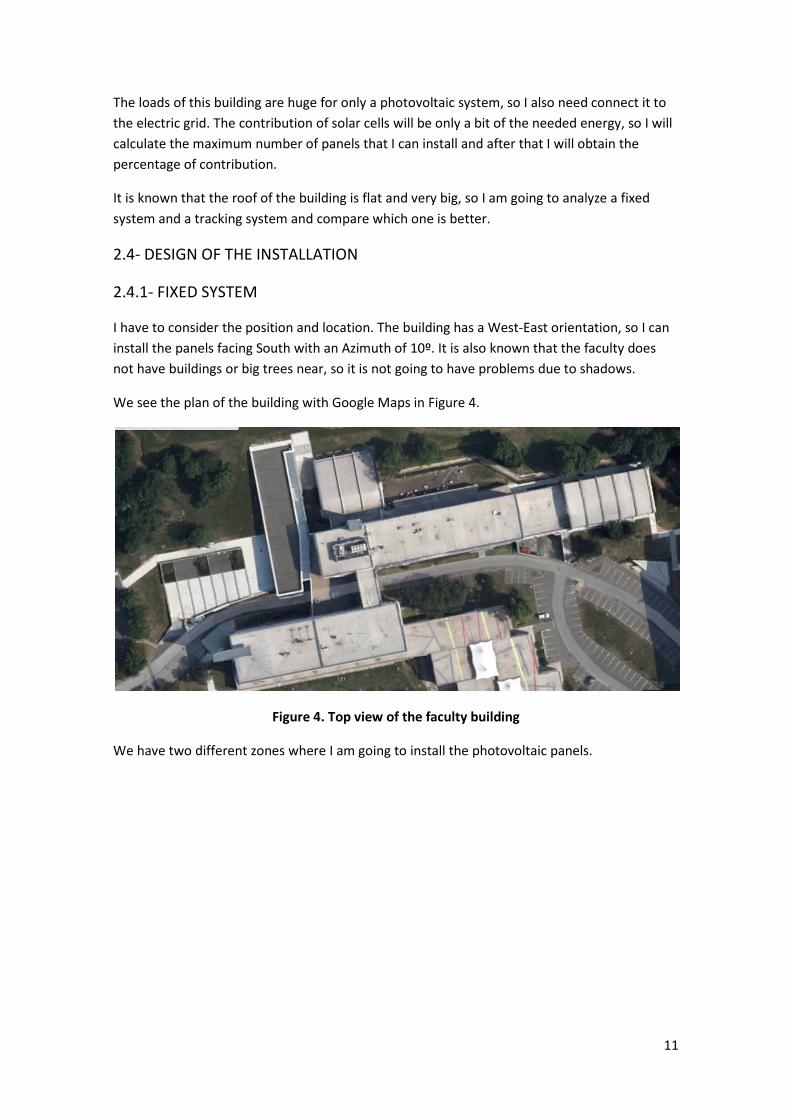
I have to consider the position and location. The building has a West-East orientation, so I can
install the panels facing South with an Azimuth of 10º. It is also known that the faculty does
not have buildings or big trees near, so it is not going to have problems due to shadows.
We see the plan of the building with Google Maps in Figure 4.
Figure 4. Top view of the faculty building
We have two different zones where I am going to install the photovoltaic panels.
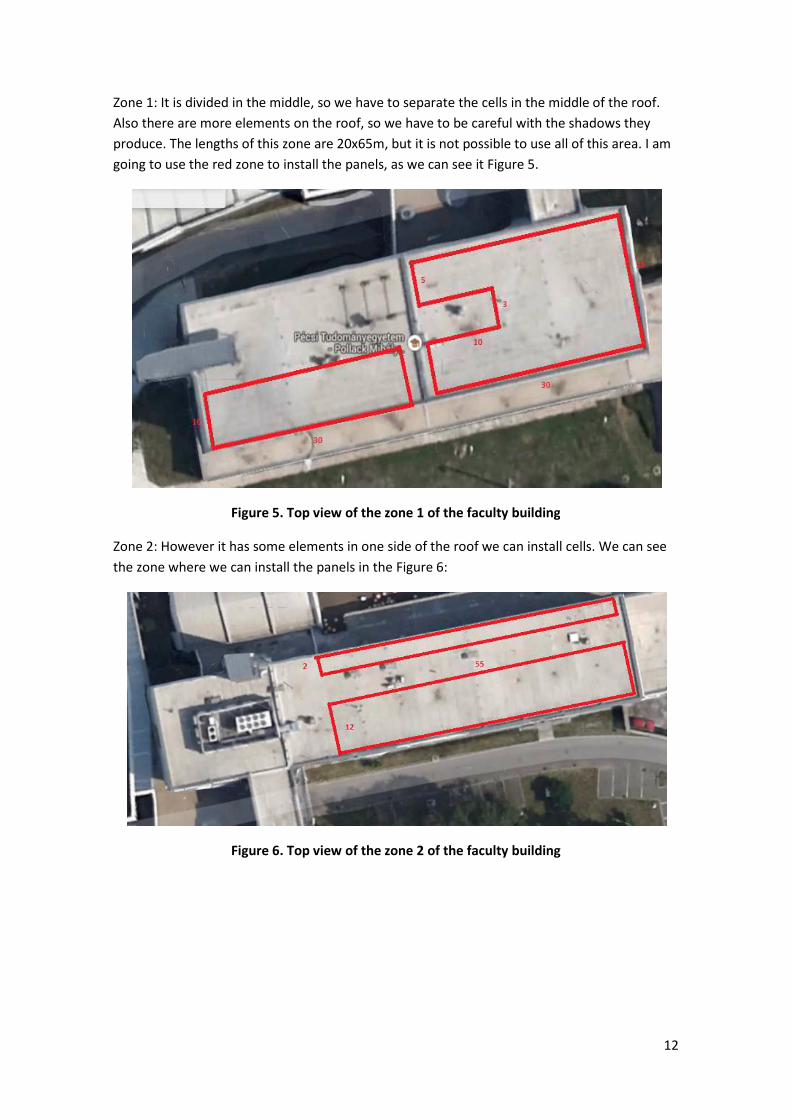
Zone 1: It is divided in the middle, so we have to separate the cells in the middle of the roof.
Also there are more elements on the roof, so we have to be careful with the shadows they
produce. The lengths of this zone are 20x65m, but
going to use the red zone to install
Figure 5. Top view of the zone 1 of the faculty building
Zone 2: However it has some
the zone where we can install the panels
Figure 6. Top view of the zone
is divided in the middle, so we have to separate the cells in the middle of the roof.
more elements on the roof, so we have to be careful with the shadows they
The lengths of this zone are 20x65m, but it is not possible to use all of this area.
install the panels, as we can see it Figure 5.
Figure 5. Top view of the zone 1 of the faculty building
elements in one side of the roof we can install cel
the zone where we can install the panels in the Figure 6:
. Top view of the zone 2 of the faculty building
12
is divided in the middle, so we have to separate the cells in the middle of the roof.
more elements on the roof, so we have to be careful with the shadows they
all of this area. I am
install cells. We can see
13
Once I have defined the available zone, I am going to select the solar cells we will use. In this
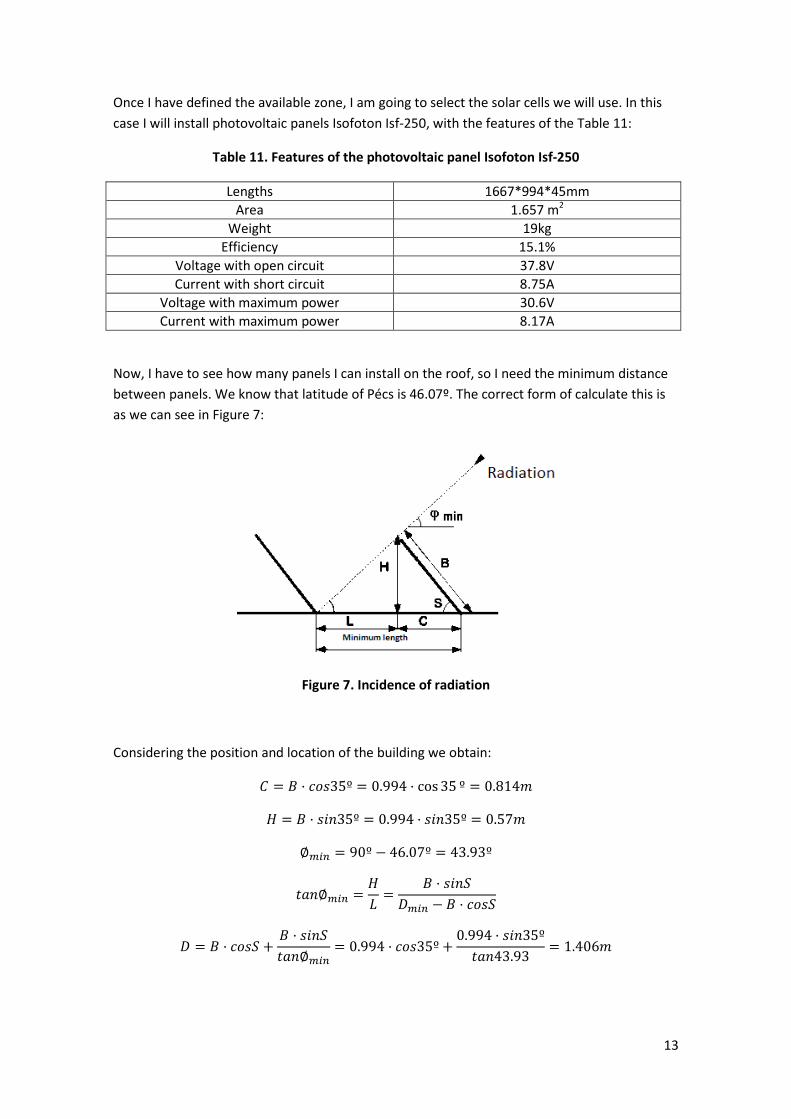
case I will install photovoltaic panels Isofoton Isf-250, with the features of the Table 11:
Table 11. Features of the photovoltaic panel Isofoton Isf-250
Lengths 1667*994*45mm
Area 1.657 m2
Weight 19kg
Efficiency 15.1%
Voltage with open circuit 37.8V
Current with short circuit 8.75A
Voltage with maximum power 30.6V
Current with maximum power 8.17A
Now, I have to see how many panels I can install on the roof, so I need the minimum distance
between panels. We know that latitude of Pécs is 46.07º. The correct form of calculate this is
as we can see in Figure 7:
Figure 7. Incidence of radiation
Considering the position and location of the building we obtain:
� = � · ���35º = 0.994 · cos 35 º = 0.814#
$ = � · �%&35º = 0.994 · �%&35º = 0.57#
∅(�) = 90º − 46.07º = 43.93º
+,&∅(�) =$
-=
� · �%&.
/(�) − � · ���.
/ = � · ���. +� · �%&.
+,&∅(�)
= 0.994 · ���35º +0.994 · �%&35º
+,&43.93= 1.406#
To calculate the number of panels
as we can see in Figure 8.
Figure 8. Top view of the
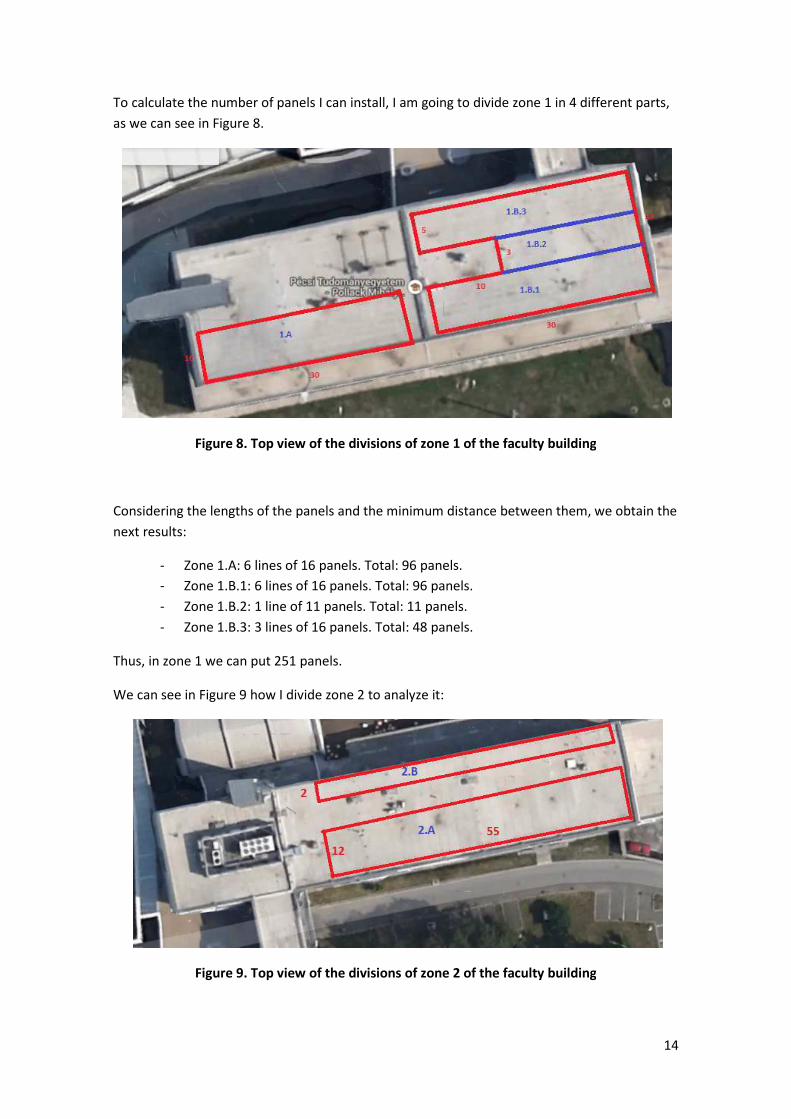
Considering the lengths of the panels and
next results:
- Zone 1.A: 6 lines of 1
- Zone 1.B.1: 6 lines of 16 panels. Total: 96 panels.
- Zone 1.B.2: 1 line
- Zone 1.B.3: 3 lines of 16 panels. Total
Thus, in zone 1 we can put 251
We can see in Figure 9 how I divide zone 2 to analyze it
Figure 9. Top view of the
To calculate the number of panels I can install, I am going to divide zone 1 in 4 different parts
. Top view of the divisions of zone 1 of the faculty building
Considering the lengths of the panels and the minimum distance between them, we obtain the
lines of 16 panels. Total: 96 panels.
6 lines of 16 panels. Total: 96 panels.
1 line of 11 panels. Total: 11 panels.
3 lines of 16 panels. Total: 48 panels.
, in zone 1 we can put 251 panels.
We can see in Figure 9 how I divide zone 2 to analyze it:
. Top view of the divisions of zone 2 of the faculty building
14
going to divide zone 1 in 4 different parts,
zone 1 of the faculty building
the minimum distance between them, we obtain the
of the faculty building
15
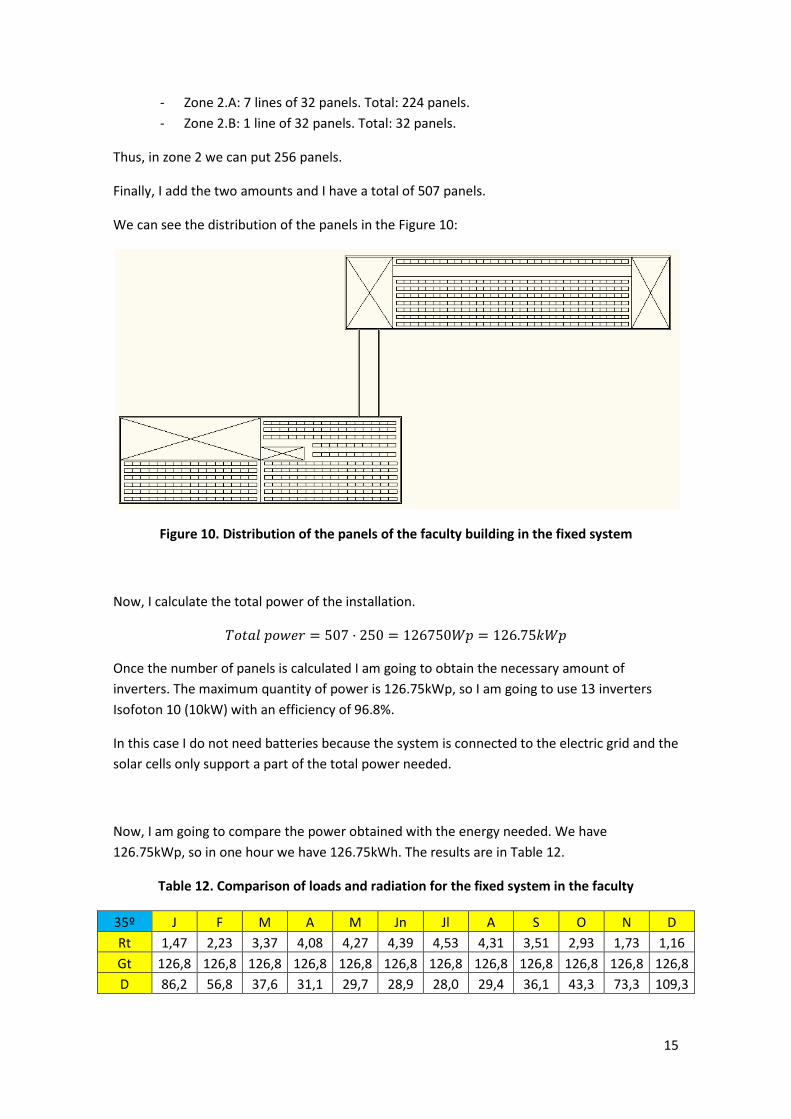
- Zone 2.A: 7 lines of 32 panels. Total: 224 panels.
- Zone 2.B: 1 line of 32 panels. Total: 32 panels.
Thus, in zone 2 we can put 256 panels.
Finally, I add the two amounts and I have a total of 507 panels.
We can see the distribution of the panels in the Figure 10:
Figure 10. Distribution of the panels of the faculty building in the fixed system
Now, I calculate the total power of the installation.
��+,12�345 = 507 · 250 = 126750�2 = 126.75��2
Once the number of panels is calculated I am going to obtain the necessary amount of
inverters. The maximum quantity of power is 126.75kWp, so I am going to use 13 inverters
Isofoton 10 (10kW) with an efficiency of 96.8%.
In this case I do not need batteries because the system is connected to the electric grid and the
solar cells only support a part of the total power needed.
Now, I am going to compare the power obtained with the energy needed. We have
126.75kWp, so in one hour we have 126.75kWh. The results are in Table 12.
Table 12. Comparison of loads and radiation for the fixed system in the faculty
35º J F M A M Jn Jl A S O N D
Rt 1,47 2,23 3,37 4,08 4,27 4,39 4,53 4,31 3,51 2,93 1,73 1,16
Gt 126,8 126,8 126,8 126,8 126,8 126,8 126,8 126,8 126,8 126,8 126,8 126,8
D 86,2 56,8 37,6 31,1 29,7 28,9 28,0 29,4 36,1 43,3 73,3 109,3

16
Finally, I compare the solar energy and the total energy to know the percent of the energy
provided by the sun. The results are in Table 13.
Table 13. Comparison of percentage of contribution of the fixed system in the faculty
35º J F M A M Jn Jl A S O N D
Solar 86,2 56,8 37,6 31,1 29,7 28,9 28,0 29,4 36,1 43,3 73,3 109,3
Total 1843,2 1215,0 804,0 148,9 142,2 138,4 54,5 57,3 173,0 207,3 1566,2 2335,8
% 4,677 4,675 4,677 20,89 20,89 20,88 51,38 51,31 20,87 20,89 4,68 4,679
2.4.2- TRACKING SYSTEM
The solar tracker is a mechanic device which is used to orient photovoltaic panels, because we
would like that they are always perpendicular to the sunlight. Tracking sun from east in the
morning to west in the evening will increase the efficiency of the solar panel up to 45%.
These systems have some advantages over the fixed systems:
- They increase the efficiency of the panel.
- Easy installation and startup.
- Different options to the installation.
- Some systems can be controlled by the Internet if you have the appropriate
software.
- High solar tracking precision.
- It is suitable for panels with low and high power.
- Low power consumption.
However they also have the disadvantage of being more expensive than the fixed ones.
In this case I have decided for a system with two axes and a pole for the movement and
support.
For this installation I am going to use a photovoltaic panel Atersa A-150P, 150W with the
features that we can see in Table 14:
Table 14. Features of the photovoltaic panel Atersa A-150P
Lengths 1476*659*35mm
Area 0.9727 m2
Weight 11.9kg
Efficiency 15.4%
Voltage with open circuit 22.6V
Current with short circuit 8.69A
Voltage with maximum power 17.84V
Current with maximum power 8.41A

17
I am going to join 9 of these panels to form a group, and each group will be installed on a pole.
So, finally we have lengths of 4428*1977mm and the total power of each group will be
1350Wp.
The distance between poles has to be calculated, thus I use the same expressions as in the
fixed case. I calculate the distances for the two extremes situations, in the sunrise and in the
sunset and in noon.
Option 1: sunrise and sunset:
The North-South distance should only be the lengths of the panels, so we need 4.6m. On the
other hand, to calculate the East-West distance I need the expression that I used in the fixed
system. The top inclination of the panel will be 70º, so I use this amount. We see this in Figure
11.
Figure 11. Incidence of radiation
/(�) = � · ���. +� · �%&.
+,&∅(�)
= 1.977 · ���70 +1.977 · �%&70
+,&43.93= 2.604#
Option 2: noon:
In this case the East-West distance is the length of the panels, 4.6m. I use the same expression
to calculate the North-South distance.
/(�) = � · ���. +� · �%&.
+,&∅(�)
= 1.977 · ���15 +1.977 · �%&15
+,&43.93= 2.44#
So, finally I need the same separation between poles, a distance of 4.6m.
The objects on the roof will not disturb the installation of the poles, and they will not have
problems with shadows too, because they are higher and sunlight reaches them directly.
I have to take into account the distance between poles to calculate how many I can install. I
divide all the building in two zones to obtain the available area:
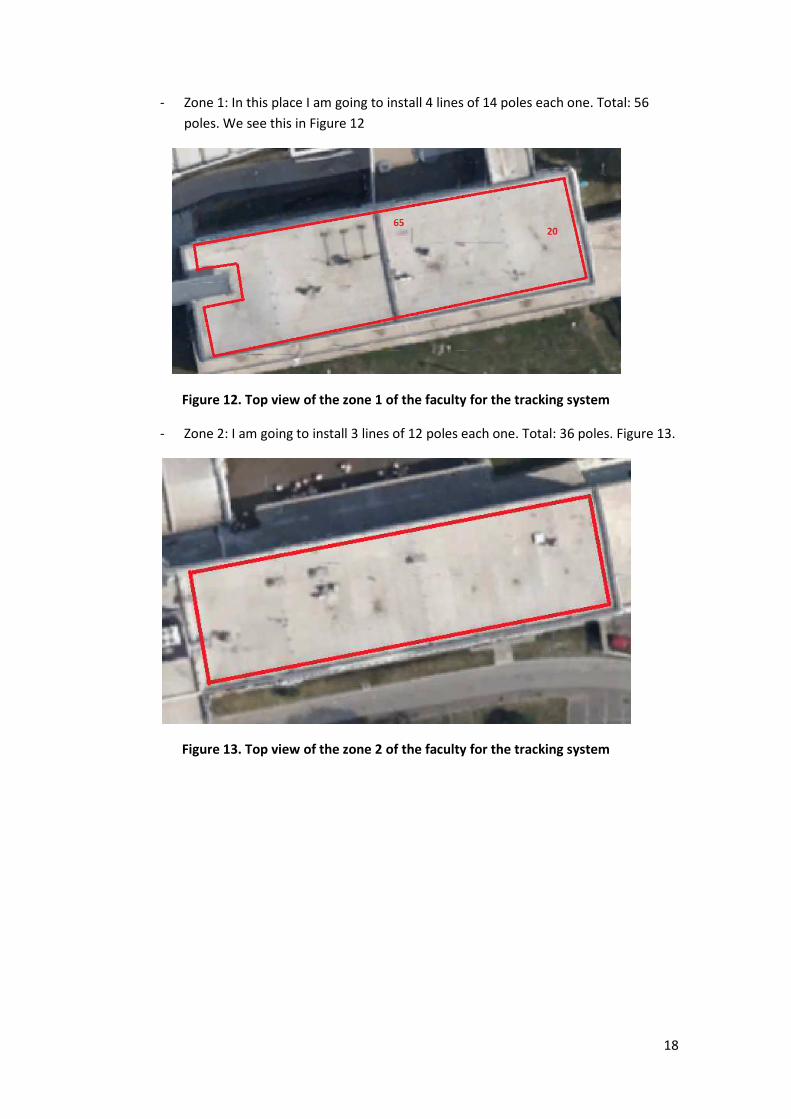
- Zone 1: In this place
poles. We see this in Figure 12
Figure 12. Top view of the zone 1 of the faculty for the tracking sys
- Zone 2: I am going to install 3 lines of
Figure 13. Top view of the zone 2 of the faculty for the tracking system
this place I am going to install 4 lines of 14 poles each one. Total: 56
We see this in Figure 12
Top view of the zone 1 of the faculty for the tracking sys
going to install 3 lines of 12 poles each one. Total: 36
Top view of the zone 2 of the faculty for the tracking system
18
4 lines of 14 poles each one. Total: 56
Top view of the zone 1 of the faculty for the tracking system
36 poles. Figure 13.
Top view of the zone 2 of the faculty for the tracking system

19
The situation of the poles is the next:
Figure 14. Distribution of the panels of the faculty building in the tracking system
Finally, we add up the two amounts and we have a total of 92 groups of panels.
��+,12�345 = 92 ∗ 1350�2 = 124.2��2
Once the power is calculated, I have to increase this value depending on the month with
corrective factors due to the different quantity of radiation reaching in the panels during the
day. In Hungary these factors for tracking systems are between 1.3 in winter and 1.8 in
summer. I obtain the next results of Table 15 for each month.
Table 15. Total power produced per month in the tracking system in the faculty
Power per month (kWp)
J F M A M Jn Jl A S O N D
Factor 1,3 1,4 1,48 1,65 1,65 1,75 1,8 1,8 1,7 1,6 1,45 1,3
Total
power 161,5 173,9 183,8 204,9 204,9 217,4 223,6 223,6 211,1 198,7 180,1 161,5
Now the inverters for the system have to be chosen. The maximum quantity of power is
223.6kW, thus I am going to use 14 inverters Isofoton 23 (10kW) with an efficiency of 96.8%.
In this case I do not need batteries because the system is connected to the electric grid and the
solar cells only cover a part of the total power needed.
The values for the irradiation in Pécs (Hungary) for a tracking system are the in Table 16:
Table 16. Radiation per month for the tracking system in the faculty
Radiation kWh/día/m2
J F M A M Jn Jl A S O N D
Tracking 1,79 2,71 4,17 5,32 5,81 6,09 6,26 5,87 4,42 3,65 2,09 1,38
Now, I divide this power between the irradiation to see the contribution to the system. We see
this in Table 17.

20
Table 17. Comparison of loads and radiation for the tracking system in the faculty
Tracking J F M A M Jn Jl A S O N D
Rt 1,79 2,71 4,17 5,32 5,81 6,09 6,26 5,87 4,42 3,65 2,09 1,38
Gt 161,5 173,9 183,8 204,9 204,9 217,4 223,6 223,6 211,1 198,7 180,1 161,5
D 90,2 64,2 44,1 38,5 35,3 35,7 35,7 38,1 47,8 54,4 86,2 117,0
Finally I compare the solar energy and the total energy to know the percent of the energy
provided by the sun. We see this in Table 18
Table 18. Comparison of percentage of contribution of the tracking system in the faculty
J F M A M Jn Jl A S O N D
Tracking 90,2 64,2 44,1 38,5 35,3 35,7 35,7 38,1 47,8 54,4 86,2 117,0
Total 1843,2 1215,0 804,0 148,9 142,2 138,4 54,5 57,3 173,0 207,3 1566,2 2335,8
% 4,894 5,281 5,483 25,87 24,8 25,79 65,53 66,47 27,61 26,26 5,502 5,009
2.5- CONCLUSIONS
- The main elements of the fixed installation are 507 panels and 13 inverters of
10kW; and for the tracking system are 92 poles with 9 panels each one, and 23
inverters of 10kW.
- In the tracking system I can use more area because the solar panels are not
installed on the floor of the roof, they are in a higher position without being
shadowed by other objects of the roof.
- The comparison of the contribution of the fixed and the tracking system is in Table
19:
Table 19. Comparison of the contribution from the fixed and the tracking system
% J F M A M Jn Jl A S O N D
Fixed 4,68 4,67 4,68 20,89 20,89 20,88 51,38 51,31 20,87 20,89 4,68 4,68
Tracking 4,89 5,28 5,48 25,87 24,80 25,79 65,53 66,47 27,61 26,26 5,50 5,01
As we can see, the contribution of the tracking system is bigger than the
contribution of the fixed one.
- In summer the percentage of contribution is higher because we have more
radiation from the sun and the loads are lower.
- The solar system only contributes with a small quantity of power to the system,
especially in winter, but we do not have to pay the fee for this power.
- The tracking system is more expensive than the fixed one but they produce more
energy. Depending on the budget we have to select one or other.
21
3-OFFICES
3.1- INTRODUCTION
I am going to analyze a typical office building for a company. It has three floors:
- Ground floor: main entrance, reception, waiting room, coffee room.
- First floor: offices, meeting room.
- Second floor: offices.
Each floor has different loads because they do not have the same rooms or the same uses. In
the point 3.2 (Analysis of loads) I am going to calculate all the loads together, without
depending on the floor.
The roof has a slope of 52º and the panels will be installed on it, so they will have the same
inclination. In this case it is not possible install tracking system because of the features of the
roof are not the best to this system.
3.2- ANALYSIS OF LOADS
I describe all the loads of the building together in the next tables.
A- HEATING – AIR COOLING
I assume that the air conditioning system is used for heating and for air cooling. The parts
are enumerated in Table 20.
Table 20. Heating related consumers at the office
Description Total power
3 systems with inside units (15kW) 45kW
Split system 35kW
Air heat recovery 15kW
Extractors and ventilators 5kW
Total 100kW
B- ELEVATORS
The building only has an elevator for 6 people with the loads of Table 21.
Table 21. Elevators related consumers at the office
Description Total power
Electric engine 11kW
2 light bulbs 120W
Total 11,12kW

22
C- LIGHTING
I am going to use fluorescents lamps of 36W. We see the distribution of lamps in Table 22.
Table 22. Distribution of the lights in the office
Room Number of rooms Number of fluorescents Total
Offices 10 3 30
Corridors/stairs - 20 20
Toilets 6 4 24
Reception 1 2 2
Meeting room 1 6 6
Coffee room 1 4 4
Total
86
D- INFORMATION TECHNOLOGY
In this part there are computers, printers, projectors and also a coffee machine. We see
this in Table 23.
Table 23. Technological elements in the office
Description Amount Power Total power
Computers 13 285W 3,7kW
Printers 11 600W 6,6kW
Projectors 1 45W 0,045kW
Coffee machine 2 1500W 3kW
Total
13.35kW
Finally, the summary of all the loads of the building are in Table 24.
Table 24: Total loads in the office
Description Number of elements Power Total
Fluorescents lamps 86 36W 3,1kW
Light bulbs 2 60W 0,12kW
Computers 13 285W 3,7kW
Printers 11 600W 6,6kW
Projectors 1 45W 0,045kW
Air cooling system 3 15kW 45kW
Split system 1 35kW 35kW
Air heat recovery 1 15kW 15kW
Extractors and ventilators 1 5kW 5kW
Coffee machine 2 1500W 3kW
Electric engine 1 11kW 11kW
Total 127,57kW

23
All the loads will not be connected at the same time, so I have to do an approach for it.
The trend of consumption has to be determined during a day, a week and a year.
- Daily: I consider that the office is open from 7a.m to 7p.m. Also the employers
have a rest to having lunch from 2p.m. to 4p.m. We can see this in Figure 15.
Figure 15. Daily trend of electricity consumption in the office
- Weekly: the office is open from Monday to Friday. At the weekend it is closed. We
can see this in Figure 16.
Figure 16. Weekly trend of electricity consumption in the office
0
20
40
60
80
100
120
0 5 10 15 20
Pe
rce
nta
ge
(%
)
Daily hours
Daily
Daily
0
20
40
60
80
100
120
1 2 3 4 5 6 7
Pe
rce
nta
ge
(%
)
Days of the week
Weekly
Weekly
24
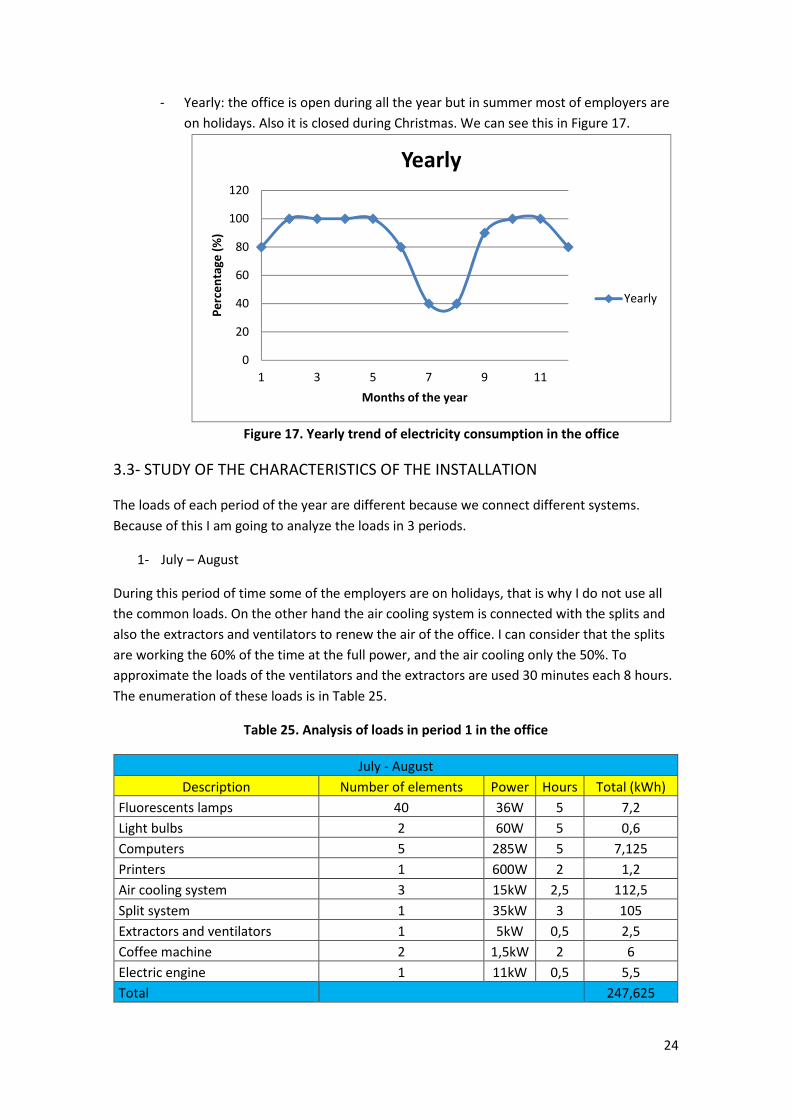
- Yearly: the office is open during all the year but in summer most of employers are
on holidays. Also it is closed during Christmas. We can see this in Figure 17.
Figure 17. Yearly trend of electricity consumption in the office
3.3- STUDY OF THE CHARACTERISTICS OF THE INSTALLATION
The loads of each period of the year are different because we connect different systems.
Because of this I am going to analyze the loads in 3 periods.
1- July – August
During this period of time some of the employers are on holidays, that is why I do not use all
the common loads. On the other hand the air cooling system is connected with the splits and
also the extractors and ventilators to renew the air of the office. I can consider that the splits
are working the 60% of the time at the full power, and the air cooling only the 50%. To
approximate the loads of the ventilators and the extractors are used 30 minutes each 8 hours.
The enumeration of these loads is in Table 25.
Table 25. Analysis of loads in period 1 in the office
July - August
Description Number of elements Power Hours Total (kWh)
Fluorescents lamps 40 36W 5 7,2
Light bulbs 2 60W 5 0,6
Computers 5 285W 5 7,125
Printers 1 600W 2 1,2
Air cooling system 3 15kW 2,5 112,5
Split system 1 35kW 3 105
Extractors and ventilators 1 5kW 0,5 2,5
Coffee machine 2 1,5kW 2 6
Electric engine 1 11kW 0,5 5,5
Total
247,625
0
20
40
60
80
100
120
1 3 5 7 9 11
Pe
rce
nta
ge
(%
)
Months of the year
Yearly
Yearly
25
Using the correcting factors of the efficiency of the inverter and a global increase I obtain:
�� =�� · ��
��
=110 · 247.625
90= 302.6��ℎ
2- January, February, March, November and December
In this period the office is full of employers, so the common loads are in the top of energy
needed. Also I have to include the heating system and we approximate it with a 40% of the full
time. We can see these loads in Table 26.
Table 26. Analysis of loads in period 2 in the office
January - February - March - November - December
Description Number of elements Power Hours Total (kWh)
Fluorescents lamps 86 36W 8 24,5
Light bulbs 2 60W 8 0,96
Computers 13 285W 8 29,64
Printers 11 600W 0,5 3,3
Projectors 1 45W 1 0,045
Split system 1 35kW 4,5 157,5
Air heat recovery 1 15kW 4 60
Extractors and ventilators 1 5kW 0,5 2,5
Coffee machine 2 1,5kW 3 9
Electric engine 1 11kW 2 22
Total
309,445
I need to increase a bit the total amount with the same approximation we did in the other
case.
�� =�� · ��
��
=110 · 309.445
90= 378.21��ℎ

26
3- April, May, June and September
During this period of time the heating or air cooling system is not connected. We can see this
in Table 27.
Table 27. Analysis of loads in period 3 in the office
April - May - June - September
Description Number of elements Power Hours Total (kWh)
Fluorescents lamps 86 36W 8 24,5
Light bulbs 2 60W 8 0,96
Computers 13 285W 8 29,64
Printers 11 600W 0,5 3,3
Projectors 1 45W 1 0,045
Extractors and ventilators 1 5kW 0,5 2,5
Coffee machine 2 1,5kW 3 9
Electric engine 1 11kW 2 22
Total
91,945
The total energy is:
�� =�� · ��
��
=110 · 91.945
90= 112.38��ℎ
3.4- DESIGN OF THE INSTALLATION
The roof has an inclination of 52º, so I will overlay panels on the roof. Obviously the panels will
have 52º of inclination, and I reject the others inclinations and the flexible system.
I use PVGIS to know the radiation in Pécs to this inclination and we obtain the next results.
With this value we can start to calculate the characteristics of our system, as we can see in
Table 28.
Table 28. Comparison of loads and radiation during the year for the office
52º J F M A M Jn Jl A S O N D
Rt 1,59 2,35 3,38 3,9 3,89 3,91 4,07 4,03 3,47 3,06 1,86 1,25
Gt 378,2 378,2 378,2 112,4 112,4 112,4 302,6 302,6 112,4 112,4 378,2 378,2
D 237,9 160,9 111,9 28,8 28,9 28,7 74,3 75,1 32,4 36,7 203,3 302,6

27
The top view of the roof of the building is in Figure 18.
Figure 18. Top view of the roof of the building of the office
I am going to install the photovoltaic panel Isofoton Isf-250, that has the features of Table 29.
Table 29. Features of the photovoltaic panel Isofoton Isf-250
Lengths 1667*994*45mm
Area 1.657 m2
Weight 19kg
Efficiency 15.1%
Voltage with open circuit 37.8V
Current with short circuit 8.75A
Voltage with maximum power 30.6V
Current with maximum power 8.17A
Now I calculate the available area to put the panels and I obtain approximately a square of
16x10m. Comparing this lengths with the ones of the panels with obtain that we can put 10
lines of 9 panels each one. The scheme of the roof is in Figure 19.
Figure 19. View of the distribution of the panels on the roof of the office
It is not necessary space between the cells because they are nail down the roof.

28
The total power we have is:
7�345 = 250 · 90 = 22500�2 = 22.5��2
It is not possible to install all the necessary panels to cover all the power demand, so the
system will be mixed; some energy will be taken from the solar installation and the rest from
the electric grid.
To calculate the needed inverters is necessary taking into account the total power obtained
with the photovoltaic panels. So I only need to invest a maximum of 22.5kWp. I select 5
inverters Isofoton 5 (5kWp), with an efficiency of 97%.
Finally I can calculate the percentage of the solar system to cover the needed loads. The
results are in Table 30.
Table 30. Comparison of loads and radiation for the fixed system in the office
52º J F M A M Jn Jl A S O N D
Rt 1,59 2,35 3,38 3,9 3,89 3,91 4,07 4,03 3,47 3,06 1,86 1,25
Gt 22,5 22,5 22,5 22,5 22,5 22,5 22,5 22,5 22,5 22,5 22,5 22,5
D 14,2 9,6 6,7 5,8 5,8 5,8 5,5 5,6 6,5 7,4 12,1 18,0
And the percentage is obtained is in Table 31.
Table 31. Comparison of percentage of contribution of the fixed system in the office
J F M A M Jn Jl A S O N D
Fixed 14,2 9,6 6,7 5,8 5,8 5,8 5,5 5,6 6,5 7,4 12,1 18,0
Total 237,9 160,9 111,9 28,8 28,9 28,7 74,3 75,1 32,4 36,7 203,3 302,6
% 5,95 5,95 5,95 20,02 20,02 20,02 7,44 7,44 20,02 20,02 5,95 5,95
3.5- CONCLUSIONS
- The main elements of the installation are 90 panels and 5 inverters of 5kW.
- If we have any problem with the solar installation we should have energy as well
because we are connected to the grid. Of course, the same advantage but in the
other side, if we have problems with the grid we can support the system with the
solar cells.
- The panels are only installed facing to the South because it is the correct form.
- In this case it is not necessary use batteries because the system is connected to the
electric grid.
- The biggest contribution of the solar panels is in Autumn and in Spring because we
have the lower loads.
29
4-SUPERMARKET
4.1 - INTRODUCTION
In this part I am going to design an installation for a supermarket. It only has one floor and it is
divided in the purchase zone, the store and an office.
The roof is flat, so the system will be easily installed. On the roof there are some chimneys, air
extraction systems and a big area that is not available to install the solar cells.
Finally I am going to design a tracking system because the conditions of the roof permit it.
4.2-ANALYSIS OF LOADS
I am going to analyze a medium supermarket. It has the main area to purchase, offices and the
store.
A- HEATING – AIR COOLING
It will have two different systems, once for the supermarket and the other one for the
office. We can see this in Table 32.
Table 32. Heating related consumers at the supermarket
Description Total power
3 heating/Air cooling system (30kW) 90kW
Office air conditioning 10kW
Total 100kW
I include in this part the refrigeration for meat, fish and milk products, and the
freezers. We can see this in Table 33.
Table 33. Refrigeration and freezers at the supermarket
Description Total power
6 refrigeration systems for food 40kW
6 freezers 20kW
Total 60kW
B- ELEVATORS
It is not normal have elevators in a supermarket, so I ignore it.

30
C- LIGHTING
I am going to use fluorescents lamps of 36W. We see the distribution of lamps in Table
34.
Table 34. Distribution of the lights in the supermarket
Room Number of fluorescents
Supermarket 50
Office 10
Store 20
Total 80
D- INFORMATION TECHNOLOGY
The supermarket has 4 computers to collect the money of the purchase, another one
in the office, a loudspeakers system and 3 automatic doors. The resume of these
elements is in Table 35.
Table 35. Technological elements in the supermarket
Description Amount Power Total power
Computers 5 285W 1,43kW
Automatic doors 3 100W 0,3kW
Loudspeakers 6 200W 1,2kW
Microphone 3 80W 0,24kW
Total
3,17kW
Finally, the summary of all loads of the supermarket is in Table 36:
Table 36: Total loads in the supermarket
Description Number of elements Power Total
Fluorescents lamps 80 36W 2,9kW
Computers 5 285W 1,43kW
Automatic doors 3 100W 0,3kW
Loudspeakers 6 200W 1,2kW
Microphone 3 80W 0,24kW
Refrigeration system for food 6
40kW
Freezers 6
20kW
Heating/Air cooling system 3 30kW 90kW
Office air conditioning 1 10kW 10kW
Total
166,07kW
The trend of consumption has to be determined during a day, a week and a year.

31
- Daily: the supermarket is open during the day, but at night it also has consumption
because of the freezers and the refrigeration systems for food. We can see this in
Figure 20.
Figure 20. Daily trend of electricity consumption in the supermarket
- Weekly: the supermarket is open less hours on Saturday and it is closed on Sunday,
but it needs power to the freezers and refrigeration systems. We can see this in
Figure 21.
Figure 21. Weekly trend of electricity consumption in the supermarket
0
20
40
60
80
100
120
0 5 10 15 20
Pe
rce
nta
ge
(%
)
Daily hours
Daily
Daily
0
20
40
60
80
100
120
1 2 3 4 5 6 7
Pe
rce
nta
ge
(%
)
Days of the week
Weekly
Weekly

32
- Yearly: the consumption during all the months is constant. We can see this in
Figure 22.
Figure 22. Yearly trend of electricity consumption in the supermarket
4.3 - STUDY OF THE CHARACTERISTICS OF THE INSTALLATION
The timetable of the supermarket is the same for all the year, so all the common loads will be
the same. The refrigeration system for food and the freezers works 24 hours per day, but I
estimate that they work 16 hours with the top power.
1- July and August
The air cooling system for the purchase zone and the office is working during this period. All
the loads are resumed in Table 37.
Table 37. Analysis of loads in period 1 in the supermarket
July - August
Description Number of elements Power Hours Total (kWh)
Fluorescents lamps 80 36W 12 34,56
Computers 5 285W 12 17,1
Automatic doors 3 100W 4 1,2
Loudspeakers 6 200W 3 3,6
Microphone 3 80W 3 0,72
Refrigeration system for food 6 40kW 16 3840
Freezers 6 20kW 16 1920
Heating/Air cooling system 3 30kW 5 450
Office air conditioning 1 10kW 2 20
Total
6287,18
0
10
20
30
40
50
60
70
80
90
100
1 3 5 7 9 11
Pe
rce
nta
ge
(%
)
Months of the year
Yearly
Yearly

33
With the correcting factors I obtain:
�� =�� · ��
��
=110 · 6287.18
90= 7684.33��ℎ
2- January, February, March, November and December
The heating system is connected and it needs the same energy than the air cooling system. We
can see this in Table 38.
Table 38. Analysis of loads in period 2 in the supermarket
January - February - March - November - December
Description Number of elements Power Hours Total (kWh)
Fluorescents lamps 80 36W 12 34,56
Computers 5 285W 12 17,1
Automatic doors 3 100W 4 1,2
Loudspeakers 6 200W 3 3,6
Microphone 3 80W 3 0,72
Refrigeration system for food 6 40kW 16 3840
Freezers 6 20kW 16 1920
Heating/Air cooling system 3 30kW 5 450
Total
6267,18
With the correcting factors we obtain:
�� =�� · ��
��
=110 · 6267.18
90= 7659.89��ℎ
3- April, May, June, September, October
As we can see in Table 39, it is not necessary the heating system.
Table 39. Analysis of loads in period 3 in the supermarket
April - May - June - September - October
Description Number of elements Power Hours Total (kWh)
Fluorescents lamps 80 36W 12 34,56
Computers 5 285W 12 17,1
Automatic doors 3 100W 4 1,2
Loudspeakers 6 200W 3 3,6
Microphone 3 80W 3 0,72
Refrigeration system for food 6 40kW 16 3840
Freezers 6 20kW 16 1920
Total 5817,18

34
With the correcting factors we obtain:
�� =�� · ��
��
=110 · 5817.18
90= 7109.89��ℎ
Once we have the loads of all the year I am going to calculate which month is the most
restrictive. With this value I can start to calculate the characteristics of the system, as we can
see in Table 40.
Table 40. Comparison of loads and radiation during the year for the supermarket
35º J F M A M Jn Jl A S O N D
Rt 1,47 2,23 3,37 4,08 4,27 4,39 4,53 4,31 3,51 2,93 1,73 1,16
Gt 7660 7660 7660 7110 7110 7110 7684 7684 7110 7110 7660 7660
D 5211 3435 2273 1743 1665 1620 1696 1783 2026 2427 4428 6603
The loads of this building are huge for only a photovoltaic system, so it needs be connected to
the electric grid. The contribution of solar cells will be only a bit of the needed energy, so I will
calculate the maximum number of panels that I can install and after that I will obtain the
percentage of contribution.
4.4- DESIGN OF THE INSTALLATION
4.4.1- FIXED SYSTEM
When I know the loads and the radiation I can start to design the installation of the
supermarket. First of all I should calculate the number of photovoltaic cells I need. This amount
will be huge due to a lot energy is needed to cover all the necessities. That is the main reason
because we are going to install as much panels as I can but the rest of energy will be cover by
the electric net.
The roof of the supermarket is a plane surface conducive to the installation of photovoltaic
panels. In the roof there is a zone that is not available to put the cells. I divide the other area in
two parts to calculate all the available area. The diagram is in Figure 23.

35
Figure 23. Top view of the roof of the supermarket
The total area of the roof is:
8 = 33 · 29 = 957#�
Where:
- A is the total area of the roof
And the available area is:
8� = 25 · 20 = 500#�
8� = 15 · 8 = 120#�
89 = 8� + 8� = 500 + 120 = 620#�
Where:
- A1 is the available area of zone 1.
- A2 is the available area of zone 2.
- AT is the available area of all the roof.
Due to the position of the supermarket, the panels with be in a southerly direction with an
Azimuth deviation of 10º.
First of all I select the photovoltaic panel Isofoton Isf-250 with 250Wp. The features are in
Table 41.
Table 41. Features of the photovoltaic panel Isofoton Isf-250
Lengths 1667*994*45mm
Area 1.657 m2
Weight 19kg
Efficiency 15.1%
Voltage with open circuit 37.8V
Current with short circuit 8.75A
Voltage with maximum power 30.6V
Current with maximum power 8.17A
36
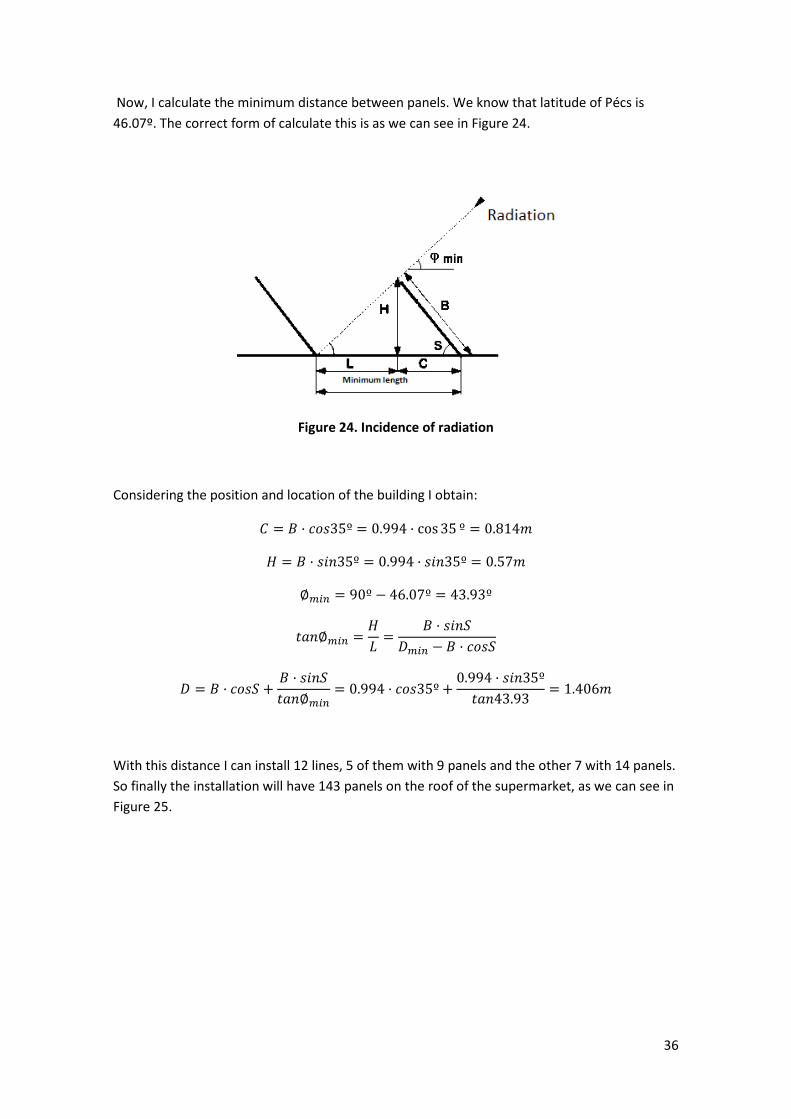
Now, I calculate the minimum distance between panels. We know that latitude of Pécs is
46.07º. The correct form of calculate this is as we can see in Figure 24.
Figure 24. Incidence of radiation
Considering the position and location of the building I obtain:
� = � · ���35º = 0.994 · cos35 º = 0.814#
$ = � · �%&35º = 0.994 · �%&35º = 0.57#
∅(�) = 90º − 46.07º = 43.93º
+,&∅(�) =$
-=
� · �%&.
/(�) −� · ���.
/ = � · ���. +� · �%&.
+,&∅(�)
= 0.994 · ���35º +0.994 · �%&35º
+,&43.93= 1.406#
With this distance I can install 12 lines, 5 of them with 9 panels and the other 7 with 14 panels.
So finally the installation will have 143 panels on the roof of the supermarket, as we can see in
Figure 25.

37
Figure 25. Distribution of the panels for the fixed system on the roof of the supermarket
��+,12�345 = 1432,&41� · 250�2 = 35750�2 = 35.75��2
I divide this amount of power between the irradiation to know the contribution to the system.
It is summarized in Table 42.
Table 42. Comparison of loads and radiation for the fixed system in the supermaket
35º J F M A M Jn Jl A S O N D
Rt 1,5 2,2 3,4 4,1 4,3 4,4 4,5 4,3 3,5 2,9 1,7 1,2
Gt 35,75 35,75 35,75 35,75 35,75 35,75 35,75 35,75 35,75 35,75 35,75 35,75
D 24,32 16,03 10,61 8,76 8,37 8,14 7,89 8,29 10,19 12,20 20,66 30,82
In Table 43 it is calculated the percentage of contribution for the fixed system:
Table 43. Comparison of percentage of contribution of the fixed system in the supermarket
% J F M A M Jn Jl A S O N D
Fixed 24,3 16,0 10,6 8,8 8,4 8,1 7,9 8,3 10,2 12,2 20,7 30,8
Total 5211 3435 2273 1743 1665 1620 1696 1783 2026 2427 4428 6603
% 0,47 0,47 0,47 0,50 0,50 0,50 0,47 0,47 0,50 0,50 0,47 0,47
Finally I obtain the necessary amount of inverters. The maximum quantity of power is
35.75kWp, so I am going to use 4 inverters Isofoton 10 (10kW) with an efficiency of 96.8%.

38
4.4.2- TRACKING SYSTEM
The solar tracker is a mechanic device which is used to orient photovoltaic panels, because we
would like that they are always perpendicular to the sunlight. Tracking sun from east in the
morning to west in the evening will increase the efficiency of the solar panel up to 45%.
These systems have some advantages over the fixed systems:
- They increase the efficiency of the panel.
- Easy installation and startup.
- Different options to the installation.
- Some systems can be controlled by the Internet if you have the appropriate
software.
- High solar tracking precision.
- It is suitable for panels with low and high power.
- Low power consumption.
However they also have the disadvantage of being more expensive than the fixed ones.
In this case I have decided for a system with two axes and a pole for the movement and
support.
For this installation I am going to use a photovoltaic panel Atersa A-150P, 150W with the
features of the Table 44:
Table 44. Features of the photovoltaic panel Atersa A-150P
Lengths 1476*659*35mm
Area 0.9727 m2
Weight 11.9kg
Efficiency 15.4%
Voltage with open circuit 22.6V
Current with short circuit 8.69A
Voltage with maximum power 17.84V
Current with maximum power 8.41A
I am going to join 9 of these panels to form a group, and each group will be installed on a pole.
So, finally the groups are 4428*1977mm and the total power of each group will be 1350Wp.
The distance between poles has to be calculated, thus I use the same expressions as in the
fixed case. I calculate the distances for the two extremes situations, in the sunrise and in the
sunset and in noon.
39
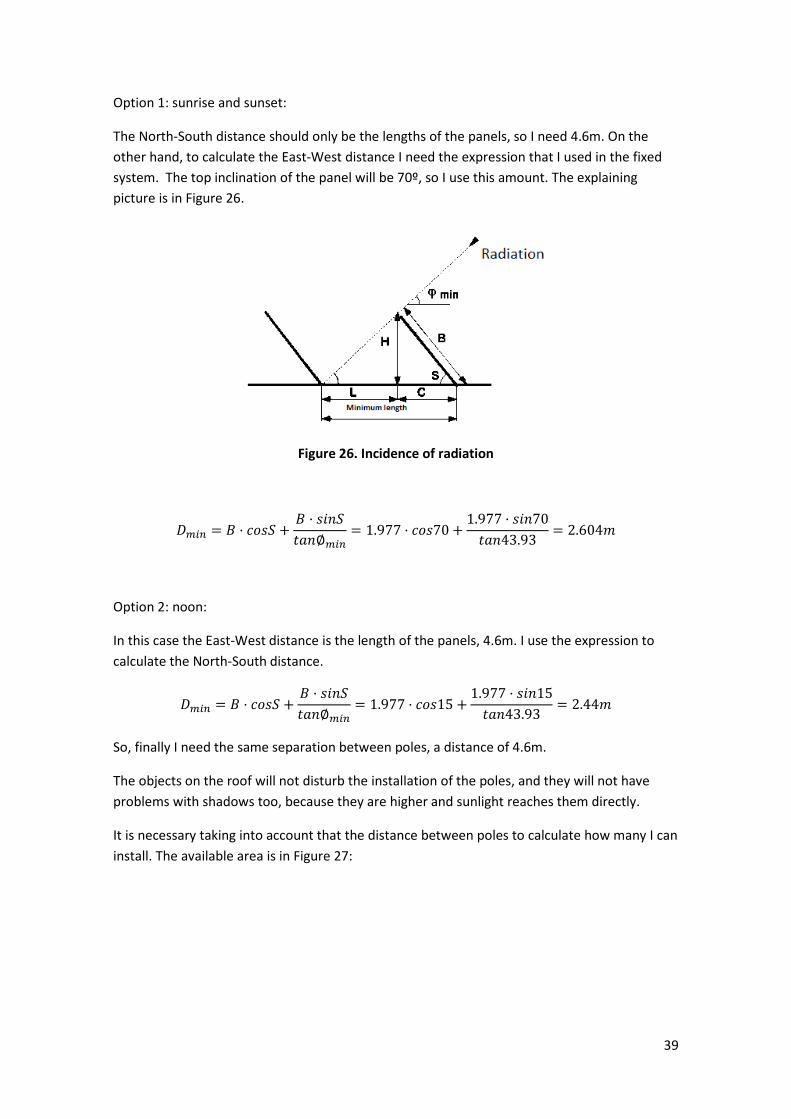
Option 1: sunrise and sunset:
The North-South distance should only be the lengths of the panels, so I need 4.6m. On the
other hand, to calculate the East-West distance I need the expression that I used in the fixed
system. The top inclination of the panel will be 70º, so I use this amount. The explaining
picture is in Figure 26.
Figure 26. Incidence of radiation
/(�) = � · ���. +� · �%&.
+,&∅(�)
= 1.977 · ���70 +1.977 · �%&70
+,&43.93= 2.604#
Option 2: noon:
In this case the East-West distance is the length of the panels, 4.6m. I use the expression to
calculate the North-South distance.
/(�) = � · ���. +� · �%&.
+,&∅(�)
= 1.977 · ���15 +1.977 · �%&15
+,&43.93= 2.44#
So, finally I need the same separation between poles, a distance of 4.6m.
The objects on the roof will not disturb the installation of the poles, and they will not have
problems with shadows too, because they are higher and sunlight reaches them directly.
It is necessary taking into account that the distance between poles to calculate how many I can
install. The available area is in Figure 27:

Figure 27. Top view of the available area of the roof of the supermarket
Taking into account the distance between poles I am
in Figure 28:
Figure 28. Distribution of the poles for the tracking system on the roof of the su
The total power installed is:
��+,12�345 =
Once I have calculated the power, we have to increase this value depending on the month with
corrective factors due to the different quantity of radi
day. In Hungary these factors for t
summer. I obtain the results of Table 45
Top view of the available area of the roof of the supermarket
t the distance between poles I am going to install 36 groups. The scheme is
Distribution of the poles for the tracking system on the roof of the su
= 36:5�;2� ∗ 1350�2 � 48600�2 � 48.6��2
have calculated the power, we have to increase this value depending on the month with
corrective factors due to the different quantity of radiation receive in the panels during the
day. In Hungary these factors for tracking systems are between 1.3 in winter and 1.8 in
of Table 45 for each month.
40
Top view of the available area of the roof of the supermarket
groups. The scheme is
Distribution of the poles for the tracking system on the roof of the supermarket
��2
have calculated the power, we have to increase this value depending on the month with
ation receive in the panels during the
in winter and 1.8 in
41
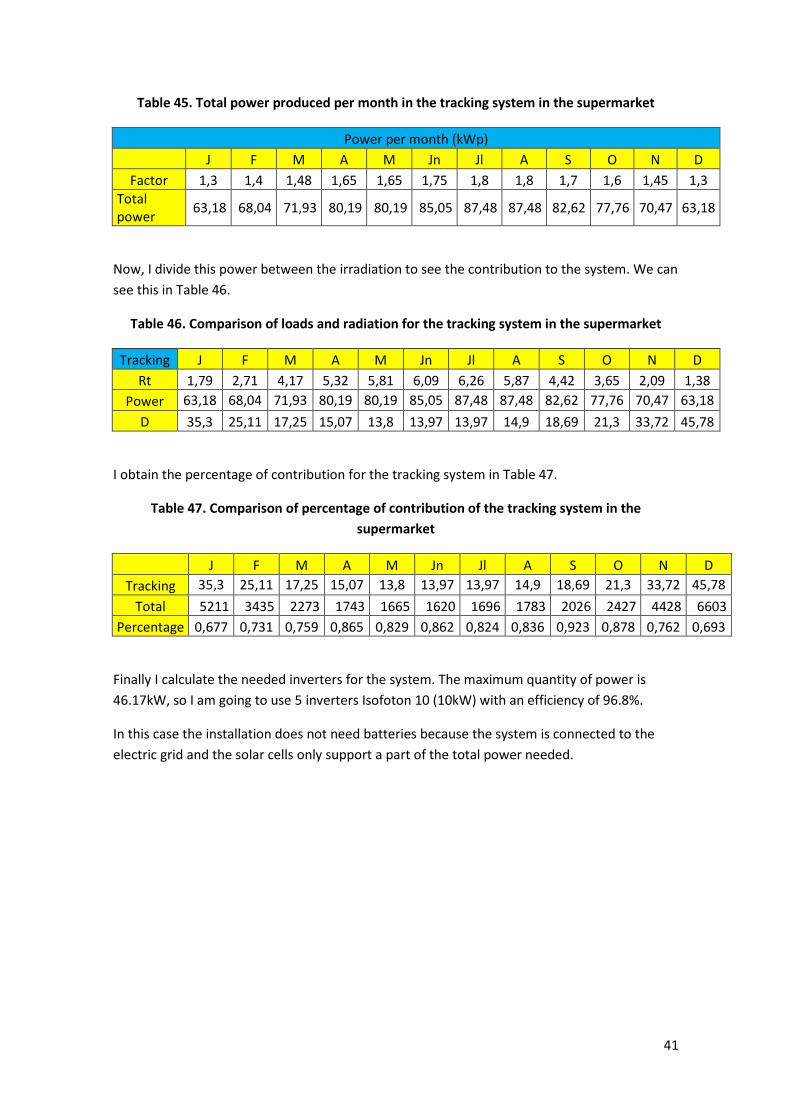
Table 45. Total power produced per month in the tracking system in the supermarket
Power per month (kWp)
J F M A M Jn Jl A S O N D
Factor 1,3 1,4 1,48 1,65 1,65 1,75 1,8 1,8 1,7 1,6 1,45 1,3
Total
power 63,18 68,04 71,93 80,19 80,19 85,05 87,48 87,48 82,62 77,76 70,47 63,18
Now, I divide this power between the irradiation to see the contribution to the system. We can
see this in Table 46.
Table 46. Comparison of loads and radiation for the tracking system in the supermarket
Tracking J F M A M Jn Jl A S O N D
Rt 1,79 2,71 4,17 5,32 5,81 6,09 6,26 5,87 4,42 3,65 2,09 1,38
Power 63,18 68,04 71,93 80,19 80,19 85,05 87,48 87,48 82,62 77,76 70,47 63,18
D 35,3 25,11 17,25 15,07 13,8 13,97 13,97 14,9 18,69 21,3 33,72 45,78
I obtain the percentage of contribution for the tracking system in Table 47.
Table 47. Comparison of percentage of contribution of the tracking system in the
supermarket
J F M A M Jn Jl A S O N D
Tracking 35,3 25,11 17,25 15,07 13,8 13,97 13,97 14,9 18,69 21,3 33,72 45,78
Total 5211 3435 2273 1743 1665 1620 1696 1783 2026 2427 4428 6603
Percentage 0,677 0,731 0,759 0,865 0,829 0,862 0,824 0,836 0,923 0,878 0,762 0,693
Finally I calculate the needed inverters for the system. The maximum quantity of power is
46.17kW, so I am going to use 5 inverters Isofoton 10 (10kW) with an efficiency of 96.8%.
In this case the installation does not need batteries because the system is connected to the
electric grid and the solar cells only support a part of the total power needed.

42
4.5-CONCLUSIONS
- The main elements of the fixed installation are 143 panels and 4 inverters of 4kW
each one; for the tracking system we have 36 groups and 5 inverters of 10kW.
- The comparison of the contribution of the fixed and the tracking system is in Table
48:
Table 48. Comparison of the contribution from the fixed and the tracking system
% J F M A M Jn Jl A S O N D
Fixed 0,467 0,467 0,467 0,503 0,503 0,503 0,465 0,465 0,503 0,503 0,467 0,467
Tracking 0,677 0,731 0,759 0,865 0,829 0,862 0,824 0,836 0,923 0,878 0,762 0,693
As we can see, the contribution of the tracking system is bigger than the
contribution of the fixed one.
- The solar system only contributes with a small quantity of power to the system,
but during the months we do not have to pay the fee for this power. In big
installation like a supermarket the percentage of power contribution is really small.
- The tracking system is more expensive than the fixed one but they produce more
energy. Depending on the budget it is possible select one or other.
43
5-CHURCH
5.1 - INTRODUCTION
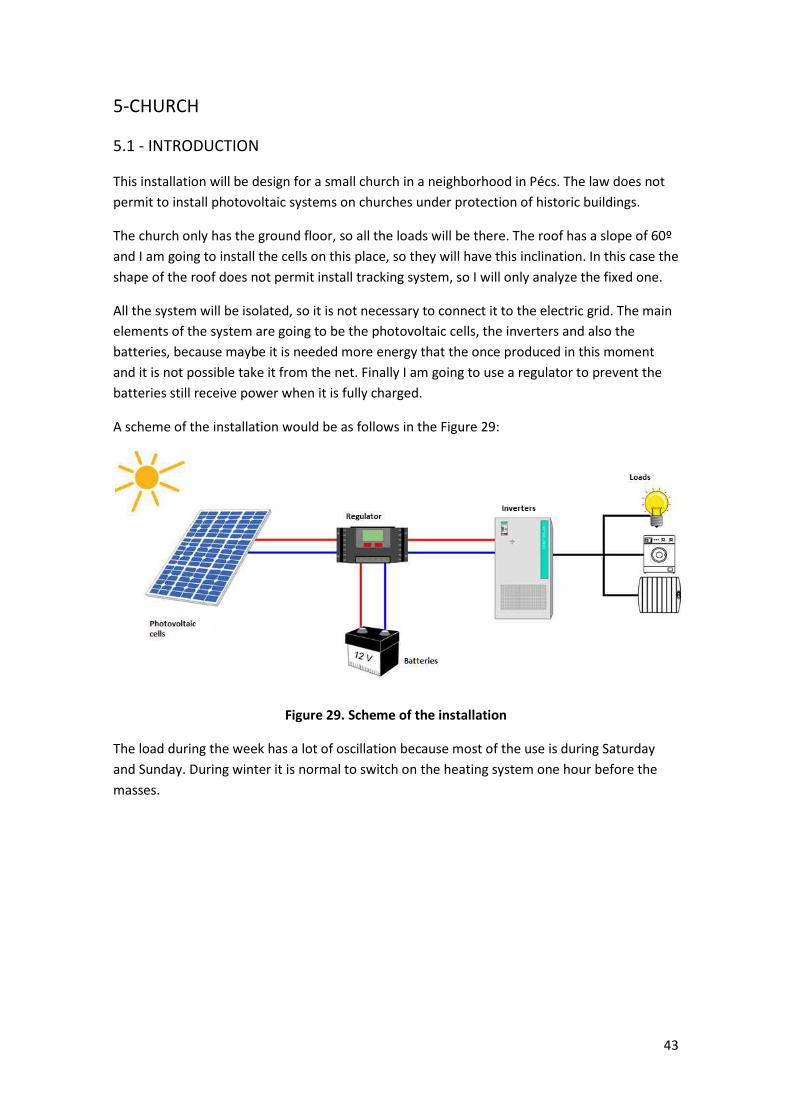
This installation will be design for a small church in a neighborhood in Pécs. The law does not
permit to install photovoltaic systems on churches under protection of historic buildings.
The church only has the ground floor, so all the loads will be there. The roof has a slope of 60º
and I am going to install the cells on this place, so they will have this inclination. In this case the
shape of the roof does not permit install tracking system, so I will only analyze the fixed one.
All the system will be isolated, so it is not necessary to connect it to the electric grid. The main
elements of the system are going to be the photovoltaic cells, the inverters and also the
batteries, because maybe it is needed more energy that the once produced in this moment
and it is not possible take it from the net. Finally I am going to use a regulator to prevent the
batteries still receive power when it is fully charged.
A scheme of the installation would be as follows in the Figure 29:
Figure 29. Scheme of the installation
The load during the week has a lot of oscillation because most of the use is during Saturday
and Sunday. During winter it is normal to switch on the heating system one hour before the
masses.

44
5.2-ANALYSIS OF LOADS
A- HEATING – AIR COOLING
The church does not have a heating system and it only has 4 electric heaters (3 in the
main area of the church and the other one in the sacristy). We can see this in Table 49.
Table 49. Heating related consumers at the church
Description Total power
4 electric heaters (2000W each one) 8000W
Total 8kW
B- ELEVATORS
Small churches rarely have elevator, so it is not included in this case.
C- LIGHTING
The building is divided in different places: the main area and the sacristy. I am going to
use bulbs of 12W. We can see the distribution in Table 50.
Table 50. Distribution of the lights in the church
Room Number of rooms Number of bulbs Total
Main area 1 50 50
Sacristy 1 10 10
Total
60
D- INFORMATION TECHNOLOGY
It is necessary to install a loudspeakers system in the main area. I also include a radio
in the sacristy for the priest. We can see this in Table 51.
Table 51. Technological elements in the church
Description Amount Power Total power
Loudspeakers 12 400W 4,8kW
Microphone 2 80W 0,16kW
Radio 1 100W 0,1kW
Total
5,06kW

45
Finally, the summary of all building loads is in Table 52:
Table 52: Total loads in the church
Description Number of elements Power Total
Heaters 4 2000W 8kW
Bulbs 60 12W 0,72kW
Loudspeakers 12 400W 4,8kW
Microphone 2 80W 0,16kW
Radio 1 100W 0,1kW
Total
13,78kW
The graphs of loads are as follows.
- Daily: the top of the loads is during the day. At night the church is closed, as we
can see in Figure 30.
Figure 30. Daily trend of electricity consumption in the church
0
20
40
60
80
100
120
-1 4 9 14 19 24
Pe
rce
nta
ge
(%
)
Daily hours
Daily
Daily
46
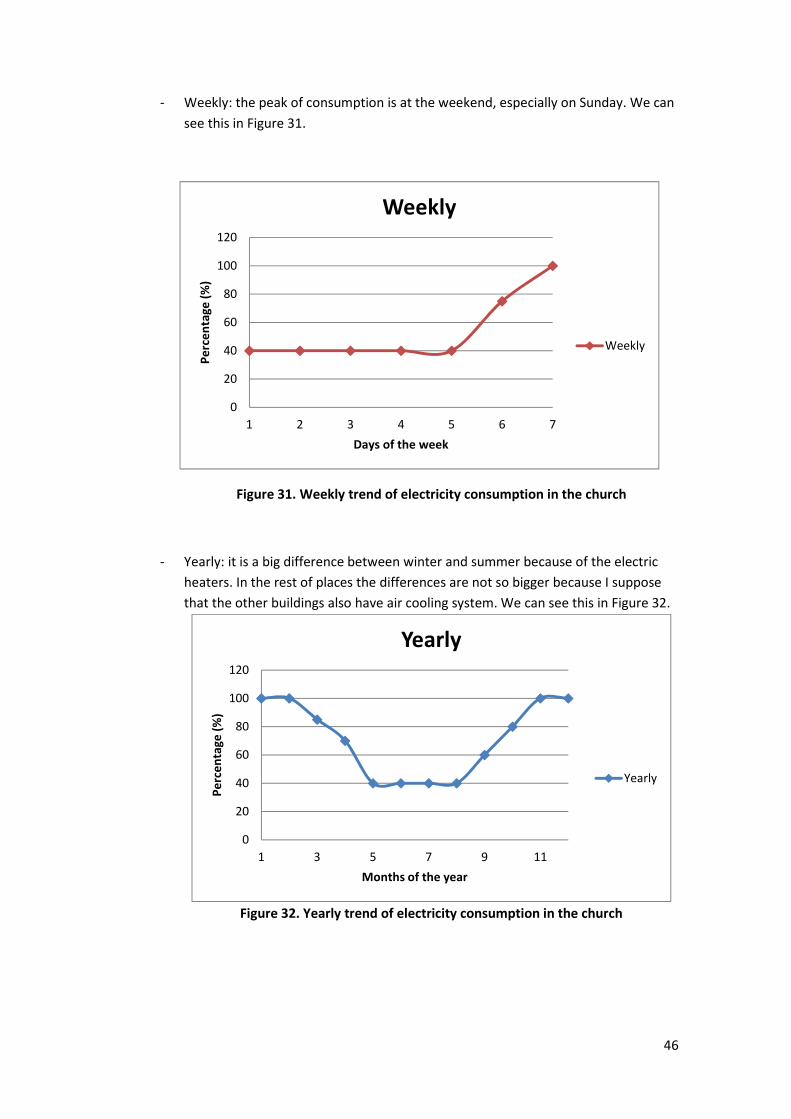
- Weekly: the peak of consumption is at the weekend, especially on Sunday. We can
see this in Figure 31.
Figure 31. Weekly trend of electricity consumption in the church
- Yearly: it is a big difference between winter and summer because of the electric
heaters. In the rest of places the differences are not so bigger because I suppose
that the other buildings also have air cooling system. We can see this in Figure 32.
Figure 32. Yearly trend of electricity consumption in the church
0
20
40
60
80
100
120
1 2 3 4 5 6 7
Pe
rce
nta
ge
(%
)
Days of the week
Weekly
Weekly
0
20
40
60
80
100
120
1 3 5 7 9 11
Pe
rce
nta
ge
(%
)
Months of the year
Yearly
Yearly

47
5.3- STUDY OF THE CHARACTERISTICS OF THE INSTALLATION
I divide the months in two groups depending on the heaters. I am going to suppose that all the
days of the week are similar, that is why the number of hours is very small, because at the
weekends the church will be open more time than during the week.
1- January, February, March, November, December
During these months we need the heaters, as we can see in Table 53.
Table 53. Analysis of loads in period 1 in the church
January - February - March - November - December
Description Number of elements Power Hours Total (kWh)
Heaters 4 2000W 1 8
Bulbs 60 12W 3 2,16
Loudspeakers 12 400W 0,5 2,4
Microphone 2 80W 0,5 0,08
Radio 1 100W 0,5 0,05
Total 12,69
I use the correcting factors.
�� ��� · ��
���
110 · 12.69
90= 15.51��ℎ
2- April, May, June, July, August, September, October
It is not necessary use the heaters, so the energy is lower than in the other case. We see this in
Table 54.
Table 54. Analysis of loads in period 2 in the church
April - May - June - July - August - September - October
Description Number of elements Power Hours Total (kWh)
Bulbs 60 12W 3 2,16
Loudspeakers 12 400W 0,5 2,4
Microphone 2 80W 0,5 0,08
Radio 1 100W 0,5 0,05
Total 4,69
We use the correcting factors again.
�� =�� · ��
��
=110 · 4.69
90= 5.73��ℎ

48
5.4- DESIGN OF THE INSTALLATION
In this case I am going to overlay the panels on the roof. So I need the radiation for 60º,
because it is the inclination of the roof. We obtain the comparison between loads and
radiation in Table 55.
Table 55. Comparison of loads and radiation during the year for the church
60º J F M A M Jn Jl A S O N D
Rt 2,05 3,19 4,03 4,76 4,94 4,89 5,03 5,08 4,44 3,79 2,45 1,6
Gt 15,51 15,51 15,51 5,73 5,73 5,73 5,73 5,73 5,73 5,73 15,51 15,51
D 7,57 4,86 3,85 1,20 1,16 1,17 1,14 1,13 1,29 1,51 6,33 9,69
Such as in the other buildings I am going to use the photovoltaic panel Isofoton Isf-250 with
250Wp. It has the characteristics written in Table 56.
Table 56. Features of the photovoltaic panel Isofoton Isf-250
Lengths 1667*994*45mm
Area 1.657 m2
Weight 19kg
Efficiency 15.1%
Voltage with open circuit 37.8V
Current with short circuit 8.75A
Voltage with maximum power 30.6V
Current with maximum power 8.17A
The orientation of the church is East-West, so I am going to install de panels in the Southern
direction with an Azimuth of 5º. An approximately scheme of the church is in Figure 33.
Figure 33. Available area of the roof of the church

49
Zones 1 and 2 are where the panels will be installed. In the part with the cross I prefer do not
install anything because it is curve and the orientation is not good. The available total area is
95.6m2.
Now I to obtain the needed area:
. �1.1 · /
<=
1.1 · 9.69
0.151= 70.59#�
Where:
- S is the total area
- D is the relation between Rt and Gt. Measurement unit: m2
- <is the efficiency of the panel.
=;#>45�?2,&41� =.
8=
70.59
1.667 · 0.994= 42.6 → 432,&41�
Where:
- S is the total area.
- A is the area of each panel
��+,12�345 = 250�2 · 432,&41� = 10750�2 = 10.75��2
We can see the position of the panels in Figure 34.
Figure 34. Distribution of the panels on the roof of the church

50
Once I have calculated the number of panels, I select the inverters. For this problem we
suppose that all the loads are connected at the same time. Due to it is normal in a church have
everything connected during the masses we have the results in Table 56.
Table 56. Total loads of the church
Description Number of elements Power Total
Heaters 4 2000W 8kW
Bulbs 60 12W 0,72kW
Loudspeakers 12 400W 4,8kW
Microphone 2 80W 0,16kW
Radio 1 100W 0,1kW
Total
13,78kW
It is not possible to have so bigger inverters, so I use three inverters Isofoton 5 (5 kW),
obtaining a maximum of 15kW.
Finally I need obtain the number of batteries needed. Each battery will have 48V in total and
2V for each section inside it, so I need 24 sections for each battery. We select the model Rolls
48V S460 460Ah C100 with maximum discharge capacity of 70%.
Now I obtain the accumulation capacity:
���� �110 · � · /
� · A=
110 · 15510 · /
48 · 70= 507 · /8ℎ
Where:
- C100 is the accumulation capacity
- G is the energy with correcting factors
- D are the days of autonomy
- T is the voltage
- M is the maximum capacity of discharge
We have to calculate the autonomy days with some tests:
- Load current:
BCDEF < 10% · ����
Where:
o Iload is the current to load
o C100 is the accumulation capacity

51
BCDEF ���
��
10750
48= 223.968 < 50.7 · / → / > 4.42J,K�
Where:
o Iload is the current to load
o CT is the total power of the panels
o T is the voltage
- Download current:
BFDL)CDEF < 10% · ����
Where:
o Idownload is the current to download
o C100 is the accumulation capacity
BFDL)CDEF =7�)M
�=
15000
48= 312.58 < 50.7 · / → / > 6.16J,K�
Where:
o Idownload is the current to download
o Pinv is the total power of the panels
o T is the voltage
- Night loads:
=%:ℎ+1�,J� < 20% · ����
Where:
o C100 is the accumulation capacity
=%:ℎ+1�,J� =�)�NOP
�= 0 → / > 0J,K�
Where:
o Gnight is the total loads at night
o T is the voltage
So, finally it is necessary have batteries with 7 autonomy days.
The accumulation capacity is:
���� = 507 · /8ℎ = 507 · 7 = 35498ℎ
Now I obtain the number of batteries:
=;#>45�?>,++45%4� =3549
460= 7.7 → 8>,++45%4�

52
5.5- CONCLUSIONS
- The main elements of the installation are 43 solar panels, 3 inverters, 1 regulator
and 8 batteries.
- The installation is isolated, so all the power will be produced by this elements.
- During winter we have the biggest amount of power needed and the lowest
amount of energy produced, so we need the batteries full charged for this period
of time. In summer we do not have this problem because the quantity of radiation
is bigger.
- The solar panels are only faces Southern because it is the best option. It has no
sense put it faces Northern because they will not have a good efficiency.
- It is not necessary power lines because the energy will be consumed in the same
place where it is produced.
- We have to pay the initial investment but after that we do not have to pay
monthly instalments.

53
6- COMPARISON OF THE CONSUMPTIONS
I am going to probe that the consumption of the different buildings is really different.
- Yearly: we can see that the office and the faculty have the same graphic of
consumption. The amount of power needed oscillate because of the summer
holidays. The church varies too, but this is because we consider that it is not
necessary the air cooling and the electric heaters need a lot of energy to work
correctly. On the other hand the consumption of the supermarket is always the
same more or less during the year. We can see this in the Figure 35.
Figure 35. Comparison of the consumptions during a year
- Weekly: we can see that all the buildings have their top of consumption during the
week. The exception is the church because most ceremonies are during the
weekend, as we can see in the Figure 36.
Figure 36. Comparison of the consumptions during a week
0
20
40
60
80
100
120
1 3 5 7 9 11
Pe
rce
nta
ge
(%
)
Months of the year
Yearly consumption
Faculty
Office
Supermarket
Church
0
20
40
60
80
100
120
1 2 3 4 5 6 7
Pe
rce
nta
ge
(%
)
Days of the week
Weekly consumption
Faculty
Office
Supermarket
Church
54
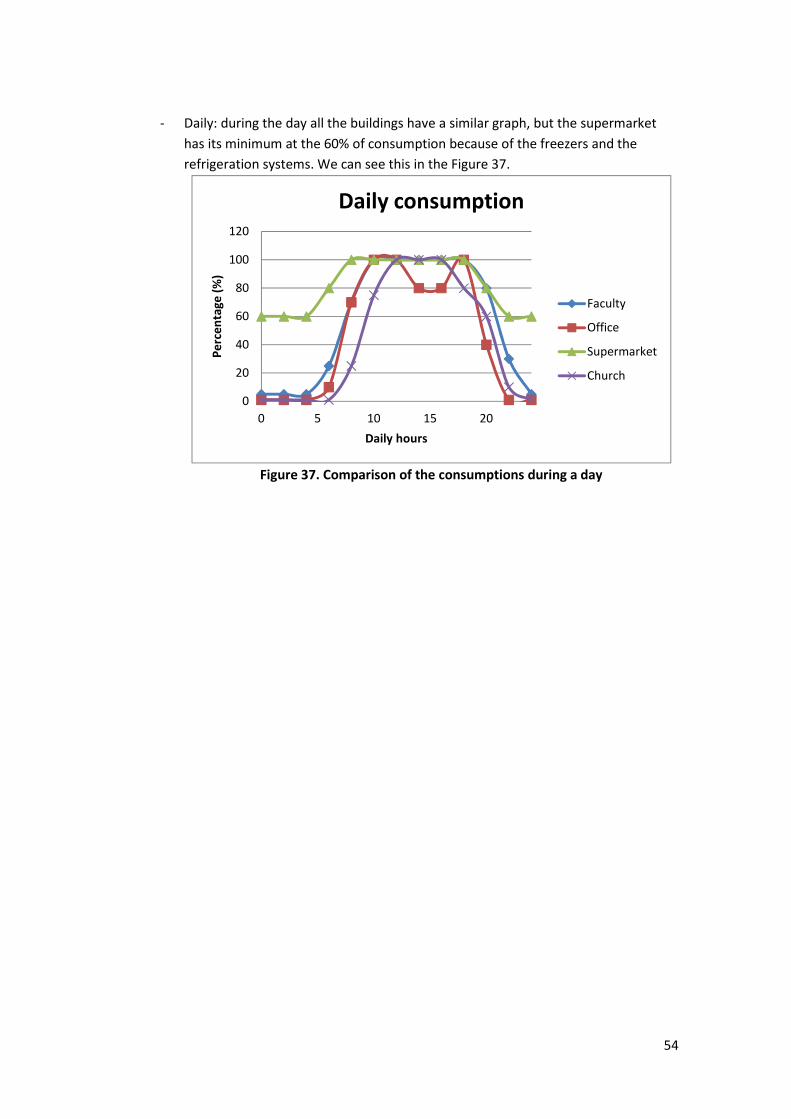
- Daily: during the day all the buildings have a similar graph, but the supermarket
has its minimum at the 60% of consumption because of the freezers and the
refrigeration systems. We can see this in the Figure 37.
Figure 37. Comparison of the consumptions during a day
0
20
40
60
80
100
120
0 5 10 15 20
Pe
rce
nta
ge
(%
)
Daily hours
Daily consumption
Faculty
Office
Supermarket
Church
55
7- REFERENCES
1- “Interactive book about solar energy and its applications”. Danny Andrés Arenas
Sánchez and Hodman Steven Zapata Castaño. University of Pereira, Faculty of
Technology. Electrical Technology Program. 2011
2- http://www.miliarium.com/Bibliografia/Monografias/Energia/EnergiasRenovables/Ene
rgiaSolarFotovoltaica.asp
3- Website http://re.jrc.ec.europa.eu/pvgis/
4- Website http://www.solar-tracking.es/
5- Website http://www.suntracking.es/en
6- Website http://www.isofoton.com/sites/default/files/250-black_es_.pdf
7- Website http://www.atersa.com/img/201328103610.pdf
8- Website http://www.isofoton.com/sites/default/files/isokit_web_.pdf
9- Website https://autosolar.es/baterias/bateria-48v/bateria-rolls-48v-460ah-
s460_precio
10- Notes of the subject “Renewable Energies”. University of Valladolid, Spain.