project number: power test report tracking code: 111667 ...suddendocs.samtec.com/testreports/111667_...
TRANSCRIPT

Project Number: Power Test Report Tracking Code: 111667_ Power Test Report_REV_1 .doc
Requested by: Neal Patterson Date: 10/21/2013 Product Rev: 0
Part #: PESS-08-12-L-12.00-DR-NUS-R / PET-08-01-L-VT PESS-08-10-L-12.00-DR-NUS-R / PET-08-01-L-VT
PESS-08-12-T-12.00-DR-NUS-R / PET-08-01-T-VT
PESS-08-10-T-12.00-DR-NUS-R / PET-08-01-T-VT
Lot #: N/A Tech: David Lieber Eng: Eric Ming
Part description: PESS\PET Qty to test: 30
Test Start: 11/20/2010 Test Completed: 12/30/2010
111667_ Power Test Report_REV_2 Page 1 of 37 10/21/2013
Power Test Report
PESS\PET PESS-08-12-L-12.00-DR-NUS-R / PET-08-01-L-VT
PESS-08-10-L-12.00-DR-NUS-R / PET-08-01-L-VT
PESS-08-12-T-12.00-DR-NUS-R / PET-08-01-T-VT
PESS-08-10-T-12.00-DR-NUS-R / PET-08-01-T-VT

POWER INTEGRITY TEST
REPORT
111667_ Power Test
Report_REV_1 .doc
INITIAL RELEASE
111667_ Power Test Report_REV_2 Page 2 of 37 10/21/2013
CERTIFICATION
All instruments and measuring equipment were calibrated to National Institute for Standards and Technology (NIST)
traceable standards according to IS0 10012-l and ANSI/NCSL 2540-1, as applicable.
All contents contained herein are the property of Samtec. No portion of this report, in part or in full shall be
reproduced without prior written approval of Samtec.
SCOPE 1. Temperature Rise/Current Carrying Capacity
1.1. To determine the amount of current the device under test (DUT) can safely carry over the operating
temperature range of the DUT.
1.2. Contact loading will also be addressed in this document which will determine how much current can be
carried as the number of energized contacts is varied.
2. Current Cycling
2.1. To determine the performance of the device under test (DUT) when subjected to the power-on/power-off
cycling that heats and cools the DUT in normal everyday use.
2.2. Contact loading will set to 100% throughout the test.
APPLICABLE DOCUMENTS
Standards: EIA Publication 364-70 Temperature Rise
EIA Publication 364-06 Contact Resistance
EIA Publication 364-55 Current Cycling
TLPM-032 Current Carrying Capacity
TLPM-084 Current Cycling
IEC 512-3 Electromechanical Components for Electronic Equipment: Basic Testing Procedures
and Measuring Methods, Part 3: Current Carrying Capacity Tests
TEST SAMPLES AND PREPARATION 1. All materials shall be manufactured in accordance with the applicable product specification.
2. All test samples shall be identified and encoded to maintain traceability throughout the test sequences.
3. After soldering, the parts to be used shall be cleaned according to TLWI-0001.
4. All samples shall be visually inspected and cleaned as necessary.
5. Any additional preparation shall be noted in the individual test sequences.
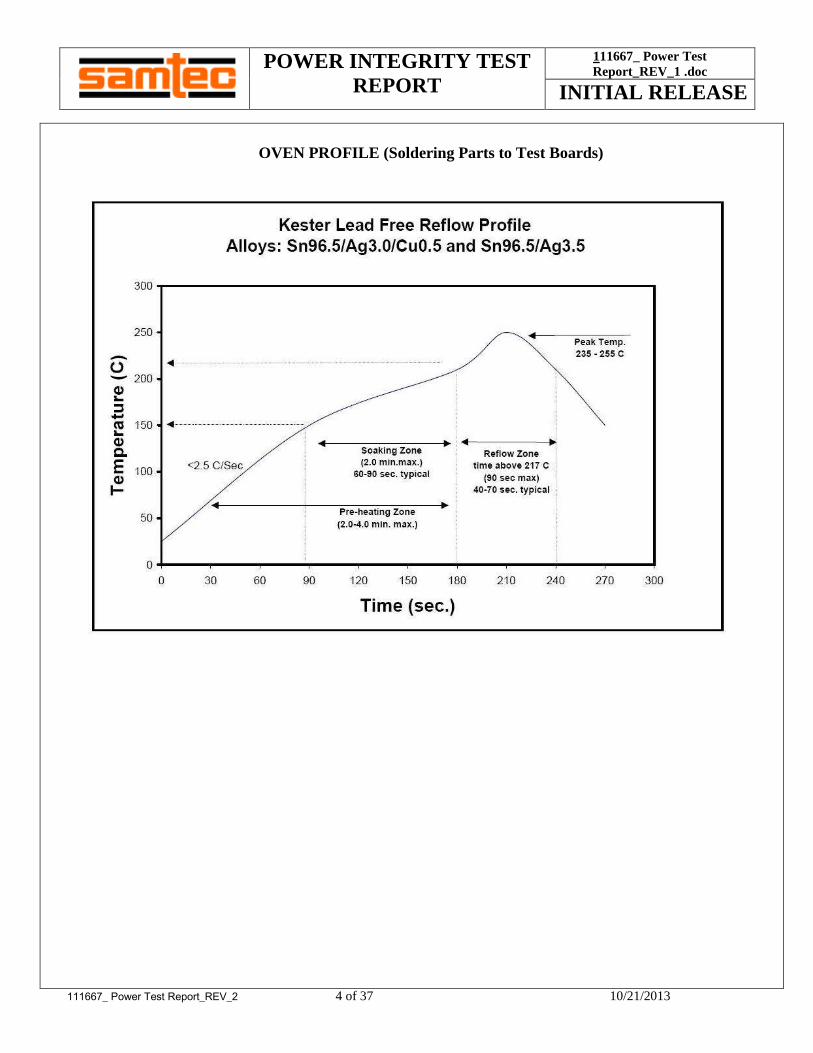
6. Solder Information: Lead Free
7. Re-Flow Time/Temp: See accompanying profile.
8. All products designed to operate mounted on a printed circuits board shall be tested mounted to test boards in
accordance with EIA-364-70.

POWER INTEGRITY TEST
REPORT
111667_ Power Test
Report_REV_1 .doc INITIAL RELEASE
111667_ Power Test Report_REV_2 3 of 37 10/21/2013
PREPARED TEST SAMPLE
9. The following loading configurations shall be tested for Temperature Rise/Current Carrying Capacity testing of
single row connector systems:
9.1. One contact energized only
9.2. Two contacts energized adjacent to each other
9.3. Three contacts energized adjacent to each other
9.4. Four contacts energized adjacent to each other
9.5. All contacts energized
Test Condition as in 9.1 above Indicates energized contacts
Indicates thermocouple monitored, energized contacts
10. For Current Cycling, only 100 % loading will be tested.
POWER INTEGRITY TEST
REPORT
111667_ Power Test
Report_REV_1 .doc INITIAL RELEASE
111667_ Power Test Report_REV_2 4 of 37 10/21/2013
OVEN PROFILE (Soldering Parts to Test Boards)

POWER INTEGRITY TEST
REPORT
111667_ Power Test
Report_REV_1 .doc INITIAL RELEASE
111667_ Power Test Report_REV_2 5 of 37 10/21/2013
FLOWCHARTS
Current Cycling
TEST GROUP A1
STEP 8 Mated Assemblies
01Current Cycle,
500 cycles
Current Cycle = EIA 364-55, Condition "B", Method #4
Test at Current Listed
Each cycle is 60 minutes
ON time is 45 minutes
OFF time is 15 minutes
Measure at 40 minutes into 45 minute ON time
ON current is 125% of the rated current
Current Carrying Capacity - Single Row
TEST GROUP A1 GROUP A2 GROUP A3
STEP 3 Mated Assemblies 3 Mated Assemblies 3 Mated Assemblies
1 Contact Powered 2 Contacts Powered 3 Contacts Powered
01 CCC CCC CCC
TEST GROUP A4 GROUP A5
STEP 3 Mated Assemblies 3 Mated Assemblies
4 Contacts Powered All Contacts Powered
01 CCC CCC
(TIN PLATING) - Tabulate calculated current at RT, 65°C, 75°C and 95°C
after derating 20% and based on 105°C
(GOLD PLATING) - Tabulate calculated current at RT, 85°C, 95°C and 115°C
after derating 20% and based on 125°C
CCC, Temp rise = EIA-364-70

POWER INTEGRITY TEST
REPORT
111667_ Power Test
Report_REV_1 .doc INITIAL RELEASE
111667_ Power Test Report_REV_2 6 of 37 10/21/2013
TEST PROCEDURES
TEMPERATURE RISE (Current Carrying Capacity, CCC):
11. Thermocouples shall be calibrated in accordance with Samtec documents; TLWI 0003, Thermocouple Welding
Procedure and TLWI 0005, Thermocouple Calibration
12. The thermocouples shall be placed at a location to sense the maximum temperature generated during testing.
13. Temperature stability shall be defined as the temperature at which three successive readings, 5 minutes apart,
differ not more than 1° C (computer controlled data acquisition). This is the Temperature Rise that the Current
Carrying Capacity and De-rating curves are based on.
14. The following loading configurations shall be tested (double for two row systems):
14.1. One contact energized only
14.2. Two contacts energized adjacent to each other
14.3. Three contacts energized adjacent to each other
14.4. Four contacts energized adjacent to each other
14.5. All contacts energized
15. The following loading configurations shall be tested for Temperature Rise/Current Carrying Capacity testing of
two row connector systems:
15.1. Two by One contact energized
15.2. Two by Two contacts energized adjacent to each other
15.3. Two by Three contacts energized adjacent to each other
15.4. Two by Four contacts energized adjacent to each other
15.5. All contacts energized
16. Three samples shall be tested for each of the above configurations for a total of eighteen assemblies.
17. Temperature Rise measurements shall be made at 5 different current levels yielding temperature rises in the 10 to
70C range.
18. The base curve for the Current Rating chart will be derived from the average (maximum) value of three test
specimens in accordance with IEC 512-3, Test 5b.
CURRENT CYCLING
1. Samples shall be prepared and tested as above (paragraph 14.5).
2. Current Cycling shall be performed in accordance with EIA-364-55, Test Condition
3. Testing shall be as follows:
3.1. Test Current: TEST CURRENT(125% of 30C Rating)
3.2. “ON” Time: 45 Minutes
3.3. “OFF” Time: 15 Minutes
3.4. Number of Cycles: 500
3.5. Measurements: 40 minutes into ON cycle
3.5.1. Temperature
3.5.2. Voltage Drop/Contact Resistance
4. Temperature vs. Number of Cycles and Voltage Drop vs. Number of Cycles shall be measured and recorded.

POWER INTEGRITY TEST
REPORT
111667_ Power Test
Report_REV_1 .doc INITIAL RELEASE
111667_ Power Test Report_REV_2 7 of 37 10/21/2013
TEST RESULTS Test Request #111667 (CCC and Current Cycling)
PESS-08-12-L-12.00-DR-NUS-R / PET-08-01-L-VT
CURRENT CARRYING CAPACITY (CCC) RESULTS
Temperature Rise, CCC at a 20% de-rating
CCC for a 30°C Temperature Rise ----------------------- 29.7 A per contact with 1 contacts (1 x 1) powered
CCC for a 30°C Temperature Rise ----------------------- 25.7A per contact with 2 contacts (1 x 2) powered
CCC for a 30°C Temperature Rise ----------------------- 22.2 A per contact with 3 contacts (1 x 3) powered
CCC for a 30°C Temperature Rise ----------------------- 21.6 A per contact with 4 contacts (1 x 4) powered
CCC for a 30°C Temperature Rise ----------------------- 19.7 A per contact with All contacts (Cable) powered
CCC for a 30°C Temperature Rise ----------------------- 19.7A per contact with All contacts (Mate area) powered
CURRENT CYCLING RESULTS Test Condition: 500 Cycles, 45 minutes ON and 15 minutes OFF
Test Current ----------------------------------------------- 24.6 Amps
Contact Resistances, Measured 40 minutes into the FIRST and LAST ON cycle
o Initial
Min --------------------------------------- 1.99 mOhms
Max --------------------------------------- 2.17 mOhms
o Final
Min --------------------------------------- 2.24 mOhms
Max --------------------------------------- 2.41 mOhms
Temperature Change, Measured 40 minutes into the FIRST and LAST ON cycle
o Initial Temperature Change ------------------ 32.41°C
o Final Temperature Change ------------------- 32.95°C
Test Request #112528 (CCC and Current Cycling)
PESS-08-10-L-12.00-DR-NUS-R / PET-08-01-L-VT
CURRENT CARRYING CAPACITY (CCC) RESULTS
Temperature Rise, CCC at a 20% de-rating
CCC for a 30°C Temperature Rise ----------------------- 34.5 A per contact with 1 contacts (1 x 1) powered
CCC for a 30°C Temperature Rise ----------------------- 28.9 A per contact with 2 contacts (1 x 2) powered
CCC for a 30°C Temperature Rise ----------------------- 26.3 A per contact with 3 contacts (1 x 3) powered
CCC for a 30°C Temperature Rise ----------------------- 24.3 A per contact with 4 contacts (1 x 4) powered
CCC for a 30°C Temperature Rise ----------------------- 23.6 A per contact with All contacts (Cable) powered
CCC for a 30°C Temperature Rise ----------------------- 22.6A per contact with All contacts (Mate area) powered
CURRENT CYCLING RESULTS Test Condition: 500 Cycles, 45 minutes ON and 15 minutes OFF
Test Current ----------------------------------------------- 28.2 Amps
Contact Resistances, Measured 40 minutes into the FIRST and LAST ON cycle
o Initial
Min --------------------------------------- 0.71 mOhms
Max --------------------------------------- 0.83 mOhms
o Final
Min --------------------------------------- 0.88 mOhms
Max --------------------------------------- 1.02 mOhms
Temperature Change, Measured 40 minutes into the FIRST and LAST ON cycle
o Initial Temperature Change ------------------ 30.1 °C
o Final Temperature Change ------------------- 30.2 °C

POWER INTEGRITY TEST
REPORT
111667_ Power Test
Report_REV_1 .doc INITIAL RELEASE
111667_ Power Test Report_REV_2 8 of 37 10/21/2013
TEST RESULTS Continued
Test Request #112526 (Current Cycling Only)
PESS-08-12-T-12.00-DR-NUS-R / PET-08-01-T-VT
CURRENT CYCLING RESULTS
Test Condition: 500 Cycles, 45 minutes ON and 15 minutes OFF
Test Current ----------------------------------------------- 24.6 Amps
Contact Resistances, Measured 40 minutes into the FIRST and LAST ON cycle
o Initial
Min --------------------------------------- 1.35 mOhms
Max --------------------------------------- 1.52 mOhms
o Final
Min --------------------------------------- 1.36 mOhms
Max --------------------------------------- 1.54 mOhms
Temperature Change, Measured 40 minutes into the FIRST and LAST ON cycle
o Initial Temperature Change ------------------ 23.22 °C
o Final Temperature Change ------------------- 23.75 °C
Test Request #112529 (Current Cycling Only)
PESS-08-10-T-12.00-DR-NUS-R / PET-08-01-T-VT
CURRENT CYCLING RESULTS
Test Condition: 500 Cycles, 45 minutes ON and 15 minutes OFF
Test Current ----------------------------------------------- 28.2 Amps
Contact Resistances, Measured 40 minutes into the FIRST and LAST ON cycle
o Initial
Min --------------------------------------- 1.4 mOhms
Max --------------------------------------- 1.6 mOhms
o Final
Min --------------------------------------- 1.41 mOhms
Max --------------------------------------- 1.64 mOhms
Temperature Change, Measured 40 minutes into the FIRST and LAST ON cycle
o Initial Temperature Change ------------------ 29.06 °C
o Final Temperature Change ------------------- 29.39 °C

POWER INTEGRITY TEST
REPORT
111667_ Power Test
Report_REV_1 .doc INITIAL RELEASE
111667_ Power Test Report_REV_2 9 of 37 10/21/2013
TEST DATA
Test Request #111667 (CCC and Current Cycling)
PESS-08-12-L-12.00-DR-NUS-R / PET-08-01-L-VT
CONTACT RESISTANCE @ RATED CURRENT - DC Resistance (DCR)
The following data represents the Voltage drop and Contact Resistance at Rated Current for the 100% energized
samples:
Contact Resistance @ Rated Current
(milli-Ohms)
1
1.5
2
2.5
3
3.5
4
4.5
5
13 14 15 16 17 18 19 20 21 22 23 24 25 26 27 28 29 30
Current (Amps)
Resis
tan
ce (
mO
hm
s)
Max
CONTACT RESISTANCE DATA ALL CONTACTS ENERGIZED
(m)
TEST CURRENT AMPS 13.21 18.68 22.92 26.46 29.58
Min 1.99 2.06 2.12 2.18 2.24
Max 2.17 2.24 2.3 2.36 2.41
Avg 2.05 2.11 2.17 2.23 2.29
POWER INTEGRITY TEST
REPORT
111667_ Power Test
Report_REV_1 .doc INITIAL RELEASE
111667_ Power Test Report_REV_2 10 of 37 10/21/2013
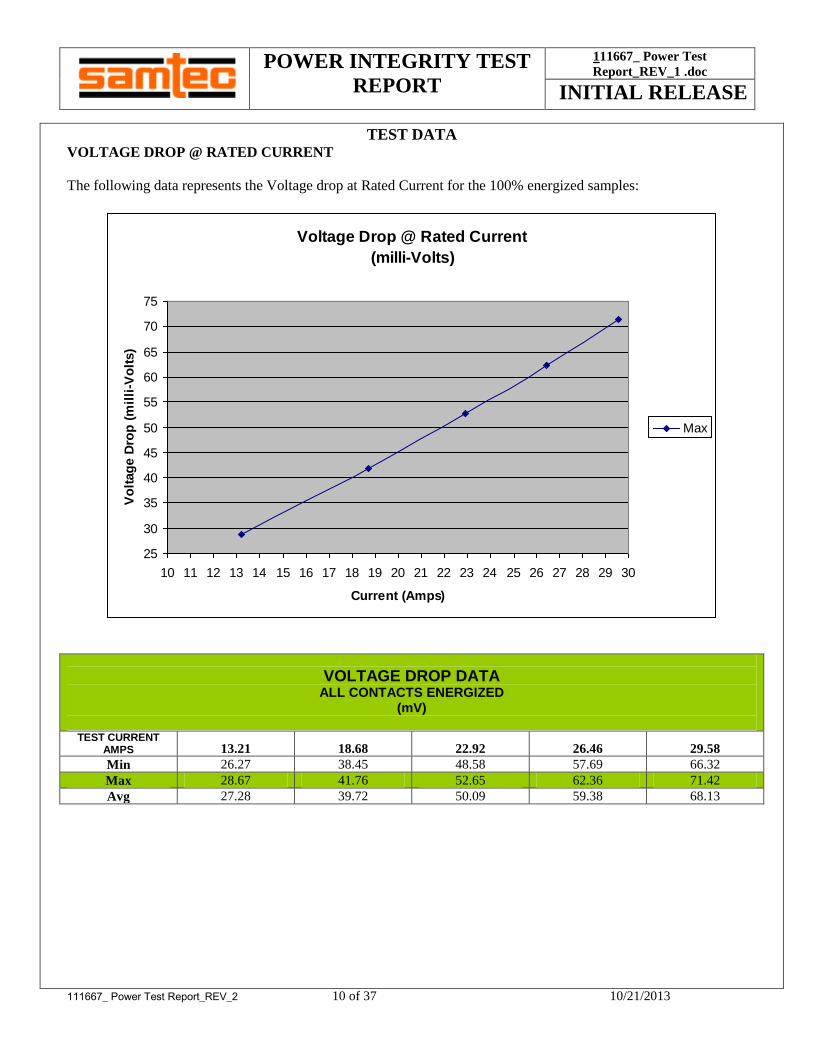
TEST DATA
VOLTAGE DROP @ RATED CURRENT
The following data represents the Voltage drop at Rated Current for the 100% energized samples:
Voltage Drop @ Rated Current
(milli-Volts)
25
30
35
40
45
50
55
60
65
70
75
10 11 12 13 14 15 16 17 18 19 20 21 22 23 24 25 26 27 28 29 30
Current (Amps)
Vo
ltag
e D
rop
(m
illi
-Vo
lts)
Max
VOLTAGE DROP DATA ALL CONTACTS ENERGIZED
(mV)
TEST CURRENT AMPS 13.21 18.68 22.92 26.46 29.58
Min 26.27 38.45 48.58 57.69 66.32
Max 28.67 41.76 52.65 62.36 71.42
Avg 27.28 39.72 50.09 59.38 68.13

POWER INTEGRITY TEST
REPORT
111667_ Power Test
Report_REV_1 .doc INITIAL RELEASE
111667_ Power Test Report_REV_2 11 of 37 10/21/2013
TEST DATA
CURRENT CARRYING CAPACITY DATA
111667
1 (1x1) Contacts Series
Part Numbers:PESS-08-12-L-12.00-DR-NUS-R/PET-08-01-L-VT
61.561.5
49.249.2
42.942.9
34.334.337.137.1
29.729.7
21.321.3
17.017.0
0.0
10.0
20.0
30.0
40.0
50.0
60.0
70.0
20 30 40 50 60 70 80 90 100 110
Ambient Temperature, ° C
Maxim
um
Cu
rren
t, A
mp
per
Co
nta
ct
Base Curve
Derated 20 %
RT Peak Amp
RT Derated Amp
Measured Current
65 ° C
65 ° C Peak Amp
65 ° C Derated Amp
75 ° C
75 ° C Peak Amp
75 ° C Derated Amp
Limit
95 ° C Peak Amp
95 ° C Derated Amp
95 ° C
Room Temp
105° C
Limit
Useful Range
Room Temp=
Current Rating per Contact (30 Deg. Rise, 20% Derated) = 29.7
TEMPERATURE RISE DATA TWO CONTACT ENERGIZED
(Degrees Celsius above ambient)
TEST CURRENT AMPS 22.25 31.47 38.56 44.5 49.77
Sample 1 10.7 20.4 30.2 40.2 50.4
Sample 2 11.3 22 33.1 44.1 55.2
Sample 3 11.4 22.2 33.3 44.4 55.8
Min 10.7 20.4 30.2 40.2 50.4
Max 11.4 22.2 33.3 44.4 55.8
Avg 11.13 21.53 32.2 42.9 53.8
Indicates energized contacts
Indicates thermocouple monitored, energized contacts
Part Number xx-yyy-zzzz
One Contact Energized
Single Row
Configuration

POWER INTEGRITY TEST
REPORT
111667_ Power Test
Report_REV_1 .doc INITIAL RELEASE
111667_ Power Test Report_REV_2 12 of 37 10/21/2013
111667
2 (1x2) Contacts Series
Part Numbers:PESS-08-12-L-12.00-DR-NUS-R/PET-08-01-L-VT
53.653.6
42.942.9
37.237.2
29.729.732.132.1
25.725.7
18.418.4
14.714.7
0.0
10.0
20.0
30.0
40.0
50.0
60.0
70.0
20 30 40 50 60 70 80 90 100 110
Ambient Temperature, ° C
Maxim
um
Cu
rren
t, A
mp
per
Co
nta
ct
Base Curve
Derated 20 %
RT Peak Amp
RT Derated Amp
Measured Current
65 ° C
65 ° C Peak Amp
65 ° C Derated Amp
75 ° C
75 ° C Peak Amp
75 ° C Derated Amp
Limit
95 ° C Peak Amp
95 ° C Derated Amp
95 ° C
Room Temp
105° C
Limit
Useful Range
Room Temp=
Current Rating per Contact (30 Deg. Rise, 20% Derated) = 28.9
TEMPERATURE RISE DATA FOUR CONTACTS ENERGIZED
(Degrees Celsius above ambient)
TEST CURRENT AMPS 32.6 42.4 52.3 62.1 72
Sample 4 9.4 18.2 26.8 35.4 44.2
Sample 5 10.4 20.6 30.7 40.9 51
Sample 6 10 19.6 29.1 38.6 47.9
Min 9.4 18.2 26.8 35.4 44.2
Max 10.4 20.6 30.7 40.9 51
Avg 9.93 19.47 28.87 38.3 47.7
Indicates energized contacts
Indicates thermocouple monitored, energized contacts
Single Row
Configuration

POWER INTEGRITY TEST
REPORT
111667_ Power Test
Report_REV_1 .doc INITIAL RELEASE
111667_ Power Test Report_REV_2 13 of 37 10/21/2013
111667
3 (1x3) Contacts Series
Part Numbers:PESS-08-12-L-12.00-DR-NUS-R/PET-08-01-L-VT
46.346.3
37.137.1
32.232.2
25.825.827.827.8
22.222.2
15.615.6
12.512.5
0.0
10.0
20.0
30.0
40.0
50.0
20 30 40 50 60 70 80 90 100 110
Ambient Temperature, ° C
Ma
xim
um
Cu
rre
nt,
Am
p p
er
Co
nta
ct
Base Curve
Derated 20 %
RT Peak Amp
RT Derated Amp
Measured Current
65 ° C
65 ° C Peak Amp
65 ° C Derated Amp
75 ° C
75 ° C Peak Amp
75 ° C Derated Amp
Limit
95 ° C Peak Amp
95 ° C Derated Amp
95 ° C
Room Temp105° C
Limit
Useful Range
Room Temp= 24.0 C
Current Rating per Contact (30 Deg. Rise, 20% Derated) = 22.2 Amps
TEMPERATURE RISE DATA SIX CONTACTS ENERGIZED
(Degrees Celsius above ambient)
TEST CURRENT AMPS 34.3 43.6 53 62.9 72.2
Sample 7 9.9 18.4 26.7 36.8 44.8
Sample 8 10.9 20.9 31.1 40.8 50.4
Sample 9 10.2 19.6 29 38.3 47.4
Min 9.9 18.4 26.7 36.8 44.8
Max 10.9 20.9 31.1 40.8 50.4
Avg 10.33 19.63 28.93 38.63 47.53
Indicates energized contacts
Indicates thermocouple monitored, energized contacts
Single Row
Configuration

POWER INTEGRITY TEST
REPORT
111667_ Power Test
Report_REV_1 .doc INITIAL RELEASE
111667_ Power Test Report_REV_2 14 of 37 10/21/2013
111667
4 (1x4) Contacts Series
Part Numbers:PESS-08-12-L-12.00-DR-NUS-R/PET-08-01-L-VT
44.944.9
35.935.9
31.331.3
25.025.0
27.027.0
21.621.6
15.315.3
12.312.3
0.0
5.0
10.0
15.0
20.0
25.0
30.0
35.0
40.0
45.0
50.0
20 30 40 50 60 70 80 90 100 110
Ambient Temperature, ° C
Ma
xim
um
Cu
rre
nt,
Am
p p
er
Co
nta
ct
Base Curve
Derated 20 %
RT Peak Amp
RT Derated Amp
Measured Current
65 ° C
65 ° C Peak Amp
65 ° C Derated Amp
75 ° C
75 ° C Peak Amp
75 ° C Derated Amp
Limit
95 ° C Peak Amp
95 ° C Derated Amp
95 ° C
Room Temp
105° C
Limit
Useful Range
Room Temp= 23.9 C
Current Rating per Contact (30 Deg. Rise, 20% Derated) = 21.6 Amps
TEMPERATURE RISE DATA ALL CONTACTS ENERGIZED
(Degrees Celsius above ambient)
TEST CURRENT AMPS 32.5 40.6 48.7 56.8 65
Sample 13 8.6 16.5 24.2 32.1 40.1
Sample 14 8.8 17 25.1 33.2 41.2
Sample 15 8.5 16.5 24.4 32.3 40.3
Min 8.5 16.5 24.2 32.1 40.1
Max 8.8 17 25.1 33.2 41.2
Avg 8.63 16.67 24.57 32.53 40.53
Indicates energized contacts
Indicates thermocouple monitored, energized contacts
Single Row
Configuration

POWER INTEGRITY TEST
REPORT
111667_ Power Test
Report_REV_1 .doc INITIAL RELEASE
111667_ Power Test Report_REV_2 15 of 37 10/21/2013
111667
8 (All Power) Contacts Series (Cable)
Part Numbers:PESS-08-12-L-12.00-DR-NUS-R/PET-08-01-L-VT
41.741.7
33.433.4
28.728.7
22.922.924.624.6
19.719.7
13.713.7
10.910.9
0.0
5.0
10.0
15.0
20.0
25.0
30.0
35.0
40.0
45.0
20 30 40 50 60 70 80 90 100 110
Ambient Temperature, ° C
Ma
xim
um
Cu
rre
nt,
Am
p p
er
Co
nta
ct
Base Curve
Derated 20 %
RT Peak Amp
RT Derated Amp
Measured Current
65 ° C
65 ° C Peak Amp
65 ° C Derated Amp
75 ° C
75 ° C Peak Amp
75 ° C Derated Amp
Limit
95 ° C Peak Amp
95 ° C Derated Amp
95 ° C
Room Temp105° C
Limit
Useful Range
Room Temp= 22.9 C
Current Rating per Contact (30 Deg. Rise, 20% Derated) = 19.7 Amps
TEMPERATURE RISE DATA ALL CONTACTS ENERGIZED
(Degrees Celsius above ambient)
TEST CURRENT AMPS 32.4 41.4 49.9 58.4 66.7
Sample 13 9.7 18.7 27 35.2 43.4
Sample 14 9.6 18.4 26.5 34.8 42.7
Sample 15 9.3 17.7 25.8 33.5 40.7
Min 9.3 17.7 25.8 33.5 40.7
Max 9.7 18.7 27 35.2 43.4
Avg 9.53 18.27 26.43 34.5 42.27
Indicates energized contacts
Indicates thermocouple monitored, energized contacts
Single Row
Configuration

POWER INTEGRITY TEST
REPORT
111667_ Power Test
Report_REV_1 .doc INITIAL RELEASE
111667_ Power Test Report_REV_2 16 of 37 10/21/2013
TEMPERATURE RISE DATA ALL CONTACTS ENERGIZED
(Degrees Celsius above ambient)
TEST CURRENT AMPS 32.2 41.1 50 50 67.3
Sample 13 9.2 18.1 26.6 34.8 43.1
Sample 14 9.1 17.6 25.8 33.9 42
Sample 15 9.5 18.3 27 35.3 43.5
Min 9.1 17.6 25.8 33.9 42
Max 9.5 18.3 27 35.3 43.5
Avg 9.27 18 26.47 34.67 42.87
Indicates energized contacts
Indicates thermocouple monitored, energized contacts
111667
8 (All Power) Contacts Series (Mate Area)
Part Numbers:PESS-08-12-L-12.00-DR-NUS-R/PET-08-01-L-VT
41.341.3
33.033.0
28.528.5
22.822.824.624.6
19.719.7
13.813.8
11.111.1
0.0
5.0
10.0
15.0
20.0
25.0
30.0
35.0
40.0
45.0
20 30 40 50 60 70 80 90 100 110
Ambient Temperature, ° C
Ma
xim
um
Cu
rren
t, A
mp
pe
r C
on
tact
Base Curve
Derated 20 %
RT Peak Amp
RT Derated Amp
Measured Current
65 ° C
65 ° C Peak Amp
65 ° C Derated Amp
75 ° C
75 ° C Peak Amp
75 ° C Derated Amp
Limit
95 ° C Peak Amp
95 ° C Derated Amp
95 ° C
Room Temp
105° C
Limit
Useful Range
Room Temp=
Current Rating per Contact (30 Deg. Rise, 20% Derated) = 19.7
Single Row
Configuration

POWER INTEGRITY TEST
REPORT
111667_ Power Test
Report_REV_1 .doc INITIAL RELEASE
111667_ Power Test Report_REV_2 17 of 37 10/21/2013
TEST DATA
CURRENT CYCLING DATA:
CURRENT CYCLING VS. TEMPERATURE RISE
20
22
24
26
28
30
32
34
36
38
40
42
44
0 100 200 300 400 500
NUMBER OF CURRENT CYCLES
TE
MP
ER
AT
UR
E R
ISE
(D
eg
rees C
ab
ove A
mb
ien
t)
Max Rise
TEMPERATURE RISE DATA ALL CONTACTS ENERGIZED
(Degrees Celsius above ambient)
INITIAL 50 CYCLES 100 CYCLES 200 CYCLES 500 CYCLES
Min 30.4 30.6 30.6 30.6 30.4
Max 34.9 35.5 35.6 35.6 35.6
Avg 32.4 32.8 32.9 32.9 33

POWER INTEGRITY TEST
REPORT
111667_ Power Test
Report_REV_1 .doc INITIAL RELEASE
111667_ Power Test Report_REV_2 18 of 37 10/21/2013
CURRENT CYCLING VS. CONTACT RESISTANCE
2
2.25
2.5
2.75
3
0 100 200 300 400 500
NUMBER OF CURRENT CYCLES
CO
NT
AC
T R
ES
IST
AN
CE
@ R
AT
ED
CU
RR
EN
T (
mil
li-O
hm
s)
Max Res
CONTACT RESISTANCE DATA ALL CONTACTS ENERGIZED
(m)
INITIAL 50 CYCLES 100 CYCLES 200 CYCLES 500 CYCLES
Min 2.13 2.15 2.14 2.15 2.15
Max 2.33 2.36 2.35 2.36 2.36
Avg 2.22 2.24 2.23 2.24 2.24
POWER INTEGRITY TEST
REPORT
111667_ Power Test
Report_REV_1 .doc INITIAL RELEASE
111667_ Power Test Report_REV_2 19 of 37 10/21/2013
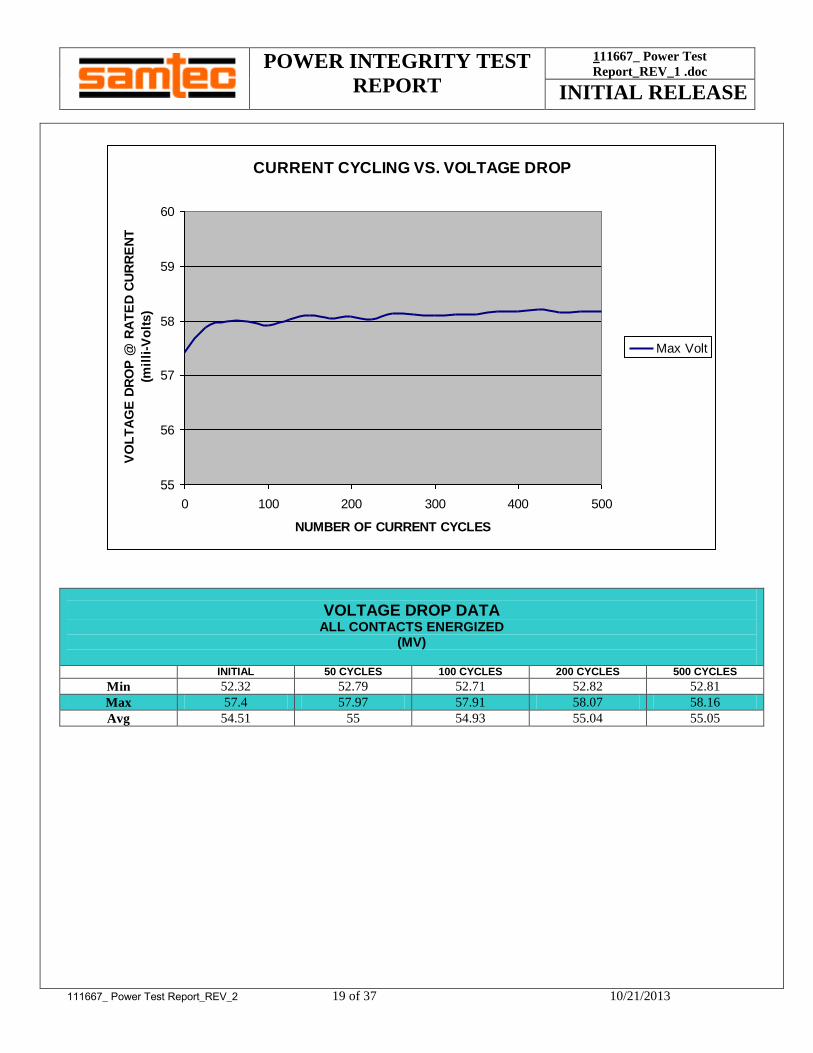
CURRENT CYCLING VS. VOLTAGE DROP
55
56
57
58
59
60
0 100 200 300 400 500
NUMBER OF CURRENT CYCLES
VO
LT
AG
E D
RO
P @
RA
TE
D C
UR
RE
NT
(mil
li-V
olt
s)
Max Volt
VOLTAGE DROP DATA ALL CONTACTS ENERGIZED
(MV)
INITIAL 50 CYCLES 100 CYCLES 200 CYCLES 500 CYCLES
Min 52.32 52.79 52.71 52.82 52.81
Max 57.4 57.97 57.91 58.07 58.16
Avg 54.51 55 54.93 55.04 55.05

POWER INTEGRITY TEST
REPORT
111667_ Power Test
Report_REV_1 .doc INITIAL RELEASE
111667_ Power Test Report_REV_2 20 of 37 10/21/2013
TEST DATA
Test Request #112528 (CCC and Current Cycling)
PESS-08-10- L-12.00-DR-NUS-R / PET-08-01-L-VT
CONTACT RESISTANCE @ RATED CURRENT - DC Resistance (DCR)
The following data represents the Voltage drop and Contact Resistance at Rated Current for the 100% energized
samples:
Contact Resistance @ Rated Current
(milli-Ohms)
0
0.5
1
1.5
2
30 34 38 42 46 50 54 58 62 66 70
Current (Amps)
Resis
tan
ce (
mO
hm
s)
Max
CONTACT RESISTANCE DATA ALL CONTACTS ENERGIZED
(m)
TEST CURRENT AMPS 32.4 41.4 49.9 58.4 66.7
Min 0.71 0.82 0.86 0.87 0.88
Max 0.83 0.95 1 1.01 1.02
Avg 0.76 0.87 0.92 0.93 0.94

POWER INTEGRITY TEST
REPORT
111667_ Power Test
Report_REV_1 .doc INITIAL RELEASE
111667_ Power Test Report_REV_2 21 of 37 10/21/2013
TEST DATA
VOLTAGE DROP @ RATED CURRENT
The following data represents the Voltage drop at Rated Current for the 100% energized samples:
Voltage Drop @ Rated Current
(milli-Volts)
25
30
35
40
45
50
55
60
65
70
75
30 34 38 42 46 50 54 58 62 66 70
Current (Amps)
Vo
ltag
e D
rop
(m
illi
-Vo
lts)
Max
VOLTAGE DROP DATA ALL CONTACTS ENERGIZED
(mV)
TEST CURRENT AMPS 32.4 41.4 49.9 58.4 66.7
Min 23.09 33.78 42.71 50.83 58.61
Max 26.97 39.44 49.72 59.22 68.09
Avg 25.03 36.57 46.23 55.09 63.43

POWER INTEGRITY TEST
REPORT
111667_ Power Test
Report_REV_1 .doc INITIAL RELEASE
111667_ Power Test Report_REV_2 22 of 37 10/21/2013
TEST DATA
CURRENT CARRYING CAPACITY DATA
112528
1 (1x1) Contacts Series
Part Numbers:PESS-08-10-L-12.00-DR-NUS-R/PET-08-01-L-VT
71.671.6
57.357.3
49.749.7
39.839.8
43.143.1
34.534.5
25.125.1
20.020.0
0.0
10.0
20.0
30.0
40.0
50.0
60.0
70.0
80.0
20 30 40 50 60 70 80 90 100 110
Ambient Temperature, ° C
Ma
xim
um
Cu
rre
nt,
Am
p p
er
Co
nta
ct
Base Curve
Derated 20 %
RT Peak Amp
RT Derated Amp
Measured Current
65 ° C
65 ° C Peak Amp
65 ° C Derated Amp
75 ° C
75 ° C Peak Amp
75 ° C Derated Amp
Limit
95 ° C Peak Amp
95 ° C Derated Amp
95 ° C
Room Temp105 C
Limit
Useful Range
Room Temp= 22.0 C
Current Rating per Contact (30 Deg. Rise, 20% Derated) = 34.5 Amps
TEMPERATURE RISE DATA TWO CONTACT ENERGIZED
(Degrees Celsius above ambient)
TEST CURRENT AMPS 31.6 41.5 52.7 62.5 72.6
Sample 1 9.2 17.8 29.4 38.6 48
Sample 2 9.8 19.2 29 38 47.3
Sample 3 9.9 19.6 29.4 38.9 48.9
Min 9.2 17.8 29 38 47.3
Max 9.9 19.6 29.4 38.9 48.9
Avg 9.63 18.87 29.27 38.5 48.07
Indicates energized contacts
Indicates thermocouple monitored, energized contacts
Part Number xx-yyy-zzzz
One Contact Energized
Single Row
Configuration

POWER INTEGRITY TEST
REPORT
111667_ Power Test
Report_REV_1 .doc INITIAL RELEASE
111667_ Power Test Report_REV_2 23 of 37 10/21/2013
112528
2 (1x2) Contacts Series
Part Numbers:PESS-08-10-L-12.00-DR-NUS-R/PET-08-01-L-VT
60.060.0
48.048.0
41.841.8
33.533.536.136.1
28.928.9
20.620.6
16.516.5
0.0
10.0
20.0
30.0
40.0
50.0
60.0
70.0
20 30 40 50 60 70 80 90 100 110
Ambient Temperature, ° C
Maxim
um
Cu
rren
t, A
mp
per
Co
nta
ct
Base Curve
Derated 20 %
RT Peak Amp
RT Derated Amp
Measured Current
65 ° C
65 ° C Peak Amp
65 ° C Derated Amp
75 ° C
75 ° C Peak Amp
75 ° C Derated Amp
Limit
95 ° C Peak Amp
95 ° C Derated Amp
95 ° C
Room Temp
105 C
Limit
Useful Range
Room Temp=
Current Rating per Contact (30 Deg. Rise, 20% Derated) = 28.9
TEMPERATURE RISE DATA FOUR CONTACTS ENERGIZED
(Degrees Celsius above ambient)
TEST CURRENT AMPS 33.2 42.3 51.4 60.8 70.2
Sample 4 9.6 18.6 27.7 36.9 46.2
Sample 5 9.4 18.4 27.1 36.2 44.8
Sample 6 9.5 18.5 27.2 36.1 44.9
Min 9.4 18.4 27.1 36.1 44.8
Max 9.6 18.6 27.7 36.9 46.2
Avg 9.5 18.5 27.33 36.4 45.3
Indicates energized contacts
Indicates thermocouple monitored, energized contacts
Single Row
Configuration

POWER INTEGRITY TEST
REPORT
111667_ Power Test
Report_REV_1 .doc INITIAL RELEASE
111667_ Power Test Report_REV_2 24 of 37 10/21/2013
TEMPERATURE RISE DATA SIX CONTACTS ENERGIZED
(Degrees Celsius above ambient)
TEST CURRENT AMPS 34.2 42.6 51.4 60.6 69.5
Sample 7 9.9 18.9 27.8 37.3 46.4
Sample 8 9.9 18.4 27 35.7 44.3
Sample 9 11.2 18.4 27 35.5 44
Min 9.9 18.4 27 35.5 44
Max 11.2 18.9 27.8 37.3 46.4
Avg 10.33 18.57 27.27 36.17 44.9
Indicates energized contacts
Indicates thermocouple monitored, energized contacts
112528
3 (1x3) Contacts Series
Part Numbers:PESS-08-10-L-12.00-DR-NUS-R/PET-08-01-L-VT
55.855.8
44.644.6
38.438.4
30.730.732.932.9
26.326.3
18.018.0
14.414.4
0.0
10.0
20.0
30.0
40.0
50.0
60.0
20 30 40 50 60 70 80 90 100 110
Ambient Temperature, ° C
Ma
xim
um
Cu
rre
nt,
Am
p p
er
Co
nta
ct
Base Curve
Derated 20 %
RT Peak Amp
RT Derated Amp
Measured Current
65 ° C
65 ° C Peak Amp
65 ° C Derated Amp
75 ° C
75 ° C Peak Amp
75 ° C Derated Amp
Limit
95 ° C Peak Amp
95 ° C Derated Amp
95 ° C
Room Temp105 C
Limit
Useful Range
Room Temp= 23.9 C
Current Rating per Contact (30 Deg. Rise, 20% Derated) = 26.3 Amps
Single Row
Configuration

POWER INTEGRITY TEST
REPORT
111667_ Power Test
Report_REV_1 .doc INITIAL RELEASE
111667_ Power Test Report_REV_2 25 of 37 10/21/2013
TEMPERATURE RISE DATA EIGHT CONTACTS ENERGIZED
(Degrees Celsius above ambient)
TEST CURRENT AMPS 33.4 43 52.7 62.3 71.8
Sample 10 10.4 19.9 29.6 39.2 48.7
Sample 11 10.5 20 29.6 39.2 48.6
Sample 12 10.2 19.2 27.8 36.1 44
Min 10.2 19.2 27.8 36.1 44
Max 10.5 20 29.6 39.2 48.7
Avg 10.37 19.7 29 38.17 47.1
Indicates energized contacts
Indicates thermocouple monitored, energized contacts
112528
4 (1x4) Contacts Series
Part Numbers:PESS-08-10-L-12.00-DR-NUS-R/PET-08-01-L-VT
51.451.4
41.141.1
35.435.4
28.328.330.430.4
24.324.3
17.017.0
13.613.6
0.0
10.0
20.0
30.0
40.0
50.0
60.0
20 30 40 50 60 70 80 90 100 110
Ambient Temperature, ° C
Ma
xim
um
Cu
rre
nt,
Am
p p
er
Co
nta
ct
Base Curve
Derated 20 %
RT Peak Amp
RT Derated Amp
Measured Current
65 ° C
65 ° C Peak Amp
65 ° C Derated Amp
75 ° C
75 ° C Peak Amp
75 ° C Derated Amp
Limit
95 ° C Peak Amp
95 ° C Derated Amp
95 ° C
Room Temp105° C
Limit
Useful Range
Room Temp= 23.0 C
Current Rating per Contact (30 Deg. Rise, 20% Derated) = 24.3 Amps
Single Row
Configuration
POWER INTEGRITY TEST
REPORT
111667_ Power Test
Report_REV_1 .doc INITIAL RELEASE
111667_ Power Test Report_REV_2 26 of 37 10/21/2013
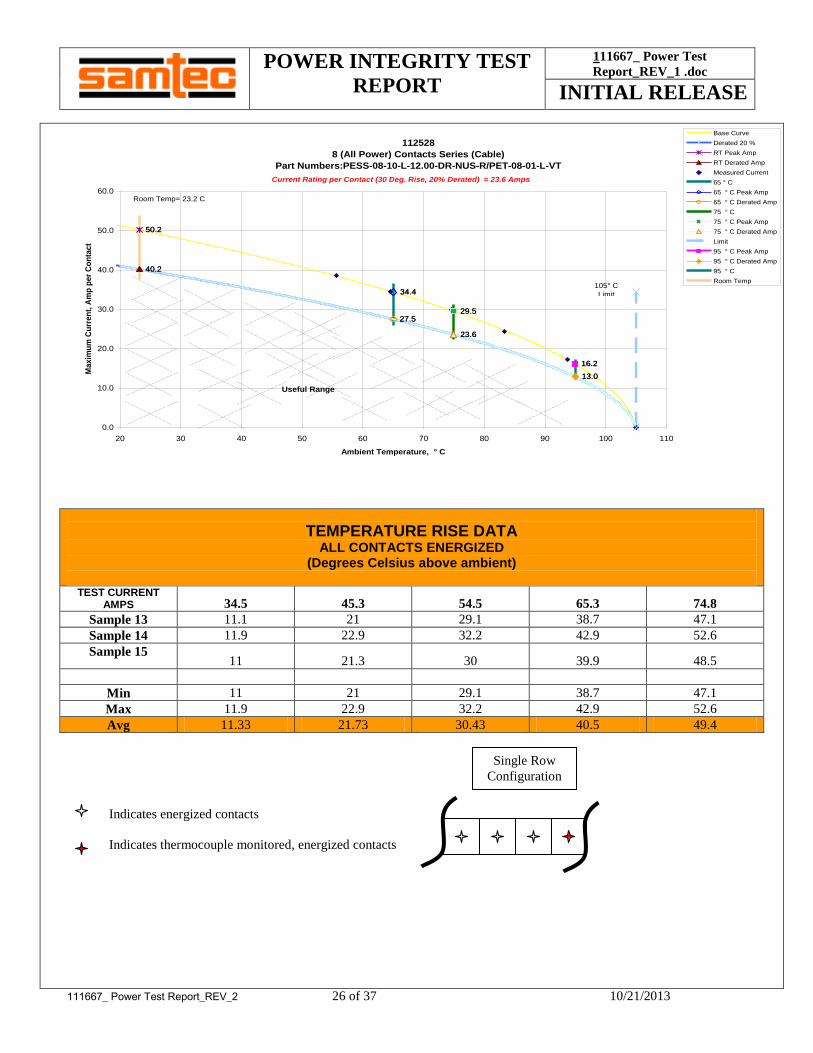
TEMPERATURE RISE DATA ALL CONTACTS ENERGIZED
(Degrees Celsius above ambient)
TEST CURRENT AMPS 34.5 45.3 54.5 65.3 74.8
Sample 13 11.1 21 29.1 38.7 47.1
Sample 14 11.9 22.9 32.2 42.9 52.6
Sample 15 11 21.3 30 39.9 48.5
Min 11 21 29.1 38.7 47.1
Max 11.9 22.9 32.2 42.9 52.6
Avg 11.33 21.73 30.43 40.5 49.4
Indicates energized contacts
Indicates thermocouple monitored, energized contacts
112528
8 (All Power) Contacts Series (Cable)
Part Numbers:PESS-08-10-L-12.00-DR-NUS-R/PET-08-01-L-VT
50.250.2
40.240.2
34.434.4
27.527.529.529.5
23.623.6
16.216.2
13.013.0
0.0
10.0
20.0
30.0
40.0
50.0
60.0
20 30 40 50 60 70 80 90 100 110
Ambient Temperature, ° C
Ma
xim
um
Cu
rre
nt,
Am
p p
er
Co
nta
ct
Base Curve
Derated 20 %
RT Peak Amp
RT Derated Amp
Measured Current
65 ° C
65 ° C Peak Amp
65 ° C Derated Amp
75 ° C
75 ° C Peak Amp
75 ° C Derated Amp
Limit
95 ° C Peak Amp
95 ° C Derated Amp
95 ° C
Room Temp105° C
Limit
Useful Range
Room Temp= 23.2 C
Current Rating per Contact (30 Deg. Rise, 20% Derated) = 23.6 Amps
Single Row
Configuration

POWER INTEGRITY TEST
REPORT
111667_ Power Test
Report_REV_1 .doc INITIAL RELEASE
111667_ Power Test Report_REV_2 27 of 37 10/21/2013
TEMPERATURE RISE DATA ALL CONTACTS ENERGIZED
(Degrees Celsius above ambient)
TEST CURRENT AMPS 35.2 46.7 57.7 68.8 79.6
Sample 13 11.5 22.4 32.7 43 53
Sample 14 12.3 23.9 34.7 45.4 56
Sample 15 12.1 23 33.4 43.7 53.5
Min 11.5 22.4 32.7 43 53
Max 12.3 23.9 34.7 45.4 56
Avg 11.97 23.1 33.6 44.03 54.17
Indicates energized contacts
Indicates thermocouple monitored, energized contacts
112528
8 (All Power) Contacts Series (Mate Area)
Part Numbers:PESS-08-10-L-12.00-DR-NUS-R/PET-08-01-L-VT
47.747.7
38.238.2
32.832.8
26.326.328.228.2
22.622.6
15.715.7
12.612.6
0.0
10.0
20.0
30.0
40.0
50.0
20 30 40 50 60 70 80 90 100 110
Ambient Temperature, ° C
Maxim
um
Cu
rren
t, A
mp
per
Co
nta
ct
Base Curve
Derated 20 %
RT Peak Amp
RT Derated Amp
Measured Current
65 ° C
65 ° C Peak Amp
65 ° C Derated Amp
75 ° C
75 ° C Peak Amp
75 ° C Derated Amp
Limit
95 ° C Peak Amp
95 ° C Derated Amp
95 ° C
Room Temp105° C
Limit
Useful Range
Room Temp= 23.2 C
Current Rating per Contact (30 Deg. Rise, 20% Derated) = 22.6 Amps
Single Row
Configuration

POWER INTEGRITY TEST
REPORT
111667_ Power Test
Report_REV_1 .doc INITIAL RELEASE
111667_ Power Test Report_REV_2 28 of 37 10/21/2013
TEST DATA
CURRENT CYCLING:
CURRENT CYCLING VS. TEMPERATURE RISE
20
22
24
26
28
30
32
34
0 100 200 300 400 500
NUMBER OF CURRENT CYCLES
TE
MP
ER
AT
UR
E R
ISE
(D
eg
rees C
ab
ove A
mb
ien
t)
Max Rise
TEMPERATURE RISE DATA ALL CONTACTS ENERGIZED
(Degrees Celsius above ambient)
INITIAL 50 CYCLES 100 CYCLES 200 CYCLES 500 CYCLES
Min 28.6 27.4 27.3 29.2 29.1
Max 31 31.3 31.2 31.1 31.1
Avg 29.8 30 29.8 30.1 30.1

POWER INTEGRITY TEST
REPORT
111667_ Power Test
Report_REV_1 .doc INITIAL RELEASE
111667_ Power Test Report_REV_2 29 of 37 10/21/2013
CURRENT CYCLING VS. CONTACT RESISTANCE
1
1.25
1.5
1.75
2
2.25
2.5
2.75
3
0 100 200 300 400 500
NUMBER OF CURRENT CYCLES
CO
NT
AC
T R
ES
IST
AN
CE
@ R
AT
ED
CU
RR
EN
T (
mil
li-O
hm
s)
Max Res
CONTACT RESISTANCE DATA ALL CONTACTS ENERGIZED
(m)
INITIAL 50 CYCLES 100 CYCLES 200 CYCLES 500 CYCLES
Min 1.44 1.43 1.43 1.43 1.42
Max 1.69 1.69 1.68 1.68 1.68
Avg 1.56 1.56 1.55 1.55 1.55

POWER INTEGRITY TEST
REPORT
111667_ Power Test
Report_REV_1 .doc INITIAL RELEASE
111667_ Power Test Report_REV_2 30 of 37 10/21/2013
CURRENT CYCLING VS. VOLTAGE DROP
35
36
37
38
39
40
41
42
43
44
45
46
47
48
49
50
0 100 200 300 400 500
NUMBER OF CURRENT CYCLES
VO
LT
AG
E D
RO
P @
RA
TE
D C
UR
RE
NT
(mil
li-V
olt
s)
Max Volt
VOLTAGE DROP DATA ALL CONTACTS ENERGIZED
(MV)
INITIAL 50 CYCLES 100 CYCLES 200 CYCLES 500 CYCLES
Min 40.57 40.37 40.26 40.2 40.09
Max 47.56 47.57 47.5 47.41 47.32
Avg 43.98 43.97 43.84 43.8 43.72

POWER INTEGRITY TEST
REPORT
111667_ Power Test
Report_REV_1 .doc INITIAL RELEASE
111667_ Power Test Report_REV_2 31 of 37 10/21/2013
TEST DATA Test Request #112529 (Current Cycling)
PESS-08-10-L-12.00-DR-NUS-R / PET-08-01-L-VT
CURRENT CYCLING DATA:
CURRENT CYCLING VS. TEMPERATURE RISE
2
4
6
8
10
12
14
16
18
20
0 100 200 300 400 500
NUMBER OF CURRENT CYCLES
TE
MP
ER
AT
UR
E R
ISE
(D
eg
rees C
ab
ove A
mb
ien
t)
Max Rise
TEMPERATURE RISE DATA ALL CONTACTS ENERGIZED
(Degrees Celsius above ambient)
INITIAL 50 CYCLES 100 CYCLES 200 CYCLES 500 CYCLES
Min 0.4 -0.3 -0.1 -0.1 -0.1
Max 2.7 3.6 2.8 3.7 3.9
Avg 1.7 1.7 1.6 1.9 1.8
POWER INTEGRITY TEST
REPORT
111667_ Power Test
Report_REV_1 .doc INITIAL RELEASE
111667_ Power Test Report_REV_2 32 of 37 10/21/2013
CURRENT CYCLING VS. CONTACT RESISTANCE
1
1.25
1.5
1.75
2
2.25
2.5
2.75
3
0 100 200 300 400 500
NUMBER OF CURRENT CYCLES
CO
NT
AC
T R
ES
IST
AN
CE
@ R
AT
ED
CU
RR
EN
T (
mil
li-O
hm
s)
Max Res
CONTACT RESISTANCE DATA ALL CONTACTS ENERGIZED
(m)
INITIAL 50 CYCLES 100 CYCLES 200 CYCLES 500 CYCLES
Min 1.4 1.41 1.41 1.41 1.41
Max 1.6 1.62 1.62 1.63 1.64
Avg 1.48 1.49 1.49 1.5 1.5

POWER INTEGRITY TEST
REPORT
111667_ Power Test
Report_REV_1 .doc INITIAL RELEASE
111667_ Power Test Report_REV_2 33 of 37 10/21/2013
CURRENT CYCLING VS. VOLTAGE DROP
35
36
37
38
39
40
41
42
43
44
45
46
47
48
49
50
0 100 200 300 400 500
NUMBER OF CURRENT CYCLES
VO
LT
AG
E D
RO
P @
RA
TE
D C
UR
RE
NT
(mil
li-V
olt
s)
Max Volt
VOLTAGE DROP DATA ALL CONTACTS ENERGIZED
(MV)
INITIAL 50 CYCLES 100 CYCLES 200 CYCLES 500 CYCLES
Min 39.55 39.79 39.85 39.81 39.84
Max 45.08 45.55 45.74 45.84 46.14
Avg 41.66 42.01 42.14 42.17 42.3

POWER INTEGRITY TEST
REPORT
111667_ Power Test
Report_REV_1 .doc INITIAL RELEASE
111667_ Power Test Report_REV_2 34 of 37 10/21/2013
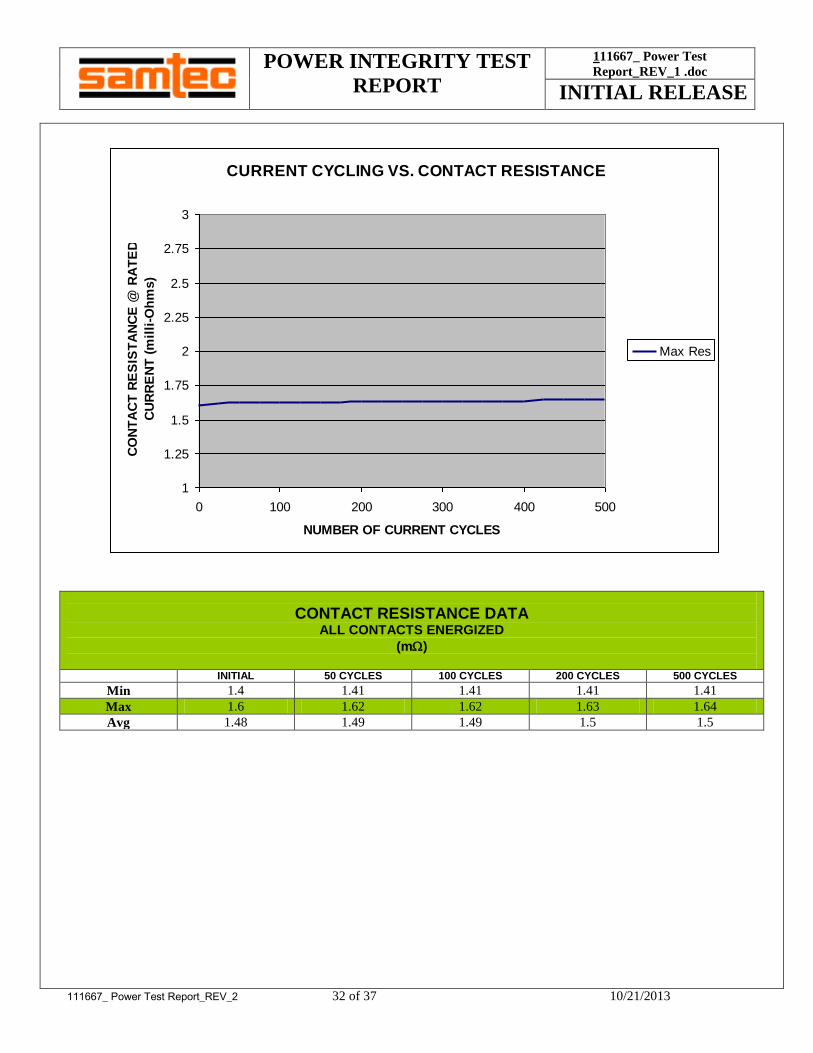
TEST DATA Test Request #112526rrent Cycling)
PESS-08-10-L-12.00-DR-NUS-R / PET-08-01-L-VT
CURRENT CYCLING DATA:
CURRENT CYCLING VS. TEMPERATURE RISE
2
4
6
8
10
12
14
16
18
20
0 100 200 300 400 500
NUMBER OF CURRENT CYCLES
TE
MP
ER
AT
UR
E R
ISE
(D
eg
rees C
ab
ove A
mb
ien
t)
Max Rise
TEMPERATURE RISE DATA ALL CONTACTS ENERGIZED
(Degrees Celsius above ambient)
INITIAL 50 CYCLES 100 CYCLES 200 CYCLES 500 CYCLES
Min -1.5 -1.9 -1.9 -1.9 -1.9
Max 7.4 7.9 8 8.7 8.6
Avg 1.6 1.4 1.4 1.6 1.5

POWER INTEGRITY TEST
REPORT
111667_ Power Test
Report_REV_1 .doc
INITIAL RELEASE
111667_ Power Test Report_REV_2 Page 35 of 37 10/21/2013
CURRENT CYCLING VS. CONTACT RESISTANCE
1
1.25
1.5
1.75
2
2.25
2.5
2.75
3
0 100 200 300 400 500
NUMBER OF CURRENT CYCLES
CO
NT
AC
T R
ES
IST
AN
CE
@ R
AT
ED
CU
RR
EN
T (
mil
li-O
hm
s)
Max Res
CONTACT RESISTANCE DATA ALL CONTACTS ENERGIZED
(m)
INITIAL 50 CYCLES 100 CYCLES 200 CYCLES 500 CYCLES
Min 1.35 1.36 1.36 1.36 1.36
Max 1.52 1.54 1.54 1.54 1.54
Avg 1.43 1.44 1.44 1.44 1.44

POWER INTEGRITY TEST
REPORT
111667_ Power Test
Report_REV_1 .doc INITIAL RELEASE
111667_ Power Test Report_REV_2 36 of 37 10/21/2013
CURRENT CYCLING VS. VOLTAGE DROP
35
36
37
38
39
40
41
42
43
44
45
46
47
48
49
50
0 100 200 300 400 500
NUMBER OF CURRENT CYCLES
VO
LT
AG
E D
RO
P @
RA
TE
D C
UR
RE
NT
(mil
li-V
olt
s)
Max Volt
VOLTAGE DROP DATA ALL CONTACTS ENERGIZED
(MV)
INITIAL 50 CYCLES 100 CYCLES 200 CYCLES 500 CYCLES
Min 33.13 33.39 33.35 33.34 33.44
Max 37.48 37.84 37.8 37.81 37.93
Avg 35.08 35.39 35.35 35.35 35.47

POWER INTEGRITY TEST
REPORT
111667_ Power Test
Report_REV_1 .doc INITIAL RELEASE
111667_ Power Test Report_REV_2 37 of 37 10/21/2013
EQUIPMENT AND CALIBRATION SCHEDULES Equipment #: MO-04
Description: Multimeter /Data Acquisition System
Manufacturer: Keithley
Model: 2700
Serial #: 0798688
Accuracy: See Manual
… Last Cal: 4/30/2010, Next Cal: 4/30/2011
Equipment #: ACLM-01
Description: Accelerometer
Manufacturer: PCB Piezotronics
Model: 352C03
Serial #: 115819
Accuracy: See Manual
… Last Cal: 07/09/2010, Next Cal: 07/09/2011
Equipment #: ED-03
Description: Event Detector
Manufacturer: Analysis Tech
Model: 32EHD
Serial #: 1100604
Accuracy: See Manual
… Last Cal: 06/04/2010, Next Cal: 06/04/2011