project report no. 612
TRANSCRIPT
October 2019
Project Report No. 612
Defining the basis for variation in water absorption of UK wheat flours
Peter R Shewry1, Abigail J Wood,1 Kirsty Hassall,1 Liz Howes2, Mervin Poole2,
Paola Tosi3 and Alison Lovegrove1
1Rothamsted Research, Harpenden, Herts, AL5 2JQ, UK
2Heygates Ltd., Bugbrooke Mills, Northampton NN7 3QH, UK 3School of Agriculture, Policy and Development, University of Reading,
Whiteknights Campus, Early Gate, RG6 7AR, UK.
This is the final report of a 39-month project (21130025) that started in April 2016. The work was funded by a contract for £180,000 from AHDB Cereals & Oilseeds.
While the Agriculture and Horticulture Development Board seeks to ensure that the information contained within this document is
accurate at the time of printing, no warranty is given in respect thereof and, to the maximum extent permitted by law, the Agriculture and
Horticulture Development Board accepts no liability for loss, damage or injury howsoever caused (including that caused by negligence)
or suffered directly or indirectly in relation to information and opinions contained in or omitted from this document.
Reference herein to trade names and proprietary products without stating that they are protected does not imply that they may be
regarded as unprotected and thus free for general use. No endorsement of named products is intended, nor is any criticism implied of
other alternative, but unnamed, products.
AHDB Cereals & Oilseeds is a part of the Agriculture and Horticulture Development Board (AHDB).
CONTENTS
1. ABSTRACT ....................................................................................................................... 1
2. INTRODUCTION ............................................................................................................... 2
3. MATERIALS AND METHODS .......................................................................................... 4
3.1. Field trials ............................................................................................................. 4
3.2. Milling and determination of WA and starch damage ........................................ 4
3.3. Analysis of arabinoxylans (pentosans) and β-glucan (dietary fibre components) ......................................................................................................... 4
3.4. Determination of grain hardness and vitreousness ........................................... 5
3.5. Solvent retention capacity (SRC) ........................................................................ 5
3.6. Determination of amylose in starch .................................................................... 5
3.7. Determination of protein fractions ...................................................................... 5
3.8. Statistical analysis/modelling .............................................................................. 5
4. RESULTS .......................................................................................................................... 6
4.1. Comparison of elite cultivars grown in years with typical (2016,2018) and atypical (low) (2013, 2017) water absorption (WA). ............................................ 6
4.1.1. Correlations and multivariate analysis of parameters measured in grain samples
grown in four years ............................................................................................... 10
4.1.2. Modelling the contributions of parameters to WA. ................................................. 14
4.1.3. Conclusions .......................................................................................................... 17
4.2. Comparison of doubled haploid (DH) and parental from the cross Yumai 34 x Valoris lines, differing in AX content. ............................................................... 17
4.3. Effect of nitrogen fertilisation on WA and AX content ..................................... 22
5. DISCUSSION .................................................................................................................. 23
6. REFERENCES ................................................................................................................ 24
1
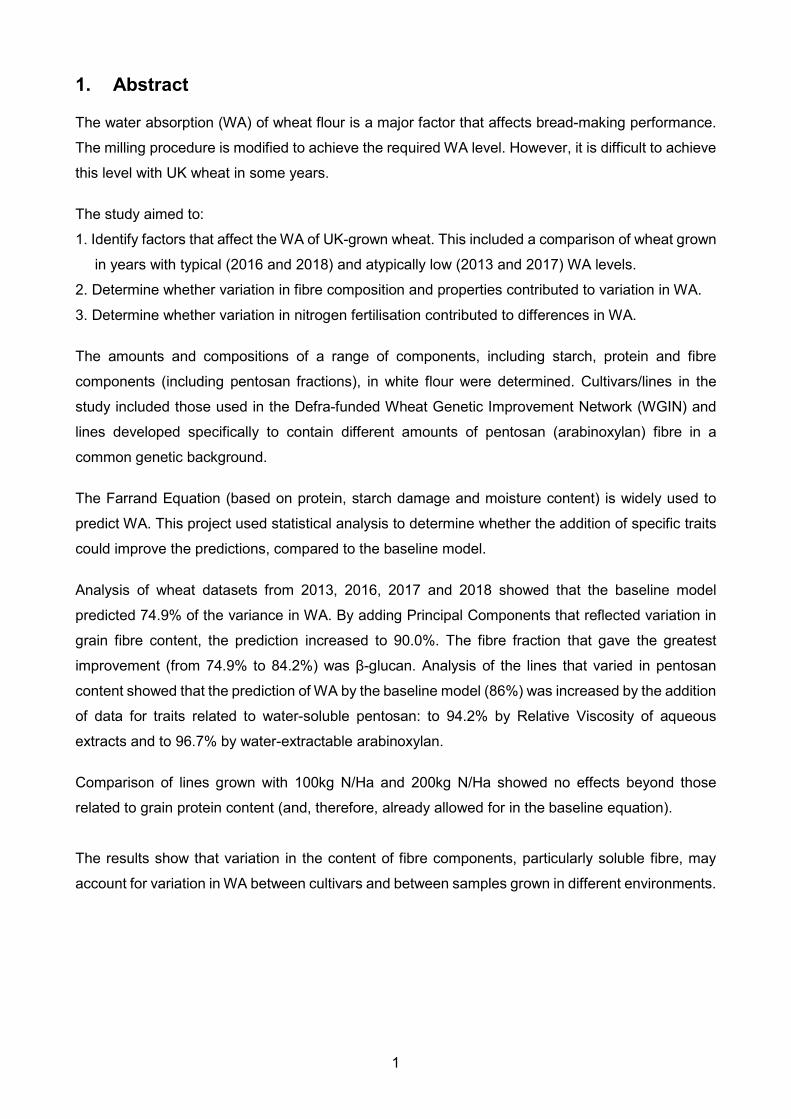
1. Abstract
The water absorption (WA) of wheat flour is a major factor that affects bread-making performance.
The milling procedure is modified to achieve the required WA level. However, it is difficult to achieve
this level with UK wheat in some years.
The study aimed to:
1. Identify factors that affect the WA of UK-grown wheat. This included a comparison of wheat grown
in years with typical (2016 and 2018) and atypically low (2013 and 2017) WA levels.
2. Determine whether variation in fibre composition and properties contributed to variation in WA.
3. Determine whether variation in nitrogen fertilisation contributed to differences in WA.
The amounts and compositions of a range of components, including starch, protein and fibre
components (including pentosan fractions), in white flour were determined. Cultivars/lines in the
study included those used in the Defra-funded Wheat Genetic Improvement Network (WGIN) and
lines developed specifically to contain different amounts of pentosan (arabinoxylan) fibre in a
common genetic background.
The Farrand Equation (based on protein, starch damage and moisture content) is widely used to
predict WA. This project used statistical analysis to determine whether the addition of specific traits
could improve the predictions, compared to the baseline model.
Analysis of wheat datasets from 2013, 2016, 2017 and 2018 showed that the baseline model
predicted 74.9% of the variance in WA. By adding Principal Components that reflected variation in
grain fibre content, the prediction increased to 90.0%. The fibre fraction that gave the greatest
improvement (from 74.9% to 84.2%) was β-glucan. Analysis of the lines that varied in pentosan
content showed that the prediction of WA by the baseline model (86%) was increased by the addition
of data for traits related to water-soluble pentosan: to 94.2% by Relative Viscosity of aqueous
extracts and to 96.7% by water-extractable arabinoxylan.
Comparison of lines grown with 100kg N/Ha and 200kg N/Ha showed no effects beyond those
related to grain protein content (and, therefore, already allowed for in the baseline equation).
The results show that variation in the content of fibre components, particularly soluble fibre, may
account for variation in WA between cultivars and between samples grown in different environments.
2
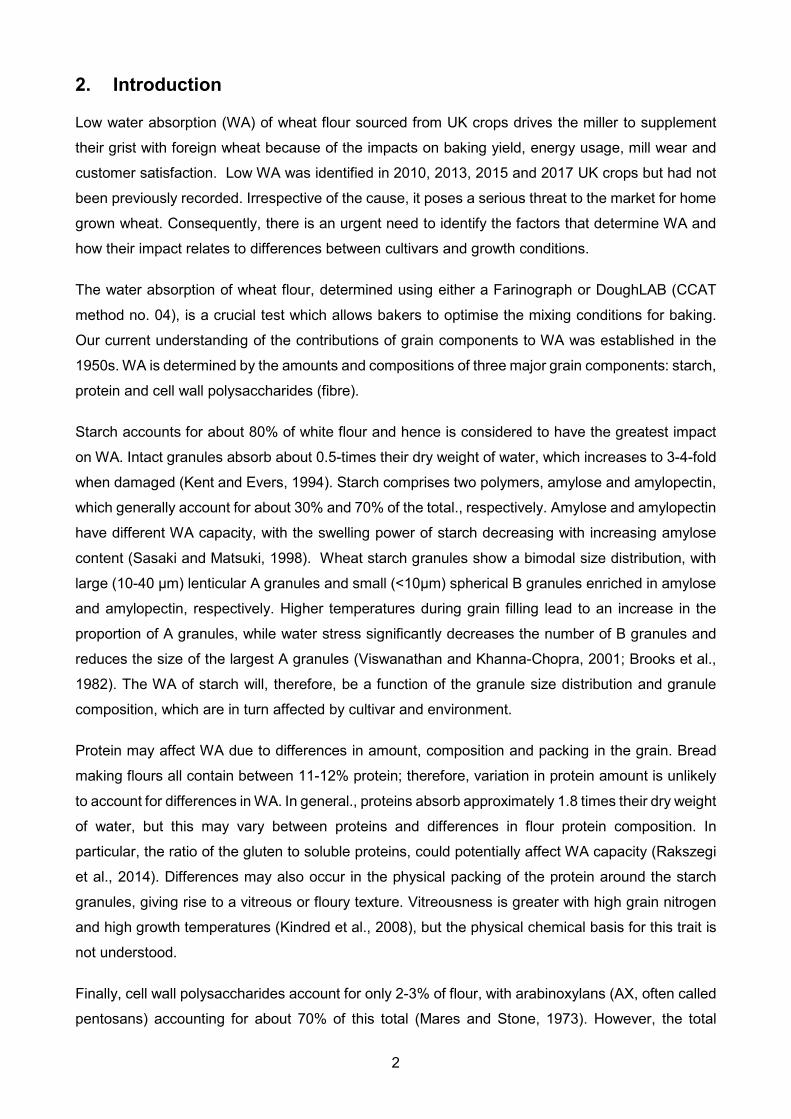
2. Introduction
Low water absorption (WA) of wheat flour sourced from UK crops drives the miller to supplement
their grist with foreign wheat because of the impacts on baking yield, energy usage, mill wear and
customer satisfaction. Low WA was identified in 2010, 2013, 2015 and 2017 UK crops but had not
been previously recorded. Irrespective of the cause, it poses a serious threat to the market for home
grown wheat. Consequently, there is an urgent need to identify the factors that determine WA and
how their impact relates to differences between cultivars and growth conditions.
The water absorption of wheat flour, determined using either a Farinograph or DoughLAB (CCAT
method no. 04), is a crucial test which allows bakers to optimise the mixing conditions for baking.
Our current understanding of the contributions of grain components to WA was established in the
1950s. WA is determined by the amounts and compositions of three major grain components: starch,
protein and cell wall polysaccharides (fibre).
Starch accounts for about 80% of white flour and hence is considered to have the greatest impact
on WA. Intact granules absorb about 0.5-times their dry weight of water, which increases to 3-4-fold
when damaged (Kent and Evers, 1994). Starch comprises two polymers, amylose and amylopectin,
which generally account for about 30% and 70% of the total., respectively. Amylose and amylopectin
have different WA capacity, with the swelling power of starch decreasing with increasing amylose
content (Sasaki and Matsuki, 1998). Wheat starch granules show a bimodal size distribution, with
large (10-40 μm) lenticular A granules and small (<10μm) spherical B granules enriched in amylose
and amylopectin, respectively. Higher temperatures during grain filling lead to an increase in the
proportion of A granules, while water stress significantly decreases the number of B granules and
reduces the size of the largest A granules (Viswanathan and Khanna-Chopra, 2001; Brooks et al.,
1982). The WA of starch will, therefore, be a function of the granule size distribution and granule
composition, which are in turn affected by cultivar and environment.
Protein may affect WA due to differences in amount, composition and packing in the grain. Bread
making flours all contain between 11-12% protein; therefore, variation in protein amount is unlikely
to account for differences in WA. In general., proteins absorb approximately 1.8 times their dry weight
of water, but this may vary between proteins and differences in flour protein composition. In
particular, the ratio of the gluten to soluble proteins, could potentially affect WA capacity (Rakszegi
et al., 2014). Differences may also occur in the physical packing of the protein around the starch
granules, giving rise to a vitreous or floury texture. Vitreousness is greater with high grain nitrogen
and high growth temperatures (Kindred et al., 2008), but the physical chemical basis for this trait is
not understood.
Finally, cell wall polysaccharides account for only 2-3% of flour, with arabinoxylans (AX, often called
pentosans) accounting for about 70% of this total (Mares and Stone, 1973). However, the total
3
amount of AX varies from 1.35% to 2.75% (dry weight) between cultivars, and the water-soluble
fraction from 0.3% to 1.4% (dry weight) (Gebruers et al., 2008)). Pentosans have a very high water-
holding capacity, about 10-times their dry weight for the water-insoluble fraction and 11-times their
dry weight for the water-soluble faction (Guzmán et al., 2015; Finnie and Atwell, 2016). About 70%
of the variation in total pentosans and 60% of the variation in soluble pentosans is determined by
the cultivar, with smaller effects of the environment. In particular, the proportion of soluble pentosans
is higher under cool wet conditions (Shewry et al., 2010). Several early studies examined the
prediction of WA by protein and starch damage and concluded that pentosans did not contribute to
its variation (Dodds, 1972; Belderok, 1973; Greer & Stewart, 1959; Tipples et al., 1978). This is
reflected in the widely used Farrand equation (Farrand, 1969) which predicts WA based on protein,
starch damage and moisture content:
WA = 68.26 + (0.878 x protein) + (0.334 x damaged starch) - (1.97 x moisture).
By contrast, Stevens and Stewart (1982) concluded that 14% of the 48% of unaccounted variability
could be explained by soluble pentosans. In a separate study, the addition of pentosanase (purified
1-4, β-xylanase) had a negative impact on both dough rheology and baking quality (McCleary et al.,
1986). The second major type of fibre in wheat flour is β-glucan, which accounts for about 20% of
the total cell wall polysaccharides (Mares and Stone, 1973). Β-glucan has not been studied in detail
from wheat flour but has been studied in barley and oats where it is the major cell wall polysaccharide
and forms highly viscous solutions (Lazaridou and Biliaderis, 2007). Finally, white flour contains up
to 0.4 % dry weight of arabinogalactan-peptide (AGP) (Loosveld et al.,1997;1998) which comprises
a 15-residue amino acid peptide (Van den Bulck et al., 2002) including three hydroxyprolines which
are o-glycosylated with branched arabinogalactan chains (Tryfona et al., 2010). AGP is not a cell
wall component and most is extracted in water (Wilkinson et al., 2017). β-glucan and AGP could also
contribute to WA and we therefore determined the amounts of both in the study.
For most grain samples the dominant role of starch damage in determining WA means that millers
can readily achieve the degree of WA required by bakers. However, although the miller can grind
the wheat from anomalous years (such as 2010, 2013 and 2015, 2017) harder to increase starch
damage, and therefore increase water absorption, this approach is limited by the higher energy cost
and damage to the surface of mill rolls. Because UK bakers are not limited to sourcing their flour
from UK millers, the economics of milling means that millers will supplement their grist with wheat
from beyond the domestic market to maintain flour production that meets customer costs and
specifications. A better understanding of what contributes to WA will, therefore, provide routes to
manage the domestic crop through improved agronomy, breeding or processing and consequently
lead to a more consistent demand for the domestic crop by UK millers.
We, therefore, determined the contributions of starch, protein, pentosans, β-glucan and AGP to
differences in the WA of grain samples, including elite cultivars grown in years with typical (2016,
4
2018) and low (2013, 2017) WA. Furthermore, to explore the specific role of pentosans we compared
a series of lines with genetically determined differences in pentosan content of white flour. These
studies have provided new information on the role of pentosans and other components in
determining WA of wheat flour, both in typical and low WA years.
3. Materials and methods
3.1. Field trials
Modern elite UK wheat cultivars were grown on the experimental farm at Rothamsted Research,
Harpenden, UK in 2013, 2016, 2017 and 2018 as part of the Wheat Genetic Improvement Network
(WGIN) (Barraclough et al., 2010.). Cultivars were grown in triplicate 9 x 3 m plots at two levels of
nitrogen fertilization, 100 and 200 kg/Ha, using ammonium nitrate. Plots were randomized within
main plots of the nitrogen treatments.
Thirteen Yumai 34 x Valoris DH lines and the parents were grown at Rothamsted in 2018, in
9 x 1.8 m plots with 200 kg N/ha.
3.2. Milling and determination of WA and starch damage
Milling was carried out using a Brabender MLU 202 test mill and MLU 302 impact finisher according
to established UK-industry test milling requirements. WA was determined by Farinograph (CCAT
method no.4). Starch damage was determined using the Chopin SDmatic (CCAT method no. 24)
(which gives greater within-laboratory precision than Farrand methods) for the 2017 and 2018
samples and by NIRS for all samples. Protein was determined by Dumas combustion for the 2017
and 2018 samples (ISO/TS 16634-2:2009) and by NIRS for 2013 and 2016 samples.
For 2013 and 2016, grain from the triplicate plots was combined for each variety prior to milling. In
2017 and 2018, grain from individual plots was milled and analysed separately.
3.3. Analysis of arabinoxylans (pentosans) and β-glucan (dietary fibre components)
For determination of water-extractable (WE) AX and total (TOT) AX, monosaccharide analysis
following mild acid hydrolysis was as described by Bromley et al., 2013 with samples analysed in
triplicate. Relative viscosity of water extracts was determined using the method of Freeman et al.
(2016). Analysis of arabinoxylan oligosaccharides (AXOS) and β-glucan was conducted as
described by Freeman et al. (2017) with minor modifications, flours were digested with recombinant
endo-1,4-xylanase (PRO-E0062) and lichenase (a glucan-hydrolase) (PRO-E0017) (Prozomix). The
oligosaccharides were separated by HPAEC and peak areas were expressed relative to a Melibiose
internal standard. Samples were analysed in duplicate.

5
3.4. Determination of grain hardness and vitreousness
Grain hardness was determined using the Perten Single Kernel Characterization System (SKCS)
4100 (Perten, IL, United States) on samples of 100 grains (for 2013 and 2016) and 300 grains (for
2017 and 2018 and for the Yumai 34 x Valoris DH lines) harvested from each plot. A total of 300
grains were analysed for each sample given in Appendix 1. Vitreousness was determined by visual
examination and scoring and expressed as % vitreouness (ICC 129 Method, 1980). Grain was cut
transversally using a single edge blade and placed in a 96-well plate for visual scoring (33 kernels
were cut for each plot), a total 7722 kernels were scored.
3.5. Solvent retention capacity (SRC)
Solvent retention capacity (SRC) was determined according to AACC Method 56-11.02 (AACC
International., 2009). SRC is the weight of solvent held by flour after centrifugation, expressed as
percent of flour weight, on a 14% moisture basis. Four solvents: water, 50% sucrose, 5% sodium
carbonate and 5% lactic acid, were independently used to produce four SRC values for samples
from 2013 and 2016. Only 50% sucrose SRC was determined for 2017-2018 samples.
3.6. Determination of amylose in starch
Amylose content of flours (% total starch) was determined using the commercial Megazyme
Amylose/Amylopectin K-AMYL kit (Megazyme Ltd, Bray, Ireland). Analyses were carried out on
25mg of flour, following manufacturer’s specifications.
3.7. Determination of protein fractions
The ratio of gliadins to total gluten proteins in each flour sample was determined by extracting and
quantifying the 50% (v/v) propan-1-ol-soluble protein under non-reducing and reducing conditions,
respectively.
100mg aliquots of flour of each sample were extracted, independently, with 2ml 50% (v/v) propan-
1-ol or 2ml 50% (v/v) propan-1-ol, 25mM Tris pH 6,8, 2% dithiothreitol (DTT). Extraction was carried
out at room temperature for 20 min with constant shaking, following which samples were centrifuged
at 6500x g for 10 min. The supernatant was retained and the protein content quantified using the
Direct Detect® Infrared Spectrometer (Merk, Damstadt, Germany) following manufacturers’
instructions.
3.8. Statistical analysis/modelling
3.8.1. For the WGIN samples, linear mixed models were fitted to explain variation in water absorption
(response). A random effect for Year was included in all models. A baseline model was defined to
include all variables of the Farrand equation (Starch damage, Protein and Flour moisture). This
6
baseline model was compared to models including these baseline variables and a single dietary fibre
component (of which there were 13), and to a model incorporating all 13 dietary fibre components.
To avoid issues of collinearity, the 13 dietary fibre components were first processed through a
principal component analysis based on the correlation matrix generated, resulting in up to 10
Principle Components (PCs), accounting for 99% of the variation, to be included in the linear mixed
model. Models were then compared through an approximation to the percentage variance accounted
for, calculated as the percentage change in the sum of the variance components for each model in
order to determine which components and which model provided the best fit for the differences
observed in WA.
3.8.2. For the Yumai 34 x Valoris samples: Models were fitted in the same process as above but in
a linear regression framework. Given the smaller sample size, only 7 PCs, accounting for 99% of
the variation, were considered for the full fibre model. Models were compared using the adjusted
R2 value, a measure of the percentage variance accounted for by the model.
4. Results
4.1. Comparison of elite cultivars grown in years with typical (2016,2018) and atypical (low) (2013, 2017) water absorption (WA).
Grain samples grown in four years were compared, comprising two years in which WA was
considered by the UK milling industry to be typical (2016, 2018) and two in which WA was considered
to be atypically low (2013, 2017). Samples were obtained from the WGIN variety trials, from large
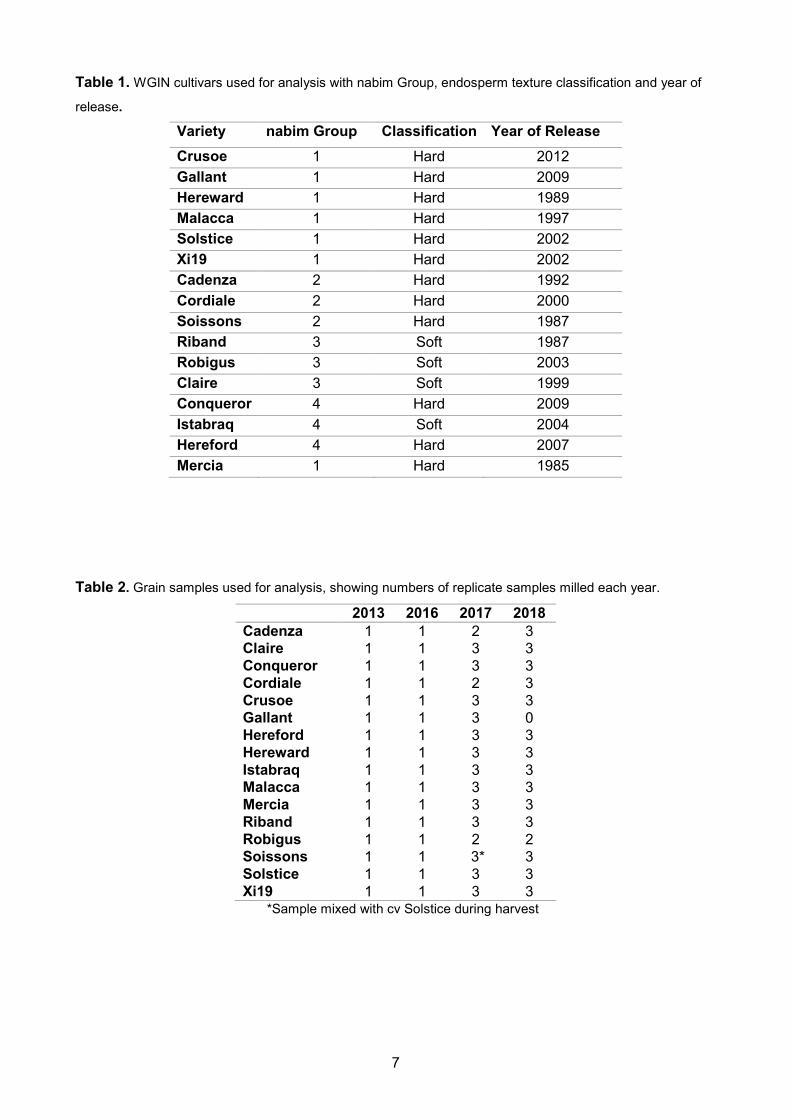
plots with 200 kg N/Ha. A total of 16 cultivars of different nabim Groups were analysed (Table 1).
Archived material was used from 2013 and 2016, with samples from three replicate plots combined
for milling. Biological replicates were combined in these years for technical reasons as the equipment
used for milling and WA measurements (Brabender and Farinograph, the widely recognised industry
standard) required a minimum sample size of 300g. Fresh grain samples were used in 2017 and
2018 and replicate plots milled separately (Table 2).
The WA of the samples is shown in Figures 1 and 2. The mean WA in 2017 was clearly lower than
that in the other years, confirming that this year was “atypical”. However, it is interesting to note that
the range of WAs overlapped with the range for 2018. By contrast, the means for 2013 and 2016
were similar to that for 2018.
7
Table 1. WGIN cultivars used for analysis with nabim Group, endosperm texture classification and year of
release. Variety nabim Group Classification Year of Release Crusoe 1 Hard 2012 Gallant 1 Hard 2009 Hereward 1 Hard 1989 Malacca 1 Hard 1997 Solstice 1 Hard 2002 Xi19 1 Hard 2002 Cadenza 2 Hard 1992 Cordiale 2 Hard 2000 Soissons 2 Hard 1987 Riband 3 Soft 1987 Robigus 3 Soft 2003 Claire 3 Soft 1999 Conqueror 4 Hard 2009 Istabraq 4 Soft 2004 Hereford 4 Hard 2007 Mercia 1 Hard 1985
Table 2. Grain samples used for analysis, showing numbers of replicate samples milled each year.
2013 2016 2017 2018 Cadenza 1 1 2 3 Claire 1 1 3 3 Conqueror 1 1 3 3 Cordiale 1 1 2 3 Crusoe 1 1 3 3 Gallant 1 1 3 0 Hereford 1 1 3 3 Hereward 1 1 3 3 Istabraq 1 1 3 3 Malacca 1 1 3 3 Mercia 1 1 3 3 Riband 1 1 3 3 Robigus 1 1 2 2 Soissons 1 1 3* 3 Solstice 1 1 3 3 Xi19 1 1 3 3
*Sample mixed with cv Solstice during harvest

8
Figure 1. Boxplots for water absorption of each sample determined for flours from the four years. A reduced
variance is seen in 2013 and 2016 due to the pooling of biological replicates.
Figure 2. Water absorption of the individual flour samples from the four years.
Coloured based on nabim group.
45
50
55
60
2013 2016 2017 2018Year
Wat
er A
bsor
ptio
n (%
)Year
2013
2016
2017
2018
40
45
50
55
60
65
2014.5 2015 2015.5 2016 2016.5 2017 2017.5 2018 2018.5
Wat
er A
bsor
ptio
n (%
)
Year
Group 1
Group 2
Group 3
Group 4
2013

9
The flours were analysed for a range of components and properties, as summarised in Table 3. The
components analysed were selected based on their potential (known or hypothesised) to influence
water absorption. These included starch damage, protein content, flour moisture content (known WA
components) and a number of measurements specifically related to fibre content and composition.
Soluble (water-extractable) arabinoxylan (WE-AX) and total AX (TOT-AX) were determined by
monosaccharide analysis and are expressed as xylose units (to avoid the requirement to correct
arabinose values for other non-starch polysaccharide components that also contain arabinose).
TOT-AX and β-glucan were also determined by enzyme fingerprinting (expressed in arbitrary units).
This analysis also allowed the ratio of these two major fibre components to be calculated in addition
to providing information on β-glucan structure (expressed as the ratio of oligosaccharides comprising
three glucose (G3) and four glucose (G4) units released by digestion).
The SRC test (Slade and Levine, 1994) determines the ability of flour to retain a set of four solvents
(water, 50% sucrose, 5% sodium carbonate, 5% lactic acid). These solvents are preferentially
absorbed by one or more of the major grain components, with 50% sucrose being preferentially
absorbed by pentosans (and thus provides a measure of arabinoxylan) (Gaines, 2004). The sucrose
SRC was therefore determined for all samples. Finally, arabinogalactan peptide (AGP) was
determined by monosaccharide analysis and expressed as galactose units.
The full datasets for the samples are given in Appendix 1.
Table 3. Traits measured in all flour samples.
Type of trait Trait Analytical method Shorthand in Tables and
Figures
Starch % amylose Megazyme K-AMYL kit % amylose
Starch damage (NIR) NIR Starch damage
Protein
% protein NIR Protein ‘as is’ in 2013 and 2016 samples Dumas combustion of Flour protein (Nx5.7) ‘as is’
in 2017 and 2018 samples
Protein
Gliadin as % total gluten protein
Direct Detect® Infrared Spectrometer % gliadin
Water % flour moisture NIR Flour moisture
Texture Hardness SKCS-Perten Hardness
Vitreousness Visual scoring following sectioning (%) Vitreousness
Fibre
Water-extractable arabinoxylan (WE-AX)
HPAEC of monosaccharides following mild acid hydrolysis, expressed as xylose
WE-(A)X
Arabinose:xylose ratio in WE-AX
HPAEC of monosaccharides following mild acid hydrolysis
WE-A:X
Relative viscosity Capillary viscometry of aqueous extracts RV
Sucrose solvent retention capacity
ACCI Method 56-11.02 Sucrose SRC
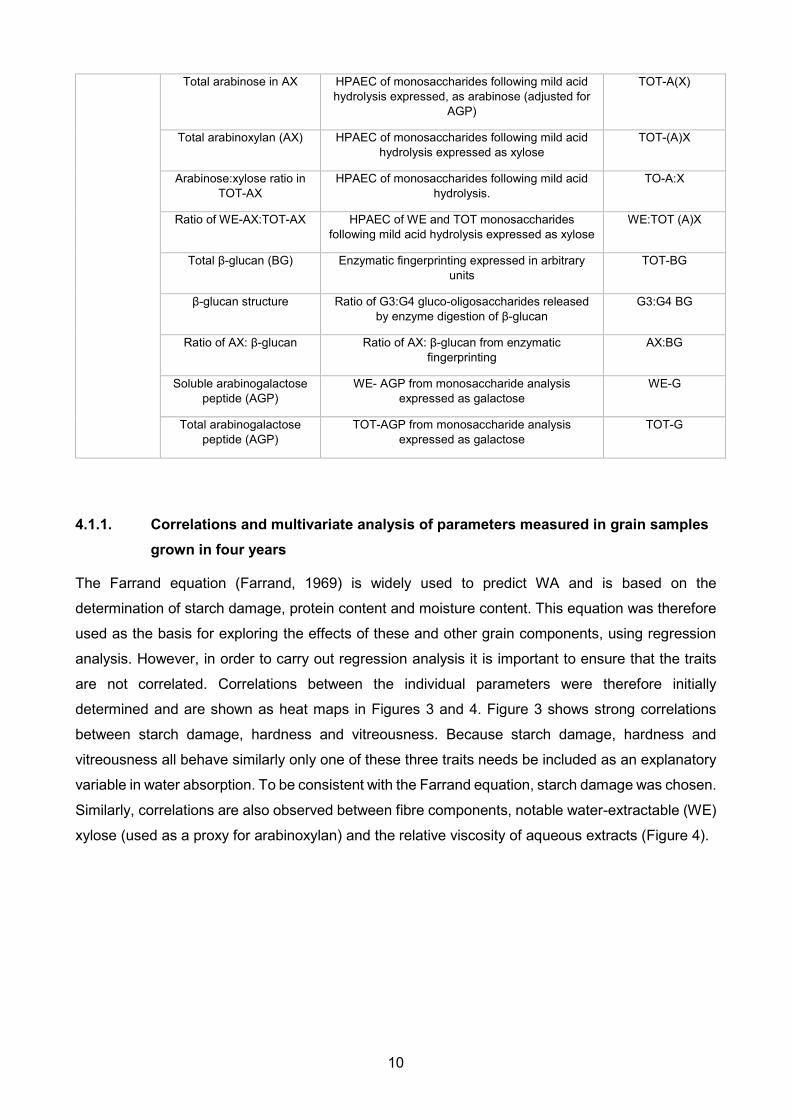
10
Total arabinose in AX HPAEC of monosaccharides following mild acid hydrolysis expressed, as arabinose (adjusted for
AGP)
TOT-A(X)
Total arabinoxylan (AX) HPAEC of monosaccharides following mild acid hydrolysis expressed as xylose
TOT-(A)X
Arabinose:xylose ratio in TOT-AX
HPAEC of monosaccharides following mild acid hydrolysis.
TO-A:X
Ratio of WE-AX:TOT-AX HPAEC of WE and TOT monosaccharides following mild acid hydrolysis expressed as xylose
WE:TOT (A)X
Total β-glucan (BG) Enzymatic fingerprinting expressed in arbitrary units
TOT-BG
β-glucan structure Ratio of G3:G4 gluco-oligosaccharides released by enzyme digestion of β-glucan
G3:G4 BG
Ratio of AX: β-glucan Ratio of AX: β-glucan from enzymatic fingerprinting
AX:BG
Soluble arabinogalactose peptide (AGP)
WE- AGP from monosaccharide analysis expressed as galactose
WE-G
Total arabinogalactose peptide (AGP)
TOT-AGP from monosaccharide analysis expressed as galactose
TOT-G
4.1.1. Correlations and multivariate analysis of parameters measured in grain samples grown in four years
The Farrand equation (Farrand, 1969) is widely used to predict WA and is based on the
determination of starch damage, protein content and moisture content. This equation was therefore
used as the basis for exploring the effects of these and other grain components, using regression
analysis. However, in order to carry out regression analysis it is important to ensure that the traits
are not correlated. Correlations between the individual parameters were therefore initially
determined and are shown as heat maps in Figures 3 and 4. Figure 3 shows strong correlations
between starch damage, hardness and vitreousness. Because starch damage, hardness and
vitreousness all behave similarly only one of these three traits needs be included as an explanatory
variable in water absorption. To be consistent with the Farrand equation, starch damage was chosen.
Similarly, correlations are also observed between fibre components, notable water-extractable (WE)
xylose (used as a proxy for arabinoxylan) and the relative viscosity of aqueous extracts (Figure 4).

11
Figure 3. Heat map of correlations between grain parameters.
Figure 4. Heat map of correlations between parameters relating to fibre amount and composition.
Starch.damage
Hardness
Vitreousness
Amylose
Protein
Gliadin
Flour.moisture
Starch.dam
age
Hardness
Vitreou
snes
s
Amylose
Protein
Gliadin
Flour.m
oisture
-1.0
-0.5
0.0
0.5
1.0
RV
WE-(A)X
WE-A:X
Sucrose SRC
TOT-A(X)
TO-A:X
TOT-(A)X
WE:TOT (A)X
TOT-BG
G3:G4 BG
AX:BG
WE-G
TOT-G
RV WE-(A)X
WE-A:X
Sucros
e SRC
TOT-A(X
)
TO-A:X
TOT-(A)X
WE:TOT (A)X
TOT-BG
G3:G4 B
G
AX:BGWE-G
TOT-G -1.0
-0.5
0.0
0.5
1.0
12
Rather than selecting a subset of independent fibre measurements for further analysis, we decided
to combine the fibre data by multivariate Principal Component Analysis (PCA). This identified 10
principal components which together accounted for 99% of the variation in the dataset. Figure 5A
and B show the plots of PC1 against PC2, which together account for 60% of the total variance,
coloured to show the cultivars and years. This shows a partial separation between years, but 2017
(which showed atypically low WA) was not clearly separated from the other years. The contributions
of the traits to the PCs (loadings) are given in Table 4.
The 10 PCs are independent of each other and hence were appropriate to be included in the
regression analysis.

13
Figure 5. PCA (PC1 v PC2) of dietary fibre components, coloured by cultivar (A) and years (B).
-5.0 -2.5 0.0 2.5
-5.0
-2.5
0.0
2.5
PC1: 37% expl. var
PC2:
23%
exp
l. va
rCultivar
CadenzaClaireConquerorCordialeCrusoeGallantHerefordHerewardIstabraqMalaccaMerciaRibandRobigusSoissonsSoissons/Solstice mixSolsticeXi19
-5.0 -2.5 0.0 2.5
-5.0
-2.5
0.0
2.5
PC1: 37% expl. var
PC2:
23%
exp
l. va
r
Year2013201620172018
(A)
(B)

14
Table 4. Contributions (loadings) of fibre components to PCs 1 to 10. Percentage variance of each PC 37.3 23.5 12.1 7.7 7.3 4.6 3.7 1.5 0.9 0.8
PC1 PC2 PC3 PC4 PC5 PC6 PC7 PC8 PC9 PC10 RV -0.277 0.367 0.193 -0.066 0.196 -0.004 0.395 0.223 -0.010 0.063 WE-(A)X -0.403 0.169 0.170 0.049 0.153 -0.220 -0.012 0.240 0.001 0.101 WE-A:X 0.347 -0.046 0.021 0.322 0.469 0.090 0.317 0.000 -0.286 0.571 Sucrose SRC -0.115 0.463 -0.107 -0.193 -0.134 0.241 0.461 -0.577 0.076 -0.022 TOT-A(X) -0.334 -0.351 0.128 0.010 0.105 0.016 0.225 0.045 0.272 0.014 TOT-A:X -0.020 -0.457 0.322 0.070 0.179 -0.301 0.354 -0.368 -0.163 -0.426 TOT-(A)X -0.413 -0.193 0.023 -0.066 0.023 0.185 0.098 0.237 0.258 0.174 WE:TOT (A)X -0.033 0.469 0.179 0.191 0.169 -0.548 -0.177 0.000 -0.047 -0.171 TOT-BG -0.294 -0.151 -0.348 -0.187 -0.374 -0.404 0.145 0.002 -0.558 0.291 G3:G4 BG -0.048 0.044 0.214 0.739 -0.603 0.096 0.162 0.055 0.013 0.014 AX:BG -0.162 0.014 0.650 -0.210 -0.072 0.355 -0.332 -0.154 -0.457 0.131 WE-G -0.368 -0.058 -0.166 0.304 0.197 -0.075 -0.392 -0.571 0.191 0.311 TO-G -0.304 0.044 -0.390 0.296 0.285 0.394 -0.056 0.114 -0.431 -0.468
4.1.2. Modelling the contributions of parameters to WA.
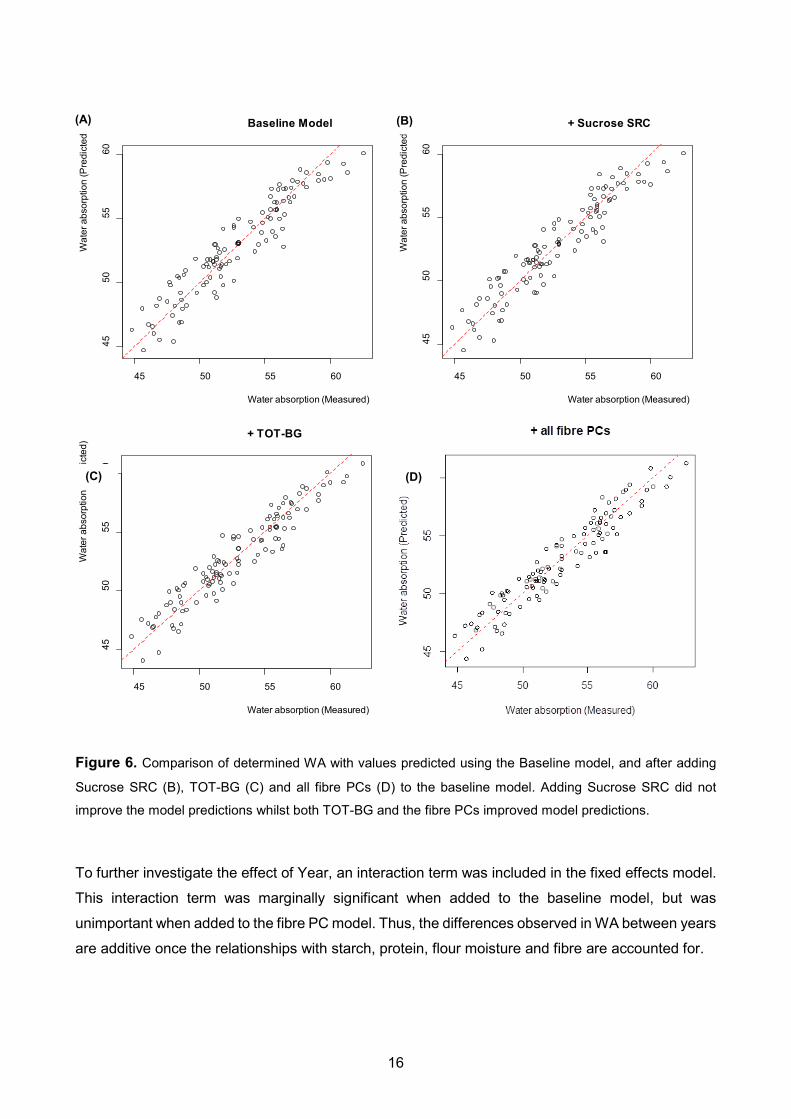
In order to determine which components are of most importance in determining WA we developed a
statistical model based upon the analytical data. Regression analysis was carried out as above
(having accounted for Year as a random effect), with the baseline model (based on the Farrand
equation) being:
WA = Starch damage + Protein + Flour Moisture.
This model was then modified by introducing either individual fibre traits or the principle components
(PCs) discussed above.
The baseline model gave an approximate percentage variance accounting for 74.9% of the variation,
therefore only traits which improved upon this %age are listed in Table 5, with plots showing the
addition of selected traits in Figure 6. The greatest improvement was achieved by adding all fibre
PCs, which improved the variance accounted for to 90.36%. However, both TOT-BG and TOT-A(X)
also gave improvements, to 84.2% and 79.9%, respectively.

15
Table 5: Regression analysis of WA, adding fibre components to the Baseline equation
Model Term Mean
square F value P value Approx. %
variance Baseline Starch damage 448.23 241.827 2.20E-16 74.91445
Protein 20.76 11.198 0.001133 Flour Moisture 36.54 19.712 2.19E-05
fibre 1 Starch damage 336.25 181.522 2.20E-16 77.79059 Protein 17.52 9.4562 0.002707 Flour Moisture 37.95 20.489 1.56E-05 WE-A:X 3.16 1.7052 0.194406 fibre 2 Starch damage 351.57 191.6235 2.20E-16 76.0267 Protein 25.34 13.8141 0.000323 Flour Moisture 38.43 20.9471 1.28E-05 Sucrose.SRC 3.94 2.1472 0.145827 fibre 3 Starch damage 419.54 225.5657 2.20E-16 79.93681 Protein 19.56 10.5168 0.001606 Flour Moisture 32.43 17.4346 6.08E-05 TOT-A(X) 3.41 1.8317 0.180315 fibre 4 Starch damage 438.86 234.7569 2.20E-16 77.06628 Protein 21.08 11.2738 0.001094 Flour Moisture 32.76 17.5234 5.84E-05 TOT-A:X 1.08 0.5793 0.448344 fibre 5 Starch damage 378.19 203.3615 2.20E-16 78.61681 Protein 18.64 10.0251 0.002051 Flour Moisture 33.68 18.1095 4.49E-05 TOT-(A)X 2.73 1.4692 0.228565 fibre 6 Starch damage 452.14 246.8569 2.20E-16 77.07794 Protein 23.58 12.8731 0.000508 Flour Moisture 32.69 17.8492 5.05E-05 WE:TOT (A)X 4.92 2.6845 0.104294 fibre 7 Starch damage 340.84 213.15 2.20E-16 84.18824 Protein 16.5 10.32 0.001811 Flour Moisture 27.26 17.049 7.25E-05 TOT-BG 31.59 19.753 2.19E-05 fibre all PC Starch damage 230.491 142.3593 2.20E-16 90.33559 Protein 26.441 16.3311 0.000107 Flour Moisture 20.947 12.9378 0.000515 fibre_PC_1 1.182 0.7298 0.431233 fibre_PC_2 16.903 10.4396 0.079864 fibre_PC_3 1.921 1.1862 0.512546 fibre_PC_4 8.593 5.307 0.065957 fibre_PC_5 8.889 5.4904 0.102056 fibre_PC_6 14.064 8.6865 0.019946 fibre_PC_7 0.764 0.4716 0.494934 fibre_PC_8 3.233 1.9965 0.161404 fibre_PC_9 1.644 1.0155 0.319889
fibre_PC_10 1.647 1.0172 0.318971
fibre PC 1+2+6 Starch damage 350.98 209.9616 2.20E-16 84.85038
Protein 23.72 14.1867 0.000282 Flour Moisture 30.07 17.989 4.82E-05 fibre_PC_1 5.66 3.3845 0.07066 fibre_PC_2 19.38 11.5922 0.00106 fibre_PC_6 14.26 8.528 0.00431
16
Figure 6. Comparison of determined WA with values predicted using the Baseline model, and after adding
Sucrose SRC (B), TOT-BG (C) and all fibre PCs (D) to the baseline model. Adding Sucrose SRC did not
improve the model predictions whilst both TOT-BG and the fibre PCs improved model predictions.
To further investigate the effect of Year, an interaction term was included in the fixed effects model.
This interaction term was marginally significant when added to the baseline model, but was
unimportant when added to the fibre PC model. Thus, the differences observed in WA between years
are additive once the relationships with starch, protein, flour moisture and fibre are accounted for.
45 50 55 60
4550
5560
Baseline Model
Water absorption (Measured)
Wat
er a
bsor
ptio
n (P
redi
cted
)
45 50 55 60
4550
5560
+ TOT-BG
Water absorption (Measured)
Wat
er a
bsor
ptio
n (P
redi
cted
)
(A)
45 50 55 60
4550
5560
+ Sucrose SRC
Water absorption (Measured)W
ater
abs
orpt
ion
(Pre
dict
ed)
(B)
(C) (D)

17
4.1.3. Conclusions
The baseline model based on the Farrand equation accounted for almost 75% of the variation in WA
between the samples and this was increased to just over 90% by adding variation in fibre
components. However, this increase was only achieved by including principal components based on
a range of fibre parameters. When considered individually, the single fibre component which resulted
in a substantial increase in the predictive power of the model was total β-glucan, which increased
the prediction to 84% when added to the baseline equation.
4.2. Comparison of doubled haploid (DH) and parental from the cross Yumai 34 x Valoris lines, differing in AX content.
The comparison of cultivars grown in different years showed that the fibre content contributed to
differences in WA. To explore this effect in more detail we compared a series of lines which had
been selected to exhibit variation in AX content in a randomly segregating genetic background.
Single samples grown in large plots were milled and subjected to analyses as in Table 3.
The full analyses of the samples are given in Appendix 2 and the data for fibre components
summarised in Figure 7. Data for selected fibre components are shown graphically in Figure 7A, B
and C.
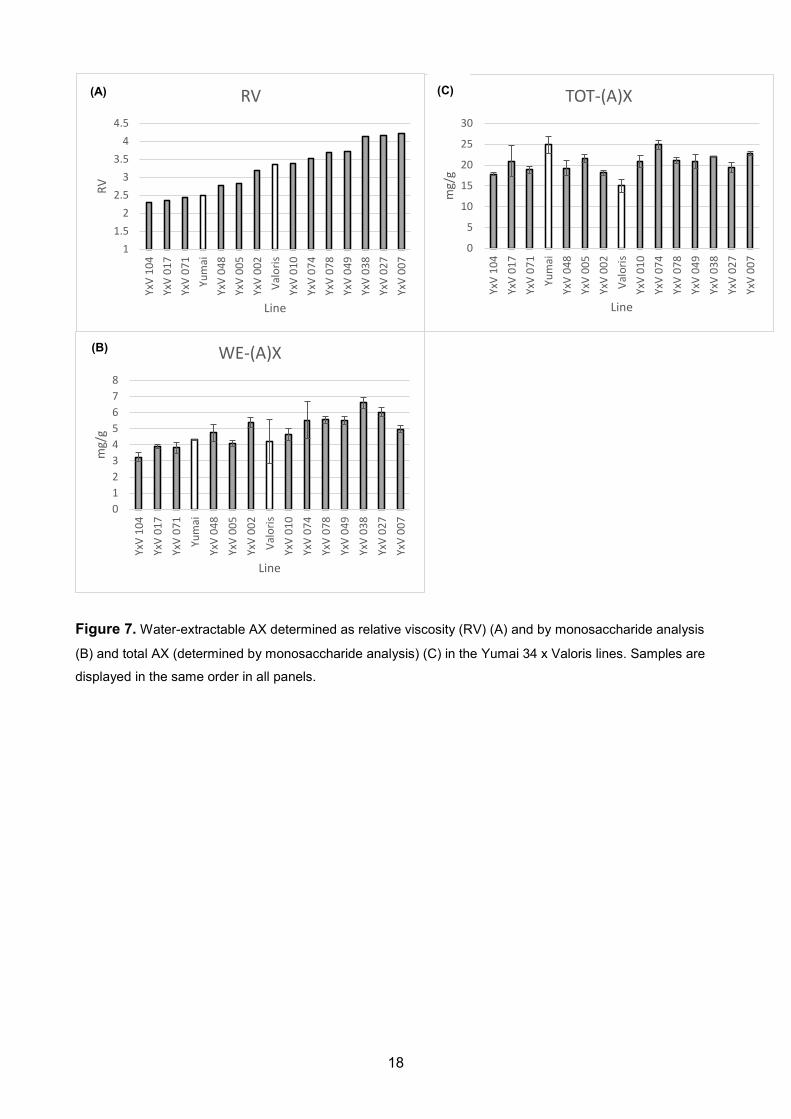
18
Figure 7. Water-extractable AX determined as relative viscosity (RV) (A) and by monosaccharide analysis
(B) and total AX (determined by monosaccharide analysis) (C) in the Yumai 34 x Valoris lines. Samples are
displayed in the same order in all panels.
0
5
10
15
20
25
30
YxV
104
YxV
017
YxV
071
Yum
aiYx
V 04
8Yx
V 00
5Yx
V 00
2Va
loris
YxV
010
YxV
074
YxV
078
YxV
049
YxV
038
YxV
027
YxV
007
mg/
g
Line
TOT-(A)X(C)
11.5
22.5
33.5
44.5
YxV
104
YxV
017
YxV
071
Yum
aiYx
V 04
8Yx
V 00
5Yx
V 00
2Va
loris
YxV
010
YxV
074
YxV
078
YxV
049
YxV
038
YxV
027
YxV
007
RV
Line
RV
012345678
YxV
104
YxV
017
YxV
071
Yum
aiYx
V 04
8Yx
V 00
5Yx
V 00
2Va
loris
YxV
010
YxV
074
YxV
078
YxV
049
YxV
038
YxV
027
YxV
007
mg/
g
Line
WE-(A)X
(A)
(B)
19
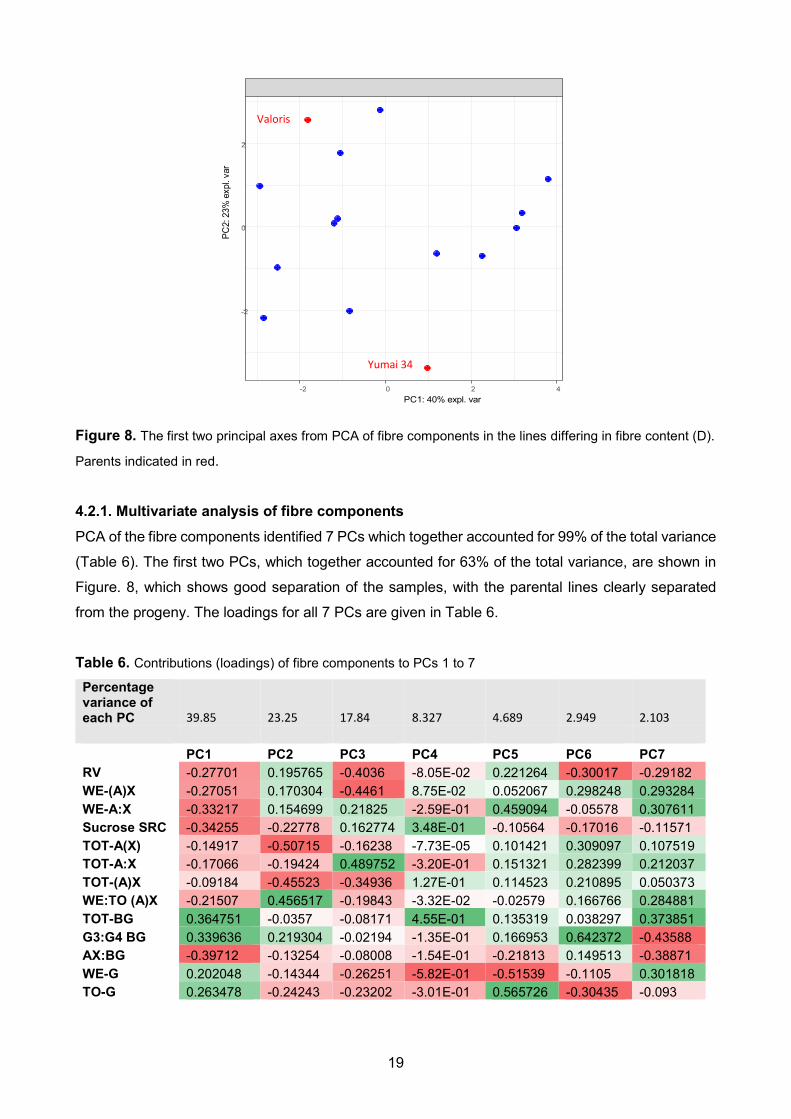
Figure 8. The first two principal axes from PCA of fibre components in the lines differing in fibre content (D).
Parents indicated in red.
4.2.1. Multivariate analysis of fibre components PCA of the fibre components identified 7 PCs which together accounted for 99% of the total variance
(Table 6). The first two PCs, which together accounted for 63% of the total variance, are shown in
Figure. 8, which shows good separation of the samples, with the parental lines clearly separated
from the progeny. The loadings for all 7 PCs are given in Table 6.
Table 6. Contributions (loadings) of fibre components to PCs 1 to 7 Percentage variance of each PC 39.85 23.25 17.84 8.327 4.689 2.949 2.103 PC1 PC2 PC3 PC4 PC5 PC6 PC7 RV -0.27701 0.195765 -0.4036 -8.05E-02 0.221264 -0.30017 -0.29182 WE-(A)X -0.27051 0.170304 -0.4461 8.75E-02 0.052067 0.298248 0.293284 WE-A:X -0.33217 0.154699 0.21825 -2.59E-01 0.459094 -0.05578 0.307611 Sucrose SRC -0.34255 -0.22778 0.162774 3.48E-01 -0.10564 -0.17016 -0.11571 TOT-A(X) -0.14917 -0.50715 -0.16238 -7.73E-05 0.101421 0.309097 0.107519 TOT-A:X -0.17066 -0.19424 0.489752 -3.20E-01 0.151321 0.282399 0.212037 TOT-(A)X -0.09184 -0.45523 -0.34936 1.27E-01 0.114523 0.210895 0.050373 WE:TO (A)X -0.21507 0.456517 -0.19843 -3.32E-02 -0.02579 0.166766 0.284881 TOT-BG 0.364751 -0.0357 -0.08171 4.55E-01 0.135319 0.038297 0.373851 G3:G4 BG 0.339636 0.219304 -0.02194 -1.35E-01 0.166953 0.642372 -0.43588 AX:BG -0.39712 -0.13254 -0.08008 -1.54E-01 -0.21813 0.149513 -0.38871 WE-G 0.202048 -0.14344 -0.26251 -5.82E-01 -0.51539 -0.1105 0.301818 TO-G 0.263478 -0.24243 -0.23202 -3.01E-01 0.565726 -0.30435 -0.093
-2 0 2 4
-2
0
2
PC1: 40% expl. var
PC2:
23%
exp
l. va
r
Valoris
Yumai 34

20
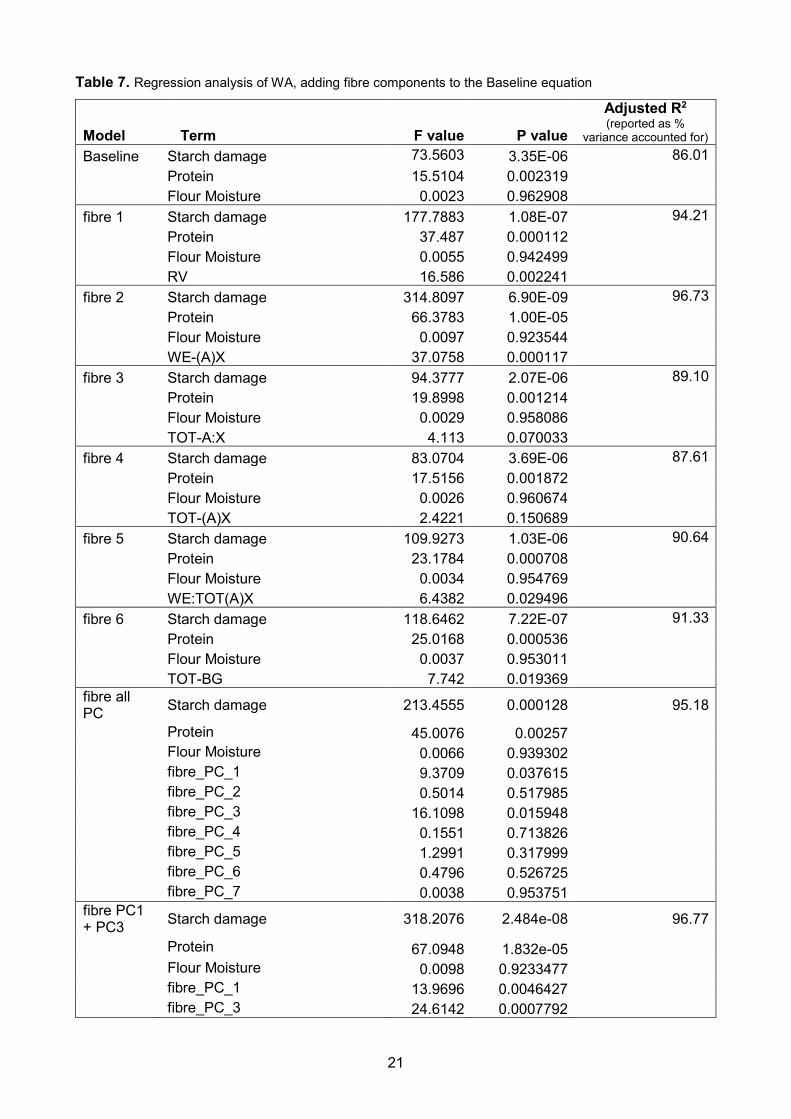
4.2.2. Regression analysis of fibre and WA. Regression analysis was carried out as above, using the same baseline model based on the Farrand
Equation:
WA = Starch damage + Protein+ Flour Moisture.
This was then modified by introducing either individual fibre traits or the PCs discussed above.
The baseline model gave an approximate percentage variance accounting for 86.01% of the
variation, so only traits which improved this are listed in Table 7, with plots of the effects of the
addition of selected traits being displayed in Figure 9.
The best improvement was achieved by adding PCs 1 and 3, which improved the variance accounted
for to 96.77%. However, both the addition of all fibre PCs, RV and WE-(A)X also gave improvements,
to 95.18, 94.21% and 96.73%, respectively. The addition of Sucrose SRC did not give any
improvement.
Figure 9. Regression analysis of WA, adding fibre components to the baseline equation.
54 56 58 60 62 64 66 68
5456
5860
6264
66
Baseline Model
Water absorption (Measured
Wat
er a
bsor
ptio
n (P
redi
cted
)
54 56 58 60 62 64 66 68
5456
5860
6264
66
+ RV
Water absorption (Measured
Wat
er a
bsor
ptio
n (P
redi
cted
)
54 56 58 60 62 64 66 68
5456
5860
6264
66
+ WE-(A)X
Water absorption (Measured
Wat
er a
bsor
ptio
n (P
redi
cted
)
54 56 58 60 62 64 66 68
5456
5860
6264
66
+ Sucrose SRC
Water absorption (Measured
Wat
er a
bsor
ptio
n (P
redi
cted
)
54 56 58 60 62 64 66 68
5456
5860
6264
66
+ all fibre PCs
Water absorption (Measured
Wat
er a
bsor
ptio
n (P
redi
cted
)
21
Table 7. Regression analysis of WA, adding fibre components to the Baseline equation
Model Term F value P value
Adjusted R2 (reported as %
variance accounted for) Baseline Starch damage 73.5603 3.35E-06 86.01 Protein 15.5104 0.002319 Flour Moisture 0.0023 0.962908 fibre 1 Starch damage 177.7883 1.08E-07 94.21 Protein 37.487 0.000112 Flour Moisture 0.0055 0.942499 RV 16.586 0.002241 fibre 2 Starch damage 314.8097 6.90E-09 96.73 Protein 66.3783 1.00E-05 Flour Moisture 0.0097 0.923544 WE-(A)X 37.0758 0.000117 fibre 3 Starch damage 94.3777 2.07E-06 89.10 Protein 19.8998 0.001214 Flour Moisture 0.0029 0.958086 TOT-A:X 4.113 0.070033 fibre 4 Starch damage 83.0704 3.69E-06 87.61 Protein 17.5156 0.001872 Flour Moisture 0.0026 0.960674 TOT-(A)X 2.4221 0.150689 fibre 5 Starch damage 109.9273 1.03E-06 90.64 Protein 23.1784 0.000708 Flour Moisture 0.0034 0.954769 WE:TOT(A)X 6.4382 0.029496 fibre 6 Starch damage 118.6462 7.22E-07 91.33 Protein 25.0168 0.000536 Flour Moisture 0.0037 0.953011 TOT-BG 7.742 0.019369 fibre all PC Starch damage 213.4555 0.000128 95.18
Protein 45.0076 0.00257 Flour Moisture 0.0066 0.939302 fibre_PC_1 9.3709 0.037615 fibre_PC_2 0.5014 0.517985 fibre_PC_3 16.1098 0.015948 fibre_PC_4 0.1551 0.713826 fibre_PC_5 1.2991 0.317999 fibre_PC_6 0.4796 0.526725 fibre_PC_7 0.0038 0.953751 fibre PC1 + PC3 Starch damage 318.2076 2.484e-08 96.77
Protein 67.0948 1.832e-05 Flour Moisture 0.0098 0.9233477 fibre_PC_1 13.9696 0.0046427 fibre_PC_3 24.6142 0.0007792
22
4.2.3. Conclusions The baseline model based on the Farrand equation accounted for 86% of the variance in WA in the
samples, which was increased to 96.77% by the addition of two PCs for variation in fibre traits.
However, improvements were also achieved by adding variation in single traits related to fibre
content and properties, and particularly soluble fibre: to 96.7% by adding WE-AX (determined as
xylose) and 94.2% by adding RV. RV is the relative viscosity of aqueous extracts and is largely
determined by water-soluble fibre, notably WE-AX. WE-β-glucan would also be expected to
contribute to RV as soluble forms of β-glucan from barley and oats are known to form highly viscous
solutions (Lazaridou and Biliaderis, 2007). However, β-glucan is a relatively minor component in
wheat flour and its solubility is low (with about 10% of the total being soluble (Nemeth et al., 2010)).
Nevertheless, the addition of the ratio of total AX:BG resulted in some improvement of the prediction,
to 91.3%, and β-glucan is also a component of PC1. This indicates that soluble β-glucan may also
contribute, though it appears less important in this population than in the cultivars described
previously.
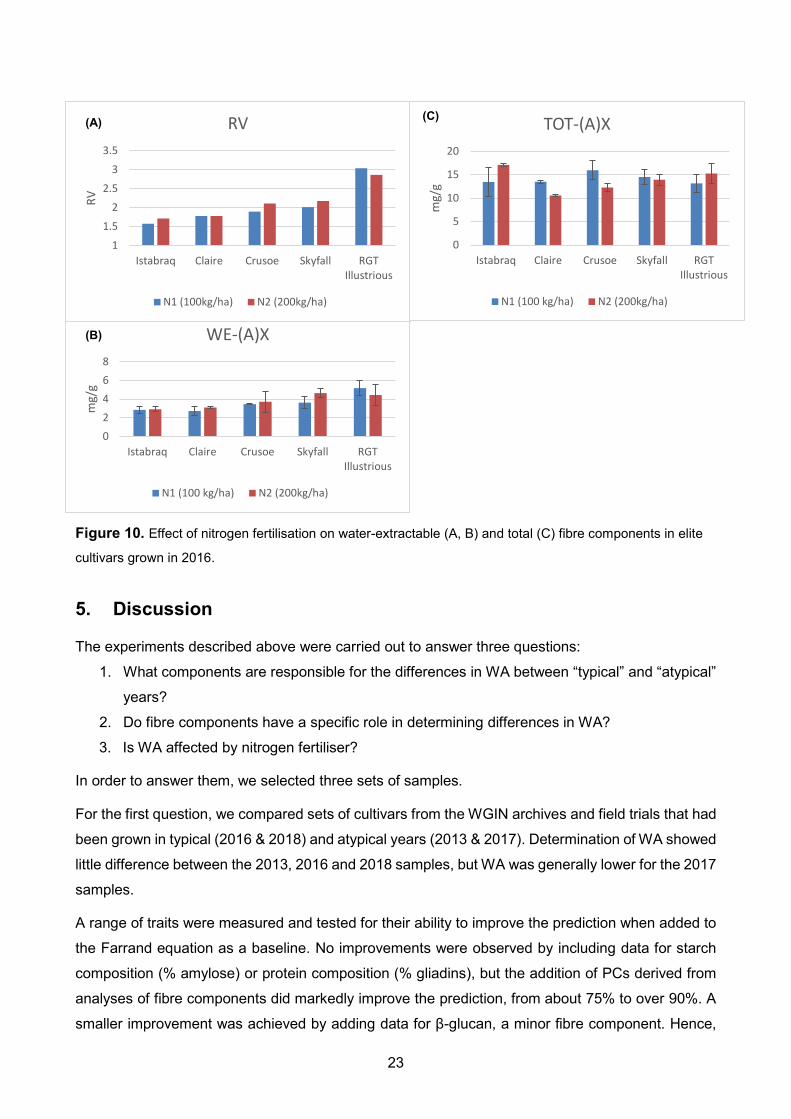
4.3. Effect of nitrogen fertilisation on WA and AX content
Five modern wheat cultivars were grown in three replicate plots at Rothamsted in 2016, with 100
and 200 kg N/ ha. Triplicate plots were combined prior to milling. Fibre analyses were performed on
flour samples showing little effect of nitrogen fertilisation on relative viscosity (RV), which is a
measure of WE-AX, or TOT-AX (Figure 10). A two-sample t-test utilising the single rep cultivars as
replicates of the nitrogen treatment (n=5), showed there was insufficient evidence to suggest a
difference in WA due to nitrogen treatment (p=0.105). (t-test analysis is shown in annex **)
23
Figure 10. Effect of nitrogen fertilisation on water-extractable (A, B) and total (C) fibre components in elite
cultivars grown in 2016.
5. Discussion
The experiments described above were carried out to answer three questions:
1. What components are responsible for the differences in WA between “typical” and “atypical”
years?
2. Do fibre components have a specific role in determining differences in WA?
3. Is WA affected by nitrogen fertiliser?
In order to answer them, we selected three sets of samples.
For the first question, we compared sets of cultivars from the WGIN archives and field trials that had
been grown in typical (2016 & 2018) and atypical years (2013 & 2017). Determination of WA showed
little difference between the 2013, 2016 and 2018 samples, but WA was generally lower for the 2017
samples.
A range of traits were measured and tested for their ability to improve the prediction when added to
the Farrand equation as a baseline. No improvements were observed by including data for starch
composition (% amylose) or protein composition (% gliadins), but the addition of PCs derived from
analyses of fibre components did markedly improve the prediction, from about 75% to over 90%. A
smaller improvement was achieved by adding data for β-glucan, a minor fibre component. Hence,
02468
Istabraq Claire Crusoe Skyfall RGTIllustrious
mg/
g
WE-(A)X
N1 (100 kg/ha) N2 (200kg/ha)
1
1.5
2
2.5
3
3.5
Istabraq Claire Crusoe Skyfall RGTIllustrious
RV
RV
N1 (100kg/ha) N2 (200kg/ha)
0
5
10
15
20
Istabraq Claire Crusoe Skyfall RGTIllustrious
mg/
g
TOT-(A)X
N1 (100 kg/ha) N2 (200kg/ha)
(A)
(B)
(C)

24
although it can be concluded that fibre components were the major contributor to the differences in
WA between the samples, it was not possible to identify a single component which could form the
basis for a simple analytical test in a non-specialist laboratory.
Comparison of a smaller set of the WGIN cultivars grown at 100 and 200 kg N/Ha in 2016 showed
no significant differences in WA related to nitrogen fertilisation, answering question 3.
In order to answer the second question, we used a series of near-isogenic lines selected to vary in
their content of arabinoxylan fibre in flour. These lines are genetically related, with backgrounds
derived from the cultivar used for the cross: Yumai 34 (Chinese) and Valoris (French). The related
genetic background of the lines may have accounted for the fact that the baseline model accounted
for a higher proportion of the total variance in WA than in the first study, 86% compared to 75%.
Improvements were again achieved by adding PCs related to fibre content, to over 96%, but also by
adding two single traits related to soluble fibre: soluble arabinoxylan (to 96.7%) and relative viscosity
of aqueous extracts (to 94.2%).
The results, therefore, demonstrate that fibre components contribute to a substantial extent to the
variation in WA between grain samples between different years. Furthermore, the comparison of
lines differing in arabinoxylan amount and composition indicate a specific role for soluble fibre. This
provides the basis for further studies in which simpler analytical procedures (for soluble AX and RV)
could be used to determine the validity of these observations on larger sample sets, which could
lead to predictive tests suitable for use by millers.
Acknowledgements Rothamsted Research receives grant-aided support from the Biotechnology and Biological Sciences
Research Council (BBSRC) of the UK and the work forms part of the Designing Future Wheat
strategic programme (BB/P016855/1). Grain samples were kindly provided by the defra Wheat
Genetic Improvement Network (WGIN).
6. References
AACC International. Approved Methods of Analysis, 11th Ed. Method 56-11.02. Solvent Retention
Capacity. Approved June 3, 2009. AACC International., St. Paul, MN, USA
http://dx.doi.org/10.1094/AACCintMethod-56-11-02.
Barraclough PB, Howarth JR, Jones J, Lopez-Bellido R, Parmar S, Shepherd CE, Hawkesford MJ
(2010) Nitrogen efficiency of wheat: genotypic and environmental variation and prospects for
improvement. Eur. J. Agron., 33, 1-11.
Belderok B (1973) Properties of damaged starch granules. Getreide Mehl Brot, 27, 9-13.

25
Bromley JR, Busse-Wicher M, Tryfona T, Mortimer JC, Zhang ZN, Brown DM, Dupree P (2013)
GUX1 and GUX2 glucuronyltransferases decorate distinct domains of glucuronoxylan with different
substitution patterns. Plant Journal 74, 423-434.
Brooks A, Jenner CF, Aspinall D (1982) Effects of water deficit on endosperm starch granules and
on grain physiology of wheat and barley. Aust. J. Plant Physiol., 9, 423-436.
Dodds NJH (1972) Methods for the measurement of water absorption for the Chorleywood Bread
process. FMBRA Bulletin, No. 5, 165-167.
Farrand EA (1969) Starch Damage and Alpha-Amylase as Bases for Mathematical Models Relating
to Flour Water- Absorption. Cereal Chem. 46, 103-116.
Finnie S and Atwell WA “Composition of Commercial Flour” Wheat Flour, 2nd edition, AACC
International., Inc., 2016, pp. 31–41.
Freeman J, Lovegrove A, Wilkinson MD, Saulnier L, Shewry PR, Mitchell RAC (2016) Effect of
suppression of arabinoxylan synthetic genes in wheat endosperm on chain length of arabinoxylan
and extract viscosity. Plant Biotechnol. J., 14, 109-116.
Freeman J, Ward JL, Kosik O, Lovegrove A, Wilkinson MD, Shewry PR, Mitchell RAC (2017)
Feruloylation and structure of arabinoxylan in wheat endosperm cell walls from RNAi lines with
suppression of genes responsible for backbone synthesis and decoration. Plant Biotechnol. J.,
10.1111/pbi.12727.
Gaines CS (2004) Prediction of sugar snap cookie diameter using sucrose retention capacity, milling
softness, and flour protein content. Cereal Chem., 81, 549-552.
Gebruers K, Dornez E, Boros D, Fras A, Dynkowska W, Bedo Z, Rakszegi M, Delcour JA, Courtin
CM (2008), Variation in the content of dietary fiber and components thereof in wheats in the
HEALTHGRAIN diversity screen. J. Agric. Food Chem., 56, 9740-9749.
Greer EN, Stewart BA (1959) The water absorption of wheat flour: relative effects of protein and
starch. J. Sci. Food Agric., 10, 248-252.
Guzmán C, Posadas-Romano G, Hernández-Espinosa N, Morales-Dorantes A, Peña RJ (2015) A
new standard water absorption criteria based on solvent retention capacity (SRC) to determine
dough mixing properties, viscoelasticity, and bread-making quality. J. Cereal Sci., 66, 59–65.
ICC. 129 Method for the Determination of Vitreousness in Durum Wheat. Approved 1980.
https://www.icc.or.at/publications/icc-standards/standards-overview/129-method-for-the-
determination-of-the-vitreousness-of-durum-wheat
Kent and Evers 1994; Kent’s Technology of Cereals. 4th ed. Woodhead Publishing, 334pp.
26
Kindred DR, Verhoeven TMO, Weightman RM, Swanston JS, Agu RC, Brosnan JM, Sylvester-
Bradley R (2008) Effects of variety and fertiliser nitrogen on alcohol yield, grain yield, starch and
protein content, and protein composition of winter wheat. J. Cereal Sci. 48, 46-57.
Lazaridou A, Biliaderis CG (2007) Molecular aspects of cereal b-glucan functionality: physical
properties, technological applications and physiological effects. J. Cereal Sci. 46, 101–11.
Loosveld A, Maes C, van Casteren WHM, Schols HA, Grobet PJ, Delcour JA (1998) Structural
Variation and Levels of Water-Extractable Arabinogalactan-Peptide in European Wheat Flours.
Cereal Chem., 75, 815–819.
Loosveld A-MA, Grobet PJ, Delcour JA (1997) Contents and Structural Features of Water-
Extractable Arabinogalactan in Wheat Flour Fractions. J. Ag. Food Chem., 45, 1998–2002.
Mares DJ, Stone BA (1973) Studies on wheat endosperm. I. Chemical composition and ultrastructure
of the cell walls, Aus. J. Biol. Sci., 26, 793-812.
McCleary BV, Gibson TS, Allen H, Gams TC (1986) Enzymic hydrolysis and industrial importance
of barley β‐glucans and wheat flour pentosans. Starch, 38, 433-437.
Nemeth C, Freeman J, Jones HD, Sparks C, Pellny TK, Wilkinson MD, Dunwell J, Andersson AAM,
Aman P, Guillon F, Saulnier L, Mitchell RAC, Shewry PR (2010) Down-Regulation of the CSLF6
Gene Results in Decreased (1,3;1,4)-beta-D-Glucan in Endosperm of Wheat. Plant Physiol., 152,
1209-1218.
Rakszegi M, Balázs G, Békés F, Harasztos A, Kovács A, Láng L, Bedő Z, Tömösközi S (2014)
Modelling water absorption of wheat flour by taking into consideration of the soluble protein and
arabinoxylan components Cer. Res. Commun., 42, 629-639.
Sasaki T, Matsuki J (1998) Effect of Wheat Starch Structure on Swelling Power. Cereal Chem., 75,
525-529.
Shewry PR, Piironen V, Lampi A-M, Edelmann M, Kariluoto S, Nurmi T, Fernandez-Orozco R, Ravel
C, Charmet G, Andersson AAM, Åman P, Boros D, Gebruers K, Dornez E, Courtin CM, Delcour JA,
Rakszegi M, Bedo Z, Ward JL (2010) The HEALTHGRAIN wheat diversity screen: effects of
genotype and environment on phytochemicals and dietary fiber components, J. Agric. Food Chem.,
58, 9291-9298.
Slade L, Levine H (1994) Structure-function relationships of cookie and cracker ingredients, in:
Faridi, H. (Ed.), The Science of Cookie and Cracker Production. Chapman & Hall, New York., pp.
23–141.
Stevens DJ, Stewart BA (1982) Factors affecting the water absorption of flour. FMBRA Bulletin No.
3 103-105.

27
Tipples KH, Meredith JO, Holas J (1978) Factors affecting farinograph and baking absorption. II.
Relative influence of flour components. Cereal Chem., 55, 652–660.
Tryfona T, Liang H-C, Kotake T, Kaneko S, Marsh J, Ichinose H, Lovegrove A, Tsumuraya Y, Shewry
PR, Stephens E, Dupree P (2010) Carbohydrate Structural Analysis of Wheat Flour Arabinogalactan
Protein. Carbohydrate Res., 345, 2648–2656.
Van den Bulck K, Loosveld A-MA, Courtin CM, Proost P, Van Damme J, Robben J, Mort A, Delcour
JA (2002) Amino Acid Sequence of Wheat Flour Arabinogalactan-Peptide, Identical to Part of Grain
Softness Protein GSP-1, Leads to Improved Structural Model. Cereal Chem., 79, 329–331.
Viswanathan C, Khanna-Chopra R (2001) Effect of Heat Stress on Grain Growth, Starch Synthesis
and Protein Synthesis in Grains of Wheat (Triticum aestivum L.) Varieties Differing in Grain Weight
Stability J. Agron. Crop Sci., 186, 1-7.
Wilkinson MD, Tosi P, Lovegrove A, Corol DI, Ward, JL, Palmer R, Powers S, Passmore D, Webster
G, Marcus SE (2017) The Gsp-1 Genes Encode the Wheat Arabinogalactan Peptide. J. Cereal Sci.,
74, 155–164.