project risk management · sourcing materials, plant and labor ... demonstrate capability and...
TRANSCRIPT
PROJECT RISK MANAGEMENT
2
Table of Contents INTRODUCTION ................................................................................................ 5
WHAT IS RISK? ............................................................................. 5
Project Risk Management ............................................................... 8
When is project risk management used? ..................................... 9
Risk Management Framework ..................................................... 11
Stakeholder identification and analysis ....................................... 12
Differences in Personal Risk Attitude ........................................................ 17
Project Management Interface ..................................................... 18
• Project Scope Statement ...................................................................... 18
• Cost Management Plan ....................................................................... 19
• Schedule Management Plan ................................................................ 20
• Communication Management Plan ..................................................... 20
• Enterprise Environmental Factors ....................................................... 21
• Organizational Process Assets ............................................................ 22
• Work Breakdown Structure ................................................................. 23
• Activity Cost Estimate ........................................................................ 24
• Activity Duration Estimate ................................................................. 26
• Stakeholder Register ........................................................................... 27
• Quality Management Plan ................................................................... 27
• Work Performance Information .......................................................... 29
• Performance Reports ........................................................................... 30
PLAN RISK MANAGEMENT .......................................................................... 32
Planning meetings & analysis ..................................................................... 32
Risk management plan ................................................................................ 32
RISK IDENTIFICATION .................................................................................. 36
Identification participants ........................................................................... 36
Information gathering techniques ............................................................... 37
Other identification techniques ................................................................... 42
3
Risk Register ................................................................................... 43
Risk Documentation ...................................................................... 44
Risk Responsibility ........................................................................ 45
Information Source ........................................................................ 45
Risk Allocation in Contracting ..................................................... 46
Known and Unknown Risks in Contracts ................................................... 47
Financial Risks ............................................................................... 49
Types of Financial Risks ............................................................................. 49
Financial Risk in Concession Contracts ..................................................... 51
Global and Elemental Risks In Concession Contracts ............................... 52
QUALITATIVE ANALYSIS ............................................................................. 55
Qualitative Risk Assessment....................................................................... 55
Review of Project Schedules and Budgets ................................................. 55
The Risk Log/Register ................................................................................ 57
Risk probability & impact assessment ........................................................ 58
Probability ................................................................................................... 58
Impact .......................................................................................................... 58
Risk Probability and Impact Rating Matrix ................................................ 59
Risk Evaluation .............................................................................. 62
Inherent risk ................................................................................................ 62
Risk data quality assessment ....................................................................... 62
Risk urgency assessment ............................................................................. 63
RISK QUANTIFICATION ................................................................................ 65
Risk Quantitative Analysis ............................................................ 66
General Approach .......................................................................... 67
Application ...................................................................................... 68
Utility Theory .............................................................................................. 70
Perform Quantitative Risk Management .................................... 72
Data gathering & representation techniques ............................................... 72
SENSITIVITY ANALYSIS .......................................................... 73
4
EXPECTED MONETARY VALUE ............................................ 75
Decision tree ............................................................................................... 77
SIMULATION ............................................................................... 79
THE RISK PREMIUM ................................................................. 86
RISK-ADJUSTED DISCOUNT RATE ....................................... 87
CERTAINTY, RISK, AND UNCERTAINTY ............................ 88
Decision Making Under Certainty .............................................................. 88
Decision Making Under Risk...................................................................... 88
Decision Making Under Uncertainty .......................................................... 90
SCENARIO ANALYSIS ............................................................... 93
RISK RESPONSE............................................................................................... 94
Strategies for Negative Risks or Threats ..................................... 95
Avoidance ................................................................................................... 95
Mitigation .................................................................................................... 97
Transference ................................................................................................ 98
Acceptance .................................................................................................. 99
Strategies for Positive Risks or Opportunities ..........................101
Exploit ....................................................................................................... 101
Share .......................................................................................................... 101
Enhance ..................................................................................................... 101
Contingent response strategies .................................................................. 101
Contractual Risk Allocation Strategies ..................................................... 104
RISK CONTROL .............................................................................................. 105
Communication and reporting ...................................................107
Fault Trees ......................................................................................................... 109
5
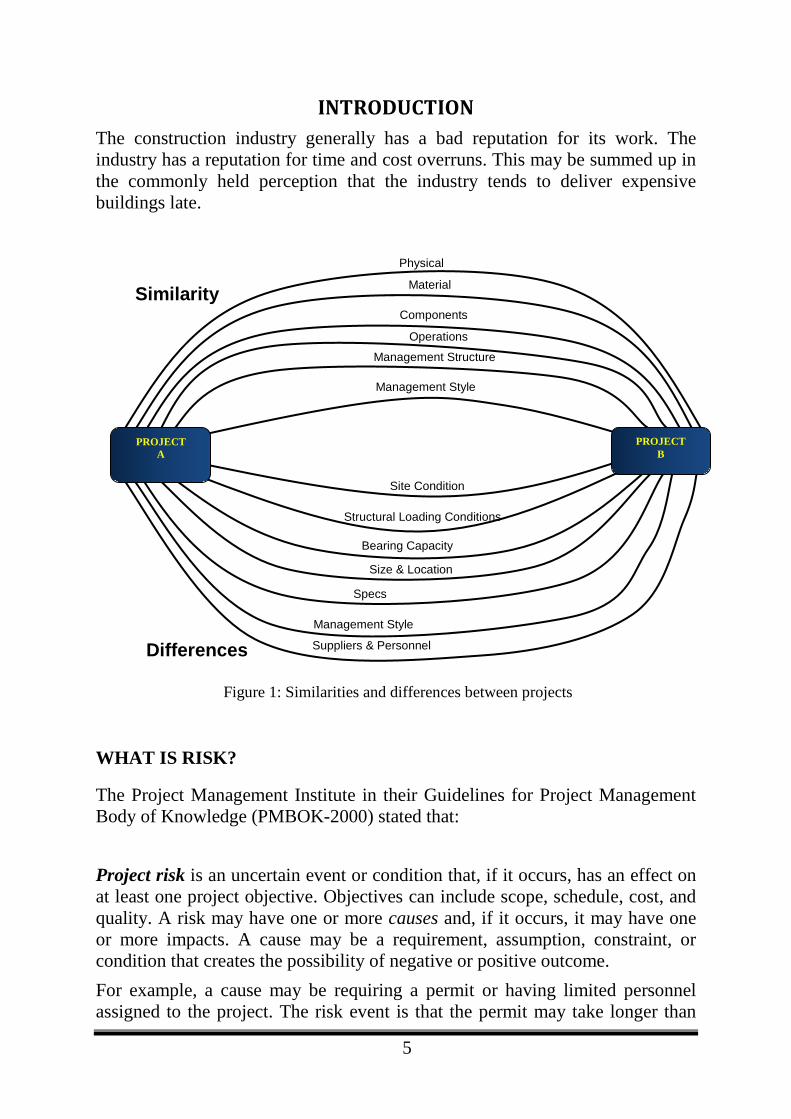
INTRODUCTION The construction industry generally has a bad reputation for its work. The industry has a reputation for time and cost overruns. This may be summed up in the commonly held perception that the industry tends to deliver expensive buildings late.
Figure 1: Similarities and differences between projects
WHAT IS RISK?
The Project Management Institute in their Guidelines for Project Management Body of Knowledge (PMBOK-2000) stated that: Project risk is an uncertain event or condition that, if it occurs, has an effect on at least one project objective. Objectives can include scope, schedule, cost, and quality. A risk may have one or more causes and, if it occurs, it may have one or more impacts. A cause may be a requirement, assumption, constraint, or condition that creates the possibility of negative or positive outcome. For example, a cause may be requiring a permit or having limited personnel assigned to the project. The risk event is that the permit may take longer than
Material
Components
Operations
Management Structure
Management Style
Site Condition
Structural Loading Conditions
Bearing Capacity
Size & Location
Specs
Management Style
Suppliers & Personnel
Physical l t
Differences
Similarity
PROJECT B
PROJECT A
6
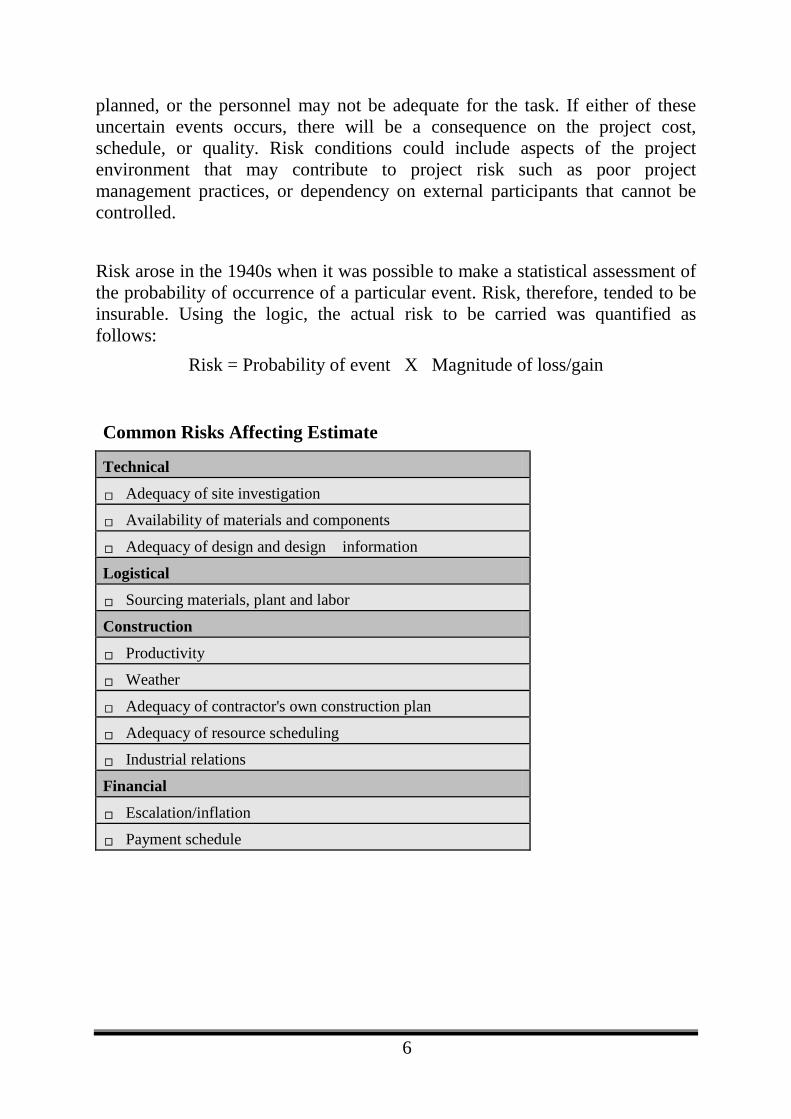
planned, or the personnel may not be adequate for the task. If either of these uncertain events occurs, there will be a consequence on the project cost, schedule, or quality. Risk conditions could include aspects of the project environment that may contribute to project risk such as poor project management practices, or dependency on external participants that cannot be controlled. Risk arose in the 1940s when it was possible to make a statistical assessment of the probability of occurrence of a particular event. Risk, therefore, tended to be insurable. Using the logic, the actual risk to be carried was quantified as follows:
Risk = Probability of event X Magnitude of loss/gain
Common Risks Affecting Estimate
Technical
Adequacy of site investigation
Availability of materials and components
Adequacy of design and design information
Logistical
Sourcing materials, plant and labor
Construction
Productivity
Weather
Adequacy of contractor's own construction plan
Adequacy of resource scheduling
Industrial relations
Financial
Escalation/inflation
Payment schedule
7
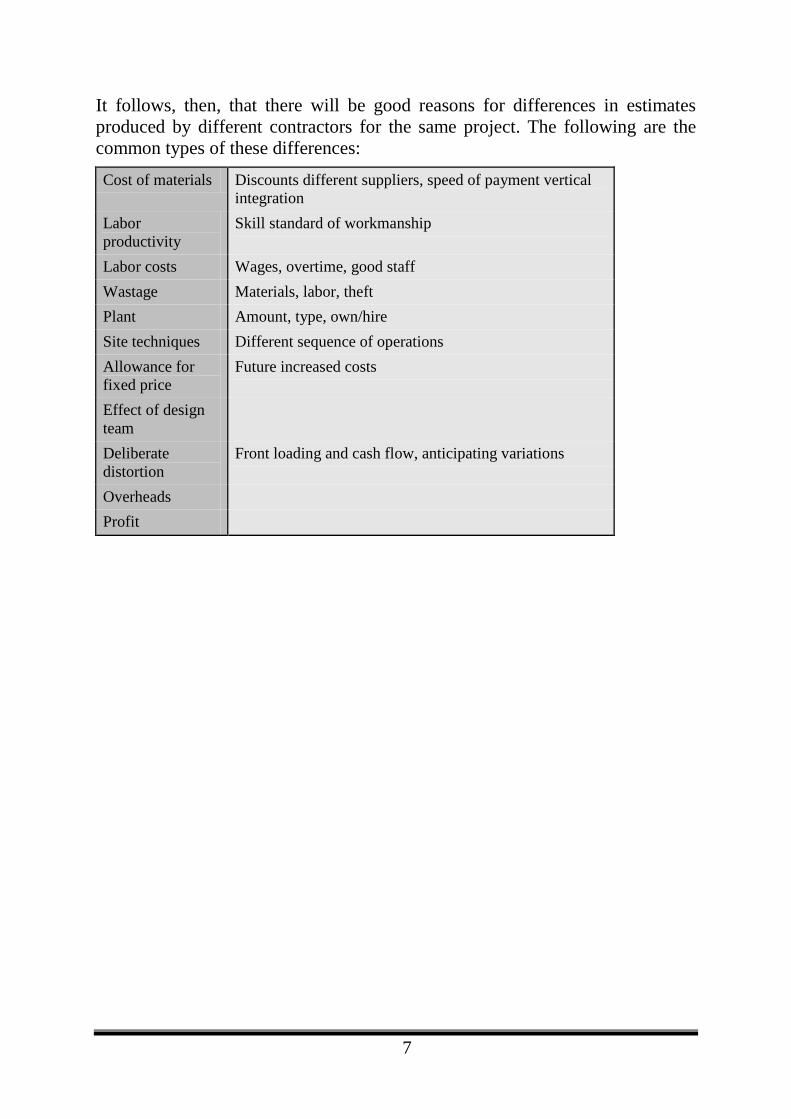
It follows, then, that there will be good reasons for differences in estimates produced by different contractors for the same project. The following are the common types of these differences:
Cost of materials Discounts different suppliers, speed of payment vertical integration
Labor productivity
Skill standard of workmanship
Labor costs Wages, overtime, good staff Wastage Materials, labor, theft Plant Amount, type, own/hire Site techniques Different sequence of operations Allowance for fixed price
Future increased costs
Effect of design team
Deliberate distortion
Front loading and cash flow, anticipating variations
Overheads Profit
8
Project Risk Management
The purpose of project risk management is to minimize the risks of not achieving the objectives of the project and the stakeholders with an interest in it, and to identify and take advantage of opportunities. In particular, risk management assists project managers in setting priorities, allocating resources and implementing actions and processes that reduce the risk of the project not achieving its objectives. There are three keys to managing project and procurement risk effectively:
1. identifying, analyzing and assessing risks early and systematically, and developing plans for handling them;
2. allocating responsibility to the party best placed to manage risks, which may involve implementing new practices, procedures or systems or negotiating suitable contractual arrangements; and
3. ensuring that the costs incurred in reducing risks are commensurate with the importance of the project and the risks involved.
The scope of risk management for projects includes: 1. Business risks include all those risks that might impact on the viability of
the enterprise, including market, industry, technology, economic and financial factors, government and political influences.
2. Project risk includes all those risks that might impact on the cost, schedule or quality of the project.
3. Operations and processing risks include all those risks that might impact on the design, procurement, construction, commissioning, operations and maintenance activities, including major hazards and catastrophic events.
9
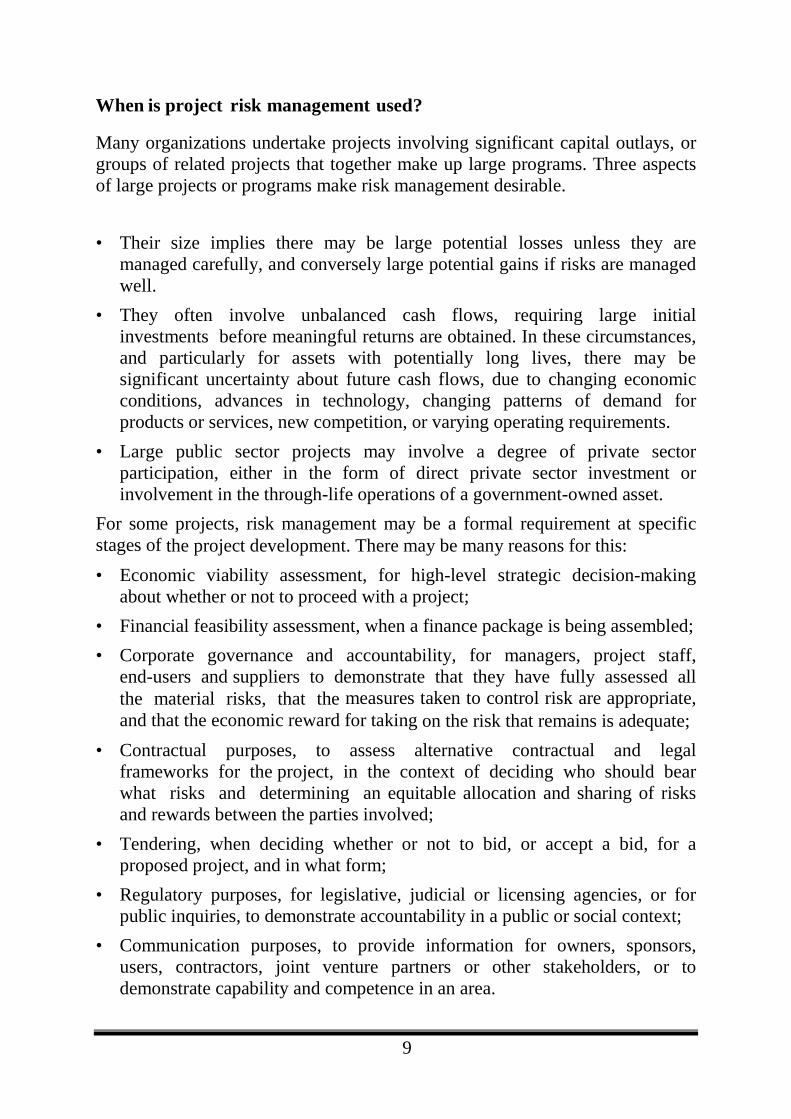
When is project risk management used?
Many organizations undertake projects involving significant capital outlays, or groups of related projects that together make up large programs. Three aspects of large projects or programs make risk management desirable.
• Their size implies there may be large potential losses unless they are managed carefully, and conversely large potential gains if risks are managed well.
• They often involve unbalanced cash flows, requiring large initial investments before meaningful returns are obtained. In these circumstances, and particularly for assets with potentially long lives, there may be significant uncertainty about future cash flows, due to changing economic conditions, advances in technology, changing patterns of demand for products or services, new competition, or varying operating requirements.
• Large public sector projects may involve a degree of private sector participation, either in the form of direct private sector investment or involvement in the through-life operations of a government-owned asset.
For some projects, risk management may be a formal requirement at specific stages of the project development. There may be many reasons for this: • Economic viability assessment, for high-level strategic decision-making
about whether or not to proceed with a project; • Financial feasibility assessment, when a finance package is being assembled; • Corporate governance and accountability, for managers, project staff,
end-users and suppliers to demonstrate that they have fully assessed all the material risks, that the measures taken to control risk are appropriate, and that the economic reward for taking on the risk that remains is adequate;
• Contractual purposes, to assess alternative contractual and legal frameworks for the project, in the context of deciding who should bear what risks and determining an equitable allocation and sharing of risks and rewards between the parties involved;
• Tendering, when deciding whether or not to bid, or accept a bid, for a proposed project, and in what form;
• Regulatory purposes, for legislative, judicial or licensing agencies, or for public inquiries, to demonstrate accountability in a public or social context;
• Communication purposes, to provide information for owners, sponsors, users, contractors, joint venture partners or other stakeholders, or to demonstrate capability and competence in an area.
10
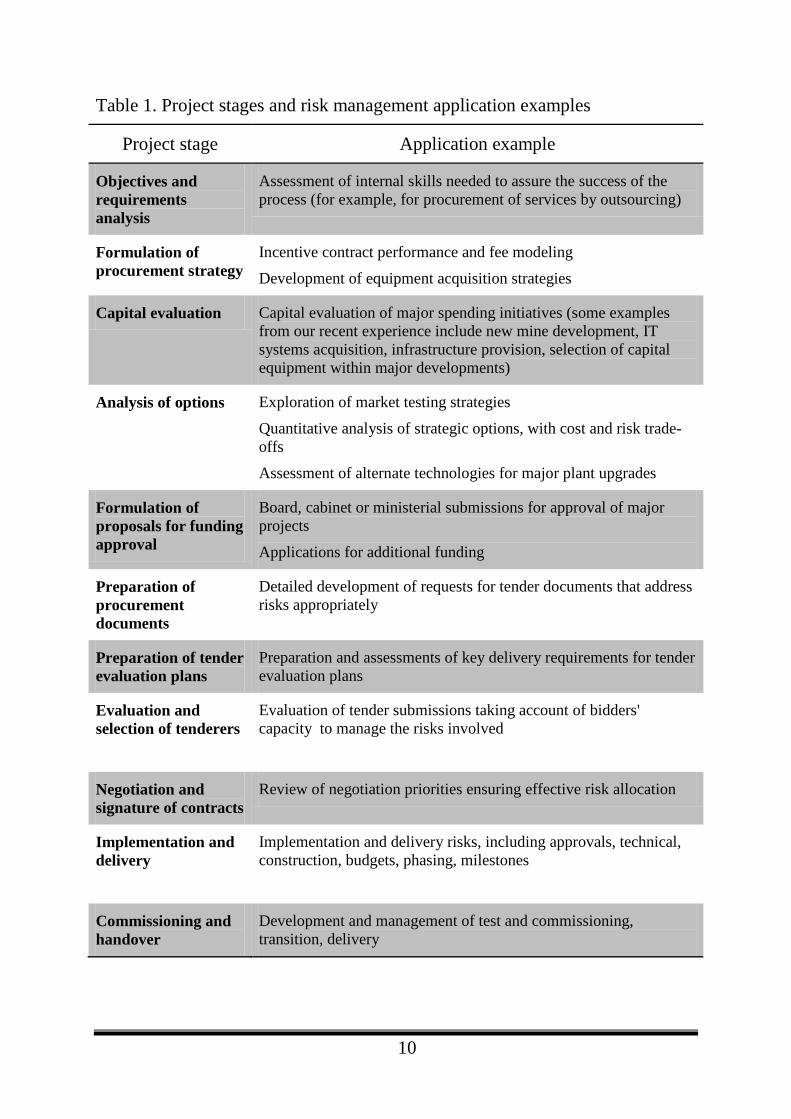
Table 1. Project stages and risk management application examples
Project stage Application example
Objectives and requirements analysis
Assessment of internal skills needed to assure the success of the process (for example, for procurement of services by outsourcing)
Formulation of procurement strategy
Incentive contract performance and fee modeling
Development of equipment acquisition strategies
Capital evaluation Capital evaluation of major spending initiatives (some examples from our recent experience include new mine development, IT systems acquisition, infrastructure provision, selection of capital equipment within major developments)
Analysis of options Exploration of market testing strategies
Quantitative analysis of strategic options, with cost and risk trade-offs
Assessment of alternate technologies for major plant upgrades
Formulation of proposals for funding approval
Board, cabinet or ministerial submissions for approval of major projects
Applications for additional funding
Preparation of procurement documents
Detailed development of requests for tender documents that address risks appropriately
Preparation of tender evaluation plans
Preparation and assessments of key delivery requirements for tender evaluation plans
Evaluation and selection of tenderers
Evaluation of tender submissions taking account of bidders' capacity to manage the risks involved
Negotiation and signature of contracts
Review of negotiation priorities ensuring effective risk allocation
Implementation and delivery
Implementation and delivery risks, including approvals, technical, construction, budgets, phasing, milestones
Commissioning and handover
Development and management of test and commissioning, transition, delivery
11
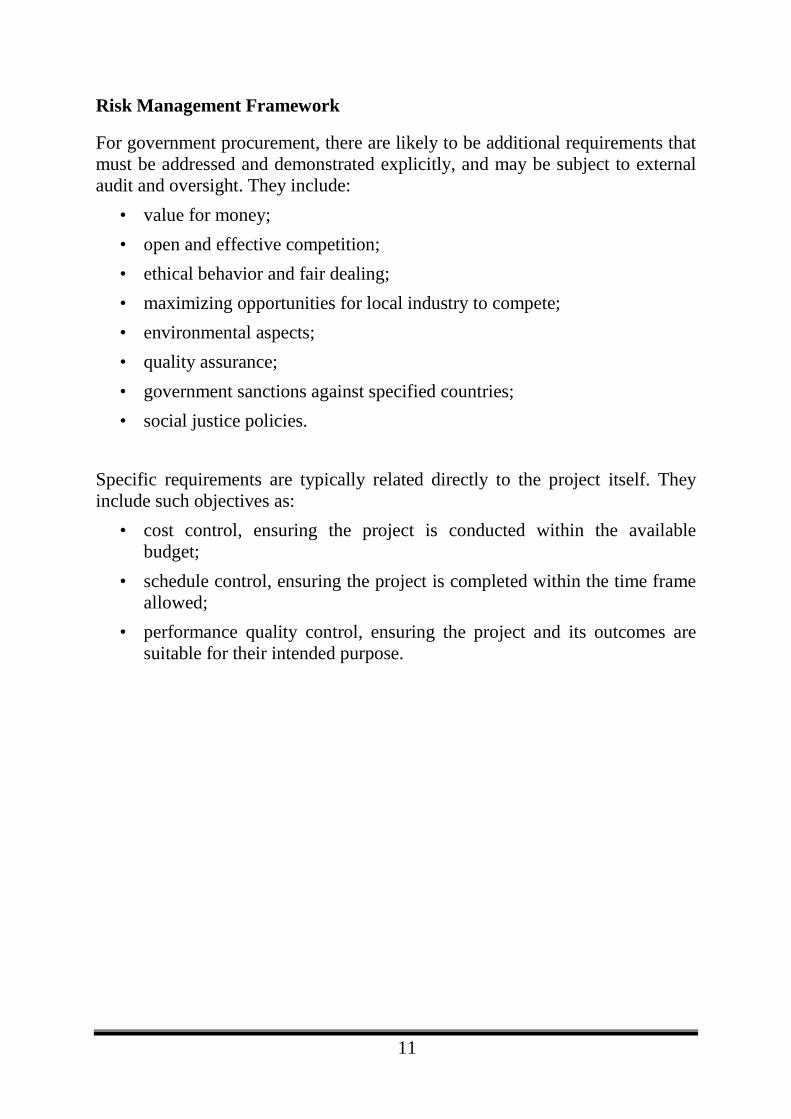
Risk Management Framework
For government procurement, there are likely to be additional requirements that must be addressed and demonstrated explicitly, and may be subject to external audit and oversight. They include:
• value for money; • open and effective competition; • ethical behavior and fair dealing; • maximizing opportunities for local industry to compete; • environmental aspects; • quality assurance; • government sanctions against specified countries; • social justice policies.
Specific requirements are typically related directly to the project itself. They include such objectives as:
• cost control, ensuring the project is conducted within the available budget;
• schedule control, ensuring the project is completed within the time frame allowed;
• performance quality control, ensuring the project and its outcomes are suitable for their intended purpose.
12
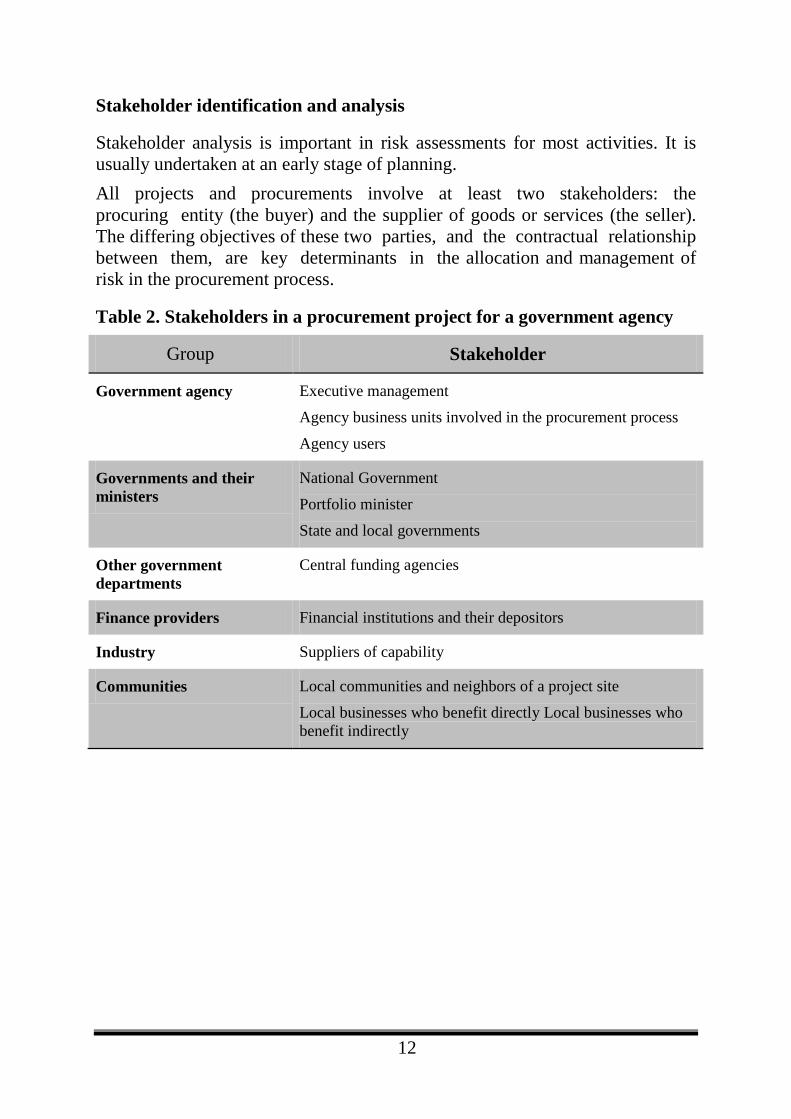
Stakeholder identification and analysis
Stakeholder analysis is important in risk assessments for most activities. It is usually undertaken at an early stage of planning. All projects and procurements involve at least two stakeholders: the procuring entity (the buyer) and the supplier of goods or services (the seller). The differing objectives of these two parties, and the contractual relationship between them, are key determinants in the allocation and management of risk in the procurement process.
Table 2. Stakeholders in a procurement project for a government agency
Group Stakeholder
Government agency Executive management
Agency business units involved in the procurement process
Agency users
Governments and their ministers
National Government
Portfolio minister
State and local governments
Other government departments
Central funding agencies
Finance providers Financial institutions and their depositors
Industry Suppliers of capability
Communities Local communities and neighbors of a project site
Local businesses who benefit directly Local businesses who benefit indirectly
13
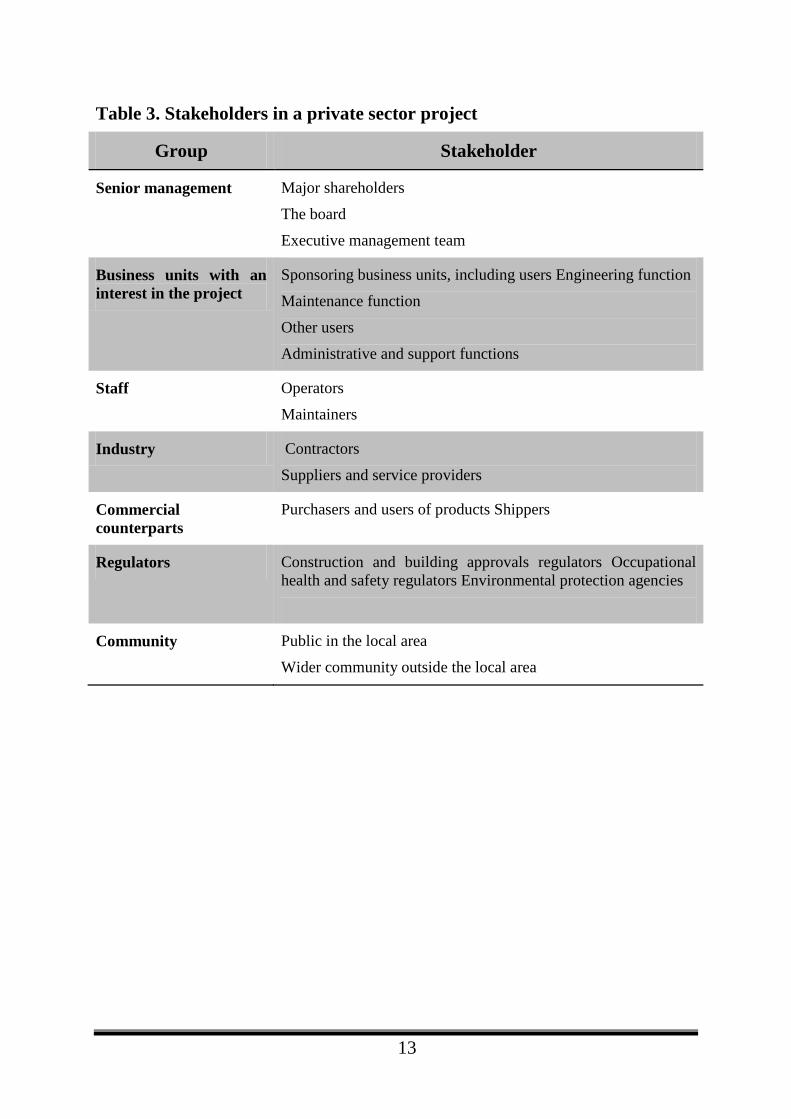
Table 3. Stakeholders in a private sector project
Group Stakeholder
Senior management
Major shareholders
The board
Executive management team
Business units with an interest in the project
Sponsoring business units, including users Engineering function
Maintenance function
Other users
Administrative and support functions
Staff Operators
Maintainers
Industry Contractors
Suppliers and service providers
Commercial counterparts
Purchasers and users of products Shippers
Regulators Construction and building approvals regulators Occupational health and safety regulators Environmental protection agencies
Community Public in the local area
Wider community outside the local area
14
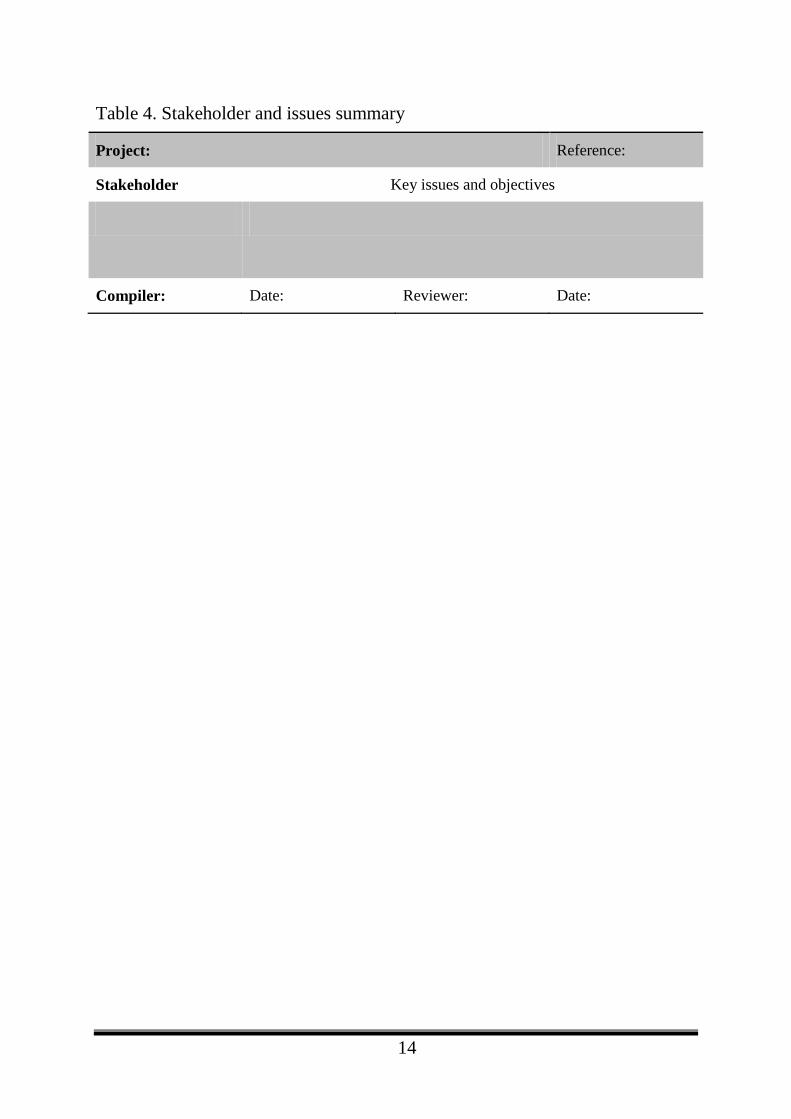
Table 4. Stakeholder and issues summary
Project: Reference:
Stakeholder Key issues and objectives
Compiler: Date: Reviewer: Date:
15
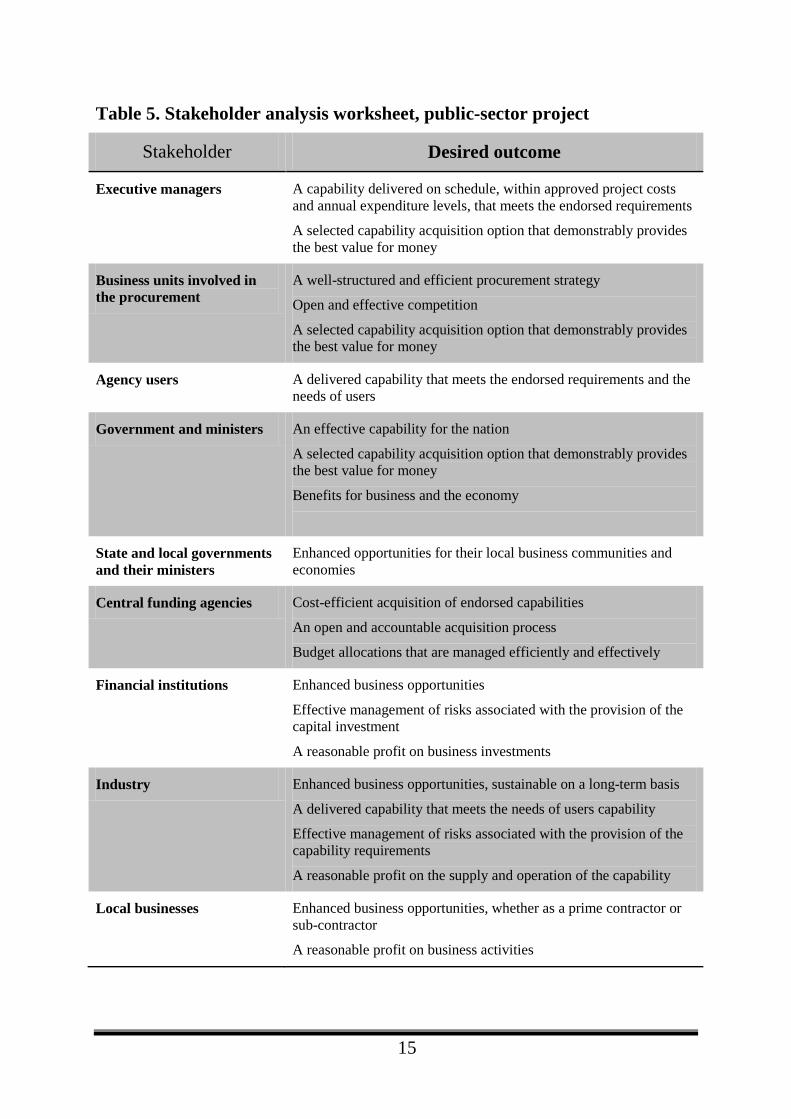
Table 5. Stakeholder analysis worksheet, public-sector project
Stakeholder Desired outcome
Executive managers A capability delivered on schedule, within approved project costs and annual expenditure levels, that meets the endorsed requirements
A selected capability acquisition option that demonstrably provides the best value for money
Business units involved in the procurement
A well-structured and efficient procurement strategy
Open and effective competition
A selected capability acquisition option that demonstrably provides the best value for money
Agency users A delivered capability that meets the endorsed requirements and the needs of users
Government and ministers An effective capability for the nation
A selected capability acquisition option that demonstrably provides the best value for money
Benefits for business and the economy
State and local governments and their ministers
Enhanced opportunities for their local business communities and economies
Central funding agencies Cost-efficient acquisition of endorsed capabilities
An open and accountable acquisition process
Budget allocations that are managed efficiently and effectively
Financial institutions Enhanced business opportunities
Effective management of risks associated with the provision of the capital investment
A reasonable profit on business investments
Industry Enhanced business opportunities, sustainable on a long-term basis
A delivered capability that meets the needs of users capability
Effective management of risks associated with the provision of the capability requirements
A reasonable profit on the supply and operation of the capability
Local businesses Enhanced business opportunities, whether as a prime contractor or sub-contractor
A reasonable profit on business activities
16
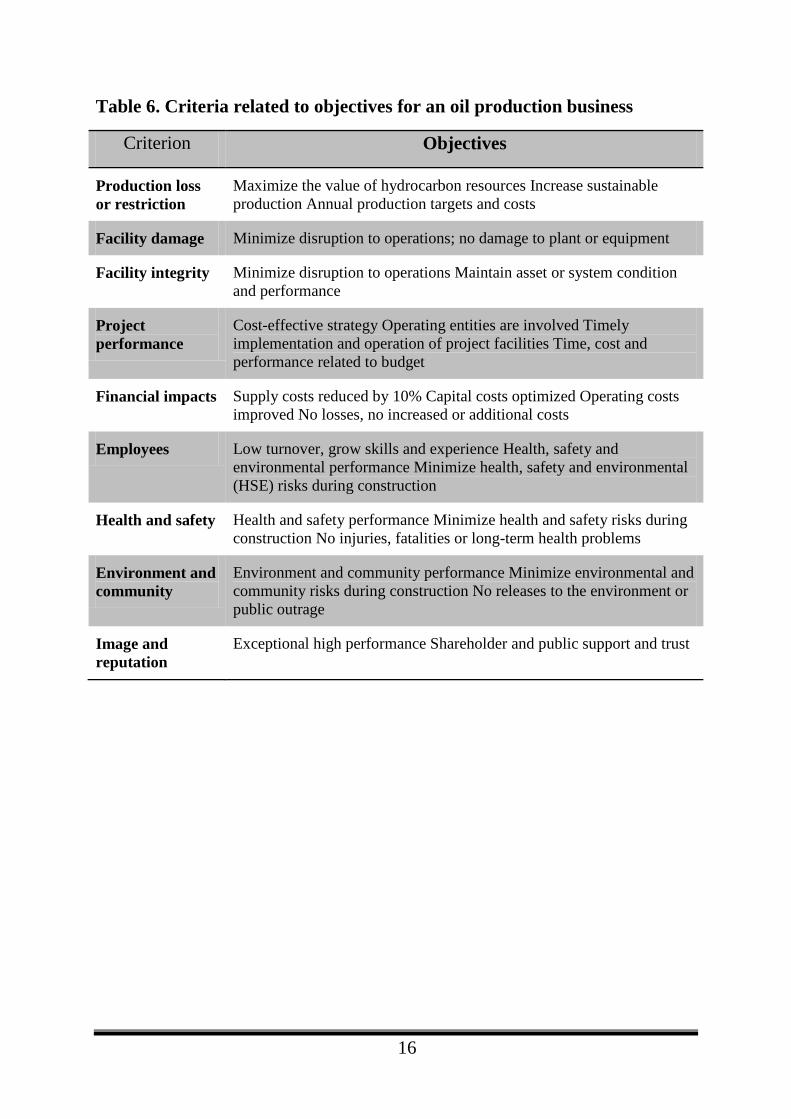
Table 6. Criteria related to objectives for an oil production business
Criterion Objectives
Production loss or restriction
Maximize the value of hydrocarbon resources Increase sustainable production Annual production targets and costs
Facility damage Minimize disruption to operations; no damage to plant or equipment
Facility integrity Minimize disruption to operations Maintain asset or system condition and performance
Project performance
Cost-effective strategy Operating entities are involved Timely implementation and operation of project facilities Time, cost and performance related to budget
Financial impacts Supply costs reduced by 10% Capital costs optimized Operating costs improved No losses, no increased or additional costs
Employees Low turnover, grow skills and experience Health, safety and environmental performance Minimize health, safety and environmental (HSE) risks during construction
Health and safety Health and safety performance Minimize health and safety risks during construction No injuries, fatalities or long-term health problems
Environment and community
Environment and community performance Minimize environmental and community risks during construction No releases to the environment or public outrage
Image and reputation
Exceptional high performance Shareholder and public support and trust
17
Differences in Personal Risk Attitude Biases and misinterpretation occur even in situations where the output from a cost model is reported in ways, which purport to take account of risk exposure. An adviser may state that there is a “reasonable” chance that a project can be completed for less than $40 million. What does this statement actually mean? The language, in itself, seems reasonably clear. However, is a “good” chance a 9 in 10, an 8 in 10, or a 6 in 10? Is a “reasonable” chance an 8 in 10, a 7 in 10, or a 5 in 10? These differences could be very significant to a decision maker choosing between projects or between different approaches to the same project. Estimator’s perspective
Assume that an estimator is just completing work on a bid for a large overseas project. The estimator has to report a net cost estimate to the managing director who will make the mark-up decision. The estimating team gets together on the day before the bid is due to be submitted and decide that their best estimate of the net cost is $72 m. This figure includes tangible and intangible costs, head office overheads, and an allowance for the cost of recovering finance charges. It includes no profit, normal or otherwise. This has been arrived at by breaking the project down. Manager’s perspective
The manager receives this figure together with the background briefing on the project from the estimators and the planning department. The decision on mark-up is a familiar problem to the manager who is accustomed to taking calculated risks in order to secure work at favorable rates for the firm. The manager knows that the estimate is a forecast of the outturn cost should the firm win the project. Thus, for the purposes of calculation, it would be rational to assume that the estimate is the most likely figure drawn from a distribution, which manifests some skewness at the upper end of the range. The mental cost model of the project held in the mind of the manager is that described by the figure. The characteristics of this model are that the most likely outturn cost is $72 m. The optimistic outcome is a project net cost of $65 m, and the pessimistic outcome shows a cost of $86 m.
18
Project Management Interface
• Project Scope Statement Generally describes the project’s deliverables and the work required to create those deliverables. The project scope statement provides a common understanding of the project scope among all project stakeholders and describes the project’s major objectives. It also enables the project team to perform more detailed planning, guides the project team’s work during execution, and provides the baseline for evaluating whether requests for changes or additional work are contained within or outside the project’s boundaries. It may include but not limited to:
• Project Objectives: Project objectives include the measurable success criteria of the project. Projects may have a wide variety of business, cost, schedule, technical, and quality objectives. Project objectives can also include cost, schedule, and quality targets. Each project objective has attributes such as cost, volume, etc., a metric, and an absolute or relative value.
• Product Scope Definition: Describes the characteristics of the product, service, or result that the project was undertaken to create. These characteristics will generally have less detail in early phases and more detail in later phases as they are progressively elaborated. While the form and substance of the characteristics will vary, the scope description should always provide sufficient detail to provide later project scope planning.
• Project Requirements: Describes the conditions or capabilities that must be met or possessed by the deliverables of the project to satisfy a contract, standard, specification or other formally imposed document. Analyses of all stakeholder needs, wants, and expectations are translated into prioritized requirements.
• Project Boundaries: Identifies generally what is included within the project. It also states explicitly what is excluded from the project, if a stakeholder might assume that a particular product, service, or result could be a component of the project.
19
• Project Deliverables: Deliverables include both the outputs that comprise the product or service of the project, as well as ancillary results, such as project management reports and documentation. Depending on the project scope statement, the deliverables may be described at a summary level or in great detail.
• Product Acceptance Criteria: Defines the process and criteria for accepting completed products.
• Project Constraints: Lists and describes the specific project constraints associated with the project scope that limit the team’s options. For example, a predefined budget or any imposed dates that are issued by the customer.
• Project Assumptions: Lists and describes the specific project assumptions associated with the project scope and the potential impact of those assumptions if they prove to be false.
• Initial Project Organization: The members of the project team, as well as stakeholders, are identified. The organization of the project is also documented.
• Schedule Milestones: The customer, Project Sponsor, or performing organization can identify milestones and can place imposed dates on those schedule milestones. These dates can be addressed as schedule constraints.
• Fund Limitation: Describes any limitation placed upon funding for the project, whether in total value or over specified timeframes.
• Approval Requirements: Identifies approval requirements that can be applied items such as project objectives, deliverables, documents, and work.
• Cost Management Plan The Cost Management Plan clearly defines how the costs on a project will be managed throughout the project’s lifecycle. It sets the format and standards by which the project costs are measured, reported and controlled. The Cost Management Plan:
• Identifies who is responsible for managing costs
• Identifies who has the authority to approve
20
changes to the project or its budget • How cost performance is quantitatively measured and reported upon • Report formats, frequency and to whom they are presented
• Schedule Management Plan This section highlights the purpose and importance of the schedule management plan. It provides a general description of what should be included in the schedule management plan. These items will be described in more detail later in the plan under each corresponding section. The project schedule is the roadmap for how the project will be executed. Schedules are an important part of any project as they provide the project team, sponsor, and stakeholders a picture of the project’s status at any given time. The purpose of the schedule management plan is to define the approach the project team will use in creating the project schedule. This plan also includes how the team will monitor the project schedule and manage changes after the baseline schedule has been approved. This includes identifying, analyzing, documenting, prioritizing, approving or rejecting, and publishing all schedule-related changes.
• Communication Management Plan Sample attributes of a communications management plan include:
• Communications item: The information that will be distributed to stakeholders
• Purpose: The reason for the distribution of that information • Frequency: How often that information will be distributed
• Start/end dates : The time frame for the distribution of the information
21
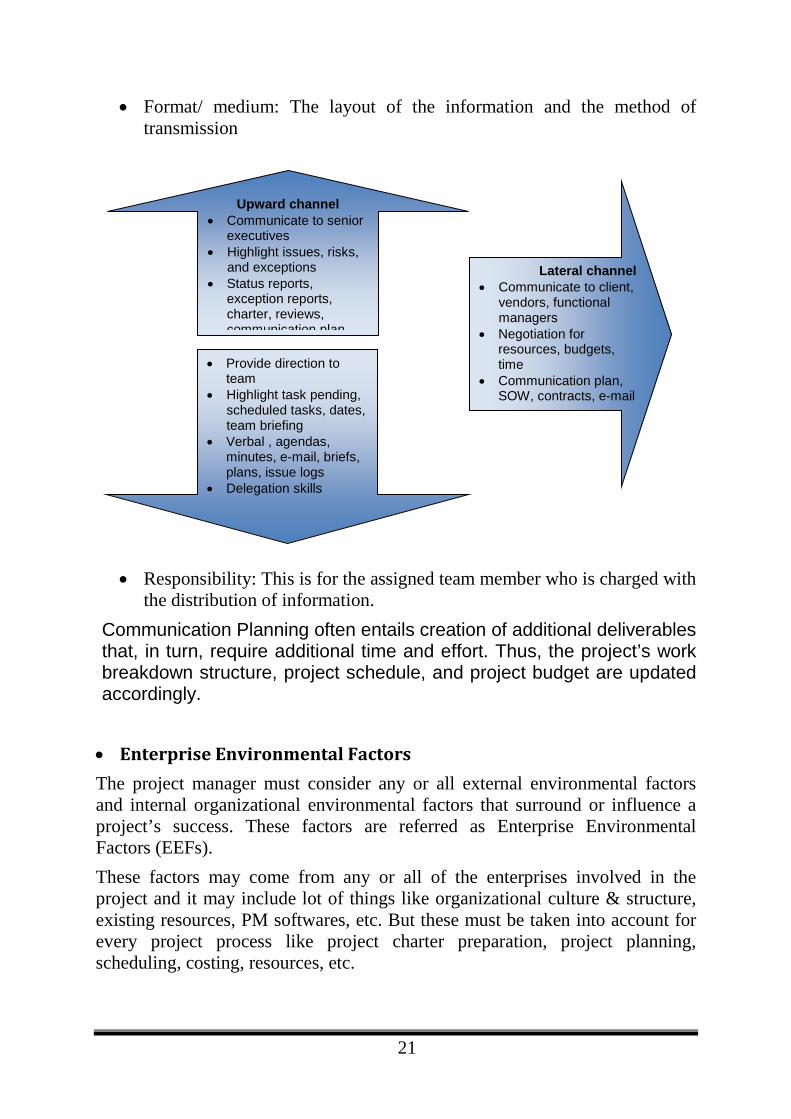
• Format/ medium: The layout of the information and the method of transmission
• Responsibility: This is for the assigned team member who is charged with the distribution of information.
Communication Planning often entails creation of additional deliverables that, in turn, require additional time and effort. Thus, the project’s work breakdown structure, project schedule, and project budget are updated accordingly.
• Enterprise Environmental Factors The project manager must consider any or all external environmental factors and internal organizational environmental factors that surround or influence a project’s success. These factors are referred as Enterprise Environmental Factors (EEFs). These factors may come from any or all of the enterprises involved in the project and it may include lot of things like organizational culture & structure, existing resources, PM softwares, etc. But these must be taken into account for every project process like project charter preparation, project planning, scheduling, costing, resources, etc.
Upward channel • Communicate to senior
executives • Highlight issues, risks,
and exceptions • Status reports,
exception reports, charter, reviews, communication plan
• Provide direction to team
• Highlight task pending, scheduled tasks, dates, team briefing
• Verbal , agendas, minutes, e-mail, briefs, plans, issue logs
• Delegation skills
D d h l
Lateral channel • Communicate to client,
vendors, functional managers
• Negotiation for resources, budgets, time
• Communication plan, SOW, contracts, e-mail
22
Enterprise Environmental Factors include(not limited to):
• Organizational culture & structure, Infrastructure,
• Government rules, guidelines, regulations or industry standards,
• Marketplace conditions, • Stakeholder risk tolerances,
• Project management information systems(PMIS), • Existing human resources factors like skills, knowledge, disciplines,
• Personnel administration like hiring, performance review guidelines, training,
• Published commercial information or databases for estimations, risk data • Company work authorization system.
• Organizational Process Assets For any projects – management team, as a first and foremost activity, need to search the historical information regarding similar projects executed in their organization. If the project is in entirely new, then they need to collect information regarding similar projects from other sources. Starting a project from scratch without using any information from past projects executed by your organization or similar projects executed by other organization(s) is such a waste of time! Each organization should have repository of information from already executed projects and these are called ‘Organizational Process Assets’. If one is not already existing, at least start creating it from now onwards. Lessons learned from earlier projects and historical information usually constitutes organization’s knowledge base, which in turn helps effective planning & execution of new project’s processes.
23
Organizational process assets include any or all processes related to the assets from an organization(s) involved in a project that can be used to influence the project’s success. Process assets include (not limited to):
• Any formal/informal plans • Organization’s standard processes, policies, procedures/methodologies,
• Guidelines, • Lessons learned, and
• knowledge & information from historical project records and documents
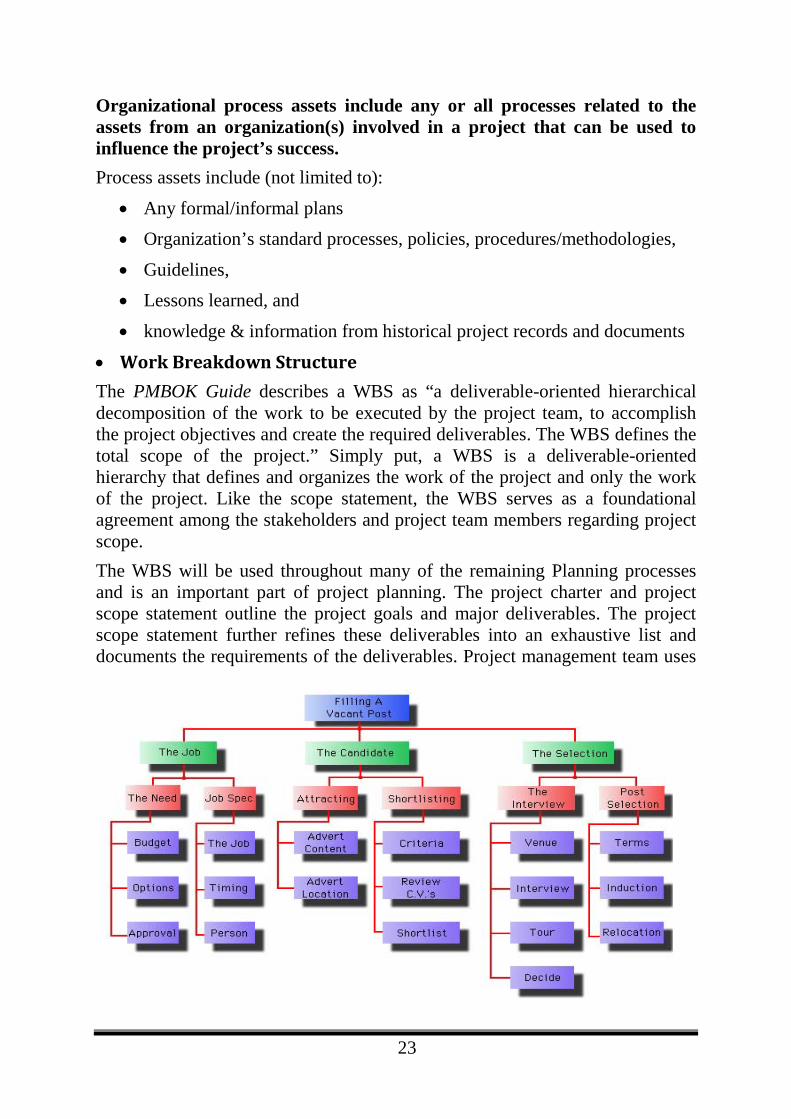
• Work Breakdown Structure The PMBOK Guide describes a WBS as “a deliverable-oriented hierarchical decomposition of the work to be executed by the project team, to accomplish the project objectives and create the required deliverables. The WBS defines the total scope of the project.” Simply put, a WBS is a deliverable-oriented hierarchy that defines and organizes the work of the project and only the work of the project. Like the scope statement, the WBS serves as a foundational agreement among the stakeholders and project team members regarding project scope. The WBS will be used throughout many of the remaining Planning processes and is an important part of project planning. The project charter and project scope statement outline the project goals and major deliverables. The project scope statement further refines these deliverables into an exhaustive list and documents the requirements of the deliverables. Project management team uses
24
that comprehensive list of deliverables produced in the project scope statement to build the framework of the WBS.
• Activity Cost Estimate • Analogous Estimating
Analogous Estimating, is one form of expert judgment and it also known as Top-down Estimating. This technique is used to determine the duration of the project. After finalizing the high level scope/requirement, the PM will refer & compare the previously completed project’s similar activities with the current activities and determine the duration. This estimation technique will be applied to determine the duration when the detailed information about the project is not available, usually during the early stages of the project. This technique will look the scope/requirement as a whole single unit to estimate. This estimate will give a ball-park idea about the estimation and will have bigger variance. Eg : To estimate the time required to complete the project of upgrading XYZ application’s database version to a higher version, is to compare similar past projects and estimate the duration. This is done irrespective of the complexity, size and other factors.
• Parametric Estimating Parametric estimating is one of the tools and technique of processes like Activity Duration Estimating, Cost Estimating, Cost Budgeting. Parametric estimating is a quantitatively based estimating method that multiplies the quantity of work by the rate. This estimate is by multiplying a known element like the quantity of materials needed by the time it takes to install or complete one unit of materials. The result is a total estimate for the activity. In this case, 10 servers multiplied by 16 hours per server gives you a 160-hour total duration estimate.
• Three-Point-Estimating
25
The three-point estimation technique is based on statistical methods, and in particular, the normal distribution. Three-point estimation is the preferred estimation technique for information systems (IS) projects. In the three-point estimation there are three figures produced for every estimate:
a = the best-case estimate m = the most likely estimate b = the worst-case estimate
These values are used to calculate an E value for the estimate and a standard deviation (SD) where:
E = (a + 4m + b) / 6 SD = (b − a)/6
E is a weighted average which takes into account both the most optimistic and most pessimistic estimates provided. SD measures the variability or uncertainty in the estimate. In Project Evaluation and Review Techniques (PERT) the three values are used to fit a Beta distribution for Monte Carlo simulations.
• Reserve Analysis Reserves or Contingency allowances are used to deal with uncertainty or “known-unknowns” and these are added to the cost estimates, thus sometimes overstating project costs. Options vary between grouping similar activities and assigning a single contingency reserve for that group to a zero duration activity. This activity may be placed across the network path for that group of schedule activities. As the schedule progresses, the reserve can be adjusted. Creating a buffer activity in the critical chain method at the end of the network path as the schedule progresses, allows the reserve to be adjusted. Reserve or contingency means adding a portion of cost/time to the activity to account for cost/time risk. You might choose to add a percentage of cost/time or a set number of work to the activity or the overall budget/schedule. For example, you know it will take $1000 to run new cable based on the quantitative estimate you came up with earlier. You also know that sometimes you hit problem areas when running the cable. To make sure you don’t impact the project budget, you build in a reserve of 10 percent of your original estimate to account for the problems you might
26
encounter. This brings your activity duration estimate to $1100 hours for this activity.
• Cost of Quality
Cost of Quality (COQ) is a measurement used for assessing the waste or losses from some defined process (eg. machine, production line, plant, department, company, etc.). Recognizing the power and universal applicability of Cost of Quality (COQ), PQA has developed numerous proprietary Cost of Quality (COQ) systems for ensuring the effectiveness of Cost of Quality (COQ) implementations. The Cost of Quality (COQ) measurement can track changes over time for one particular process, or be used as a benchmark for comparison of two or more different processes (eg. two machines, different production lines, sister plants, two competitor companies, etc.).
Vendor-Bid-Analysis
In a competitive bid process, you can apply vendor bid analysis to determine how much a project should cost. Comparing bids can help you determine the most likely cost for each deliverable, which will allow for a more accurate project cost estimate.
• Activity Duration Estimate • Analogous Estimating
Analogous Estimating is an estimating technique with the following characteristics: o Estimates are based on past projects (historical information). o It is less accurate when compared to
bottom-up estimation. o It is a top-down approach. o It takes less time when compared to bottom-up estimation. o It is a form of an expert judgment.
• Parametric Estimating
27
A parametric cost model is an extremely useful tool for preparing early conceptual estimates when there is little technical data or engineering deliverables to provide a basis for using more detailed estimating methods. A parametric model is a mathematical representation of cost relationships that provide a logical and predictable correlation between the physical or functional characteristics of a plant (or process system) and its resultant cost. A parametric estimate comprises cost estimating relationships and other parametric estimating functions that provide logical and repeatable relationships between independent variables, such as design parameters or physical characteristics and the dependent variable, cost.
• Three-Point-Estimating
• Reserve Analysis In terms of the project management scope of work and work flow, the concept of reserve analysis actually refers to a specific technique that of often implemented by the project management team and or the project management team leader or leaders for the purposes of helping to better maintain and manage the projects that they may have under their guise at that respective time.
• Stakeholder Register The Stakeholder Register is used to identify those with interest in the project and involves applying techniques to create the Stakeholder Requirements Document. The Stakeholder Register provides the list of stakeholders along with the Stakeholder Management Strategy. It contains information on each stakeholder that will assist in working effectively with them
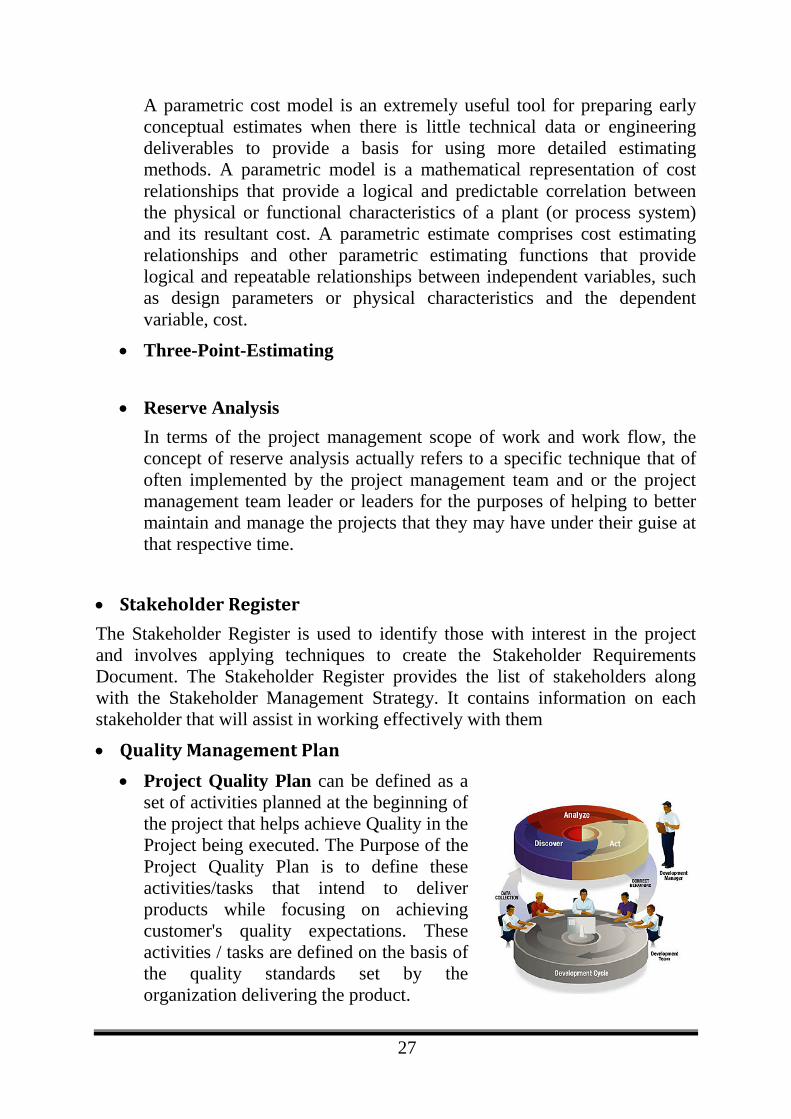
• Quality Management Plan • Project Quality Plan can be defined as a
set of activities planned at the beginning of the project that helps achieve Quality in the Project being executed. The Purpose of the Project Quality Plan is to define these activities/tasks that intend to deliver products while focusing on achieving customer's quality expectations. These activities / tasks are defined on the basis of the quality standards set by the organization delivering the product.
28
• Project Quality Plan identifies which Quality Standards are relevant to the project and determines how they can be satisfied. It includes the implementation of Quality Events (peer reviews, checklist execution) by using various Quality Materials (templates, standards, checklists) available within the organization. The holding of the Quality Event is termed as Quality Control. As an output of the various activities, Quality Metrics or Measurements are captured which assist in continuous improvement of Quality thus adding to the inventory of Lessons Learned. Quality Assurance deals in preparation of the Quality Plan and formation of organization wide standards.
• Guidelines to write the Project Quality Plan
• Project Quality Plan should be written with the objective to provide project management with easy access to quality requirements and should have ready availability of the procedures and standards thus mentioned.
• The following list provides you the various Quality Elements that should be included in a detailed Project Quality Plan:
• Management Responsibility. Describes the quality responsibilities of all stakeholders.
• Documented Quality Management System. This refers to the existing Quality Procedures that have been standardized and used within the organization.
• Design Control. This specifies the procedures for Design Review, Sign-Off, Design Changes and Design Waivers of requirements.
• Document Control. This defines the process to control Project Documents at each Project Phase.
• Purchasing. This defines Quality Control and Quality Requirements for sub-contracting any part / whole part of the project.
• Inspection Testing. This details the plans for Acceptance Testing and Integration Testing.
• Nonconformance. This defines the procedures to handle any type of nonconformance work. The procedures include defining responsibilities, defining conditions and availability of required documentation in such cases.
• Corrective Actions. This describes the procedures for taking Corrective Actions for the problems encountered during project execution.
• Quality Records. This describes the procedures for maintaining the Quality Records (metrices, variance reports, executed checklists etc) during project execution as well as after the project completion.
29
• Quality Audits. An internal audit should be planned and implemented during each phase of the project.
• Training. This should specify any training requirements for the project team.
• Work Performance Information Work Performance Information (WPI) is the raw data of project status, or we can say that it is ‘as of now’ status of the processes from each knowledge areas. It refers to what work has been completed, or how much time has been elapsed, or the cost incurred etc. It provides us information about current status of project deliverables. This information is utilized in creation of Work Performance Measurements (WPM) and Performance Reporting. Work Performance Information (WPI) includes, but not limited to:
• Scope: How much of scope of work has been physically completed? • Time: Schedule progress; e.g. status of activities; i.e. how many activities
has been completed and how many have been started and their current status etc.
• Cost: How much cost has been incurred till date? • Quality: Here technical performance measurements are noted. For
example, characteristics of product; i.e. physical properties, quality metrics, number of defects and rejection rate etc.
• Human Resource: Work Performance Information can also include performance, or requirements of team member; e.g. if any kind of training given to the team member to enhance his certain skills.
• Risks: Risks status which includes how many identified and unidentified risks have occurred, how many new risks have been identified, effectiveness of response plan, how much contingency, or management reserve has been utilized.
• Procurement: Procurement related activities; e.g. seller performance including how much work has been completed from his side, and how much money is paid etc.
30
• Performance Reports • Information presentation tools - Information presentation tools
enable the project team members to present project performance data. Most organizations have software packages which can be used to paint a picture with a graph or a spreadsheet analysis.
• Performance information gathering and compilation - The performance information gathering and compilation technique is the organizing of all pertinent project information.
• Status review meetings - Status review meetings are regularly scheduled meetings to exchange information about a project. Commonly there is a team level status review meeting and then an executive over site review meeting.
• Time reporting systems - Time reporting systems record and provide information about the time spent for activities on a project.
• Cost reporting systems - Cost reporting systems record and provide the costs expended for the project.
The Performance Reporting process provides pertinent and verifiable documentation of project performance. The outputs of the Performance Reporting process are: • Performance reports - Performance reports are presentations and
documents that summarize work performance information in the form of bar charts, S-curves, histograms, and tables.
• Forecasts - Forecasts are predictions of what will occur based on the project performance to date. Forecasts are updated and reissued as new work performance information is available during project execution. A project manager might want to conduct a trend analysis of cost and schedule variance to see how on budget and on time the project is likely to be.
• Requested changes - Requested changes are project changes affecting scope that are submitted to the Integrated Change Control
31
process. These must be reflected in performance reporting to stakeholders.
• Recommended corrective actions - Recommended corrective actions are documented suggestions affecting project execution designed to ensure that expected future project performance will conform to the Project Management Plan. Once a project manager is made aware of a schedule or cost variance, he needs to take action to get the project back in line with original objectives. To do so, recommended corrective actions may be offered.
• Organizational process assets updates - Organizational process assets updates are changes or updates to formal and informal policies, plans, guidelines, organizational best practices, and lessons learned from project experience.
32
PLAN RISK MANAGEMENT Planning meetings & analysis
The purpose of these meetings, which are held with project team members, stakeholders, functional managers, and others who might have involvement in the risk management process, is to contribute to the risk management plan. During these meetings, the fundamental plans for performing risk management activities will be discussed and determined and then documented in the risk management plan. The key outcomes of performing these planning meetings are as follows:
Risk management plan The risk management plan may include:
• Methodology: This section defines how you will perform risk management for the particular project. Remember to adapt to the needs of each project.
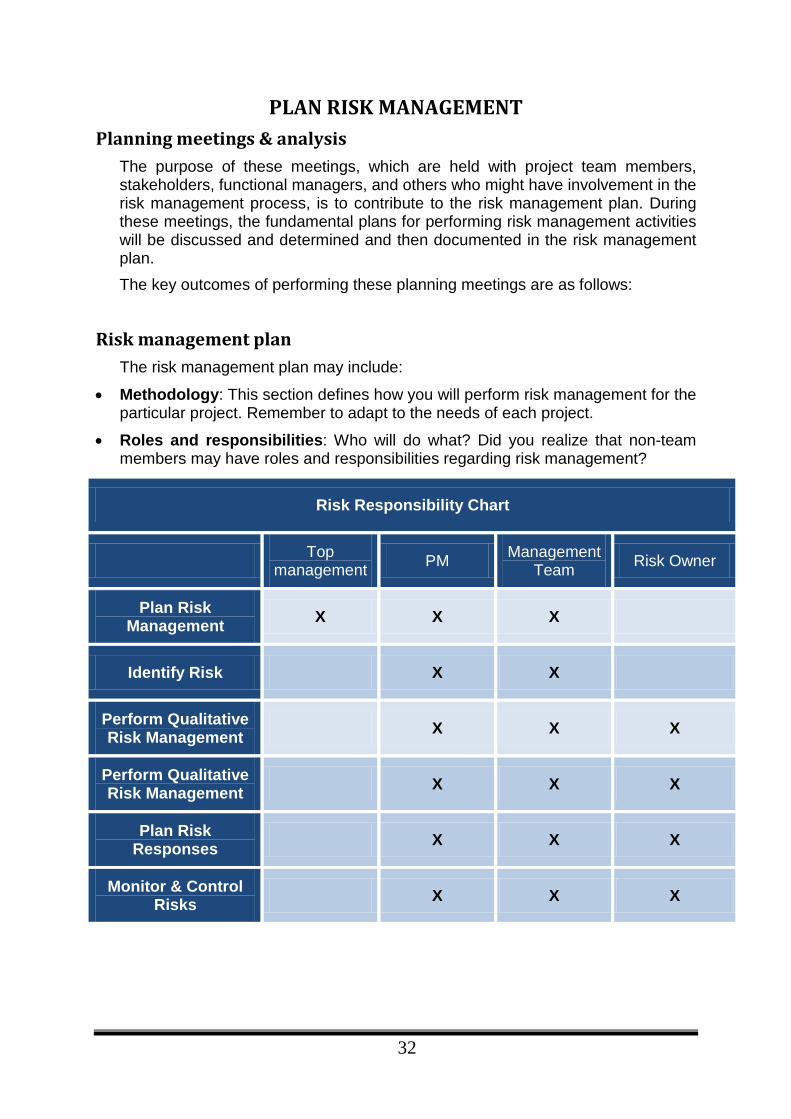
• Roles and responsibilities: Who will do what? Did you realize that non-team members may have roles and responsibilities regarding risk management?
Risk Responsibility Chart
Top management PM Management
Team Risk Owner
Plan Risk Management X X X
Identify Risk X X
Perform Qualitative Risk Management X X X
Perform Qualitative Risk Management X X X
Plan Risk Responses X X X
Monitor & Control Risks X X X
33
• Budgeting: This section includes the cost for the risk management process.
• Timing: This sections talks about when to do risk management for this particular project. Risk management should start as soon as you have the appropriate inputs. It should also be repeated throughout the life of the project, since new risks can be identified and may change the degree of risk on the project.
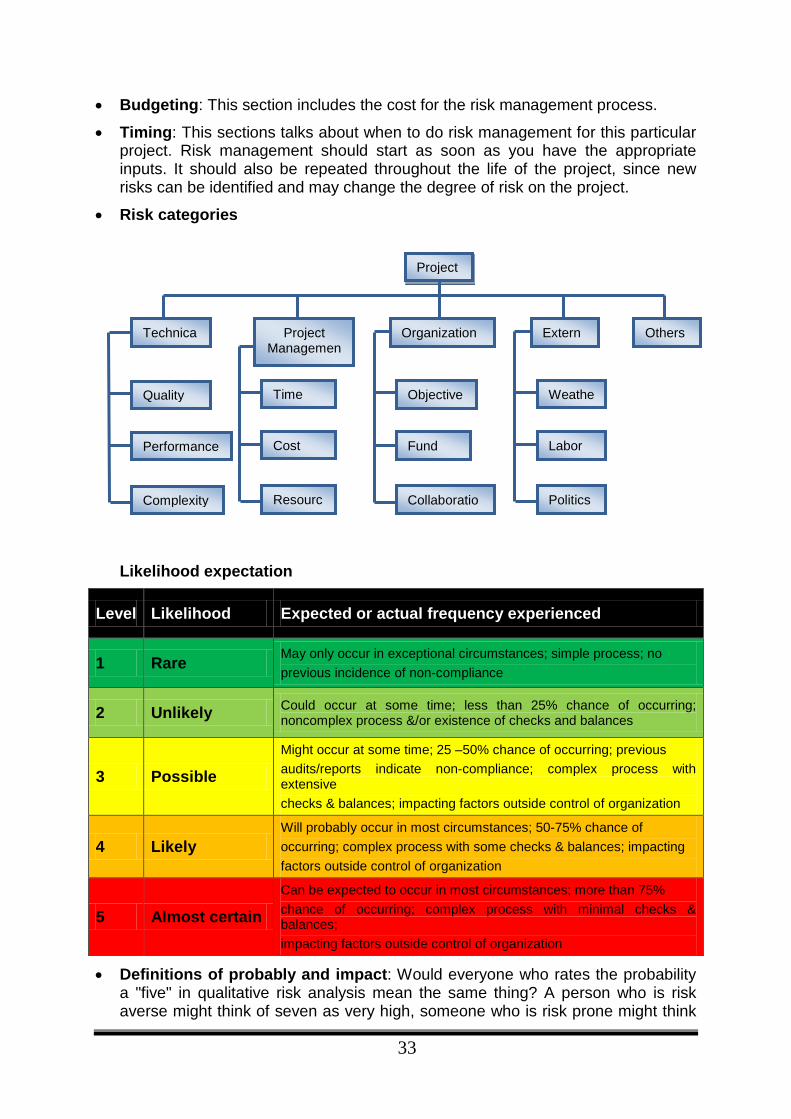
• Risk categories
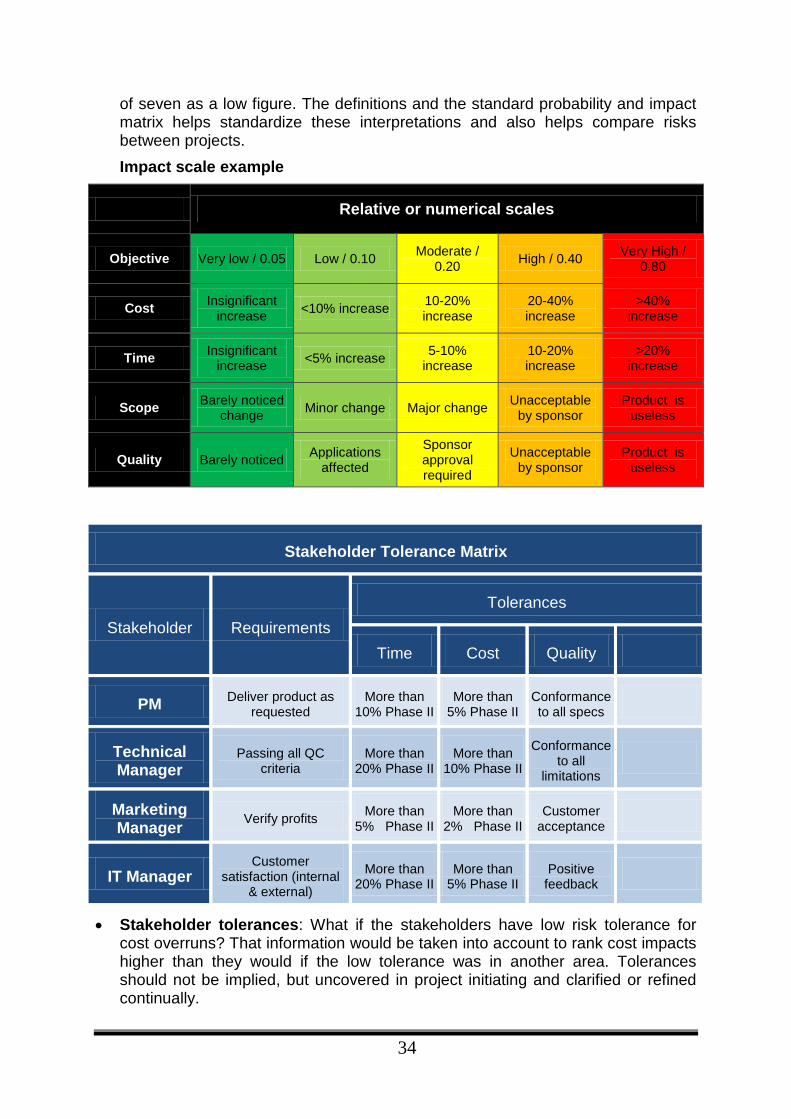
Likelihood expectation
Level Likelihood Expected or actual frequency experienced
1 Rare May only occur in exceptional circumstances; simple process; no previous incidence of non-compliance
2 Unlikely Could occur at some time; less than 25% chance of occurring; noncomplex process &/or existence of checks and balances
3 Possible Might occur at some time; 25 –50% chance of occurring; previous audits/reports indicate non-compliance; complex process with extensive checks & balances; impacting factors outside control of organization
4 Likely Will probably occur in most circumstances; 50-75% chance of occurring; complex process with some checks & balances; impacting factors outside control of organization
5 Almost certain Can be expected to occur in most circumstances; more than 75% chance of occurring; complex process with minimal checks & balances; impacting factors outside control of organization
• Definitions of probably and impact: Would everyone who rates the probability a "five" in qualitative risk analysis mean the same thing? A person who is risk averse might think of seven as very high, someone who is risk prone might think
Project
Organization
Project Managemen
t
Technica
Extern
Others
Time
Cost
Resourc
Quality
Performance
Complexity
Objective
Fund
Collaboratio
Weathe
Labor
Politics
34
of seven as a low figure. The definitions and the standard probability and impact matrix helps standardize these interpretations and also helps compare risks between projects. Impact scale example
Relative or numerical scales
Objective Very low / 0.05 Low / 0.10 Moderate / 0.20 High / 0.40 Very High /
0.80
Cost Insignificant increase <10% increase 10-20%
increase 20-40% increase
>40% increase
Time Insignificant increase <5% increase 5-10%
increase 10-20% increase
>20% increase
Scope Barely noticed change Minor change Major change Unacceptable
by sponsor Product is
useless
Quality Barely noticed Applications affected
Sponsor approval required
Unacceptable by sponsor
Product is useless
Stakeholder Tolerance Matrix
Stakeholder Requirements Tolerances
Time Cost Quality
PM Deliver product as requested
More than 10% Phase II
More than 5% Phase II
Conformance to all specs
Technical Manager
Passing all QC criteria
More than 20% Phase II
More than 10% Phase II
Conformance to all
limitations
Marketing Manager Verify profits More than
5% Phase II More than
2% Phase II Customer
acceptance
IT Manager Customer
satisfaction (internal & external)
More than 20% Phase II
More than 5% Phase II
Positive feedback
• Stakeholder tolerances: What if the stakeholders have low risk tolerance for cost overruns? That information would be taken into account to rank cost impacts higher than they would if the low tolerance was in another area. Tolerances should not be implied, but uncovered in project initiating and clarified or refined continually.
35
• Reporting formats: This section describes any reports related to risk management that will be used and what they will include.
• Definitions of terms: (probability, impact, risk types, risk levels, and so on) are developed and documented.
• The probability and impact matrix is defined or modified for this project.
• Tracking: Take this to mean how the risk process will be audited, and documenting what happens with risk management activities.
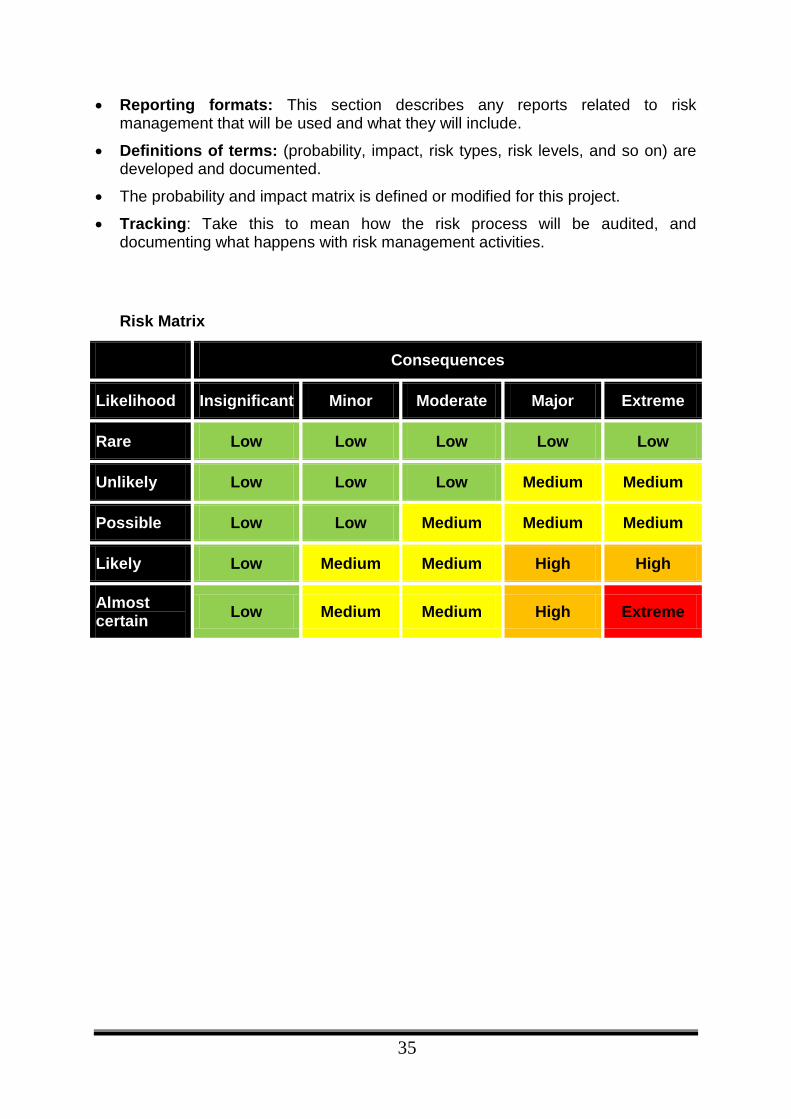
Risk Matrix
Consequences
Likelihood Insignificant Minor Moderate Major Extreme
Rare Low Low Low Low Low
Unlikely Low Low Low Medium Medium
Possible Low Low Medium Medium Medium
Likely Low Medium Medium High High
Almost certain Low Medium Medium High Extreme
36
RISK IDENTIFICATION Identification participants Where time and resources permit, all members of the project team should attend the identification session, including functional unit members assigned to the project on a part-time basis. People who might be included in a brainstorming group are:
• the project manager and the project team; • project sponsors and site representatives; • discipline engineers; • experts with specific knowledge in particular areas of concern, where
there may be insufficient expertise in the project team; • commercial specialists; • health, safety and environmental specialists; • people with experience in similar previous or current projects; • users of the project outcomes; • key stakeholders who need to be confident in the project and the project
management process before approvals are granted.
37
Information gathering techniques I. Documentation reviews:
What is and what is not included in the preliminary project scope statement, the project charter and later documents can help identify risks. Lessons learned, articles and other documents can also help uncover risks. Documentation reviews involve reviewing project plans, assumptions, and historical information from a total project perspective as well as at the individual deliverables or activities level. This review helps the project team identify risks associated with the project objectives. Pay attention to the quality of the plans and the consistency between plans.
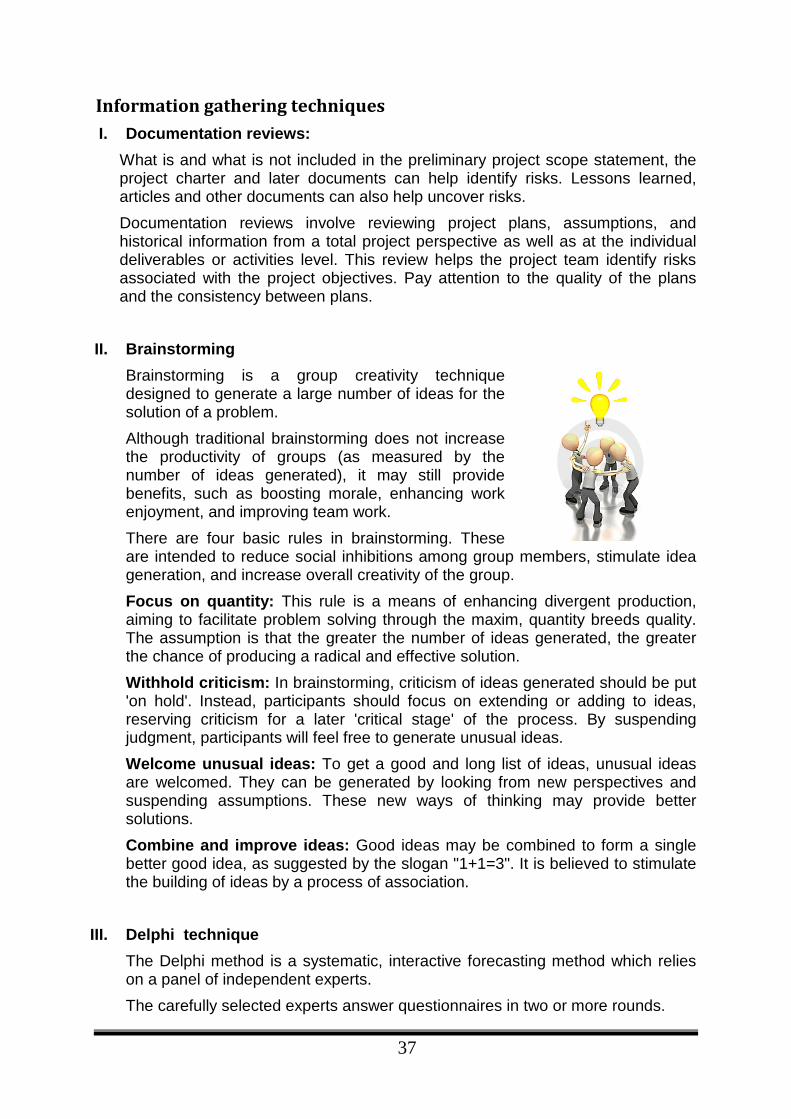
II. Brainstorming Brainstorming is a 1Tgroup creativity technique1T designed to generate a large number of 1Tideas1T for the solution of a 1Tproblem1T. Although traditional brainstorming does not increase the productivity of groups (as measured by the number of ideas generated), it may still provide benefits, such as boosting morale, enhancing work enjoyment, and improving 1Tteam work 1T. There are four basic rules in brainstorming. These are intended to reduce social inhibitions among group members, stimulate idea generation, and increase overall creativity of the group. Focus on quantity: This rule is a means of enhancing divergent production, aiming to facilitate problem solving through the maxim, quantity breeds quality. The assumption is that the greater the number of ideas generated, the greater the chance of producing a radical and effective solution. Withhold criticism: In brainstorming, 1Tcriticism1T of ideas generated should be put 'on hold'. Instead, participants should focus on extending or adding to ideas, reserving criticism for a later 'critical stage' of the process. By suspending judgment, participants will feel free to generate unusual ideas. Welcome unusual ideas: To get a good and long list of ideas, unusual ideas are welcomed. They can be generated by looking from new perspectives and suspending assumptions. These new ways of thinking may provide better solutions. Combine and improve ideas: Good ideas may be combined to form a single better good idea, as suggested by the slogan "1+1=3". It is believed to stimulate the building of ideas by a process of 1Tassociation1T.
III. Delphi technique
The Delphi method is a systematic, interactive 1Tforecasting1T method which relies on a panel of independent experts. The carefully selected experts answer questionnaires in two or more rounds.
38
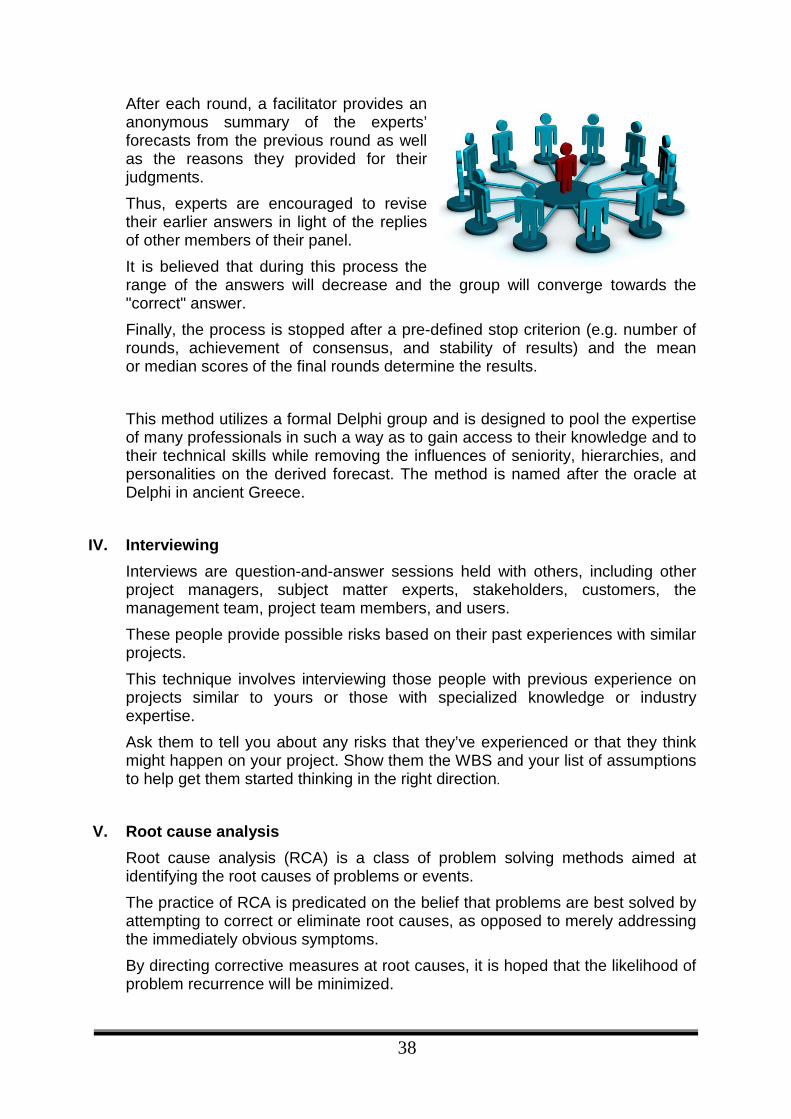
After each round, a facilitator provides an anonymous summary of the experts’ forecasts from the previous round as well as the reasons they provided for their judgments. Thus, experts are encouraged to revise their earlier answers in light of the replies of other members of their panel. It is believed that during this process the range of the answers will decrease and the group will converge towards the "correct" answer. Finally, the process is stopped after a pre-defined stop criterion (e.g. number of rounds, achievement of consensus, and stability of results) and the 1Tmean1T or 1Tmedian1T scores of the final rounds determine the results.
This method utilizes a formal Delphi group and is designed to pool the expertise of many professionals in such a way as to gain access to their knowledge and to their technical skills while removing the influences of seniority, hierarchies, and personalities on the derived forecast. The method is named after the oracle at Delphi in ancient Greece.
IV. Interviewing Interviews are question-and-answer sessions held with others, including other project managers, subject matter experts, stakeholders, customers, the management team, project team members, and users. These people provide possible risks based on their past experiences with similar projects. This technique involves interviewing those people with previous experience on projects similar to yours or those with specialized knowledge or industry expertise. Ask them to tell you about any risks that they’ve experienced or that they think might happen on your project. Show them the WBS and your list of assumptions to help get them started thinking in the right direction.
V. Root cause analysis
Root cause analysis (RCA) is a class of 1Tproblem solving1T methods aimed at identifying the 1Troot causes1T of problems or events. The practice of RCA is predicated on the belief that problems are best solved by attempting to correct or eliminate root causes, as opposed to merely addressing the immediately obvious symptoms. By directing corrective measures at root causes, it is hoped that the likelihood of problem recurrence will be minimized.
39
However, it is recognized that complete prevention of recurrence by a single intervention is not always possible. Thus, RCA is often considered to be an iterative process, and is frequently viewed as a tool of continuous improvement.
VI. Checklists Checklists are quick to use, and they provide useful guides for areas in which the organization has a depth of experience, particularly for projects that are standard or routine in nature. Sometimes these take the form of standard procedures that have a similar effect. Often, the checklists are part of the organization's quality assurance procedures and documentation. Checklists used during the Risk Identification process are usually developed based on historical information and previous project team experience. It isn’t possible for a single checklist to be an exhaustive source for all projects. You can improve your checklists at the end of the project by adding the new risks that were identified.
VII. Diagramming techniques
Diagramming techniques, such as system flow charts, cause-and-effect diagrams, and influence diagrams are used to uncover risks that aren't readily apparent in verbal descriptions.
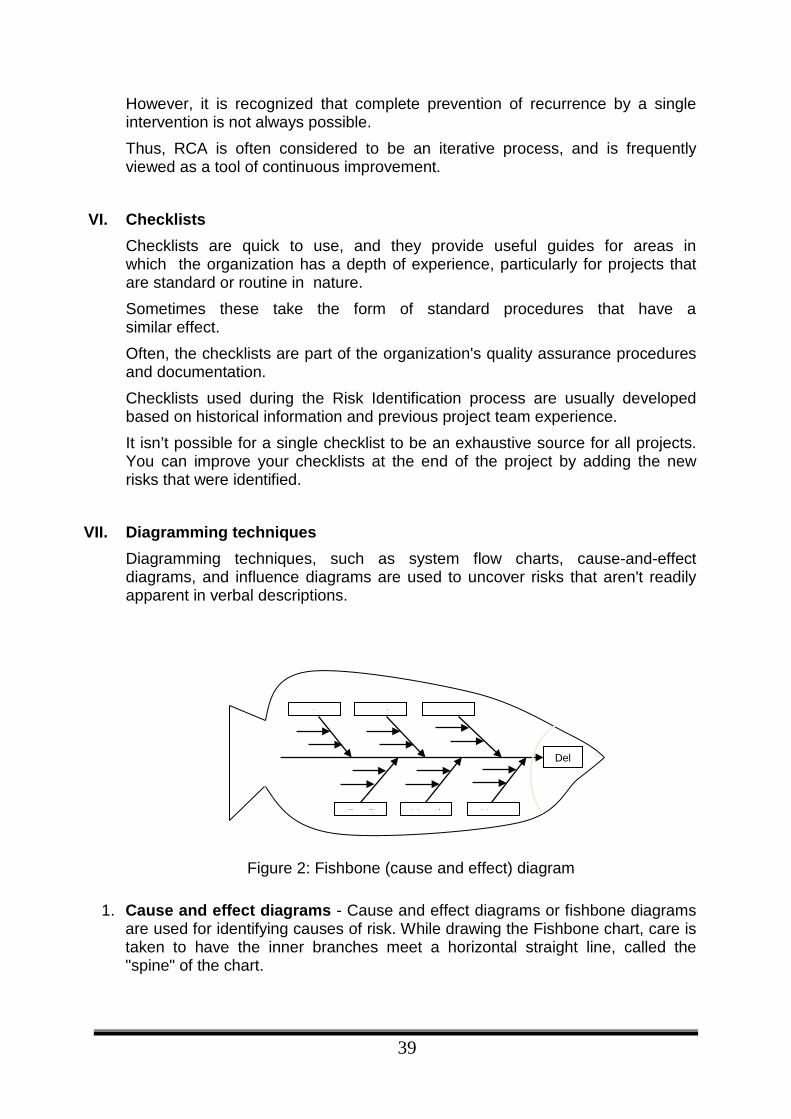
Figure 2: Fishbone (cause and effect) diagram
1. Cause and effect diagrams - Cause and effect diagrams or fishbone diagrams are used for identifying causes of risk. While drawing the Fishbone chart, care is taken to have the inner branches meet a horizontal straight line, called the "spine" of the chart.
Del
MM t iF di
S P dL b
40
The statement of the problem - or the effect - is to the right of the spine inside a box, which makes it look like the head of a fish. When finished, the entire map resembles a fishbone.
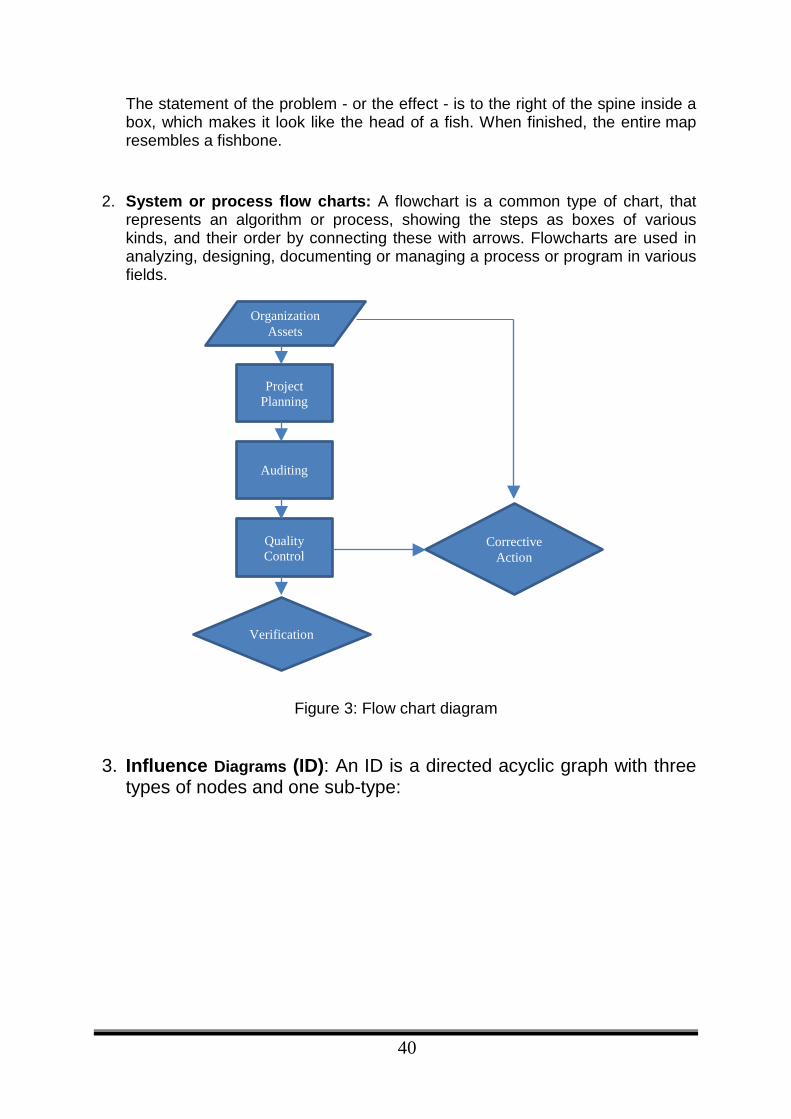
2. System or process flow charts: A flowchart is a common type of chart, that represents an algorithm or process, showing the steps as boxes of various kinds, and their order by connecting these with arrows. Flowcharts are used in analyzing, designing, documenting or managing a process or program in various fields.
Figure 3: Flow chart diagram
3. Influence Diagrams (ID): An ID is a directed acyclic graph with three
types of nodes and one sub-type:
Organization Assets
Project Planning
Auditing
Quality Control
Verification
Corrective Action
41
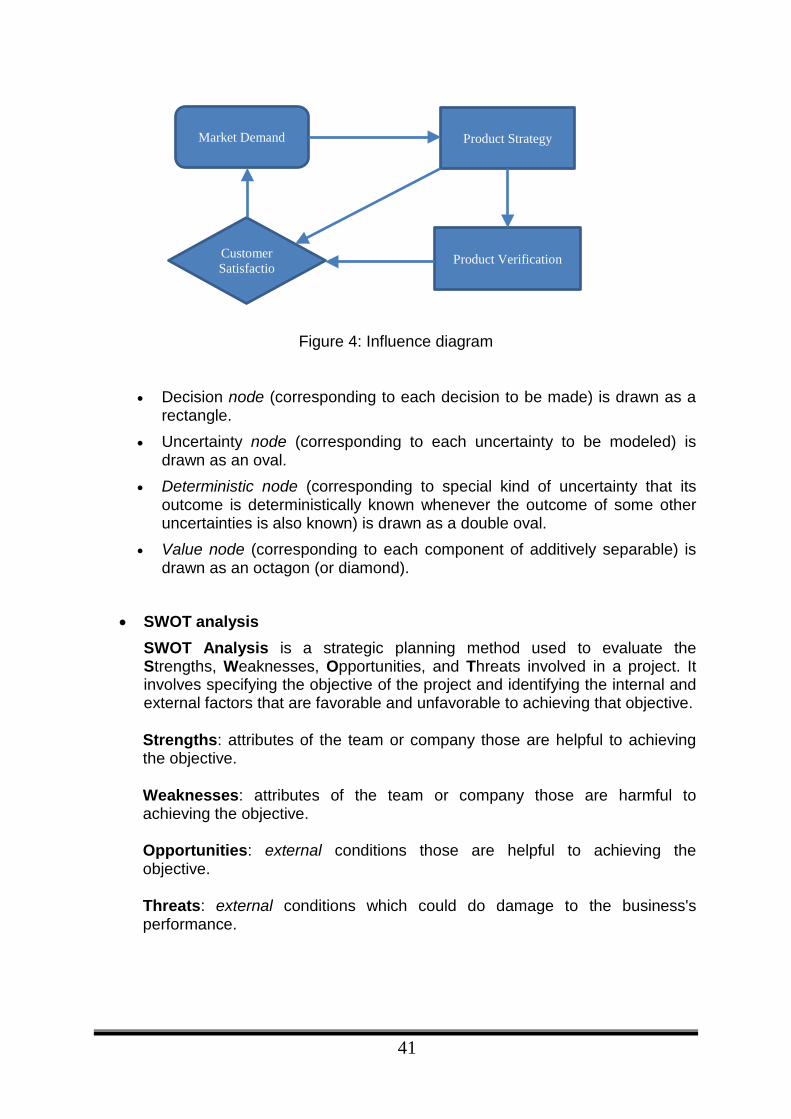
Figure 4: Influence diagram
• Decision node (corresponding to each decision to be made) is drawn as a
rectangle. • Uncertainty node (corresponding to each uncertainty to be modeled) is
drawn as an oval. • Deterministic node (corresponding to special kind of uncertainty that its
outcome is deterministically known whenever the outcome of some other uncertainties is also known) is drawn as a double oval.
• Value node (corresponding to each component of additively separable) is drawn as an octagon (or diamond).
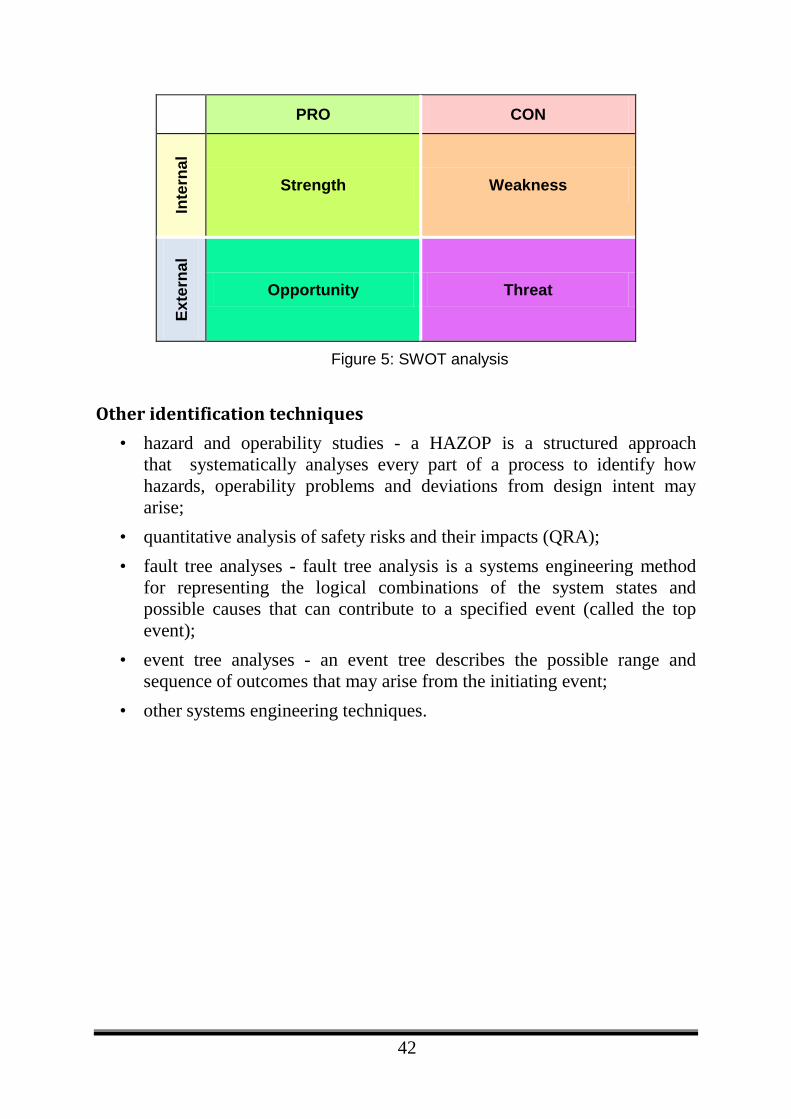
• SWOT analysis
SWOT Analysis is a strategic planning method used to evaluate the Strengths, Weaknesses, Opportunities, and Threats involved in a project. It involves specifying the objective of the project and identifying the internal and external factors that are favorable and unfavorable to achieving that objective.
Strengths: attributes of the team or company those are helpful to achieving the objective.
Weaknesses: attributes of the team or company those are harmful to achieving the objective.
Opportunities: external conditions those are helpful to achieving the objective.
Threats: external conditions which could do damage to the business's performance.
Market Demand Product Strategy
Product Verification Customer Satisfactio
42
PRO CON
Inte
rnal
Strength Weakness
Exte
rnal
Opportunity Threat
Figure 5: SWOT analysis
Other identification techniques • hazard and operability studies - a HAZOP is a structured approach
that systematically analyses every part of a process to identify how hazards, operability problems and deviations from design intent may arise;
• quantitative analysis of safety risks and their impacts (QRA); • fault tree analyses - fault tree analysis is a systems engineering method
for representing the logical combinations of the system states and possible causes that can contribute to a specified event (called the top event);
• event tree analyses - an event tree describes the possible range and sequence of outcomes that may arise from the initiating event;
• other systems engineering techniques.
43
Risk Register
At this point the risk register would include:
• List of risks.
• List of potential responses. Though risk response planning occurs later, one of the things experienced risk managers know is that it is not always logical to separate work on each part of risk management.
• Root causes of risks previously explained, these are now documented.
• Updated risk categories. You will notice lots of places where historical records and company records are updated throughout the project management process.
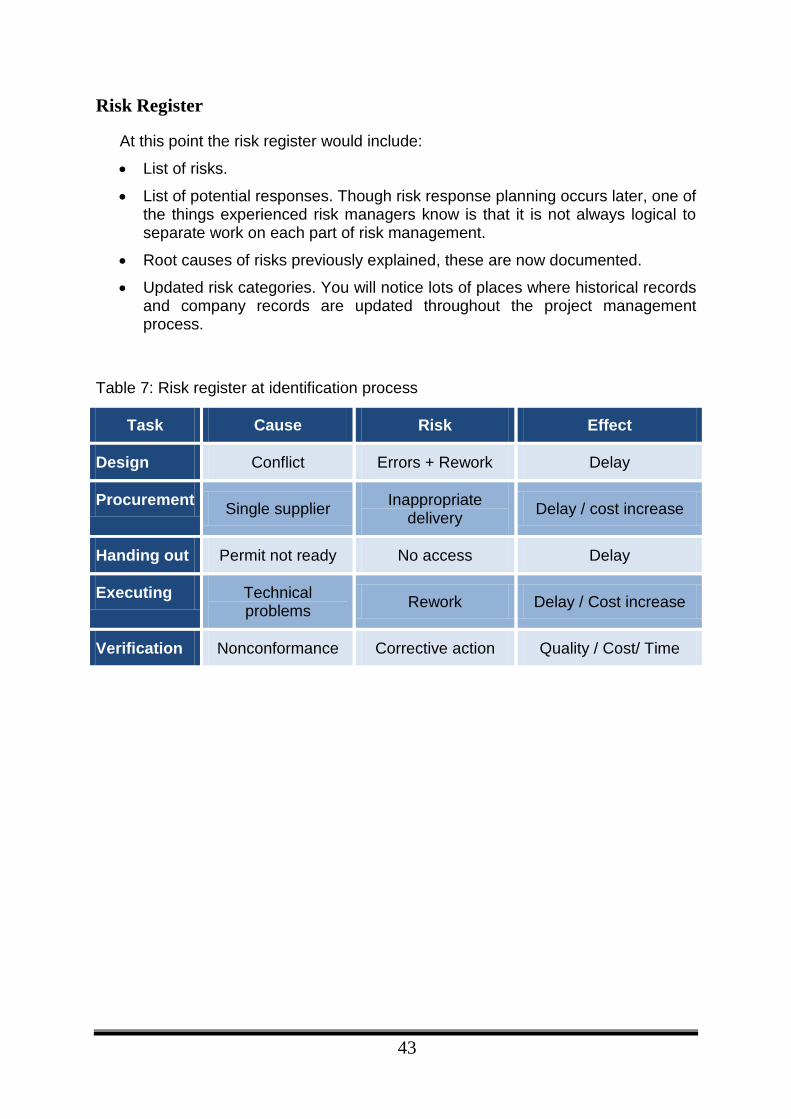
Table 7: Risk register at identification process
Task Cause Risk Effect
Design Conflict Errors + Rework Delay
Procurement Single supplier Inappropriate delivery Delay / cost increase
Handing out Permit not ready No access Delay
Executing Technical problems Rework Delay / Cost increase
Verification Nonconformance Corrective action Quality / Cost/ Time
44
Risk Documentation
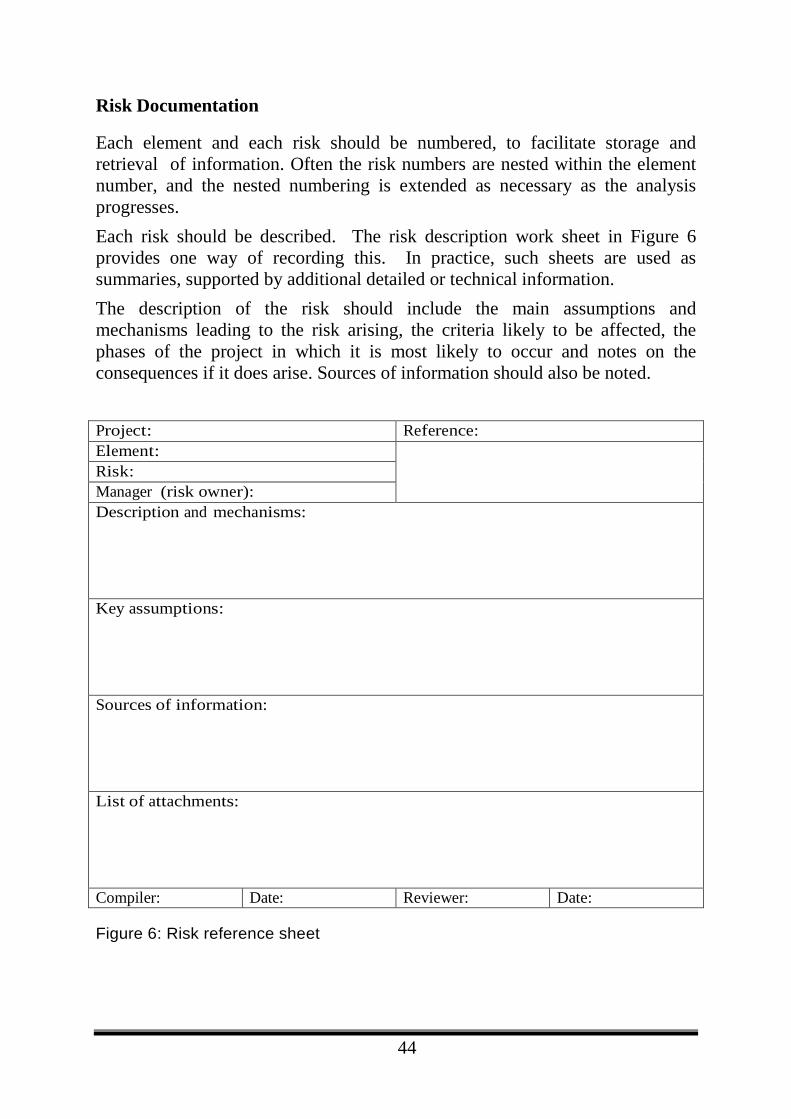
Each element and each risk should be numbered, to facilitate storage and retrieval of information. Often the risk numbers are nested within the element number, and the nested numbering is extended as necessary as the analysis progresses. Each risk should be described. The risk description work sheet in Figure 6 provides one way of recording this. In practice, such sheets are used as summaries, supported by additional detailed or technical information. The description of the risk should include the main assumptions and mechanisms leading to the risk arising, the criteria likely to be affected, the phases of the project in which it is most likely to occur and notes on the consequences if it does arise. Sources of information should also be noted. Project: Reference: Element: Risk: Manager (risk owner): Description and mechanisms:
Key assumptions:
Sources of information:
List of attachments:
Compiler: Date: Reviewer: Date:
Figure 6: Risk reference sheet
45
Risk Responsibility
Management responsibility for dealing with each specified risk and ensuring effective treatment plans are developed and implemented should be assigned and recorded. The responsible manager is sometimes called the risk owner.
Information Source
As a general rule, all available data sources should be used when assessing high-priority elements and risks, and evaluating ways of managing them. Information sources may include:
• historical records, often for similar or related projects; • project experience, either specific to the kind of project being assessed or
more general experience with large or complex activities or with similar kinds of contractors or suppliers;
• industry best practice and user experience, including relevant benchmarks and standards;
• relevant published literature and research reports, including appropriate theory, for example relating to failure modes or equipment reliability;
• product brochures, technical manuals and audit reports; • test marketing and market research, where there is benefit in seeking
or creating new information relating to specific aspects of the project, and particularly its acceptability to its intended end-users or customers;
• experiments and prototypes, where there may be technical risks or areas in which more
• empirical rather than theoretical information may be useful; • economic or other models, to provide the necessary theoretical
foundations for specific and general risk assessments, including traditional cash-flow and sensitivity models where appropriate;
• expert commercial and technical judgment, including that of the project team and
• appropriate external advisers where necessary.
46
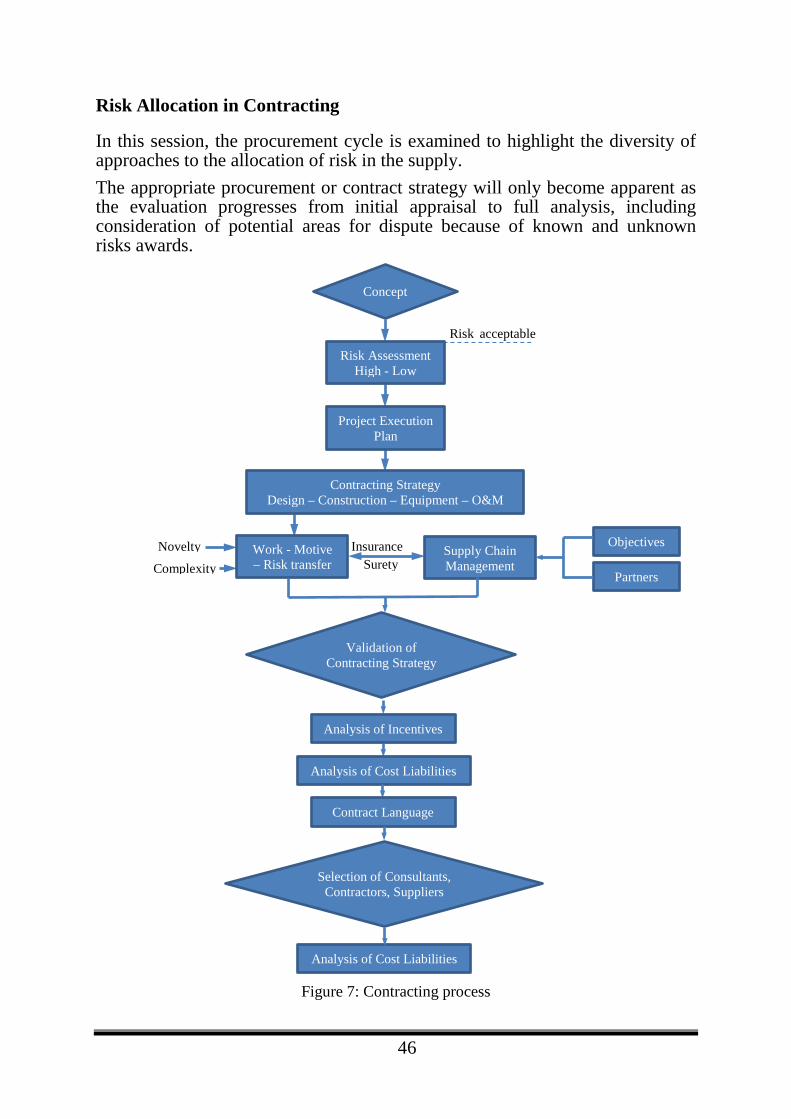
Risk Allocation in Contracting
In this session, the procurement cycle is examined to highlight the diversity of approaches to the allocation of risk in the supply. The appropriate procurement or contract strategy will only become apparent as the evaluation progresses from initial appraisal to full analysis, including consideration of potential areas for dispute because of known and unknown risks awards.
Figure 7: Contracting process
Insurance Surety
Novelty
Complexity
Risk acceptable
Concept
Risk Assessment High - Low
Project Execution Plan
Contracting Strategy Design – Construction – Equipment – O&M
Work - Motive – Risk transfer
Supply Chain Management
Validation of Contracting Strategy
Analysis of Incentives
Analysis of Cost Liabilities
Contract Language
Selection of Consultants, Contractors, Suppliers
Analysis of Cost Liabilities
Objectives
Partners
47
Known and Unknown Risks in Contracts The three main functions of contracts are:
1) work transfer: to define the work that one party will do for the other; 2) risk transfer: to define how the risks inherent in doing the work will be
allocated between the parties; and 3) motive transfer: to implant motives in the contractor that match those of
the client. During project appraisal, risks that may occur throughout the whole life of the project should be identified for the whole supply chain. These could then be considered based on: • which party can best control events;
• which party can best manage risks;
• which party should carry the risk if it cannot be controlled;
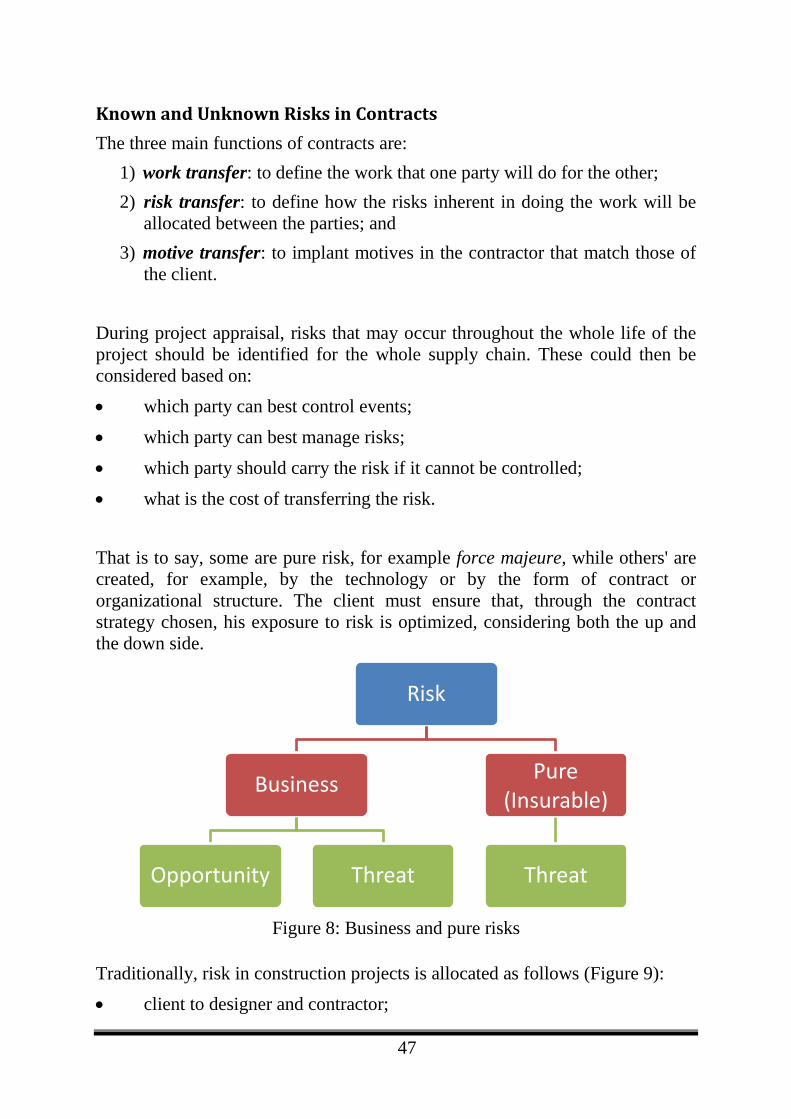
• what is the cost of transferring the risk. That is to say, some are pure risk, for example force majeure, while others' are created, for example, by the technology or by the form of contract or organizational structure. The client must ensure that, through the contract strategy chosen, his exposure to risk is optimized, considering both the up and the down side.
Figure 8: Business and pure risks
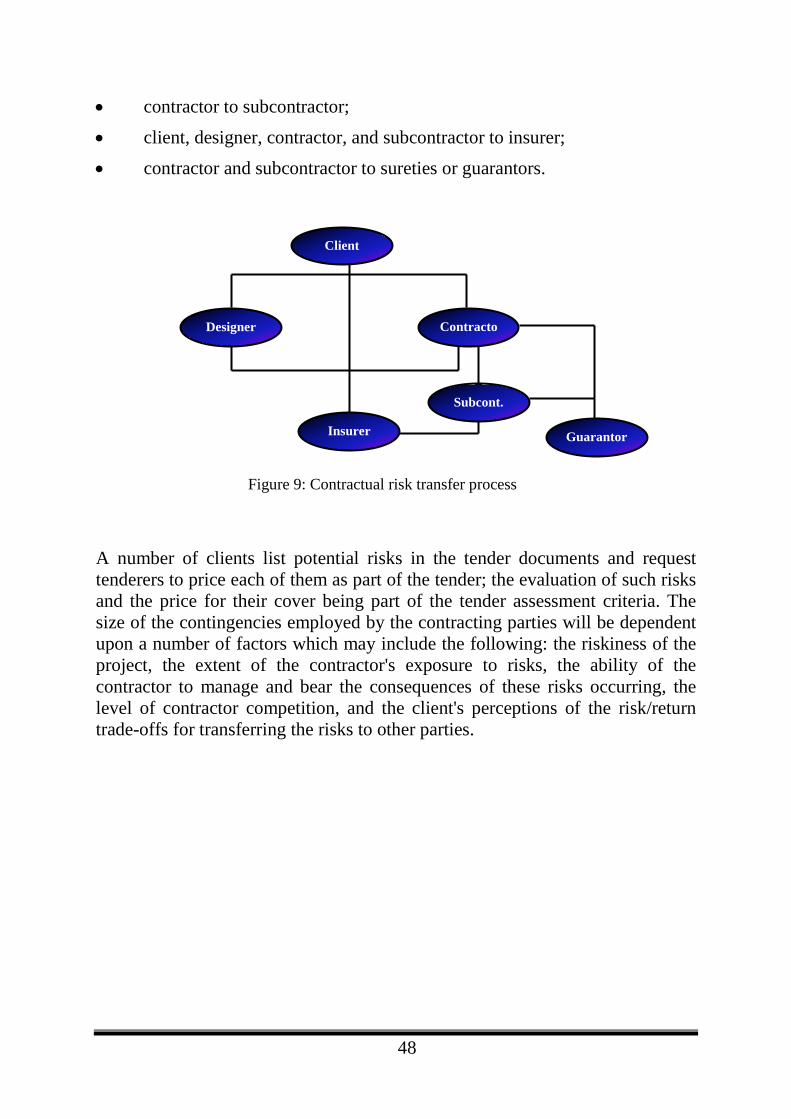
Traditionally, risk in construction projects is allocated as follows (Figure 9): • client to designer and contractor;
Risk
Business
Opportunity Threat
Pure (Insurable)
Threat
48
• contractor to subcontractor;
• client, designer, contractor, and subcontractor to insurer;
• contractor and subcontractor to sureties or guarantors.
A number of clients list potential risks in the tender documents and request tenderers to price each of them as part of the tender; the evaluation of such risks and the price for their cover being part of the tender assessment criteria. The size of the contingencies employed by the contracting parties will be dependent upon a number of factors which may include the following: the riskiness of the project, the extent of the contractor's exposure to risks, the ability of the contractor to manage and bear the consequences of these risks occurring, the level of contractor competition, and the client's perceptions of the risk/return trade-offs for transferring the risks to other parties.
Client
Designer Contracto
Subcont.
Insurer Guarantor
Figure 9: Contractual risk transfer process
49
Financial Risks
Types of Financial Risks Financial risks are common to most projects. In some cases, the financial risks are dependent on the occurrence of other risks such as delay in construction or reduced revenue generation. Typical financial risks include: • Interest: type of rate, fixed, floating or
capped, changes in interest rate, existing rates.
• Payback: loan period, fixed payments, cash flow milestones, discount rates, rate of return, scheduling of payments.
• Loan: type and source of loan, availability of loan, cost of servicing loan, default by lender, standby loan facility, debt/equity ratio, holding period, existing debt, covenants.
• Equity: institutional support, take-up of shares, type of equity offered.
• Dividends: time and amounts of dividend/coupon payments.
• Currencies: currencies of loan, ratio of local/base currencies, depreciation and devaluation of currencies.
• Market: changes in demand for facility or product, escalation of costs of raw materials and consumables, recession, economic downturn, quality of product, social acceptability of user pay policy, marketing of product and consumer resistance to tolls.
• Currency: convertibility of revenue currencies, fluctuation in exchange rates, devaluation.
50
Both borrowers and lenders need to adopt a risk management program. Risk management should not be approached in an ad hoc manner but structured. The five major steps of such a process are: (1) identify the financial objectives of the project; (2) identify the source of the risk exposure;
(3) quantify the exposure; (4) assess the impact of the exposure on business and financial strategy (5) respond to the exposure. The first stage is to develop a clear understanding of the project. Borrowers and lenders need to determine their objectives regarding the financing of a project. Many borrowers seek long-term loans with repayments made from revenues. The risk of not meeting repayments is often reduced when the borrower has sufficient earnings at the start of operation to service the debt. Many projects, however, suffer commissioning delays that increase the borrowers' loans and repayments. In many cases, borrowers will seek grace periods from lenders to cover such delays. Lenders seek positive cash flows and must ensure that their objectives are met by providing the best loan package. If a short-term loan is the lender's objective then the major risk will occur at the start of operation, and should the project not generate sufficient revenues the lender may need to consider debt for equity swaps. Once the project objectives are defined, the overall costs, including construction and operation costs, are determined and a cumulative cash flow model is prepared. The model can be used to quickly estimate the net present value (NPV), internal rate of return (IRR) and payback period of a project. It is essential that the estimates and programs prepared are reflective of cost and time over the project's life cycle. The risk of inaccurate estimates based on fixed budgets often leads to optimistic cash flows that do not truly illustrate the effects of risk occurring during a project.
51
Financial Risk in Concession Contracts In the context of concession projects there are two types of risk, those being elemental risks and global risks and are defined as: (1) elemental risks are those risks that may be controlled within the project
elements of a concession project; (2) global risks are those risks outside the project elements that may not be
controllable within the project elements of a concession project. Risk management is not a discrete activity but a fundamental of project management techniques and the responsibility of the complete project team. In concession projects, the project team representing the promoter needs to determine the risks associated with each contract prior to appraisal (Woodhouse-1993). Financial risk, political risk, and technical risk must be considered as major elements of projects as are pre-completion and post-completion risks. Political risks may adversely affect the facility during either of these phases. Specific legal risks may be broken down into three broad categories: political risks, construction risks, and operational risks.
52
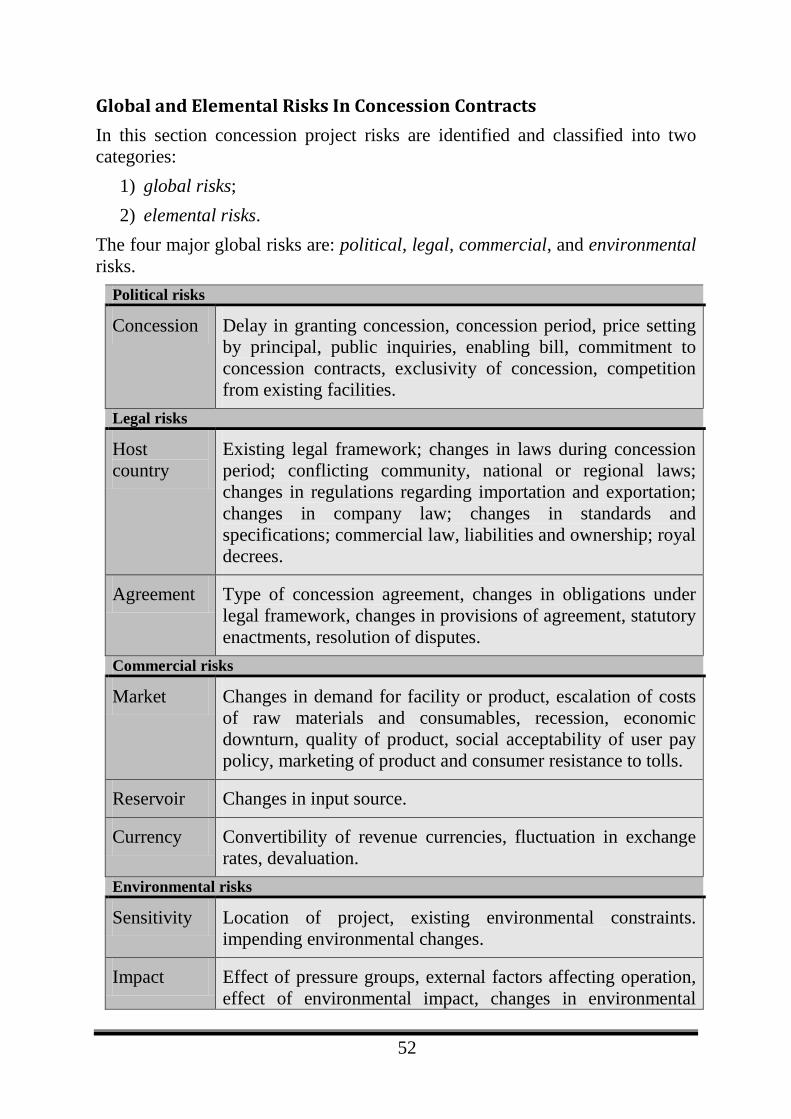
Global and Elemental Risks In Concession Contracts In this section concession project risks are identified and classified into two categories:
1) global risks; 2) elemental risks.
The four major global risks are: political, legal, commercial, and environmental risks.
Political risks
Concession Delay in granting concession, concession period, price setting by principal, public inquiries, enabling bill, commitment to concession contracts, exclusivity of concession, competition from existing facilities.
Legal risks
Host country
Existing legal framework; changes in laws during concession period; conflicting community, national or regional laws; changes in regulations regarding importation and exportation; changes in company law; changes in standards and specifications; commercial law, liabilities and ownership; royal decrees.
Agreement Type of concession agreement, changes in obligations under legal framework, changes in provisions of agreement, statutory enactments, resolution of disputes.
Commercial risks
Market Changes in demand for facility or product, escalation of costs of raw materials and consumables, recession, economic downturn, quality of product, social acceptability of user pay policy, marketing of product and consumer resistance to tolls.
Reservoir Changes in input source.
Currency Convertibility of revenue currencies, fluctuation in exchange rates, devaluation.
Environmental risks
Sensitivity Location of project, existing environmental constraints. impending environmental changes.
Impact Effect of pressure groups, external factors affecting operation, effect of environmental impact, changes in environmental
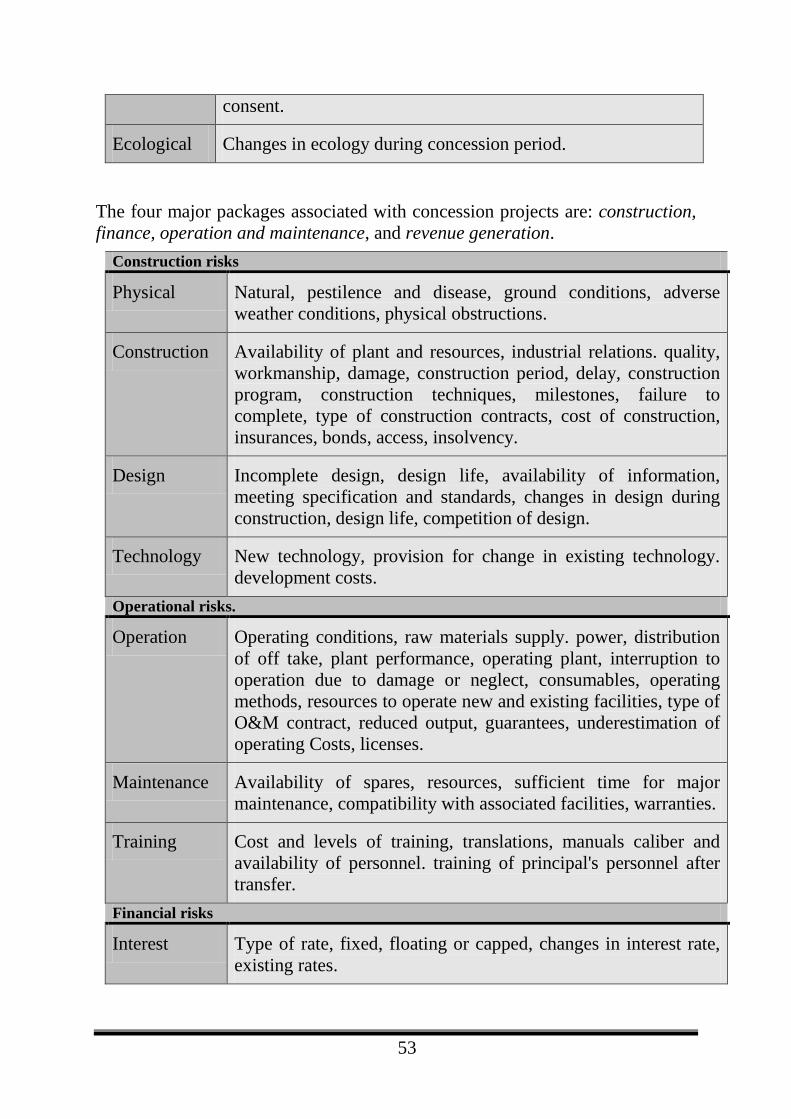
53
consent.
Ecological Changes in ecology during concession period.
The four major packages associated with concession projects are: construction, finance, operation and maintenance, and revenue generation.
Construction risks
Physical Natural, pestilence and disease, ground conditions, adverse weather conditions, physical obstructions.
Construction Availability of plant and resources, industrial relations. quality, workmanship, damage, construction period, delay, construction program, construction techniques, milestones, failure to complete, type of construction contracts, cost of construction, insurances, bonds, access, insolvency.
Design Incomplete design, design life, availability of information, meeting specification and standards, changes in design during construction, design life, competition of design.
Technology New technology, provision for change in existing technology. development costs.
Operational risks.
Operation Operating conditions, raw materials supply. power, distribution of off take, plant performance, operating plant, interruption to operation due to damage or neglect, consumables, operating methods, resources to operate new and existing facilities, type of O&M contract, reduced output, guarantees, underestimation of operating Costs, licenses.
Maintenance Availability of spares, resources, sufficient time for major maintenance, compatibility with associated facilities, warranties.
Training Cost and levels of training, translations, manuals caliber and availability of personnel. training of principal's personnel after transfer.
Financial risks
Interest Type of rate, fixed, floating or capped, changes in interest rate, existing rates.
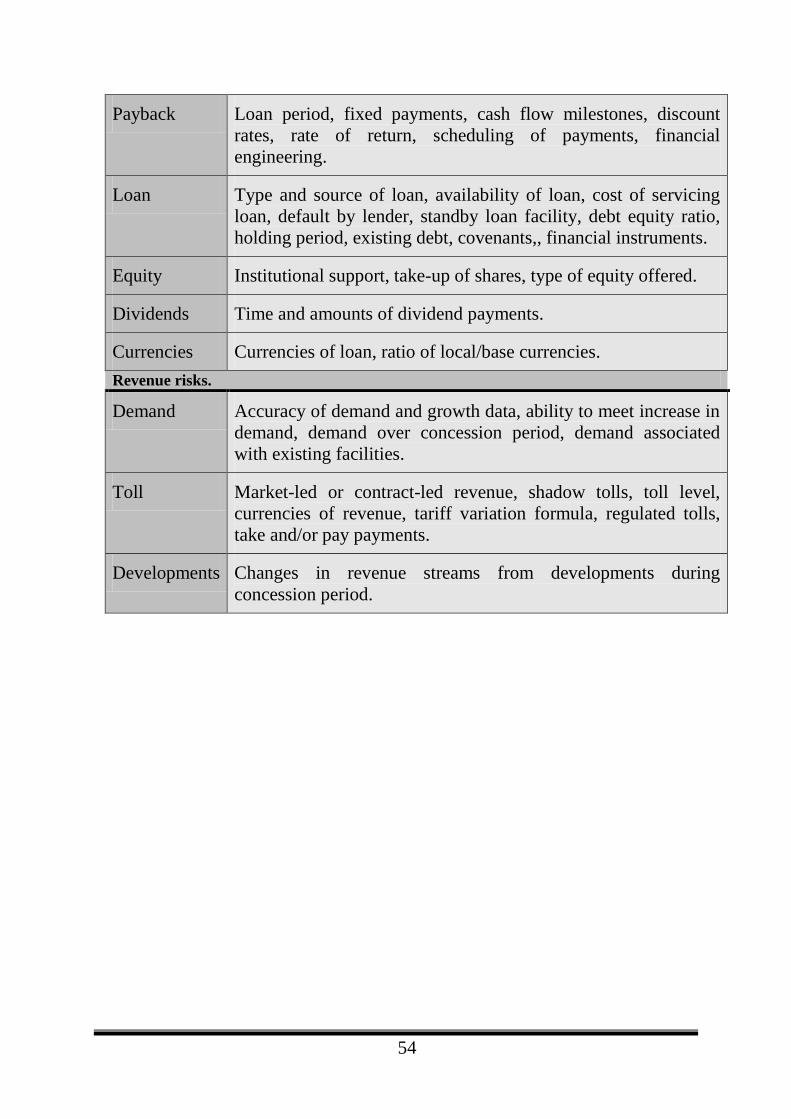
54
Payback Loan period, fixed payments, cash flow milestones, discount rates, rate of return, scheduling of payments, financial engineering.
Loan Type and source of loan, availability of loan, cost of servicing loan, default by lender, standby loan facility, debt equity ratio, holding period, existing debt, covenants,, financial instruments.
Equity Institutional support, take-up of shares, type of equity offered.
Dividends Time and amounts of dividend payments.
Currencies Currencies of loan, ratio of local/base currencies. Revenue risks.
Demand Accuracy of demand and growth data, ability to meet increase in demand, demand over concession period, demand associated with existing facilities.
Toll Market-led or contract-led revenue, shadow tolls, toll level, currencies of revenue, tariff variation formula, regulated tolls, take and/or pay payments.
Developments Changes in revenue streams from developments during concession period.
55
QUALITATIVE ANALYSIS • Often the first stage in any analysis has to be a qualitative approach because
there is insufficient information available to proceed with any quantitative methods.
• The value of a risk log is reviewed. • Finally, the methodology is examined in detail. Qualitative Risk Assessment Qualitative risk assessment is the most useful part of the risk management process and it lays the foundation for all the subsequent stages in that process, including the quantitative analyses that are frequently required to define budgets and time-scales. Applying weighting factors to the qualitative assessment provides a quasi-quantitative form of analysis. Review of Project Schedules and Budgets It is important that a project's schedules and budgets are realistic if it is to meet its objectives in terms of its quality and performance even as remaining within its predetermined time-scale and budget. Unless the budget and program are achievable, it is unlikely that risk analysis will predict the out-turn cost and duration. This depends upon several factors including: • the experience of the project management organization;
• the amount of relevant data from closely similar projects that can form the basis of performance specifications, estimates and programs;
• the extent of innovation; and
• the size and complexity of the project. Budgets should be based on a realistic schedule for the work taking into account resource provision, productivity, time-related costs, and risks. The outline schedule should be checked to ensure that: • all the key activities have been identified;
• the durations are realistic; and
• the logic links and any other constraints are correct.
56
Such constraints may include, for example, the links to, or dependencies on: • other projects;
• approvals for safety cases;
• approvals by statutory authorities (planning permission, etc.);
• approval of programs on method statements; and
• approval of subcontracts and materials. If the schedule is in network form, the critical path(s), free and total float must be identified. All assumptions underlying the budget and program must be identified and logged. Within each project the following interfaces must be identified to ensure that they are included in the program and managed effectively: • between design groups;
• between design groups and specialists;
• between design and procurement;
• between design and construction; • between procurement and construction; and
• with other projects. Management will be facilitated by ensuring that each such interface is logged as a risk so that the following data are recorded and the following actions are undertaken: • define data each party requires from others;
• define when they are required;
• agree assumptions if data are not available on time;
• log the assumptions; • revise assumptions until final data are available;
• specify physical factors:
• spatial positions;
• loadings;
• capacity,
57
The Risk Log/Register The results of the interviews and reviews of the schedule and budget should form the basis for a risk log or risk register that will list all the identified risks. It will also contain assessments of their potential impact on the budget, schedule, and quality/performance aspects of the project. To aid manipulation, the risk log may include: • project phase; • the owner of the risk;
• location;
• other use-defined categories, for example, cross-references to the project schedule and budget.
The risk log will also contain the information on actions to avoid, mitigate, or transfer risks, the secondary risks arising, and possible fallback plans.
58
Risk probability & impact assessment This tool assesses the probability that the identified risk events will occur, and it determines the effect their impacts have on the project objectives, including time, scope, quality, and cost. Analyzing risks in this way allows you to determine which risks require the most aggressive management.
Probability Probability is the likelihood that an event will occur. The classic example is flipping a coin. There is a 0.50 probability of getting heads and a 0.50 probability of getting tails on the flip. Note that the probability that an event will occur plus the probability that the event will not occur always equals 1.0. Determining risk probability can be difficult because it’s most commonly accomplished using expert judgment. This means you are guessing (or asking other experts to guess) at the probability a risk event will occur.
Impact Impact is the amount of pain (or the amount of gain) the risk event poses to the project. The risk impact scale can be a relative scale that assigns values such as high-medium-low (or some combination of these) or a numeric scale known as a cardinal scale. Cardinal scale values are actual numeric values assigned to the risk impact. Cardinal scales are expressed as values from 0.0 to 1.0 and can be stated in equal (linear) or unequal (nonlinear) increments.
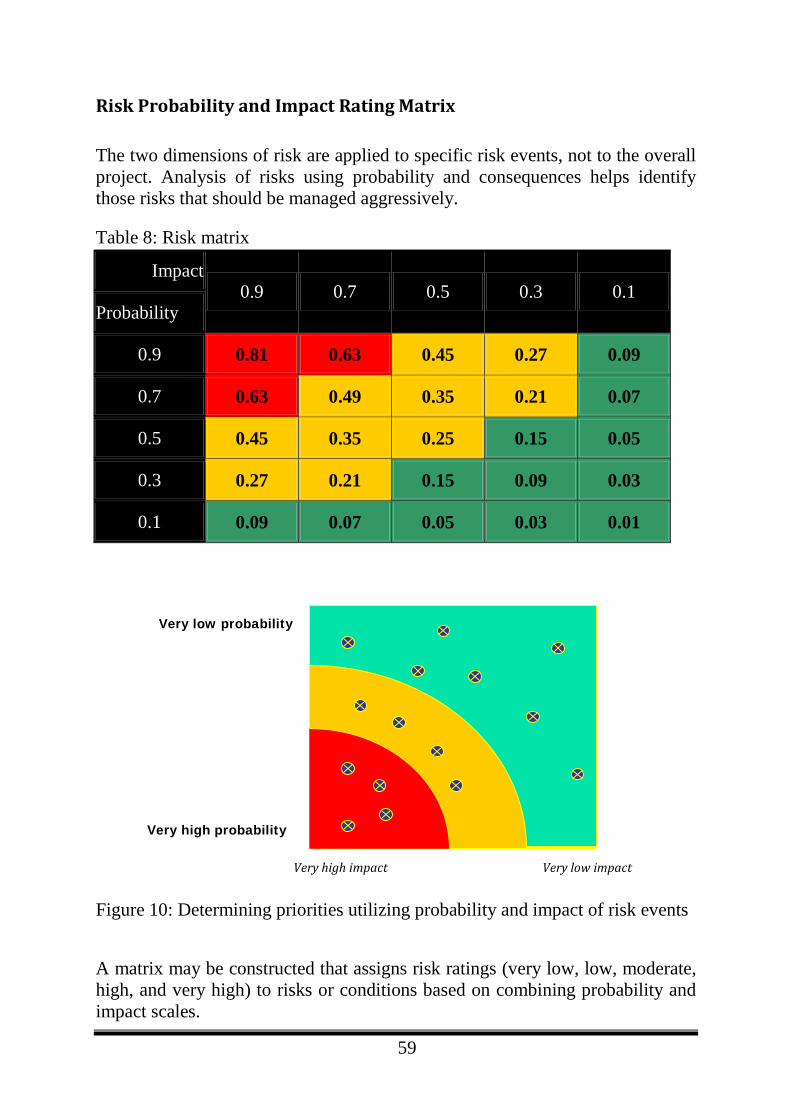
59
Risk Probability and Impact Rating Matrix
The two dimensions of risk are applied to specific risk events, not to the overall project. Analysis of risks using probability and consequences helps identify those risks that should be managed aggressively.
Table 8: Risk matrix
Impact 0.9 0.7 0.5 0.3 0.1
Probability
0.9 0.81 0.63 0.45 0.27 0.09
0.7 0.63 0.49 0.35 0.21 0.07
0.5 0.45 0.35 0.25 0.15 0.05
0.3 0.27 0.21 0.15 0.09 0.03
0.1 0.09 0.07 0.05 0.03 0.01
Figure 10: Determining priorities utilizing probability and impact of risk events A matrix may be constructed that assigns risk ratings (very low, low, moderate, high, and very high) to risks or conditions based on combining probability and impact scales.
Very high impact
Very high probability
Very low probability
Very low impact

60
Risks with high probability and high impact are likely to require further analysis, including quantification, and aggressive risk management. A risk’s probability scale naturally falls between 0.0 (no probability) and 1.0 (certainty). Assessing risk probability may be difficult because expert judgment is used, often without benefit of historical data. An ordinal scale, representing relative probability values from very unlikely to almost certain, could be used. Alternatively, specific probabilities could be assigned by using a general scale (e.g., .1 / .3 / .5 / .7 / .9).
Table 9: Detailed priority-setting matrix
Consequences
Likelihood Insignificant Minor Moderate Major Catastrophic
Almost certain Medium Medium High High High
Likely Medium Medium Medium High High
Possible Low Medium Medium Medium High
Unlikely Low Low Medium Medium Medium
Rare Low Low Low Medium Medium
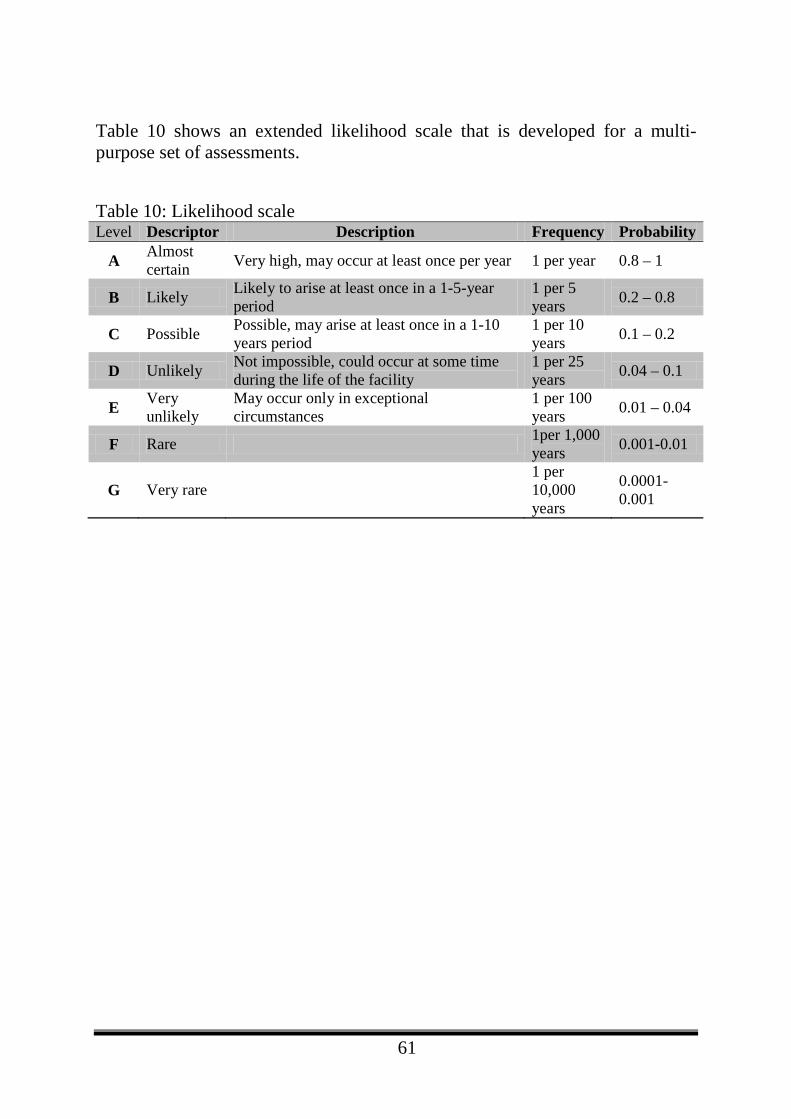
61
Table 10 shows an extended likelihood scale that is developed for a multi-purpose set of assessments. Table 10: Likelihood scale Level Descriptor Description Frequency Probability
A Almost certain Very high, may occur at least once per year 1 per year 0.8 – 1
B Likely Likely to arise at least once in a 1-5-year period
1 per 5 years 0.2 – 0.8
C Possible Possible, may arise at least once in a 1-10 years period
1 per 10 years 0.1 – 0.2
D Unlikely Not impossible, could occur at some time during the life of the facility
1 per 25 years 0.04 – 0.1
E Very unlikely
May occur only in exceptional circumstances
1 per 100 years 0.01 – 0.04
F Rare 1per 1,000 years 0.001-0.01
G Very rare 1 per 10,000 years
0.0001-0.001
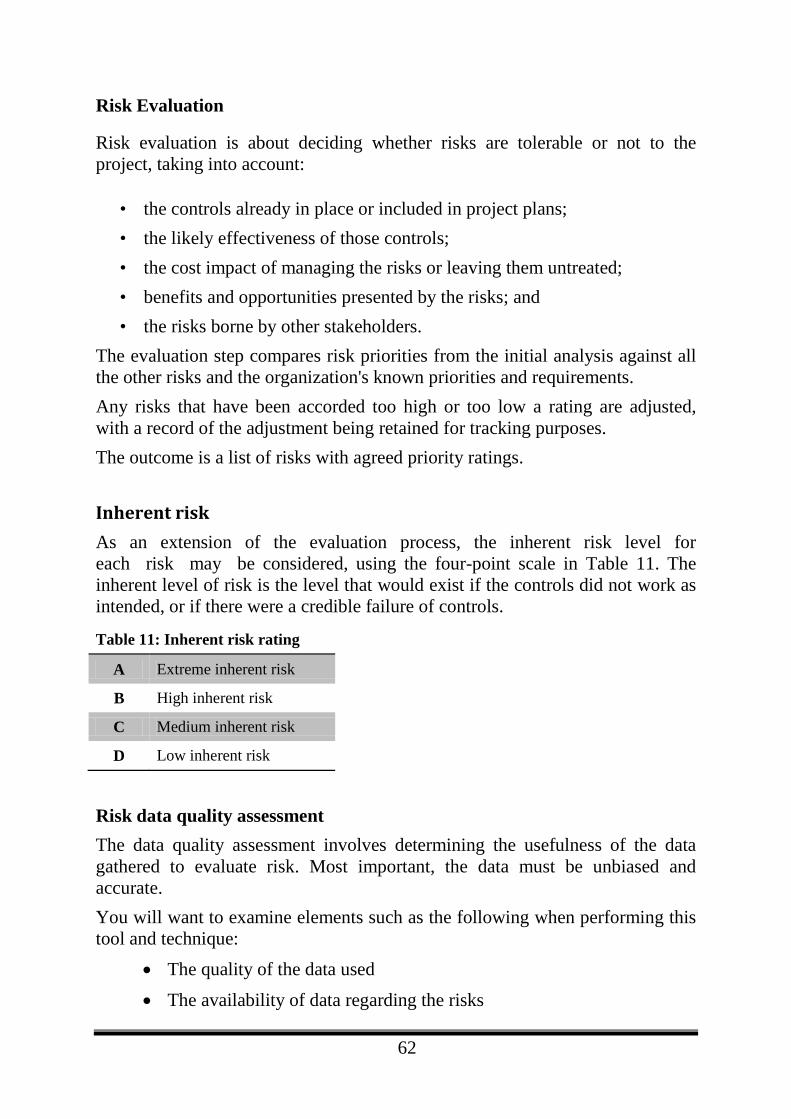
62
Risk Evaluation
Risk evaluation is about deciding whether risks are tolerable or not to the project, taking into account:
• the controls already in place or included in project plans; • the likely effectiveness of those controls; • the cost impact of managing the risks or leaving them untreated; • benefits and opportunities presented by the risks; and • the risks borne by other stakeholders.
The evaluation step compares risk priorities from the initial analysis against all the other risks and the organization's known priorities and requirements. Any risks that have been accorded too high or too low a rating are adjusted, with a record of the adjustment being retained for tracking purposes. The outcome is a list of risks with agreed priority ratings.
Inherent risk As an extension of the evaluation process, the inherent risk level for each risk may be considered, using the four-point scale in Table 11. The inherent level of risk is the level that would exist if the controls did not work as intended, or if there were a credible failure of controls.
Table 11: Inherent risk rating
A Extreme inherent risk
B High inherent risk
C Medium inherent risk
D Low inherent risk
Risk data quality assessment The data quality assessment involves determining the usefulness of the data gathered to evaluate risk. Most important, the data must be unbiased and accurate. You will want to examine elements such as the following when performing this tool and technique:
• The quality of the data used
• The availability of data regarding the risks
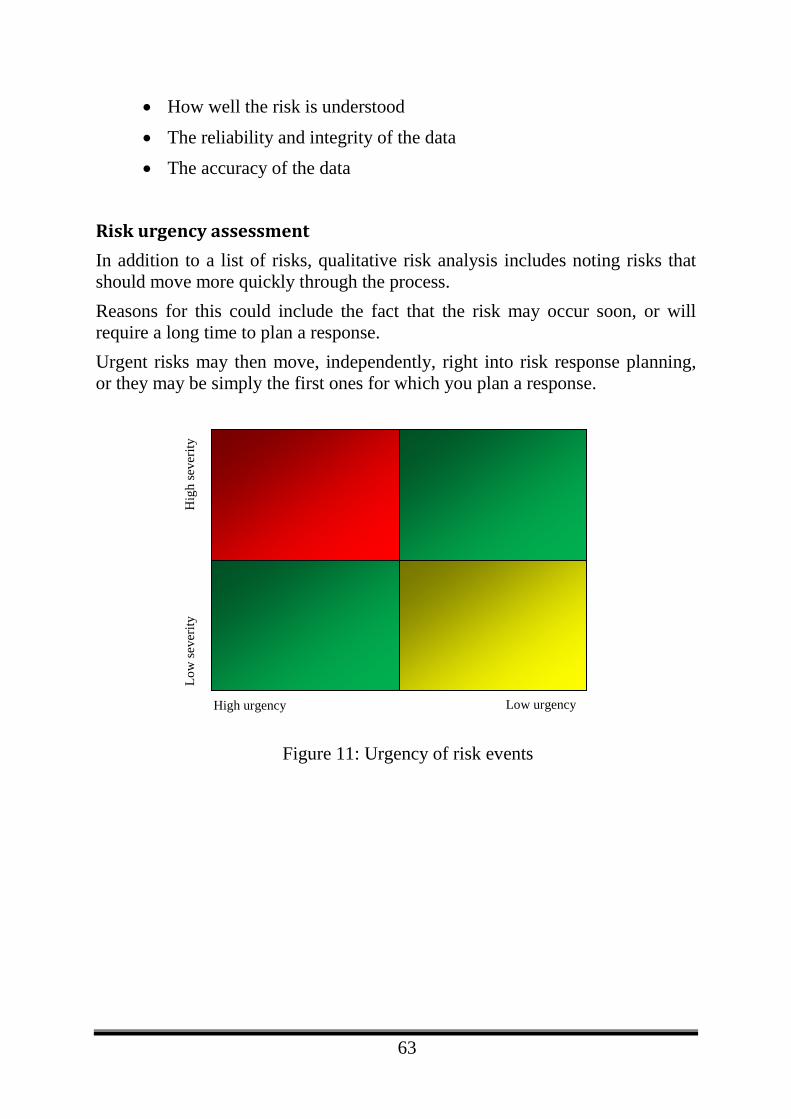
63
• How well the risk is understood
• The reliability and integrity of the data • The accuracy of the data
Risk urgency assessment In addition to a list of risks, qualitative risk analysis includes noting risks that should move more quickly through the process. Reasons for this could include the fact that the risk may occur soon, or will require a long time to plan a response. Urgent risks may then move, independently, right into risk response planning, or they may be simply the first ones for which you plan a response.
Figure 11: Urgency of risk events
High urgency Low urgency
Hig
h se
verit
y Lo
w se
verit
y
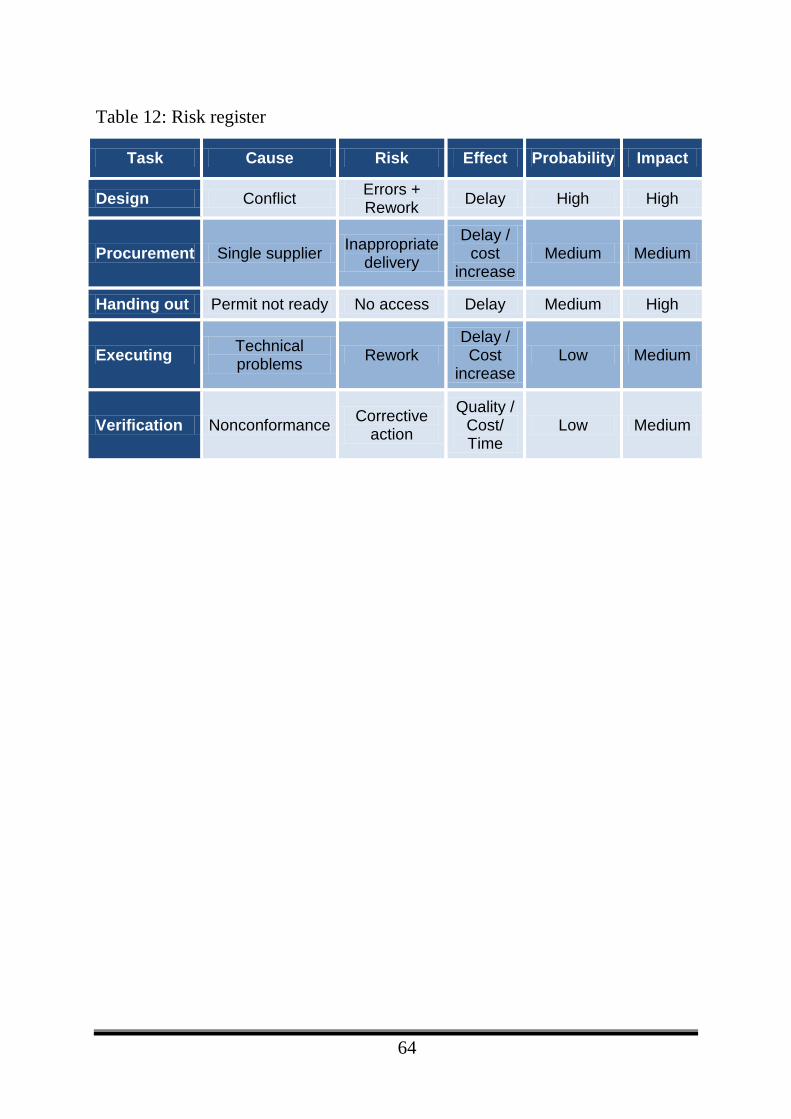
64
Table 12: Risk register
Task Cause Risk Effect Probability Impact
Design Conflict Errors + Rework Delay High High
Procurement Single supplier Inappropriate delivery
Delay / cost
increase Medium Medium
Handing out Permit not ready No access Delay Medium High
Executing Technical problems Rework
Delay / Cost
increase Low Medium
Verification Nonconformance Corrective action
Quality / Cost/ Time
Low Medium
65
RISK QUANTIFICATION The quantitative risk analysis process aims to analyze numerically the probability of each risk and its consequence on project objectives, as well as the extent of overall project risk. This process uses techniques such as Monte Carlo simulation and decision analysis to:
• Determine the probability of achieving a specific project objective.
• Quantify the risk exposure for the project, and determine the size of cost and schedule contingency reserves that may be needed.
• Identify risks requiring the most attention by quantifying their relative contribution to project risk.
• Identify realistic and achievable cost, schedule, or scope targets. Quantitative risk analysis generally follows qualitative risk analysis. The qualitative and quantitative risk analysis processes can be used separately or together. Trends in the results when quantitative analysis is repeated can indicate the need for more or less risk management action.
66
Risk Quantitative Analysis
While the early sections set out detailed processes for implementing risk management in a qualitative or semi-quantitative framework, they do not address quantification in any detail. The following sections show how the aggregate uncertainty associated with a project can be evaluated using quantitative risk models in a variety of circumstances. Quantitative modeling provides a framework within which to integrate individual risks into an overall assessment to support decision-making and management control.
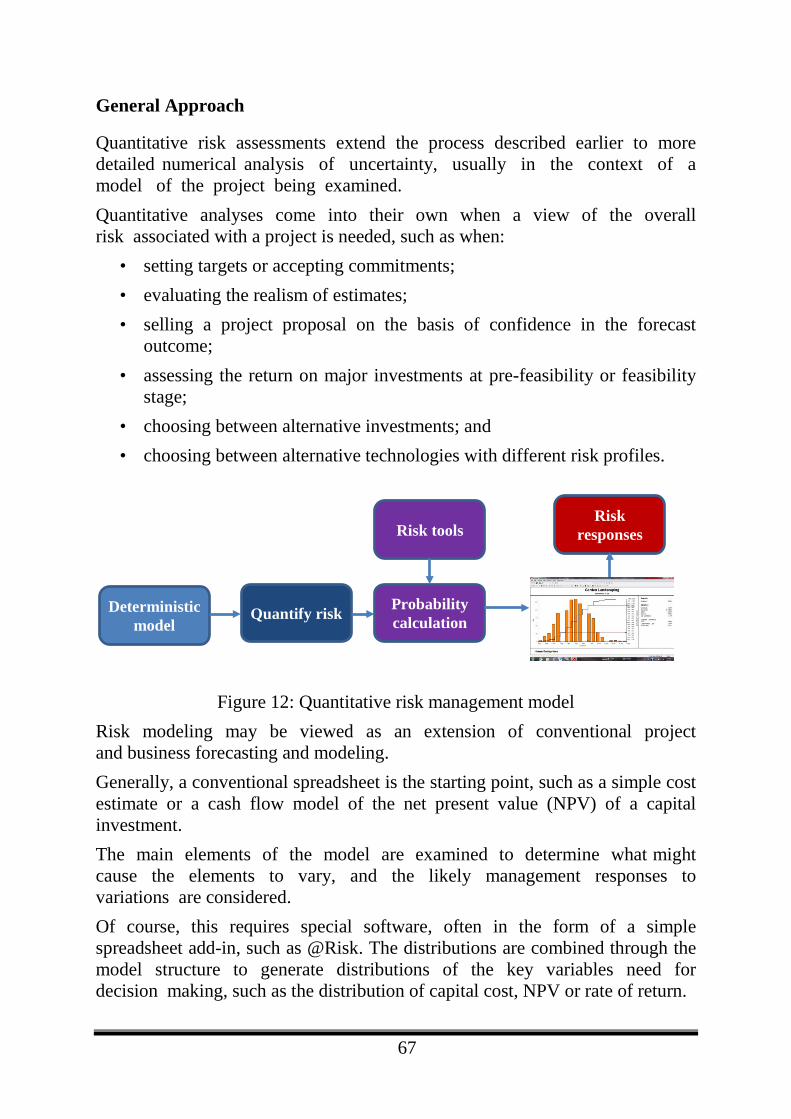
67
General Approach
Quantitative risk assessments extend the process described earlier to more detailed numerical analysis of uncertainty, usually in the context of a model of the project being examined. Quantitative analyses come into their own when a view of the overall risk associated with a project is needed, such as when:
• setting targets or accepting commitments; • evaluating the realism of estimates; • selling a project proposal on the basis of confidence in the forecast
outcome; • assessing the return on major investments at pre-feasibility or feasibility
stage; • choosing between alternative investments; and • choosing between alternative technologies with different risk profiles.
Figure 12: Quantitative risk management model
Risk modeling may be viewed as an extension of conventional project and business forecasting and modeling. Generally, a conventional spreadsheet is the starting point, such as a simple cost estimate or a cash flow model of the net present value (NPV) of a capital investment. The main elements of the model are examined to determine what might cause the elements to vary, and the likely management responses to variations are considered. Of course, this requires special software, often in the form of a simple spreadsheet add-in, such as @Risk. The distributions are combined through the model structure to generate distributions of the key variables need for decision making, such as the distribution of capital cost, NPV or rate of return.
Deterministic model
Probability calculation Quantify risk
Risk responses Risk tools
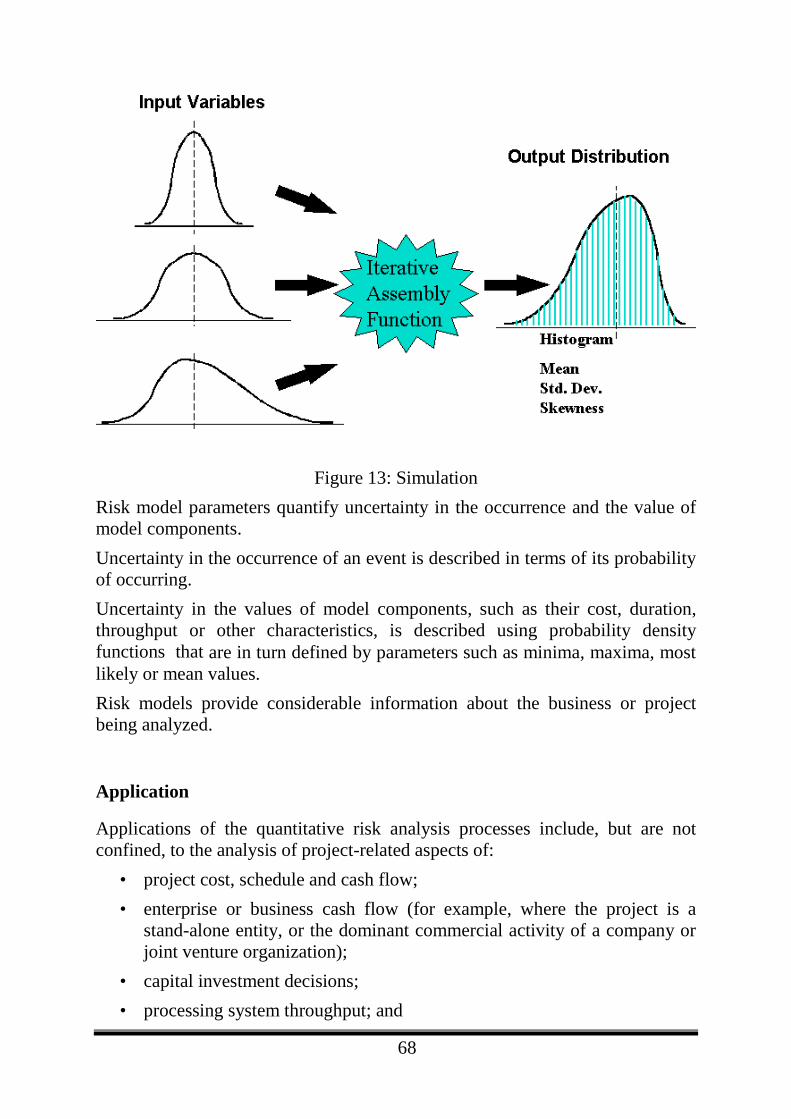
68
Figure 13: Simulation Risk model parameters quantify uncertainty in the occurrence and the value of model components. Uncertainty in the occurrence of an event is described in terms of its probability of occurring. Uncertainty in the values of model components, such as their cost, duration, throughput or other characteristics, is described using probability density functions that are in turn defined by parameters such as minima, maxima, most likely or mean values. Risk models provide considerable information about the business or project being analyzed.
Application
Applications of the quantitative risk analysis processes include, but are not confined, to the analysis of project-related aspects of:
• project cost, schedule and cash flow; • enterprise or business cash flow (for example, where the project is a
stand-alone entity, or the dominant commercial activity of a company or joint venture organization);
• capital investment decisions; • processing system throughput; and

69
• marketing and sales forecasts and project revenues; • go/no-go investment decisions; • establishing or negotiating targets, commitments and contingency
amounts; • evaluating the realism of established targets and commitments; • planning risk treatments that will reduce overall project uncertainty; and • prioritizing sources of uncertainty and establishing the extent to
which various stake- holders can control the overall uncertainty in a project.
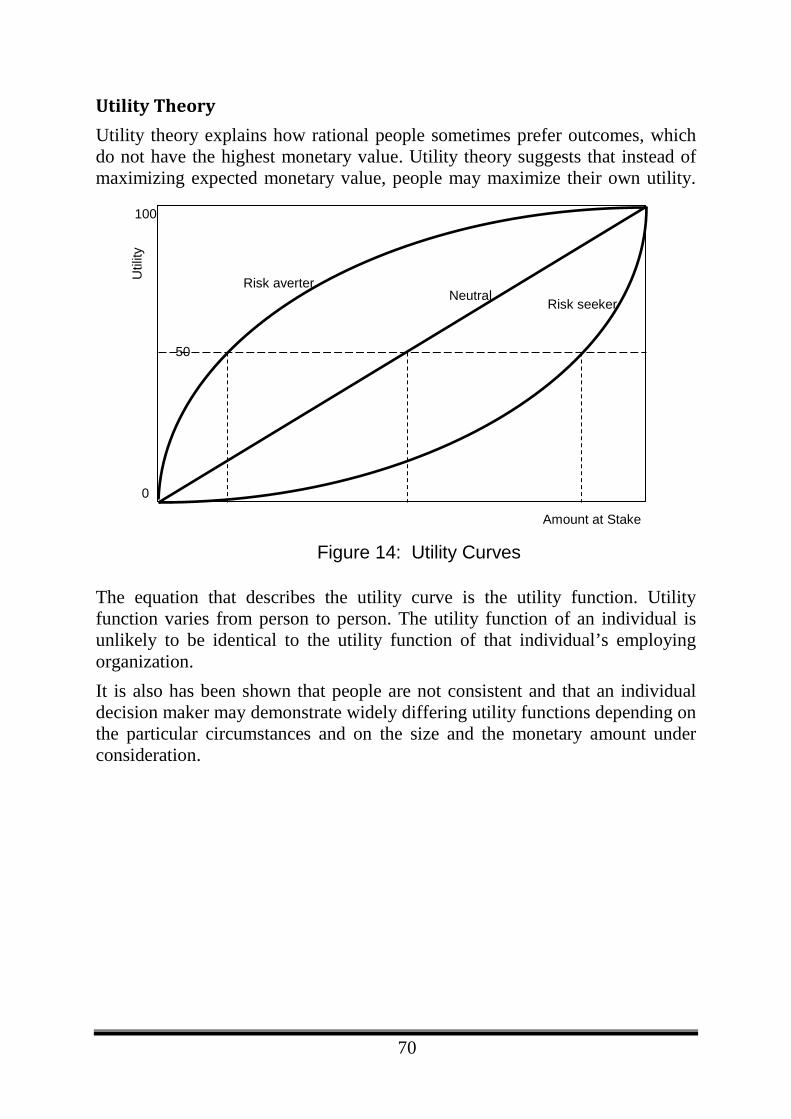
70
Utility Theory Utility theory explains how rational people sometimes prefer outcomes, which do not have the highest monetary value. Utility theory suggests that instead of maximizing expected monetary value, people may maximize their own utility.
The equation that describes the utility curve is the utility function. Utility function varies from person to person. The utility function of an individual is unlikely to be identical to the utility function of that individual’s employing organization. It is also has been shown that people are not consistent and that an individual decision maker may demonstrate widely differing utility functions depending on the particular circumstances and on the size and the monetary amount under consideration.
0
50
100
Amount at Stake
Util
ity
Figure 14: Utility Curves
Risk seeker Neutral Risk averter
71
Risk attitude is concerned with the trade-off that people will make between uncertain payoffs of known probability and sure payoffs, again with known probability. Expected utility is a measure of the individual's implicit value, or preference, for each policy in the risk environment. This measure is represented by a numerical value associated with each monetary gain and loss in order to indicate the utility of these monetary values to the decision-maker. The following rules must be obeyed:
• the more desirable an outcome, the higher the utility measure will be. For example, winning $50 without any risk will have a higher utility measure than winning $5 without any risk;
• if a decision-maker prefers outcome A to outcome B, and he prefers outcome B to outcome C, then A will be preferred to outcome C;
• if a decision-maker is indifferent between two outcomes, they have equal utility.
72
Perform Quantitative Risk Management
Data gathering & representation techniques This technique is like the interviewing technique discussed earlier. Project team members, stakeholders, and subject matter experts are prime candidates for risk interviews. They are asked about their experiences on past projects and about working with the types of technology or processes you’ll use during this project. When using this technique, it is required first to determine what methods of probability distribution. The chosen technique will dictate the type of information needed to gather. For example, the team may use the three-point scale that assesses the optimistic, pessimistic, and most likely risk scenarios or take it a step further and use standard deviations calculations.
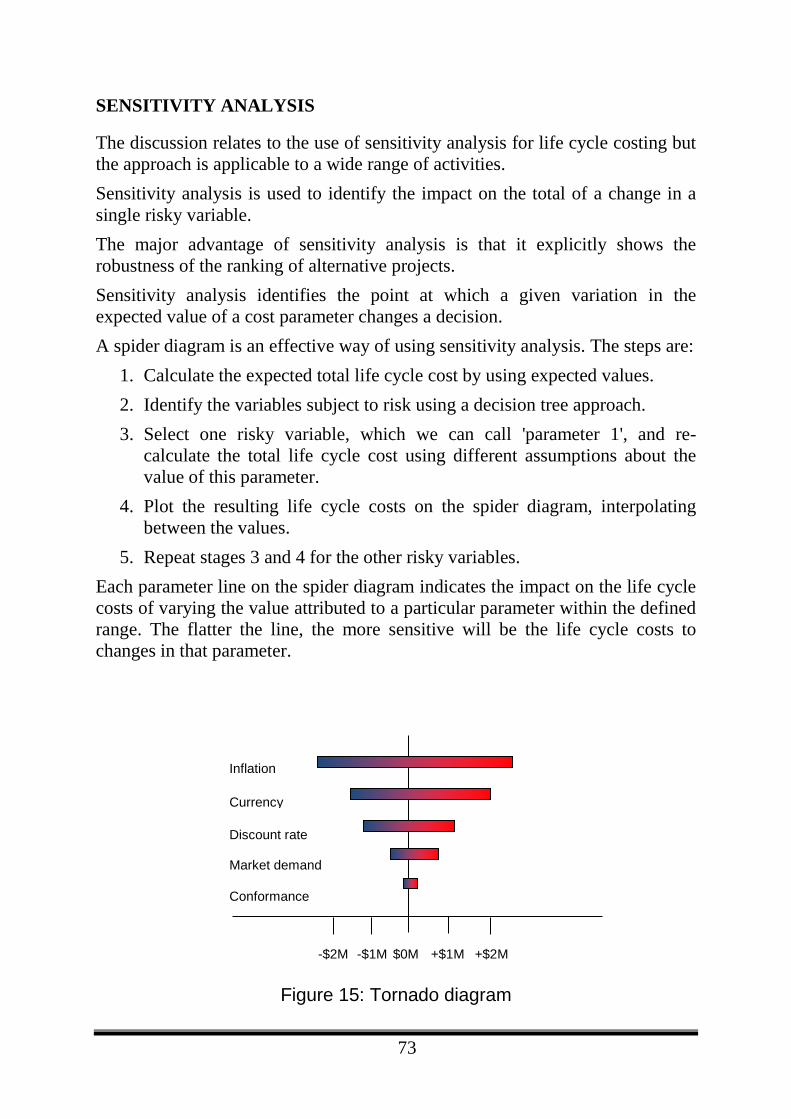
73
SENSITIVITY ANALYSIS
The discussion relates to the use of sensitivity analysis for life cycle costing but the approach is applicable to a wide range of activities. Sensitivity analysis is used to identify the impact on the total of a change in a single risky variable. The major advantage of sensitivity analysis is that it explicitly shows the robustness of the ranking of alternative projects. Sensitivity analysis identifies the point at which a given variation in the expected value of a cost parameter changes a decision. A spider diagram is an effective way of using sensitivity analysis. The steps are:
1. Calculate the expected total life cycle cost by using expected values. 2. Identify the variables subject to risk using a decision tree approach. 3. Select one risky variable, which we can call 'parameter 1', and re-
calculate the total life cycle cost using different assumptions about the value of this parameter.
4. Plot the resulting life cycle costs on the spider diagram, interpolating between the values.
5. Repeat stages 3 and 4 for the other risky variables. Each parameter line on the spider diagram indicates the impact on the life cycle costs of varying the value attributed to a particular parameter within the defined range. The flatter the line, the more sensitive will be the life cycle costs to changes in that parameter.
Figure 15: Tornado diagram
Inflation
Currency
Discount rate
Market demand
Conformance
-$2M -$1M $0M +$1M +$2M
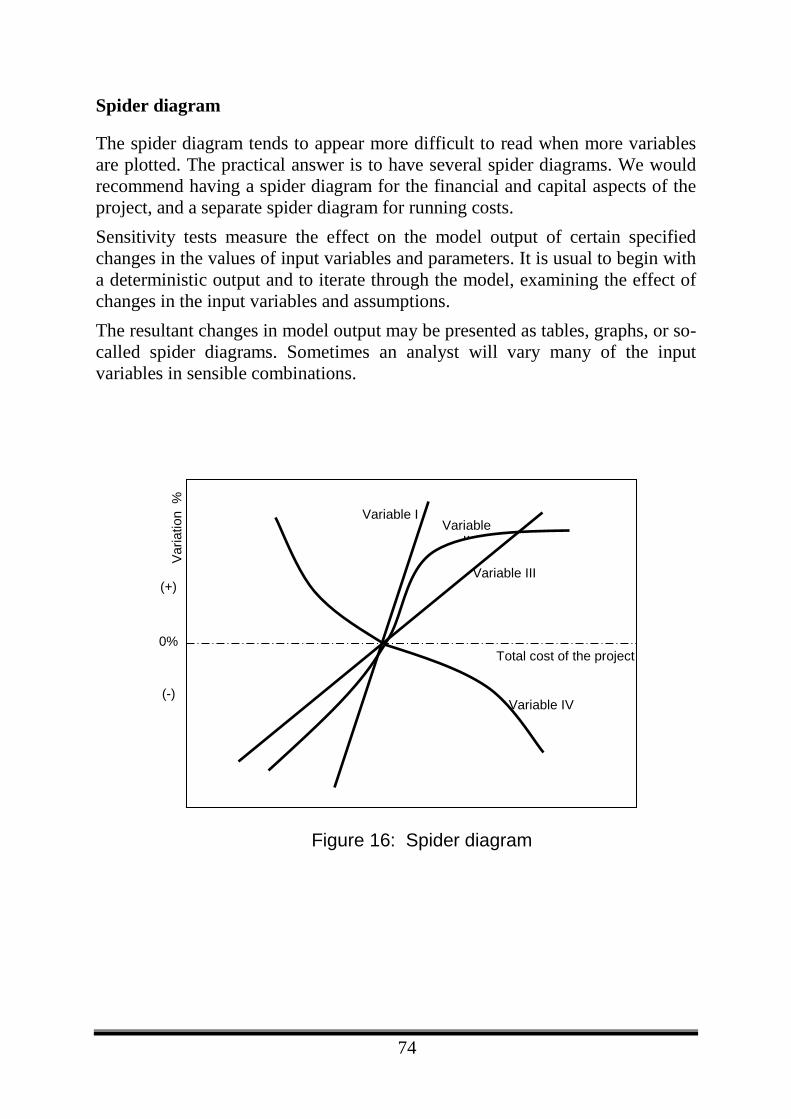
74
Spider diagram
The spider diagram tends to appear more difficult to read when more variables are plotted. The practical answer is to have several spider diagrams. We would recommend having a spider diagram for the financial and capital aspects of the project, and a separate spider diagram for running costs. Sensitivity tests measure the effect on the model output of certain specified changes in the values of input variables and parameters. It is usual to begin with a deterministic output and to iterate through the model, examining the effect of changes in the input variables and assumptions. The resultant changes in model output may be presented as tables, graphs, or so-called spider diagrams. Sometimes an analyst will vary many of the input variables in sensible combinations.
Total cost of the project
Variable I Variable
II
Variable III
Varia
tion
%
0%
(+)
(-)
Figure 16: Spider diagram
Variable IV
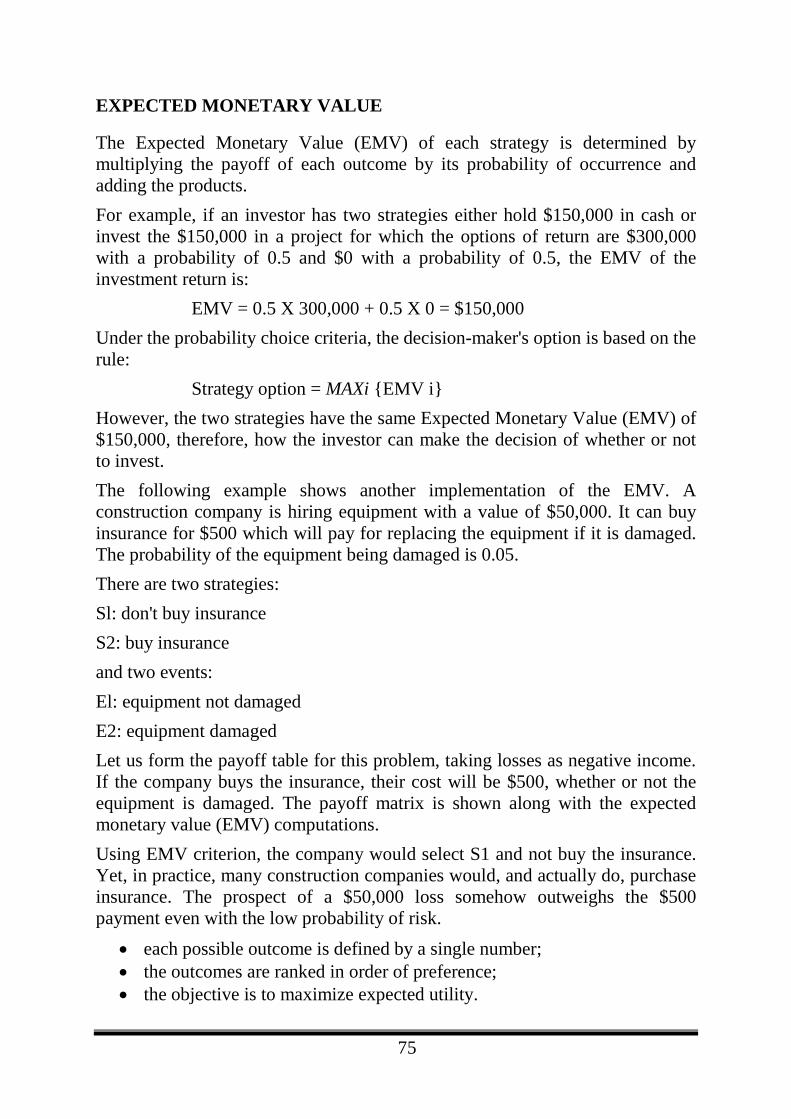
75
EXPECTED MONETARY VALUE
The Expected Monetary Value (EMV) of each strategy is determined by multiplying the payoff of each outcome by its probability of occurrence and adding the products. For example, if an investor has two strategies either hold $150,000 in cash or invest the $150,000 in a project for which the options of return are $300,000 with a probability of 0.5 and $0 with a probability of 0.5, the EMV of the investment return is:
EMV = 0.5 X 300,000 + 0.5 X 0 = $150,000 Under the probability choice criteria, the decision-maker's option is based on the rule:
Strategy option = MAXi {EMV i} However, the two strategies have the same Expected Monetary Value (EMV) of $150,000, therefore, how the investor can make the decision of whether or not to invest. The following example shows another implementation of the EMV. A construction company is hiring equipment with a value of $50,000. It can buy insurance for $500 which will pay for replacing the equipment if it is damaged. The probability of the equipment being damaged is 0.05. There are two strategies: Sl: don't buy insurance S2: buy insurance and two events: El: equipment not damaged E2: equipment damaged Let us form the payoff table for this problem, taking losses as negative income. If the company buys the insurance, their cost will be $500, whether or not the equipment is damaged. The payoff matrix is shown along with the expected monetary value (EMV) computations. Using EMV criterion, the company would select S1 and not buy the insurance. Yet, in practice, many construction companies would, and actually do, purchase insurance. The prospect of a $50,000 loss somehow outweighs the $500 payment even with the low probability of risk.
• each possible outcome is defined by a single number; • the outcomes are ranked in order of preference; • the objective is to maximize expected utility.
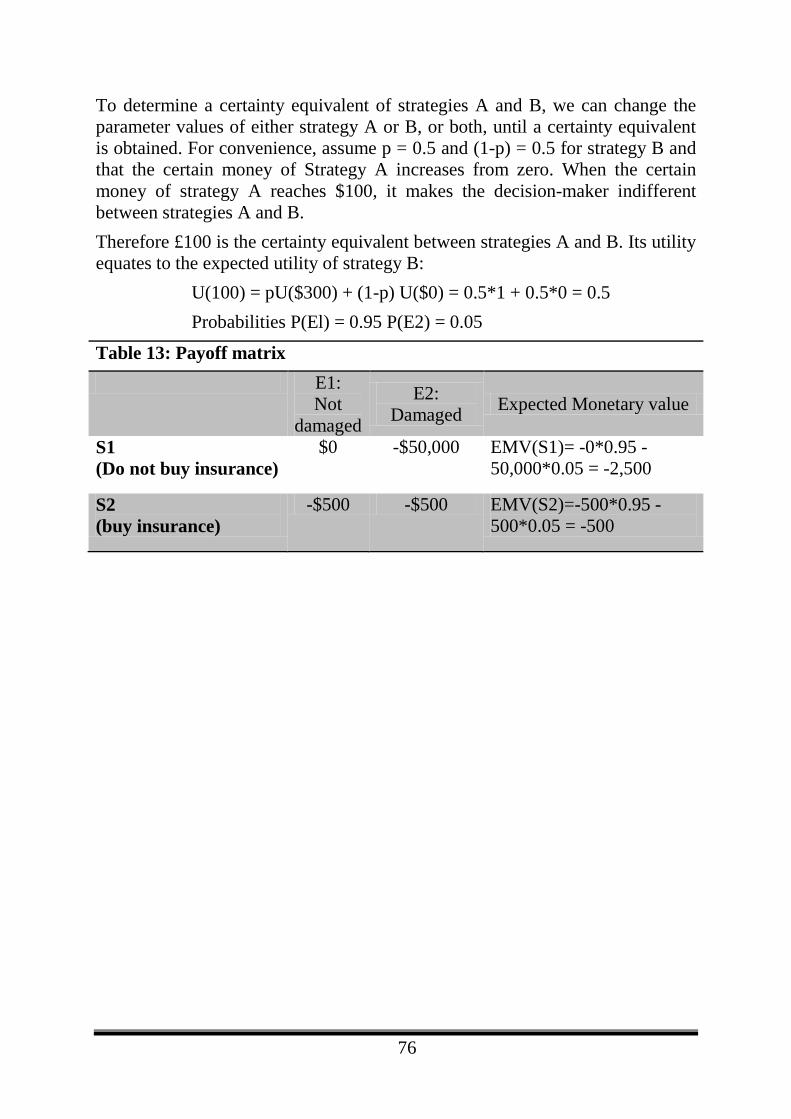
76
To determine a certainty equivalent of strategies A and B, we can change the parameter values of either strategy A or B, or both, until a certainty equivalent is obtained. For convenience, assume p = 0.5 and (1-p) = 0.5 for strategy B and that the certain money of Strategy A increases from zero. When the certain money of strategy A reaches $100, it makes the decision-maker indifferent between strategies A and B. Therefore £100 is the certainty equivalent between strategies A and B. Its utility equates to the expected utility of strategy B:
U(100) = pU($300) + (1-p) U($0) = 0.5*1 + 0.5*0 = 0.5 Probabilities P(El) = 0.95 P(E2) = 0.05
Table 13: Payoff matrix E1:
Not damaged
E2: Damaged Expected Monetary value
S1 (Do not buy insurance)
$0 -$50,000 EMV(S1)= -0*0.95 -50,000*0.05 = -2,500
S2 (buy insurance)
-$500 -$500 EMV(S2)=-500*0.95 -500*0.05 = -500
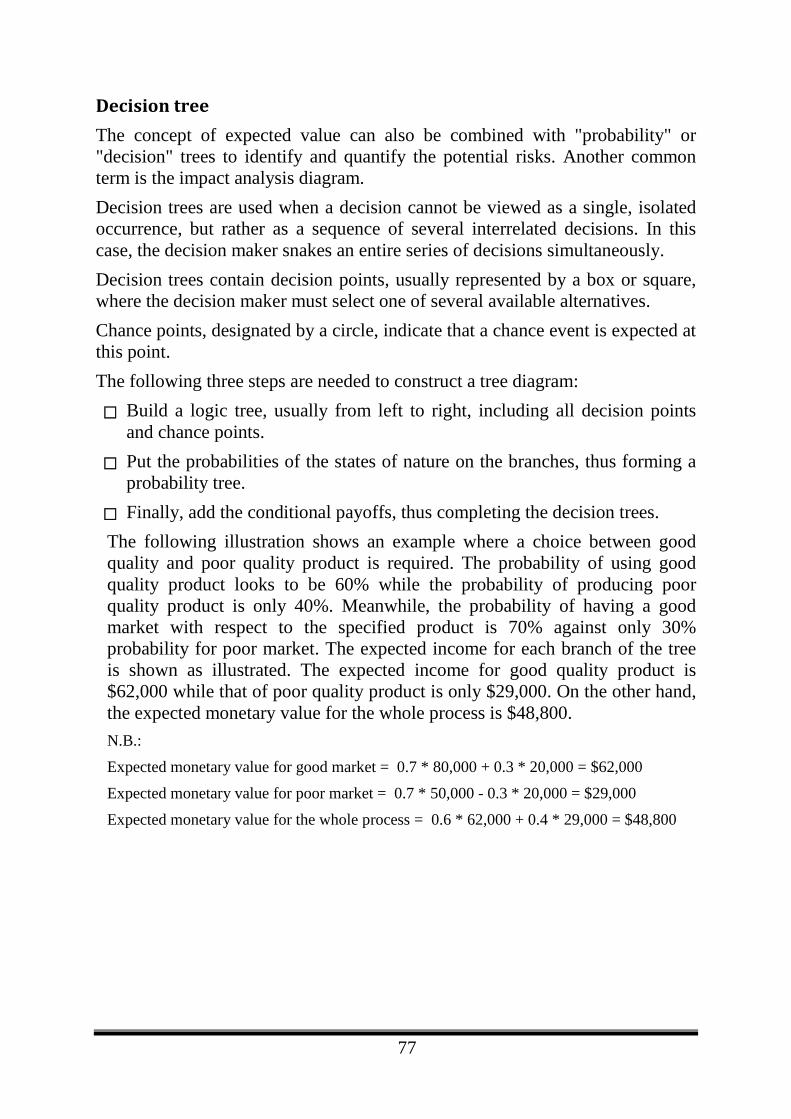
77
Decision tree The concept of expected value can also be combined with "probability" or "decision" trees to identify and quantify the potential risks. Another common term is the impact analysis diagram. Decision trees are used when a decision cannot be viewed as a single, isolated occurrence, but rather as a sequence of several interrelated decisions. In this case, the decision maker snakes an entire series of decisions simultaneously. Decision trees contain decision points, usually represented by a box or square, where the decision maker must select one of several available alternatives. Chance points, designated by a circle, indicate that a chance event is expected at this point. The following three steps are needed to construct a tree diagram: Build a logic tree, usually from left to right, including all decision points
and chance points. Put the probabilities of the states of nature on the branches, thus forming a
probability tree. Finally, add the conditional payoffs, thus completing the decision trees. The following illustration shows an example where a choice between good quality and poor quality product is required. The probability of using good quality product looks to be 60% while the probability of producing poor quality product is only 40%. Meanwhile, the probability of having a good market with respect to the specified product is 70% against only 30% probability for poor market. The expected income for each branch of the tree is shown as illustrated. The expected income for good quality product is $62,000 while that of poor quality product is only $29,000. On the other hand, the expected monetary value for the whole process is $48,800. N.B.:
Expected monetary value for good market = 0.7 * 80,000 + 0.3 * 20,000 = $62,000
Expected monetary value for poor market = 0.7 * 50,000 - 0.3 * 20,000 = $29,000
Expected monetary value for the whole process = 0.6 * 62,000 + 0.4 * 29,000 = $48,800
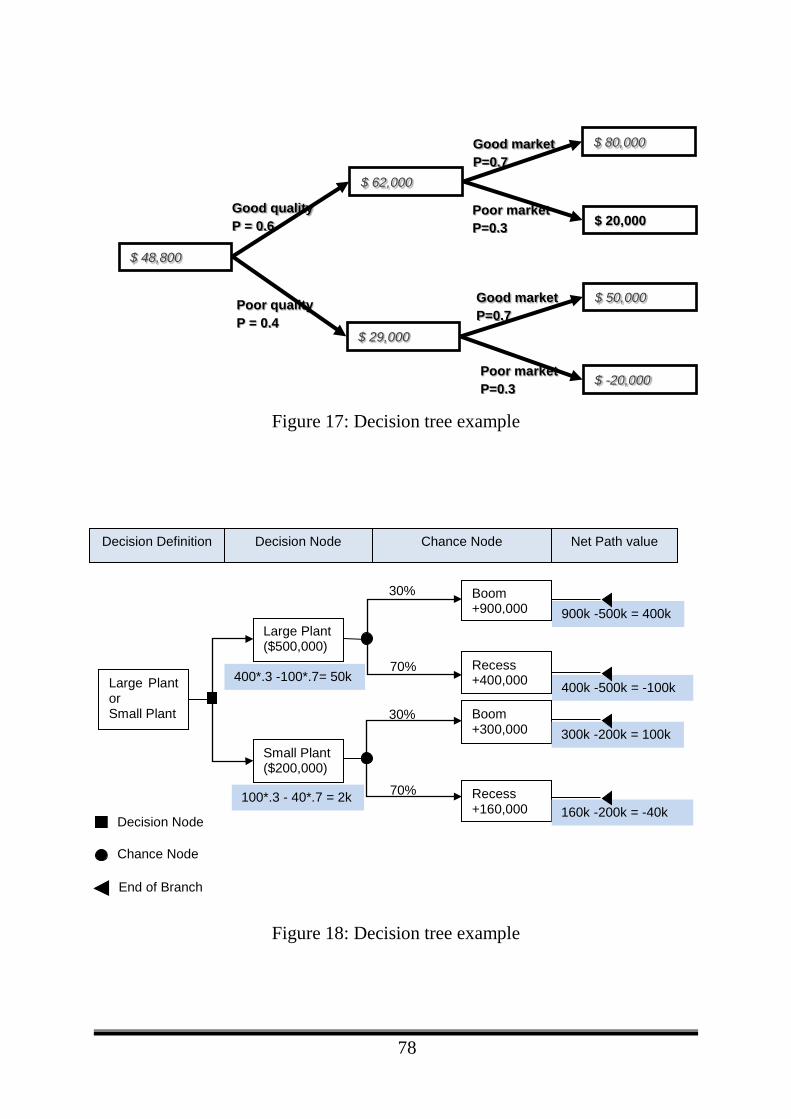
78
Figure 17: Decision tree example
Figure 18: Decision tree example
Large Plant or Small Plant
Small Plant ($200,000)
Large Plant ($500,000)
Recess +400,000
Boom +900,000
Recess +160,000
Boom +300,000
30%
70%
30%
70%
900k -500k = 400k
400k -500k = -100k
300k -200k = 100k
160k -200k = -40k
400*.3 -100*.7= 50k
100*.3 - 40*.7 = 2k
Decision Definition Decision Node Chance Node Net Path value
Decision Node
Chance Node
End of Branch
$ 48,800
$ 29,000
$ 62,000
$ -20,000
$ 50,000
$ 20,000
$ 80,000
Good quality P = 0.6
Poor quality P = 0.4
Good market P=0.7
Good market P=0.7
Poor market P=0.3
Poor market P=0.3
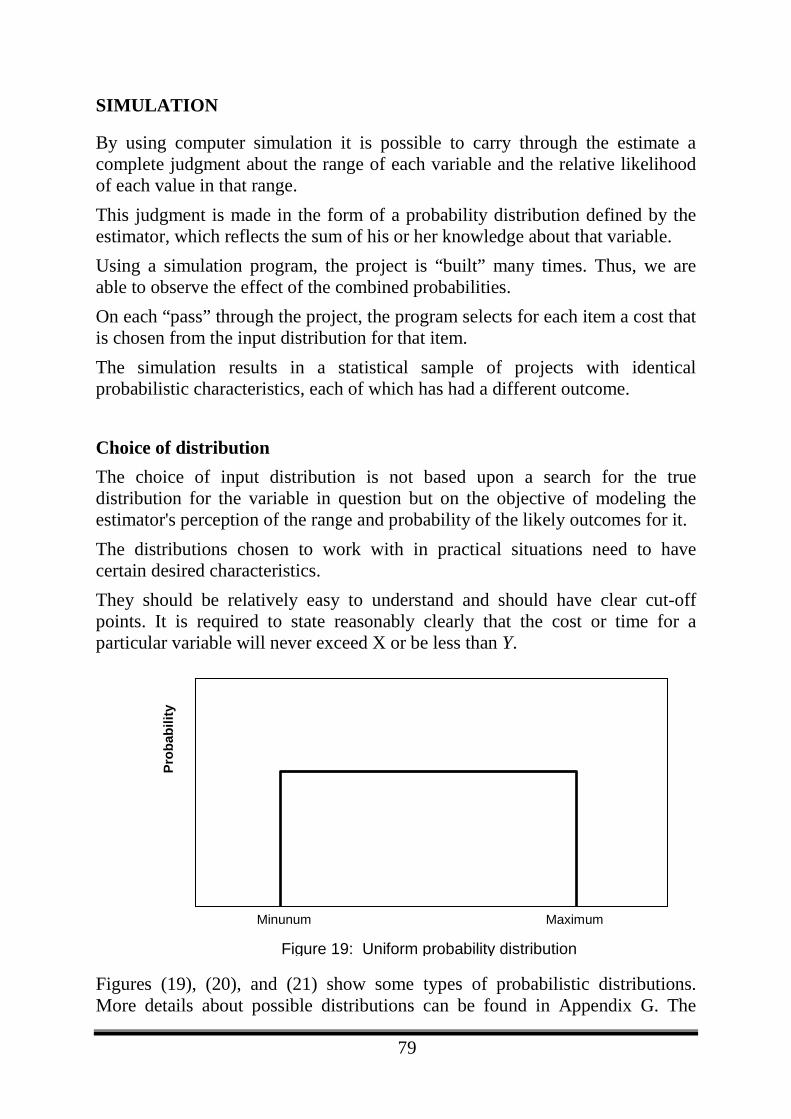
79
SIMULATION
By using computer simulation it is possible to carry through the estimate a complete judgment about the range of each variable and the relative likelihood of each value in that range. This judgment is made in the form of a probability distribution defined by the estimator, which reflects the sum of his or her knowledge about that variable. Using a simulation program, the project is “built” many times. Thus, we are able to observe the effect of the combined probabilities. On each “pass” through the project, the program selects for each item a cost that is chosen from the input distribution for that item. The simulation results in a statistical sample of projects with identical probabilistic characteristics, each of which has had a different outcome. Choice of distribution
The choice of input distribution is not based upon a search for the true distribution for the variable in question but on the objective of modeling the estimator's perception of the range and probability of the likely outcomes for it. The distributions chosen to work with in practical situations need to have certain desired characteristics. They should be relatively easy to understand and should have clear cut-off points. It is required to state reasonably clearly that the cost or time for a particular variable will never exceed X or be less than Y.
Figures (19), (20), and (21) show some types of probabilistic distributions. More details about possible distributions can be found in Appendix G. The
Minunum Maximum
Prob
abili
ty
Figure 19: Uniform probability distribution
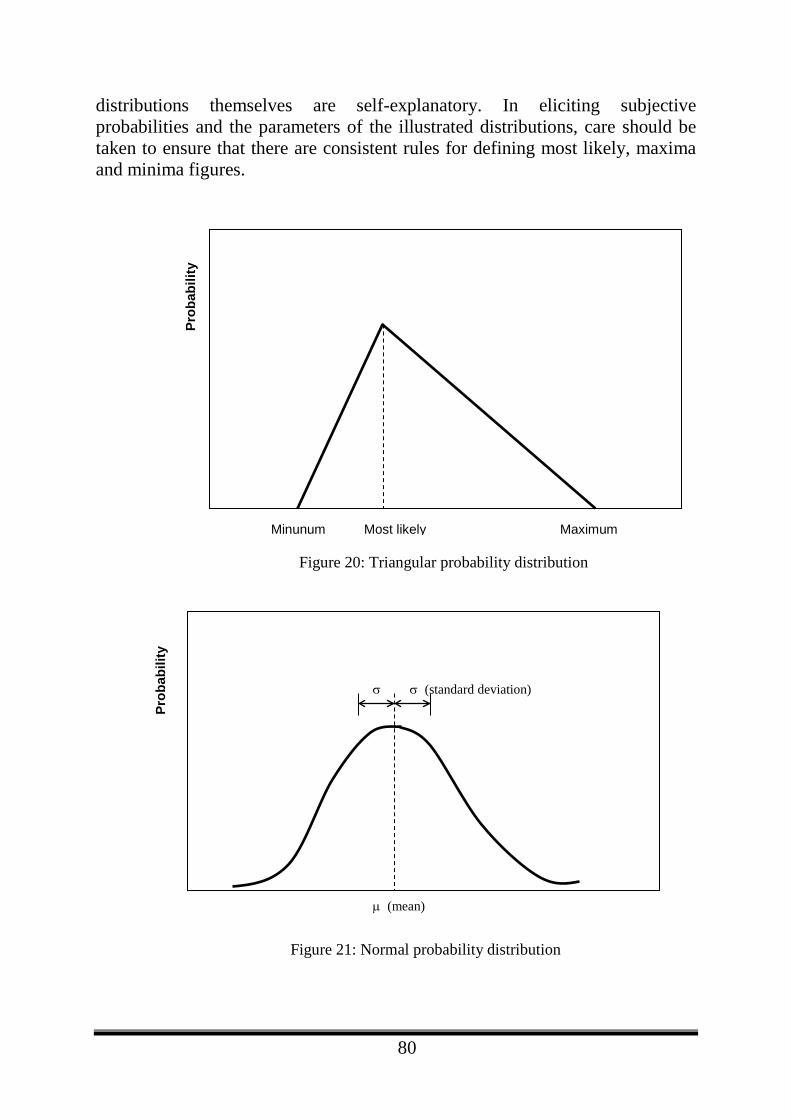
80
distributions themselves are self-explanatory. In eliciting subjective probabilities and the parameters of the illustrated distributions, care should be taken to ensure that there are consistent rules for defining most likely, maxima and minima figures.
Minunum Maximum
Prob
abili
ty
Most likely
Figure 20: Triangular probability distribution
Prob
abili
ty
µ (mean)
σ σ (standard deviation)
Figure 21: Normal probability distribution
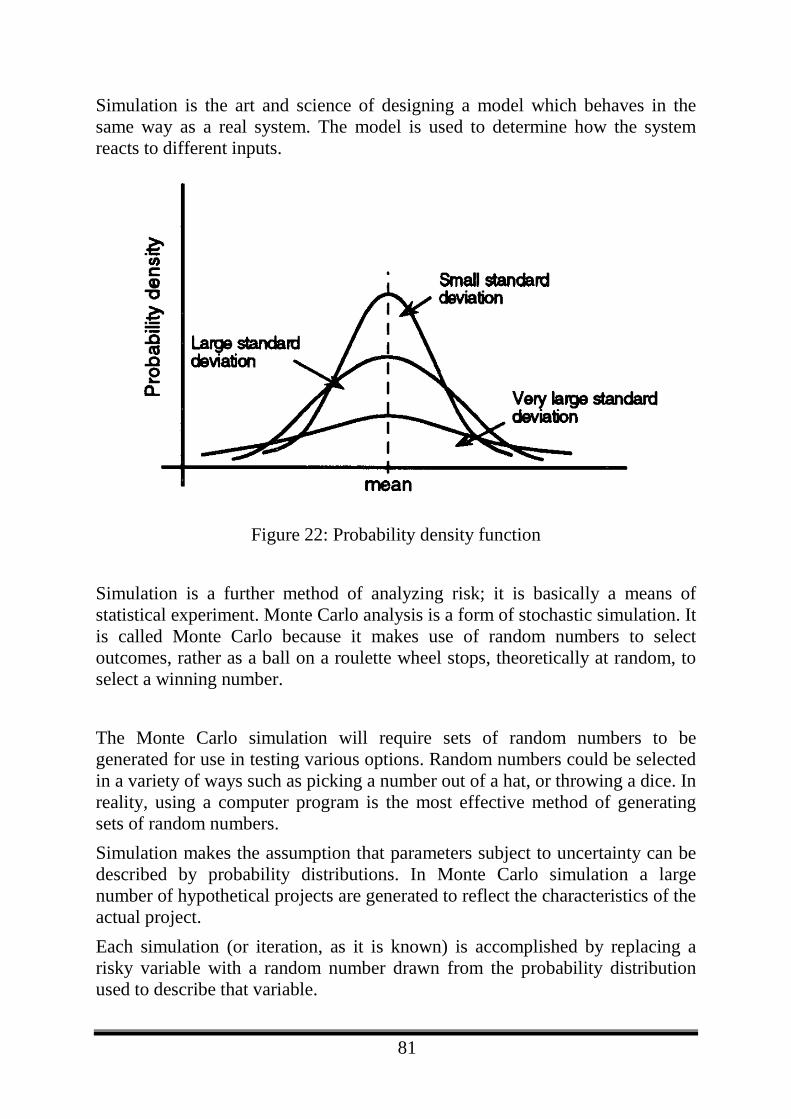
81
Simulation is the art and science of designing a model which behaves in the same way as a real system. The model is used to determine how the system reacts to different inputs.
Figure 22: Probability density function
Simulation is a further method of analyzing risk; it is basically a means of statistical experiment. Monte Carlo analysis is a form of stochastic simulation. It is called Monte Carlo because it makes use of random numbers to select outcomes, rather as a ball on a roulette wheel stops, theoretically at random, to select a winning number. The Monte Carlo simulation will require sets of random numbers to be generated for use in testing various options. Random numbers could be selected in a variety of ways such as picking a number out of a hat, or throwing a dice. In reality, using a computer program is the most effective method of generating sets of random numbers. Simulation makes the assumption that parameters subject to uncertainty can be described by probability distributions. In Monte Carlo simulation a large number of hypothetical projects are generated to reflect the characteristics of the actual project. Each simulation (or iteration, as it is known) is accomplished by replacing a risky variable with a random number drawn from the probability distribution used to describe that variable.
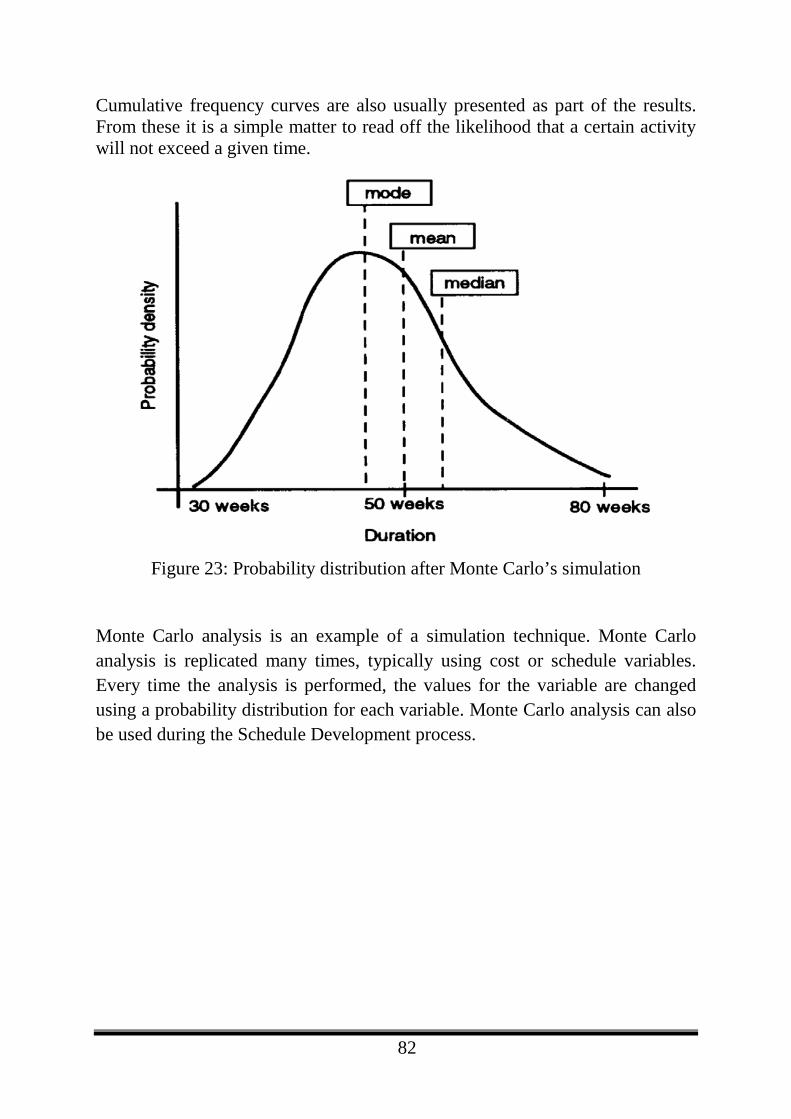
82
Cumulative frequency curves are also usually presented as part of the results. From these it is a simple matter to read off the likelihood that a certain activity will not exceed a given time.
Figure 23: Probability distribution after Monte Carlo’s simulation
Monte Carlo analysis is an example of a simulation technique. Monte Carlo analysis is replicated many times, typically using cost or schedule variables. Every time the analysis is performed, the values for the variable are changed using a probability distribution for each variable. Monte Carlo analysis can also be used during the Schedule Development process.
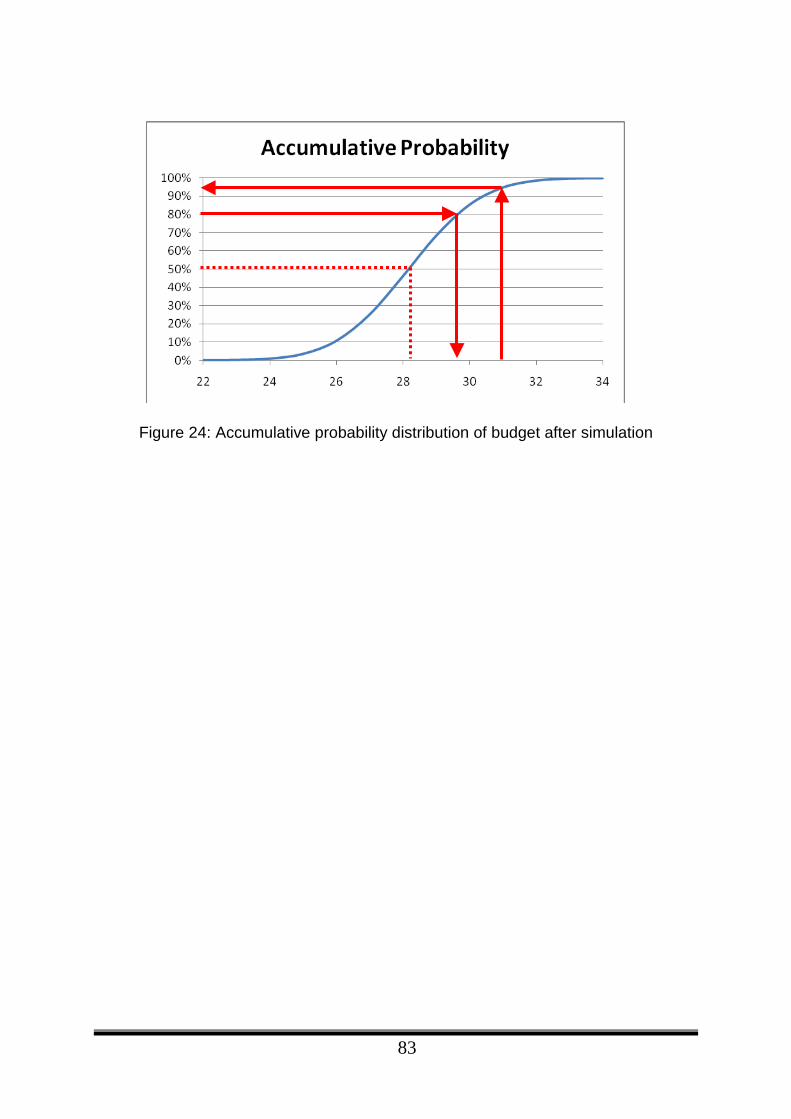
83
Figure 24: Accumulative probability distribution of budget after simulation
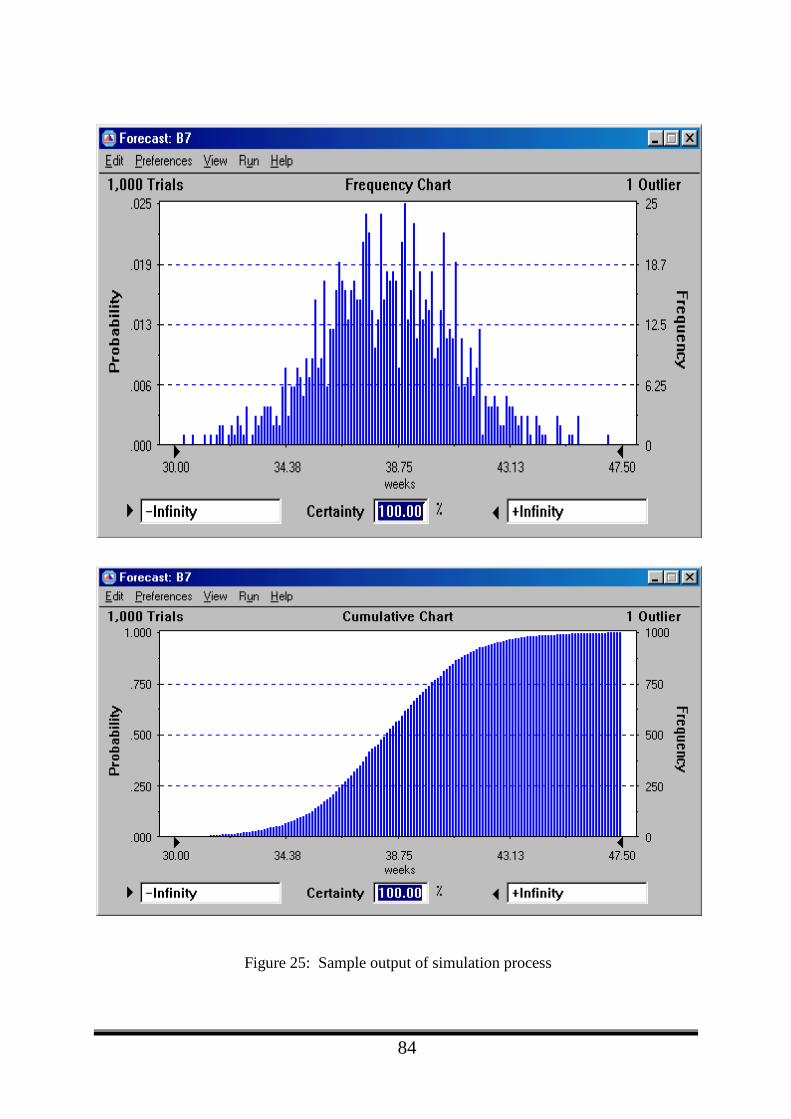
84
Figure 25: Sample output of simulation process

85
Once the main project data are entered in the input sheet, the user can specify the setting regulating functioning of the INFRISK simulation. This is done through the main dialog’s key function, which cover the following areas:
Macroeconomic Parameters Construction Cost Risk Variables Dept Capital Info Equity Capital Info Output Options
86
THE RISK PREMIUM
• A discount rate reflects the investor's time value of money and the rate of return the property must earn to justify the investment.
• The investor in land and property will balance the costs and the revenue of the investment over a period of time by using a discount rate.
• The risk premium will be added to the risk free discount rate. • There are no formulae which derive an appropriate risk premium; each
investor will have his or her own requirements as to the risk premium for each project.
• Financial commitments always carry certain risks which can be neither eliminated nor transferred.
• The term risk free is intended to imply not absolute absence of all risk, but virtual absence of default risk.
• In financial terms, the risk free rate is taken as that which would apply if lenders viewed a borrower's credit and collateral so favorably that they were absolutely certain of repayment at the scheduled time.
87
RISK-ADJUSTED DISCOUNT RATE
• It is tempting to consider the risk premium as the requirement for an additional rate of return.
• A real discount rate used in say, life-cycle costing calculations, may be viewed as composed of three parts: a time value of money; an adjustment for expected inflation; and a risk premium.
• The size of the premium depends upon the degree of risk associated with the project and the attitude to risk by the investor.
• The greater the risk, the greater the premium.
• In practice, a single risk-adjusted discount rate is added to the discount factor: RA = (RF + I + RP)t RA = Risk adjusted discount rate RF = Risk free rate I = allowance for inflation RP = Risk premium which is the adjustment for extra risk above the
normal risk
• A potential disadvantage of this approach has already been noted. Since the discount factor is part of a compounding function, the discount factor grows with increases in the value of (t).
• This implies a special assumption that the risks associated with future costs and revenues increase geometrically with time.
• A procedure for evaluating such projects is to separate timing and risk adjustments using the concept of certainty equivalent value (CEV).
• The CEV of a cash flow in a given year is simply its risk adjusted value in that year. Hence, if all future cash flows were converted to CEVs, they could then be discounted to the present using a single risk free discount rate.
• An alternative is to discount cost and benefit streams separately, each with a unique risk-adjusted (RA) discount rate.
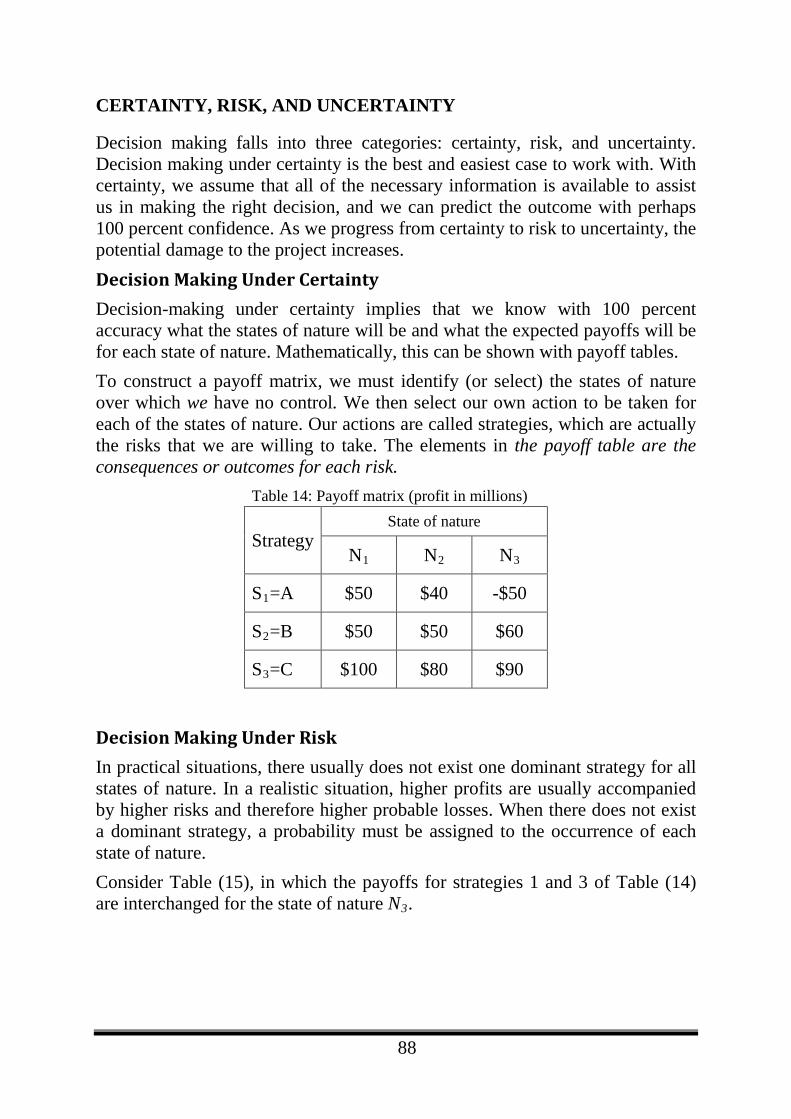
88
CERTAINTY, RISK, AND UNCERTAINTY
Decision making falls into three categories: certainty, risk, and uncertainty. Decision making under certainty is the best and easiest case to work with. With certainty, we assume that all of the necessary information is available to assist us in making the right decision, and we can predict the outcome with perhaps 100 percent confidence. As we progress from certainty to risk to uncertainty, the potential damage to the project increases. Decision Making Under Certainty Decision-making under certainty implies that we know with 100 percent accuracy what the states of nature will be and what the expected payoffs will be for each state of nature. Mathematically, this can be shown with payoff tables. To construct a payoff matrix, we must identify (or select) the states of nature over which we have no control. We then select our own action to be taken for each of the states of nature. Our actions are called strategies, which are actually the risks that we are willing to take. The elements in the payoff table are the consequences or outcomes for each risk.
Table 14: Payoff matrix (profit in millions)
Strategy State of nature
N1 N2 N3
S1=A $50 $40 -$50
S2=B $50 $50 $60
S3=C $100 $80 $90
Decision Making Under Risk In practical situations, there usually does not exist one dominant strategy for all states of nature. In a realistic situation, higher profits are usually accompanied by higher risks and therefore higher probable losses. When there does not exist a dominant strategy, a probability must be assigned to the occurrence of each state of nature. Consider Table (15), in which the payoffs for strategies 1 and 3 of Table (14) are interchanged for the state of nature N3.
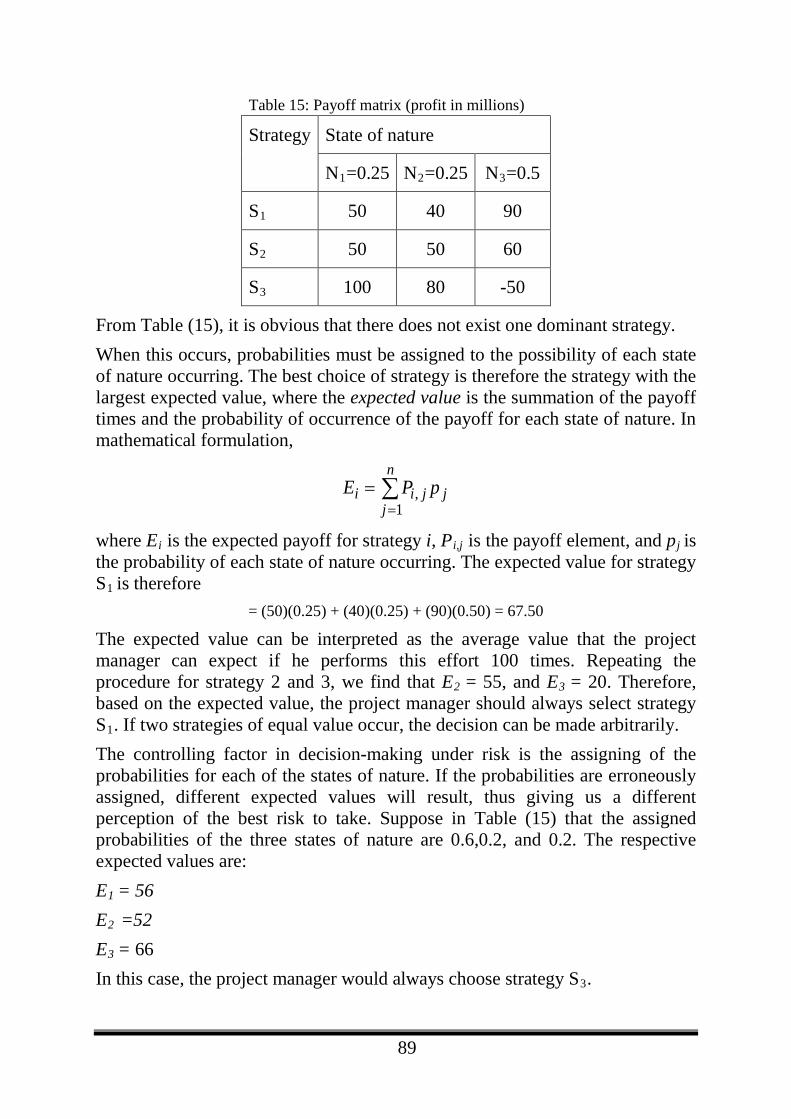
89
Table 15: Payoff matrix (profit in millions)
Strategy State of nature
N1=0.25 N2=0.25 N3=0.5
S1 50 40 90
S2 50 50 60
S3 100 80 -50
From Table (15), it is obvious that there does not exist one dominant strategy. When this occurs, probabilities must be assigned to the possibility of each state of nature occurring. The best choice of strategy is therefore the strategy with the largest expected value, where the expected value is the summation of the payoff times and the probability of occurrence of the payoff for each state of nature. In mathematical formulation,
∑=
=n
jjjii pPE
1,
where Ei is the expected payoff for strategy i, Pi,j is the payoff element, and pj is the probability of each state of nature occurring. The expected value for strategy S1 is therefore
= (50)(0.25) + (40)(0.25) + (90)(0.50) = 67.50
The expected value can be interpreted as the average value that the project manager can expect if he performs this effort 100 times. Repeating the procedure for strategy 2 and 3, we find that E2 = 55, and E3 = 20. Therefore, based on the expected value, the project manager should always select strategy S1. If two strategies of equal value occur, the decision can be made arbitrarily. The controlling factor in decision-making under risk is the assigning of the probabilities for each of the states of nature. If the probabilities are erroneously assigned, different expected values will result, thus giving us a different perception of the best risk to take. Suppose in Table (15) that the assigned probabilities of the three states of nature are 0.6,0.2, and 0.2. The respective expected values are: E1 = 56 E2 =52 E3 = 66 In this case, the project manager would always choose strategy S3.
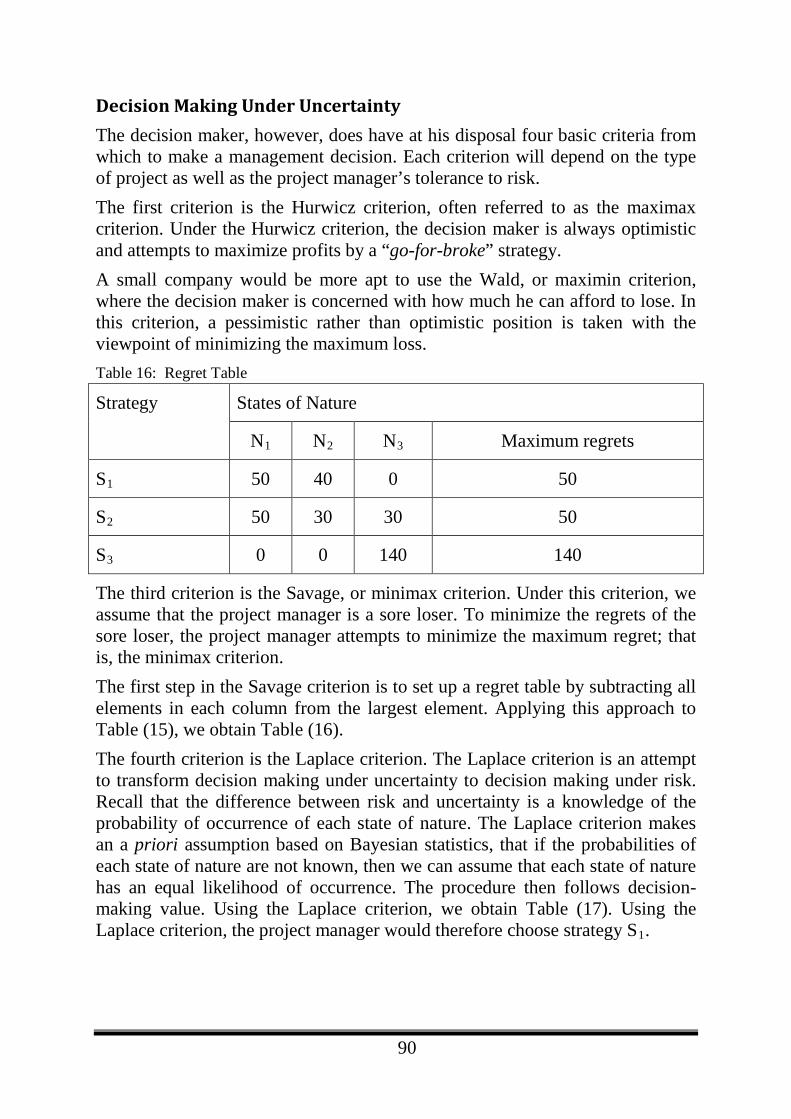
90
Decision Making Under Uncertainty The decision maker, however, does have at his disposal four basic criteria from which to make a management decision. Each criterion will depend on the type of project as well as the project manager’s tolerance to risk. The first criterion is the Hurwicz criterion, often referred to as the maximax criterion. Under the Hurwicz criterion, the decision maker is always optimistic and attempts to maximize profits by a “go-for-broke” strategy. A small company would be more apt to use the Wald, or maximin criterion, where the decision maker is concerned with how much he can afford to lose. In this criterion, a pessimistic rather than optimistic position is taken with the viewpoint of minimizing the maximum loss. Table 16: Regret Table
Strategy States of Nature
N1 N2 N3 Maximum regrets
S1 50 40 0 50
S2 50 30 30 50
S3 0 0 140 140
The third criterion is the Savage, or minimax criterion. Under this criterion, we assume that the project manager is a sore loser. To minimize the regrets of the sore loser, the project manager attempts to minimize the maximum regret; that is, the minimax criterion. The first step in the Savage criterion is to set up a regret table by subtracting all elements in each column from the largest element. Applying this approach to Table (15), we obtain Table (16). The fourth criterion is the Laplace criterion. The Laplace criterion is an attempt to transform decision making under uncertainty to decision making under risk. Recall that the difference between risk and uncertainty is a knowledge of the probability of occurrence of each state of nature. The Laplace criterion makes an a priori assumption based on Bayesian statistics, that if the probabilities of each state of nature are not known, then we can assume that each state of nature has an equal likelihood of occurrence. The procedure then follows decision-making value. Using the Laplace criterion, we obtain Table (17). Using the Laplace criterion, the project manager would therefore choose strategy S1.

91
Table 17: Laplace criterion
Strategy Expected value
S1 60
S2 160/3
S3 130/3
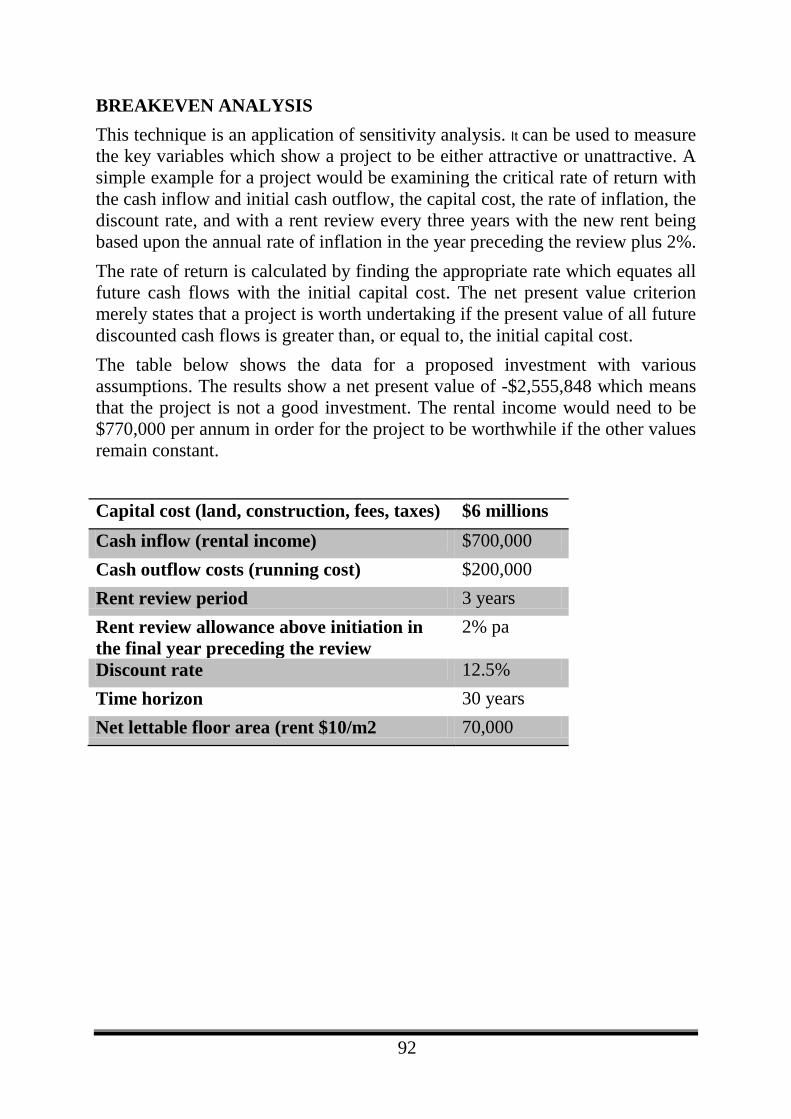
92
BREAKEVEN ANALYSIS This technique is an application of sensitivity analysis. It can be used to measure the key variables which show a project to be either attractive or unattractive. A simple example for a project would be examining the critical rate of return with the cash inflow and initial cash outflow, the capital cost, the rate of inflation, the discount rate, and with a rent review every three years with the new rent being based upon the annual rate of inflation in the year preceding the review plus 2%. The rate of return is calculated by finding the appropriate rate which equates all future cash flows with the initial capital cost. The net present value criterion merely states that a project is worth undertaking if the present value of all future discounted cash flows is greater than, or equal to, the initial capital cost. The table below shows the data for a proposed investment with various assumptions. The results show a net present value of -$2,555,848 which means that the project is not a good investment. The rental income would need to be $770,000 per annum in order for the project to be worthwhile if the other values remain constant.
Capital cost (land, construction, fees, taxes) $6 millions Cash inflow (rental income) $700,000 Cash outflow costs (running cost) $200,000 Rent review period 3 years Rent review allowance above initiation in the final year preceding the review
2% pa
Discount rate 12.5% Time horizon 30 years Net lettable floor area (rent $10/m2 70,000
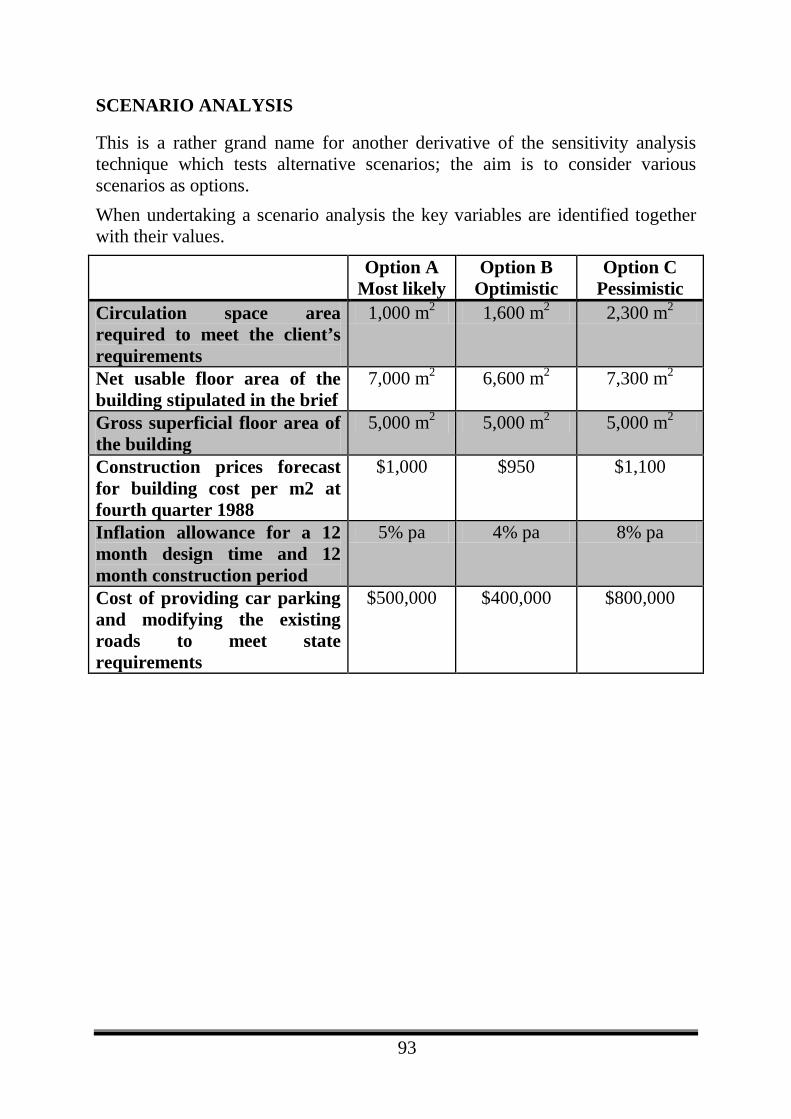
93
SCENARIO ANALYSIS
This is a rather grand name for another derivative of the sensitivity analysis technique which tests alternative scenarios; the aim is to consider various scenarios as options. When undertaking a scenario analysis the key variables are identified together with their values.
Option A Most likely
Option B Optimistic
Option C Pessimistic
Circulation space area required to meet the client’s requirements
1,000 m2 1,600 m2 2,300 m2
Net usable floor area of the building stipulated in the brief
7,000 m2 6,600 m2 7,300 m2
Gross superficial floor area of the building
5,000 m2 5,000 m2 5,000 m2
Construction prices forecast for building cost per m2 at fourth quarter 1988
$1,000 $950 $1,100
Inflation allowance for a 12 month design time and 12 month construction period
5% pa 4% pa 8% pa
Cost of providing car parking and modifying the existing roads to meet state requirements
$500,000 $400,000 $800,000

94
RISK RESPONSE Risk response and mitigation is the action that is required to reduce or eliminate the potential impact of risk. There are two types of response to risk:
• First is an immediate change or alteration to the project, which usually results in the elimination of the risk;
• Second is a contingency plan that will only be implemented if an identified risk should materialize.
In order to mitigate the potential impact of any risk the project manager or his designated risk manager must consider alternative courses of action and evaluate the consequences should that action be taken. In order to identify which route(s) should be adopted a number of questions must first be asked: • is the risk controllable or uncontrollable? • who is best placed to influence/deal with the source and outcome of the
risk? • what secondary or resultant risks arise as a result of the action taken?
• is the cost of mitigating the risk acceptable when compared to the potential impact of the risk itself?
95
Strategies for Negative Risks or Threats
Once risks have been identified and assessed, all techniques to manage the negative risk fall into one or more of these four major categories:
• Avoidance (eliminate) • Mitigation (reduce or control) • Transference (outsource or insure) • Acceptance (retain or assume)
Another source, from the US Department of Defense, calls these categories ACAT, for Avoid, Control, Accept, or Transfer.
Avoidance This strategy includes not performing an activity that could carry risk. Not entering a business to avoid the risk of loss also avoids the possibility of earning profits. A simple example could like doing activities in parallel which usually being carries out in series to accelerate the performance of the project. In simple terms, this method of mitigation involves the removal of the cause of the risk and therefore the risk itself. Risk avoidance is most likely to take place where the level of risk is at a level where the project is potentially unviable. Examples of risk avoidance include:
• more detailed planning; • the selection of alternative approaches; • improving designs and systems engineering; • procedural changes; • protection and safety systems; • preventive maintenance; • quality assurance procedures; • operations reviews; • regular inspections and audits; and • training and skills enhancement.
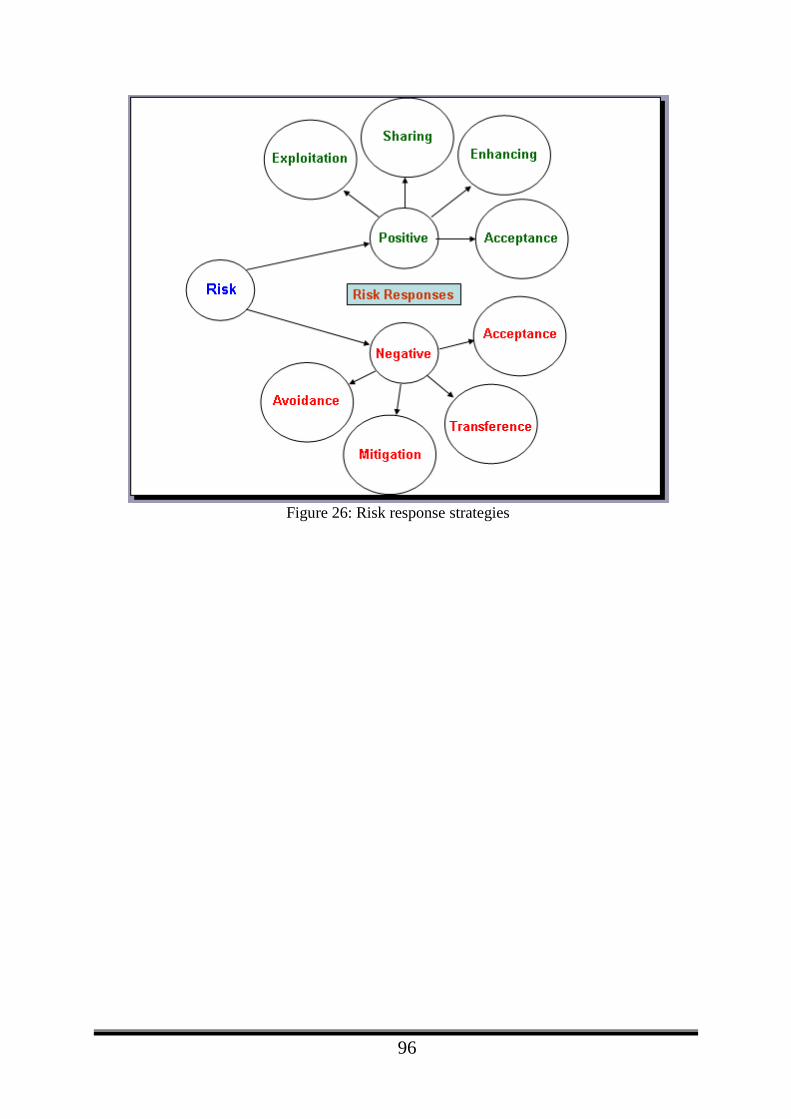
96
Figure 26: Risk response strategies
97
Mitigation In this strategy it is targeted to reduce the severity of the loss or the likelihood of the loss from occurring. For example, sprinklers are designed to put out a fire to reduce the risk of loss by fire. This method may cause a greater loss by water damage and therefore may not be suitable. Halogen fire suppression systems may mitigate that risk, but the cost may be prohibitive as a strategy. Impact mitigation is directed to minimizing the consequences of risks. The likelihoods of other risks arising may be reduced by risk prevention strategies, but the risks may still occur. Typical action to reduce risk could be:
• detailed site investigation; • alternative procurement route by utilizing an alternative contract strategy • changes in design to accommodate the findings of the identified risks; • engineering and structural barriers; • separation or relocation of an activity and resources; • quality assurance; • regular audits and checks to detect compliance or information security
breaches; and • crisis management and disaster recovery plans.
However, risk reduction will result in an increase in the base cost but should offer a significantly greater reduction in the level of contingency required.
98
Transference In the terminology of practitioners and scholars alike, the purchase of an insurance contract is often described as a "transfer of risk." However, technically speaking, the buyer of the contract generally retains legal responsibility for the losses "transferred", meaning that insurance may be described more accurately as a post-event compensatory mechanism. For example, a personal injuries insurance policy does not transfer the risk of a car accident to the insurance company. The risk still lays with the policy holder namely the person who has been in the accident. The insurance policy simply provides that if an accident (the event) occurs involving the policy holder then some compensation may be payable to the policy holder that is commensurate to the suffering/damage. Where a risk is transferred the intention should be to transfer the whole of the risk including its potential impact. Where the responsibility for the risk is allocated to a project participant, time, cost, quality repercussions remain, and this may still adversely affect the project's outcome. Risk transferring occurs when contracts are negotiated between an organization and its suppliers or sub-contractors. In many projects, procurement contracts require sound risk management processes to be developed and implemented by the contractors, sub-contractors or suppliers of products or services, as part of prudential control and oversight procedures. Insurance is a well-known risk transferring strategy. It is normally used for physical assets and a limited range of commercial risks, particularly for the low probability but high impact residual risks that may remain after other risk treatment actions have been implemented. Transferring a risk with another party will usually incur a cost, for example an insurance premium, which provides a direct measure of the cost of transferring the risk. Insurance is particularly relevant to the management of 'residual' risks, where active risk prevention and mitigation measures have been implemented. The remaining variability is a prime candidate for insurance.
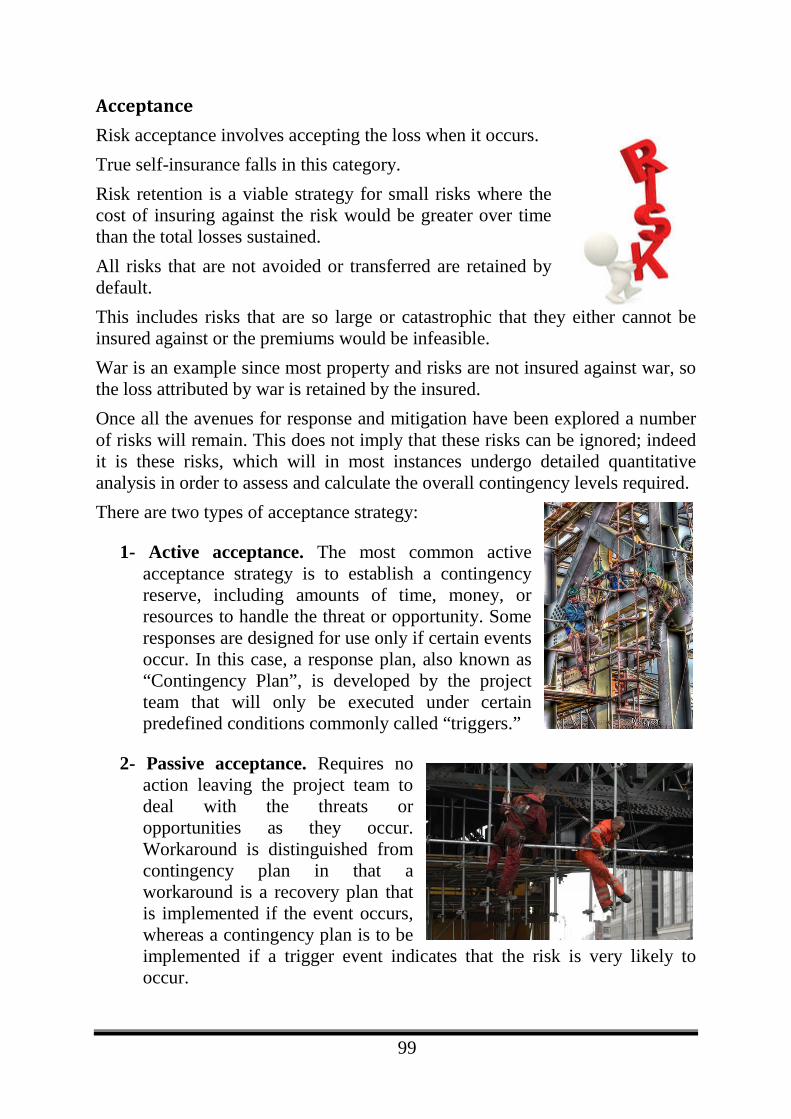
99
Acceptance Risk acceptance involves accepting the loss when it occurs. True self-insurance falls in this category. Risk retention is a viable strategy for small risks where the cost of insuring against the risk would be greater over time than the total losses sustained. All risks that are not avoided or transferred are retained by default. This includes risks that are so large or catastrophic that they either cannot be insured against or the premiums would be infeasible. War is an example since most property and risks are not insured against war, so the loss attributed by war is retained by the insured. Once all the avenues for response and mitigation have been explored a number of risks will remain. This does not imply that these risks can be ignored; indeed it is these risks, which will in most instances undergo detailed quantitative analysis in order to assess and calculate the overall contingency levels required. There are two types of acceptance strategy:
1- Active acceptance. The most common active acceptance strategy is to establish a contingency reserve, including amounts of time, money, or resources to handle the threat or opportunity. Some responses are designed for use only if certain events occur. In this case, a response plan, also known as “Contingency Plan”, is developed by the project team that will only be executed under certain predefined conditions commonly called “triggers.”
2- Passive acceptance. Requires no action leaving the project team to deal with the threats or opportunities as they occur. Workaround is distinguished from contingency plan in that a workaround is a recovery plan that is implemented if the event occurs, whereas a contingency plan is to be implemented if a trigger event indicates that the risk is very likely to occur.
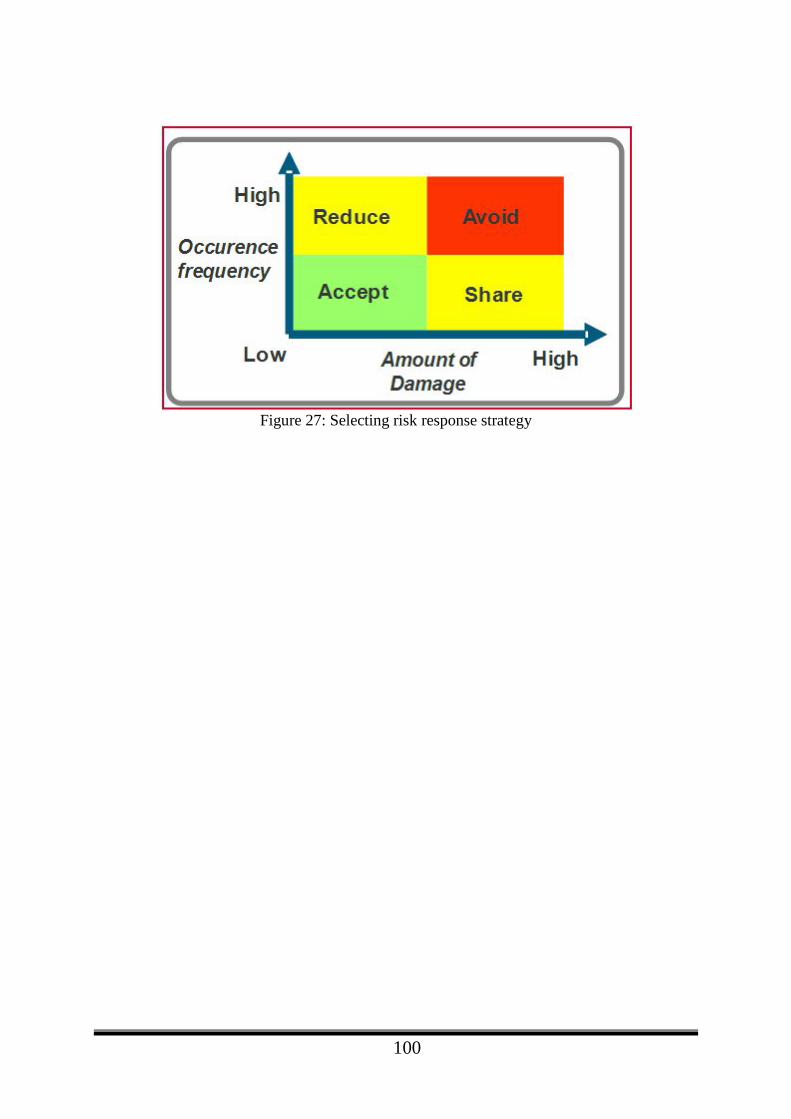
100
Figure 27: Selecting risk response strategy
101
Strategies for Positive Risks or Opportunities
Four strategies exist to deal with opportunities or positive risks that might present themselves on the project: exploit, share, enhance, and accept. Exploit When exploiting a risk event, the opportunities for positive impacts are aimed. This is the strategy of choice when identifying positive risks that you want to make certain will occur on the project. Examples of exploiting a risk include reducing the amount of time to complete the project by bringing on more qualified resources (as possible) or by providing even better quality than originally planned. Share The share strategy is similar to transferring because you’ll assign the risk to a third-party owner who is best able to bring about the opportunity the risk event presents. For example, perhaps what your organization does best is investing. However, it isn’t so good at marketing. Forming a joint venture with a marketing firm to capitalize on a positive risk will make the most of the opportunities. Enhance The enhance strategy closely watches the probability or impact of the risk event to assure that the organization realizes the benefits. This entails watching for and emphasizing risk triggers and identifying the root causes of the risk to help enhance impacts or probability. It is something like convincing the customer to enlarge the size of the project, adding more activities to the scope, or repeating the project again in terms to enhance the profit of my organization. Contingent response strategies The last tool and technique of the Risk Response Planning process is called the contingent response strategy, better known as contingency planning. It involves planning alternatives to deal with the risks should they occur. This is different from mitigation planning in that mitigation looks to reduce the probability of the risk and its impact, whereas contingency planning doesn’t necessarily attempt to reduce the probability of a risk event or its impacts. Contingency planning says the risk might very well occur, and you better have plans in place to deal with it when it does.
102
Contingency comes into play when the risk event occurs. This implies you need to plan for your contingencies well in advance of the threat occurring. After the risks have been identified and quantified, contingency plans should be developed and kept at the ready. Contingency allowances or reserves are a common contingency response. Contingency reserves include project funds that are held in reserve to offset any unavoidable threats that might occur to project scope, schedule, cost, or quality. It also includes reserving time and resources to account for risks. You should consider stakeholder risk tolerances when determining the amount of contingency reserves. Secondary Risk: A secondary risk can be defined as a risk created by the response to another risk. In other words, the secondary risk is a consequence of dealing with the original risk. A simple way to look at this is to think of project management as a chess game in which one has to think as many moves ahead as possible. One has to consider the reaction to the reaction, or in other words, the consequences that could arise from dealing with a problem or risk. Secondary risks are generally not as severe or significant as primary risks, but can become so if not anticipated and planned for appropriately. Residual Risk: It is these risks which remain after risk response planning, and those that have been accepted for which contingency plans and fallback plans can be created. Residual risks should be properly documented and reviewed throughout the project to see if their ranking has changed. Contingency Plans Contingency plans are plans describing the specific actions that will be taken if the opportunity or threat occurs. Workaround: Another type of corrective action is a workaround. Workarounds are unplanned responses to emerging risks that weren't accepted or identified. Workarounds give a way to "work around" the problem and as a result, reduce the effects that the risk has on the project. Workarounds should not be applied without documentation. Since using workarounds may have a positive or negative effect on the project, it is required to incorporate them into the project plan and risk response plan.

103
Risk register after planning risk responses
Task Cause Risk Effect Probability Impact Trigger Response Allocation Owner Residual risk Secondary risk
Design
Procurement
Handing out
Executing
Verification
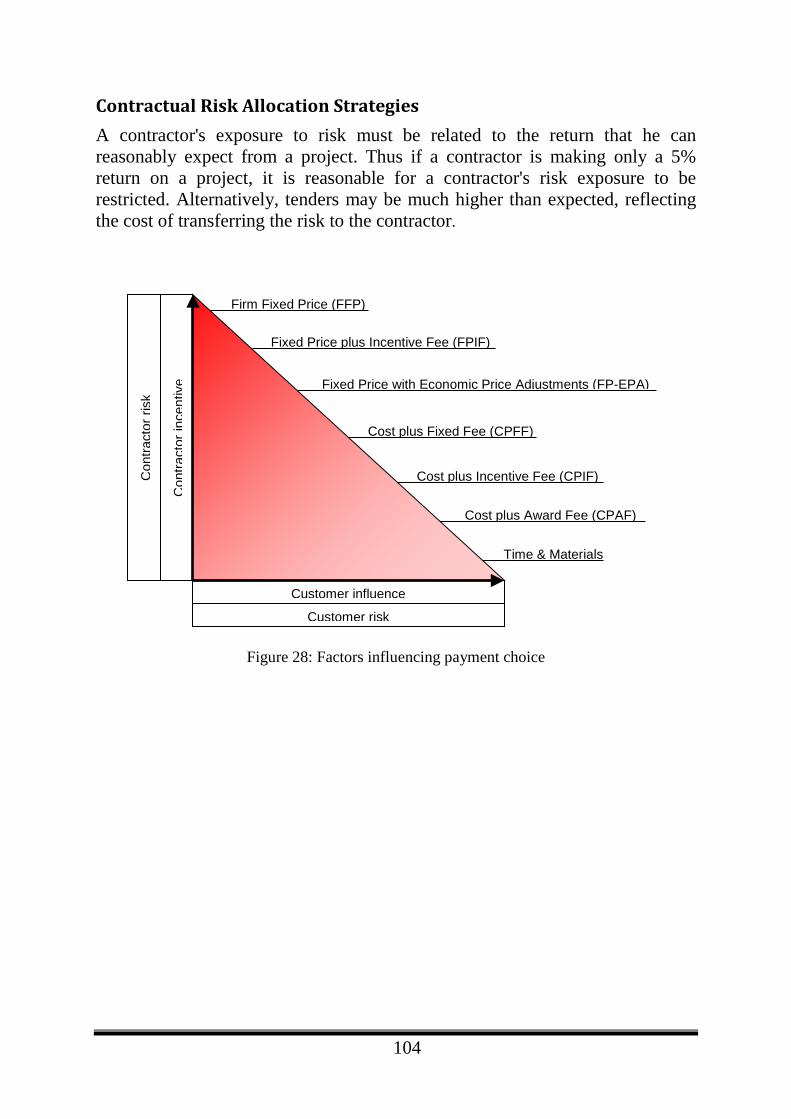
104
Contractual Risk Allocation Strategies A contractor's exposure to risk must be related to the return that he can reasonably expect from a project. Thus if a contractor is making only a 5% return on a project, it is reasonable for a contractor's risk exposure to be restricted. Alternatively, tenders may be much higher than expected, reflecting the cost of transferring the risk to the contractor.
Figure 28: Factors influencing payment choice
Con
tract
or in
cent
ive
Firm Fixed Price (FFP)
Fixed Price plus Incentive Fee (FPIF)
Fixed Price with Economic Price Adjustments (FP-EPA)
Cost plus Fixed Fee (CPFF)
Cost plus Incentive Fee (CPIF)
Customer influence
Cost plus Award Fee (CPAF)
Time & Materials
Customer risk
Con
tract
or ri
sk
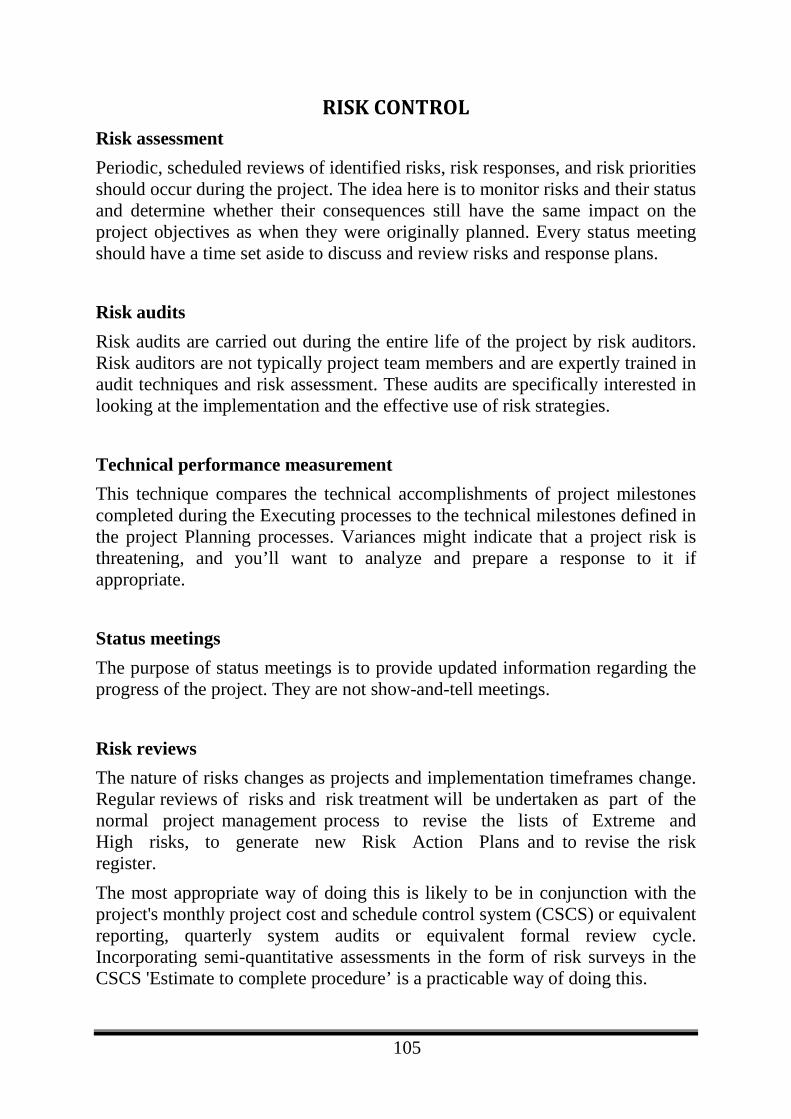
105
RISK CONTROL Risk assessment Periodic, scheduled reviews of identified risks, risk responses, and risk priorities should occur during the project. The idea here is to monitor risks and their status and determine whether their consequences still have the same impact on the project objectives as when they were originally planned. Every status meeting should have a time set aside to discuss and review risks and response plans. Risk audits Risk audits are carried out during the entire life of the project by risk auditors. Risk auditors are not typically project team members and are expertly trained in audit techniques and risk assessment. These audits are specifically interested in looking at the implementation and the effective use of risk strategies. Technical performance measurement This technique compares the technical accomplishments of project milestones completed during the Executing processes to the technical milestones defined in the project Planning processes. Variances might indicate that a project risk is threatening, and you’ll want to analyze and prepare a response to it if appropriate. Status meetings The purpose of status meetings is to provide updated information regarding the progress of the project. They are not show-and-tell meetings. Risk reviews The nature of risks changes as projects and implementation timeframes change. Regular reviews of risks and risk treatment will be undertaken as part of the normal project management process to revise the lists of Extreme and High risks, to generate new Risk Action Plans and to revise the risk register. The most appropriate way of doing this is likely to be in conjunction with the project's monthly project cost and schedule control system (CSCS) or equivalent reporting, quarterly system audits or equivalent formal review cycle. Incorporating semi-quantitative assessments in the form of risk surveys in the CSCS 'Estimate to complete procedure’ is a practicable way of doing this.
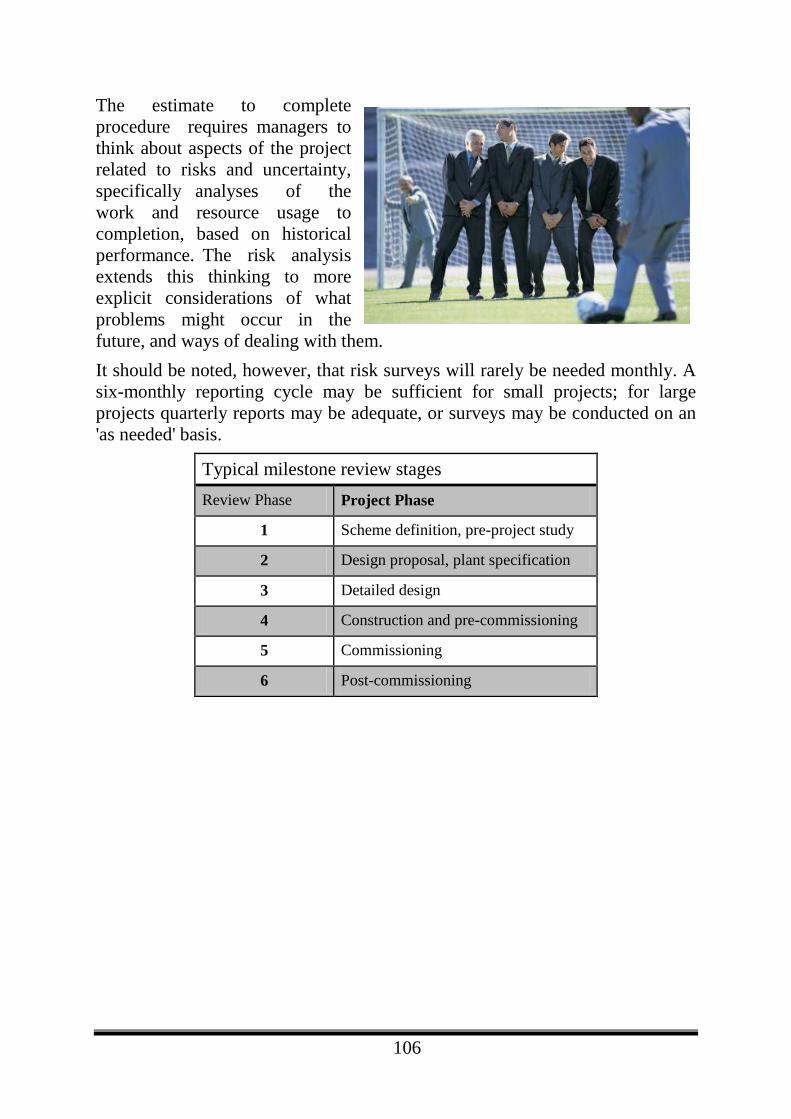
106
The estimate to complete procedure requires managers to think about aspects of the project related to risks and uncertainty, specifically analyses of the work and resource usage to completion, based on historical performance. The risk analysis extends this thinking to more explicit considerations of what problems might occur in the future, and ways of dealing with them. It should be noted, however, that risk surveys will rarely be needed monthly. A six-monthly reporting cycle may be sufficient for small projects; for large projects quarterly reports may be adequate, or surveys may be conducted on an 'as needed' basis.
Typical milestone review stages Review Phase Project Phase
1 Scheme definition, pre-project study
2 Design proposal, plant specification
3 Detailed design
4 Construction and pre-commissioning
5 Commissioning
6 Post-commissioning
107
Communication and reporting
There are many reasons for communicating and reporting the outcomes of a risk management study.
• Communication within the project team. Maintaining the consistency and 'reasonableness' of a large risk assessment in a complex project, possibly incorporating the judgments from a diverse team of experts, requires special care. Recording the assumptions that underlie each judgment and decision is important for checking purposes when the results of a risk analysis do not seem right.
• Communication with an owner or client. It is important that the end-users understand the risks and trade-offs that must be made in a large project, as they are usually the ones who must pay for risk.
• Communication with the providers of finance and insurance support. Funding bodies, whether they are banks, bond holders, equity providers (shareholders), credit guarantors, the finance divisions of the procuring organisations, government funding agencies, or private-sector participants in a public-sector project, all require information about the risks and their allocation and management.
• Accountability and auditability. Project managers must be accountable for their decisions. It is important that the risk assessment process is documented in such a way that it can be reviewed, to enable the structure and assumptions to be examined and the reasons for particular judgments and decisions to be identified.
• Information source for future projects. The collection of detailed information about all aspects of a project, in a structured fashion that facilitates retrieval, generates a very valuable organizational asset.
• Record for post-implementation project evaluation. All organizations should review their large projects after completion, to ensure their objectives have been met and their procedures have been adequate, and to extract the key lessons for improving performance in future projects.
108
Communication and reporting also makes an important contribution to planning processes.
• Risk management planning for the key stakeholders. The project Risk Management Plan described in the next chapter provides a high-level focus on risk across the entire project.
• Tactical risk action planning. The Risk Action Plans described in the previous chapter provide the basis for tactical action and implementation.
• Justification for spending money now or taking a particular course of action. Where significant risk management activity must be taken early in the life of a project, usually directed to risk prevention measures, different funding levels and spending profiles may result.
• Communication between the project team and the contractors or suppliers. The project Risk Management Plan and Risk Action Plans should identify the problems and the solutions and convey a detailed understanding of what must be done and why.
• Control of risk and risk management activities. Formal project risk management reports specify the criteria for success, the targets and measures used to assess performance, detailed accountabilities for managing risk and the allocation of budgets and resources. They provide the strategic and tactical focus for successful project risk management.
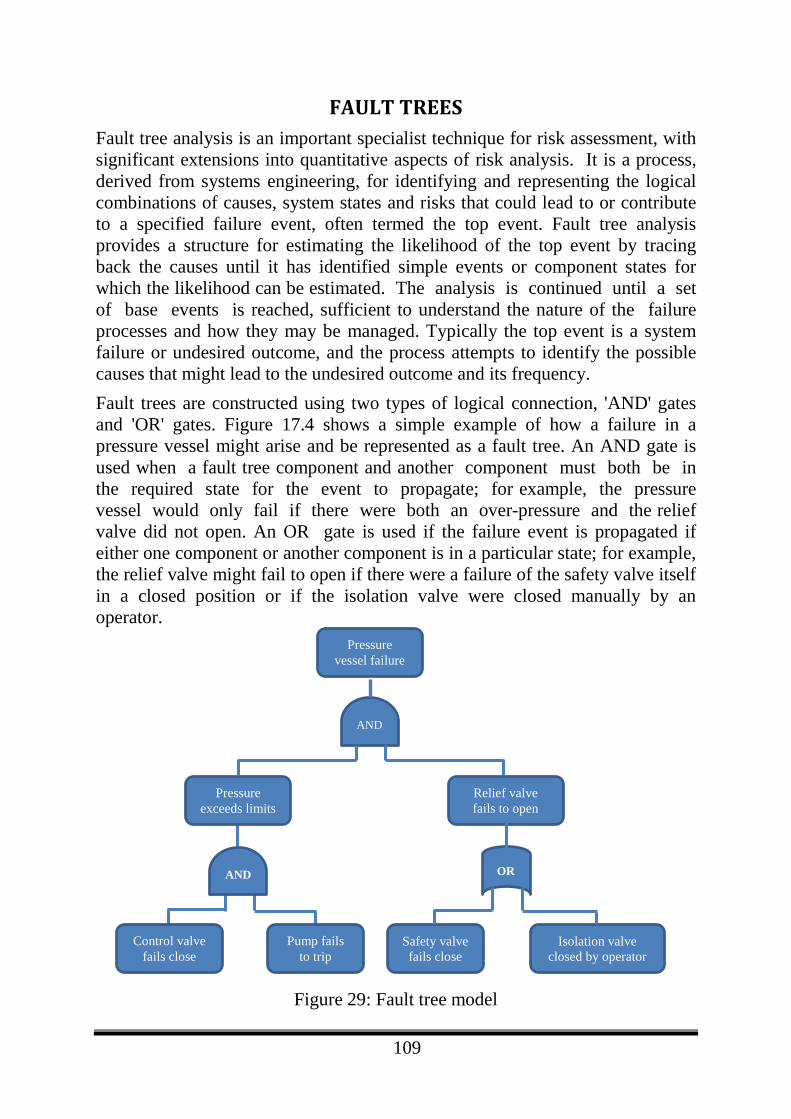
109
FAULT TREES Fault tree analysis is an important specialist technique for risk assessment, with significant extensions into quantitative aspects of risk analysis. It is a process, derived from systems engineering, for identifying and representing the logical combinations of causes, system states and risks that could lead to or contribute to a specified failure event, often termed the top event. Fault tree analysis provides a structure for estimating the likelihood of the top event by tracing back the causes until it has identified simple events or component states for which the likelihood can be estimated. The analysis is continued until a set of base events is reached, sufficient to understand the nature of the failure processes and how they may be managed. Typically the top event is a system failure or undesired outcome, and the process attempts to identify the possible causes that might lead to the undesired outcome and its frequency. Fault trees are constructed using two types of logical connection, 'AND' gates and 'OR' gates. Figure 17.4 shows a simple example of how a failure in a pressure vessel might arise and be represented as a fault tree. An AND gate is used when a fault tree component and another component must both be in the required state for the event to propagate; for example, the pressure vessel would only fail if there were both an over-pressure and the relief valve did not open. An OR gate is used if the failure event is propagated if either one component or another component is in a particular state; for example, the relief valve might fail to open if there were a failure of the safety valve itself in a closed position or if the isolation valve were closed manually by an operator.
Figure 29: Fault tree model
Pressure vessel failure
AND
Pressure exceeds limits
Relief valve fails to open
AND
Pump fails to trip
Control valve fails close
OR
Isolation valve closed by operator
Safety valve fails close