project study on the grand design for global logistics in
TRANSCRIPT

Project Study on the
Grand Design for Global Logistics
in the Indo-Pacific Region
(Second Year)
FINAL REPORT (Summary Version)
March 2020
Japan International Cooperation Agency (JICA)
Pacific Consultants Co., Ltd. (PCKK) EI
JR 20-037


Table of Contents
INTRODUCTION ................................................................................... - 1 -
1. Overview of the Study ............................................................................. - 1 - 1-1 Background of the Study ........................................................................ - 1 - 1-2 Objective of the Study ............................................................................ - 1 -
2. Methodology ........................................................................................... - 2 -
CH.1. OUTLINE OF OUTPUTS OF 1ST YEAR STUDY ....................... - 3 -
1. Background and objectives ....................................................................... - 3 - 2. Scenarios devised in 1st year Study .......................................................... - 4 -
2-1 Scenarios and description ....................................................................... - 4 - 2-2 Assumption for the two scenarios ........................................................... - 5 -
CH.2. INFRASTRUCTURE DEVELOPMENT IN THE INDO-PACIFIC REGION .................................................................................................. - 9 -
1. Overview of Economic Corridors ............................................................. - 9 - 2. Logistics Infrastructure Development Plans by Sector ............................ - 10 -
CH.3. GTAP MODEL ANALYSIS ......................................................... - 11 -
1. Initial Setting for Model Analysis .......................................................... - 11 - 1-1 Country/Region Classifications ............................................................ - 11 - 1-2 Industry Classifications ........................................................................ - 11 - 1-3 Analysis Period and Point of Time ........................................................ - 12 -
2. Scenario Configuration .......................................................................... - 12 - 3. Analysis Result ...................................................................................... - 17 -
CH.4. INTERMODAL GLOBAL LOGISTICS MODEL ANALYSIS .... - 18 -
1. Objective of Logistics Model Analysis ................................................... - 18 - 2. Target Areas for Analysis ....................................................................... - 18 - 3. Analysis Result: Case of Successful Economic Corridor Development .... - 19 -
CH.5. LOGISTICS STRATEGY IN THE INDO-PACIFIC REGION ... - 20 -
1. Ports ...................................................................................................... - 20 - 2. Roads .................................................................................................... - 21 - 3. Findings and Recommendations for Logistics Infrastructure Strategy ...... - 22 -
3-1 Challenges for Logistics Infrastructure Indicated from the Study ........... - 22 - 3-2 Recommendations for JICA’s Approach and Opportunity ...................... - 23 -

Table of Acronyms
Acronym Definition AfCFTA(CFTA) African Continental Free Trade Area AfDB African Development Bank Agardir Agardir Agreement ANZCERTA Australia New Zealand Closer Economic Agreement APTA Asia Pacific Trade Agreement ASEAN The Association of Southeast Asian Nations AU African Union BAU Business As Usual CEMAC Communauté Économique et Monétaire de l'Afrique Centrale CMIP6 Coupled Model Intercomparison Project version 6 COMESA Common Market for Eastern and Southern Africa CU Customs Union EC European Community ECO Economic Cooperation Organization EEA Europe Economic Area EPA Economic Partnership Agreement EU European Union FTA Free Trade Agreement GCC Gulf Cooperation Council GDP Gross Domestic Products GSTP Global System of Trade Preferences among Developing Countries GTAP Global Trade Analysis Project IIASA International Institute for Applied Systems Analysis IPCC Intergovernmental Panel on Climate Change JETRO Japan External Trade Organization JICA Japan International Cooperation Agency MERCOSU Mercado Común del Sur NCAR National Center for Atmospheric Research NEPAD New Partnership for Africa's Development NIES National Institute for Environmental Studies OECD Organisation for Economic Co-operation and Development PAFTA Pan Arab Free Trade Area PIDA Program for Infrastructure Development in Africa PIDA-PAP PIDA Priority Action Plan PTN Protocol relating to Trade Negotiations among Developing Countries RCEP Regional Comprehensive Economic Partnership RCP Representative Concentration Pathways SACU Southern African Customs Union SADC Southern African Development Community SAFTA South Asian Association for Regional Cooperation SC Supply Chain SPARTECA South Pacific Regional Trade and Economic Co-operation Agreement SSP Shared Socioeconomic Pathways TICAD Tokyo International Conference on African Development TPP Trans-Pacific Partnership

Acronym Definition UNFCCC United Nations Framework Convention on Climate Change WTO World Trade Organization


- 1 -
Introduction 1. Overview of the Study
1-1 Background of the Study
The Indo-Pacific region, the target territory of this project study (hereinafter, the “Study”), is a collective term that encompasses the fast-growing Asia region and the emerging African region with huge potential for economic growth. At the 2016 Tokyo International Conference on African Development (TICAD VI), the Japanese Government announced its Free and Open Indo-Pacific (FOIP) Strategy, which drew attention to Indo-Pacific as a region that can achieve high growth as a connected whole by promoting free trade and infrastructure investment to enhance economic connectivity.
To facilitate stable economic growth of each country within the region, it is essential to develop the basic logistics infrastructure, such as ports, harbors, roads, and railways. However, since separate efforts of individual countries can only generate limited effects, partnerships and concerted efforts of neighboring countries and regions, in addition to infrastructure development by individual states, are needed to develop cross-border corridors, etc. to further expand and accelerate the growth of the whole region. To this effect, formulation of an effective logistics strategy from a global and long-term perspective is urgently called for.
However, studies thus far have only projected future demands or analyzed the feasibility of individual projects for developing logistics infrastructure facilities or corridors. Accordingly, no consistent data is available to determine the outlook of global economy and trade volume or the various effects of infrastructure development on a regional scale.
Against this backdrop, JICA, prior to this Study, conducted a project study in 2017 (hereinafter, the “1st Year Study”) to analyze various factors that could affect the international logistics strategy for the Indo-Pacific region, including India and the Sub-Saharan Africa where long-term future growth is expected due to population bonus. The 1st Year Study adopted the scenario planning method to create two scenarios representing a broad range of situations that take into account the high uncertainty of modern society.
1-2 Objective of the Study
This Study attempts to quantitatively project the trade trends in the Indo-Pacific region in 2040 by envisioning the future of global logistics in the region taking a wholistic approach to propose a group of transport infrastructure projects that are consistent throughout the region.

- 2 -
2. Methodology
In this Study, several scenarios are first set, based on the prediction by the year 2040. The global trade trend is then analyzed with GTAP (Global Trade Analysis Project), which is a general applied equilibrium model. The model comprehensively incorporates economic structures or trade conditions of the 40 target countries and regions in the Indo-Pacific Region, and elsewhere around the world.
The results gained by GTAP model is subsequently inputted into the Intermodal Global Logistics Model (hereinafter referred to as Logistics Model), developed by The University of Tokyo Associate Professor Shibasaki et al. Hence using the Model, the future logistics infrastructure is analyzed chiefly for nations along the eastern coast of Africa and landlocked nations.
F igure 1 S tudy Procedure

- 3 -
Outline of Outputs of 1st Year Study In prior to undertaking the Study, the outputs of the 1st Year Study were outlined as
follows.
1. Background and objectives
The background and objective of the 1st Year Study are as follows: Background Since the 2000s, the international economy has undergone dramatic changes
including the advancement of globalization, and emergence of new economic powers such as China and India. It is projected that the gravity center of global economy would continue its shift towards the Indo-Pacific region.
This calls for the necessity for formulation of a long-term logistics strategy for the Indo-Pacific region, including corridor development in East African coastal countries, West Asia, South Asia, and other regions that comprise the Indo-Pacific.
It also requires projection of future scenarios which considers uncertainties in a broad range of variables that can affect global economy and trade.
Objective To address the above needs, this Study attempts to quantitatively project the
trade trends in the Indo-Pacific region for 2030 and beyond, envisioning the future of global logistics in the region from a wholistic approach to propose a group of potential transport infrastructure projects for the region that are consistent to the projection.
The 1st Year Study adopted the scenario-planning method, one of the techniques to examine multiple possibilities of future developments, to analyze various factors that could affect international logistics infrastructure in the Indo-Pacific region. Two scenarios that represent a broad range of possible situations were thus developed.

- 4 -
2. Scenarios devised in 1st year Study
2-1 Scenarios and description
The two scenarios that were devised and configured for this Study is as follows: I. Senario-1: African corridor development realized under loose trade bloc. In this scenario, a coordinated free trade system is established based on the
following assumptions: three Mega-FTAs currently under negotiation (TPP, TTI, and RCEP) will take effect; the One Belt One Road will become public goods; and multinational giant corporations will carry out their responsibilities for respecting human rights and protecting the environment.
In Africa, intra-regional trade is vitalized due to the ratification of the African Continental Free Trade Agreement (AfCFTA) covering the entire continent, and growth is achieved at a faster pace than the global average due to the development of well-balanced and dispersed multi-polar corridors.
II. Senario-2: African corridor development fails under loose trade bloc. In this scenario, a coordinated free trade system is established under Mega-
FTAs, as is the case with Scenario-1. In Africa, however, industry would be formed in a way that intra-regional
import/ export would be limited, and AfCFTA does not take place due to conflict of interest among the countries in the region, creating a situation where economic development becomes overly dependent on extra-regional imports and consumption in metropolitan areas.

- 5 -
2-2 Assumption for the two scenarios
Provided below are detailed descriptions of the above two scenarios.
Table 1-1 Major scenar ios presented by the 1s t Year S tudy
Item Scenario Description
Population Common
Population in 2050 reaches 9.8 billion globally, 1.36 billion in China, 1.66 billion in India, and 800 million in ASEAN.
GDP
Common
Global GDP grows at an average annual rate of 2.6%. Global GDP share in 2050: China (20%), India (15%),
USA (12%), EU27 (9%)
S1 Africa grows at an average annual rate of 6.6 – 5.7%
(high case)
S2 Africa grows at an average annual rate of 4.0 – 3.6%
(low case)
Expansion of free trade
Common
More Mega-FTAs are created to complement WTO. Horizonal international specialization progresses further in each area. Intra-regional trade becomes relatively dominant (TPP, TTIP, RCEP, etc.)
S1
Investment under China’s One Belt One Road initiative contributes to the development of India and African countries.
Economic integration within the African continent progresses due to CFTA.
Quality growth is achieved as a result of developing corridors in Africa.
S2
Investment under One Belt One Road initiative does not contribute to Africa’s quality growth (it only accelerates over dependence on extra-regional imports and consumption in metropolitan areas).
CFTA is not reached (due to conflict of interest within the African continent).
Global trade
Common Global trade increases at a similar pace to GDP (even
trade).
S1
Trade volume within African region grows faster than GDP due to expanding intra-African trade under CFTA (fast trade).
S2 Intra-African trade, as is the case with global trade,
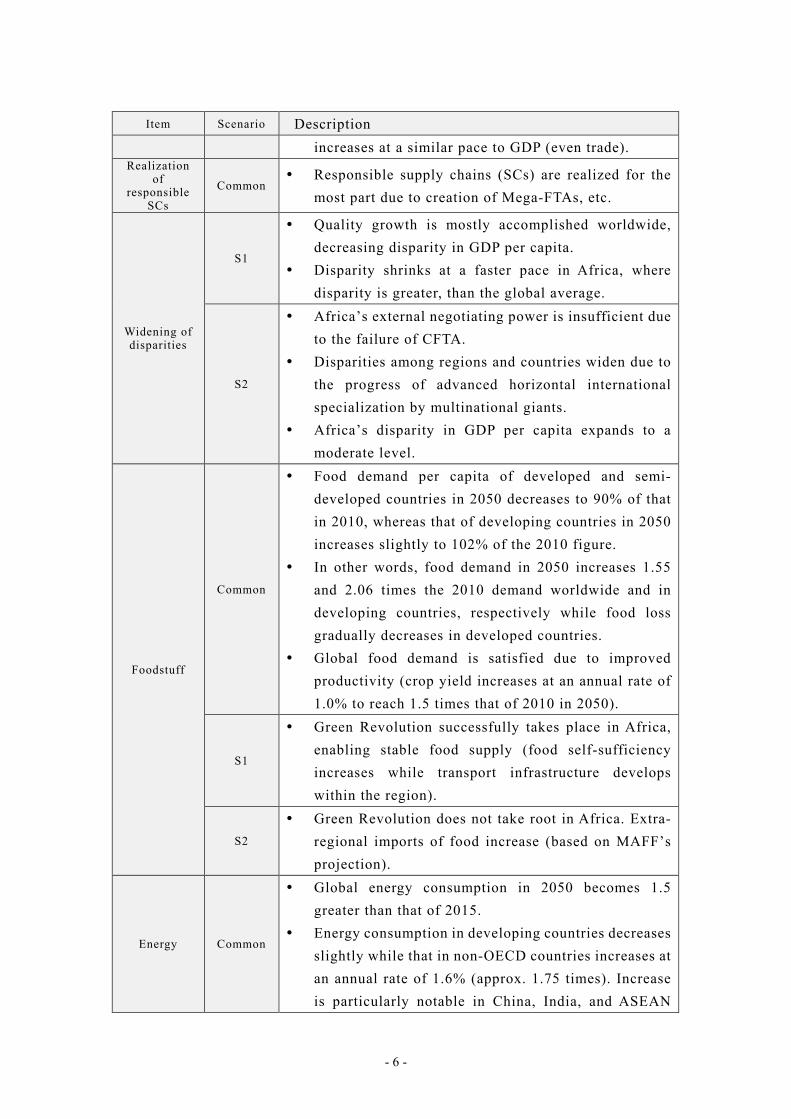
- 6 -
Item Scenario Description increases at a similar pace to GDP (even trade).
Realization of
responsible SCs
Common Responsible supply chains (SCs) are realized for the
most part due to creation of Mega-FTAs, etc.
Widening of disparities
S1
Quality growth is mostly accomplished worldwide, decreasing disparity in GDP per capita.
Disparity shrinks at a faster pace in Africa, where disparity is greater, than the global average.
S2
Africa’s external negotiating power is insufficient due to the failure of CFTA.
Disparities among regions and countries widen due to the progress of advanced horizontal international specialization by multinational giants.
Africa’s disparity in GDP per capita expands to a moderate level.
Foodstuff
Common
Food demand per capita of developed and semi-developed countries in 2050 decreases to 90% of that in 2010, whereas that of developing countries in 2050 increases slightly to 102% of the 2010 figure.
In other words, food demand in 2050 increases 1.55 and 2.06 times the 2010 demand worldwide and in developing countries, respectively while food loss gradually decreases in developed countries.
Global food demand is satisfied due to improved productivity (crop yield increases at an annual rate of 1.0% to reach 1.5 times that of 2010 in 2050).
S1
Green Revolution successfully takes place in Africa, enabling stable food supply (food self-sufficiency increases while transport infrastructure develops within the region).
S2
Green Revolution does not take root in Africa. Extra-regional imports of food increase (based on MAFF’s projection).
Energy Common
Global energy consumption in 2050 becomes 1.5 greater than that of 2015.
Energy consumption in developing countries decreases slightly while that in non-OECD countries increases at an annual rate of 1.6% (approx. 1.75 times). Increase is particularly notable in China, India, and ASEAN

- 7 -
Item Scenario Description countries, as well as in Middle East, North Africa, and Sub-Saharan Africa (due to population and economic growth).
79% of energy demand is satisfied by fossil fuels (30% petroleum, 26% natural gas, and 23% coal) and the remaining 21% by other fuels. There is no depletion of resources.
Production of fossil fuels in 2050 increases to 1.35 times that of 2015 (at an annual rate of 0.9%) for petroleum, 1.76 times (1.6%) for natural gas, and 1.18 times (0.5%) for coal. However, if conversion to electric cars and other ZEVs accelerates, petroleum demand will be about 99% of that in 2015.
Consumer awareness
Common While over-consumerism accelerates due to increased income, the “sustainable consumption” concept gradually gains awareness and popularity toward the achievement of SDGs (reaching a halfway point).
Technological innovation
Common Productivity of horticulture, livestock farming, and fisheries, as well as storage/transport technologies, continue to improve and become more sophisticated.
Super-large container ships (40,000 TEU class) will not emerge (They will stay at the current 20,000 TEU level due to navigation restrictions in the Suez Canal and the Straits of Malacca).
Climate change risk
Common International horizontal specialization progresses under a loose trade bloc. Stable economic growth is achieved while maintaining the supply-demand balance of food and energy.
Climate change risk equivalent to a medium stabilizing scenario (RCP4.5) as a result of certain mitigation measures is assumed.
Risk of war, conflict, and
terrorism
S1 The risk of war, conflict, and terrorism remains “low” due to formation of a loose trade bloc.
S2 While international horizontal specialization progresses based on comparative advantage under a loose trade bloc, corridor development fails.
Multinational giants accumulate wealth by leading the trade market while nations and citizens are deprived

- 8 -
Item Scenario Description of their fair shares, posing a “high risk” for conflict and terrorism.
Impact on global
logistics
Common Global trade increases at a similar level to GDP (even trade).
Size of large container vessels remains at the current 20,000TEU level.
Two types of ocean freight networks (hub-and-spoke and point-to-point) develop at multiple levels.
Medium to small container ships (4,000TEU – 8,000TEU) are predominant in the Intra-Asia trade.
Advancement of international horizontal specialization heightens the importance of warehouse facilities as storage and inland gateways.
Transshipment services via hub ports in Asia, Sub-Saharan Africa, and Islamic region (Port of Colombo, Port Luis, Port Salalah, and Port Mombasa) are prevalent.

- 9 -
Infrastructure Development in the Indo-Pacific Region The related development plans and masterplans of logistics infrastructure were
reviewed in order to collect information to develop a viable analysis case for Intermodal Global Logistic Model aimed at simulating freight transport.
1. Overview of Economic Corridors
・ Figure 2-1 shows the economic corridors which are located in the target countries for the Study. Maputo Corridor, North-South Corridor, Dar es Salaam Corrido, Beira Corridor, Nacala Corridor, Trans-Caprivi Corridor, Trans-Kalahari Corridor, and Lobito Corridor are the major corridors in eastern and southern Africa regions.
・ Further, parts of the Nacala Corridor, Djibouti Corridor, and East Africa Northern Corridor were included in the five priority areas for Africa economic corridor development assistance at TICAD V, held in Yokohama in 2013 by the Japanese government.
Source: Prepared by the Study Team (Background map: Open Street Map)
Figure 2-1 Map of Corr idor P lan Locat ions

- 10 -
2. Logistics Infrastructure Development Plans by Sector
・ Information regarding the logistics infrastructure including ports, roads, railways, inland water transport, and dry ports were collected and reviewed.
・ Figure 2-2 shows the location of ports whose development plan were reviewed
Source: Prepared by the Study Team (Background map: Open Street Map)
Figure 2-2 Locat ion of reviewed por t s

- 11 -
GTAP Model Analysis For the economic analysis, several scenarios are first set, based on the prediction by
the year 2040. The global trade trend is then analyzed with GTAP (Global Trade Analysis Project), which is a general applied equilibrium model. The model comprehensively incorporates economic structures or trade conditions of the 40 target countries and regions in the Indo-Pacific Region, and elsewhere around the world.
1. Initial Setting for Model Analysis
1-1 Country/Region Classifications
The 140 countries and regions of the GTAP9 Data Base are consolidated into the 31 countries and regions in the GTAP Model analysis for the Study.
The Study focuses on global logistics in the Indo-Pacific; therefore, countries in East Africa and South Asia that border the Indian Ocean are the targets of the analysis, and are treated as individual countries. Countries in other regions are consolidated into regional units, with each treated as a hypothetical country in the GTAP Model.
F igure 3-1 Image of GTAP Model Count ry /Region Class i f ica t ion
1-2 Industry Classifications
The GTAP9 Data Base used for the Study contains 57 different industrial sectors (goods) that are aggregated into the following 10 industrial sectors for the GTAP Model for the Study.

- 12 -
Based on the assumption that analysis on bulk freight transport is conducted separately, primary resource industries that involve a lot of bulk cargo are subdivided to the highest degree. Conversely, given that the main purpose of the Study is to gain a full understanding of trends in international trade, non-tradable goods are aggregated into the “10. Services” sector.
Table 3-1 Set t ings for Indus t r ia l Sec tors (goods)
A g g r e g a t e d s e c t o r s O r i g i n a l s e c t o r s c o d e 1 . A g r i c u l t u r e ( a g r i c u l t u r e , f o r e s t r y, a n d f i s h e r i e s )
P D R , W H T, G R O, V _ F, O S D , C _ B , P F B , O C R , C T L , O A P, R M K , W O L , F R S , F S H
2 . C o a l C O A 3 . O i l ( c r u d e o i l ) O I L 4 . G a s ( L N G ) G A S 5 . M i n e r a l s ( m i n i n g ) O M N 6 . C o n s u m p t i o n g o o d s ( c o n s u m e r g o o d s )
C MT, O MT, V O L , M I L , P C R , S G R , O F D , B _ T, T E X, WA P, L E A , L U M, O M F
7 . I n d u s t r i a l ma t e r i a l s ( i n d u s t r i a l i n p u t g o o d s ) P P P, P _ C , C R P, N M M , I _ S , N F M , F M P
8 . M o t o r v e h i c l e s ( a u t o m o b i l e s ) M V H
9 . P r o c e s s i n g / A s s e m b l i n g s ( i n d u s t r i a l m a c h i n e r y / a s s e m b l y )
O T N, E L E , O M E
1 0 . S e r v i c e s ( o t h e r s e r v i c e s ) I n d u s t r i a l s e c t o r s o t h e r t h a n t h e a b o v e
1-3 Analysis Period and Point of Time
For analysis, the base year is 2011—the base year of GTAP9—and the target years are set at 2016, 2020, 2025, 2030, 2035, and 2040.
The base year of the logistics model is 2016; setting 2016 as an analysis section aligns the results of the calculations, which are used as input data for the logistics model, with the assumptions of the logistics model.
2. Scenario Configuration
In the GTAP Model, scenario-based shocks are applied to the exogenous variables, and the impacts on endogenous variables are analyzed with and without the shocks.
In the Study, the future scenario resulting from 1st Year Study is the basis for setting the baseline scenario and two long-term scenarios: the “Africa Economic Corridor Development Success Scenario”; and the “Africa Economic Corridor Development Failure Scenario”.
It is worth noting that the results of 1st Year Study contain parts that are conceptual, and parts that do not fully consider the calculation possibilities of the GTAP Model. Therefore, in this research, the details of each scenario—specifically, the settings in the GTAP Model—are defined. Outlines of each scenario are as follows.

- 13 -
Table 3-2(1) Scenar io Conf igura t ion (Popula t ion) 1. Population (1st Year Study results) All scenarios: Population in 2050 reaches 9.8 billion globally, 1.36 billion in China,
1.66 billion in India, and 800 million in ASEAN Population Settings
BL ■Global: SSP2 population growth rate
S1
■Africa: SSP2 population growth rate plus an additional 0.33% per year (envisioning a population 10% greater than the SSP2 population in 2040)
■Rest of the world: (Same as BL) SSP2 population growth rate
S2 ■Africa: SSP2 population growth rate minus 0.33% per year (envisioning a
population 10% less than the SSP2 population in 2040) ■Rest of the world: (Same as BL) SSP2 population growth rate
Labor Settings
BL ■Global: (Same as BL) The overall workforce fluctuates at the same rate as the
population. The ratio of skilled to unskilled workers remains in the present state until 2040.
S1
S2
Table 3-2(2) Scenar io Conf igura t ion (GDP)
2. GDP (1st Year Study results) All scenarios: Global GDP grows at an average annual rate of 2.6% All scenarios: Global GDP share in 2050: China (20%), India (15%), USA (12%),
EU27 (9%) S1: Africa grows at an average annual rate of 6.6 – 5.7% (high case) S2: Africa grows at an average annual rate of 4.0 – 3.6% (low case) GDP/Rate of Technological Innovation Settings
BL ■Global: Rate of technological innovation for total factor productivity (Afereg) to achieve SSP2 GDP growth rate
S1
■Africa: GDP growth rate set to the BL GDP growth rate for African countries plus 1.5% (the difference of 1.5%/year between the SSP2 GDP growth rate of 5.1%/year for 2010-2040 and the maximum envisioned growth rate of 6.6%/year from 1st Year Study).
■Rest of the world: (Same as BL) SSP2 GDP growth rate.
S2
■Africa: GDP growth rate set to the BL GDP growth rate for African countries minus 1.5% (the difference of 1.5%/year between the SSP2 GDP growth rate of 5.1%/year for 2010-2040 and the minimum envisioned growth rate of 3.6%/year from 1st Year Study).
■Rest of the world: (Same as BL) SSP2 GDP growth rate.

- 14 -
Table 3-2(3) Scenar io Conf igura t ion (Expans ion of Free Trade) 3. Expansion of Free Trade (1st Year Study results) All scenarios: (1) More Mega-FTAs are created to complement WTO. Horizonal
international specialization progresses further in each area. Intra-regional trade becomes relatively dominant (TPP, TTIP, RCEP, etc.)
S1: (1) Investment under China’s One Belt One Road initiative contributes to the development of India and African countries, (2) Economic integration within the African continent progresses due to CFTA, and (3) Quality growth is achieved as a result of developing corridors in Africa
S2: (1) Investment under One Belt One Road initiative does not contribute to Africa’s quality growth (it only accelerates over dependence on extra-regional imports and consumption in metropolitan areas), and (2) CFTA is not reached (due to conflict of interest within the African continent)
Tariff Rate Settings
BL
■Global: FTAs/EPAs planned/discussed as of 2019 are established. Tariffs between signatories are phased out in four stages. (Stage 1: 25% reduction, Stage 2: 33% reduction, Stage 3: 50% reduction, Stage 4: 100% reduction) *The timing of tariff rate reduction stages depends on the FTA/EPA
S1
■Africa: (Same as BL) The development of economic corridors in Africa enhances opportunities for free trade, and FTAs/EPAs planned/discussed as of 2019 are established. Tariffs between signatories are phased out in four stages. (Stage 1: 25% reduction, Stage 2: 33% reduction, Stage 3: 50% reduction, Stage 4: 100% reduction) *The timing of tariff rate reduction stages depends on the FTA/EPA
■Africa: In addition to the above, all tariffs between African countries that have not yet discussed FTAs/EPAs are phased out starting in 2020. (Envisioning the transcontinental reach of the Africa Continental Free Trade Area (AfCFTA) put into effect in May 2019) (2020 to 2025 (Stage 1): 25% reduction: 2025 to 2030 (Stage 2): 33% reduction, 2030 to 2035 (Stage 3): 50% reduction, 2035 to 2040 (Stage 4): 100% reduction)
■Rest of the world: (Same as BL) The development of economic corridors in Africa enhances opportunities for free trade, and FTAs/EPAs planned/discussed as of 2019 are established. Tariffs between signatories are phased out in four stages (Stage 1: 25% reduction, Stage 2: 33% reduction, Stage 3: 50% reduction, Stage 4: 100% reduction) *The timing of tariff rate reduction stages depends on the FTA/EPA
S2
■Africa: Stalemates, suspensions, and other problems with negotiations for FTAs/EPAs planned/discussed as of 2019 cause tariff rates to remain at the present level in and after 2020 to 2025 (Stage 3).
■Rest of the world: (Same as BL) FTAs/EPAs planned/discussed as of 2019 are established. Tariffs between signatories are phased out in four stages. (Stage 1: 25% reduction, Stage 2: 33% reduction, Stage 3: 50% reduction, Stage 4: 100% reduction) *The timing of tariff rate reduction stages depends on the FTA/EPA

- 15 -
Table 3-2(4) Scenar io Conf igura t ion (Food) 7. Foodstuff (1st Year Study results) All scenarios: (1) Food demand per capita of developed and semi-developed
countries in 2050 decreases to 90% of that in 2010, whereas that of developing countries in 2050 increases slightly to 102% of the 2010 figure.(2) In other words, food demand in 2050 increases 1.55 and 2.06 times the 2010 demand worldwide and in developing countries, respectively while food loss gradually decreases in developed countries.(3) Global food demand is satisfied due to improved productivity (crop yield increases at an annual rate of 1.0% to reach 1.5 times that of 2010 in 2050).
S1: (1)Green Revolution successfully takes place in Africa, enabling stable food supply (food self-sufficiency increases while transport infrastructure develops within the region).
S2: (1) Green Revolution does not take root in Africa. Extra-regional imports of food increase (based on MAFF’s projection).
Agricultural and Fisheries Factor Productivity Settings
BL ■Global: Agricultural and fisheries (Agri) factor productivity (Afeall)
increases at an annual rate 1% higher than total factor productivity (land, skilled labor, unskilled labor, capital, resources).
S1
■Africa: Agricultural and fisheries (Agri) factor productivity (Afeall) increases at an annual rate 3.04% higher than total factor productivity (land, skilled labor, unskilled labor, capital, resources) (set based on the average productivity rate increase between factors in Africa in the GTAP Data Base from 2004 to 2011).
■Rest of the world: (Same as BL) Agricultural and fisheries (Agri) factor productivity (Afeall) increases at an annual rate 1% higher than total factor productivity (land, skilled labor, unskilled labor, capital, resources).
S2
■Africa: Remains in the present state (no change). ■Rest of the world: (Same as BL) Agricultural and fisheries (Agri) factor
productivity (Afeall) increases at an annual rate 1% higher than total factor productivity (land, skilled labor, unskilled labor, capital, resources).

- 16 -
Table 3-2(5) Scenar io Conf igura t ion (Energy) 8. Energy (1st Year Study results) All scenarios: (1) Global energy consumption in 2050 becomes 1.5 greater than that of 2015. (2)Energy consumption in developing countries decreases slightly while that in non-
OECD countries increases at an annual rate of 1.6% (approx. 1.75 times). Increase is particularly notable in China, India, and ASEAN countries, as well as in Middle East, North Africa, and Sub-Saharan Africa (due to population and economic growth).
(3) 79% of energy demand is satisfied by fossil fuels (30% petroleum, 26% natural gas, and 23% coal) and the remaining 21% by other fuels. There is no depletion of resources.
(4) Production of fossil fuels in 2050 increases to 1.35 times that of 2015 (at an annual rate of 0.9%) for petroleum, 1.76 times (1.6%) for natural gas, and 1.18 times (0.5%) for coal. However, if conversion to electric cars and other ZEVs accelerates, petroleum demand will be about 99% of that in 2015.
Natural Resource Reserve Settings
BL ■Global: Natural resource reserves increase 1.2% per year (set based on the
annual average rate of increase in the GTAP Data Base from 2004 to 2011).
S1 ■Africa: Natural resource reserves increase 2.4% per year (twice as high as the
rest of the world). ■Rest of the world: (Same as BL) Natural resource reserves increase 1.2% per
year.
S2 ■Africa: Remains in the present state (no change). ■Rest of the world: (Same as BL) Natural resource reserves increase 1.2% per
year.
Table 3-2(6) Scenar io Conf igura t ion (Technology Innovat ion) 10. Technological Innovation (1st Year Study Results) All scenarios: (1) Productivity of horticulture, livestock farming, and fisheries, as well as
storage/transport technologies, continue to improve and become more sophisticated.
(2) Super-large container ships (40,000 TEU class) will not emerge (They will stay at the current 20,000 TEU level due to navigation restrictions in the Suez Canal and the Straits of Malacca).
Rate of Technological Innovation in Transport (ATS, ATD) Settings
BL ■Global: Increases 0.76% per year (set based on the global average productivity
rate increase in the transport sector in the GTAP Data Base from 2004 to 2011).
S1 ■Africa: Increases 3.38% per year (set based on the African average
productivity rate increase in the transport sector in the GTAP Data Base from 2004 to 2011).
■Rest of the world: (Same as BL) Increases 0.76% per year.
S2 ■Africa: Remains in the present state (no change) due to lack of technical
innovation. ■Rest of the world: (Same as BL) Increases 0.76% per year.

- 17 -
3. Analysis Result
The results of the GTAP Model Analysis are as outlined below:
The simulations show the highest rates of change for Africa and the world in Scenario “S2”, followed by Scenarios “BL” and “S1”. Particularly, in South Asia, a region with active trade with Africa, exports increase substantially despite a decrease in exports to Africa due to the impact of burgeoning intraregional free trade there, and imports also increase substantially. The resulting expansion of globalization and regional integration under Africa Economic Corridor Development, the AfCFTA, and other economic cooperation framework only benefit Africa, but also radiate outward to other regions of the world. However, this is likely the result of intensified competition in international trade between South Asian exports and goods produced in Africa. There are significant differences in the rates of change of countries, regions, and industrial sectors in Africa. Additionally, Scenarios “BL” and “S2” show higher rates of increase than Scenario “S1”. This is likely due to the expansion of Africa Economic Corridor Development and the AfCFTA, and indicative of inequality within Africa due to alternative goods brought about by changes to terms of trade between regions and industrial sectors.
Figure 3-2 Change of Trade Value by Indus t r ies (GTAP Model Analys is )

- 18 -
Intermodal Global Logistics Model Analysis
1. Objective of Logistics Model Analysis
To identify infrastructure development issues in the region and gain implications for strategies, the intermodal global logistics model developed by University of Tokyo Associate Professor Shibasaki and others (“the Logistics Model”) is applied to the Indo-Pacific, with special focus on East Coast of Africa. The current situation and the future freight transport were simulated and analyzed based on actual maritime and land transport networks within the region with the Logistics Model.
2. Target Areas for Analysis
The target of this analysis is the Indo-Pacific, with a particular focus on land transport in East Africa. The analysis involves simulating and projecting the flow of freight in freight transport networks within the hinterland of each port in the region. Additionally, a global maritime container transport model is applied to analyze the flow of freight in container freight transport networks between ports around the world.
Figure 4-1 Por t s Incorpora ted in to the Global Logis t ics Model

- 19 -
3. Analysis Result: Case of Successful Economic Corridor Development
According to the calculation result of the logistics model for the economic corridor development, the development of economic corridors and OSBP are expected to deliver an 18% reduction in the average unit price of land transport in East African countries. The changes of average transportation cost by region are as shown in
The average unit price of land transport in coastal countries 1 with their own ports declined 12%, while the average unit price of land transport in landlocked countries 2 that rely on border crossings to access ports declined 18%; landlocked countries enjoyed a roughly 50% greater reduction in the unit price of transport than coastal countries.
However, the average unit price of land transport may increase because gaps between the planned transport capacity and future freight demand of some roads in coastal countries will result in congestion due to the concentration of freight.
If these roads are upgraded to ensure sufficient transport capacity in the future, further reductions in the unit price of transport can be expected.
Figure 4-2 Compar ison of the Average Uni t Pr ice of Land Transpor t in Coas ta l Count r ies and Landlocked Count r ies
1 C o a s t a l c o u n t r i e s : E g y p t , S u d a n , E r i t r e a , D j i b o u t i , S o m a l i a , K e n y a , Ta n z a n i a , M o z a m b i q u e , S o u t h A f r i c a
2 L a n d l o c k e d c o u n t r i e s : E t h i o p i a , S o u t h S u d a n , U g a n d a , R w a n d a , B u r u n d i , D e m o c r a t i c R e p u b l i c o f t h e
C o n g o , Z a m b i a , M a l a w i , Z i m b a b w e , B o t s w a n a , E s w a t i n i , L e s o t h o

- 20 -
Logistics Strategy in the Indo-Pacific Region Bottlenecks in logistics infrastructure such as ports and roads (economic corridors)
were identified based on the results of the logistics model simulations explained in the previous sections.
1. Ports
The comparison of projected future freight demand against the current and planned capacity of the ports are as shown in Figure 5-1.
The result of the analysis implies that Dar es Salaam and Nacala should be given high priority for development, as they will most likely face capacity shortages.
Figure 5-1 Pro jec t ions of Por t Fre igh t Handl ing Demand, aga ins t Current and Planned Por t Handl ing Capaci ty

- 21 -
2. Roads
Figure 5-2 shows the present conditions of the freight road network based on PIDA report, and freight flow forecasts based on the simulation result.
North-South Corridor has the largest freight flow, followed by Northern Corridor and Central Corridor.
Growth in freight flow is expected especially in the road sections connecting ports and large cities, for which steady development needs to be ensured. Here, attention needs to be paid to railroad development, as it could affect the freight transport capacity.
Figure 5-2 Current S ta te o f Fre igh t Transpor t Road Networks and Fre ight F low Forecas t

- 22 -
3. Findings and Recommendations for Logistics Infrastructure Strategy
Based on the findings of the analysis, the future challenges for logistics infrastructure development, and recommendations for JICA’s approach and opportunities for logistics sector are outlined.
3-1 Challenges for Logistics Infrastructure Indicated from the Study
3-1-1 Facilitation of Integrated Development of Economic Corridors and OSBPs for Sustainable Growth
The analysis results of the logistics model suggest that physical measure of developing economic corridor while providing institutional measure of developing OSBPs to improve custom procedures would contribute to reducing the average land freight transport cost for coastal countries and inland countries by 12% and18% respectively. Thus, it was implied that the impact on trade cost reduction would be higher in inland countries.
In order to further facilitate growth of the inland countries, it is important to take wholistic approach, that is, to promote development and improvement of port facilities in coastal countries, while at the same time enhance connectivity through economic corridor development and OSBP facilitation.
3-1-2 Formulation of Ports Development Strategy with regards to Hinterland Connectivity
The analysis of ports with high economic benefits from international import/ export of maritime container freight in the East African region indicated that the development of economic corridors and trade facilitation by OSBP can diversify the port selections. In particular, the major ports such as Mombasa, Dar es Salaam, Beira, Durban also transport freights to several inland countries and plays an important role in the economic development of these regions.
In order to formulate a port development strategy in the future, it is important to consider the changes in the transport network in the hinterland and also the freight transport demand of inland regions and countries that result from the development of economic corridors and the facilitation of OSBP.
3-1-3 Facilitation of proportionate infrastructure development with regards to the future growth of freight demand
The integrated analysis of freight flow by transport route in the eastern African region and the road condition as of 2009 indicated by PIDA showed that it is imperative to have develop and maintain the road conditions to a sufficient level,
- 23 -
especially for the roads with poor conditions and huge freight transport demand. In addition, the results of freight transportation demand forecasts in the eastern
African region and network allocations indicated that there were ports with sufficient planned capacities for future demands and ports with insufficient capacities (such as Dar es Salaam and Nacala). The infrastructures that should be developed with priority were identified.
In order to achieve sustainable economic growth in the eastern African region, it is important to fully consider the freight demand in the hinterland, as well as to develop ports in the surrounding area with considerations into the development plans of transport infrastructure in the hinterland.
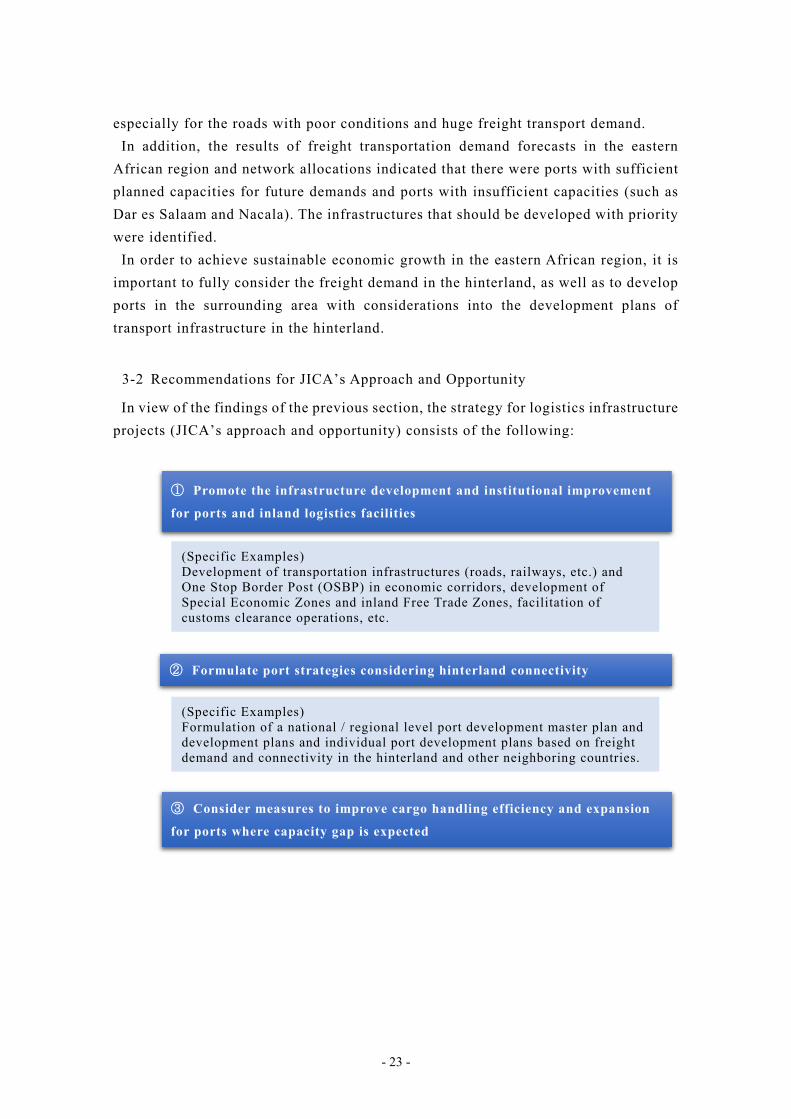
3-2 Recommendations for JICA’s Approach and Opportunity
In view of the findings of the previous section, the strategy for logistics infrastructure projects (JICA’s approach and opportunity) consists of the following:
① Promote the infrastructure development and institutional improvement
for ports and inland logistics facilities
② Formulate port strategies considering hinterland connectivity
③ Consider measures to improve cargo handling efficiency and expansion
for ports where capacity gap is expected
(Specific Examples) Development of transportation infrastructures (roads, railways, etc.) and One Stop Border Post (OSBP) in economic corridors, development of Special Economic Zones and inland Free Trade Zones, facilitation of customs clearance operations, etc.
(Specific Examples) Formulation of a national / regional level port development master plan and development plans and individual port development plans based on freight demand and connectivity in the hinterland and other neighboring countries.