project title: inline chemistry for reactive trace gases ... · pdf filethis special project...
TRANSCRIPT

June 2015 This template is available at: http://www.ecmwf.int/en/computing/access-computing-facilities/forms
SPECIAL PROJECT FINAL REPORT All the following mandatory information needs to be provided. Project Title: Inline chemistry for reactive trace gases
within IFS
Computer Project Account: spnlmacc
Start Year - End Year : 2012- 2014 Principal Investigator(s) V. Huijnen
Affiliation/Address: Royal Netherlands Meteorological Institute (KNMI) P.O. Box 201 3730 AE De Bilt
Other Researchers (Name/Affiliation):
Dr. H. Eskes

June 2015 This template is available at: http://www.ecmwf.int/en/computing/access-computing-facilities/forms
The following should cover the entire project duration. Summary of project objectives (10 lines max)
This special project aimed at establishing and benchmarking a version of ECMWF’s Integrated Forecasting System that contains tropospheric chemistry based on the TM5 chemistry model. At the start of the project parameterizations in the system, such as photolysis, dry / wet deposition and lightning NOx emissions, required testing in detail. The aim was a deliverably of the C-IFS system to the wider community at the end of 2014. During the course of the special project, research work has been shifted towards the integration of stratospheric chemistry originating from BASCOE (Belgian Assimilation System for Chemical ObsErvations). Summary of problems encountered (If you encountered any problems of a more technical nature, please describe them here. ) I experienced considerable troubles related to the upgrade of the C-IFS to the new super-computer, as a mix of code changes, script changes and permission issues specific for member states. It took over two months to resolve most of this – also because much of the migration happened during the summer period. Experience with the Special Project framework (Please let us know about your experience with administrative aspects like the application procedure, progress reporting etc.) I’m pleased with the Special Project framework, with its clear procedure. Only the word-document template for the reporting is not very practical (containing invisible tables), and could be revised. Summary of results (This section should comprise up to 10 pages and can be replaced by a short summary plus an existing scientific report on the project.)

June 2015 This template is available at: http://www.ecmwf.int/en/computing/access-computing-facilities/forms
Introduction A major accomplishment resulting from all benchmarking and testing as supported this special project is the start of operational use of Composition IFS (C-IFS) for forecast and data assimilation of global atmospheric composition in preparation of the Copernicus Atmosphere Monitoring Service (CAMS), in September 2014. The C-IFS-CB05 model as used in the operational system has been documented in Flemming et al. (2015) and the application of data assimilation using this model in Inness et al. (2015). Ongoing research work is supported by this series of special projects, where the key elements of progress achieved in the past years include (i) the coupling to the aerosol model as described in Huijnen et al. (2014). Improving the run environment and the flexibility of the chemistry code management was investigated through the use of the Kinetic Pre-Processor (KPP) software for automated chemistry solver generation (ii). A major new development concerned the coding and testing of a version of C-IFS using the stratospheric chemistry mechanism based on BASCOE chemistry (iii). This module is coupled to C-IFS-CB05 in order to extend the applicability of this version to model the stratospheric composition. These three subjects are discussed in more detail in the following subsections. (i) Coupling of aerosol to tropospheric chemistry The modified band approach, which is adopted for the computation of photolysis rates (Williams et al., 2012), uses the actual aerosol optical properties of the MACC aerosol components at each model level in the computation of the actinic fluxes in the full column. For this purpose we have ported the computation in IFS for total aerosol absorption, scattering and single scattering albedo as constructed from all aerosol components within each grid box at two wavelengths (340 and 645 nm), and interpolated it to the wavelengths required for the photolysis routine. For shorter wavelengths we use the proportionality AOD ~ λ-1 to extrapolate to the 5 wavelength bands ranging between 205nm and 320nm, while for the SSA we simply use the value as computed for 340 nm. For the wavelength bands 370-580 we apply interpolation. In Fig. 1 we illustrate the effect of the modified photolysis on atmospheric composition during the August 2010 Russian fires. As a consequence of the reduced photolysis of NO2, a reduction in O3 of up to 8 ppb (~10%) was found locally, illustrating that this can have a local impact under specific conditions with high aerosol loading. On a global scale the reduction of the photolysis rates at the surface has a small effect on the oxidizing capacity, increasing the CH4 lifetime by ~0.1 yr.
.
Figure 1. Illustration of the effect of modified photolysis during the August 2010 Russian fires. Left: AOD on 8 August 2010. Middle: corresponding change in NO2 photolysis at the surface, right: daily mean change in surface O3.
June 2015 This template is available at: http://www.ecmwf.int/en/computing/access-computing-facilities/forms
For the computation of heterogeneous reactions taking place on aerosol and cloud particles a pseudo first-order rate constant is used (Schwartz, 1986):
𝑘ℎ𝑒𝑒 = � 𝑟𝑒𝐷𝑔
+ 4𝑐𝑐�−1𝐴 (1)
Where re (cm) is the particle effective radius, Dg [cm2s-1] is the gas phase diffusion coefficient, γ is the uptake coefficient, c [cm s-1] is the mean molecular speed, and A is the cloud or aerosol surface area density [cm2cm-3]. The SAD for liquid cloud and aerosol particles is computed as:
𝐴 = 3𝑀𝜌𝑟𝑒
(2)
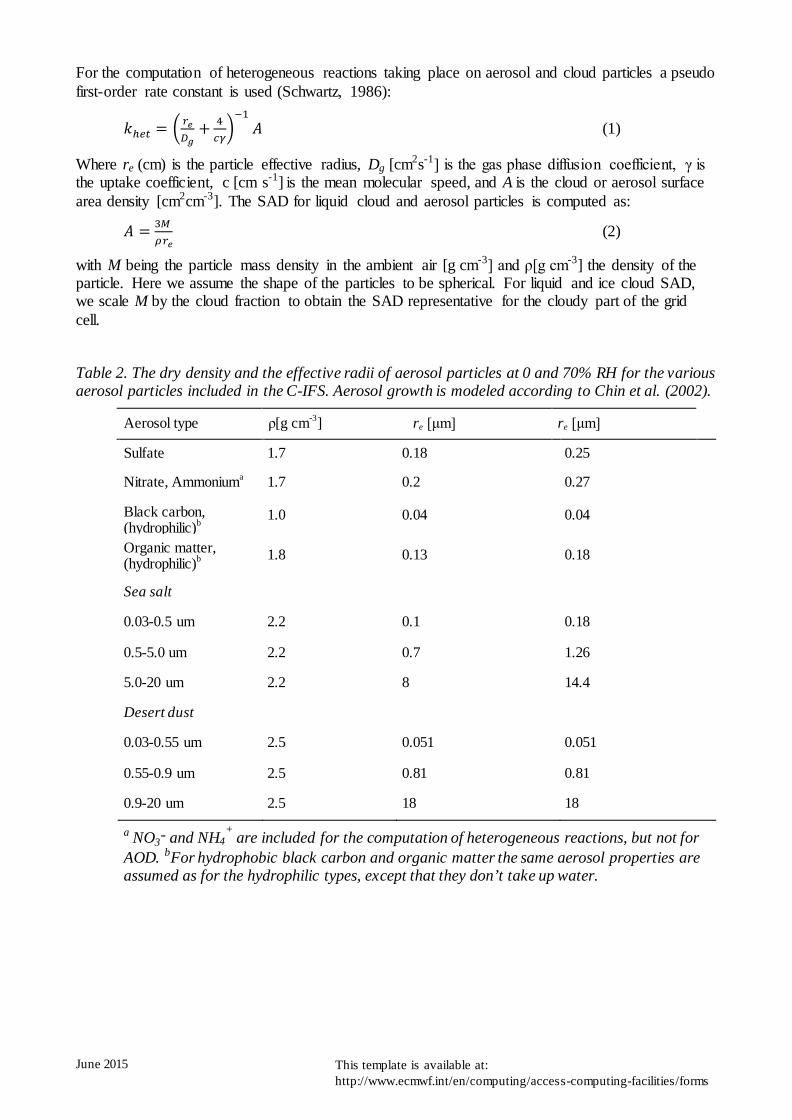
with M being the particle mass density in the ambient air [g cm-3] and ρ[g cm-3] the density of the particle. Here we assume the shape of the particles to be spherical. For liquid and ice cloud SAD, we scale M by the cloud fraction to obtain the SAD representative for the cloudy part of the grid cell.
Table 2. The dry density and the effective radii of aerosol particles at 0 and 70% RH for the various aerosol particles included in the C-IFS. Aerosol growth is modeled according to Chin et al. (2002).
Aerosol type ρ[g cm-3]
re [μm]
re [μm] Sulfate 1.7 0.18 0.25
Nitrate, Ammoniuma 1.7 0.2 0.27
Black carbon, (hydrophilic)b
1.0 0.04 0.04
Organic matter, (hydrophilic)b 1.8 0.13 0.18
Sea salt
0.03-0.5 um 2.2 0.1 0.18
0.5-5.0 um 2.2 0.7 1.26
5.0-20 um 2.2 8 14.4
Desert dust
0.03-0.55 um 2.5 0.051 0.051
0.55-0.9 um 2.5 0.81 0.81
0.9-20 um 2.5 18 18
a NO3- and NH4+ are included for the computation of heterogeneous reactions, but not for
AOD. bFor hydrophobic black carbon and organic matter the same aerosol properties are assumed as for the hydrophilic types, except that they don’t take up water.

June 2015 This template is available at: http://www.ecmwf.int/en/computing/access-computing-facilities/forms
Table 2 contains the density of each aerosol type and the assumptions regarding the effective radii to account for hygroscopic growth at increased relative humidity, required for the computation of the aerosol SAD. Hygroscopic growth with ambient moisture for different hydrophilic aerosol types is parameterized with the relative humidity (RH) prescribed by the ECMWF meteorological data following Chin et al. (2002). Heterogeneous reactions on cloud and aerosol for N2O5 , HO2, and NO3 are assumed to take place. We note that an empirical scaling factor is adopted to account for the spatial inhomogeneity of clouds present in grid boxes (Huijnen et al., 2015, in preparation). As a result the efficiency of the corresponding heterogeneous reactions are moderated depending on the cloud fraction. Further details of the implementation are given in Huijnen et al. (2014).
The effect of the coupling of MACC aerosol for use of heterogeneous chemistry rates is illustrated in Fig. 2 for the 2010 Russian fire situation. As can be seen from this figure, the heterogeneous chemistry has a significant impact on surface O3 during situations with moderate to large amount of aerosol, mainly due to a reduction of the HO2 radical. For this case, O3 is reduced by up to 13 ppbv (20%), and a larger area is affected than was the case for the photolysis impact. This reduction limits the O3 production in ozone-production regimes (in presence of significant NOx), and it reduces the O3 loss in remote, low NOx conditions. On a global average, the newly implemented heterogeneous reaction rates result in a larger conversion of N2O5 on aerosol surfaces as compared to the un-coupled version of C-IFS-CB05, which contained a rather incomplete description for aerosol, Table 3. Therefore, even though the contribution of heterogeneous reactions on clouds has been decreased due to the sub-grid scale effects, there is a net increase in N2O5 reaction budget, and a corresponding decrease in N2O5 burden by ~10%. The newly introduced reactions of HO2 on cloud and aerosol result in an increase in the tropospheric CO and O3 lifetimes by ~3% (Huijnen et al., 2014).
Figure 2. Illustration of the effect of heterogeneous chemistry on aerosol surfaces during the August 2010 Russian fires. Left: aerosol surface area density (SAD) on 8 August 2010. Middle: corresponding change in HO2 concentrations at the surface, right: daily mean change in surface O3.
Table 3. N2O5 conversion on cloud aerosol and cloud, as well as N2O5 tropospheric burden, in two C-IFS runs. One is based on the original parameterization (Flemming et al., 2015) and one based on the revised version (Huijnen et al., 2014)
Surface type AER
[Tg N/yr]
CLD
[Tg N/yr]
Trop burden
[Tg N]
Original parameterization 0.5 3.1 3.7
revised parameterization 4.0 1.3 3.3

June 2015 This template is available at: http://www.ecmwf.int/en/computing/access-computing-facilities/forms
(ii) Implementation of KPP for C-IFS-CB05 A first version of a Rosenbrock solver based on the Kinetic Pre-Processor (KPP, Sandu and Sander, 2006) has been implemented in C-IFS-CB05. By adopting this software, it is much easier to handle (upgrades to) the chemical mechanism, making use of automatic code generation for the solver. Also it opens up the ability to construct an adjoint of the chemical solver, necessary for a 4D-VAR data assimilation system that contains the adjoint of a chemical mechanism. A simple switch has been implemented to choose between the classical Euler Backward Integration (EBI) solver or the KPP solver. Despite its clear benefits regarding code management, the computational costs of the use of the solver have increased drastically, as indicated by an overall increase of the high performance system billing units (SBU) of a C-IFS run by ~50%. In a test run for the year 2008 it was found that the use of the KPP solver generally led to very similar concentration fields as compared to the EBI solver, for most trace gases. Also the evaluation against O3 sondes did not show remarkable differences, Fig 3.
Figure 3. Evaluation of C-IFS-CB05 tropospheric O3 using EBI solver (red) or KPP solver (green) during summer 2008 against O3 sondes from the WOUDC database.
(iii) Implementation of the BASCOE scheme The Belgian Assimilation System for Chemical ObsErvations (BASCOE) was developed by BIRA-IASB (Errera et al., 2008). This system is based on the 4D-VAR method and a Chemistry Transport Model (CTM) of the stratosphere . The CTM includes and advection scheme, a chemical scheme based on KPP and a parameterization that account for the chemical effect of Polar Stratospheric Clouds (PSC). The BASCOE chemical scheme and PSC parameterization has been implemented in the C-IFS considering a stratospheric mode (C-IFS-BASCOE) or a tropospheric-stratospheric mode (C-IFS-CB05-BASCOE). Also a tracer to account for stratospheric aerosol is available, which is nudged to a climatological value. The total number of tracers in C-IFS-BASCOE and C-IFS-CB05-BASCOE are 60 and 99, respectively.
The BASCOE chemical scheme contains 142 gas-phase, 9 heterogeneous and 52 photolytic reactions, and is referred to as version ‘sb14a’. Gas-phase and heterogeneous reaction rates are taken from JPL evaluation 17 (JPL 2011) and JPL evaluation 13 (JPL 2000), respectively. Photolysis rates are computed based on a lookup table approach depending on altitude, ozone overhead column and solar zenith angle. The precalculation of the lookup table is done using absorption cross section taken from JPL evaluation 15 (JPL 2006). An update of the reaction rates and cross sections to the latest JPL evaluation could be a task of the follow-up of this project. Surface boundary conditions, rather than emissions, for N2O and a selection of halogen, bromine and chlorine containing trace gases are provided as global annual mean input.

June 2015 This template is available at: http://www.ecmwf.int/en/computing/access-computing-facilities/forms
The PSC parameterization sets the surface area density of PSCs and calculates the loss of HNO3 and H2O by PSC sedimentation as a function of temperature. Ice PSCs are presumed to exist in the winter/spring Polar Regions at any grid point where the temperature is colder than 186 K, and Nitric Acid Tri-hydrate (NAT) PSCs at any grid point where the temperature is colder than 194 K. The surface area density is set to 10−6 cm2/cm3 for ice PSCs and 10−7 cm2/cm3 for NAT PSCs. The sedimentation of PSC particles causes denitrification and dehydration. This process is also approximated in a very simple way, by an exponential decay of HNO3 with a characteristic time-scale of 100 days for gridpoints where NAT particles are supposed to exist, and an exponential decay of HNO3 and H2O with a characteristic time-scale of 9 days for gridpoints where ice particles are supposed to exist.
As compared to the C-IFS-CB05 experiments, the cost of running an experiment including stratospheric chemistry (the C-IFS-CB05-BASCOE system) increases by a ~250% as compared to ‘classical’ C-IFS-CB05 run using EBI chemistry, see Table 4. This can be explained by the additional costs of the use of the KPP solver, the shorter time step, and the extension of the chemistry scheme. The smaller time steps appear necessary when running with stratospheric chemistry to keep the solver stable. The additional burden for transport due to the increase in the number of tracers is only marginally increasing the computational time, as consequence of the very efficient Lagrangian advection scheme for many species in the IFS.
Table 4. Computational expenses in terms of system billing units (SBU) for various C-IFS model versions
C-IFS-CB05 (EBI)
C-IFS-CB05 (KPP)
C-IFS-BASCOE
C-IFS-BASCOE-CB05
No tracers 55 55 59 99
Time step 1h 1h 0.5h 0.5h
SBU 800 1250 2000 2800
Interface between tropospheric and stratospheric solver For runs with merged CB05 tropospheric chemistry and BASCOE stratospheric chemistry, specifically the photolysis rates need to be merged between the tropospheric parameterization (which explicitly accounts for clouds, aerosol, surface albedo, O2 and O3 overhead column, pressure, but does not include a proper parameterization for short wavelengths and solar zenith angles (SZA) larger than 85°) and the stratospheric parameterization (which accounts for short wavelengths, solar zenith angles larger than 85°, O3 and O2 overhead columns and an extended list of trace gases, but does not account for clouds, aerosol and variable surface albedo). Currently we merge and interpolate photolysis rates at four levels around the interface level between both solutions. This interpolation is only done for SZA<85° for photolysis rates that are present in both schemes. An example is given in Fig. 4. It illustrates that the photolysis rates follow the TM5 implementation in the troposphere, and BASCOE in the stratosphere. At the interface for JO3 on average a small increase of the merged photolysis rate is seen towards lower levels, due to the switch to the TM5 scheme.

June 2015 This template is available at: http://www.ecmwf.int/en/computing/access-computing-facilities/forms
Figure 4. Illustration of the merging procedure for photolysis rates between the tropospheric and stratospheric parameterizations for the reaction O3 -> O1D (left) and NO2 -> NO+O (right) as zonally averaged over the tropics. Red: BASCOE parameterization, green: TM5 parameterization, orange: merged parameterization. (Note that BASCOE rates are not computed at altitude levels below the interface, which explains the jump to zero in the figure).
Also an interface is in place to choose between the tropospheric solver or the stratospheric solver, typically around the tropopause. Note that this is not necessarily at the same level as the interface for the photolysis rates, and the actual definition of the level is still under investigation. A version where the tropopause is defined on the chemical tracer composition, by defining tropospheric grid cells as particles with O3<200ppb and CO>40ppb works well, but another choice could still be to use a humidity-based pressure level.
Using the humidity based criterion the tropopause level is higher in altitude (lower pressure level) in the sub-tropics, Fig. 5, but at lower altitude in the tropics. The BASCOE routine shows even larger spread between the tropics and sub-tropics (higher altitude in tropics, lower in sub-tropics). The LCHEM_TROPO switch is used in the IFS code to select the method for defining the interface for the chemistry.
Figure 5. Tropopause pressure for various criteria. Left: BASCOE (dT/dz>-2), Middle: q>5ppm, right: O3/CO criterion.

June 2015 This template is available at: http://www.ecmwf.int/en/computing/access-computing-facilities/forms
Evaluation of C-IFS-BASCOE and C-IFS-CB05-BASCOE A technically working version of C-IFS-CB05-BASCOE has been accomplished. The performance of C-IFS-BASCOE and C-IFS-CB05-BASCOE has been compared against the stand-alone BASCOE CTM, observations and the C-IFS-CB05 run. For this a run starting on 1 April 2008 and running through the whole year 2008 was executed on T159 (i.e. approx. 0.9° lon / lat), using the implementation in branch nk9_CY40R2_BASCOE_TM5_V2. An example of the success of the implementation of BASCOE chemistry is illustrated in Fig. 6, which shows the evolution of stratospheric O3 against observations at the Syowa (Antarctica) station. It clearly shows the ability of the C-IFS versions that have stratospheric chemistry to capture the O3 hole, indicating that chemistry (including heterogeneous reactions) are well implemented. From the figure it can be seen that both implementations show very similar stratospheric O3, while the C-IFS-BASCOE version, lacking tropospheric chemistry as well as a (simple) loss term for O3 at the surface, shows a build-up of ozone in the troposphere. Also the evaluation in the troposphere shows reasonable results (see Fig. 7) although the model appears to show a slight negative bias compared to C-IFS-CB05 and observations, specifically in the tropics and aver the SH. Despite these promising results, the model still features significant, unwanted trends in long-lived trace gases, as well as, e.g., stratospheric HNO3. An illustration is given in Fig. 8, showing larger gradients in the N2O profile over the SH, a significant decline in stratospheric HNO3, a corresponding decrease in NO2 and increase in O3. These features need to be looked at in more detail.
Figure 6. Evaluation of stratospheric ozone against WOUDC ozone sondes at Syowa station during September-November 2008.Black: WOUDC, Red: C-IFS-BASCOE, green: C-IFS-BASCOE-CB05.
Figure 7. Evaluation of tropospheric ozone against WOUDC ozone sondes at Syowa station during July-August 2008 at Hohenpeissenberg station (left) and Paramaribo station (right). Black: WOUDC, Red: C-IFS-CB05, green: C-IFS-BASCOE-CB05.

June 2015 This template is available at: http://www.ecmwf.int/en/computing/access-computing-facilities/forms
Fig. 8. Evaluation of C-IFS-CB05-BASCOE (red line) zonally averaged trace gas profiles for 1 December 2008, over the extra-tropical SH, as compared to a BASCOE offline run (black line).
Summary While a well-documented version of C-IFS-CB05 is now running operationally in preparation of CAMS, work has been ongoing to prepare for further upgrades. The coupling to the MACC aerosol model is foreseen to become part of the new release of C-IFS, while other developments, such as the KPP implementation for the tropospheric solver, need to be assessed further in terms of code optimization. A first evaluation of C-IFS-CB05 with extension of BASCOE to describe stratospheric chemistry indicates good performance of the system for shorter runs (a few months up to one year), of equal skill as BASCOE stand-alone. In cases even better performance for C-IFS was seen, specifically for O3 in the tropical UTLS region. Nevertheless, we find that runs exceeding one year we still observe spurious trends in stratospheric tracer fields with long lifetime (CFC’s, N2O, …) As a result of those trends, also tracer fields directly influencing stratospheric ozone are affected. When this is solved, an extended evaluation of the stratospheric composition beyond stratospheric O3 is foreseen to fully characterize the regions and periods where the model is performing well, and where improvements are still needed.
References Chin, M., Ginoux, P., Kinne, S., Torres, O., Holben, B.N., Duncan, B.N., Martin, R.V., Logan, J.A.,
Higurashi, A., Nakajima, T.: Tropospheric aerosol optical thickness from the GOCART model and comparisons with satellite and sun photometer measurements. J. Atmos. Sci., 59, 461–483, 2002.
Errera, Q., Daerden, F., Chabrillat, S., Lambert, J. C., Lahoz, W. A. , Viscardy, S. , Bonjean, S. and Fonteyn, D.: 4D-Var assimilation of MIPAS chemical observations: ozone and nitrogen dioxide analyses, Atmos. Chem. Phys., 8, 6169-6187, 2008
Flemming, J., Huijnen, V., Arteta, J., Bechtold, P., Beljaars, A., Blechschmidt, A.-M., Diamantakis, M., Engelen, R. J., Gaudel, A., Inness, A., Jones, L., Josse, B., Katragkou, E., Marecal, V., Peuch, V.-H., Richter, A., Schultz, M. G., Stein, O., and Tsikerdekis, A.: Tropospheric chemistry in the Integrated Forecasting System of ECMWF, Geosci. Model Dev., 8, 975-1003, doi:10.5194/gmd-8-975-2015, 2015.
Huijnen, V., Williams, J. E., and Flemming, J.: Modeling global impacts of heterogeneous loss of HO2 on cloud droplets, ice particles and aerosols, Atmos. Chem. Phys. Discuss., 14, 8575-8632, doi:10.5194/acpd-14-8575-2014, 2014.
Inness, A., Blechschmidt, A.-M., Bouarar, I., Chabrillat, S., Crepulja, M., Engelen, R. J., Eskes, H., Flemming, J., Gaudel, A., Hendrick, F., Huijnen, V., Jones, L., Kapsomenakis, J., Katragkou, E., Keppens, A., Langerock, B., de Mazière, M., Melas, D., Parrington, M., Peuch, V. H., Razinger, M., Richter, A., Schultz, M. G., Suttie, M., Thouret, V., Vrekoussis, M., Wagner, A., and Zerefos, C.: Data assimilation of satellite-retrieved ozone, carbon monoxide and nitrogen dioxide with ECMWF's Composition-IFS, Atmos. Chem. Phys., 15, 5275-5303, doi:10.5194/acp-15-5275-2015, 2015.
JPL 2000, Chemical Kinetics and Photochemical Data for Use in Atmospheric Studies, Evaluation Number 13: supplement to evaluation 12 and update of key reactions, Tech. rep., Jet Propulsion Laboratory, California Institute of Technology, Pasadena, California, 2000.

June 2015 This template is available at: http://www.ecmwf.int/en/computing/access-computing-facilities/forms
JPL 2006, Chemical Kinetics and Photochemical Data for Use in Atmospheric Studies, Evaluation Number 15, Tech. rep., Jet Propulsion Laboratory, California Institute of Technology, Pasadena, California, 2006.
JPL 2011, Chemical Kinetics and Photochemical Data for Use in Atmospheric Studies, Evaluation Number 17: update of key reactions, Tech. rep., Jet Propulsion Laboratory, California Institute of Technology, Pasadena, California, 2010.
Sandu, A. and Sander, R.: Technical note: Simulating chemical systems in Fortran90 and Matlab with the Kinetic PreProcessor KPP-2.1, Atmos. Chem. Phys., 6, 187-195, doi:10.5194/acp-6-187-2006, 2006.
Schwartz, S.E., Mass-transport considerations pertinent to aqueous-phase reactions of gases in liquid-water clouds. In: Jaechske, W. (Ed.), Chemistry of Multiphase Atmospheric Systems. Springer, Heidelberg, pp. 415-471, 1986.
Williams, J. E., Strunk, A., Huijnen, V., and van Weele, M.: The application of the Modified Band Approach for the calculation of on-line photodissociation rate constants in TM5: implications for oxidative capacity, Geosci. Model Dev., 5, 15-35, doi:10.5194/gmd-5-15-2012, 2012.
List of publications/reports from the project with complete references Arnold, S. R., Emmons, L. K., Monks, S. A., Law, K. S., Ridley, D. A., Turquety, S., Tilmes, S.,
Thomas, J. L., Bouarar, I., Flemming, J., Huijnen, V., Mao, J., Duncan, B. N., Steenrod, S., Yoshida, Y., Langner, J., and Long, Y.: Biomass burning influence on high-latitude tropospheric ozone and reactive nitrogen in summer 2008: a multi-model analysis based on POLMIP simulations, Atmos. Chem. Phys., 15, 6047-6068, doi:10.5194/acp-15-6047-2015, 2015.
Emmons, L. K., Arnold, S. R., Monks, S. A., Huijnen, V., Tilmes, S., Law, K. S., Thomas, J. L.,
Raut, J.-C., Bouarar, I., Turquety, S., Long, Y., Duncan, B., Steenrod, S., Strode, S., Flemming, J., Mao, J., Langner, J., Thompson, A. M., Tarasick, D., Apel, E. C., Blake, D. R., Cohen, R. C., Dibb, J., Diskin, G. S., Fried, A., Hall, S. R., Huey, L. G., Weinheimer, A. J., Wisthaler, A., Mikoviny, T., Nowak, J., Peischl, J., Roberts, J. M., Ryerson, T., Warneke, C., and Helmig, D.: The POLARCAT Model Intercomparison Project (POLMIP): overview and evaluation with observations, Atmos. Chem. Phys. Discuss., 14, 29331-29393, doi:10.5194/acpd-14-29331-2014, 2014.
Eskes, H., Huijnen, V., Arola, A., Benedictow, A., Blechschmidt, A.-M., Botek, E., Boucher, O.,
Bouarar, I., Chabrillat, S., Cuevas, E., Engelen, R., Flentje, H., Gaudel, A., Griesfeller, J., Jones, L., Kapsomenakis, J., Katragkou, E., Kinne, S., Langerock, B., Razinger, M., Richter, A., Schultz, M., Schulz, M., Sudarchikova, N., Thouret, V., Vrekoussis, M., Wagner, A., and Zerefos, C.: Validation of reactive gases and aerosols in the MACC global analysis and forecast system, Geosci. Model Dev. Discuss., 8, 1117-1169, doi:10.5194/gmdd-8-1117-2015, 2015.
Flemming, J., Huijnen, V., Arteta, J., Bechtold, P., Beljaars, A., Blechschmidt, A.-M., Diamantakis,
M., Engelen, R. J., Gaudel, A., Inness, A., Jones, L., Josse, B., Katragkou, E., Marecal, V., Peuch, V.-H., Richter, A., Schultz, M. G., Stein, O., and Tsikerdekis, A.: Tropospheric chemistry in the Integrated Forecasting System of ECMWF, Geosci. Model Dev., 8, 975-1003, doi:10.5194/gmd-8-975-2015, 2015.

June 2015 This template is available at: http://www.ecmwf.int/en/computing/access-computing-facilities/forms
Huijnen, V., Williams, J. E., and Flemming, J.: Modeling global impacts of heterogeneous loss of HO2 on cloud droplets, ice particles and aerosols, Atmos. Chem. Phys. Discuss., 14, 8575-8632, doi:10.5194/acpd-14-8575-2014, 2014.
Inness, A., Blechschmidt, A.-M., Bouarar, I., Chabrillat, S., Crepulja, M., Engelen, R. J., Eskes, H.,
Flemming, J., Gaudel, A., Hendrick, F., Huijnen, V., Jones, L., Kapsomenakis, J., Katragkou, E., Keppens, A., Langerock, B., de Mazière, M., Melas, D., Parrington, M., Peuch, V. H., Razinger, M., Richter, A., Schultz, M. G., Suttie, M., Thouret, V., Vrekoussis, M., Wagner, A., and Zerefos, C.: Data assimilation of satellite-retrieved ozone, carbon monoxide and nitrogen dioxide with ECMWF's Composition-IFS, Atmos. Chem. Phys., 15, 5275-5303, doi:10.5194/acp-15-5275-2015, 2015.
Inness, A., Benedetti, A., Flemming, J., Huijnen, V., Kaiser, J. W., Parrington, M., and Remy, S.:
The ENSO signal in atmospheric composition fields: emission driven vs. dynamically induced changes, Atmos. Chem. Phys. Discuss., 15, 13705-13745, doi:10.5194/acpd-15-13705-2015, 2015.
Monks, S. A., Arnold, S. R., Emmons, L. K., Law, K. S., Turquety, S., Duncan, B. N., Flemming,
J., Huijnen, V., Tilmes, S., Langner, J., Mao, J., Long, Y., Thomas, J. L., Steenrod, S. D., Raut, J. C., Wilson, C., Chipperfield, M. P., Diskin, G. S., Weinheimer, A., Schlager, H., and Ancellet, G.: Multi-model study of chemical and physical controls on transport of anthropogenic and biomass burning pollution to the Arctic, Atmos. Chem. Phys., 15, 3575-3603, doi:10.5194/acp-15-3575-2015, 2015.
Stein, O., Schultz, M. G., Bouarar, I., Clark, H., Huijnen, V., Gaudel, A., George, M., and Clerbaux,
C.: On the wintertime low bias of Northern Hemisphere carbon monoxide found in global model simulations, Atmos. Chem. Phys., 14, 9295-9316, doi:10.5194/acp-14-9295-2014, 2014.
Future plans (Please let us know of any imminent plans regarding a continuation of this research activity, in particular if they are linked to another/new Special Project.) A continuation special project (spnlmacc) is ongoing to support futher developments. These include:
- Extension of CIFS-CB05 into the stratosphere based on BASCOE - Use of KPP software for automatic chemistry solver generation - Establishing the coupling to GLOMAP aerosol model