projections of the diversity of the canadian · pdf filereport prepared by éric caron...
TRANSCRIPT

Catalogue no. 91-551-X
Projections of the Diversity of the Canadian Population
2006 to 2031

How to obtain more information
For information about this product or the wide range of services and data available from Statistics Canada, visit our website at www.statcan.gc.ca, e-mail us at [email protected], or telephone us, Monday to Friday from 8:30 a.m. to 4:30 p.m., at the following numbers:
Statistics Canada’s National Contact CentreToll-free telephone (Canada and United States): Inquiries line 1-800-263-1136 National telecommunications device for the hearing impaired 1-800-363-7629 Fax line 1-877-287-4369
Local or international calls: Inquiries line 1-613-951-8116 Fax line 1-613-951-0581
Depository Services Program Inquiries line 1-800-635-7943 Fax line 1-800-565-7757
To access this product
This product, Catalogue no. 91-551-X, is available free in electronic format. To obtain a single issue, visit our website at www.statcan.gc.ca and select “Publications.”
Standards of service to the public
Statistics Canada is committed to serving its clients in a prompt, reliable and courteous manner. To this end, Statistics Canada has developed standards of service that its employees observe. To obtain a copy of these service standards, please contact Statistics Canada toll-free at 1-800-263-1136. The service standards are also published on www.statcan.gc.ca under “About us” > “Providing services to Canadians.”

Statistics Canada
Demography Division
Projections of the Diversity of the Canadian Population
2006 to 2031
Note of appreciation
Canada owes the success of its statistical system to a long-standing partnership between Statistics Canada, the citizens of Canada, its businesses, governments and other institutions. Accurate and timely statistical information could not be produced without their continued cooperation and goodwill.
Published by authority of the Minister responsible for Statistics Canada
© Minister of Industry, 2010
All rights reserved. The content of this electronic publication may be reproduced, in whole or in part, and by any means, without further permission from Statistics Canada, subject to the following conditions: that it be done solely for the purposes of private study, research, criticism, review or newspaper summary, and/or for non-commercial purposes; and that Statistics Canada be fully acknowledged as follows: Source (or “Adapted from”, if appropriate): Statistics Canada, year of publication, name of product, catalogue number, volume and issue numbers, reference period and page(s). Otherwise, no part of this publication may be reproduced, stored in a retrieval system or transmitted in any form, by any means—electronic, mechanical or photocopy—or for any purposes without prior written permission of Licensing Services, Client Services Division, Statistics Canada, Ottawa, Ontario, Canada K1A 0T6.
March 2010
Catalogue no. 91-551-X
ISSN 1920-9134
Frequency: Irregular
Ottawa
Cette publication est également disponible en français.
by the Demosim team
Report prepared by Éric Caron Malenfant, André Lebel and Laurent Martel

- i -Statistics Canada—Catalogue number 91-551-X
Projections of the Diversity of the Canadian Population, 2006 to 2031
Symbols
The following standard symbols are used in Statistics Canada publications:
. not available for any reference period
.. not available for a specific reference period
… not applicable
0 true zero or a value rounded to zero
0s value rounded to 0 (zero) where there is a meaningful distinction between true zero and the value that was roundedp preliminaryr revised
x suppressed to meet the confidentiality requirements of the Statistics ActE use with caution
F too unreliable to be published
- ii -Statistics Canada—Catalogue number 91-551-X
Projections of the Diversity of the Canadian Population, 2006 to 2031
Already published:
Report on the Demographic Situation in Canada (Statistics Canada Catalogue no. 91-209-X)
2005 and 2006 Edition-Portrait of the mobility of Canadians in 2006: Trajectories and characteristics of migrants.
2003 and 2004 Edition-The fertility of visible minority women in Canada;-Recent immigration to Canada from the Balkans.
2002 Edition-The Fertility of Immigrant Women and Their Canadian-born Daughters;-Healthy Aging: the Determinants of Aging Without Loss of Independence Among Older Canadians.
2001 Edition-A Comparative Study of Recent Trends in Canadian and American Fertility, 1980-1999;-Changing Demographic Trends and the Use of Home Care Services.
2000 Edition-Smoking and Disability-free Life Expectancy in Canada;-Impacts of Causes of Death on Life Expectancy at Higher Ages;-Family Changes and the Economic Well-Being of Preschool-age Children;-The Emergence of the Blended Family.
1998-1999 Edition-Relative Income, Opportunity Cost and Fertility Changes;-Dependence-free and Health-adjusted Life Expectancy;-Ethnic Mobility and Demographic Growth of Aboriginal Populations.
1997 Edition-Effects of the Social Environment of Elderly Persons on their Socio-Economic Condition.
1996 Edition-Common-law Unions in Canada at the End of the 20th Century.
1995 Edition-Demographic Similarities and Differences Between Ontario and Quebec.
1994 Edition-The Sandwich Generation: Myths and Reality.
1993 Edition-Mexico’s Demographic Challenges (An Overview).
1992 Edition-Age Structure in Mutation: Two Centuries of Demographic Change.
1991 Edition-Overview of the Principal World Migratory Flows Since World War II.
1990 Edition-Recent Evolution of the Canadian and American Populations.
1988 Edition-The Termination of Pregnancy in a Population Perspective;-Long-term Consequences of Adolescent Marriage and Fertility.
- iii -Statistics Canada—Catalogue number 91-551-X
Projections of the Diversity of the Canadian Population, 2006 to 2031
Report on the Demographic Situation in Canada (Statistics Canada Catalogue no. 91-209-X)
1986 Edition-Childbearing Performance of Married Canadian-born Women;-The Fertility of Single Women;-The Strengthening of Majority Positions.
1983 Edition
OccasionalBeaujot, R., K.G. Basavarajappa and R.B.P. Verma. 1988. Income of Immigrants, Statistics Canada Catalogue no. 91-527E.
Beaujot, R., E.M. Gee, F. Rajulton and Z.R. Ravanera. 1995. Family over the Life Course, Statistics Canada Catalogue no. 91-543E.
Desjardins, B. 1993. Aging of the Population and Seniors in Canada, Statistics Canada Catalogue no. 91-533E.Dumas, J. and Y. Péron. 1992. Marriage and Conjugal Life in Canada, Statistics Canada Catalogue no. 91-534E.
Ram, B. 1990. New Trends in the Family, Statistics Canada Catalogue no. 91-535E.
Richmond, A.H. 1988. Caribbean Immigrants, Statistics Canada Catalogue no. 91-536E.Romaniuc, A. 1984. Fertility in Canada: from Baby-boom to Baby-bust, Statistics Canada Catalogue no. 91-524E.
Canadian Demographics at a Glance (Statistics Canada Catalogue no. 91-003-X)
1st edition, January 25 2008.
Demographic Documents (Statistics Canada Catalogue no. 910015MPE)
Number 1. Verma, R.B.P., S. Loh, S.Y. Dai and D. Ford. 1996. Fertility Projections for Canada, Provinces and Territories, 1993-2016.
Number 2. Smith, G. 1996. The Population in Collective Dwellings: Canada, 1971-1991.Number 3. Bourbeau, R., J. Légaré and V. Emond. 1997. New Birth Cohort Life Tables for Canada and Quebec, 1801-1991.Number 4. Bédard, M. and M. Michalowski. 1997. Advantages of the One Year Mobility Variable for Breaking Down Interprovincial
Migration by Age, Sex and Marital Status.Number 5. Kerr, D. 1998. A Review of Procedures for Estimating the Net Undercount of Censuses in Canada, the United States, Britain
and Australia.Number 6. Wilkinson, P. 2004. Estimates of Internal Migration Based on New and Old Methods for Combined Annual Periods 1996-
1997 to 2000-2001.Number 7. He, J. and M. Michalowski. 2005. Research on Modifications to the Method of Preliminary Estimates of Interprovincial
Migration.Number 8. Caron Malenfant, E., A. Milan, M. Charron and A. Bélanger. 2007. Demographic Changes in Canada from 1971 to 2001
Across an Urban-to-Rural Gradient.Number 9. Carrière, Y., J. Keefe, J. Légaré, X. Lin, G. Rowe, L. Martel and S. Rajbhandary. 2008. Projecting the Future Availability
of the Informal Support Network of the Elderly Population and Assessing Its Impact on Home Care Services.Number 10. Handelman, R. 2009. Feasibility Study on the Use of Provincial/Territorial Medicare Records for Measuring the Level of
Inter-provincial and Inter-territorial Migration.

- iv -Statistics Canada—Catalogue number 91-551-X
Projections of the Diversity of the Canadian Population, 2006 to 2031
In memory of our colleague René Gélinas, 1960-2007
- v -Statistics Canada—Catalogue number 91-551-X
Projections of the Diversity of the Canadian Population, 2006 to 2031
Acknowledgements
This project was funded by the Department of Canadian Heritage, Human Resources and Skills DevelopmentCanada and Citizenship and Immigration Canada. These policy departments were responsible for the policy relatedassumptions of the projections.
It is important to recognize the contribution of the members of the two committees that were created as part ofthis project: the scientific committee, chaired by Michael Wolfson (Statistics Canada) and composed of Roderic Beaujot(University of Western Ontario), Kevin McQuillan (University of Calgary), Norbert Robitaille (Université de Montréal)and Frank Trovato (University of Alberta) and the project steering committee, whose members are Jean Bergeron,Kamal Dib and Fernando Mata (Citizenship and Immigration Canada), Michel Fourzly and Andaleeb Qayyum (HumanResources and Skills Development Canada) and Lorna Jantzen (Canadian Heritage).
This project was carried out by the Demosim team under the direction of Éric Caron Malenfant (DemographyDivision). The Demosim team is composed of Éric Caron Malenfant, Patrice Dion, André Lebel and Laurent Martel(Demography Division), Iván Carrillo-García, Dominic Grenier, Chantal Grondin and Robert-Charles Titus (SocialSurvey Methods Division), Claude Charette and Martin Spielauer (Modelling Division). The project also benefitedfrom the contribution of external collaborators, especially Alain Bélanger (professor, Institut national de la recherchescientifique) and Éric Guimond (Department of Indian and Northern Affairs).
A number of other persons also participated in this project, whether by providing advice and suggestions, helpingto estimate parameters and prepare data, programming and validating, preparing for dissemination or reviewing thisreport: Nicolas Bastien, Rosemary Bender, Jonathan Chagnon, Tina Chui, Colleen Clark, Rosalinda Costa, Carol D’Aoust,Johanne Denis, Peter Dick, Karla Fox, Harry François, René Gélinas, Marie-France Germain, Steve Gribble, ChantalHicks, Milorad Kovacevic, Réjean Lachapelle, Christiane Laperrière, Laetitia Martin, Anne Milan, Jean-DominiqueMorency, Jean-François Naud, Covadonga Robles, Geoff Rowe and Russell Wilkins.

- vi -Statistics Canada—Catalogue number 91-551-X
Projections of the Diversity of the Canadian Population, 2006 to 2031
Table of contents
Highlights ......................................................................................................................................................................... 1Introduction ...................................................................................................................................................................... 3
1 Methodology ................................................................................................................................................................. 41.1 Objective and content of the Demosim microsimulation projection model ..................................................... 41.2 General functioning of the model ....................................................................................................................... 51.3 Probabilities associated with simulated events ............................................................................................... 5
2. Assumptions and scenarios ...................................................................................................................................... 92.1 Assumptions ...................................................................................................................................................... 9
Fertility ........................................................................................................................................................... 9Mortality .......................................................................................................................................................... 10Immigration ................................................................................................................................................... 11Emigration ..................................................................................................................................................... 11Internal migration .......................................................................................................................................... 12Education ...................................................................................................................................................... 12Religious mobility ......................................................................................................................................... 12
2.2 Scenarios ........................................................................................................................................................... 13
3 Cautionary notes ......................................................................................................................................................... 14
4 Analysis of results ....................................................................................................................................................... 154.1 Ethnocultural diversity from one generation to the next ..................................................................................... 15
4.1.1 Very soon, the proportion of foreign-born within the Canadian population could reach a recordhigh ..................................................................................................................................................... 15
4.1.2 An increasingly diversified foreign-born population in ethnocultural terms ....................................... 164.1.3 In 2031, only one Canadian in two aged 15 years and over might belong to a family settled in
Canada for at least three generations ............................................................................................... 184.1.4 Ethnocultural diversity up sharply within the Canadian-born population ........................................... 20
4.2 Ethnocultural diversity of the Canadian population as a whole ........................................................................ 234.2.1 In 2031, about three Canadians in ten could belong to a visible minority group .............................. 234.2.2 The population having a non-Christian religious denomination could double by 2031 ................... 254.2.3 Three Canadians in ten in 2031 could have a mother tongue other than English or French .............. 26
4.3 Ethnocultural diversity within census metropolitan areas (CMAs) .................................................................... 264.3.1 The vast majority of persons belonging to a visible minority group would continue to live in one
of the 33 CMAs between now and 2031 ............................................................................................ 274.3.2 Approximately three persons in five could belong to a visible minority group in the Toronto and
Vancouver CMAs in 2031 .................................................................................................................... 284.3.3 More than two persons in five belonging to a visible minority group in 2031 could live in the
Toronto CMA ....................................................................................................................................... 304.3.4 More than one visible minority person in three living in the Toronto CMA in 2031 could belong to
the South Asian group ........................................................................................................................ 314.3.5 More than one person in five in the Vancouver CMA could belong to the Chinese visible minority
group in 2031 ..................................................................................................................................... 324.3.6 About one-third of the Vancouver CMA could report having no religion in 2031 ................................. 324.3.7 The population belonging to visible minority groups could more than double by 2031 in the
Montréal CMA...................................................................................................................................... 324.3.8 Approximately 16% of the population of the Montréal CMA could have a non-Christian religion
in 2031 ................................................................................................................................................ 33

- vii -Statistics Canada—Catalogue number 91-551-X
Projections of the Diversity of the Canadian Population, 2006 to 2031
Conclusion ....................................................................................................................................................................... 34Endnotes .......................................................................................................................................................................... 35Bibliography ..................................................................................................................................................................... 38Appendix .......................................................................................................................................................................... 40Glossary ........................................................................................................................................................................... 65
Figures1. Proportion of foreign-born population by projection scenario, Canada, 1871 to 2031................................................. 162. Distribution of the foreign-born population by continent of birth, Canada, 1981 to 2031 (reference scenario) 173. Proportion of the foreign-born population belonging to a visible minority group, allophone or having a non-
Christian religious denomination, Canada, 2006 and 2031 (reference scenario) ................................................... 184. Distribution of the population aged 15 years and over by generation status, Canada, 1971, 2006 and 2031
(reference scenario) ................................................................................................................................................... 195. Age pyramid (in number) by generation status, Canada, 2006.......................................................................................... 206. Age pyramid (in number) by generation status, Canada, 2031 (reference scenario).................................................... 217. Proportion of the population born in Canada belonging to a visible minority group, to an allophone group or having
a non-Christian religious denomination by projection scenario, Canada, 2006 and 2031...................................... 218. Proportion of the population belonging to a visible minority group by generation status, Canada, 2006 and 2031
(reference scenario) ................................................................................................................................................... 229. Proportion of the population belonging to a visible minority group by age group, Canada, 2006 and 2031 (reference
scenario) ..................................................................................................................................................................... 2410. Distribution of the population by generation status and place of residence (Census Metropolitan Areas or outside
Census Metropolitan Areas), Canada, 2006 and 2031 (reference scenario) ........................................................... 2711. Distribution of the population belonging to a visible minority group, to an allophone group or having a
non-Christian religious denomination by place of residence (Census Metropolitan Areas or outside CensusMetropolitan Areas), Canada, 2006 and 2031 (reference scenario) ......................................................................... 28
12. Proportion of foreign-born population by Census Metropolitan Area, Canada, 2006 and 2031 (reference scenario) 2913. Proportion of the population belonging to a visible minority group by Census Metropolitan Area, Canada, 2006
and 2031 (reference scenario) ................................................................................................................................... 30
Tables1. Key methods, data sources and variables used for parameters estimates in Demosim........................................... 62. Key assumptions for projections of the diversity of the Canadian population, 2006 to 2031...................................... 103. Composition of selected scenarios for projections of the diversity of the Canadian population, 2006 to 2031..... 134. Population by visible minority group and projection scenario, Canada, 2006 and 2031.............................................. 235. Population by religious denomination and projection scenario, Canada, 2006 and 2031.......................................... 256. Population by mother tongue and projection scenario, Canada, 2006 and 2031.......................................................... 267. Population of the Toronto Census Metropolitan Area by visible minority group, 2006 and 2031 (reference scenario) 318. Population of the Toronto Census Metropolitan Area by religious denomination, 2006 and 2031 (reference
scenario) ..................................................................................................................................................................... 319. Population for Vancouver Census Metropolitan Area by visible minority group, 2006 and 2031 (reference scenario) 3210. Population of the Vancouver Census Metropolitan Area by religious denomination, 2006 and 2031
(reference scenario) ................................................................................................................................................... 3211. Population of the Montreal Census Metropolitan Area by visible minority group, 2006 and 2031 (reference
scenario) .................................................................................................................................................................... 33
Table of contents

- viii -Statistics Canada—Catalogue number 91-551-X
Projections of the Diversity of the Canadian Population, 2006 to 2031
12. Population of the Montreal Census Metropolitan Area by religious denomination, 2006 and 2031 (referencescenario) .................................................................................................................................................................... 33
AppendixA1. Population by visible minority group, place of residence and projection scenario, Canada, 2006 and 2031 41A2. Population by religious denomination, place of residence and projection scenario, Canada, 2006 and 2031 47A3. Population by generation status, place of residence and projection scenario, Canada, 2006 and 2031 53A4. Foreign-born population by continent of birth, place of residence and projection scenario, Canada, 2006 and 2031 59
Table of contents
Tables

- 1 -Statistics Canada—Catalogue number 91-551-X
Projections of the Diversity of the Canadian Population, 2006 to 2031
Highlights
The ethnocultural diversity of the Canadian population• Approximately three Canadians in ten (between 29% and 32%) could be a member of a visible minority
group in 2031, regardless of the projection scenario. Canada would then have between 11.4 million and14.4 million visible minority persons.
• The visible minority population would be over-represented in the younger age groups. Thus, according tothe reference scenario for these projections, 36% of the population under 15 years of age in 2031 wouldbelong to a visible minority group, compared to 18% of persons aged 65 and over.
• In 2031, among all the visible minority groups, South Asians and Chinese should still be the largest visibleminority groups in Canada. The South Asian population would number between 3.2 million and 4.1 millionin 2031, compared to 1.3 million in 2006. The Chinese population would go from 1.3 million in 2006 tobetween 2.4 million and 3.0 million in 2031.
• Arabs and West Asians are the visible minority groups that would grow the fastest between 2006 and2031. Depending on the scenario, Canada’s Arab population would thus number between 806,000 and 1.1million in 2031 and its West Asian population, between 457,000 and 592,000, compared to 276,000 and164,000 respectively, in 2006.
• The number of persons having a non-Christian religion would more than double by 2031, reaching between5.3 million and 6.8 million in 2031 compared to an estimated number of 2.5 million in 2006. From 8% ofthe population in 2006, the proportion that they represent would rise to approximately 14% in 2031.
• Within the population having a non-Christian religion, approximately one person in two would be a Muslimin 2031, whereas the corresponding proportion in 2006 was estimated at 35%.
• According to the scenarios developed for these projections, fewer than two Canadians in three would havea Christian religion in 2031. Three Canadians in four (75%) had a Christian religion in 2006. The correspondingproportion in 1981 was 90%.
• Persons whose mother tongue was neither English nor French accounted for less than 10% of Canada’spopulation in 1981. By 2006, that proportion had risen to 20%, and the projections indicate that it wouldreach between 29% and 32% in 2031.
Ethnocultural diversity from one generation to the next• Depending on the projections chosen, the proportion of persons who are foreign-born would reach between
25% and 28% in 2031, a record in Canada since Confederation. In 2006, the corresponding proportionwas 20%
• If immigration were to continue to come mostly from non-European countries, the population of foreign-born persons residing in Canada would continue to change over the next 25 years. In 2031, the percentageof visible minorities who were foreign-born would reach 71%, the percentage of allophones more than 77%while the percentage of persons having a non-Christian religion would be approximately 32%. The correspondingproportions were respectively 54%, 70% and 24% in 2006.
• According to the reference scenario, in 2031 nearly one Canadian in two (46%) aged 15 and over would beforeign-born or would have at least one foreign-born parent, compared to 39% in 2006.
- 2 -Statistics Canada—Catalogue number 91-551-X
Projections of the Diversity of the Canadian Population, 2006 to 2031
• Under the combined effect of the fertility of immigrants and their Canadian-born children and the intergenerationaltransmission of certain characteristics—e.g., belonging to a visible minority group, mother tongue andreligious denomination—the diversity related to these characteristics would also be likely to increasesubstantially within the Canadian-born population in the coming decades.
• According to the projection scenarios chosen, the proportion of visible minority persons, those having anon-Christian religion and those with neither English nor French as their mother tongue is likely to approximatelydouble within the Canadian-born population between 2006 and 2031.
• Within two decades, nearly one Canadian-born person in two (47%) belonging to the second generation(the generation of children of immigrants) would belong to a visible minority group, compared to 24% in2006.
• Within the third or higher generations (those consisting of persons born in Canada of Canadian-born parents),the proportion belonging to visible minorities, although low, would almost triple, going from 1% in 2006 to3% in 2031.
Ethnocultural diversity in census metropolitan areas (CMAs)• New Canadian immigrants’ propensity to settle in metropolitan areas, along with their birth rate, has contributed,
in recent decades, to the concentration of ethnocultural diversity in metropolitan areas.
• Almost all persons belonging to a visible minority group (96%) would continue to live in one of the 33census metropolitan areas between now and 2031. More than 71% of all visible minority persons wouldlive in Canada’s three largest CMAs: Toronto, Vancouver and Montréal.
• Approximately 55% of persons living in CMAs in 2031 would be either immigrants or the Canadian-bornchildren of immigrants. In Toronto and Vancouver, these proportions would reach 78% and 70%, respectively.They would be at most 10% in the St. John’s, Saguenay and Trois-Rivières CMAs.
• According to these projections, approximately three persons in five would belong to a visible minority groupin the Toronto and Vancouver CMAs in 2031. The corresponding proportion would be no more than 5% inthe St. John’s, Greater Sudbury, Trois-Rivières, Québec and Saguenay CMAs.
• Nearly one person in four (24%) living in the Toronto CMA in 2031 would belong to the South Asian visibleminority group, which would continue to be the largest visible minority group in this CMA. The number ofSouth Asians living there would be approximately 2.1 million.
• In 2031, Chinese would be the largest visible minority group in the Vancouver CMA. With a population ofapproximately 809,000, this group would account for approximately 23% of the population of this CMA,compared to 18% in 2006.
• In the Montréal CMA, visible minority persons would account for about three persons in ten (31%), upfrom 16 % in 2006, but this proportion would remain considerably lower than the corresponding proportionsin Toronto and Vancouver.
• By 2031, the population of the Arab visible minority group would almost reach the Black population in theMontréal CMA. Each of these groups would then account for close to 8% of the total population of thisCMA.

- 3 -Statistics Canada—Catalogue number 91-551-X
Projections of the Diversity of the Canadian Population, 2006 to 2031
Introduction
Owing to persistent low fertility and strong immigration, Canada has seen its population rapidly change inrecent decades. Thus, from one census to the next, there has been an increase in the proportion of persons bornabroad, persons whose mother tongue is neither English nor French, and persons belonging to visible minoritygroups as defined by the Employment Equity Act, to cite only a few examples.1 However, this change is not occurringat the same pace throughout the country: while very rapid in the largest metropolitan areas, especially Montréal,Toronto and Vancouver, where most newcomers settle, it has thus far remained quite modest elsewhere in Canada.
Because of the various public policy implications of these rapid changes in the composition of the Canadianpopulation, the Multiculturalism and Human Rights Branch at the Department of Canadian Heritage (this branch isnow with Citizenship and Immigration Canada) commissioned Statistics Canada in 2004 to make regional projectionsof the population of visible minority groups, immigrant status, religion and the population with neither English norFrench as its mother tongue. Those projections were made to 2017, the year of the hundred and fiftieth anniversaryof Canadian Confederation. Owing to the great number of variables to be projected, Statistics Canada’s DemographyDivision developed, in collaboration with Modelling Division, a microsimulation model (originally called PopSim,now known as Demosim2) to make these projections, since models based on aggregate data proved to be inappropriatefor this type of exercise. Programmed using the Modgen microsimulation language, the model led, in 2005, to thepublication of an analytical report3 that received wide media coverage and has since been widely used, notably byvarious federal departments.
The publication of the results of the 2006 Census, as well as the timeliness of issues relating to immigrationand the changes occurring in the Canadian population, called for the development of a new series of populationprojections. While these projections drew on the work published in 2005, they went further by projecting newcharacteristics of the population (place of birth, generation status and highest level of schooling, for example),adding categories to the variables that had then been projected (religion and place of residence), simulating newevents (e.g., change of religion, graduation and departure of children from the family home), and extending the timehorizon to 2031.4 This report presents the results of those new projections, which were made by Statistics Canadafor Canadian Heritage, Human Resources and Skills Development Canada and Citizenship and Immigration Canada.These policy departments were responsible for the policy related assumptions of the projections.
This report consists of three main sections. The first describes the methods and data sources used. The seconddescribes the assumptions and scenarios that were employed in this exercise. The third presents the main resultsof the population projections. Readers interested in more results can refer to the detailed tables appended. A glossaryat the end defines the more specialized terms used in the report.

- 4 -Statistics Canada—Catalogue number 91-551-X
Projections of the Diversity of the Canadian Population, 2006 to 2031
1. Methodology5
1.1 Objective and content of the Demosim microsimulation projection modelThe population projections contained in this report were produced with Demosim, a microsimulation model
developed at Statistics Canada with the specific objective of making projections on the ethnocultural diversity (seedefinition in the glossary) of the entire population of Canada according to a detailed geographic structure that includesCanada’s thirty-three census metropolitan areas (CMAs) and the rest of the provinces and territories. This objectivelargely shaped the choices that were made regarding the database that serves as the starting population, the variablescontained in the model and the methods, models and data sources that underlie the projections.
The starting point for the projections is the microdata file for the 20% sample of the 2006 census of the populationof Canada.6 This database, which includes close to seven million persons with their characteristics, has beenadjusted to take account the net undercoverage in the census according to age, sex and place of residence. Theseadjustements were made by recomputing the sampling weights associated with each individual in the database.Also, some variables of interest needed for projection but absent or incomplete in the census were imputed intothe database. These included individuals’ graduation dates, the generation status of the population under 15 yearsof age and the province or territory of birth for a small portion of the respondents to the 2006 Census.
The variables contained in the initial file can be divided into two major groups. The first consists of variablesthat were projected with a view to eventual release:
• Age• Sex• Place of residence• Religion (see Box 1)• Visible minority group• Immigrant status• Generation status• Continent/region of birth• Mother tongue• Highest level of schooling• Labour market participation7
The second group consists of so-called support variables, that is, variables that are included in the model onlybecause they serve to increase the quality of the projection for the variables in the first group. Most of the time,these are variables used to predict events simulated by the model. They are the following:
• Marital status8
• Province or territory of birth of non-immigrants• Year of immigration• Age at immigration• Aboriginal identity• Registered Indian status• Number or presence of children in the home• Age of youngest child in the home• Sex of youngest child in the home• Dates on which diplomas were obtained
- 5 -Statistics Canada—Catalogue number 91-551-X
Projections of the Diversity of the Canadian Population, 2006 to 2031
1.2 General functioning of the model
Like any population projection model, Demosim makes the initial population change over time by adding birthsand immigrants and subtracting deaths and emigrants. Also, as in “traditional” models, the future number of births,deaths, immigrants and emigrants is based on assumptions that can be changed or combined in various scenarios.
However, since it proceeds on the basis of microdata, the functioning of Demosim differs greatly from that ofmodels based on aggregate data.9 As in “traditional” projection models, the method is designed to obtain an estimateof the population of Canada at a future reference date; but it obtains this by simulating one at a time the future ofeach individual included in the original file. These individuals are therefore likely to “experience,” in the course ofprojection, a number of events, the main ones being the following: birthday, birth of a child, death, migration fromone part of Canada to another, emigration, change of education level, change of marital status, change in labourmarket participation and change of religion (see Box 1). Using a Monte Carlo procedure and the probabilities associatedwith each event, the model calculates for each person, based on his or her particular characteristics, the probabilitiesthat the person will experience these events as well as the time that will elapse before they occur (waiting time).The event with the shortest waiting time is the one that will occur first. After each event, the probabilities and waitingtime are recalculated to take account of the new individual situation. The model accordingly advances the individualsto the end of the projection period, unless they die or emigrate in the meantime. New individuals are also addedover time through birth or immigration, after which they are subject, like the rest of the population, to the probabilitiesof experiencing the events simulated by Demosim.
It should be added that the functioning of Demosim is maintained by Modgen, a programming language speciallydesigned by Statistics Canada’s Modelling Division to facilitate the development of microsimulation models. Modgenhas been used to develop various microsimulation models, including LifePaths and Pohem.10
1.3 Probabilities associated with simulated events
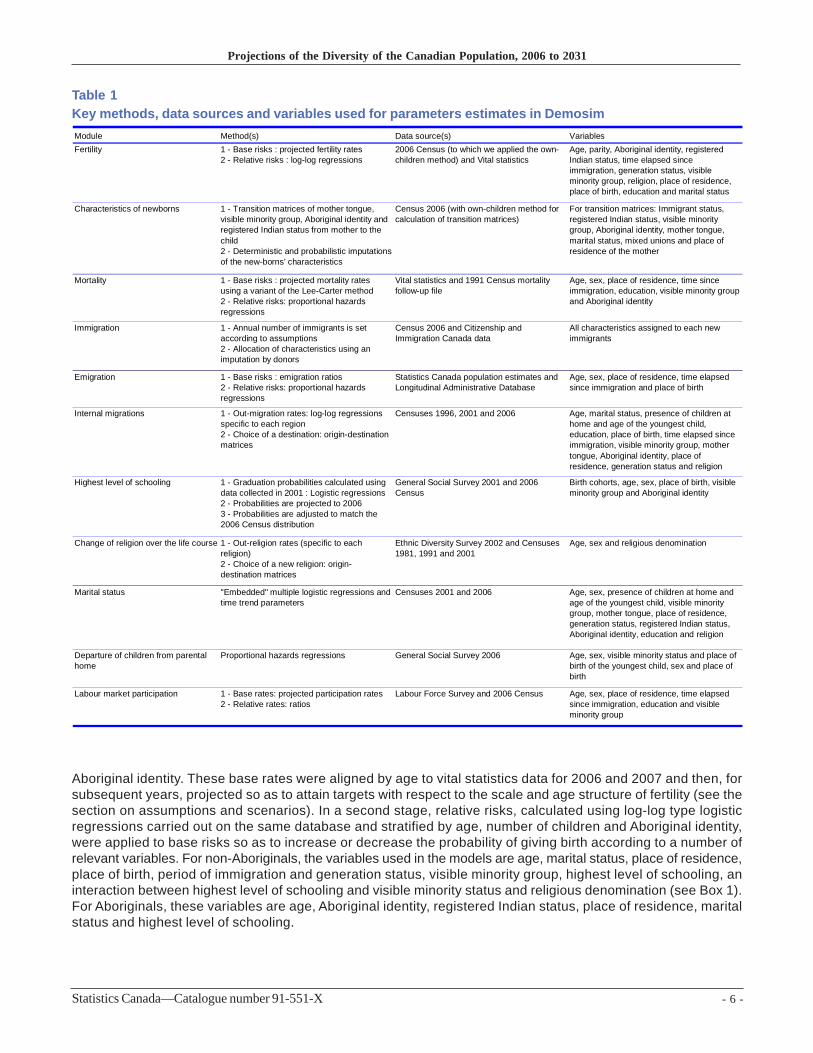
Nor could Demosim function if the various probabilities associated with each event that it simulates were notestablished in advance. The methods used and the variables selected for calculating the parameters of the modelwere determined on the basis of data availability and the objectives of the different modules of the model. The restof this section briefly describes the functioning of the main modules11 of Demosim, summarized in Table 1.
The fertility module was designed in part to take account of the differences in fertility observed in the literaturebetween visible minority groups, religious groups, immigrant groups and other categories of the population.12 Basedon 2006 Census data to which the own-children method13 was applied, this module was created in two main stages.In a first stage, a base risk of giving birth to a child was derived from fertility rates by age, number of children and
Box 1Projections of religious denomination
The question on religion was not asked in the 2006 Census. Therefore, unlike all the other variables,religion was projected starting from data coming from the 2001 Census and then aligned to the resultsof the main series, which starts from 2006. The alignment was done by age, place of residence, visibleminority group and generation status. The model used to project religion starting from 2001 is similar tothe main model, although it underwent a few adaptations to take account of the composition of immigrationby religion and the differences between religious groups as to their propensity to enter into unions, toform common-law unions, to have children and, to some extent, to migrate. It also includes a modulethat simulates changes of religion over the person’s lifetime.
Sections 1 and 2 of this document describe the methods, assumptions and scenarios in the mainprojection series, which uses 2006 as a starting point and does not include religion. In these sectionsit is sometimes noted that religion is taken into consideration in the modelling of a given event, butreaders should keep in mind that this was done only in models used to project religion from 2001 dataand which, consequently, were specially adapted to the projection of religion.
- 6 -Statistics Canada—Catalogue number 91-551-X
Projections of the Diversity of the Canadian Population, 2006 to 2031
Aboriginal identity. These base rates were aligned by age to vital statistics data for 2006 and 2007 and then, forsubsequent years, projected so as to attain targets with respect to the scale and age structure of fertility (see thesection on assumptions and scenarios). In a second stage, relative risks, calculated using log-log type logisticregressions carried out on the same database and stratified by age, number of children and Aboriginal identity,were applied to base risks so as to increase or decrease the probability of giving birth according to a number ofrelevant variables. For non-Aboriginals, the variables used in the models are age, marital status, place of residence,place of birth, period of immigration and generation status, visible minority group, highest level of schooling, aninteraction between highest level of schooling and visible minority status and religious denomination (see Box 1).For Aboriginals, these variables are age, Aboriginal identity, registered Indian status, place of residence, maritalstatus and highest level of schooling.
Table 1Key methods, data sources and variables used for parameters estimates in DemosimModule Method(s) Data source(s) VariablesFertility 1 - Base risks : projected fertility rates
2 - Relative risks : log-log regressions2006 Census (to which we applied the own-children method) and Vital statistics
Age, parity, Aboriginal identity, registered Indian status, time elapsed since immigration, generation status, visible minority group, religion, place of residence, place of birth, education and marital status
Characteristics of newborns 1 - Transition matrices of mother tongue, visible minority group, Aboriginal identity and registered Indian status from mother to the child2 - Deterministic and probabilistic imputations of the new-borns' characteristics
Census 2006 (with own-children method for calculation of transition matrices)
For transition matrices: Immigrant status, registered Indian status, visible minority group, Aboriginal identity, mother tongue, marital status, mixed unions and place of residence of the mother
Mortality 1 - Base risks : projected mortality rates using a variant of the Lee-Carter method2 - Relative risks: proportional hazards regressions
Vital statistics and 1991 Census mortality follow-up file
Age, sex, place of residence, time since immigration, education, visible minority group and Aboriginal identity
Immigration 1 - Annual number of immigrants is set according to assumptions2 - Allocation of characteristics using an imputation by donors
Census 2006 and Citizenship and Immigration Canada data
All characteristics assigned to each new immigrants
Emigration 1 - Base risks : emigration ratios 2 - Relative risks: proportional hazards regressions
Statistics Canada population estimates and Longitudinal Administrative Database
Age, sex, place of residence, time elapsed since immigration and place of birth
Internal migrations 1 - Out-migration rates: log-log regressions specific to each region2 - Choice of a destination: origin-destination matrices
Censuses 1996, 2001 and 2006 Age, marital status, presence of children at home and age of the youngest child, education, place of birth, time elapsed since immigration, visible minority group, mother tongue, Aboriginal identity, place of residence, generation status and religion
Highest level of schooling 1 - Graduation probabilities calculated using data collected in 2001 : Logistic regressions2 - Probabilities are projected to 2006 3 - Probabilities are adjusted to match the 2006 Census distribution
General Social Survey 2001 and 2006 Census
Birth cohorts, age, sex, place of birth, visible minority group and Aboriginal identity
Change of religion over the life course 1 - Out-religion rates (specific to each religion)2 - Choice of a new religion: origin-destination matrices
Ethnic Diversity Survey 2002 and Censuses 1981, 1991 and 2001
Age, sex and religious denomination
Marital status "Embedded" multiple logistic regressions and time trend parameters
Censuses 2001 and 2006 Age, sex, presence of children at home and age of the youngest child, visible minority group, mother tongue, place of residence, generation status, registered Indian status, Aboriginal identity, education and religion
Departure of children from parental home
Proportional hazards regressions General Social Survey 2006 Age, sex, visible minority status and place of birth of the youngest child, sex and place of birth
Labour market participation 1 - Base rates: projected participation rates2 - Relative rates: ratios
Labour Force Survey and 2006 Census Age, sex, place of residence, time elapsed since immigration, education and visible minority group

- 7 -Statistics Canada—Catalogue number 91-551-X
Projections of the Diversity of the Canadian Population, 2006 to 2031
In general, this approach, which distinguishes between base risks and relative risks, has the following twoadvantages: 1) it lends itself to creating parameters that combine the robustness of a data source such as VitalStatistics with the wealth of variables offered by other sources such as surveys; and 2) it makes it easier to preparealternative assumptions, which can be obtained by changing base risks only, relative risks only or both.
When a birth occurs in the simulation process, a new record is added to the database and must be assignedat birth a value for each projected characteristic so that new records will have the minimal attributes to enablethem to be subject to the probabilities of “experiencing” the events that the model provides for. Most characteristicsof newborns are assigned deterministically: children are 0 years of age, not in a union, have no high school diploma,are born in the mother’s region of residence, and so forth. Mother tongue, visible minority group and Aboriginalidentity are instead assigned probabilistically, using mother-to-child characteristics transition matrices calculatedon the basis of 2006 Census data to which the own-children method14 has previously been applied. These matricesinclude the following variables: a mother tongue is assigned to the child based on the mother’s mother tongue,immigrant status and region of residence; the child’s visible minority group depends on that of the mother and herimmigrant status; and Aboriginal identity is assigned to the child based on the mother’s Aboriginal identity andregistered Indian status.
Assigning generation status to newborns is a special case, in that it is necessary to know the father’s immigrantstatus when the mother herself is not an immigrant; in that event, the child is second generation if the father is animmigrant and third generation or more if the father is not an immigrant. Because births are linked only to themothers in Demosim, the information regarding the father’s immigrant status was “registered” along with the mother’smarital status (which indicates whether or not her spouse has the same immigrant status or, in other words, whetheror not the union is mixed). This makes it possible to assign newborns’ generation status correctly and directly,based solely on their mother’s characteristics.15
The mortality module was designed to reflect the secular decline of mortality in Canada along with the differencesthat separate, in this regard, the various population groups for which the projection is made.16 As in the case offertility, the method used for doing this entails two stages. In a first stage, a base risk of dying was calculatedaccording to age and sex on the basis of mortality rates projected by means of a variant of the Lee-Carter modelapplied to Canadian vital statistics data from 1981 to 2006.17 In a second stage, relative risks of dying accordingto place of residence, immigrant status, period of immigration, visible minority group, Aboriginal identity, highestlevel of schooling, age and sex were obtained from a proportional hazards regression model stratified by age groupapplied to a longitudinal database on mortality follow-up.18 These relative risks serve to increase or reduce, as thecase may be, the basic risks obtained from the projected rates by age and sex.
The functioning of the immigration module, central to the future ethnocultural composition of the population,assumes, firstly, that a number of newcomers is determined for each year of the projection period. This number,which is set outside the model, can be changed to create alternative assumptions regarding the volume of immigration.Next, each new immigrant must be assigned a value for each of the projected characteristics, which is done usinga donor imputation method. Donors are selected in the micro database for the 2006 Census from among personswho report having recently immigrated to Canada. The model is then “forced” to accommodate a distribution ofimmigrants by country of birth, which is produced on the database of Citizenship and Immigration Canada (see thesection on assumptions and scenarios).19 Thus, alternative assumptions can also be created on the compositionof immigration.
The emigration module was developed according to the same principle as the fertility and mortality modules,namely by distinguishing between base risks and relative risks, notably taking account of the immigrants’ greaterpropensity to emigrate, especially in the first years after their arrival in Canada.20 The base risks were derived fromnet emigration ratios21 by age and sex, calculated using Statistics Canada annual population estimates. Thesewere then augmented or reduced using the results of a proportional hazards regression which, carried out on theLongitudinal Administrative Database,22 estimates the probability of emigrating according to place of residence,age, being a recent immigrant (settled for 15 years or less) and, for persons in the latter category, place of birthand time elapsed since immigration to Canada.
The internal migration module serves to project changes of residence between the 47 regions in the model,taking account of the various characteristics of inter-regional migrants, namely age, marital status, presence ofchildren, age of youngest child, place of birth, time elapsed since immigration, visible minority group, Aboriginal

- 8 -Statistics Canada—Catalogue number 91-551-X
Projections of the Diversity of the Canadian Population, 2006 to 2031
identity, mother tongue, highest level of schooling, generation status and religion. It draws on Canadian populationcensuses, which include, apart from the variables of interest, information on individuals’ geographic mobility. Onthis basis, the probabilities of leaving each of the 47 regions were first calculated using log-log logistic regressionmodels including a number of variables suited to the specificities of the regions for which they were estimated.Origin-destination matrices, which take account of age, place of birth, time elapsed since immigration, visible minoritygroup, mother tongue and Aboriginal identity, are then used to distribute the migrants among the other 46 regions.This method can also be used to create alternative assumptions, by estimating the models and matrices for differentperiods.
To make projections of religious denomination (see Box 1), it was necessary to add a religious mobility module,so as not to underestimate the future number of persons who report having no religion, since this group has seenits numbers grow over time owing to the mobility of individuals who have left their religion and not subsequentlyreported having another one.23 This module was constructed in the same way as the geographic mobility module.First, the probabilities of migrating from one religion to another—“exit rates,” so to speak—were established byage and sex for each of the main religious groups by combining the information drawn from the 2002 Ethnic DiversitySurvey (EDS) and a cohort-based analysis of the 1981, 1991 and 2001 censuses.24 The “migrants” were then distributedamong the other religions using origin-destination matrices by sex drawn from the Ethnic Diversity Survey.25
Demosim also includes two socioeconomic modules, one modelling changes in highest schooling level andthe other modelling labour market participation. The results for these modules are not described here, since theylie outside the framework of this analysis. The education module is made up of probabilities of graduating, whichare designed to reflect differences in this regard between the projected ethnocultural groups. They were establishedas follows. First, probabilities of graduating by age cohort, sex and place of birth were estimated using logisticregression models, applied to data from the 2001 General Social Survey. These probabilities were then projectedto 2006 before being calibrated so as to allow exact reproduction of the population distributions by schooling level,age, sex and place of birth, visible minority groups and Aboriginal identity in the 2006 Census.26
Labour market participation is simulated by annually imputing a labour market activity status to each individual.Participation rates used for imputation were derived in two steps. Firstly, participation rates by age, sex, highestlevel of schooling and province of residence were established by drawing on annual data from the Labour ForceSurvey. Ratios based on labour market activity contained in the 2006 Census were used, secondly, to increase ordecrease, for each combination of age, sex and schooling level, the labour market participation of the populationaccording to visible minority group, immigrant status and immigration period.
Demosim also includes other modules primarily designed to update, in the course of projection, variables thatinfluence other events in the model. Among them, the marital status module stands out in that it greatly improvesthe projection of births in particular. The function of this module is to assign—i.e., to impute—annually to each individuala marital status according to the results of logistic regression models estimated on the basis of the 2006 Census.Stratified by sex and Aboriginal identity, these models estimate the probability of being in a union and then, amongpersons in a union, the probability of being married (by opposition to be living in a common-law union), taking accountof age, place of residence, visible minority group, mother tongue, presence of children at home, age of youngestchild, generation status, education, registered Indian status and religious denomination. The mixed or non-mixednature of women’s union (that is, whether or not they are in a union with spouses with a different immigrant statusor registered Indian status) is then modelled using logistic regressions so as to make it possible to assign generationstatus or registered Indian status to children born over the course of the simulation. Trend parameters were alsoadded to the model, in part to take account of the increase in common-law unions within the Canadian population.
A module for projecting the departure of children from the parental home was also developed in order to updatethe number of children in the home, an intermediate variable important for the internal migration module; it basicallyconsists of the results of two proportional hazard regression models (one for males and the other for females)estimated with data from the 2006 General Social Survey. The child’s age, sex, visible minority status and placeof birth as well as the father’s or mother’s place of birth were covariates in these models.

- 9 -Statistics Canada—Catalogue number 91-551-X
Projections of the Diversity of the Canadian Population, 2006 to 2031
2. Assumptions and scenarios
The data presented in this document do not constitute predictions; rather, they are part of an exercise designedto estimate how the ethnocultural diversity of the Canadian population might evolve in the future according to variousscenarios of population growth. As it happens, the number of scenarios, and the assumptions underpinning them,is virtually infinite; it was therefore necessary to make choices. The choice of scenarios presented here was guidedby the following considerations:
• they had to be plausible based on the recent situation and past trends;• they had to reflect the inherent uncertainty of any forecasting exercise, since the future is by its very nature
unknown;• insofar as possible, they had to be consistent with the assumptions and scenarios of other series of population
projections disseminated by Statistics Canada;Assumptions and scenarios have also been submitted to members of the scientific committee created for this
project so they could comment them. When possible, assumptions were aligned with what was being proposed,at the time of this writing, on the upcoming edition of Population Projections for Canada, Provinces and Territories,2009-2036 (Statistics Canada Catalogue no. 91-520). The assumptions of Population Projections for Canada, Provincesand Territories, 2009-2036 were also the object of consultations, in particular with provincial and territorial focalpoints and demographers.
2.1 AssumptionsA limited number of assumptions were ultimately selected (see Table 2).27 For a number of aspects of the
projections, a single assumption was chosen, either because the simulated phenomenon changes little over timeor because of the difficulty of creating or justifying an alternative assumption, often owing to the lack of availabledata. Thus, there is only one assumption for fertility differentials, parameters for assigning characteristics to newborns,mortality differentials, net non-permanent residents (NPR), emigration rates, emigration differentials, probabilitiesof a change in schooling level, parameters for marital status, departure of children from parental home and probabilitiesof a change from one religious denomination to another. On the other hand, there is more than one assumption fornumber of children per woman and age at maternity, life expectancy, the immigration rate and immigrants’ placesof origin, as well as interregional migration. The paragraphs below briefly describe, for the main components projected,the assumptions that were selected.28
Fertility
Three assumptions were selected for the base risks of childbearing29 in the framework of projections of thediversity of the Canadian population, all based on the assumptions which, at the time this report was completed,were expected to be incorporated into Population Projections for Canada, Provinces and Territories, 2009-2036(Catalogue no. 91-520). The three assumptions combine target figures for an average number of children per woman(a total fertility rate or TFR) and an average age at fertility. According to the medium assumption, a total fertilityrate of 1.7 children per woman is reached in 2009, with an average age at fertility that is 0.4 years higher than in2007 (when it was 29.75 years). With the low and high assumptions, the targets—respectively total fertility ratesof 1.5 and 1.9 children per woman combined with an increase of 0.6 years in the average age at fertility for the lowassumption and 0.2 years for the high assumption—are reached in 2013. In 2006 and 2007, age-specific fertilityrates are aligned to Canadian vital statistics data.
Under the medium assumption, the choice of a target average number of children per woman that is slightlyhigher than in 2007 (1.70 compared to 1.66) is justified by the fact that preliminary data for 2008 and 200930 indicatea continuation of the increase in fertility observed in the past few years in Canada. Moreover, 1.7 is a number quitesimilar to the completed fertility rate for cohorts born in the 1970s, the most recent cohorts for which this indicatorcan be calculated. Also, the total fertility rate adopted for the medium assumption corresponds to a level that couldbe described as average when compared to the other G8 countries. Among these, three—France, the United States

- 10 -Statistics Canada—Catalogue number 91-551-X
Projections of the Diversity of the Canadian Population, 2006 to 2031
and the United Kingdom—have higher fertility (1.9 children per woman or more) and four—Germany, Italy, Japanand Russia—have lower fertility (1.5 children per woman or less).31 These differences among the G8 countries, likethe differences among Canada’s provinces,32 also guided the development of the high and low assumptions.33 Thefairly rapid attainment of the targets has to do with uncertainty regarding the short-term evolution of fertility in Canada,with recent years having been marked by a sudden rise in fertility after a period of nearly ten years of stability.Also, the assumption of a continuation of the upward variation in the average age at fertility is intended to reflectthe generation effect whereby fertility has occurred ever later from one generation to the next in Canada and continuesto do so.
While the average number of children and the average age at fertility are important aspects of fertility, so is itsethnocultural composition, especially in these projections. Owing to the relative stability over time of the relationshipsbetween fertility and most variables used to model it, a single assumption as to the relative risks of childbearingwas selected.34 Under this assumption, the fertility gaps between the projected groups would remain as observedfrom 2005 to 2006 until the end of the projection period. Thus, recent immigrants and members of the Arab andSouth Asian visible minority groups would exhibit higher-than-average fertility, while Chinese and Koreans wouldhave lower fertility. Since the models used take account of socioeconomic variables (see the section on methods)such as marital status and education, it is clear that the changes that will occur in the composition of the projectedgroups as regards these variables may affect their propensity to have children and may thus cause their fertility toshift higher or lower.
Mortality
The three assumptions selected as to the base risk of dying are identical to those expected to be used inPopulation Projections for Canada, Provinces and Territories, 2009-2036. Based on the trends observed from 1981to 2006, they all assume a continuation of the rise in life expectancy between now and 2031 and a gradual narrowingof the life expectancy gap between males and females. For males, life expectancy would reach 81.7 years underthe low assumption, 83.1 years under the medium assumption and 84.5 years under the high assumption, whilefor women it would reach 85.4, 86.6 and 87.7 years respectively. Despite the stability and regularity of life expectancy
Table 2Key assumptions for projections of the diversity of the Canadian population, 2006 to 2031
Assumption Number of assumptions Details
Average number of children per woman / Increase in mean age at ferility
3 Low: 1.5 children / + 0.6 year Medium: 1.7 children / + 0.4 yearHigh: 1.9 children / + 0.2 year
Fertility differentials 1 Observed between 2005 and 2006 Characteristics of newborns 1 Transmission mother - child observed in 2005-2006, recent sex ratio at birthLife expectancy 3 Low: males = 81.7 years / females = 85.4 years
Medium: males = 83.1 years / females = 86.6 yearsHigh: males = 84.5 years / females = 87.7 years
Mortality differentials 1 Observed from 1991 to 2001Immigration rate 3 Low: 6.0 per 1,000
Medium: 7.5 per 1,000High: 9.0 per 1,000
Place of birth of new immigrants 2 Average: 2001 to 2006Alternative: 2007 to 2008
Net non-permanent residents 1 Progressive levelling-off to 0 in 2018Net emigration rate 1 Observed from 1991 to 2008 Emigration differentials 1 Observed from 1995 to 2005 Inter-regional migration 2 Average: 1995-1996, 2000-2001 and 2005-2006
Alternative: 2005-2006 Schooling 1 Progressive levelling-off in trends and educational completion differentials based on 2006Marital status 1 Observed in 2006 and 2001-2006 trendReligious mobility (see Box 1) 1 Level: observed in data collected in 2002. Age structure: net changes from 1981 to 1991 and
from 1991 to 2001Departure of children from parental home 1 Observed in data collected in 2006

- 11 -Statistics Canada—Catalogue number 91-551-X
Projections of the Diversity of the Canadian Population, 2006 to 2031
trends in Canada since World War II, it is impossible to predict with accuracy what life expectancy will be morethan twenty years into the future. For this reason, three assumptions were selected rather than a single one, forthis demographic component.
The mortality gaps between the projected ethnocultural groups are likely to have an effect on the future compositionof the Canadian population. Therefore, they are taken into account by means of an assumption regarding mortalitydifferentials. Based on the observations in the Canadian census mortality follow-up study, 1991 through 2001, mortalitywould notably be lower for the most recent immigrants and would then increase with the time spent in Canada. Itwould be lower for the most educated persons, lower for visible minority persons and higher for Aboriginals, forboth males and females, even when controlling for the various socioeconomic variables included in the models(see the section on methods).35 The relationships observed between mortality and the selected variables are robust,in that they are in conformity with the literature and are consistent with the estimates obtained from the NationalPopulation Health Survey.36 Accordingly, the present projections are based on only one assumption regarding mortalitydifferentials. Unlike in the case of life expectancy, these differentials are assumed to remain constant over timeand therefore to remain unchanged until 2031.
Immigration
Three assumptions on annual flows of immigrants were included in Demosim. For the years 2009, 2010 and2011, the low, medium and high assumptions correspond to the objectives of the most recent immigration plan ofCitizenship and Immigration Canada, which indicates the number of persons that Canada expects to admit in theshort term. Thus, from 2009 to 2011, the number of immigrants will be 240,000 with the low assumption, 252,500with the medium assumption and 265,000 with the high assumption. Starting in 2012 and up to the end of theprojection period, the annual number of immigrants is drawn from immigration rates (annual number of immigrantsin proportion to the total Canadian population) of 6.0 per thousand, 7.5 per thousand and 9.0 per thousand. Theserates represent approximately the lowest rate observed in Canada from 1990 to 2008 for the low assumption, theaverage rate observed during that period for the medium assumption and the highest rate for the high assumption.37
From 2006 to 2009, the number of immigrants actually admitted was used.
The difference between the high and low assumptions may seem sizable, especially considering that theassumptions will come into force suddenly rather than gradually. The reason for this is that immigration, unlike,say, mortality (except, of course, in the case of war or epidemic), can increase or decrease suddenly and substantiallyfrom one year to another. One need only consider the changes in the annual number of immigrants in the 1980s,when that number went from less than 100,000, to close to 200,000 in just a few years.
The composition of immigration, which also changes over time, is in turn the object of two separate assumptions.With the medium assumption, the composition of the new cohorts of immigrants by country of birth is representativeof the composition of the immigration observed from 2001 to 2006. Here, approximately 62% of immigrants wouldcome from Asian countries; China and India alone are the place of birth of more than 29% of all immigrants toCanada. While this assumption appears to closely reflect the face of immigration to Canada since the early 1990s,there have been changes in this regard in more recent years, namely since the 2006 Census. Thus, in 2007 and2008, the immigration of persons born in China and India has fallen off, now accounting for only 24% of all immigration,and there has been an increase in the proportion of immigrants originating from the Philippines and the Americas(including the West Indies and Bermuda) in particular. Insofar as these changes could possibly signal a lastingchange in immigration to Canada, and since such a change could significantly affect the future composition of theCanadian population, a second assumption is in order. Under this second assumption, immigrants’ places of birthwould be representative of those observed in 2007 and 2008.
Emigration
Once again, a concern for consistency with Population Projections for Canada, Provinces and Territories, 2009-2036 entered into the development of the assumption on base risks of emigrating. The present projections, unlikePopulation Projections for Canada, Provinces and Territories, 2009-2036, use the concept of net emigration ratherthan the separate components of emigration;38 however, the reference period for calculating the probabilities ofleaving by age and sex is the same: 1991-2008. The rationale for using this reference period as the basis for theassumption selected is two-fold: we wanted to use an assumption based on medium-term observations, since the

- 12 -Statistics Canada—Catalogue number 91-551-X
Projections of the Diversity of the Canadian Population, 2006 to 2031
projections are also medium-term; and it was not possible to obtain a coherent data series beginning before 1991.39
The base risks of emigrating thus obtained are applied to projected populations starting in 2009, prior to whichfigures from Statistics Canada population estimates are used directly.
For differential emigration too there is only one assumption, since differences in emigration levels betweenthe projected groups are sufficiently robust over time according to the Longitudinal Database.40 The assumptionselected is based on data extending from 1995 to 2005 that show a stronger propensity to emigrate among recentimmigrants to Canada, in particular those born in the United States, Western and Northern Europe and Far Easterncountries (primarily China, Japan and Korea). The differentials taken into account in the model are held constantover the projection period.
Internal migration
Two assumptions on internal migration were selected, each concerning the propensity to migrate, migrants’choices of destinations and the ethnocultural composition of internal migration. The medium assumption was createdby combining observations regarding internal migration patterns for the periods 1995-1996, 2000-2001 and 2005-2006,41 while the assumption regarding recent migration is based solely on the period 2005-2006. The two assumptionsare largely similar with respect to the composition of internal migration: each relies on the same consistent migrationpatterns, e.g., strong propensity of young persons to migrate to metropolitan areas; greater migration of recentimmigrants compared to other immigrants; even greater migration of non-immigrants living outside their province ofbirth and very strong propensity of the latter to make a return migration; and lower probabilities of migrating amongvisible minorities, especially when they live in one of Canada’s largest metropolitan areas.42
However, the volume of migration by region of origin and the choice of destination can vary considerably fromone period to another. Furthermore, for some regions, internal migration is the main component of population growth,ahead of international migration and natural increase. In light of these considerations, alternative assumptions wereselected. The medium assumption is based on several reference periods, an approach that offers two advantages:it reduces cyclical effects and draws on a larger sample. The recent assumption, for its part, enables us to estimatehow projected populations would be affected if recent trends were to be maintained over a longer period. Basedsolely on observations from the 2006 Census, it also allows the effect of generation status on inter-regional migrationto be taken into account. This was not possible with the medium assumption owing to the absence of informationon place of birth of parents for observations prior to 2001.
Education
Education is a key determinant of fertility, internal migration and mortality. Therefore, this socioeconomiccharacteristic is of great importance for the future composition of the Canadian population. A single assumptionwas selected regarding the probability to change level of schooling. This assumption suggests a progressive levelling-off of the trend towards an increase in the education level of the Canadian population up to 2031 and also maintains,again until the end of the projection period, the gaps between ethnocultural groups as estimated from informationon education in the 2001 General Social Survey combined with data from the 2006 Census (see Methods section).Under this assumption, members of visible minority groups would generally have higher probabilities of graduatingthan the rest of the population. More specifically, the probabilities of obtaining a high school diploma would behigher for each visible minority group than for the rest of the population, while at higher education levels, this wouldhold true only for some specific visible minority groups. Aboriginals, by contrast, would continue to have lowerprobabilities of graduating than the rest of the population. The remarkable stability of these gaps over time justifiesselecting a single assumption.43
Religious mobility (see Box 1)
These projections use a single assumption regarding mobility between religions, with such an assumptionbeing essential to the projection of some religious groups. Under this assumption, the probabilities of leaving eachreligion and the choices of a new religious group would, as shown by the Ethnic Diversity Survey and a cohort-based analysis of decennial censuses from 1981 to 2001, be favourable to groups with no religion and Christiansnot included elsewhere.44 They would be unfavourable to all other groups, more especially Protestants and Catholics,which in the past have experienced the largest net losses of numbers through religious mobility.

- 13 -Statistics Canada—Catalogue number 91-551-X
Projections of the Diversity of the Canadian Population, 2006 to 2031
2.2 ScenariosWith three assumptions for age-specific fertility rates, three assumptions on future life expectancy, three for
the future number of immigrants, two possible formulations of the composition of immigration by country of birthand two internal migration schemas, 108 projection scenarios were possible. Of them, five were selected (seeTable 3). Three are analysed in the following pages, while two are presented in the appendix only, in tabular form.Although these five scenarios are considered plausible, one should not be considered as more probable than theothers, since the future is, by its very nature, unknown. Instead, readers are encouraged to consider the range ofpossibilities that these various scenarios offer.
The reference scenario, a low-growth scenario and a high-growth scenario are analysed in this document. Thereference scenario combines medium fertility, life expectancy, immigration, an immigration composition representativeof what was observed from 2001 to 2006, and medium internal migration. It serves to estimate what the populationwould be if the recent situation and trends were to continue in the coming years. The low-growth scenario differsfrom the reference scenario in that it instead combines low assumption on fertility, life expectancy and immigration,whereas by contrast, the high-growth scenario instead assumes high fertility, high life expectancy and high immigration.The latter two scenarios reflect uncertainty as to the future evolution of the Canadian population, and they shedlight on what would happen if recent trends were to shift in such a way as to either slow or accelerate the growthof the population. Clearly, such a shift would affect both the size of the population and its ethnocultural makeup.
The two scenarios whose results are merely appended are both identical to the reference scenario except forone component, namely internal migration with the alternative internal migration scenario, and the composition ofimmigration with the alternative immigration scenario. The alternative internal migration scenario reproduces theinter-regional migratory patterns observed from 2005 to 2006 rather than those for 1995-1996, 2000-2001 and 2005-2006, while the alternative immigration scenario assumes that immigrants’ countries of birth that will be addedduring the simulation will be representative of what was observed in 2007 and 2008 instead of 2001 to 2006. Thesetwo variants of the reference scenario yield two distinct portraits of the Canadian population of tomorrow, whichillustrate the extent to which both its composition is sensitive to regional and international migratory phenomena.
Table 3Composition of selected scenarios for projections of the diversity of the Canadian population, 2006 to 2031
Immigration Fertility Life expectancy Internal migration
Composition: 2001-2006 Males = 81.7 years
Rate: 6.0 / 1,000 Females = 85.4 years
Composition: 2001-2006 Males = 83.1 years
Rate: 7.5 / 1,000 Females = 86.6 years
Composition: 2001-2006 Males = 84.5 years
Rate: 9.0 / 1,000 Females = 87.7 years
Composition: 2001-2006 Males = 83.1 years
Rate: 7.5 / 1,000 Females = 86.6 years
Composition: 2007-2008 Males = 83.1 years
Rate: 7.5 / 1,000 Females = 86.6 years1995-1996, 2000-2001
and 2005-2006
2005-2006
A) Low growth
B) Reference scenario
C) High growth
1995-1996, 2000-2001 and 2005-2006
1995-1996, 2000-2001 and 2005-2006
1995-1996, 2000-2001 and 2005-2006
D) Alternative internal migration Total fertility rate = 1.7Scenarios in appendix only
Scenario
Total fertility rate = 1.5
Total fertility rate = 1.7
Total fertility rate = 1.9
Scenarios analysed in the document
Total fertility rate = 1.7E) Alternative immigration

- 14 -Statistics Canada—Catalogue number 91-551-X
Projections of the Diversity of the Canadian Population, 2006 to 2031
3. Cautionary notes
This report contains the results of population projections rather than forecasts. This is an important nuance,because we expect forecasts to tell us what the future will most probably be, whereas projections instead tell uswhat would happen if the assumptions and scenarios chosen were to prove correct. In this sense, making projectionsis a prospective exercise whose purpose is much more to support the planning of public policies and nourish publicdebate than to predict the future.
Also, these projections were made with the specific objective of providing an insight into what the ethnoculturalmakeup of the Canadian population might be between now and 2031. Methods, assumptions and scenarios werechosen with a view to achieving this objective. For this reason, the projections presented here may differ from otherseries of projections generated to meet other objectives by means of different methods, scenarios and assumptions.
Despite the wealth of information contained in Demosim, the number of variables projected remains relativelylimited. This is due not only to the framework determined by the objectives of the project, but also to the limitationsinherent in the starting population, which contains only information that can be obtained from the Census of Population.45
As a result, it was not possible, when estimating parameters, to include all variables that the literature recognizesas explaining the demographic behaviours simulated by Demosim, since variables can be taken into account onlyif they are themselves projected.
Also, the projections contained in this report were created using various data sources, each with its own limitations.While the data sources were selected and used with a view to obtaining the most reliable and robust parameterspossible, it goes without saying that coverage of the target populations can vary from one source to another, andthat parameters estimated on the basis of a sample survey are subject to variability due to sampling error. In otherwords, the population projections described here include several sources of uncertainty related to the source data.Although generally quite low, some variability is also associated with the Monte Carlo process used to calculatewaiting times in the simulation model. For these reasons, and so as not to give a false impression of accuracy, theresults have been rounded to the nearest thousandth.
Also, it is worth noting that the results relating to religious denomination must be interpreted with additionalcaution: these were produced on the basis of the 2001 Census rather than the 2006 Census, since the question onreligion is asked in decennial censuses only (see Box 1).
A final point is that the projections presented in this document were developed and analysed using variousconcepts as they exist today. Most of these concepts are based on those used by the Census of Canada or definedby various Canadian laws, notably the Employment Equity Act in the case of visible minority groups. Possibly, asthe demographic situation changes and as ethnocultural diversity increases, the concepts themselves are destinedto change. Thus, it is possible that the very notion of ethnocultural diversity will evolve in the coming decades inCanada as elsewhere, under the influence of migratory exchanges between countries and the intermingling betweenthe immigrant population and the host population. These ongoing changes, combined with the planning needs,underline the great importance of regularly updating projections of the ethnocultural diversity of the Canadian population.

- 15 -Statistics Canada—Catalogue number 91-551-X
Projections of the Diversity of the Canadian Population, 2006 to 2031
4. Analysis of results
Recent decades have seen a shift from a primarily European-based immigration to a pattern in which the majorityof immigrants come from Asia. This, combined with the maintenance of sustained immigration levels, has contributed(and continues to do so) to the ethnocultural diversification of the Canadian population. That diversification takesplace with new cohorts of foreign-born persons differing from previous cohorts, but also through the descendantsthat these new immigrants have after settling in Canada. While the progeny of the immigrants of recent decadesis still quite young, its importance for the composition of the Canadian population will grow in the years to come.Thus the Canadian population can be expected to undergo major changes by 2031, especially in areas where thelargest contingents of newcomers will settle.
The analysis presented in this section was structured so as to bring out the various facets of this phenomenon,in particular the mechanisms by which the population diversifies from one generation to the next. The results of thethree population projection scenarios selected for analysis are first presented for Canada as a whole and then,more succinctly, for Canada’s major metropolitan areas. Readers are invited to consult the definitions of the keyconcepts of the analysis, especially the concept of generation status, in Box 2.
4.1 Ethnocultural diversity from one generation to the next4.1.1 Very soon, the proportion of foreign-born within the Canadian population could reach a
record high
According to the 2006 Census, the foreign-born population, also called the first-generation population (seeBox 2), consisted of just over 6.5 million persons and accounted for 19.8% of the Canadian population, or approximatelyone person in five (Figure 1). By comparison, the corresponding proportion in the United States was 12.5% and inAustralia, 22.2% during the same period.46
The relative share of the population that is foreign-born has mostly increased since 1991, in conjunction withthe upward trends observed for immigration. Between 1991 and 2006, the average annual number of immigrants toCanada was 229,000, making the years 1991 to 2006 one of the longest uninterrupted periods of strong immigrationsince 1871. Between 1951 and 1991, the proportion of foreign-born persons in Canada had changed little, goingfrom 14.7% to 16.1% over a forty-year period.
Box 2Ethnocultural diversity
In this document, the concept of ethnocultural diversity is used to refer to diversity with respect tovisible minority groups, generation status, religious denomination, place of birth and mother tongue.Clearly, this operational definition does not cover all forms of ethnocultural diversity, and that diversitycould therefore be defined using other variables.
Foreign-born populationIn this study, the concept of foreign-born population (also called immigrant population) is used to
designate persons who are, or once were, landed immigrants in Canada. This means that what is intendedby foreign-born population does not include either non-permanent residents or Canadian citizens bybirth who were born abroad. The latter are considered Canadians by birth or non-immigrants.
Generation statusThis refers to the respondent’s generational rank since the settlement of his or her family (meaning
those from whom he or she is directly descended) in Canada. Foreign-born persons are the first generation;the second generation consists of persons born in Canada of at least one foreign-born parent; subsequentgenerations (third or more) consist of Canadian-born persons, both of whose parents were also born inCanada.
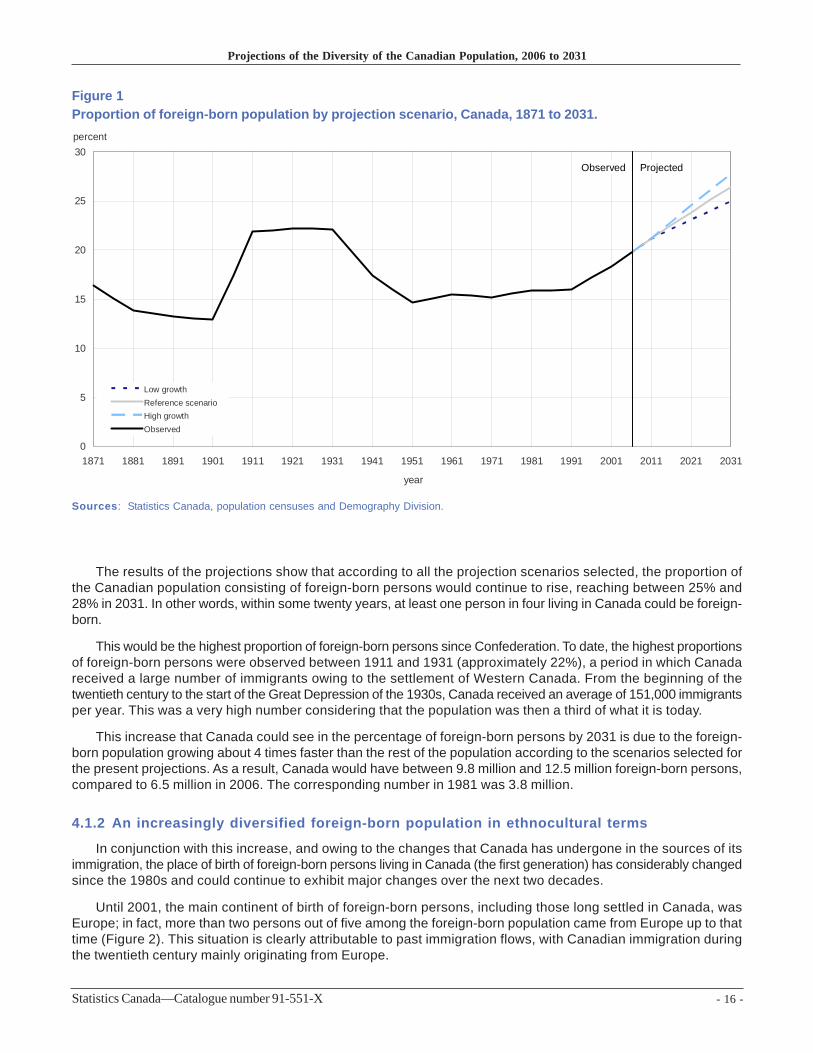
- 16 -Statistics Canada—Catalogue number 91-551-X
Projections of the Diversity of the Canadian Population, 2006 to 2031
0
5
10
15
20
25
30
1871 1881 1891 1901 1911 1921 1931 1941 1951 1961 1971 1981 1991 2001 2011 2021 2031
Low growthReference scenarioHigh growthObserved
percent
Observed Projected
year
The results of the projections show that according to all the projection scenarios selected, the proportion ofthe Canadian population consisting of foreign-born persons would continue to rise, reaching between 25% and28% in 2031. In other words, within some twenty years, at least one person in four living in Canada could be foreign-born.
This would be the highest proportion of foreign-born persons since Confederation. To date, the highest proportionsof foreign-born persons were observed between 1911 and 1931 (approximately 22%), a period in which Canadareceived a large number of immigrants owing to the settlement of Western Canada. From the beginning of thetwentieth century to the start of the Great Depression of the 1930s, Canada received an average of 151,000 immigrantsper year. This was a very high number considering that the population was then a third of what it is today.
This increase that Canada could see in the percentage of foreign-born persons by 2031 is due to the foreign-born population growing about 4 times faster than the rest of the population according to the scenarios selected forthe present projections. As a result, Canada would have between 9.8 million and 12.5 million foreign-born persons,compared to 6.5 million in 2006. The corresponding number in 1981 was 3.8 million.
4.1.2 An increasingly diversified foreign-born population in ethnocultural terms
In conjunction with this increase, and owing to the changes that Canada has undergone in the sources of itsimmigration, the place of birth of foreign-born persons living in Canada (the first generation) has considerably changedsince the 1980s and could continue to exhibit major changes over the next two decades.
Until 2001, the main continent of birth of foreign-born persons, including those long settled in Canada, wasEurope; in fact, more than two persons out of five among the foreign-born population came from Europe up to thattime (Figure 2). This situation is clearly attributable to past immigration flows, with Canadian immigration duringthe twentieth century mainly originating from Europe.
Figure 1Proportion of foreign-born population by projection scenario, Canada, 1871 to 2031.
Sources: Statistics Canada, population censuses and Demography Division.

- 17 -Statistics Canada—Catalogue number 91-551-X
Projections of the Diversity of the Canadian Population, 2006 to 2031
15.1 15.9 16.1 16.1 15.4 15.3 15.0 14.7 14.4 14.1 13.9
66.7 62.254.3
46.942.0
36.831.9
28.1 25.0 22.5 20.5
14.1 18.424.6
31.436.5
40.945.2
48.651.3 53.6 55.4
3.8 4.6 5.2 6.0 7.0 7.8 8.5 9.0 9.5
0
10
20
30
40
50
60
70
80
90
100
1981 1986 1991 1996 2001 2006 2011 2016 2021 2026 2031
Oceania and othersAfricaAsiaEuropeAmericas
Observed Projected
year
percent
However, since 1981, among foreign-born persons enumerated in censuses, the proportion of Asian-born personshas steadily increased, going from 14% to 41% in 2006, while the proportion of persons born in Europe has steadilydeclined, going from 67% to 37%. In fact, the Asian-born proportion of the foreign-born population exceeded theEuropean-born proportion in 2006 for the first time.
According to the scenarios selected for the present projections, 55% of the foreign-born population would comefrom Asia in 2031. European-born persons, on the other hand, would then account for only 20% of that population.Markedly older (median age of 57.0 compared to 46.5 for all foreign-born), the European-born segment would registermore deaths, which would barely be offset by the number of newcomers. The Asian-born, who on average wouldhave settled in Canada more recently, would by comparison be younger (with a median age of 40.3) and their numberswould be swelled by a larger contribution from immigration.
The foreign-born population from non-European countries stands out from the rest of the Canadian populationin having a larger proportion of visible minority persons, individuals with neither English nor French as their mothertongue and persons having a non-Christian religion.47 Consequently, the changes observed with regard to the placesof birth of foreign-born persons are accompanied by a diversification of this population in several respects.
Thus, according to the projection scenarios, the proportion of visible minority persons within the foreign-bornpopulation would be approximately 71% in 2031 (Figure 3), compared to 54% in 2006. In other words, within twodecades, more than two foreign-born persons in three living in Canada could belong to a visible minority group.
Figure 2Distribution of the foreign-born population by continent of birth, Canada, 1981 to 2031 (reference scenario)
Sources: Statistics Canada, population censuses and Demography Division.

- 18 -Statistics Canada—Catalogue number 91-551-X
Projections of the Diversity of the Canadian Population, 2006 to 2031
54.4
70.3
23.9
71.0
77.1
32.0
0
10
20
30
40
50
60
70
80
90
Visible minorities Allophones Non-Christians
20062031 (Reference scenario)
percent
Similarly, once again within the population of first-generation Canadians, the share consisting of persons havinga non-Christian religion and those with a mother tongue other than English or French could increase substantiallyin the coming years. In 2006, approximately one person in four (24%) in Canada’s immigrant population had a non-Christian religion; by 2031 and according to the reference scenario, that proportion would reach 32%, or nearly oneperson out of three. Similarly, the proportion of persons with neither English nor French as their mother tonguewould go from 70% in 2006 to about 77%—more than three persons out of four—in 2031.
Of course, these results as to the composition of immigration are highly sensitive to the assumptions chosen.As noted earlier, readers may consult, appended to this report, results based on a scenario that assumes that thefuture composition will differ from that in the three scenarios analysed here (Scenario E alternative immigration -see Assumptions section for a description of this scenario).
4.1.3 In 2031, only one Canadian in two aged 15 years and over might belong to a family settledin Canada for at least three generations
While it is expected that changes in the volume and composition of immigration to Canada will first affect theethnocultural diversity of the foreign-born population living in Canada, it is inevitable that in the longer run, as onegeneration is replaced by another, this diversity will also increase within the Canadian-born population. The projectionsmade for this project distinguish, within the Canadian-born population, between the second generation and thethird generation or more. As explained above, second-generation persons are born in Canada of at least one foreign-
1. Excluding individuals declaring being without religion.Note: 2006 data on religious denomination have been projected from 2001.Source: Statistics Canada, Demography Division.
Figure 3Proportion of the foreign-born population belonging to a visible minority group, to an allophone group orhaving a non-Christian religious denomination1, Canada, 2006 and 2031 (reference scenario)

- 19 -Statistics Canada—Catalogue number 91-551-X
Projections of the Diversity of the Canadian Population, 2006 to 2031
19.8 22.730.2
18.8 15.9
15.9
61.4 60.552.2
0
10
20
30
40
50
60
70
80
90
100
1971 2006 2031
Non-permanent residents
Third generation or over
Second generationFirst generation
percent
born parent; this population is therefore made up of the Canadian-born children of immigrants. The third generationor more is made up of persons who are Canadian-born and whose parents (both of them) are also Canadian-born.This is, therefore, a population for which their family has been settled in Canada for a longer period of time.
Between 1971 and 2006, the share of Canadians of the third generation or more within the population aged 15and over48 hovered around the level of approximately 60% (Figure 4). In other words, during this period, approximatelythree persons in five aged 15 and over belong to families settled in Canada for at least three generations.
According to the results of the reference scenario developed for the present projections, this proportion should,however, decrease significantly over the coming decades, declining to 52% in 2031. At that point, no more thanone Canadian in two aged 15 and over would come from a family settled in Canada for at least three generations.
By the same token, the share of first- or second-generation Canadians within the Canadian population aged 15and over would increase to 46% in 2031, compared to 39% in 2006. In other words, at that point, nearly one Canadianin two aged 15 and over would either be foreign-born or have at least one foreign-born parent.
An examination of the age structure of the population by generation (figures 5 and 6) shows that those proportionswould vary considerably by age. On the one hand, first- and second-generation persons would account for nearly44% of the population between 0 and 14 years of age in 2031, up sharply from approximately 31% in 2006. Thisincrease is clearly attributable to the birth rate of foreign-born persons.
Figure 4Distribution of the population aged 15 years and over by generation status, Canada, 1971, 2006 and 2031(reference scenario)
Note: In 1971, non-permanent residents were not included in the population enumerated at the census.Sources: Statistics Canada, population censuses and Demography Division.

- 20 -Statistics Canada—Catalogue number 91-551-X
Projections of the Diversity of the Canadian Population, 2006 to 2031
Figure 5Age pyramid (in number) by generation status, Canada, 2006
Source: Statistics Canada, Demography Division.
On the other hand, nearly one person in two in the working-age population (that is, the population aged 15 to64) would be first- or second-generation in 2031, compared to 36% in 2006. This increase is due not only to thehigh volume of immigration to Canada, since the majority of immigrants coming to Canada are in this age group,but also to the fact that by 2031, the large cohorts of the baby-boom, consisting primarily of Canadian-born personsof the third generation or more, will have moved into the 65-and-over age group.
Finally, it is interesting to note that the proportion of first- and second-generation persons within the populationaged 65 and over would decline between 2006 and 2031 from 51% to 41%. Here again, the arrival in this age groupof the baby-boom cohorts largely explains why the growth of ethnocultural diversity would be limited within thesenior population over the next two decades.
4.1.4 Ethnocultural diversity up sharply within the Canadian-born population
Under the combined effect of the fertility of immigrants and their Canadian-born children and the intergenerationaltransmission of certain characteristics—e.g., belonging to a visible minority group, mother tongue and religiousdenomination—the diversity related to these characteristics would also be likely to increase substantially withinthe Canadian-born population in the coming decades.
Figure 7 shows that in general, within the Canadian-born population, the proportion of persons who belong toa visible minority group, have a non-Christian religion or have neither English nor French as their mother tonguecould approximately double between 2006 and 2031. For example, visible minority persons accounted for just over6% of the Canadian-born population in 2006; they could account for about 15% in 2031. This is an even fasterincrease than within the foreign-born population.
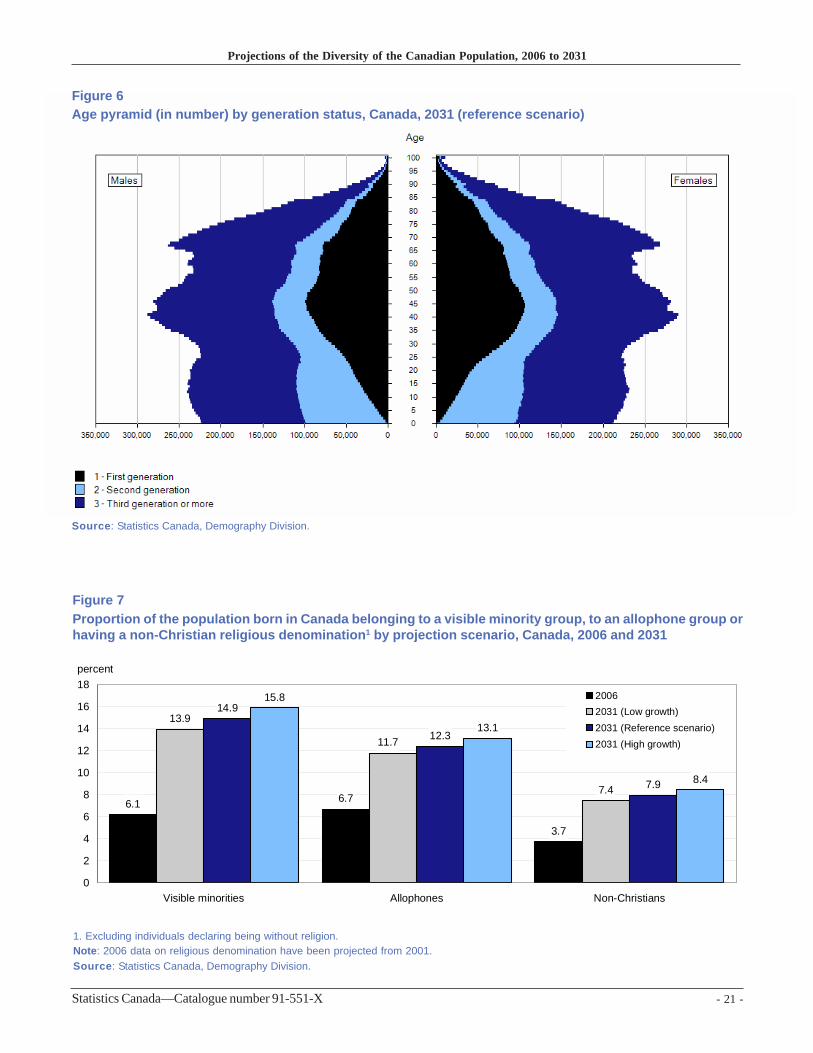
- 21 -Statistics Canada—Catalogue number 91-551-X
Projections of the Diversity of the Canadian Population, 2006 to 2031
Figure 6Age pyramid (in number) by generation status, Canada, 2031 (reference scenario)
Source: Statistics Canada, Demography Division.
Figure 7Proportion of the population born in Canada belonging to a visible minority group, to an allophone group orhaving a non-Christian religious denomination1 by projection scenario, Canada, 2006 and 2031
1. Excluding individuals declaring being without religion.Note: 2006 data on religious denomination have been projected from 2001.Source: Statistics Canada, Demography Division.
6.1 6.7
3.7
13.9
7.4
14.9
12.3
7.9
15.8
13.1
8.4
11.7
0
2
4
6
8
10
12
14
16
18
Visible minorities Allophones Non-Christians
20062031 (Low growth)2031 (Reference scenario)2031 (High growth)
percent

- 22 -Statistics Canada—Catalogue number 91-551-X
Projections of the Diversity of the Canadian Population, 2006 to 2031
1.0
71.0
2.8
54.4
24.3
47.5
0
10
20
30
40
50
60
70
80
First generation Second generation Third generation or over
2006
2031
Canada 2006 (16.3%)
Canada 2031 (30.6%)
percent
Figure 8 shows that the increase in this diversity would be rapid, within both the second and third generationsor more. Thus, the proportion of persons belonging to a visible minority group could almost double during the next25 years within the second-generation population, going from 24% in 2006 to 47% in 2031 under the referencescenario. In other words, nearly one person in two within the Canadian-born population and belonging to the secondgeneration—the children of immigrants—could belong to a visible minority group within two decades.
While diversity is more modest within the third generation or more, it is in the latter population that the increasein the proportion of visible minority persons would be fastest, since it could almost triple (from 1% to 3% accordingto the reference scenario) during the next 25 years. The increase in diversity within this population is expected tocontinue well beyond 2031. This is indicated by the fact that the proportion of visible minority persons in the 0 to14 age group of this population would reach approximately 8% in 2031.
Within the population consisting of the second generation and the third generation or more, there would alsobe a rapid rise in the proportion of allophones and persons having a non-Christian religion. Thus, from 2006 to2031, according to the reference scenario, the percentage of allophones would go from 21% to 35% within thesecond generation and from 2% to 4% within the third generation or more. At the same time, the percentage ofpersons having a non-Christian religion would reach 23% in 2031 for the second generation and 2% in the thirdgeneration or more, compared to 12% and 1% in 2006.
Figure 8Proportion of the population belonging to a visible minority group by generation status, Canada, 2006 and2031 (reference scenario)
Source: Statistics Canada, Demography Division.

- 23 -Statistics Canada—Catalogue number 91-551-X
Projections of the Diversity of the Canadian Population, 2006 to 2031
4.2 Ethnocultural diversity of the Canadian population as a whole4.2.1 In 2031, about three Canadians in ten could belong to a visible minority group
This process, which relates to the fact that the increase in the ethnocultural diversity of the Canadian populationfirst happens within the foreign-born population (first generation), and then, through fertility, within the Canadian-born population, would result in a population that differs in several respects from the current population.
In 2006, Canada had more than 5 million persons belonging to visible minority groups. At that time, thosepersons accounted for 16% of the overall population, compared to only 5% in 1981. The projections indicate thatby 2031, Canada’s visible minority population could rise to between 11.4 million and 14.4 million, depending on thethree scenarios selected for this analysis (Table 4). The proportion that it would represent within the total populationwould vary between 29% and 32%. In other words, about three Canadians in ten could belong to a visible minoritygroup in 2031, regardless of the projection scenario.
Table 4Population by visible minority group and projection scenario, Canada, 2006 and 2031
Source: Statistics Canada, Demography Division.
Between 4.0 million and 5.0 million (or one-third of) persons belonging to a visible minority group in 2031 wouldbe Canadian-born, either as the children of immigrants (the second generation) or as members of families settledin Canada for three generations or more.
The projected increase in the percentage of visible minority persons occurs because this population wouldgrow at a faster rate than the rest of the population. While the population belonging to visible minority groups wouldmore than double over the next 25 years according to all the scenarios, the rest of the population would change byonly 12% at most. This is because the visible minority population would continue, according to the scenarios selectedfor the projections, to be bolstered, in the coming years, by sustained immigration, slightly higher fertility and ayounger age structure (median age of 32.5 compared to 40.4 years for the rest of the population), one that accordinglywould be more conducive to births and would generate fewer deaths.
Reflecting this younger age structure of visible minority populations, diversity should continue to be concentratedwithin the population under 65 years of age in the coming decades (Figure 9). Thus, the proportion of visible minoritypersons would reach respectively 36%, 36% and 30% within the populations aged 0 to 14, 15 to 44, and 45 to 64by 2031. It would remain lower beyond age 65, at 18%. However, the proportion would rise sharply in all age groups.
The projections made also show which visible minority groups could continue, over the next two decades, toexhibit the largest changes (Table 4).
thousands percent thousands percent thousands percent thousands percentTotal 32,522 100.0 39,251 100.0 42,078 100.0 45,008 100.0
Total - Visible minority 5,285 16.3 11,377 29.0 12,855 30.6 14,434 32.1Chinese 1,269 3.9 2,408 6.1 2,714 6.4 3,038 6.7South Asian 1,320 4.1 3,181 8.1 3,640 8.7 4,136 9.2Black 815 2.5 1,620 4.1 1,809 4.3 2,012 4.5Filipino 427 1.3 908 2.3 1,020 2.4 1,139 2.5Latin American 317 1.0 657 1.7 733 1.7 814 1.8Southeast Asian 250 0.8 409 1.0 449 1.1 491 1.1Arab 276 0.8 806 2.1 930 2.2 1,062 2.4West Asian 164 0.5 457 1.2 523 1.2 592 1.3Korean 148 0.5 361 0.9 407 1.0 455 1.0Japanese 85 0.3 131 0.3 142 0.3 153 0.3Other visible minorities 213 0.7 439 1.1 489 1.2 541 1.2
Rest of the population 27,237 83.7 27,875 71.0 29,222 69.4 30,575 67.9
Visible minority groups2031
High growthReference scenarioLow growth2006
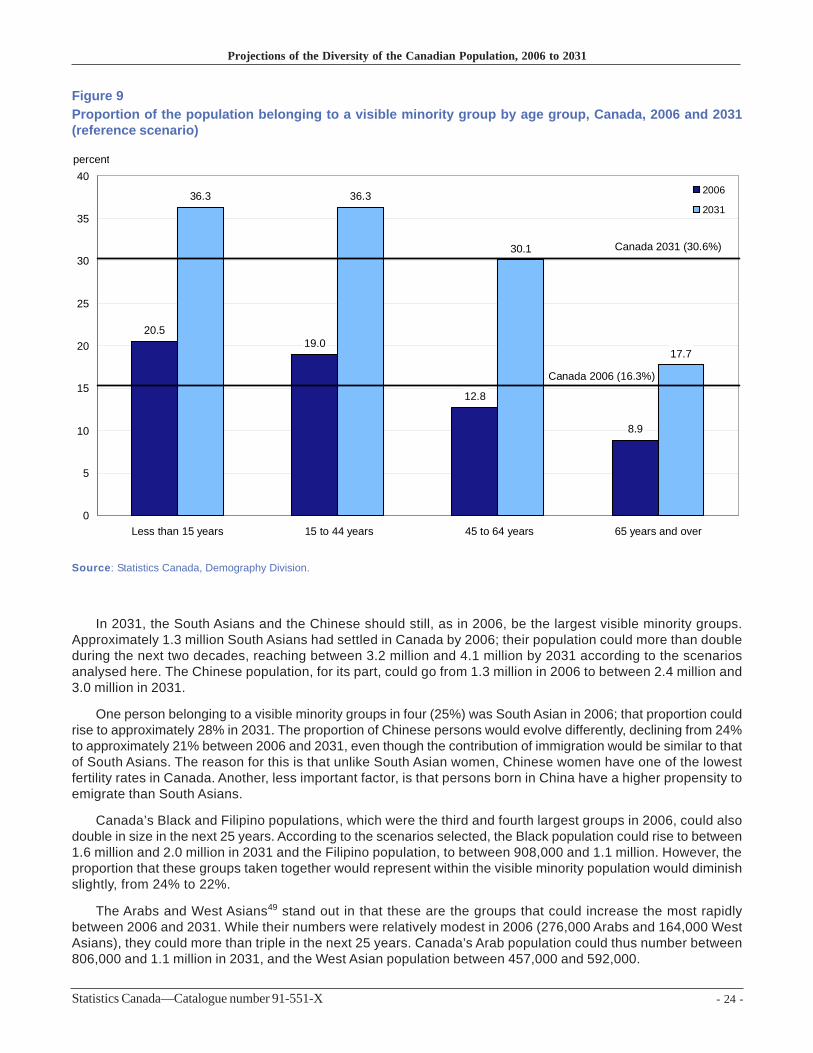
- 24 -Statistics Canada—Catalogue number 91-551-X
Projections of the Diversity of the Canadian Population, 2006 to 2031
20.519.0
12.8
8.9
36.3 36.3
30.1
17.7
0
5
10
15
20
25
30
35
40
Less than 15 years 15 to 44 years 45 to 64 years 65 years and over
2006
2031
percent
Canada 2006 (16.3%)
Canada 2031 (30.6%)
In 2031, the South Asians and the Chinese should still, as in 2006, be the largest visible minority groups.Approximately 1.3 million South Asians had settled in Canada by 2006; their population could more than doubleduring the next two decades, reaching between 3.2 million and 4.1 million by 2031 according to the scenariosanalysed here. The Chinese population, for its part, could go from 1.3 million in 2006 to between 2.4 million and3.0 million in 2031.
One person belonging to a visible minority groups in four (25%) was South Asian in 2006; that proportion couldrise to approximately 28% in 2031. The proportion of Chinese persons would evolve differently, declining from 24%to approximately 21% between 2006 and 2031, even though the contribution of immigration would be similar to thatof South Asians. The reason for this is that unlike South Asian women, Chinese women have one of the lowestfertility rates in Canada. Another, less important factor, is that persons born in China have a higher propensity toemigrate than South Asians.
Canada’s Black and Filipino populations, which were the third and fourth largest groups in 2006, could alsodouble in size in the next 25 years. According to the scenarios selected, the Black population could rise to between1.6 million and 2.0 million in 2031 and the Filipino population, to between 908,000 and 1.1 million. However, theproportion that these groups taken together would represent within the visible minority population would diminishslightly, from 24% to 22%.
The Arabs and West Asians49 stand out in that these are the groups that could increase the most rapidlybetween 2006 and 2031. While their numbers were relatively modest in 2006 (276,000 Arabs and 164,000 WestAsians), they could more than triple in the next 25 years. Canada’s Arab population could thus number between806,000 and 1.1 million in 2031, and the West Asian population between 457,000 and 592,000.
Figure 9Proportion of the population belonging to a visible minority group by age group, Canada, 2006 and 2031(reference scenario)
Source: Statistics Canada, Demography Division.
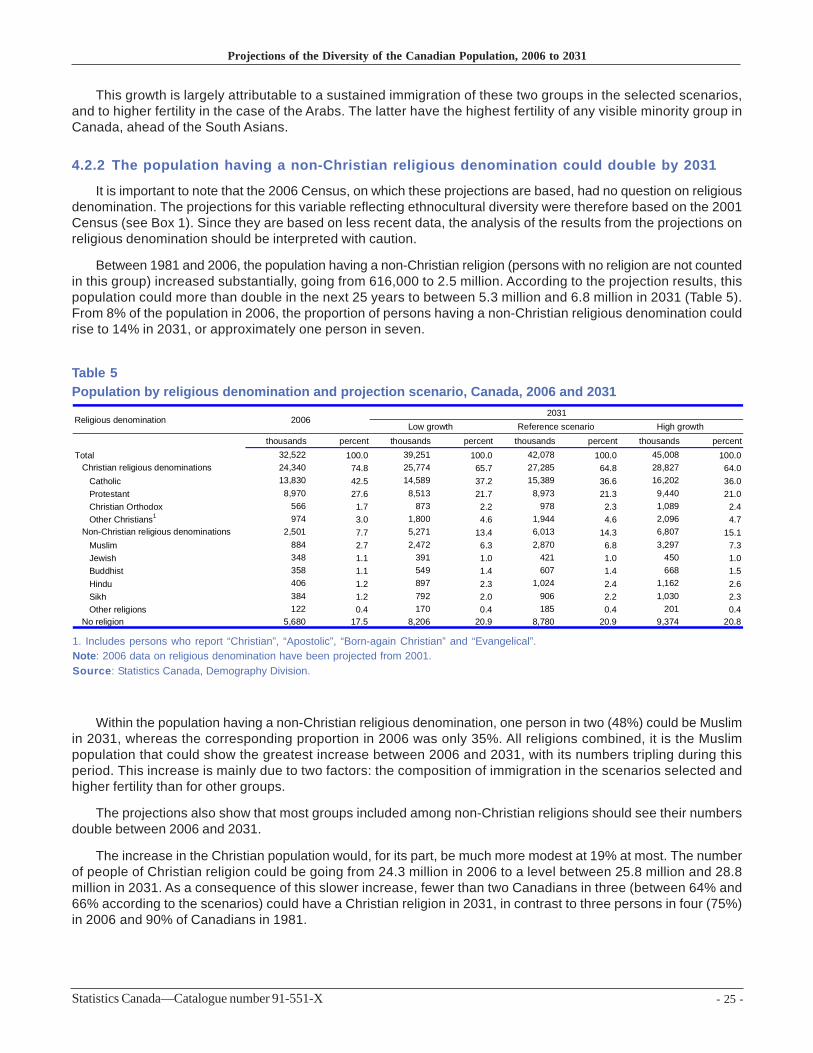
- 25 -Statistics Canada—Catalogue number 91-551-X
Projections of the Diversity of the Canadian Population, 2006 to 2031
This growth is largely attributable to a sustained immigration of these two groups in the selected scenarios,and to higher fertility in the case of the Arabs. The latter have the highest fertility of any visible minority group inCanada, ahead of the South Asians.
4.2.2 The population having a non-Christian religious denomination could double by 2031
It is important to note that the 2006 Census, on which these projections are based, had no question on religiousdenomination. The projections for this variable reflecting ethnocultural diversity were therefore based on the 2001Census (see Box 1). Since they are based on less recent data, the analysis of the results from the projections onreligious denomination should be interpreted with caution.
Between 1981 and 2006, the population having a non-Christian religion (persons with no religion are not countedin this group) increased substantially, going from 616,000 to 2.5 million. According to the projection results, thispopulation could more than double in the next 25 years to between 5.3 million and 6.8 million in 2031 (Table 5).From 8% of the population in 2006, the proportion of persons having a non-Christian religious denomination couldrise to 14% in 2031, or approximately one person in seven.
Table 5Population by religious denomination and projection scenario, Canada, 2006 and 2031
1. Includes persons who report “Christian”, “Apostolic”, “Born-again Christian” and “Evangelical”.Note: 2006 data on religious denomination have been projected from 2001.Source: Statistics Canada, Demography Division.
Within the population having a non-Christian religious denomination, one person in two (48%) could be Muslimin 2031, whereas the corresponding proportion in 2006 was only 35%. All religions combined, it is the Muslimpopulation that could show the greatest increase between 2006 and 2031, with its numbers tripling during thisperiod. This increase is mainly due to two factors: the composition of immigration in the scenarios selected andhigher fertility than for other groups.
The projections also show that most groups included among non-Christian religions should see their numbersdouble between 2006 and 2031.
The increase in the Christian population would, for its part, be much more modest at 19% at most. The numberof people of Christian religion could be going from 24.3 million in 2006 to a level between 25.8 million and 28.8million in 2031. As a consequence of this slower increase, fewer than two Canadians in three (between 64% and66% according to the scenarios) could have a Christian religion in 2031, in contrast to three persons in four (75%)in 2006 and 90% of Canadians in 1981.
thousands percent thousands percent thousands percent thousands percentTotal 32,522 100.0 39,251 100.0 42,078 100.0 45,008 100.0
Christian religious denominations 24,340 74.8 25,774 65.7 27,285 64.8 28,827 64.0Catholic 13,830 42.5 14,589 37.2 15,389 36.6 16,202 36.0Protestant 8,970 27.6 8,513 21.7 8,973 21.3 9,440 21.0Christian Orthodox 566 1.7 873 2.2 978 2.3 1,089 2.4Other Christians1 974 3.0 1,800 4.6 1,944 4.6 2,096 4.7
Non-Christian religious denominations 2,501 7.7 5,271 13.4 6,013 14.3 6,807 15.1Muslim 884 2.7 2,472 6.3 2,870 6.8 3,297 7.3Jewish 348 1.1 391 1.0 421 1.0 450 1.0Buddhist 358 1.1 549 1.4 607 1.4 668 1.5Hindu 406 1.2 897 2.3 1,024 2.4 1,162 2.6Sikh 384 1.2 792 2.0 906 2.2 1,030 2.3Other religions 122 0.4 170 0.4 185 0.4 201 0.4
No religion 5,680 17.5 8,206 20.9 8,780 20.9 9,374 20.8
Reference scenarioLow growth High growthReligious denomination 2006
2031

- 26 -Statistics Canada—Catalogue number 91-551-X
Projections of the Diversity of the Canadian Population, 2006 to 2031
Among Christian religions, the growth of the two largest groups, the Catholics and the Protestants, would bebelow the average or even negative, mainly owing to religious mobility, which for them, more than for other groups,is unfavourable, as in the past.
Lastly, the proportion of Canadians reporting no religion could increase significantly over the coming years,going from 5.7 million in 2006 to a level ranging between 8.2 million and 9.4 million in 2031, depending on thescenario. An estimated 17% of the population had no religion in 2006; this proportion could rise to 21% in 2031. In1981, 1.8 million persons, or 7% of the population, did not report a religious denomination. The main factors underlyingthis increase are mobility between religions, which favoured this group in the scenarios selected, and the immigrationof persons reporting no religion (in many cases Chinese).
4.2.3 Three Canadians in ten in 2031 could have a mother tongue other than English or French
Persons with neither English nor French as their mother tongue—also called allophones—accounted for lessthan 10% of Canada’s population in 1981. That proportion increased to 20% in 2006, and the projections indicatethat it could reach between 29% and 32% in 2031, depending on the scenario chosen (Table 6). In other words,three Canadians in ten could have neither English nor French as their mother tongue in 2031. At that point, thenumber of allophones would vary between 11.4 million and 14.3 million. The number of allophones could increasebetween seven and eleven times faster than the rest of the population, augmented by immigration as among immigrants,persons with a mother tongue other than English or French would continue to be over-represented in the scenariosdeveloped for the projections.
Table 6Population by mother tongue and projection scenario, Canada, 2006 and 2031
Source: Statistics Canada, Demography Division.
4.3 Ethnocultural diversity within census metropolitan areas (CMAs)Apart from its high level since the late 1980s and its ethnocultural diversity, Canadian immigration has another
characteristic: its strong geographic concentration. According to the 2006 Census, the vast majority of immigrantswho came to Canada between 2001 and 2006 settled in one of the country’s 33 census metropolitan areas. Inrecent decades, this situation was one factor that distinguished Canada’s CMAs from other areas in Canada, withstrong immigration causing the metropolitan areas to experience more rapid population growth and greater diversificationof their populations. This section is intended to illustrate what the ethnocultural diversity of Canada’s different metropolitanand other areas could be in 2031.
In the interest of brevity, only the reference scenario will be analysed in this section. As noted earlier, resultson the regional scale are especially sensitive to the assumptions made regarding internal migration. The assumptionmade in the reference scenario is a so-called “medium” assumption based on the trends observed in the censusesof 1996, 2001 and 2006. Obviously, other scenarios, including the alternative internal migration scenario (appended),lead to different results, especially as regards the population sizes of the different parts of Canada. Results at theregional level should therefore be interpreted with caution. However, all the scenarios point to a growing ethnoculturaldiversity of the Canadian population within the 2031 time horizon.
thousands percent thousands percent thousands percent thousands percentTotal 32,522 100.0 39,251 100.0 42,078 100.0 45,008 100.0
Allophone 6,441 19.8 11,352 28.9 12,789 30.4 14,318 31.8English and/or French 26,081 80.2 27,899 71.1 29,288 69.6 30,690 68.2
Mother tongue 20062031
Low growth Reference scenario High growth
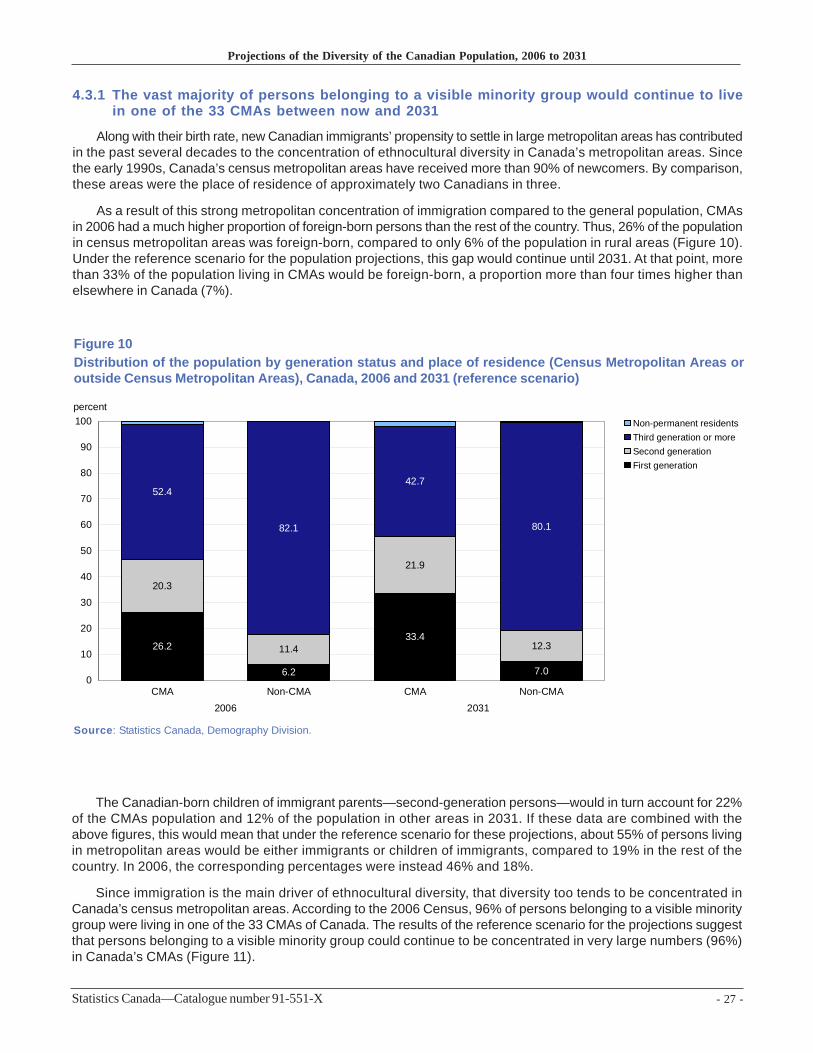
- 27 -Statistics Canada—Catalogue number 91-551-X
Projections of the Diversity of the Canadian Population, 2006 to 2031
26.2
6.2
33.4
7.0
20.3
11.4
21.9
12.3
52.4
82.1
42.7
80.1
0
10
20
30
40
50
60
70
80
90
100
CMA Non-CMA CMA Non-CMA2006 2031
Non-permanent residentsThird generation or moreSecond generationFirst generation
percent
Figure 10Distribution of the population by generation status and place of residence (Census Metropolitan Areas oroutside Census Metropolitan Areas), Canada, 2006 and 2031 (reference scenario)
Source: Statistics Canada, Demography Division.
4.3.1 The vast majority of persons belonging to a visible minority group would continue to livein one of the 33 CMAs between now and 2031
Along with their birth rate, new Canadian immigrants’ propensity to settle in large metropolitan areas has contributedin the past several decades to the concentration of ethnocultural diversity in Canada’s metropolitan areas. Sincethe early 1990s, Canada’s census metropolitan areas have received more than 90% of newcomers. By comparison,these areas were the place of residence of approximately two Canadians in three.
As a result of this strong metropolitan concentration of immigration compared to the general population, CMAsin 2006 had a much higher proportion of foreign-born persons than the rest of the country. Thus, 26% of the populationin census metropolitan areas was foreign-born, compared to only 6% of the population in rural areas (Figure 10).Under the reference scenario for the population projections, this gap would continue until 2031. At that point, morethan 33% of the population living in CMAs would be foreign-born, a proportion more than four times higher thanelsewhere in Canada (7%).
The Canadian-born children of immigrant parents—second-generation persons—would in turn account for 22%of the CMAs population and 12% of the population in other areas in 2031. If these data are combined with theabove figures, this would mean that under the reference scenario for these projections, about 55% of persons livingin metropolitan areas would be either immigrants or children of immigrants, compared to 19% in the rest of thecountry. In 2006, the corresponding percentages were instead 46% and 18%.
Since immigration is the main driver of ethnocultural diversity, that diversity too tends to be concentrated inCanada’s census metropolitan areas. According to the 2006 Census, 96% of persons belonging to a visible minoritygroup were living in one of the 33 CMAs of Canada. The results of the reference scenario for the projections suggestthat persons belonging to a visible minority group could continue to be concentrated in very large numbers (96%)in Canada’s CMAs (Figure 11).

- 28 -Statistics Canada—Catalogue number 91-551-X
Projections of the Diversity of the Canadian Population, 2006 to 2031
4.0 3.913.2 9.0 5.3 5.4
96.0 96.186.8 91.0 94.7 94.6
0
20
40
60
80
100
2006 2031 2006 2031 2006 2031
Visible minorities Allophones Non-Christians
Non-CMA
CMA
percent
Similarly, the great majority of persons having a non-Christian religion and persons with neither English norFrench as their mother tongue will likely live in Canada’s largest metropolitan areas over the next two decades, aswas already the case in 2006. For example, the results show that 95% of persons having a non-Christian religionand about 91% of allophones could, in 2031, live in Canada’s metropolitan areas.
The proportions of visible minorities, allophones and persons having a non-Christian religion within the populationof Canada’s metropolitan areas, already above the national average in 2006, could reach respectively 40%, 37%and 18% in 2031, once again illustrating the great diversity that already characterizes Canadian CMAs and wouldcontinue to do so.
4.3.2 Approximately three persons in five could belong to a visible minority group in the Torontoand Vancouver CMAs in 2031
Although ethnocultural diversity is greater in the largest metropolitan areas than elsewhere in Canada, sizabledifferences are observed from one CMA to another. According to the 2006 Census, for example, foreign-born personsaccounted for more than 46% of the population of the Toronto CMA and 40% of the Vancouver CMA, but less than5% of the CMAs of St. John’s, Québec, Moncton, Trois-Rivières, Saint John and Saguenay. Similarly, the proportionof the population belonging to a visible minority group varied from approximately 43% in the Toronto CMA to less
Figure 11Distribution of the population belonging to a visible minority group, to an allophone group or having a non-Christian religious denomination1 by place of residence (Census Metropolitan Areas or outside CensusMetropolitan Areas), Canada, 2006 and 2031 (reference scenario)
1. Excluding individuals declaring being without religion.Note: 2006 data on religious denomination have been projected from 2001.Source: Statistics Canada, Demography Division.
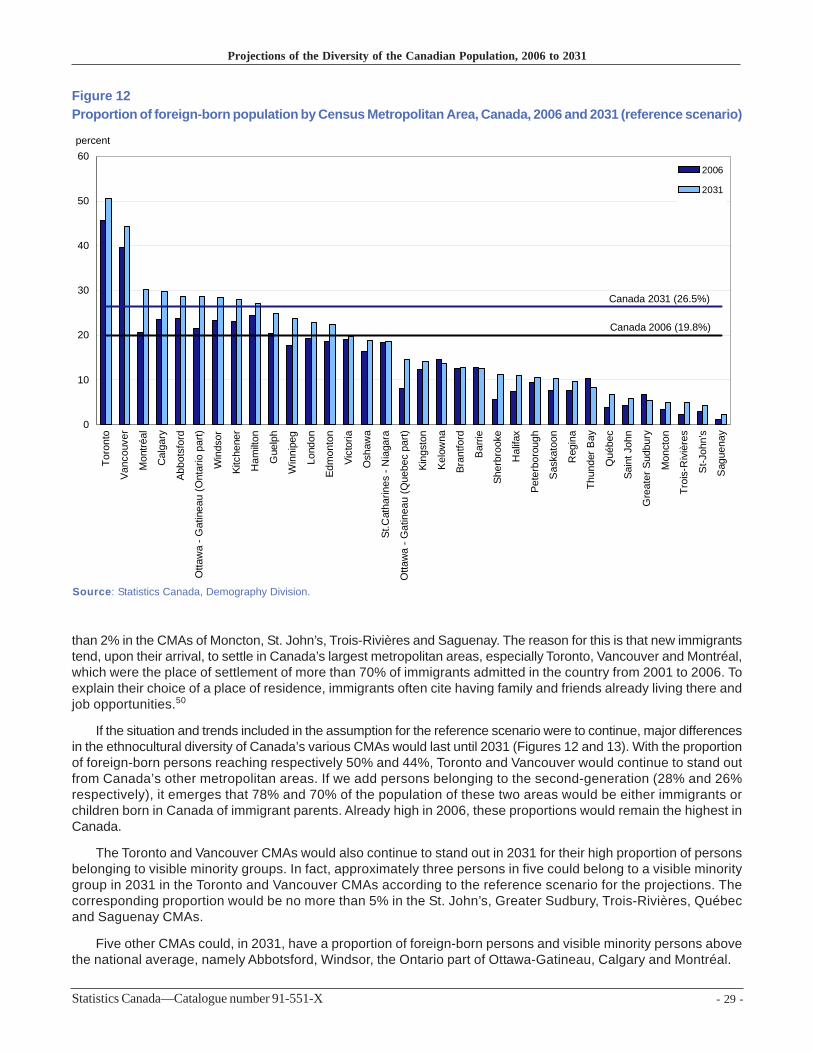
- 29 -Statistics Canada—Catalogue number 91-551-X
Projections of the Diversity of the Canadian Population, 2006 to 2031
0
10
20
30
40
50
60
Toro
nto
Vanc
ouve
r
Mon
tréal
Cal
gary
Abbo
tsfo
rd
Otta
wa
- Gat
inea
u (O
ntar
io p
art)
Win
dsor
Kitc
hene
r
Ham
ilton
Gue
lph
Win
nipe
g
Lond
on
Edm
onto
n
Vict
oria
Osh
awa
St.C
atha
rines
- N
iaga
ra
Otta
wa
- Gat
inea
u (Q
uebe
c pa
rt)
King
ston
Kel
owna
Bran
tford
Bar
rie
Sher
broo
ke
Hal
ifax
Pete
rbor
ough
Sas
kato
on
Reg
ina
Thun
der B
ay
Qué
bec
Sain
t Joh
n
Gre
ater
Sud
bury
Mon
cton
Troi
s-R
iviè
res
St-J
ohn'
s
Sag
uena
y
2006
2031
Canada 2006 (19.8%)
Canada 2031 (26.5%)
percent
Figure 12Proportion of foreign-born population by Census Metropolitan Area, Canada, 2006 and 2031 (reference scenario)
Source: Statistics Canada, Demography Division.
than 2% in the CMAs of Moncton, St. John’s, Trois-Rivières and Saguenay. The reason for this is that new immigrantstend, upon their arrival, to settle in Canada’s largest metropolitan areas, especially Toronto, Vancouver and Montréal,which were the place of settlement of more than 70% of immigrants admitted in the country from 2001 to 2006. Toexplain their choice of a place of residence, immigrants often cite having family and friends already living there andjob opportunities.50
If the situation and trends included in the assumption for the reference scenario were to continue, major differencesin the ethnocultural diversity of Canada’s various CMAs would last until 2031 (Figures 12 and 13). With the proportionof foreign-born persons reaching respectively 50% and 44%, Toronto and Vancouver would continue to stand outfrom Canada’s other metropolitan areas. If we add persons belonging to the second-generation (28% and 26%respectively), it emerges that 78% and 70% of the population of these two areas would be either immigrants orchildren born in Canada of immigrant parents. Already high in 2006, these proportions would remain the highest inCanada.
The Toronto and Vancouver CMAs would also continue to stand out in 2031 for their high proportion of personsbelonging to visible minority groups. In fact, approximately three persons in five could belong to a visible minoritygroup in 2031 in the Toronto and Vancouver CMAs according to the reference scenario for the projections. Thecorresponding proportion would be no more than 5% in the St. John’s, Greater Sudbury, Trois-Rivières, Québecand Saguenay CMAs.
Five other CMAs could, in 2031, have a proportion of foreign-born persons and visible minority persons abovethe national average, namely Abbotsford, Windsor, the Ontario part of Ottawa-Gatineau, Calgary and Montréal.
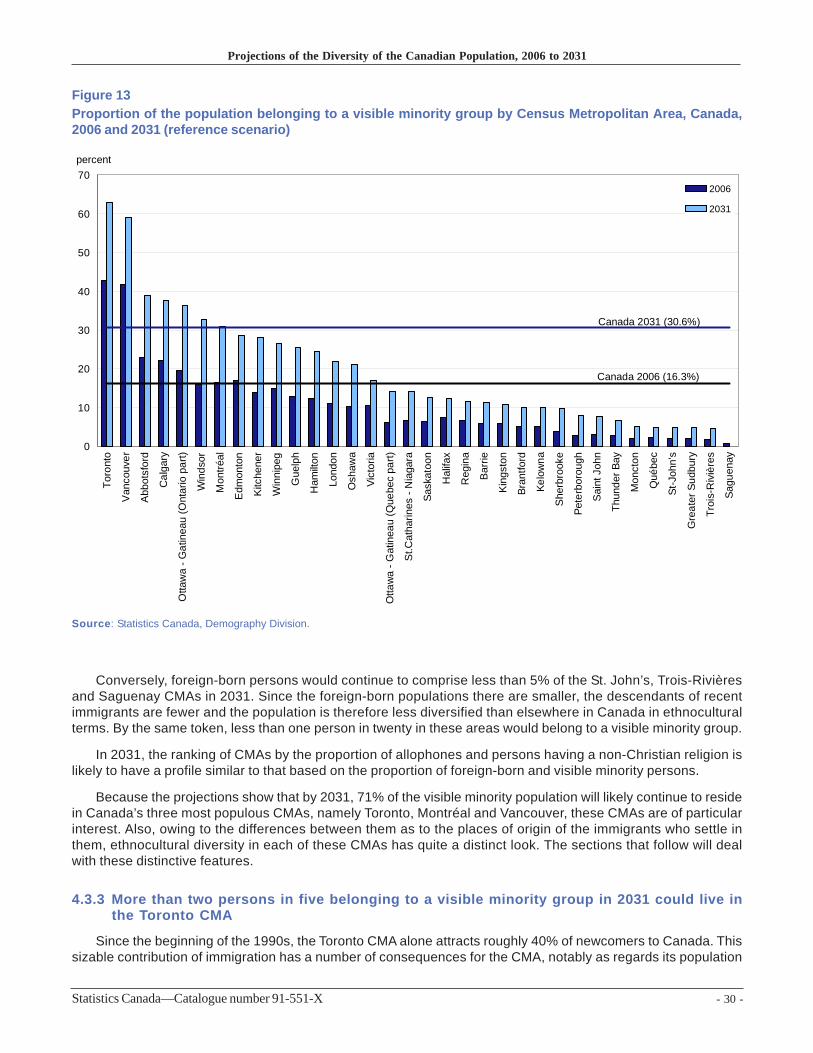
- 30 -Statistics Canada—Catalogue number 91-551-X
Projections of the Diversity of the Canadian Population, 2006 to 2031
0
10
20
30
40
50
60
70
Toro
nto
Van
couv
er
Abb
otsf
ord
Cal
gary
Otta
wa
- Gat
inea
u (O
ntar
io p
art)
Win
dsor
Mon
tréal
Edm
onto
n
Kitc
hene
r
Win
nipe
g
Gue
lph
Ham
ilton
Lond
on
Osh
awa
Vict
oria
Otta
wa
- Gat
inea
u (Q
uebe
c pa
rt)
St.C
atha
rines
- N
iaga
ra
Sask
atoo
n
Hal
ifax
Reg
ina
Bar
rie
Kin
gsto
n
Bran
tford
Kelo
wna
She
rbro
oke
Pete
rbor
ough
Sai
nt J
ohn
Thun
der B
ay
Mon
cton
Qué
bec
St-J
ohn'
s
Gre
ater
Sud
bury
Troi
s-R
iviè
res
Sagu
enay
2006
2031
percent
Canada 2031 (30.6%)
Canada 2006 (16.3%)
Figure 13Proportion of the population belonging to a visible minority group by Census Metropolitan Area, Canada,2006 and 2031 (reference scenario)
Source: Statistics Canada, Demography Division.
Conversely, foreign-born persons would continue to comprise less than 5% of the St. John’s, Trois-Rivièresand Saguenay CMAs in 2031. Since the foreign-born populations there are smaller, the descendants of recentimmigrants are fewer and the population is therefore less diversified than elsewhere in Canada in ethnoculturalterms. By the same token, less than one person in twenty in these areas would belong to a visible minority group.
In 2031, the ranking of CMAs by the proportion of allophones and persons having a non-Christian religion islikely to have a profile similar to that based on the proportion of foreign-born and visible minority persons.
Because the projections show that by 2031, 71% of the visible minority population will likely continue to residein Canada’s three most populous CMAs, namely Toronto, Montréal and Vancouver, these CMAs are of particularinterest. Also, owing to the differences between them as to the places of origin of the immigrants who settle inthem, ethnocultural diversity in each of these CMAs has quite a distinct look. The sections that follow will dealwith these distinctive features.
4.3.3 More than two persons in five belonging to a visible minority group in 2031 could live inthe Toronto CMA
Since the beginning of the 1990s, the Toronto CMA alone attracts roughly 40% of newcomers to Canada. Thissizable contribution of immigration has a number of consequences for the CMA, notably as regards its population

- 31 -Statistics Canada—Catalogue number 91-551-X
Projections of the Diversity of the Canadian Population, 2006 to 2031
growth, its age structure and its ethnocultural diversity. In fact, already in 2006, the Toronto CMA had a largerproportion of foreign-born persons than American cities such as Miami or Los Angeles, yet the latter are known forhaving a sizable immigrant population.51
There were 2.3 million visible minority persons in the Toronto CMA in 2006; this population is projected to morethan double by 2031 to reach, according to the reference scenario, approximately 5.6 million (Table 7), accounting
Table 7Population of the Toronto Census Metropolitan Areaby visible minority group, 2006 and 2031 (referencescenario)
Source: Statistics Canada, Demography Division.
for more than 60% of the area’s population. Thus, theToronto could in 2031 be the place of residence of morethan two visible minority persons in five (43%) living inCanada. It should be added that according to theprojections, about one visible minority person in threeliving in the Toronto CMA would, in 2031, be Canadian-born.
The growth of the rest of the population of the TorontoCMA could be much more modest at roughly 8% overthe period 2006-2031.
4.3.4 More than one visible minority personin three living in the Toronto CMA in 2031could belong to the South Asian group
Already the largest visible minority group in 2006in the Toronto CMA, South Asians are likely to remainso in 2031 and see their population almost triple, goingfrom 718,000 to 2.1 million during the period. Thus, nearlyone person in four (24%) living in the Toronto CMA wouldbe South Asian in 2031, up from 13% in 2006. The factorsthat contribute to this increase are a sustainedimmigration and a higher fertility rate than many othervisible minority groups, in the scenarios selected.
The Chinese would likely remain the second largest visible minority group in the Toronto CMA in 2031. Althoughthe change in the percentage that they represent would be modest, going from 10% of visible minority persons in2006 to 12% in 2031, their numbers would likely double during the period, going from 510,000 to 1.1 million, mainlyowing to the contribution of immigration. As noted earlier, the more modest growth of the Chinese group is mainlydue to having one of the lowest fertility rates of all visible minority groups.
Table 8Population of the Toronto Census Metropolitan Area by religiousdenomination, 2006 and 2031 (reference scenario)
Note: 2006 data on religious denomination have been projected from 2001.Source: Statistics Canada, Demography Division.
Two visible minority groups with asmaller population in 2006 could see theirnumbers grow rapidly between 2006 and2031: Arabs and West Asians. Forexample, according to the referencescenario for the projections, the Arabpopulation could go from 56,000 to 202,000over the next two decades. This situationreflects what is observed at the nationallevel, with these two groups being the onesthat could grow the most rapidly in Canada.
The change over time in the mainreligious denominations goes hand in handwith the projected trends regarding visibleminority groups. Thus, the population having a non-Christian religion could more than double over the next twodecades and come to represent about 30% of the overall population of the CMA, up from the 21% that it representedin 2006 (Table 8).
Visible minority groups 2006 2031 2006 2031
Total 5,320 8,868 100.0 100.0Total - Visible minority 2,281 5,572 42.9 62.8
Chinese 510 1,102 9.6 12.4South Asian 718 2,115 13.5 23.8Black 369 708 6.9 8.0Filipino 180 404 3.4 4.6Latin American 105 235 2.0 2.6Southeast Asian 74 143 1.4 1.6Arab 56 202 1.1 2.3West Asian 79 254 1.5 2.9Korean 58 138 1.1 1.6Japanese 20 33 0.4 0.4Other visible minorities 112 238 2.1 2.7
Rest of the population 3,039 3,296 57.1 37.2
percentthousands
Religious denomination 2006 2031 2006 2031
Total 5,320 8,868 100.0 100.0Christian religious denominations 3,286 4,384 61.8 49.4Non-Christian religious denominations 1,098 2,709 20.6 30.5No religious denomination 937 1,774 17.6 20.0
thousands percent
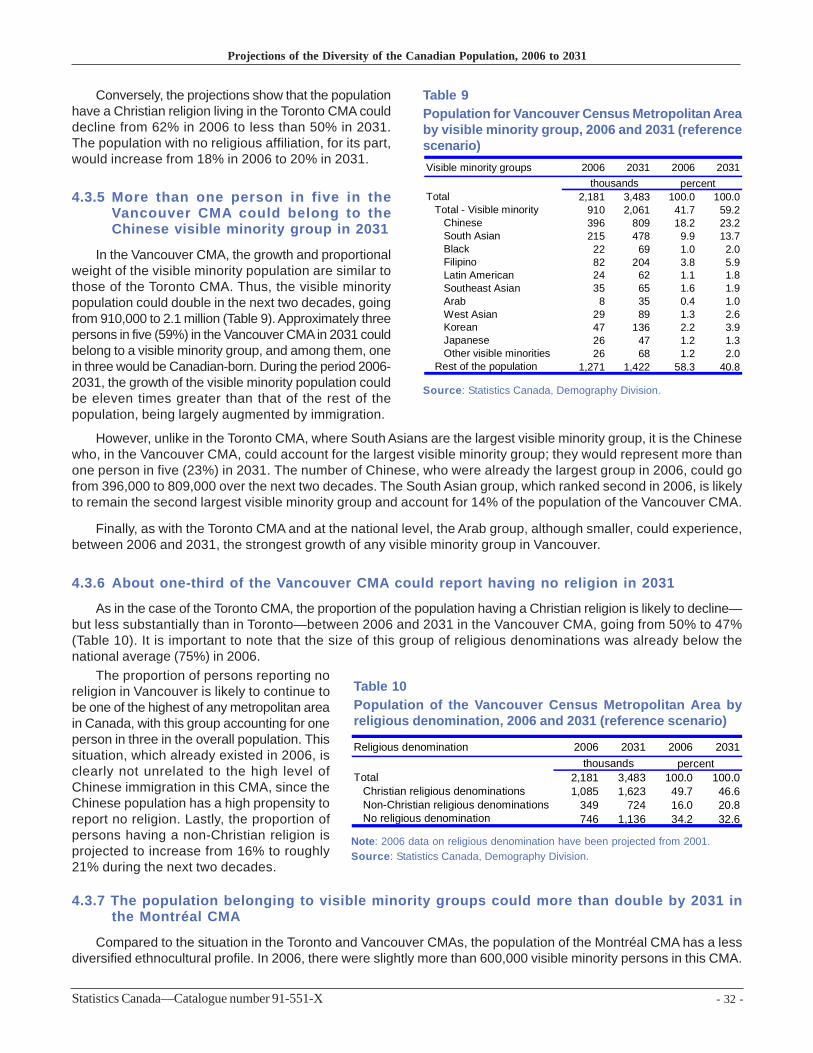
- 32 -Statistics Canada—Catalogue number 91-551-X
Projections of the Diversity of the Canadian Population, 2006 to 2031
Source: Statistics Canada, Demography Division.
Table 9Population for Vancouver Census Metropolitan Areaby visible minority group, 2006 and 2031 (referencescenario)
Conversely, the projections show that the populationhave a Christian religion living in the Toronto CMA coulddecline from 62% in 2006 to less than 50% in 2031.The population with no religious affiliation, for its part,would increase from 18% in 2006 to 20% in 2031.
4.3.5 More than one person in five in theVancouver CMA could belong to theChinese visible minority group in 2031
In the Vancouver CMA, the growth and proportionalweight of the visible minority population are similar tothose of the Toronto CMA. Thus, the visible minoritypopulation could double in the next two decades, goingfrom 910,000 to 2.1 million (Table 9). Approximately threepersons in five (59%) in the Vancouver CMA in 2031 couldbelong to a visible minority group, and among them, onein three would be Canadian-born. During the period 2006-2031, the growth of the visible minority population couldbe eleven times greater than that of the rest of thepopulation, being largely augmented by immigration.
However, unlike in the Toronto CMA, where South Asians are the largest visible minority group, it is the Chinesewho, in the Vancouver CMA, could account for the largest visible minority group; they would represent more thanone person in five (23%) in 2031. The number of Chinese, who were already the largest group in 2006, could gofrom 396,000 to 809,000 over the next two decades. The South Asian group, which ranked second in 2006, is likelyto remain the second largest visible minority group and account for 14% of the population of the Vancouver CMA.
Finally, as with the Toronto CMA and at the national level, the Arab group, although smaller, could experience,between 2006 and 2031, the strongest growth of any visible minority group in Vancouver.
4.3.6 About one-third of the Vancouver CMA could report having no religion in 2031
As in the case of the Toronto CMA, the proportion of the population having a Christian religion is likely to decline—but less substantially than in Toronto—between 2006 and 2031 in the Vancouver CMA, going from 50% to 47%(Table 10). It is important to note that the size of this group of religious denominations was already below thenational average (75%) in 2006.
Table 10Population of the Vancouver Census Metropolitan Area byreligious denomination, 2006 and 2031 (reference scenario)
Note: 2006 data on religious denomination have been projected from 2001.Source: Statistics Canada, Demography Division.
The proportion of persons reporting noreligion in Vancouver is likely to continue tobe one of the highest of any metropolitan areain Canada, with this group accounting for oneperson in three in the overall population. Thissituation, which already existed in 2006, isclearly not unrelated to the high level ofChinese immigration in this CMA, since theChinese population has a high propensity toreport no religion. Lastly, the proportion ofpersons having a non-Christian religion isprojected to increase from 16% to roughly21% during the next two decades.
4.3.7 The population belonging to visible minority groups could more than double by 2031 inthe Montréal CMA
Compared to the situation in the Toronto and Vancouver CMAs, the population of the Montréal CMA has a lessdiversified ethnocultural profile. In 2006, there were slightly more than 600,000 visible minority persons in this CMA.
Visible minority groups 2006 2031 2006 2031
Total 2,181 3,483 100.0 100.0Total - Visible minority 910 2,061 41.7 59.2
Chinese 396 809 18.2 23.2South Asian 215 478 9.9 13.7Black 22 69 1.0 2.0Filipino 82 204 3.8 5.9Latin American 24 62 1.1 1.8Southeast Asian 35 65 1.6 1.9Arab 8 35 0.4 1.0West Asian 29 89 1.3 2.6Korean 47 136 2.2 3.9Japanese 26 47 1.2 1.3Other visible minorities 26 68 1.2 2.0
Rest of the population 1,271 1,422 58.3 40.8
percentthousands
Religious denomination 2006 2031 2006 2031
Total 2,181 3,483 100.0 100.0Christian religious denominations 1,085 1,623 49.7 46.6Non-Christian religious denominations 349 724 16.0 20.8No religious denomination 746 1,136 34.2 32.6
thousands percent

- 33 -Statistics Canada—Catalogue number 91-551-X
Projections of the Diversity of the Canadian Population, 2006 to 2031
The results of the reference scenario for the projectionsindicate that this number could more than double in thenext two decades, reaching 1.5 million in 2031 (Table11). Visible minority persons could then account for nearlyone person in three (31%), up from 2006 (16%). Thisproportion would remain lower than those in Toronto (63%)and Vancouver (59%). However, as in the latter CMAs,the proportion of visible minority persons born in Canadawould be approximately one in three in 2031.
Like in Toronto and Vancouver, however, the growthof the visible minority population in Montreal is expectedto be much greater than that of the rest of the population.
The Montréal CMA also stands out with respect tothe main visible minority groups within its boundaries.While South Asians and Chinese are the two largestgroups in the Toronto and Vancouver CMAs, the largestgroups in the Montréal CMA in 2006 were Blacks andArabs, and they are projected to remain so up to 2031according to the reference scenario.
Table 11Population of the Montreal Census Metropolitan Areaby visible minority group, 2006 and 2031 (referencescenario)
Source: Statistics Canada, Demography Division.
In 2006, Blacks accounted for 5% of Montréal’spopulation, and Arabs, 3%. Owing to greater population
Table 12Population of the Montreal Census Metropolitan Area byreligious denomination, 2006 and 2031 (reference scenario)
Note: 2006 data on religious denomination have been projected from 2001.Source: Statistics Canada, Demography Division.
four in five in 2006.
The reason for this is that the proportionof persons having a non-Christian religionor reporting no religion is expected to increasein the next two decades. The percentage ofpersons having a non-Christian religion wouldgo from 9% to 16% during the period, whilethe population with no religious affiliationwould comprise 13% in 2031, compared to9% in 2006.
Visible minority groups 2006 2031 2006 2031
Total 3,680 4,900 100.0 100.0Total - Visible minority 604 1,521 16.4 31.0
Chinese 74 198 2.0 4.0South Asian 72 170 2.0 3.5Black 173 381 4.7 7.8Filipino 24 56 0.7 1.1Latin American 77 179 2.1 3.7Southeast Asian 46 70 1.3 1.4Arab 101 367 2.7 7.5West Asian 15 44 0.4 0.9Korean 5 16 0.1 0.3Japanese 3 7 0.1 0.1Other visible minorities 14 34 0.4 0.7
Rest of the population 3,076 3,380 83.6 69.0
percentthousands
growth, with their numbers likely to triple between 2006 and 2031, the Arab group could almost catch up to theBlacks by 2031, with each group then accounting for close to 8% of the population of the Montréal CMA. Together,these two groups could comprise, in 2031, approximately half of the visible minority population in Montréal.
It is also worth noting that in 2031, the Montréal CMA would continue to be, as it already was in 2006, theCanadian metropolitan area with the largest Arab community. This situation is not unrelated to the characteristicsof Quebec immigration, especially the propensity to select immigrants likely to speak French, including a numberwho come from the Maghreb (North African) countries.
Lastly, the Chinese and South Asian populations in Montréal could more than double between 2006 and 2031,but their share of the total would remain below those of the Black and Arab populations during the period.
4.3.8 Approximately 16% of the population of the Montréal CMA could have a non-Christian religionin 2031
In 2006, the religious portrait of Montréal in 2006 already stood out from those of Toronto and Vancouver in thatthe population having a Christian religion still accounted for a sizable proportion of the population, at approximately82%. Over the years, this proportion is expected to decrease and by 2031, it could decline to 70% (Table 12). Inother words, two persons in three living in the Montréal CMA in 2031 could have a Christian religion, compared to
Religious denomination 2006 2031 2006 2031
Total 3,680 4,900 100.0 100.0Christian religious denominations 3,024 3,450 82.2 70.4Non-Christian religious denominations 333 797 9.0 16.3No religious denomination 323 654 8.8 13.3
thousands percent

- 34 -Statistics Canada—Catalogue number 91-551-X
Projections of the Diversity of the Canadian Population, 2006 to 2031
Conclusion
Carried out on the initiative of Canadian Heritage, Human Resources and Skills Development Canada and Citizenshipand Immigration Canada, the projections presented in this document are primarily intended to describe the evolutionof the ethnocultural diversity of the Canadian population from 2006 to 2031. The results show that regardless of thescenario of future change considered, the ethnocultural diversity of the population will continue to increase significantlyover the next two decades, especially within certain census metropolitan areas. Three Canadians in ten could bea member of a visible minority group in 2031, and the corresponding proportion in the Toronto and Vancouver CMAscould be two times greater.
The projections also shed light on the process by which ethnocultural diversity is increasing. While the face ofthe foreign-born Canadian population was already diversified in 2006, the projections also show that this diversityis likely to increase rapidly within the Canadian-born population, notably within the so-called second generation,composed of the children of immigrants. And finally, regardless of future levels and diversity of immigration to Canada,the ethnocultural diversity will grow as a result of the fertility of immigrants already settled in Canada and the transmissionof some of their characteristics to their Canadian-born children.
The projections have a number of limitations that should be kept in mind. These projections are in no case anattempt to predict the future, but are instead based on a number of assumptions and scenarios regarding futurechange that were carefully developed and selected for their plausibility and utility. The databases used, while producinghigh quality parameters subject to little sampling variability, do have some limitations with respect to the coverageof the target populations and the variables that they make available for analysis. Despite these limitations, theprojections presented in this document are a useful and relevant tool for estimating future demographic changes insupport of program and policy development.

- 35 -Statistics Canada—Catalogue number 91-551-X
Projections of the Diversity of the Canadian Population, 2006 to 2031
Endnotes
1. On this subject, see Tina Chui, Kelly Tran and Hélène Maheux (2007) or Statistics Canada (2008).
2. To avoid any confusion, only Demosim will be used to designate the model throughout the rest of the report.
3. Alain Bélanger and Éric Caron Malenfant (2005). The project also led, in 2008, to a more technical publicationin the research papers of Eurostat (see Bélanger, A., É. Caron Malenfant, L. Martel and R. Gélinas (2008)).
4. The methods employed by the microsimulation-based projection model were thoroughly revised, and the modelwas also adapted in order to study the feasibility of Aboriginal projections by microsimulation. Although themethodology section of this report refers several times to the Aboriginal component of the model, no resultrelating to those populations will be described here.
5. Of course, this section is based on the existing documentation on the model, of which it is both an updateand an extension. Readers interested in a more detailed description of the Demosim methodology are invitedto view the Demosim Methodology Report (to be made available on the Statistics Canada website).
6. Except for religious denomination, which is projected separately based on the 2001 Census. See Box 1 formore information on this subject.
7. Although they are part of the simulation model, the results on labour market participation, like those on highestlevel of schooling, are not presented here because they lie outside the framework established for this analysis.
8. Including the mixed or non-mixed nature of the union. Two types of mixed unions are possible: with a partnerwhose immigrant status is different and/or with a partner whose registered Indian status is different. Thisinformation is used to assign generation status and registered Indian status to newborns.
9. See Evert Van Imhoff (1997) for a discussion of the details of microsimulation projection models and Bélangeret al. (2008), op. cit., for a discussion of the previous version of the model.
10. More information on Modgen is available at the Statistics Canada website: http://www.statcan.gc.ca/microsimulation/modgen/modgen-eng.htm. Also, Statistics Canada’s Modelling Division can be contacted [email protected].
11. Demosim has one module per simulated event.
12. On this subject, see Bélanger and Gilbert (2003), McQuillan (2004), Ram (2004) and Caron Malenfant andBélanger (2006)
13. This is an indirect method of estimating fertility that considers women living with at least one of their childrenunder one year of age at the time of the census as having given birth during the previous year. Please seeCho et al, 1986, Desplanques, 1993 and Bélanger and Gilbert, 2003 for a description and discussion of thismethod.
14. This is basically the same method as was used to develop fertility parameters.
15. The module for mother-to-child transmission of registered Indian status is largely based on the same principle.
16. In particular, see Chen, Wilkins and Ng (1996) and Wilkins et al. (2008).
17. Li, N. and R. Lee. (2005)
18. This database results from records linkages between the 1991 Census and Canadian vital statistics datafrom 1991 to 2001. On this subject, see Wilkins et al. (2008).
- 36 -Statistics Canada—Catalogue number 91-551-X
Projections of the Diversity of the Canadian Population, 2006 to 2031
19. It should be noted that the model allows the addition of non-permanent residents over time. The module thatmanages these additions functions similarly to the immigration module, that is, by setting an annual numberof new non-permanent residents and then imputing characteristics to them by the use of donors, who in thiscase are non-permanent residents in the base population.
20. On this subject, see Aydemir and Robinson (2006) and Michalowski and Tran (2008).
21. Net emigration is the number of emigrants minus returning emigrants plus net temporary emigration.
22. This database consists of a longitudinal sample created by matching tax data to the longitudinal database onimmigrants.
23. Readers interested in data on the increase in the number of persons reporting no religion, or more generallyin the change over time in the numbers for the major religions in Canada, are invited to consult Canada (2003(1)).
24. The Ethnic Diversity Survey allows us to compared respondents’ religion with that of their mother when they(respondents) were under 15 years of age. The results of the EDS must therefore be interpreted as measuringboth intergenerational mobility (since respondents are compared with their mother) and intragenerational mobility(since a change in religion can take place in one’s later years). The age at the time of a change was estimatedby means of a cohort-based analysis of data from the 1981 to 2001 censuses, similar to what was used byGuimond (1999) to estimate the ethnic mobility of Aboriginals.
25. It should be noted that in the model, this module is applied only to non-Aboriginal populations, since Aboriginalsare not part of the target population of the Ethnic Diversity Survey. By way of compensation, the results of amother-to-child religion transmission matrix calculated with 2001 Census data are used to assign stochasticallya religion to Aboriginals who are born in the course of simulation.
26. The modelling of education in Demosim is documented in Spielauer (2009).
27. It should be noted that when observed data were available for reference periods subsequent to the startingpoint for projections, they were used directly or indirectly as alignment targets for the parameters for theapplicable years (age-specific fertility rates for 2006 and 2007, number of immigrants for 2006 to 2009, increasein the number of non-permanent residents from 2006 to 2009, mortality rates by age and sex in 2006 and netemigration rates from 2006 to 2009). In this case, the assumptions described on the following pages beganto be applied only in the year following the last year of observation.
28. This description is complemented by the section that describes the methods used to project the components.
29. The distinction between base risks and relative risks is explained in the section on methods.
30. Compiled for selected provinces.
31. See Population Reference Bureau (2009)
32. At the provincial level, fertility gaps are observed similar to those exhibited by the G8 countries, with fertilitybeing equal to or greater than 1.9 children per women in the Prairie Provinces and lower, at approximately 1.5children per woman, in Newfoundland and Labrador, Nova Scotia, New Brunswick and British Columbia. Quebec,Ontario and Prince Edward Island are closer to the national average (Statistics Canada (2009)).
33. Other reasons may also be cited to justify these alternative assumptions. As regards a possible increase infertility, note the recent increase in the total fertility rate, not only in Canada but also in several other G8countries. On the other hand, various social changes often associated with declining fertility have probablynot run their course. Among the main manifestations of these changes is the increase of common-law unionsas a form of conjugality, the increased education of women and the fall-off in religious attendance. However,it is not outside the realm of possibility that the relationship between fertility and these phenomena will changeover time.
34. The results of the analyses that were conducted in order to make these projections are quite similar to thoseobtained by Caron Malenfant and Bélanger (2006) and Bélanger and Gilbert (2003).

- 37 -Statistics Canada—Catalogue number 91-551-X
Projections of the Diversity of the Canadian Population, 2006 to 2031
35. Also see Wilkins (2008).
36. This is the source that was used to develop the relative risks for Population projections of visible minoritygroups, Canada, provinces and regions: 2001-2017. Despite its limited sample, it too showed that immigrants’mortality is lower during the first years after they settle in Canada and that it tends, with time spent in Canada,to converge with that of the rest of the population.
37. We say “approximately” because in reality, the average was 7.6 per thousand with extremes of 5.8 per thousand(in 1998) and 9.0 per thousand (in 1992 and 1993).
38. Net emigration is the number of emigrants minus returning emigrants plus net temporary emigration.
39. Before 1991, one of the components of net emigration was not estimated, namely the net number of personstemporarily abroad.
40. They are also consistent with the observations from the Reverse Record Check survey, which were used indeveloping the assumption used for Population Projections of Visible Minority Groups, Canada 2001-2017.
41. It should be noted that a constant geographic structure—the one for 2006—was applied to the database thatwas used to create the medium assumption.
42. See, for example, Dion and Coulombe (2008).
43. See Spielauer (2009).
44. These are Christians other than Catholics, Protestants and Orthodox Christians. This group includes personswho indicate “Christian”, as well as those who indicate “Apostolic,” “Born-again Christian” and “Evangelical”(Statistics Canada, 2003 (1), op. cit.) This group stood out between 1991 and 2001 by the sizable increasein its population.
45. Unless, of course, the information is imputed into the database.
46. See Chui, Tran and Maheux (2007).
47. In this study, persons having a non-Christian religion are those who have a religion (which therefore excludespersons with no religion) other than Catholic, Protestant, Christian Orthodox or Christian not included elsewhere.The projected non-Christian religions are Islam, Judaism, Buddhism, Hinduism, Sikhism and other non-Christianreligions.
48. In the census, data on generation status are collected only from the population aged 15 and over. Data on thepopulation under 15 years of age were imputed into the 2006 Census database for projection purposes, butthose data are not available for 1971. Therefore, comparisons with 1971 concern only the population aged 15and over.
49. In 2006, the main countries of birth of West Asians born outside Canada were Iran and Afghanistan.
50. See Statistics Canada (2003 (2)).
51. See Chui, Tran and Maheux (2007).

- 38 -Statistics Canada—Catalogue number 91-551-X
Projections of the Diversity of the Canadian Population, 2006 to 2031
Bibliography
Aydemir, A., and Chris Robinson. 2006. Return and Onward Migration Among Working Age Men, Statistics Canada Catalogueno. 11F0019, Ottawa.
Bélanger, A., and É. Caron Malenfant. 2005. Population Projections of Visible Minority Groups, Canada, Provinces andRegions, 2001-2017, Statistics Canada Catalogue no. 91-541, Ottawa.
Bélanger, A., É. Caron Malenfant, L. Martel and R. Gélinas. 2008. Projecting ethno-cultural diversity of the Canadian populationusing a microsimulation approach, proceedings of the Joint UNECE/Eurostat Work Session on Demographic Projectionsin Bucharest.
Bélanger, A., and S. Gilbert. 2003. “The fertility of immigrant women and their Canadian-born daughters”, Report on theDemographic Situation in Canada, 2002, Statistics Canada Catalogue no. 91-209, Ottawa.
Caron Malenfant, É., and A. Bélanger. 2006. “The fertility of visible minority women in Canada”, Report on the DemographicSituation in Canada, 2003 and 2004, Statistics Canada Catalogue no. 91-209, Ottawa.
Chen, J., R. Wilkins and E. Ng. 1996. “Health expectancy by immigrant status, 1986 and 1991”, Health Reports, StatisticsCanada Catalogue no. 82-003, volume 8, no. 3, Ottawa.
Cho, L.J., R.D. Retherford and M.K. Choe. 1986. The Own-Children Method of Fertility Estimation, University of HawaiiPress.
Chui, T., K. Tran and H. Maheux. 2007. “Immigration in Canada: A Portrait of the Foreign-born Population, 2006 Census:Findings”, 2006 Analysis series, Statistics Canada Catalogue no. 97-557, Ottawa.
Desplanques, G. 1993. “Mesurer les disparités de fécondité à l’aide du seul recensement”, Population, volume 48, no. 6,p. 2011 to 2024.
Dion, P., and S. Coulombe. 2008. “Portrait of the mobility of Canadians in 2006: Trajectories and characteristics of migrants”,Report on the Demographic Situation in Canada, 2005 and 2006, Statistics Canada Catalogue no. 91-209, Ottawa.
Guimond, É. 1999. “Ethnic mobility and the demographic growth of Canada’s aboriginal populations from 1986 to 1996",Report on the Demographic Situation in Canada, 1998 and 1999, Statistics Canada Catalogue no. 91-209, Ottawa.
Li, N. and R. Lee. 2005. “Coherent Mortality Forecasts for a Group of Populations: An Extension of the Lee-Carter Method”,Demography (Chicago), volume 42, no. 3, p. 575-594.
McQuillan, K. 2004. “When Does Religion Influence Fertility”, Population and Development Review, volume 30, no. 1, NewYork, p. 25-56.
Michalowski, M., and K. Tran. 2008. “Canadians abroad”, Canadian Social Trends, summer 2008, no. 85, Statistics CanadaCatalogue no. 11-008, Ottawa.
Population Reference Bureau. 2009. 2009 World population data sheet, Washington.
Ram, B. 2004. “New Estimates of Aboriginal Fertility 1966-1971 to 1996-2001”, Canadian Population Studies, volume 31,no. 4, Edmonton, p. 179-196.
Spielauer, M. 2009. Ethno-cultural diversity and educational attainment: The modeling of education in the CanadianDemoSim population projection model, paper presented at the Conference of the International MicrosimulationAssociation, June 2009, Ottawa.
Statistics Canada. 2009. Births 2007, Statistics Canada Catalogue no. 84F0210, Ottawa.
Statistics Canada. 2008. “Canada’s Ethnocultural Mosaic, 2006 Census: Findings”, 2006 Analysis series, Statistics CanadaCatalogue no. 97-562, Ottawa.
- 39 -Statistics Canada—Catalogue number 91-551-X
Projections of the Diversity of the Canadian Population, 2006 to 2031
Statistics Canada. 2003. “Religions in Canada”, Analysis Series, 2001 Census, Statistics Canada Catalogue no. 96F0030,Ottawa.
Statistics Canada. 2003. “Longitudinal Survey of Immigrants to Canada, 2001”, The Daily, September 4.
Van Imhoff, E. 1997. “Méthodes de micro-simulation pour des projections de population”, Population, 52nd year, no. 4,p. 889-932.
Wilkins, R., M. Tjepkema, C. Mustard and R. Choinière. 2008. “The Canadian census mortality follow-up study, 1991 through2001”, Health Reports, Statistics Canada Catalogue no. 82-003, volume 19, no. 3, Ottawa.

- 40 -Statistics Canada—Catalogue number 91-551-X
Projections of the Diversity of the Canadian Population, 2006 to 2031
Appendix
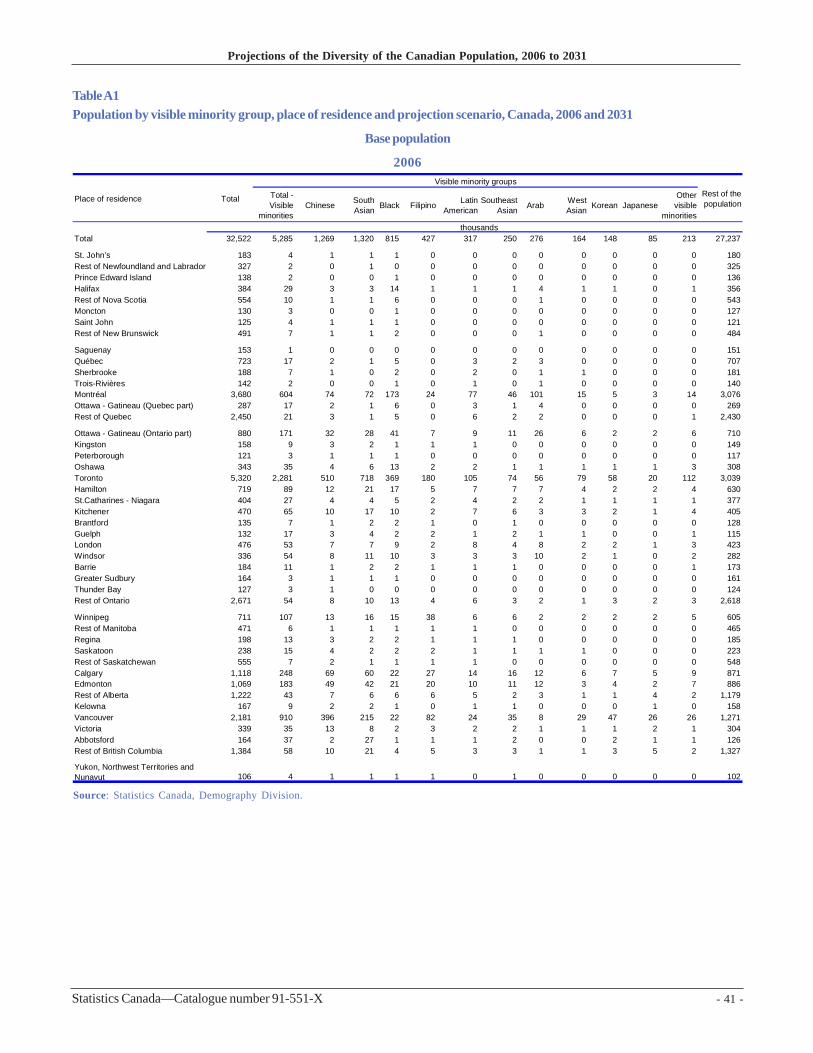
- 41 -Statistics Canada—Catalogue number 91-551-X
Projections of the Diversity of the Canadian Population, 2006 to 2031
Table A1Population by visible minority group, place of residence and projection scenario, Canada, 2006 and 2031
Base population
2006
Source: Statistics Canada, Demography Division.
Total - Visible
minoritiesChinese South
Asian Black Filipino Latin American
Southeast Asian Arab West
Asian Korean JapaneseOther visible
minorities
Total 32,522 5,285 1,269 1,320 815 427 317 250 276 164 148 85 213 27,237
St. John’s 183 4 1 1 1 0 0 0 0 0 0 0 0 180Rest of Newfoundland and Labrador 327 2 0 1 0 0 0 0 0 0 0 0 0 325Prince Edward Island 138 2 0 0 1 0 0 0 0 0 0 0 0 136Halifax 384 29 3 3 14 1 1 1 4 1 1 0 1 356Rest of Nova Scotia 554 10 1 1 6 0 0 0 1 0 0 0 0 543Moncton 130 3 0 0 1 0 0 0 0 0 0 0 0 127Saint John 125 4 1 1 1 0 0 0 0 0 0 0 0 121Rest of New Brunswick 491 7 1 1 2 0 0 0 1 0 0 0 0 484
Saguenay 153 1 0 0 0 0 0 0 0 0 0 0 0 151Québec 723 17 2 1 5 0 3 2 3 0 0 0 0 707Sherbrooke 188 7 1 0 2 0 2 0 1 1 0 0 0 181Trois-Rivières 142 2 0 0 1 0 1 0 1 0 0 0 0 140Montréal 3,680 604 74 72 173 24 77 46 101 15 5 3 14 3,076Ottawa - Gatineau (Quebec part) 287 17 2 1 6 0 3 1 4 0 0 0 0 269Rest of Quebec 2,450 21 3 1 5 0 6 2 2 0 0 0 1 2,430
Ottawa - Gatineau (Ontario part) 880 171 32 28 41 7 9 11 26 6 2 2 6 710Kingston 158 9 3 2 1 1 1 0 0 0 0 0 0 149Peterborough 121 3 1 1 1 0 0 0 0 0 0 0 0 117Oshawa 343 35 4 6 13 2 2 1 1 1 1 1 3 308Toronto 5,320 2,281 510 718 369 180 105 74 56 79 58 20 112 3,039Hamilton 719 89 12 21 17 5 7 7 7 4 2 2 4 630St.Catharines - Niagara 404 27 4 4 5 2 4 2 2 1 1 1 1 377Kitchener 470 65 10 17 10 2 7 6 3 3 2 1 4 405Brantford 135 7 1 2 2 1 0 1 0 0 0 0 0 128Guelph 132 17 3 4 2 2 1 2 1 1 0 0 1 115London 476 53 7 7 9 2 8 4 8 2 2 1 3 423Windsor 336 54 8 11 10 3 3 3 10 2 1 0 2 282Barrie 184 11 1 2 2 1 1 1 0 0 0 0 1 173Greater Sudbury 164 3 1 1 1 0 0 0 0 0 0 0 0 161Thunder Bay 127 3 1 0 0 0 0 0 0 0 0 0 0 124Rest of Ontario 2,671 54 8 10 13 4 6 3 2 1 3 2 3 2,618
Winnipeg 711 107 13 16 15 38 6 6 2 2 2 2 5 605Rest of Manitoba 471 6 1 1 1 1 1 0 0 0 0 0 0 465Regina 198 13 3 2 2 1 1 1 0 0 0 0 0 185Saskatoon 238 15 4 2 2 2 1 1 1 1 0 0 0 223Rest of Saskatchewan 555 7 2 1 1 1 1 0 0 0 0 0 0 548Calgary 1,118 248 69 60 22 27 14 16 12 6 7 5 9 871Edmonton 1,069 183 49 42 21 20 10 11 12 3 4 2 7 886Rest of Alberta 1,222 43 7 6 6 6 5 2 3 1 1 4 2 1,179Kelowna 167 9 2 2 1 0 1 1 0 0 0 1 0 158Vancouver 2,181 910 396 215 22 82 24 35 8 29 47 26 26 1,271Victoria 339 35 13 8 2 3 2 2 1 1 1 2 1 304Abbotsford 164 37 2 27 1 1 1 2 0 0 2 1 1 126Rest of British Columbia 1,384 58 10 21 4 5 3 3 1 1 3 5 2 1,327
Yukon, Northwest Territories and Nunavut 106 4 1 1 1 1 0 1 0 0 0 0 0 102
in thousands
Place of residence Total Rest of the population
Visible minority groups
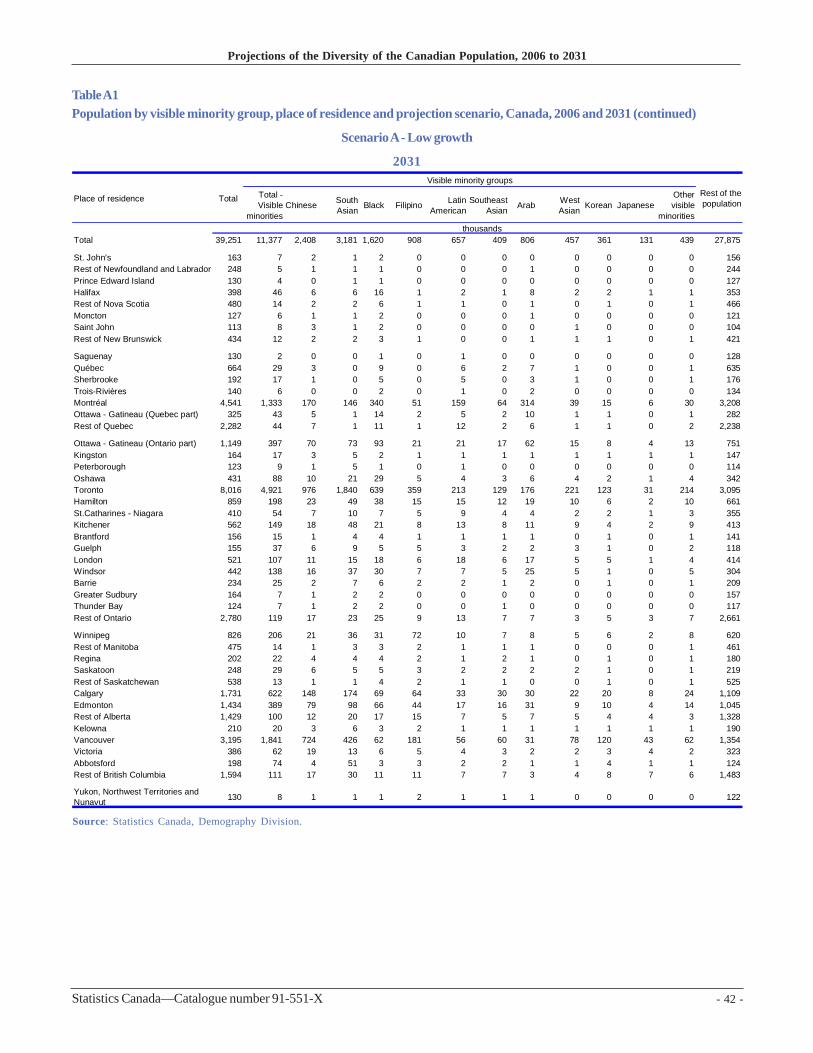
- 42 -Statistics Canada—Catalogue number 91-551-X
Projections of the Diversity of the Canadian Population, 2006 to 2031
Table A1Population by visible minority group, place of residence and projection scenario, Canada, 2006 and 2031 (continued)
Scenario A - Low growth
2031
Source: Statistics Canada, Demography Division.
Total - Visible
minoritiesChinese South
Asian Black Filipino Latin American
Southeast Asian Arab West
Asian Korean JapaneseOther visible
minorities
Total 39,251 11,377 2,408 3,181 1,620 908 657 409 806 457 361 131 439 27,875
St. John’s 163 7 2 1 2 0 0 0 0 0 0 0 0 156Rest of Newfoundland and Labrador 248 5 1 1 1 0 0 0 1 0 0 0 0 244Prince Edward Island 130 4 0 1 1 0 0 0 0 0 0 0 0 127Halifax 398 46 6 6 16 1 2 1 8 2 2 1 1 353Rest of Nova Scotia 480 14 2 2 6 1 1 0 1 0 1 0 1 466Moncton 127 6 1 1 2 0 0 0 1 0 0 0 0 121Saint John 113 8 3 1 2 0 0 0 0 1 0 0 0 104Rest of New Brunswick 434 12 2 2 3 1 0 0 1 1 1 0 1 421
Saguenay 130 2 0 0 1 0 1 0 0 0 0 0 0 128Québec 664 29 3 0 9 0 6 2 7 1 0 0 1 635Sherbrooke 192 17 1 0 5 0 5 0 3 1 0 0 1 176Trois-Rivières 140 6 0 0 2 0 1 0 2 0 0 0 0 134Montréal 4,541 1,333 170 146 340 51 159 64 314 39 15 6 30 3,208Ottawa - Gatineau (Quebec part) 325 43 5 1 14 2 5 2 10 1 1 0 1 282Rest of Quebec 2,282 44 7 1 11 1 12 2 6 1 1 0 2 2,238
Ottawa - Gatineau (Ontario part) 1,149 397 70 73 93 21 21 17 62 15 8 4 13 751Kingston 164 17 3 5 2 1 1 1 1 1 1 1 1 147Peterborough 123 9 1 5 1 0 1 0 0 0 0 0 0 114Oshawa 431 88 10 21 29 5 4 3 6 4 2 1 4 342Toronto 8,016 4,921 976 1,840 639 359 213 129 176 221 123 31 214 3,095Hamilton 859 198 23 49 38 15 15 12 19 10 6 2 10 661St.Catharines - Niagara 410 54 7 10 7 5 9 4 4 2 2 1 3 355Kitchener 562 149 18 48 21 8 13 8 11 9 4 2 9 413Brantford 156 15 1 4 4 1 1 1 1 0 1 0 1 141Guelph 155 37 6 9 5 5 3 2 2 3 1 0 2 118London 521 107 11 15 18 6 18 6 17 5 5 1 4 414Windsor 442 138 16 37 30 7 7 5 25 5 1 0 5 304Barrie 234 25 2 7 6 2 2 1 2 0 1 0 1 209Greater Sudbury 164 7 1 2 2 0 0 0 0 0 0 0 0 157Thunder Bay 124 7 1 2 2 0 0 1 0 0 0 0 0 117Rest of Ontario 2,780 119 17 23 25 9 13 7 7 3 5 3 7 2,661
Winnipeg 826 206 21 36 31 72 10 7 8 5 6 2 8 620Rest of Manitoba 475 14 1 3 3 2 1 1 1 0 0 0 1 461Regina 202 22 4 4 4 2 1 2 1 0 1 0 1 180Saskatoon 248 29 6 5 5 3 2 2 2 2 1 0 1 219Rest of Saskatchewan 538 13 1 1 4 2 1 1 0 0 1 0 1 525Calgary 1,731 622 148 174 69 64 33 30 30 22 20 8 24 1,109Edmonton 1,434 389 79 98 66 44 17 16 31 9 10 4 14 1,045Rest of Alberta 1,429 100 12 20 17 15 7 5 7 5 4 4 3 1,328Kelowna 210 20 3 6 3 2 1 1 1 1 1 1 1 190Vancouver 3,195 1,841 724 426 62 181 56 60 31 78 120 43 62 1,354Victoria 386 62 19 13 6 5 4 3 2 2 3 4 2 323Abbotsford 198 74 4 51 3 3 2 2 1 1 4 1 1 124Rest of British Columbia 1,594 111 17 30 11 11 7 7 3 4 8 7 6 1,483
Yukon, Northwest Territories and Nunavut 130 8 1 1 1 2 1 1 1 0 0 0 0 122
in thousands
Place of residence Total Rest of the population
Visible minority groups

- 43 -Statistics Canada—Catalogue number 91-551-X
Projections of the Diversity of the Canadian Population, 2006 to 2031
Table A1Population by visible minority group, place of residence and projection scenario, Canada, 2006 and 2031 (continued)
Scenario B - Reference scenario
2031
Source: Statistics Canada, Demography Division.
Total - Visible
minoritiesChinese South
Asian Black Filipino Latin American
Southeast Asian Arab West
Asian Korean JapaneseOther visible
minorities
Total 42,078 12,855 2,714 3,640 1,809 1,020 733 449 930 523 407 142 489 29,222
St. John’s 169 8 2 1 2 0 1 0 1 0 0 0 0 161Rest of Newfoundland and Labrador 258 5 1 1 1 0 0 0 1 0 0 0 0 252Prince Edward Island 136 4 0 1 1 0 0 0 0 0 0 0 0 132Halifax 418 52 7 7 18 1 2 1 10 2 2 1 1 366Rest of Nova Scotia 501 16 2 2 7 1 1 1 1 1 1 0 1 486Moncton 132 7 1 1 3 0 0 0 1 0 0 0 0 125Saint John 117 9 3 1 2 0 0 0 0 1 0 0 0 108Rest of New Brunswick 451 14 2 3 3 1 0 1 1 1 1 0 1 437
Saguenay 135 3 0 0 1 0 1 0 0 0 0 0 0 132Québec 692 34 4 0 10 0 7 2 8 1 1 0 1 658Sherbrooke 203 20 1 0 6 0 5 0 4 1 0 0 1 183Trois-Rivières 145 7 0 0 2 0 1 0 2 0 0 0 0 139Montréal 4,900 1,521 198 170 381 56 179 70 367 44 16 7 34 3,380Ottawa - Gatineau (Quebec part) 342 49 6 1 16 2 6 3 11 2 1 0 1 294Rest of Quebec 2,378 51 8 2 13 1 14 3 7 1 1 0 2 2,327
Ottawa - Gatineau (Ontario part) 1,232 447 79 82 103 23 24 19 71 18 9 4 15 786Kingston 172 19 3 5 2 1 1 1 2 1 1 1 1 153Peterborough 128 10 1 5 2 0 1 0 0 0 0 0 0 118Oshawa 455 97 11 24 31 5 4 3 7 4 2 1 5 359Toronto 8,868 5,572 1,102 2,115 708 404 235 143 202 254 138 33 238 3,296Hamilton 921 226 26 56 43 17 16 13 22 11 7 2 12 695St.Catharines - Niagara 433 62 8 12 8 6 11 4 5 2 2 1 3 372Kitchener 603 170 20 55 24 9 14 9 13 10 4 2 9 434Brantford 164 16 1 5 4 1 1 1 1 0 1 0 1 148Guelph 165 42 7 10 5 5 3 3 2 3 1 0 2 123London 554 121 13 17 20 7 21 6 20 6 6 1 4 432Windsor 476 156 18 43 33 8 8 6 29 5 1 0 5 320Barrie 246 28 3 8 7 3 2 1 2 0 1 0 1 218Greater Sudbury 170 8 2 2 2 0 0 0 0 0 0 0 0 162Thunder Bay 131 9 2 2 2 0 0 1 0 0 0 0 0 122Rest of Ontario 2,908 133 20 26 27 10 14 8 8 4 5 3 8 2,775
Winnipeg 884 235 23 42 36 82 12 8 9 6 7 2 9 649Rest of Manitoba 507 15 1 3 4 2 2 1 1 1 0 0 1 492Regina 211 25 5 4 5 2 1 2 1 0 1 0 1 187Saskatoon 262 33 7 6 6 3 2 2 2 2 1 0 2 229Rest of Saskatchewan 570 14 1 2 4 2 1 1 1 0 1 0 1 556Calgary 1,864 703 166 199 78 72 37 33 34 25 23 9 27 1,161Edmonton 1,529 437 88 111 75 50 18 18 34 10 12 5 16 1,092Rest of Alberta 1,510 115 14 23 20 16 9 6 8 6 4 5 4 1,395Kelowna 219 22 3 7 3 2 1 1 1 1 1 1 1 198Vancouver 3,483 2,061 809 478 69 204 62 65 35 89 136 47 68 1,422Victoria 406 69 21 14 6 6 5 3 2 2 3 4 3 337Abbotsford 214 83 5 59 3 3 2 2 1 1 5 1 2 130Rest of British Columbia 1,674 122 18 32 12 13 7 8 3 5 9 7 7 1,552
Yukon, Northwest Territories and Nunavut 139 9 1 2 2 2 1 1 1 0 0 0 0 130
in thousands
Place of residence Total Rest of the population
Visible minority groups

- 44 -Statistics Canada—Catalogue number 91-551-X
Projections of the Diversity of the Canadian Population, 2006 to 2031
Table A1Population by visible minority group, place of residence and projection scenario, Canada, 2006 and 2031 (continued)
Scenario C - High growth
2031
Source: Statistics Canada, Demography Division.
Total - Visible
minoritiesChinese South
Asian Black Filipino Latin American
Southeast Asian Arab West
Asian Korean JapaneseOther visible
minorities
Total 45,008 14,434 3,038 4,136 2,012 1,139 814 491 1,062 592 455 153 541 30,575
St. John’s 175 9 2 2 3 0 1 0 1 0 0 0 0 166Rest of Newfoundland and Labrador 267 6 1 1 1 0 1 0 1 0 0 0 0 261Prince Edward Island 141 5 1 1 2 0 0 0 0 0 1 0 0 136Halifax 438 58 8 8 19 1 2 2 12 2 2 1 2 380Rest of Nova Scotia 522 17 3 2 7 1 1 1 1 1 1 0 1 505Moncton 136 8 1 1 3 0 0 0 1 1 0 0 0 129Saint John 121 10 4 1 2 0 0 0 0 1 0 0 0 111Rest of New Brunswick 469 16 3 3 4 1 0 1 1 1 2 0 1 453
Saguenay 140 3 0 0 1 0 1 0 0 0 0 0 0 137Québec 719 40 4 1 11 0 8 2 9 2 1 0 1 679Sherbrooke 213 23 1 0 7 0 6 0 5 1 0 0 1 190Trois-Rivières 151 8 1 0 2 0 2 0 2 0 0 0 0 144Montréal 5,275 1,722 228 195 426 62 199 76 422 50 18 7 39 3,554Ottawa - Gatineau (Quebec part) 360 55 7 1 18 2 7 3 13 2 1 0 2 306Rest of Quebec 2,472 58 9 2 15 1 16 3 8 1 1 1 2 2,414
Ottawa - Gatineau (Ontario part) 1,319 499 89 93 115 26 26 20 80 20 10 4 16 820Kingston 180 21 4 6 3 1 1 1 2 1 1 1 1 159Peterborough 134 12 1 6 2 0 1 0 0 0 0 0 0 122Oshawa 480 106 12 26 34 6 4 4 8 5 2 1 5 374Toronto 9,764 6,266 1,235 2,415 780 451 259 157 229 288 154 36 263 3,498Hamilton 984 256 29 65 48 19 19 15 26 13 8 2 13 728St.Catharines - Niagara 456 69 9 13 9 6 12 4 6 3 2 1 4 386Kitchener 647 193 23 63 27 10 16 10 15 12 5 2 10 455Brantford 172 18 1 6 4 1 1 1 1 0 1 0 1 154Guelph 177 47 8 12 6 6 3 3 2 3 1 0 2 130London 589 138 15 20 23 8 24 6 24 7 7 1 5 450Windsor 512 175 20 48 36 8 9 6 33 6 2 0 6 337Barrie 257 31 3 9 7 3 2 1 2 1 1 1 2 226Greater Sudbury 177 9 2 2 3 0 0 0 0 0 0 0 0 168Thunder Bay 136 10 2 2 2 1 0 1 1 0 0 0 0 126Rest of Ontario 3,037 147 22 30 30 11 15 9 9 4 6 3 9 2,890
Winnipeg 945 265 26 48 41 92 13 8 11 6 8 2 10 680Rest of Manitoba 543 18 1 4 4 3 2 1 1 1 0 0 1 526Regina 222 28 6 5 6 3 2 2 1 1 2 0 1 194Saskatoon 277 37 8 7 7 4 2 2 2 2 1 0 2 240Rest of Saskatchewan 608 16 2 2 5 2 1 1 1 0 1 0 1 591Calgary 2,003 789 187 225 89 80 41 36 39 28 26 9 30 1,214Edmonton 1,627 487 97 126 83 57 20 19 38 12 13 5 17 1,140Rest of Alberta 1,592 130 15 27 23 19 10 7 9 7 5 5 5 1,462Kelowna 230 24 4 7 4 2 1 2 1 1 1 1 1 206Vancouver 3,783 2,292 899 532 77 227 68 71 39 100 152 50 75 1,491Victoria 426 76 23 15 7 6 5 3 2 2 4 5 3 351Abbotsford 231 94 5 66 4 3 3 2 1 1 5 2 2 137Rest of British Columbia 1,753 134 20 36 13 14 8 9 4 6 10 8 8 1,619
Yukon, Northwest Territories and Nunavut 149 10 1 2 2 2 1 1 1 0 0 0 0 138
in thousands
Place of residence Total Rest of the population
Visible minority groups

- 45 -Statistics Canada—Catalogue number 91-551-X
Projections of the Diversity of the Canadian Population, 2006 to 2031
Table A1Population by visible minority group, place of residence and projection scenario, Canada, 2006 and 2031 (continued)
Scenario D - Alternative internal migration
2031
Source: Statistics Canada, Demography Division.
Total - Visible
minoritiesChinese South
Asian Black Filipino Latin American
Southeast Asian Arab West
Asian Korean JapaneseOther visible
minorities
Total 42,079 12,854 2,713 3,639 1,809 1,020 733 449 930 523 407 142 489 29,226
St. John’s 181 11 2 2 3 0 1 0 1 0 0 0 0 170Rest of Newfoundland and Labrador 252 6 1 1 2 0 1 0 1 0 0 0 0 246Prince Edward Island 135 4 0 1 1 0 0 0 0 0 0 0 0 131Halifax 409 48 7 5 17 1 2 1 8 3 2 1 2 361Rest of Nova Scotia 502 18 3 3 7 1 1 1 1 1 1 0 1 483Moncton 130 7 1 2 3 0 0 0 1 1 0 0 0 123Saint John 118 7 3 1 1 0 0 0 0 1 0 0 0 111Rest of New Brunswick 452 20 3 4 4 1 1 1 1 1 2 0 1 432
Saguenay 127 2 0 0 1 0 1 0 0 0 0 0 0 125Québec 717 32 3 1 10 0 4 2 8 2 0 0 1 684Sherbrooke 212 27 2 1 9 0 7 1 5 1 0 0 1 185Trois-Rivières 144 9 0 0 3 0 2 0 2 0 0 0 0 135Montréal 4,640 1,424 179 148 359 54 163 66 360 39 16 7 34 3,215Ottawa - Gatineau (Quebec part) 376 64 8 2 22 2 7 3 13 2 1 0 2 312Rest of Quebec 2,517 62 9 1 17 2 17 4 7 2 1 0 2 2,455
Ottawa - Gatineau (Ontario part) 1,113 358 61 66 82 17 18 13 64 14 7 3 12 755Kingston 164 16 3 4 2 1 2 1 1 1 1 1 1 147Peterborough 135 11 1 6 2 0 1 0 0 0 0 0 0 124Oshawa 504 134 13 40 40 5 5 4 12 6 3 1 5 370Toronto 8,452 5,343 1,076 2,026 665 394 225 144 187 237 130 32 227 3,109Hamilton 941 247 30 63 48 17 17 13 23 13 8 2 12 694St.Catharines - Niagara 445 76 9 16 12 5 15 4 4 3 2 1 4 369Kitchener 622 186 25 65 25 9 14 9 14 11 4 2 8 436Brantford 159 20 2 7 4 1 1 1 1 1 1 0 1 139Guelph 172 48 8 13 6 5 4 3 2 3 2 0 2 125London 586 137 15 18 23 7 24 8 23 7 5 2 6 448Windsor 494 174 18 53 38 7 8 6 32 4 3 0 6 320Barrie 254 30 3 8 7 3 2 1 3 1 1 0 2 224Greater Sudbury 182 6 1 2 1 0 0 0 0 0 0 0 0 176Thunder Bay 131 9 2 2 2 1 0 1 0 0 0 0 0 121Rest of Ontario 3,087 192 27 41 37 15 21 9 11 9 7 3 12 2,895
Winnipeg 897 259 29 45 39 86 11 11 11 8 7 2 10 638Rest of Manitoba 536 22 2 4 4 4 2 1 1 1 1 0 1 514Regina 226 28 6 6 6 2 1 2 1 0 2 0 1 197Saskatoon 273 37 9 7 6 3 2 2 2 2 1 0 2 235Rest of Saskatchewan 566 19 3 3 4 2 1 1 1 1 1 0 1 547Calgary 1,897 744 172 211 84 76 35 38 41 29 22 9 28 1,152Edmonton 1,592 473 88 127 85 52 20 18 39 12 11 4 17 1,119Rest of Alberta 1,545 130 15 29 24 17 13 6 7 4 5 5 5 1,415Kelowna 230 26 4 9 3 2 2 2 1 1 1 1 1 203Vancouver 3,484 2,061 817 483 74 198 63 59 33 91 131 46 67 1,422Victoria 413 76 23 15 7 7 5 3 2 2 5 4 3 337Abbotsford 213 88 5 63 2 2 2 2 1 1 6 1 2 125Rest of British Columbia 1,710 146 23 33 16 17 10 10 3 4 14 7 8 1,565
Yukon, Northwest Territories and Nunavut 148 14 2 2 2 3 1 1 1 1 0 0 0 134
in thousands
Place of residence Total Rest of the population
Visible minority groups

- 46 -Statistics Canada—Catalogue number 91-551-X
Projections of the Diversity of the Canadian Population, 2006 to 2031
Table A1Population by visible minority group, place of residence and projection scenario, Canada, 2006 and 2031 (end)
Scenario E- Alternative immigration
2031
Source: Statistics Canada, Demography Division.
Total - Visible
minoritiesChinese South
Asian Black Filipino Latin American
Southeast Asian Arab West
Asian Korean JapaneseOther visible
minorities
Total 42,099 12,833 2,457 3,361 1,906 1,267 818 481 987 495 398 150 512 29,266
St. John’s 169 8 2 1 2 0 1 0 1 0 0 0 0 161Rest of Newfoundland and Labrador 258 5 1 1 1 0 0 0 1 0 0 0 0 253Prince Edward Island 136 4 0 1 2 0 0 0 0 0 0 0 0 132Halifax 421 52 6 6 18 1 2 2 11 2 2 1 2 369Rest of Nova Scotia 504 16 2 2 7 1 1 1 1 0 1 0 1 488Moncton 132 7 0 1 3 0 0 0 1 0 0 0 0 125Saint John 117 9 3 1 2 1 0 0 0 1 0 0 0 108Rest of New Brunswick 453 14 2 3 3 1 0 1 1 1 1 0 1 439
Saguenay 135 3 0 0 1 0 1 0 0 0 0 0 0 133Québec 695 37 3 0 11 0 8 2 9 1 1 0 1 658Sherbrooke 205 21 1 0 6 0 6 0 4 1 0 0 1 183Trois-Rivières 146 7 0 0 2 0 2 0 2 0 0 0 0 139Montréal 4,938 1,569 171 152 413 67 200 75 389 41 16 7 37 3,369Ottawa - Gatineau (Quebec part) 345 51 5 1 17 2 6 3 12 1 1 0 2 294Rest of Quebec 2,383 53 7 2 14 1 15 3 7 1 1 1 2 2,330
Ottawa - Gatineau (Ontario part) 1,240 452 72 77 109 28 26 20 74 17 9 4 16 788Kingston 173 19 3 5 2 1 1 1 2 1 1 1 1 154Peterborough 129 10 1 5 2 0 1 0 0 0 0 0 0 118Oshawa 457 97 10 22 32 6 4 3 7 4 2 1 5 360Toronto 8,741 5,469 991 1,939 750 502 262 149 217 242 135 35 245 3,272Hamilton 924 228 23 51 44 21 18 14 24 11 7 2 12 696St.Catharines - Niagara 436 63 7 11 8 7 12 4 5 2 2 1 3 373Kitchener 601 167 18 50 24 11 16 9 13 9 4 2 10 434Brantford 164 17 1 5 4 1 1 1 1 0 1 0 1 148Guelph 166 42 6 9 5 6 3 3 2 3 1 0 2 124London 559 125 12 16 21 8 24 6 21 6 6 1 4 434Windsor 475 157 16 40 34 9 9 6 30 5 1 0 6 318Barrie 247 28 2 7 7 3 2 1 2 0 1 0 1 219Greater Sudbury 170 8 1 2 2 0 0 0 0 0 0 0 0 162Thunder Bay 131 9 1 2 2 1 0 1 1 0 0 0 0 122Rest of Ontario 2,917 134 18 24 28 12 15 8 8 4 5 3 8 2,783
Winnipeg 907 256 21 39 37 104 13 8 10 5 7 2 10 652Rest of Manitoba 513 16 1 3 4 3 2 1 1 0 0 0 1 497Regina 211 24 5 4 5 3 2 2 1 0 1 0 1 187Saskatoon 262 33 7 5 6 4 2 2 2 2 1 0 2 230Rest of Saskatchewan 572 15 1 1 5 3 1 1 0 0 1 0 1 557Calgary 1,863 696 150 182 78 89 40 36 36 23 22 9 29 1,166Edmonton 1,538 442 81 103 77 64 20 19 36 9 11 5 17 1,096Rest of Alberta 1,520 118 13 21 20 20 9 7 8 6 4 5 4 1,402Kelowna 221 22 3 6 3 2 1 2 1 1 1 1 1 199Vancouver 3,475 2,043 744 456 70 254 69 72 37 86 133 49 72 1,432Victoria 411 70 19 13 7 7 6 3 2 2 3 4 3 341Abbotsford 212 81 4 56 3 3 2 2 1 1 5 2 2 131Rest of British Columbia 1,687 126 18 31 12 15 8 9 4 5 8 7 8 1,562
Yukon, Northwest Territories and Nunavut 140 10 1 1 2 2 1 1 1 0 0 0 0 130
in thousands
Place of residence Total Rest of the population
Visible minority groups
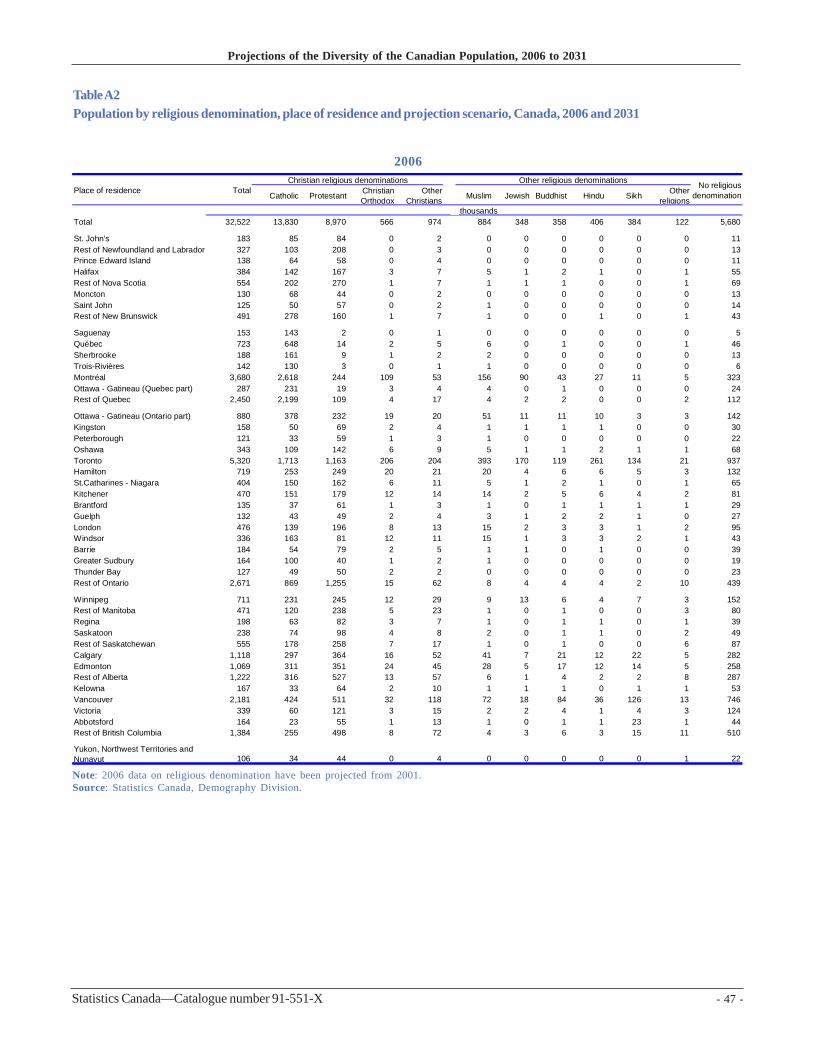
- 47 -Statistics Canada—Catalogue number 91-551-X
Projections of the Diversity of the Canadian Population, 2006 to 2031
Table A2Population by religious denomination, place of residence and projection scenario, Canada, 2006 and 2031
2006
Note: 2006 data on religious denomination have been projected from 2001.Source: Statistics Canada, Demography Division.
Catholic Protestant Christian Orthodox
Other Christians Muslim Jewish Buddhist Hindu Sikh Other
religions
Total 32,522 13,830 8,970 566 974 884 348 358 406 384 122 5,680
St. John’s 183 85 84 0 2 0 0 0 0 0 0 11Rest of Newfoundland and Labrador 327 103 208 0 3 0 0 0 0 0 0 13Prince Edward Island 138 64 58 0 4 0 0 0 0 0 0 11Halifax 384 142 167 3 7 5 1 2 1 0 1 55Rest of Nova Scotia 554 202 270 1 7 1 1 1 0 0 1 69Moncton 130 68 44 0 2 0 0 0 0 0 0 13Saint John 125 50 57 0 2 1 0 0 0 0 0 14Rest of New Brunswick 491 278 160 1 7 1 0 0 1 0 1 43
Saguenay 153 143 2 0 1 0 0 0 0 0 0 5Québec 723 648 14 2 5 6 0 1 0 0 1 46Sherbrooke 188 161 9 1 2 2 0 0 0 0 0 13Trois-Rivières 142 130 3 0 1 1 0 0 0 0 0 6Montréal 3,680 2,618 244 109 53 156 90 43 27 11 5 323Ottawa - Gatineau (Quebec part) 287 231 19 3 4 4 0 1 0 0 0 24Rest of Quebec 2,450 2,199 109 4 17 4 2 2 0 0 2 112
Ottawa - Gatineau (Ontario part) 880 378 232 19 20 51 11 11 10 3 3 142Kingston 158 50 69 2 4 1 1 1 1 0 0 30Peterborough 121 33 59 1 3 1 0 0 0 0 0 22Oshawa 343 109 142 6 9 5 1 1 2 1 1 68Toronto 5,320 1,713 1,163 206 204 393 170 119 261 134 21 937Hamilton 719 253 249 20 21 20 4 6 6 5 3 132St.Catharines - Niagara 404 150 162 6 11 5 1 2 1 0 1 65Kitchener 470 151 179 12 14 14 2 5 6 4 2 81Brantford 135 37 61 1 3 1 0 1 1 1 1 29Guelph 132 43 49 2 4 3 1 2 2 1 0 27London 476 139 196 8 13 15 2 3 3 1 2 95Windsor 336 163 81 12 11 15 1 3 3 2 1 43Barrie 184 54 79 2 5 1 1 0 1 0 0 39Greater Sudbury 164 100 40 1 2 1 0 0 0 0 0 19Thunder Bay 127 49 50 2 2 0 0 0 0 0 0 23Rest of Ontario 2,671 869 1,255 15 62 8 4 4 4 2 10 439
Winnipeg 711 231 245 12 29 9 13 6 4 7 3 152Rest of Manitoba 471 120 238 5 23 1 0 1 0 0 3 80Regina 198 63 82 3 7 1 0 1 1 0 1 39Saskatoon 238 74 98 4 8 2 0 1 1 0 2 49Rest of Saskatchewan 555 178 258 7 17 1 0 1 0 0 6 87Calgary 1,118 297 364 16 52 41 7 21 12 22 5 282Edmonton 1,069 311 351 24 45 28 5 17 12 14 5 258Rest of Alberta 1,222 316 527 13 57 6 1 4 2 2 8 287Kelowna 167 33 64 2 10 1 1 1 0 1 1 53Vancouver 2,181 424 511 32 118 72 18 84 36 126 13 746Victoria 339 60 121 3 15 2 2 4 1 4 3 124Abbotsford 164 23 55 1 13 1 0 1 1 23 1 44Rest of British Columbia 1,384 255 498 8 72 4 3 6 3 15 11 510
Yukon, Northwest Territories and Nunavut 106 34 44 0 4 0 0 0 0 0 1 22
Place of residence
in thousands
TotalChristian religious denominations Other religious denominations No religious
denomination

- 48 -Statistics Canada—Catalogue number 91-551-X
Projections of the Diversity of the Canadian Population, 2006 to 2031
Table A2Population by religious denomination, place of residence and projection scenario, Canada, 2006 and 2031 (continued)
Scenario A - Low growth
2031
Source: Statistics Canada, Demography Division.
Catholic Protestant Christian Orthodox
Other Christians Muslim Jewish Buddhist Hindu Sikh Other
religions
Total 39,251 14,589 8,513 873 1,800 2,472 391 549 897 792 170 8,206
St. John’s 163 66 69 1 4 1 0 0 1 0 0 20Rest of Newfoundland and Labrador 248 86 126 1 6 1 0 0 0 0 0 28Prince Edward Island 130 58 47 1 5 1 0 0 0 0 0 18Halifax 398 141 142 5 13 13 2 3 3 1 1 77Rest of Nova Scotia 480 179 190 3 14 3 1 1 1 1 1 86Moncton 127 63 37 1 4 2 0 0 0 0 0 19Saint John 113 43 42 1 3 1 0 0 0 0 0 20Rest of New Brunswick 434 230 121 2 12 3 1 1 1 1 1 61
Saguenay 130 111 5 0 2 1 0 0 0 0 0 10Québec 664 535 30 3 13 13 0 1 1 0 1 67Sherbrooke 192 146 13 2 4 6 1 0 0 0 0 20Trois-Rivières 140 115 6 1 3 2 0 0 0 0 0 12Montréal 4,541 2,580 389 153 131 464 86 56 47 28 8 600Ottawa - Gatineau (Quebec part) 325 220 31 5 9 13 1 2 1 0 1 42Rest of Quebec 2,282 1,834 143 11 45 17 4 3 2 1 3 218
Ottawa - Gatineau (Ontario part) 1,149 406 245 32 49 122 12 17 23 10 5 228Kingston 164 56 55 3 7 4 1 1 1 1 1 35Peterborough 123 39 44 2 5 3 1 0 2 1 1 27Oshawa 431 140 131 11 20 19 3 3 7 4 1 93Toronto 8,016 2,087 1,249 296 409 1,087 181 188 564 305 37 1,612Hamilton 859 289 225 28 40 55 5 10 14 10 3 180St.Catharines - Niagara 410 145 129 10 18 12 1 3 4 2 1 84Kitchener 562 173 153 19 25 40 3 7 15 10 3 114Brantford 156 49 53 3 7 4 1 1 1 1 1 35Guelph 155 49 44 4 7 7 1 2 3 2 1 34London 521 166 161 12 23 31 2 4 6 2 2 112Windsor 442 159 98 15 24 41 3 5 12 6 1 79Barrie 234 78 75 6 10 6 2 1 2 1 1 53Greater Sudbury 164 82 41 2 6 2 1 0 1 0 1 29Thunder Bay 124 44 42 2 5 2 0 1 1 0 1 28Rest of Ontario 2,780 976 975 43 112 34 9 10 10 6 12 593
Winnipeg 826 261 240 15 49 25 12 8 9 14 4 189Rest of Manitoba 475 132 187 5 28 4 1 1 1 1 4 111Regina 202 63 70 3 10 3 0 2 1 1 1 47Saskatoon 248 77 84 4 12 4 1 2 2 1 2 58Rest of Saskatchewan 538 175 192 5 25 3 1 1 1 1 9 125Calgary 1,731 462 438 34 103 112 9 32 36 59 7 439Edmonton 1,434 401 396 28 81 70 9 22 27 31 8 362Rest of Alberta 1,429 407 484 19 86 24 3 7 6 7 10 376Kelowna 210 50 65 3 14 4 1 2 1 3 1 66Vancouver 3,195 676 569 55 207 180 21 131 75 217 18 1,045Victoria 386 89 111 6 25 8 2 6 3 6 3 128Abbotsford 198 37 44 2 12 5 1 2 4 38 1 51Rest of British Columbia 1,594 374 474 19 107 19 7 11 7 18 13 544
Yukon, Northwest Territories and Nunavut 130 41 47 1 6 1 0 1 0 0 1 31
Place of residence
in thousands
TotalChristian religious denominations Other religious denominations No religious
denomination
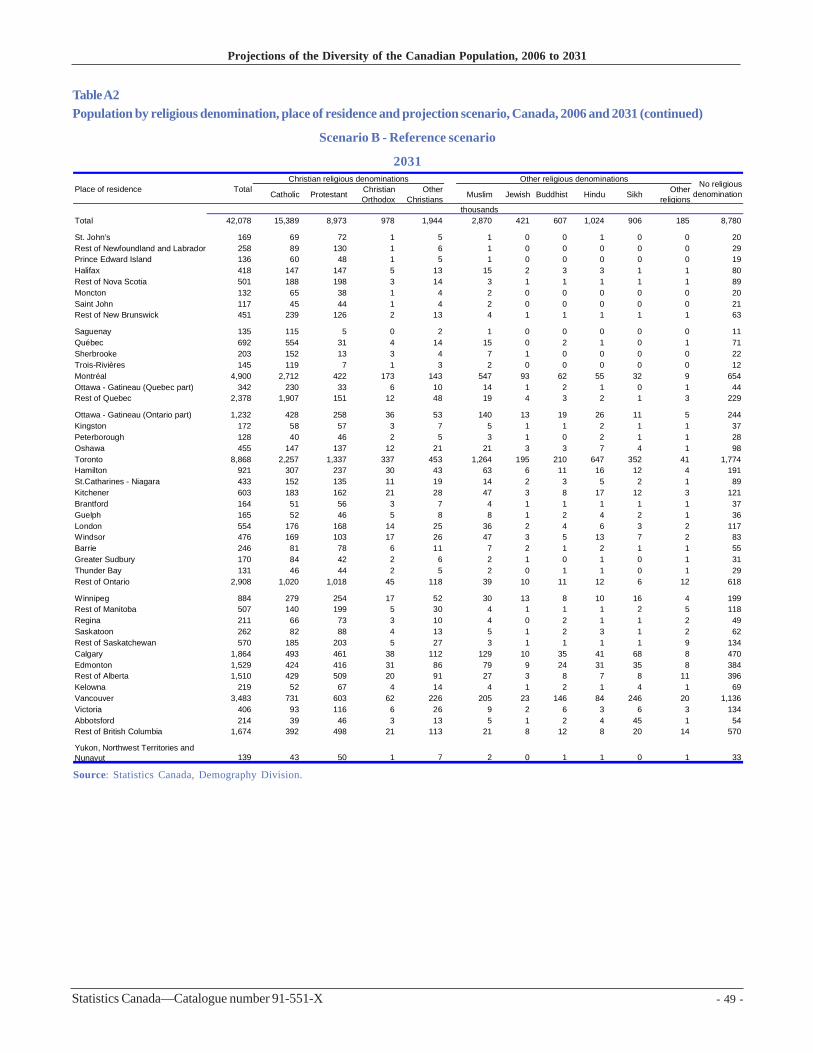
- 49 -Statistics Canada—Catalogue number 91-551-X
Projections of the Diversity of the Canadian Population, 2006 to 2031
Table A2Population by religious denomination, place of residence and projection scenario, Canada, 2006 and 2031 (continued)
Scenario B - Reference scenario
2031
Source: Statistics Canada, Demography Division.
Catholic Protestant Christian Orthodox
Other Christians Muslim Jewish Buddhist Hindu Sikh Other
religions
Total 42,078 15,389 8,973 978 1,944 2,870 421 607 1,024 906 185 8,780
St. John’s 169 69 72 1 5 1 0 0 1 0 0 20Rest of Newfoundland and Labrador 258 89 130 1 6 1 0 0 0 0 0 29Prince Edward Island 136 60 48 1 5 1 0 0 0 0 0 19Halifax 418 147 147 5 13 15 2 3 3 1 1 80Rest of Nova Scotia 501 188 198 3 14 3 1 1 1 1 1 89Moncton 132 65 38 1 4 2 0 0 0 0 0 20Saint John 117 45 44 1 4 2 0 0 0 0 0 21Rest of New Brunswick 451 239 126 2 13 4 1 1 1 1 1 63
Saguenay 135 115 5 0 2 1 0 0 0 0 0 11Québec 692 554 31 4 14 15 0 2 1 0 1 71Sherbrooke 203 152 13 3 4 7 1 0 0 0 0 22Trois-Rivières 145 119 7 1 3 2 0 0 0 0 0 12Montréal 4,900 2,712 422 173 143 547 93 62 55 32 9 654Ottawa - Gatineau (Quebec part) 342 230 33 6 10 14 1 2 1 0 1 44Rest of Quebec 2,378 1,907 151 12 48 19 4 3 2 1 3 229
Ottawa - Gatineau (Ontario part) 1,232 428 258 36 53 140 13 19 26 11 5 244Kingston 172 58 57 3 7 5 1 1 2 1 1 37Peterborough 128 40 46 2 5 3 1 0 2 1 1 28Oshawa 455 147 137 12 21 21 3 3 7 4 1 98Toronto 8,868 2,257 1,337 337 453 1,264 195 210 647 352 41 1,774Hamilton 921 307 237 30 43 63 6 11 16 12 4 191St.Catharines - Niagara 433 152 135 11 19 14 2 3 5 2 1 89Kitchener 603 183 162 21 28 47 3 8 17 12 3 121Brantford 164 51 56 3 7 4 1 1 1 1 1 37Guelph 165 52 46 5 8 8 1 2 4 2 1 36London 554 176 168 14 25 36 2 4 6 3 2 117Windsor 476 169 103 17 26 47 3 5 13 7 2 83Barrie 246 81 78 6 11 7 2 1 2 1 1 55Greater Sudbury 170 84 42 2 6 2 1 0 1 0 1 31Thunder Bay 131 46 44 2 5 2 0 1 1 0 1 29Rest of Ontario 2,908 1,020 1,018 45 118 39 10 11 12 6 12 618
Winnipeg 884 279 254 17 52 30 13 8 10 16 4 199Rest of Manitoba 507 140 199 5 30 4 1 1 1 2 5 118Regina 211 66 73 3 10 4 0 2 1 1 2 49Saskatoon 262 82 88 4 13 5 1 2 3 1 2 62Rest of Saskatchewan 570 185 203 5 27 3 1 1 1 1 9 134Calgary 1,864 493 461 38 112 129 10 35 41 68 8 470Edmonton 1,529 424 416 31 86 79 9 24 31 35 8 384Rest of Alberta 1,510 429 509 20 91 27 3 8 7 8 11 396Kelowna 219 52 67 4 14 4 1 2 1 4 1 69Vancouver 3,483 731 603 62 226 205 23 146 84 246 20 1,136Victoria 406 93 116 6 26 9 2 6 3 6 3 134Abbotsford 214 39 46 3 13 5 1 2 4 45 1 54Rest of British Columbia 1,674 392 498 21 113 21 8 12 8 20 14 570
Yukon, Northwest Territories and Nunavut 139 43 50 1 7 2 0 1 1 0 1 33
Place of residence
in thousands
TotalChristian religious denominations Other religious denominations No religious
denomination

- 50 -Statistics Canada—Catalogue number 91-551-X
Projections of the Diversity of the Canadian Population, 2006 to 2031
Table A2Population by religious denomination, place of residence and projection scenario, Canada, 2006 and 2031 (continued)
Scenario C - High growth
2031
Source: Statistics Canada, Demography Division.
Catholic Protestant Christian Orthodox
Other Christians Muslim Jewish Buddhist Hindu Sikh Other
religions
Total 45,008 16,202 9,440 1,089 2,096 3,297 450 668 1,162 1,030 201 9,374
St. John’s 175 71 74 1 5 1 0 0 1 0 0 21Rest of Newfoundland and Labrador 267 92 135 1 6 1 0 0 0 0 0 30Prince Edward Island 141 62 50 1 5 1 0 0 0 0 0 20Halifax 438 153 153 6 14 17 2 3 3 1 1 84Rest of Nova Scotia 522 196 206 3 15 3 2 1 1 1 1 92Moncton 136 68 40 1 4 2 0 1 1 0 0 20Saint John 121 46 45 1 4 2 0 0 0 0 0 21Rest of New Brunswick 469 247 130 2 14 4 1 1 2 1 1 66
Saguenay 140 118 6 0 3 1 0 0 0 0 0 11Québec 719 572 33 4 14 18 0 2 1 0 1 75Sherbrooke 213 158 15 3 4 9 1 0 0 0 0 23Trois-Rivières 151 124 7 1 3 3 0 0 0 0 0 13Montréal 5,275 2,848 456 194 156 634 100 68 62 37 9 710Ottawa - Gatineau (Quebec part) 360 239 36 7 10 16 1 2 1 1 1 47Rest of Quebec 2,472 1,975 159 13 50 22 4 4 2 1 3 240
Ottawa - Gatineau (Ontario part) 1,319 450 270 40 57 161 14 21 29 12 6 260Kingston 180 60 60 3 7 6 1 1 2 1 1 38Peterborough 134 42 47 2 6 3 1 0 2 1 1 29Oshawa 480 154 143 13 22 24 3 4 8 5 1 103Toronto 9,764 2,434 1,425 379 501 1,458 209 232 737 403 46 1,942Hamilton 984 325 249 34 46 73 6 12 19 13 4 203St.Catharines - Niagara 456 159 140 11 21 16 2 4 5 2 1 94Kitchener 647 193 170 23 30 54 3 9 19 14 4 128Brantford 172 54 58 3 8 5 1 1 2 2 1 39Guelph 177 55 49 5 8 10 1 3 4 2 1 38London 589 186 175 15 27 42 2 4 7 3 3 124Windsor 512 178 109 19 29 54 3 6 15 8 2 89Barrie 257 85 81 6 12 8 2 1 3 1 1 57Greater Sudbury 177 87 44 2 6 3 1 0 1 0 1 32Thunder Bay 136 47 45 2 5 2 0 1 1 1 1 31Rest of Ontario 3,037 1,063 1,060 49 123 43 10 11 13 7 13 645
Winnipeg 945 299 266 19 57 35 14 9 12 19 5 211Rest of Manitoba 543 149 213 6 33 5 1 1 1 2 5 126Regina 222 69 76 3 11 5 0 2 2 1 2 51Saskatoon 277 86 93 4 14 6 1 3 3 1 3 65Rest of Saskatchewan 608 196 215 6 29 4 1 1 1 1 10 144Calgary 2,003 526 485 43 121 147 11 38 46 77 8 501Edmonton 1,627 448 437 34 92 90 10 26 35 40 9 406Rest of Alberta 1,592 451 535 22 96 31 3 8 8 9 12 417Kelowna 230 55 70 4 15 4 1 2 1 4 1 71Vancouver 3,783 788 639 70 245 232 25 161 94 276 22 1,230Victoria 426 97 121 7 28 10 3 7 3 7 3 141Abbotsford 231 42 49 3 14 6 1 2 4 51 1 57Rest of British Columbia 1,753 410 520 22 119 23 8 13 8 22 15 593
Yukon, Northwest Territories and Nunavut 149 46 53 1 7 2 0 1 1 1 1 35
Place of residence
in thousands
TotalChristian religious denominations Other religious denominations No religious
denomination
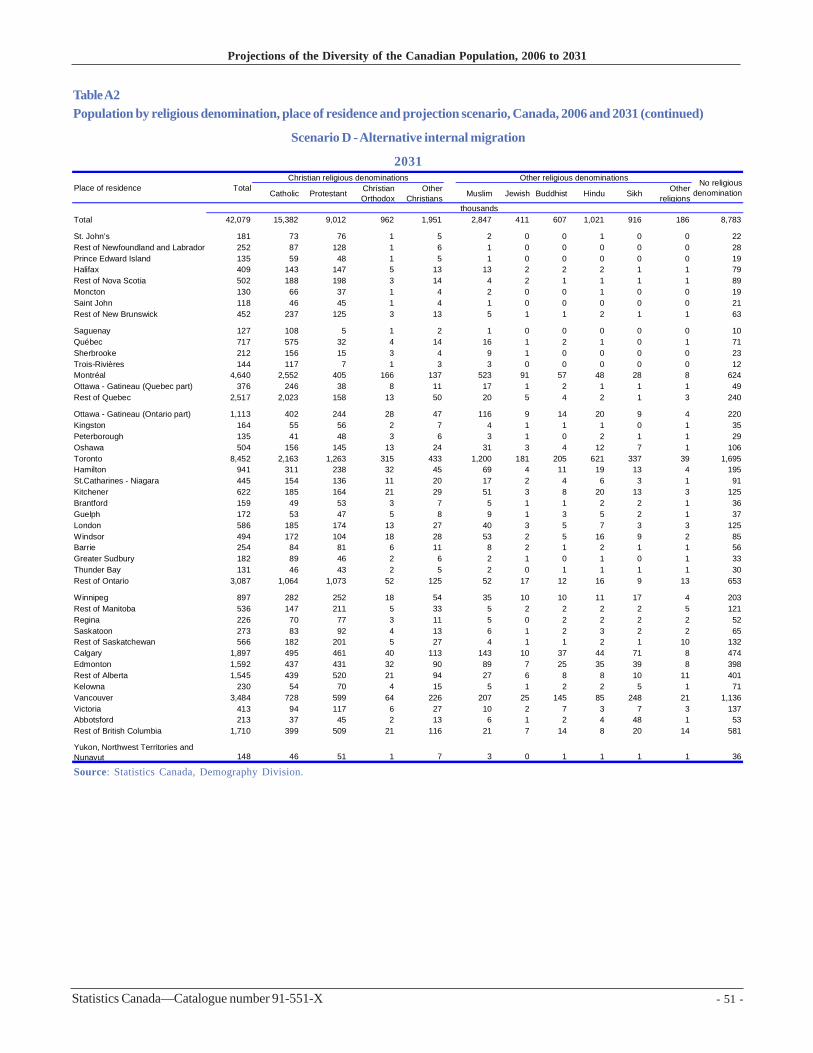
- 51 -Statistics Canada—Catalogue number 91-551-X
Projections of the Diversity of the Canadian Population, 2006 to 2031
Table A2Population by religious denomination, place of residence and projection scenario, Canada, 2006 and 2031 (continued)
Scenario D - Alternative internal migration
2031
Source: Statistics Canada, Demography Division.
Catholic Protestant Christian Orthodox
Other Christians Muslim Jewish Buddhist Hindu Sikh Other
religions
Total 42,079 15,382 9,012 962 1,951 2,847 411 607 1,021 916 186 8,783
St. John’s 181 73 76 1 5 2 0 0 1 0 0 22Rest of Newfoundland and Labrador 252 87 128 1 6 1 0 0 0 0 0 28Prince Edward Island 135 59 48 1 5 1 0 0 0 0 0 19Halifax 409 143 147 5 13 13 2 2 2 1 1 79Rest of Nova Scotia 502 188 198 3 14 4 2 1 1 1 1 89Moncton 130 66 37 1 4 2 0 0 1 0 0 19Saint John 118 46 45 1 4 1 0 0 0 0 0 21Rest of New Brunswick 452 237 125 3 13 5 1 1 2 1 1 63
Saguenay 127 108 5 1 2 1 0 0 0 0 0 10Québec 717 575 32 4 14 16 1 2 1 0 1 71Sherbrooke 212 156 15 3 4 9 1 0 0 0 0 23Trois-Rivières 144 117 7 1 3 3 0 0 0 0 0 12Montréal 4,640 2,552 405 166 137 523 91 57 48 28 8 624Ottawa - Gatineau (Quebec part) 376 246 38 8 11 17 1 2 1 1 1 49Rest of Quebec 2,517 2,023 158 13 50 20 5 4 2 1 3 240
Ottawa - Gatineau (Ontario part) 1,113 402 244 28 47 116 9 14 20 9 4 220Kingston 164 55 56 2 7 4 1 1 1 0 1 35Peterborough 135 41 48 3 6 3 1 0 2 1 1 29Oshawa 504 156 145 13 24 31 3 4 12 7 1 106Toronto 8,452 2,163 1,263 315 433 1,200 181 205 621 337 39 1,695Hamilton 941 311 238 32 45 69 4 11 19 13 4 195St.Catharines - Niagara 445 154 136 11 20 17 2 4 6 3 1 91Kitchener 622 185 164 21 29 51 3 8 20 13 3 125Brantford 159 49 53 3 7 5 1 1 2 2 1 36Guelph 172 53 47 5 8 9 1 3 5 2 1 37London 586 185 174 13 27 40 3 5 7 3 3 125Windsor 494 172 104 18 28 53 2 5 16 9 2 85Barrie 254 84 81 6 11 8 2 1 2 1 1 56Greater Sudbury 182 89 46 2 6 2 1 0 1 0 1 33Thunder Bay 131 46 43 2 5 2 0 1 1 1 1 30Rest of Ontario 3,087 1,064 1,073 52 125 52 17 12 16 9 13 653
Winnipeg 897 282 252 18 54 35 10 10 11 17 4 203Rest of Manitoba 536 147 211 5 33 5 2 2 2 2 5 121Regina 226 70 77 3 11 5 0 2 2 2 2 52Saskatoon 273 83 92 4 13 6 1 2 3 2 2 65Rest of Saskatchewan 566 182 201 5 27 4 1 1 2 1 10 132Calgary 1,897 495 461 40 113 143 10 37 44 71 8 474Edmonton 1,592 437 431 32 90 89 7 25 35 39 8 398Rest of Alberta 1,545 439 520 21 94 27 6 8 8 10 11 401Kelowna 230 54 70 4 15 5 1 2 2 5 1 71Vancouver 3,484 728 599 64 226 207 25 145 85 248 21 1,136Victoria 413 94 117 6 27 10 2 7 3 7 3 137Abbotsford 213 37 45 2 13 6 1 2 4 48 1 53Rest of British Columbia 1,710 399 509 21 116 21 7 14 8 20 14 581
Yukon, Northwest Territories and Nunavut 148 46 51 1 7 3 0 1 1 1 1 36
Place of residence
in thousands
TotalChristian religious denominations Other religious denominations No religious
denomination

- 52 -Statistics Canada—Catalogue number 91-551-X
Projections of the Diversity of the Canadian Population, 2006 to 2031
Table A2Population by religious denomination, place of residence and projection scenario, Canada, 2006 and 2031 (end)
Scenario E- Alternative immigration
2031
Source: Statistics Canada, Demography Division.
Catholic Protestant Christian Orthodox
Other Christians Muslim Jewish Buddhist Hindu Sikh Other
religions
Total 42,099 15,738 9,106 876 1,970 2,695 425 620 988 868 185 8,628
St. John’s 169 69 72 1 5 1 0 0 1 0 0 20Rest of Newfoundland and Labrador 258 89 130 1 6 1 0 0 0 0 0 29Prince Edward Island 136 60 49 1 5 1 0 0 0 0 0 19Halifax 421 148 149 5 14 15 2 3 3 1 1 81Rest of Nova Scotia 504 189 200 3 14 3 1 1 1 1 1 90Moncton 132 66 39 1 4 2 0 0 0 0 0 20Saint John 117 45 44 1 4 2 0 0 0 0 0 21Rest of New Brunswick 453 239 127 2 13 3 1 1 1 1 1 63
Saguenay 135 115 5 0 2 1 0 0 0 0 0 11Québec 695 555 32 3 14 16 0 2 1 0 1 71Sherbrooke 205 153 14 2 4 8 1 0 0 0 0 22Trois-Rivières 146 120 7 1 3 3 0 0 0 0 0 12Montréal 4,938 2,756 439 149 146 555 95 64 52 30 9 641Ottawa - Gatineau (Quebec part) 345 232 34 5 10 15 1 2 1 0 1 44Rest of Quebec 2,383 1,910 152 11 48 20 4 3 2 1 3 230
Ottawa - Gatineau (Ontario part) 1,240 440 261 32 55 139 13 20 25 11 5 239Kingston 173 59 58 3 7 5 1 1 2 1 1 37Peterborough 129 40 46 2 5 3 1 0 2 1 1 28Oshawa 457 149 138 11 21 20 3 3 7 4 1 98Toronto 8,741 2,380 1,373 300 461 1,133 195 210 622 338 41 1,687Hamilton 924 315 241 27 43 58 6 11 16 11 4 190St.Catharines - Niagara 436 155 136 10 20 13 2 3 4 2 1 89Kitchener 601 186 164 18 28 43 3 8 16 11 3 120Brantford 164 52 56 2 7 4 1 1 1 1 1 37Guelph 166 54 47 4 7 8 1 3 4 2 1 36London 559 181 171 12 25 35 2 4 6 3 2 117Windsor 475 172 105 15 26 45 3 5 13 7 1 82Barrie 247 82 79 6 11 7 2 1 2 1 1 55Greater Sudbury 170 84 42 2 6 2 1 0 1 0 1 31Thunder Bay 131 46 44 2 5 2 0 1 1 0 1 29Rest of Ontario 2,917 1,025 1,024 42 119 37 10 11 11 6 12 620
Winnipeg 907 299 258 16 54 28 13 9 10 15 4 200Rest of Manitoba 513 141 203 5 31 4 1 1 1 2 5 120Regina 211 66 73 3 10 4 0 2 1 1 2 49Saskatoon 262 82 89 4 13 5 1 2 2 1 2 61Rest of Saskatchewan 572 185 204 5 27 3 1 1 1 1 9 134Calgary 1,863 512 468 35 112 119 10 37 39 64 8 460Edmonton 1,538 438 422 29 87 75 9 25 30 33 8 382Rest of Alberta 1,520 433 514 19 92 26 3 8 7 8 11 398Kelowna 221 53 68 3 15 4 1 2 1 3 1 70Vancouver 3,475 783 615 55 228 193 23 148 82 236 20 1,091Victoria 411 95 117 6 27 9 3 7 3 6 3 135Abbotsford 212 40 47 2 13 5 1 2 4 42 1 54Rest of British Columbia 1,687 398 502 19 114 20 8 12 8 19 14 573
Yukon, Northwest Territories and Nunavut 140 44 50 1 7 2 0 1 0 0 1 33
Place of residence
in thousands
TotalChristian religious denominations Other religious denominations No religious
denomination

- 53 -Statistics Canada—Catalogue number 91-551-X
Projections of the Diversity of the Canadian Population, 2006 to 2031
Table A3Population by generation status, place of residence and projection scenario, Canada, 2006 and 2031
Base population
2006
Source: Statistics Canada, Demography Division.
Place of residence Total First generation Second generation Third generation or more
Non-permanent resident
Total 32,522 6,452 5,669 20,119 281
St. John’s 183 5 7 170 1Rest of Newfoundland and Labrador 327 3 5 319 0Prince Edward Island 138 5 8 125 0Halifax 384 28 37 317 2Rest of Nova Scotia 554 18 33 501 1Moncton 130 4 7 117 0Saint John 125 5 9 110 1Rest of New Brunswick 491 18 27 445 1
Saguenay 153 2 2 149 0Québec 723 27 21 673 2Sherbrooke 188 11 8 168 1Trois-Rivières 142 3 3 136 0Montréal 3,680 760 516 2,361 44Ottawa - Gatineau (Quebec part) 287 23 19 244 1Rest of Quebec 2,450 49 59 2,339 3
Ottawa - Gatineau (Ontario part) 880 190 172 510 9Kingston 158 20 27 110 1Peterborough 121 11 18 90 1Oshawa 343 56 77 209 1Toronto 5,320 2,432 1,454 1,353 82Hamilton 719 175 184 353 6St.Catharines - Niagara 404 74 95 232 3Kitchener 470 108 96 262 4Brantford 135 17 26 92 0Guelph 132 27 29 76 1London 476 92 100 279 5Windsor 336 78 72 182 4Barrie 184 24 36 123 1Greater Sudbury 164 11 20 133 0Thunder Bay 127 13 28 86 0Rest of Ontario 2,671 237 381 2,045 9
Winnipeg 711 126 149 430 6Rest of Manitoba 471 31 65 374 2Regina 198 15 32 149 1Saskatoon 238 18 38 179 3Rest of Saskatchewan 555 17 88 449 1Calgary 1,118 263 244 598 13Edmonton 1,069 198 231 631 9Rest of Alberta 1,222 89 211 915 7Kelowna 167 24 40 102 1Vancouver 2,181 863 559 717 42Victoria 339 65 88 183 4Abbotsford 164 39 44 80 1Rest of British Columbia 1,384 170 293 915 6
Yukon, Northwest Territories and Nunavut 106 7 10 89 1
in thousands

- 54 -Statistics Canada—Catalogue number 91-551-X
Projections of the Diversity of the Canadian Population, 2006 to 2031
Table A3Population by generation status, place of residence and projection scenario, Canada, 2006 and 2031 (continued)
Scenario A - Low growth
2031
Source: Statistics Canada, Demography Division.
Place of residence Total First generation Second generation Third generation or more
Non-permanent resident
Total 39,251 9,842 7,503 21,240 666
St. John’s 163 6 8 146 2Rest of Newfoundland and Labrador 248 4 9 234 1Prince Edward Island 130 6 9 114 1Halifax 398 40 41 311 6Rest of Nova Scotia 480 20 34 423 3Moncton 127 6 10 110 1Saint John 113 6 9 95 2Rest of New Brunswick 434 19 27 384 3
Saguenay 130 2 4 123 0Québec 664 39 32 586 6Sherbrooke 192 19 13 157 3Trois-Rivières 140 6 6 127 1Montréal 4,541 1,295 760 2,383 103Ottawa - Gatineau (Quebec part) 325 44 33 246 2Rest of Quebec 2,282 68 110 2,097 6
Ottawa - Gatineau (Ontario part) 1,149 312 263 553 20Kingston 164 22 31 109 3Peterborough 123 12 23 86 1Oshawa 431 79 109 240 3Toronto 8,016 3,939 2,216 1,667 193Hamilton 859 222 209 414 14St.Catharines - Niagara 410 73 88 241 8Kitchener 562 149 128 274 10Brantford 156 19 30 106 1Guelph 155 36 35 81 2London 521 112 108 290 11Windsor 442 119 103 210 9Barrie 234 28 54 150 2Greater Sudbury 164 8 23 132 1Thunder Bay 124 10 22 91 1Rest of Ontario 2,780 222 486 2,051 21
Winnipeg 826 183 142 487 15Rest of Manitoba 475 40 49 381 4Regina 202 18 23 158 3Saskatoon 248 23 28 190 6Rest of Saskatchewan 538 16 42 476 2Calgary 1,731 490 375 837 30Edmonton 1,434 304 281 827 22Rest of Alberta 1,429 113 211 1,088 16Kelowna 210 27 42 138 2Vancouver 3,195 1,366 834 897 98Victoria 386 73 83 221 9Abbotsford 198 54 51 89 3Rest of British Columbia 1,594 180 294 1,106 15
Yukon, Northwest Territories and Nunavut 130 9 11 110 1
in thousands

- 55 -Statistics Canada—Catalogue number 91-551-X
Projections of the Diversity of the Canadian Population, 2006 to 2031
Table A3Population by generation status, place of residence and projection scenario, Canada, 2006 and 2031 (continued)
Scenario B - Reference scenario
2031
Source: Statistics Canada, Demography Division.
Place of residence Total First generation Second generation Third generation or more
Non-permanent resident
Total 42,078 11,147 8,165 22,099 666
St. John’s 169 7 8 151 2Rest of Newfoundland and Labrador 258 4 10 243 1Prince Edward Island 136 7 10 118 1Halifax 418 46 45 322 6Rest of Nova Scotia 501 22 36 441 3Moncton 132 7 10 114 1Saint John 117 7 9 98 2Rest of New Brunswick 451 22 28 398 3
Saguenay 135 3 5 127 0Québec 692 47 36 603 6Sherbrooke 203 23 15 163 3Trois-Rivières 145 7 6 131 1Montréal 4,900 1,483 849 2,465 103Ottawa - Gatineau (Quebec part) 342 50 37 254 2Rest of Quebec 2,378 77 118 2,176 6
Ottawa - Gatineau (Ontario part) 1,232 352 286 575 20Kingston 172 24 33 113 3Peterborough 128 14 24 89 1Oshawa 455 85 116 252 3Toronto 8,868 4,476 2,455 1,744 193Hamilton 921 250 225 433 14St.Catharines - Niagara 433 81 94 251 8Kitchener 603 169 138 286 10Brantford 164 21 31 111 1Guelph 165 41 38 84 2London 554 126 115 302 11Windsor 476 135 113 219 9Barrie 246 31 57 156 2Greater Sudbury 170 9 24 136 1Thunder Bay 131 11 23 95 1Rest of Ontario 2,908 242 507 2,138 21
Winnipeg 884 209 154 506 15Rest of Manitoba 507 46 53 404 4Regina 211 20 24 164 3Saskatoon 262 27 31 199 6Rest of Saskatchewan 570 18 44 505 2Calgary 1,864 556 409 870 30Edmonton 1,529 342 304 860 22Rest of Alberta 1,510 128 225 1,141 16Kelowna 219 30 45 142 2Vancouver 3,483 1,544 911 929 98Victoria 406 80 88 229 9Abbotsford 214 61 56 93 3Rest of British Columbia 1,674 196 309 1,155 15
Yukon, Northwest Territories and Nunavut 139 10 12 116 1
in thousands

- 56 -Statistics Canada—Catalogue number 91-551-X
Projections of the Diversity of the Canadian Population, 2006 to 2031
Table A3Population by generation status, place of residence and projection scenario, Canada, 2006 and 2031 (continued)
Scenario C - High growth
2031
Source: Statistics Canada, Demography Division.
Place of residence Total First generation Second generation Third generation or more
Non-permanent resident
Total 45,008 12,526 8,870 22,946 666
St. John’s 175 8 9 156 2Rest of Newfoundland and Labrador 267 5 10 251 1Prince Edward Island 141 8 10 122 1Halifax 438 53 48 332 6Rest of Nova Scotia 522 24 37 458 3Moncton 136 8 10 117 1Saint John 121 8 10 101 2Rest of New Brunswick 469 24 30 411 3
Saguenay 140 4 5 131 0Québec 719 55 39 619 6Sherbrooke 213 26 16 168 3Trois-Rivières 151 8 6 136 1Montréal 5,275 1,682 947 2,543 103Ottawa - Gatineau (Quebec part) 360 56 40 262 2Rest of Quebec 2,472 87 127 2,252 6
Ottawa - Gatineau (Ontario part) 1,319 394 310 595 20Kingston 180 27 34 116 3Peterborough 134 15 25 93 1Oshawa 480 93 122 263 3Toronto 9,764 5,043 2,710 1,818 193Hamilton 984 280 241 450 14St.Catharines - Niagara 456 89 99 260 8Kitchener 647 190 149 298 10Brantford 172 23 33 115 1Guelph 177 46 41 88 2London 589 142 124 312 11Windsor 512 153 123 228 9Barrie 257 34 60 161 2Greater Sudbury 177 10 25 141 1Thunder Bay 136 12 24 98 1Rest of Ontario 3,037 262 529 2,225 21
Winnipeg 945 236 168 527 15Rest of Manitoba 543 53 57 429 4Regina 222 23 26 170 3Saskatoon 277 31 33 208 6Rest of Saskatchewan 608 21 47 537 2Calgary 2,003 626 446 901 30Edmonton 1,627 382 328 894 22Rest of Alberta 1,592 144 240 1,193 16Kelowna 230 33 47 147 2Vancouver 3,783 1,730 992 962 98Victoria 426 88 93 236 9Abbotsford 231 69 62 97 3Rest of British Columbia 1,753 212 325 1,201 15
Yukon, Northwest Territories and Nunavut 149 11 12 124 1
in thousands

- 57 -Statistics Canada—Catalogue number 91-551-X
Projections of the Diversity of the Canadian Population, 2006 to 2031
Table A3Population by generation status, place of residence and projection scenario, Canada, 2006 and 2031 (continued)
Scenario D - Alternative internal migration
2031
Source: Statistics Canada, Demography Division.
Place of residence Total First generation Second generation Third generation or more
Non-permanent resident
Total 42,079 11,146 8,168 22,099 666
St. John’s 181 12 9 158 2Rest of Newfoundland and Labrador 252 6 8 238 1Prince Edward Island 135 9 9 116 1Halifax 409 41 43 319 6Rest of Nova Scotia 502 29 32 438 3Moncton 130 7 9 113 1Saint John 118 6 9 101 2Rest of New Brunswick 452 31 28 390 3
Saguenay 127 4 4 120 0Québec 717 42 34 634 6Sherbrooke 212 30 16 164 3Trois-Rivières 144 10 5 129 1Montréal 4,640 1,348 898 2,290 103Ottawa - Gatineau (Quebec part) 376 69 35 269 2Rest of Quebec 2,517 99 92 2,320 6
Ottawa - Gatineau (Ontario part) 1,113 249 262 582 20Kingston 164 15 31 116 3Peterborough 135 17 22 94 1Oshawa 504 119 114 267 3Toronto 8,452 4,196 2,491 1,571 193Hamilton 941 276 223 428 14St.Catharines - Niagara 445 98 91 249 8Kitchener 622 182 140 290 10Brantford 159 24 31 103 1Guelph 172 48 35 87 2London 586 137 122 316 11Windsor 494 151 118 216 9Barrie 254 39 53 159 2Greater Sudbury 182 10 22 149 1Thunder Bay 131 12 24 94 1Rest of Ontario 3,087 363 467 2,237 21
Winnipeg 897 231 162 489 15Rest of Manitoba 536 62 54 417 4Regina 226 25 25 173 3Saskatoon 273 31 35 201 6Rest of Saskatchewan 566 25 41 497 2Calgary 1,897 588 421 858 30Edmonton 1,592 367 321 882 22Rest of Alberta 1,545 158 205 1,165 16Kelowna 230 36 44 147 2Vancouver 3,484 1,548 932 906 98Victoria 413 86 85 233 9Abbotsford 213 63 54 92 3Rest of British Columbia 1,710 229 300 1,166 15
Yukon, Northwest Territories and Nunavut 148 16 12 118 1
in thousands

- 58 -Statistics Canada—Catalogue number 91-551-X
Projections of the Diversity of the Canadian Population, 2006 to 2031
Table A3Population by generation status, place of residence and projection scenario, Canada, 2006 and 2031 (end)
Scenario E- Alternative immigration
2031
Source: Statistics Canada, Demography Division.
Place of residence Total First generation Second generation Third generation or more
Non-permanent resident
Total 42,099 11,152 8,181 22,099 666
St. John’s 169 7 8 151 2Rest of Newfoundland and Labrador 258 5 10 243 1Prince Edward Island 136 8 10 118 1Halifax 421 49 45 322 6Rest of Nova Scotia 504 24 36 441 3Moncton 132 7 10 114 1Saint John 117 7 9 98 2Rest of New Brunswick 453 23 29 398 3
Saguenay 135 3 5 127 0Québec 695 49 37 603 6Sherbrooke 205 24 15 163 3Trois-Rivières 146 8 6 131 1Montréal 4,938 1,506 864 2,465 103Ottawa - Gatineau (Quebec part) 345 52 37 254 2Rest of Quebec 2,383 81 120 2,176 6
Ottawa - Gatineau (Ontario part) 1,240 358 288 575 20Kingston 173 25 33 113 3Peterborough 129 14 24 89 1Oshawa 457 86 116 252 3Toronto 8,741 4,368 2,435 1,744 193Hamilton 924 252 225 433 14St.Catharines - Niagara 436 83 94 251 8Kitchener 601 166 138 286 10Brantford 164 21 31 111 1Guelph 166 42 38 84 2London 559 130 116 302 11Windsor 475 135 112 219 9Barrie 247 32 57 156 2Greater Sudbury 170 9 24 136 1Thunder Bay 131 11 24 95 1Rest of Ontario 2,917 249 509 2,138 21
Winnipeg 907 228 158 506 15Rest of Manitoba 513 51 54 404 4Regina 211 20 24 164 3Saskatoon 262 27 31 199 6Rest of Saskatchewan 572 20 45 505 2Calgary 1,863 554 409 870 30Edmonton 1,538 350 305 860 22Rest of Alberta 1,520 136 227 1,141 16Kelowna 221 32 45 142 2Vancouver 3,475 1,537 911 929 98Victoria 411 85 88 229 9Abbotsford 212 60 56 93 3Rest of British Columbia 1,687 206 311 1,155 15
Yukon, Northwest Territories and Nunavut 140 11 12 116 1
in thousands

- 59 -Statistics Canada—Catalogue number 91-551-X
Projections of the Diversity of the Canadian Population, 2006 to 2031
Table A4Foreign-born population by continent of birth, place of residence and projection scenario, Canada, 2006 and 2031
Base population
2006
Note: In this table, the concept of foreign-born population refers to persons who are, or once were, landed immigrants in Canada.Source: Statistics Canada, Demography Division.
Place of residence Total Americas Europe Africa Asia Oceania and others
Total 6,452 990 2,371 390 2,639 61
St. John’s 5 1 2 0 1 0Rest of Newfoundland and Labrador 3 1 2 0 1 0Prince Edward Island 5 2 3 0 0 0Halifax 28 5 13 2 8 0Rest of Nova Scotia 18 5 10 0 2 0Moncton 4 2 2 0 1 0Saint John 5 1 3 0 1 0Rest of New Brunswick 18 8 7 1 2 0
Saguenay 2 0 1 0 0 0Québec 27 6 12 5 4 0Sherbrooke 11 3 4 2 1 0Trois-Rivières 3 1 1 1 0 0Montréal 760 162 261 112 222 2Ottawa - Gatineau (Quebec part) 23 5 9 4 5 0Rest of Quebec 49 13 27 3 5 0
Ottawa - Gatineau (Ontario part) 190 29 63 20 77 1Kingston 20 3 12 1 4 0Peterborough 11 2 8 0 2 0Oshawa 56 12 33 2 9 0Toronto 2,432 386 722 123 1,191 9Hamilton 175 20 108 6 40 1St.Catharines - Niagara 74 12 48 2 10 0Kitchener 108 16 59 5 28 1Brantford 17 2 11 0 3 0Guelph 27 3 14 1 9 0London 92 14 51 4 22 1Windsor 78 11 35 4 28 0Barrie 24 4 16 1 3 0Greater Sudbury 11 1 8 0 1 0Thunder Bay 13 1 10 0 1 0Rest of Ontario 237 44 168 4 20 2
Winnipeg 126 18 50 7 51 0Rest of Manitoba 31 12 15 1 3 0Regina 15 2 6 1 5 0Saskatoon 18 3 7 1 7 0Rest of Saskatchewan 17 4 9 1 2 0Calgary 263 31 79 19 132 4Edmonton 198 22 71 14 87 4Rest of Alberta 89 21 46 5 16 1Kelowna 24 3 17 1 3 1Vancouver 863 57 189 28 564 25Victoria 65 9 36 2 16 2Abbotsford 39 5 12 1 21 1Rest of British Columbia 170 28 108 4 26 4
Yukon, Northwest Territories and Nunavut 7 1 3 0 2 0
in thousands

- 60 -Statistics Canada—Catalogue number 91-551-X
Projections of the Diversity of the Canadian Population, 2006 to 2031
Table A4Foreign-born population by continent of birth, place of residence and projection scenario, Canada, 2006 and 2031 (continued)
Scenario A - Low growth
2031
Note: In this table, the concept of foreign-born population refers to persons who are, or once were, landed immigrants in Canada.Source: Statistics Canada, Demography Division.
Place of residence Total Americas Europe Africa Asia Oceania and others
Total 9,842 1,392 2,069 914 5,388 79
St. John’s 6 1 2 1 2 0Rest of Newfoundland and Labrador 4 1 1 0 1 0Prince Edward Island 6 1 3 1 1 0Halifax 40 6 12 6 16 0Rest of Nova Scotia 20 5 9 1 4 0Moncton 6 1 2 1 2 0Saint John 6 1 2 0 3 0Rest of New Brunswick 19 6 6 2 5 0
Saguenay 2 1 1 0 0 0Québec 39 8 17 9 6 0Sherbrooke 19 6 5 6 3 0Trois-Rivières 6 2 2 2 1 0Montréal 1,295 262 298 301 430 3Ottawa - Gatineau (Quebec part) 44 9 11 10 13 0Rest of Quebec 68 17 29 9 12 0
Ottawa - Gatineau (Ontario part) 312 46 60 47 157 1Kingston 22 4 9 1 7 0Peterborough 12 2 6 1 4 0Oshawa 79 17 27 7 27 1Toronto 3,939 509 619 248 2,550 13Hamilton 222 32 81 19 89 1St.Catharines - Niagara 73 17 30 4 21 1Kitchener 149 24 48 11 65 1Brantford 19 3 9 1 6 0Guelph 36 5 11 2 17 0London 112 26 36 9 40 1Windsor 119 19 30 12 58 1Barrie 28 5 13 2 8 0Greater Sudbury 8 1 4 1 2 0Thunder Bay 10 1 5 1 3 0Rest of Ontario 222 44 122 10 44 3
Winnipeg 183 25 39 18 100 1Rest of Manitoba 40 11 20 3 7 0Regina 18 2 4 3 8 0Saskatoon 23 3 6 3 12 0Rest of Saskatchewan 16 4 6 2 4 0Calgary 490 55 83 45 301 5Edmonton 304 35 60 36 168 5Rest of Alberta 113 23 40 13 36 2Kelowna 27 4 13 2 7 1Vancouver 1,366 96 160 49 1,034 28Victoria 73 13 28 4 25 2Abbotsford 54 5 9 2 38 1Rest of British Columbia 180 32 87 9 46 6
Yukon, Northwest Territories and Nunavut 9 1 3 1 4 0
in thousands
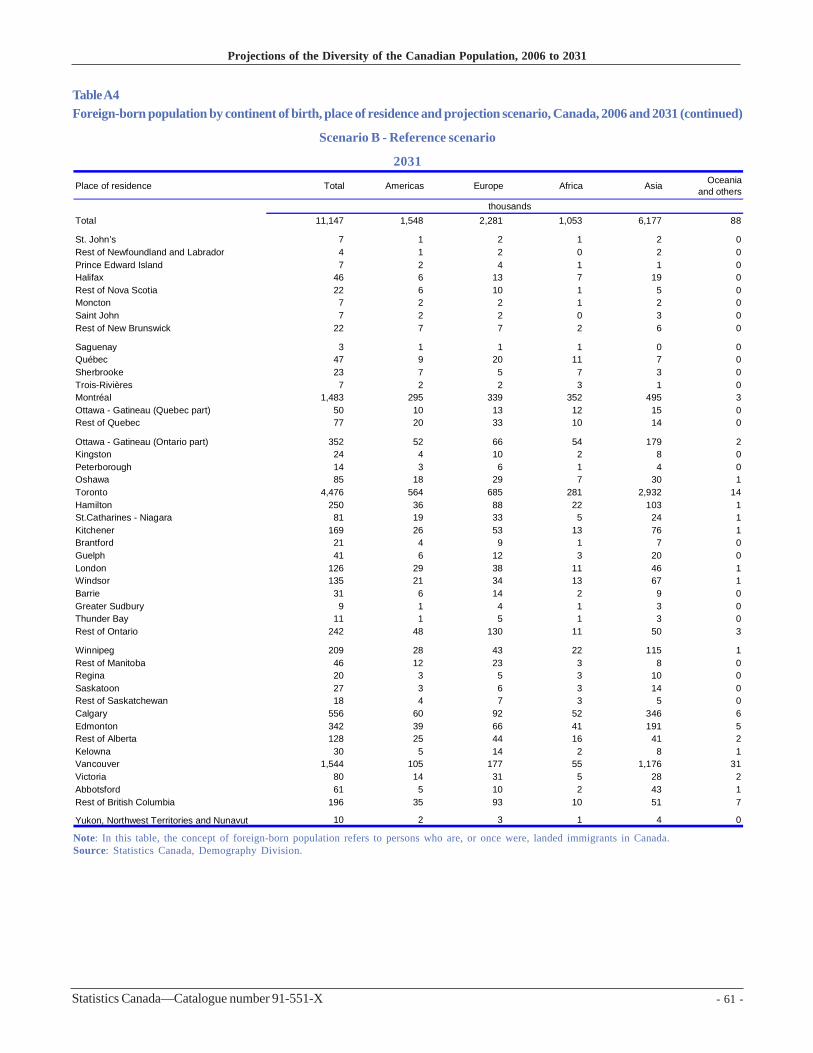
- 61 -Statistics Canada—Catalogue number 91-551-X
Projections of the Diversity of the Canadian Population, 2006 to 2031
Table A4Foreign-born population by continent of birth, place of residence and projection scenario, Canada, 2006 and 2031 (continued)
Scenario B - Reference scenario
2031
Note: In this table, the concept of foreign-born population refers to persons who are, or once were, landed immigrants in Canada.Source: Statistics Canada, Demography Division.
Place of residence Total Americas Europe Africa Asia Oceania and others
Total 11,147 1,548 2,281 1,053 6,177 88
St. John’s 7 1 2 1 2 0Rest of Newfoundland and Labrador 4 1 2 0 2 0Prince Edward Island 7 2 4 1 1 0Halifax 46 6 13 7 19 0Rest of Nova Scotia 22 6 10 1 5 0Moncton 7 2 2 1 2 0Saint John 7 2 2 0 3 0Rest of New Brunswick 22 7 7 2 6 0
Saguenay 3 1 1 1 0 0Québec 47 9 20 11 7 0Sherbrooke 23 7 5 7 3 0Trois-Rivières 7 2 2 3 1 0Montréal 1,483 295 339 352 495 3Ottawa - Gatineau (Quebec part) 50 10 13 12 15 0Rest of Quebec 77 20 33 10 14 0
Ottawa - Gatineau (Ontario part) 352 52 66 54 179 2Kingston 24 4 10 2 8 0Peterborough 14 3 6 1 4 0Oshawa 85 18 29 7 30 1Toronto 4,476 564 685 281 2,932 14Hamilton 250 36 88 22 103 1St.Catharines - Niagara 81 19 33 5 24 1Kitchener 169 26 53 13 76 1Brantford 21 4 9 1 7 0Guelph 41 6 12 3 20 0London 126 29 38 11 46 1Windsor 135 21 34 13 67 1Barrie 31 6 14 2 9 0Greater Sudbury 9 1 4 1 3 0Thunder Bay 11 1 5 1 3 0Rest of Ontario 242 48 130 11 50 3
Winnipeg 209 28 43 22 115 1Rest of Manitoba 46 12 23 3 8 0Regina 20 3 5 3 10 0Saskatoon 27 3 6 3 14 0Rest of Saskatchewan 18 4 7 3 5 0Calgary 556 60 92 52 346 6Edmonton 342 39 66 41 191 5Rest of Alberta 128 25 44 16 41 2Kelowna 30 5 14 2 8 1Vancouver 1,544 105 177 55 1,176 31Victoria 80 14 31 5 28 2Abbotsford 61 5 10 2 43 1Rest of British Columbia 196 35 93 10 51 7
Yukon, Northwest Territories and Nunavut 10 2 3 1 4 0
in thousands

- 62 -Statistics Canada—Catalogue number 91-551-X
Projections of the Diversity of the Canadian Population, 2006 to 2031
Table A4Foreign-born population by continent of birth, place of residence and projection scenario, Canada, 2006 and 2031 (continued)
Scenario C - High growth
2031
Note: In this table, the concept of foreign-born population refers to persons who are, or once were, landed immigrants in Canada.Source: Statistics Canada, Demography Division.
Place of residence Total Americas Europe Africa Asia Oceania and others
Total 12,526 1,713 2,503 1,202 7,012 97
St. John’s 8 2 2 1 3 0Rest of Newfoundland and Labrador 5 1 2 0 2 0Prince Edward Island 8 2 4 1 2 0Halifax 53 7 14 8 23 0Rest of Nova Scotia 24 6 11 1 5 0Moncton 8 2 2 2 2 0Saint John 8 2 2 1 3 0Rest of New Brunswick 24 7 8 2 7 0
Saguenay 4 1 1 1 1 0Québec 55 11 23 13 9 0Sherbrooke 26 8 6 8 4 0Trois-Rivières 8 2 2 3 1 0Montréal 1,682 329 381 405 563 3Ottawa - Gatineau (Quebec part) 56 11 14 13 17 0Rest of Quebec 87 22 36 12 16 0
Ottawa - Gatineau (Ontario part) 394 57 72 61 203 2Kingston 27 4 11 2 9 0Peterborough 15 3 6 1 4 0Oshawa 93 20 30 8 33 1Toronto 5,043 619 753 317 3,338 15Hamilton 280 40 95 25 118 2St.Catharines - Niagara 89 21 35 6 27 1Kitchener 190 29 58 15 87 1Brantford 23 4 10 1 8 0Guelph 46 7 13 3 23 0London 142 33 41 13 53 1Windsor 153 23 37 15 76 1Barrie 34 6 15 2 10 0Greater Sudbury 10 2 4 1 3 0Thunder Bay 12 2 5 1 4 0Rest of Ontario 262 52 138 12 56 3
Winnipeg 236 31 47 25 132 1Rest of Manitoba 53 13 26 4 9 0Regina 23 3 5 4 11 0Saskatoon 31 4 7 4 16 0Rest of Saskatchewan 21 4 7 3 6 0Calgary 626 67 102 59 391 6Edmonton 382 43 73 47 215 6Rest of Alberta 144 28 48 18 47 2Kelowna 33 5 16 2 9 1Vancouver 1,730 117 194 61 1,325 34Victoria 88 15 33 5 32 3Abbotsford 69 6 11 2 49 1Rest of British Columbia 212 39 99 10 57 7
Yukon, Northwest Territories and Nunavut 11 2 3 1 5 0
in thousands

- 63 -Statistics Canada—Catalogue number 91-551-X
Projections of the Diversity of the Canadian Population, 2006 to 2031
Table A4Foreign-born population by continent of birth, place of residence and projection scenario, Canada, 2006 and 2031 (continued)
Scenario D - Alternative internal migration
2031
Note: In this table, the concept of foreign-born population refers to persons who are, or once were, landed immigrants in Canada.Source: Statistics Canada, Demography Division.
Place of residence Total Americas Europe Africa Asia Oceania and others
Total 11,146 1,548 2,282 1,054 6,176 88
St. John’s 12 2 3 2 4 0Rest of Newfoundland and Labrador 6 1 2 1 2 0Prince Edward Island 9 2 4 1 2 0Halifax 41 6 12 6 17 0Rest of Nova Scotia 29 7 13 2 7 0Moncton 7 2 2 1 2 0Saint John 6 1 2 0 2 0Rest of New Brunswick 31 9 10 3 10 0
Saguenay 4 1 2 1 0 0Québec 42 7 18 10 7 0Sherbrooke 30 9 6 10 4 0Trois-Rivières 10 3 2 3 1 0Montréal 1,348 264 315 329 438 3Ottawa - Gatineau (Quebec part) 69 14 16 16 22 0Rest of Quebec 99 25 40 14 20 0
Ottawa - Gatineau (Ontario part) 249 37 42 39 129 1Kingston 15 3 5 1 5 0Peterborough 17 3 8 1 5 0Oshawa 119 25 34 11 48 1Toronto 4,196 521 612 262 2,788 13Hamilton 276 40 94 24 117 1St.Catharines - Niagara 98 24 36 7 31 1Kitchener 182 27 53 13 88 1Brantford 24 4 10 1 9 0Guelph 48 7 14 3 24 0London 137 32 39 12 53 1Windsor 151 24 35 16 76 1Barrie 39 7 17 3 11 0Greater Sudbury 10 2 4 1 3 0Thunder Bay 12 2 5 1 4 0Rest of Ontario 363 70 181 18 89 4
Winnipeg 231 29 45 24 131 1Rest of Manitoba 62 15 29 5 13 0Regina 25 3 6 4 12 0Saskatoon 31 3 7 4 16 0Rest of Saskatchewan 25 5 8 4 8 0Calgary 588 61 95 55 371 6Edmonton 367 43 67 46 206 5Rest of Alberta 158 34 51 20 51 2Kelowna 36 5 16 2 11 1Vancouver 1,548 107 176 56 1,180 30Victoria 86 14 31 5 33 2Abbotsford 63 5 9 2 46 1Rest of British Columbia 229 41 103 11 67 7
Yukon, Northwest Territories and Nunavut 16 3 5 1 7 0
in thousands
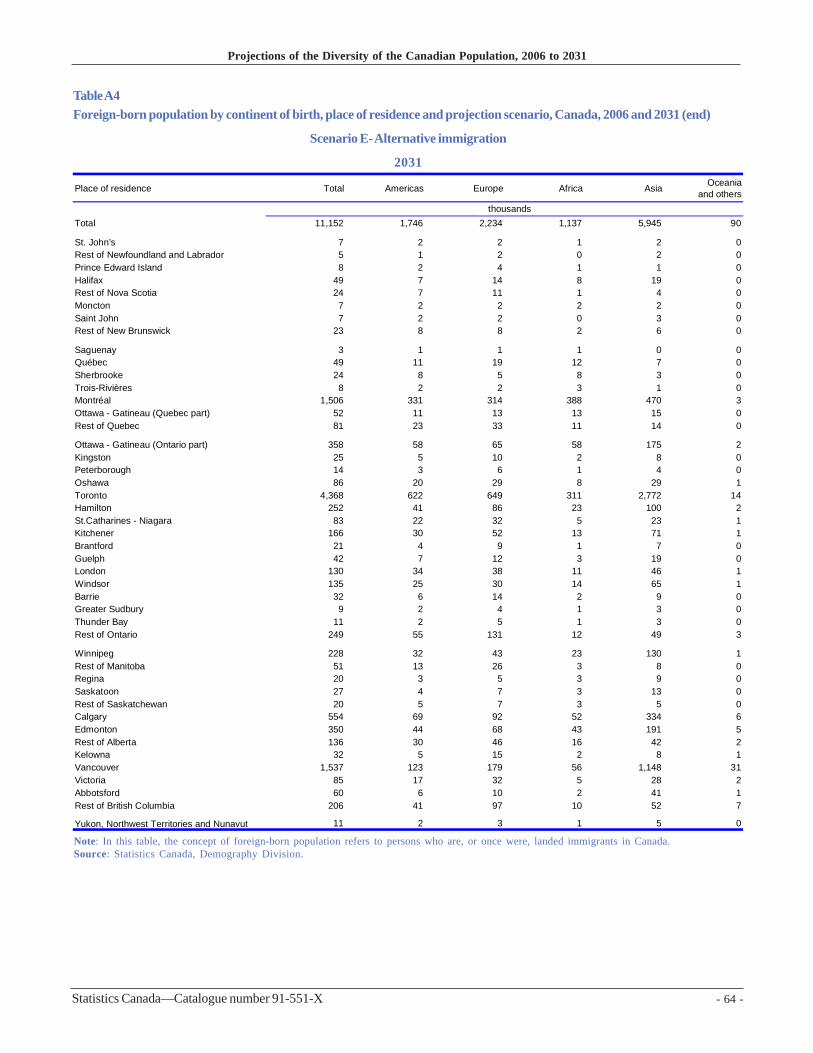
- 64 -Statistics Canada—Catalogue number 91-551-X
Projections of the Diversity of the Canadian Population, 2006 to 2031
Table A4Foreign-born population by continent of birth, place of residence and projection scenario, Canada, 2006 and 2031 (end)
Scenario E- Alternative immigration
2031
Note: In this table, the concept of foreign-born population refers to persons who are, or once were, landed immigrants in Canada.Source: Statistics Canada, Demography Division.
Place of residence Total Americas Europe Africa Asia Oceania and others
Total 11,152 1,746 2,234 1,137 5,945 90
St. John’s 7 2 2 1 2 0Rest of Newfoundland and Labrador 5 1 2 0 2 0Prince Edward Island 8 2 4 1 1 0Halifax 49 7 14 8 19 0Rest of Nova Scotia 24 7 11 1 4 0Moncton 7 2 2 2 2 0Saint John 7 2 2 0 3 0Rest of New Brunswick 23 8 8 2 6 0
Saguenay 3 1 1 1 0 0Québec 49 11 19 12 7 0Sherbrooke 24 8 5 8 3 0Trois-Rivières 8 2 2 3 1 0Montréal 1,506 331 314 388 470 3Ottawa - Gatineau (Quebec part) 52 11 13 13 15 0Rest of Quebec 81 23 33 11 14 0
Ottawa - Gatineau (Ontario part) 358 58 65 58 175 2Kingston 25 5 10 2 8 0Peterborough 14 3 6 1 4 0Oshawa 86 20 29 8 29 1Toronto 4,368 622 649 311 2,772 14Hamilton 252 41 86 23 100 2St.Catharines - Niagara 83 22 32 5 23 1Kitchener 166 30 52 13 71 1Brantford 21 4 9 1 7 0Guelph 42 7 12 3 19 0London 130 34 38 11 46 1Windsor 135 25 30 14 65 1Barrie 32 6 14 2 9 0Greater Sudbury 9 2 4 1 3 0Thunder Bay 11 2 5 1 3 0Rest of Ontario 249 55 131 12 49 3
Winnipeg 228 32 43 23 130 1Rest of Manitoba 51 13 26 3 8 0Regina 20 3 5 3 9 0Saskatoon 27 4 7 3 13 0Rest of Saskatchewan 20 5 7 3 5 0Calgary 554 69 92 52 334 6Edmonton 350 44 68 43 191 5Rest of Alberta 136 30 46 16 42 2Kelowna 32 5 15 2 8 1Vancouver 1,537 123 179 56 1,148 31Victoria 85 17 32 5 28 2Abbotsford 60 6 10 2 41 1Rest of British Columbia 206 41 97 10 52 7
Yukon, Northwest Territories and Nunavut 11 2 3 1 5 0
in thousands
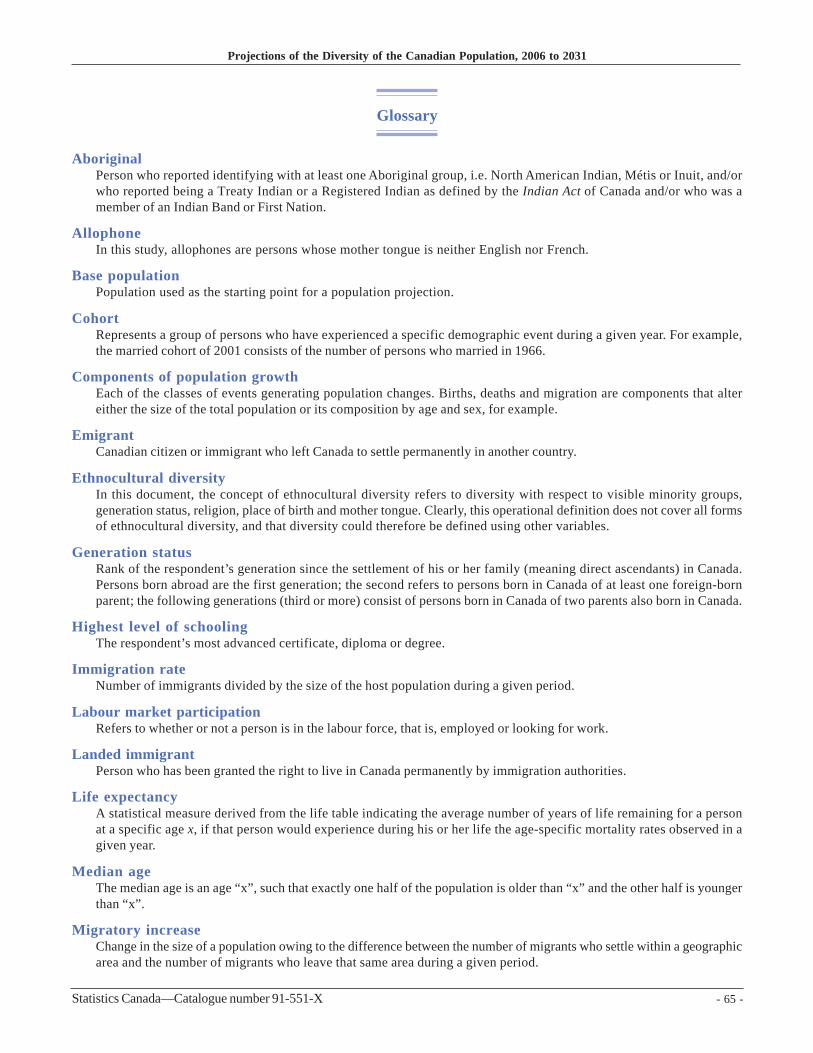
- 65 -Statistics Canada—Catalogue number 91-551-X
Projections of the Diversity of the Canadian Population, 2006 to 2031
Glossary
AboriginalPerson who reported identifying with at least one Aboriginal group, i.e. North American Indian, Métis or Inuit, and/orwho reported being a Treaty Indian or a Registered Indian as defined by the Indian Act of Canada and/or who was amember of an Indian Band or First Nation.
AllophoneIn this study, allophones are persons whose mother tongue is neither English nor French.
Base populationPopulation used as the starting point for a population projection.
CohortRepresents a group of persons who have experienced a specific demographic event during a given year. For example,the married cohort of 2001 consists of the number of persons who married in 1966.
Components of population growthEach of the classes of events generating population changes. Births, deaths and migration are components that altereither the size of the total population or its composition by age and sex, for example.
EmigrantCanadian citizen or immigrant who left Canada to settle permanently in another country.
Ethnocultural diversityIn this document, the concept of ethnocultural diversity refers to diversity with respect to visible minority groups,generation status, religion, place of birth and mother tongue. Clearly, this operational definition does not cover all formsof ethnocultural diversity, and that diversity could therefore be defined using other variables.
Generation statusRank of the respondent’s generation since the settlement of his or her family (meaning direct ascendants) in Canada.Persons born abroad are the first generation; the second refers to persons born in Canada of at least one foreign-bornparent; the following generations (third or more) consist of persons born in Canada of two parents also born in Canada.
Highest level of schoolingThe respondent’s most advanced certificate, diploma or degree.
Immigration rateNumber of immigrants divided by the size of the host population during a given period.
Labour market participationRefers to whether or not a person is in the labour force, that is, employed or looking for work.
Landed immigrantPerson who has been granted the right to live in Canada permanently by immigration authorities.
Life expectancyA statistical measure derived from the life table indicating the average number of years of life remaining for a personat a specific age x, if that person would experience during his or her life the age-specific mortality rates observed in agiven year.
Median ageThe median age is an age “x”, such that exactly one half of the population is older than “x” and the other half is youngerthan “x”.
Migratory increaseChange in the size of a population owing to the difference between the number of migrants who settle within a geographicarea and the number of migrants who leave that same area during a given period.
- 66 -Statistics Canada—Catalogue number 91-551-X
Projections of the Diversity of the Canadian Population, 2006 to 2031
Mother tongueRefers to the first language learned at home in childhood and still understood by the individual at the time of the census.
Natural increaseChange in the size of a population owing to the difference between the number of births and the number of deathsduring a given period.
Net emigrationNumber of emigrants minus the number of returning emigrants plus net temporary emigration.
Net non-permanent residentsVariation in the number of non-permanent residents between two dates.
Net temporary emigration Variation in the number of temporary emigrants between two dates.
Net undercoverageDifference between the number of persons who were covered by the census but who were not enumerated (undercoverage)and the number of persons who were enumerated whereas they should not have been or who were enumerated morethan once (overcoverage).
Non-Christian religionsIn this study, persons having a non-Christian religion are those who have a religion (which therefore excludes personswith no religion) other than Catholic, Protestant, Christian Orthodox or Christian not included elsewhere. The projectednon-Christian religions are Islam, Judaism, Buddhism, Hinduism, Sikhism and other non-Christian religions.
Non-permanent residentsPersons who had a Work or Study Permit or who were refugee claimants, and family members living in Canada withthem.
Participation rateNumber of persons in the labour force (employed or looking for work) divided by the total population.
Person-yearTotal number of years lived in a given status by the individuals who make up the population from January 1 to December31 of a given year. In this study, projected population figures are presented in person-years while the figures for thebase population are as of May 16, 2006 (Census day).
Population increase or total increaseChange in the size of a population between two dates. It can also be obtained by summing natural increase and migratoryincrease.
Population pyramidBar chart that illustrates the distribution of a population by age and sex.
Projection scenarioSet of assumptions relating to the components, demographic or otherwise, used to make a population projection.
Registered or Treaty IndianPersons who reported, in the census, they were registered under the Indian Act of Canada. Treaty Indians are personswho are registered under the Indian Act and can prove descent from a Band that signed a treaty.
ReligionRefers to specific religious denominations, groups or bodies, as well as to sects, cults, or other religiously definedcommunities or systems of belief.

- 67 -Statistics Canada—Catalogue number 91-551-X
Projections of the Diversity of the Canadian Population, 2006 to 2031
Returning emigrantCanadian citizen or immigrant who previously emigrated from Canada and who returns to settle in Canada.
Sex ratioRatio of the number of males to the number of females. Generally this ratio is expressed as an index, where the numberof females serves as the base 100.
TempoDistribution over time, within a cohort, of the demographic events corresponding to the investigated phenomenon.
Temporary emigrantCanadian citizen or immigrant who left Canada to settle temporarily in a foreign country.
Total fertility rateThe sum of age-specific fertility rates during a given year. It indicates the average number of children that a generationof women would have if, over the course of their reproductive life, they had fertility rates identical to those of the yearconsidered.
Visible minority groupsThe Employment Equity Act defines visible minorities as “persons, other than Aboriginal peoples, who are non-Caucasianin race or non-white in colour.”