proni regional project on youth youth in croatia...
TRANSCRIPT

1
SVEUČILIŠTE U ZAGREBUFILOZOFSKI FAKULTET
Istraživačko-obrazovni centar za ljudska prava i demokratskograđanstvo
UNIVERSITY OF ZAGREBFACULTY OF PHILOSOPHY
Research and TrainingCentre for Human Rights &
Democratic Citizenship____________________________________________________________________________________________
Ivana Lučića 3, 10 000 Zagreb, CroatiaTel./Fax: +385 1 600-24-37
E-mail: [email protected]: http://www.ffzg.hr/hre-edc
PRONI Regional Project on Youth
Youth in Croatia 2002
by:
Vedrana Spajić-VrkašFaculty of Philosophy University of Zagreb
Vlasta IlišinInstitute for Social Research - Zagreb
ZagrebApril 2003

2
Youth in Croatia 2002 is a national report that makes part of a regional researchproject on young people’s life initiated and coordinated by PRONI (Institute of SocialEducation) and the School of Education of the University of Jönköping working inclose co-operation with relevant national governments and universities. Therealization of the project was supported by SIDA (Swedish International DevelopmentCooperation Agency). It was carried on in 2002 in four countries of SoutheasternEuropean (Croatia, Macedonia, Montenegro and Yugoslavia) with a view to provideempirical data on life, needs, attitudes and expectations of young people from theregion. It was presumed that these would serve as an integral part of the Council ofEurope’s youth policy reviews that aims at improving youth participation in theprocesses of democratic changes of the countries in the region.
The main objective of the project was to make the results widely known so as tostimulate the debate about youth in the media, and among politicians and decision-makers, as well as to assist youth organisations in adjusting national strategies totheir needs and aspirations.
The research on Croatian youth was based on the agreement between the Ministry ofEducation and Sport of the Republic of Croatia and the PRONI Institute on terms ofco-operation in the implementation of the project. Upon Croatia’s acceptance of theinvitation from the Council of Europe, the project was understood as part of theEuropean process of national youth policy review.
The research was carried out in the second half of 2002 by the Research and TrainingCentre for Human Rights and Democratic Citizenship of the Faculty of PhilosophyUniversity of Zagreb It was co-ordinated by Prof. Dr. Vedrana Spajić-Vrkaš, theHead of the Centre, who worked in close co-operation with Dr. Vlasta Ilišin, seniorresearcher from the Institute for Social Research - Zagreb.
Among those who helped us in the preparation of this report we owe an enormousdebt to Jasmina Božić from the Centre for her assistance in translating and editing ofthe tekst, as well as to Martina Mikrut from the Caty and Welling agency and hercollaborators from the University of Osijek who did an excellent job in collecting thedata and their statistical analysis. Our gratitude also goes to Tončica Šiškov andTamara Božićević-Haban from the Centre, who provided technical andadministrative support throughout the implementation process.
We would like to extend our thanks to Ms. Nada Jakir from the Ministry of Educationand Sport, as well as to PRONI Institute from Sweden for their support inaccomplishing this task.

3
Contents
List of tables 4List of graphs 6
Part one: YOUTH IN CROATIA IN THE YEARS OF TRANSITION
1. Introduction 81.1. Limits of understanding 81.2. Burden of transition 111.3. Croatian Youth at the crossroads 13
2. Earlir research on youth in Croatia 163. National Programme for Youth 20
3.1. Goals 203.2. Working Plan 21
Part two: PRESENT RESEARCH ON CROATIAN YOUTH
1. The purpose and objectives of the research 252. Methodology 25
2.1. Questionnaire 252.2. Sample 262.3. Methods 27
3. Results 28
3.1. Frequency analysis and discussion: Regional Questionnaire 283.2. Frequency analysis and discussion: Croatian Supplement 713.3. Correlation analysis: Differences among youth 82
Concluding remarks 98References 105Annexes 107
A) Individual tables for questions 38 and 39 from the Croatian Supplement 107B) Questionnaire in Croatian 118

4
List of tables
Table 1: GenderTable 2: AgeTable 3: NationalityTable 4: Marital statusTable 5a: Having childrenTable 5b: Number of childrenTable 6a: Family patternTable 6b: Number of brothers & sisters in the householdTable 7: Number of rooms in the houseTable 8: Having a separate roomTable 9a: Place where computer is used?Table 9b: Reasons for not using the computerTable 10a: Father's educational backgroundTable 10b: Father's occupationTable 11a: Mother’s educational backgroundTable 11b: Mother’s occupationTable 12a: Level of school achieved by the respondentTable 12b: Respondent’s occupationTable 13: Attitude towards own present lifeTable 14: Attitude towards present life of the closest friends Table 15: Attitude towards present life of young people in Western EuropeTable 16: Attitude towards own futureTable 17: Attitude towards future of the closest friendsTable 18: Attitude towards future of young people in Western EuropeTable 19: DestinationTable 20: Opinion on large cities as places that offer better opportunitiesTable 21: Preferred place for living other than presentTable 22: Preferred occupationTable 23: Perception of chances for getting a preferred jobTable 24: Feelings about schoolTable 25: Cigarette smoking Table 26: Alcohol consumption Table 27a: Abuse of drugs: marijuanaTable 27b: Abuse of drugs: hashishTable 27c: Abuse of drugs: LSDTable 27d: Abuse of drugs: cocaine or crackTable 27e: Abuse of drugs: methadoneTable 27f: Abuse of drugs: heroineTable 27g: Abuse of drugs: amphetamineTable 27h: Abuse of drugs: ecstasyTable 27i: Abuse of drugs: inhalantsTable 27j: Abuse of drugs: anabolic steroidsTable 27k: Abuse of drugs: speedTable 27a-k: Abuse of drugs: SummaryTable 28a: Sources of information about the events in the countryTable 28b: Sources of information about the events in the worldTable 29: Free time and its useTable 30: Satisfaction with the way free time is spent

5
Table 31a: I am satisfied with myselfTable 31b: Sometimes I think I am not good at allTable 31c: I feel I have a good number qualitiesTable 31d: I think I am as capable as othersTable 31e: I feel I have little to be proud ofTable 31f: I feel useless sometimesTable 31g: I am self-confident (I feel that I am someone)Table 31h: I wish I had more self-respectTable 31i: I often feel as being a failureTable 31j: I have positive attitude towards myselfTable 31k: I think most people like meTable 32a: I can easily get warmth and care from my parentsTable 32b: I can easily get support from my parentsTable 32c: My parents are willing to support me financiallyTable 32d: I can easily get support from my friendsTable 32e: I can easily get assistance from my teachersTable 32f: I am worried about my futureTable 32g: I am worried about my friends’ futureTable 32h: My parents/relatives define rules for what I can doTable 32i: My parents/relatives know where and with whom I spend my eveningsTable 32j: My parents/relatives ask about my progress in schoolTable 32k: My parents/relatives know about my school situationTable 32l: My parents/relatives are worried about my school situationTable 32m: My parents/relatives are worried about my futureTable 32a-m: Opinions about parents, teachers, etc.: Summary Table 33: Imagining himself/herself in 10 yearsTable 34: Respondents’ comments on the issues omitted Table 35: Perception of major youth problems in Croatia todayTable 36: Opinion on who has the greatest responsibility for solving youth problems in Croatiansociety Table 37: Perception of the most important measures to solve youth problems in Croatian societyTable 38a-u: Personal importance of certain values: SummaryTable 39a-l: View on the importance of certain values for social promotion in Croatia: SummaryTable 40: Use of computer in relation to the type of settlement Table 41: Use of computer in relation to father’s educational backgroundTable 42: Use of computer in relation to regional backgroundTable 43: Use of computer in relation to ageTable 44: Use of computer in relation to socio-professional status Table 45: Perception of present life in relation to ageTable 46: Perception of present life in relation to socio-professional statusTable 47: Professional and educational aspirations in relation to the type of settlementTable 48: Professional and educational aspirations in relation to father’s educationalbackroundTable 49: Professional and educational aspirations in relation to ageTable 50: Professional and educational aspirations in relations to socio-professional statusTable 51: Accomodation preferences in relation to father’s educational backgroundTable 52: Accomodation preferences in relation to ageTable 53: Accomodation preferences in relation to socio-professional statusTable 54: Preferred place for living in relation to the type of settlementTable 55: Preferred place for living in relation to regional backgroundTable 56: Estimation of chances for getting a preferred job in relation to ageTable 57: Estimation of chances for getting a preferred job in relation to socio-professionalstatusTable 58: Feeling about school or faculty study in relation to genderTable 59: Feeling about school or faculty study in relation to socio-professional statusTable 60: Smoking in relation to age

6
Table 61: Smoking in relation to socio-professional statusTable 62: Alcohol consumption in relation to genderTable 63: Abuse of marijuana in relation to the type of settlementTable 64: Abuse of marijuana in relation to father’s educational backgroundTable 65: Abuse of marijuana in relation to regional backgroundTable 66: Abuse of marijuana in relation to genderTable 67: Abuse of marijuana in relation to ageTable 68: Abuse of marijuana in relation to socio-professional statusTable 69: (Dis)satisfaction with the way free time is spent in relation to ageTable 70: (Dis)satisfaction with the way free time is spent in relation to socio-professionalstatusList of graphs
Graph 1: Expected age of parenthoodGraph 2: The use of computerGraph 3: Place where computer is usedGraph 4: Comparison of attitudes towards present lifeGraph 5: Comparison of attitudes towards futureGraph 6: Professional ands educational aspirationsGraph 7: Plans on moving to ensure a better futureGraph 8: Preferred accommodationGraph 9: Preferred place for livingGraph 10: Preferred destination abroadGraph 11: Perception of chances for getting a preferred jobGraph 12: Feeling about schoolGraph 13: Comparison of the sources of informationGraph 14: Satisfaction with the way free time is spentGraph 15: Summary of attitudes about oneself (agree)Graph 16: Perception of supportGraph 17: Monitoring and control: SummaryGraph 18: Imagining his/her life in 10 yearsGraph 19: Perception of actors responsible for solving youth problemsGraph 20: Perception of most important steps to solve youth problemsGraph 21: Ranking of personal values (Mean)Graph 22: Ranking of values important for the promotion in Croatian society (Mean)

7
Part one:
YOUTH IN CROATIA IN THE YEARS OF TRANSITION

8
1. INTRODUCTION
It is widely accepted that youth present a particular period of life during which threetypes of maturation occur interdependently: physical, cognitive and social. The endof the youth maturation process is seen as the acquisition of an appropriate degree ofsocial autonomy and independence, as well as of self-responsibility, responsibility forothers and the community as a whole. Although this definition provides a commonground for a reliable approach to youth, there are still many issues that need to beaddressed before the generalisations are made. Thus, do we really know who theyoung are; what are the differences among them; are they the beneficiaries or thevictims of today's policies, in general, and of youth policies, in particular; how muchpower do they have to influence the policies of today for their world of tomorrow; is itthe group that is still merely represented or the one that represents itself; who are thepresenters in both cases; how efficient are social, economic, political and culturalcontexts that support youth development; what are the similarities and differencesbetween young people living in the West and the East of Europe; what impact thesesimilarities/differences have on the positioning of young people in decision-makingprocesses in their societies and in Europe as a whole; how much of paternalistictradition and rhetoric is still practiced for the purpose of their pacification instead oftheir empowerment, etc.
1.1. Limits of understanding
Almost none of these questions may be answered fully for the reasons describedbelow:
Firstly, despite the fact that there are a number of comparative large-scale studies onyouth, most of them treat young people as a cultural group in the context ofsocialisation into the life of adults. In such framework, social, economic and politicaldimensions are merely "added" to the "youth culture". This "methodologicalromanticism" has equipped us with the abundance of data on youth sub-culture andcounter-culture, as well as about the failure of young people to respond properly tothe requirements of school, workplace, citizenship etc. On the other hand, it has left uslargely unaware of complex social, economic, political and cultural constraints, overtand covert alike, that young people face while trying to (re/dis)locate itself in thepower structure from the local to the international community levels. In the context ofEurope, this is particularly true for young people in transitional countries since nocomprehensive, systemic and comparative research of this kind has been conducted inthe region. Recent exceptions are the European Youth Trend Reports of 1998 and2000 (on socio-economic situation) by the Directorate of Youth and Sport of theCouncil of Europe, written on the initiative of the National Youth ResearchCorrespondents nominated by the ministries in charge of youth affairs and theUNICEF’s survey "Young People in Changing Societies" that covers 27 transitionalcountries, including the former Soviet Union.

9
Secondly, apart from a broad sociological understanding of youth as a stage ofsocialisation and transition from childhood to adulthood, an international consensuson the meaning of the term has been reach on pure statistical and legal grounds. Thedefinition adopted by the UN General Assembly in the context of the InternationalYouth Year in 1995 refers to youth as "the age cohorts between 15-24 years of age,without prejudices to other definitions of member states". In addition, it is pointed outthat the meaning of the term varied in different societies and that it had changed"continuously in response to political, economic, social and cultural changes".
If international consensus on the meaning of the term is reached on the basis ofconstructing explicit, legal norms while in reality it appears so varied and context-bounded due to the importance of implicit, i.e. cultural norms, it is difficult to drawany general conclusion and initiate any wider action targeting the "affairs" ofapproximately 1 billion (525 million young men and 500 million young women) ofthe "statistically defined" youths in today's world. How relevant for the generalisationon the youth affairs is the fact that 85% of the total number of the "statisticallydefined" young people live in developing countries (with 60% in Asia alone and 23%in Africa, Latin America and the Caribbean), where resources for their developmentare scarce and where life expectancy is far shorter; or that 6,5 % of the world's"youth" live in transitional countries that are faced with the deterioration of life due toincrease in poverty? In addition, how important for the generalisation on youth is theestimation that some 19% (57 million young men and 96 million young women) of atotal number of "youth" from developing countries are illiterate and much morefunctionally illiterate to benefit from scientific and technological development; thatmore than half of the world's refugees are children and adolescents and that around 70million young workers around the world are unemployed and with no real possibilityto earn for decent living in the future?
Thirdly, partly because of the fact that youth has been treated as a transitional stagebetween two "solid" life-span periods and partly because of large varieties of theyouth’s implicit and explicit features, as well as of its contextual determinants, youngpeople were until very recently left out from any youth-specific system of protectiondespite the fact that they have been faced with risks more than any other age group.Indeed, it can be said, that young people are one of the most vulnerable segments ofthe population in modern society because of their specific transitional status: they areno longer protected as children and they still do not enjoy all the possibilities andadvantages available to adults. They are divided in two age sub-groups with differentlegal status – those up to 18 years of age, which still enjoy all the protection and thebenefits society bestows upon children, and those that have come of age after whichthey are faced with all the responsibilities and rights of adults. Thus, the young, to putit shortly, “from one angle, they still look like children; from another, they are alreadyadults. In fact, they are both – and neither” (UNICEF, 2000).
When these legal and administrative boundaries are removed we are met with athreatening situation well described in the 1995 UN Secretary-General Report inwhich it is pointed out that hundreds of millions of young people in the world directlysuffer from:
• the decline in official development assistance, which undermines thecapacity of many countries to meet development needs;

10
• the external debts and the trade imbalances which have a crippling effecton low income and developing countries;
• structural adjustment programmes which are insufficiently attentive tosocial problems;
• conflicts, violence and wars that disproportionately affect young people;• the incidence of poverty and unemployment that imperil the opportunities
for sustainable livelihoods of young people;• the effects of drugs and crime on youth, in general, and on youth at risk, in
particular.
The above is echoed in the European Youth Trend Report of the Directorate of Youthand Sport of the Council of Europe that describes the situation in the following way:
"Young people have been successful in adapting to a number of unpleasant circumstances.However, this fact does not distract our concern about overt actions that lead to theexclusion of a large number of young people from equal opportunities, from equity ineducational provision and from obstacles to decent and fair employment. This is furtherconfounded by elimination strategies that put youth in risk situations, such as those thatfoster prolonged and enforced dependency and that obstruct the development of relevantcompetencies and skills. It is unfortunate to note that young people's aspirations andexpectations are often defined and managed by adults who have become experts inproposing strategies through which they can exclude young people from decision-makingprocesses and social and educational benefits while, at the same time, appearing to offerparticipation and acquisition at all levels on a silver plate."
Indeed, the transition into the so-called world of adults is becoming more complex,because the institutionalised educational process lasts longer, modern technologicalchanges demand an ever more flexible and qualified work force, and economic trendscause a cyclic increase of unemployment which, before all, affects the young. Theresult of this is a slower entering into the so-called world of labour and a generallyslower gaining of socio-economic independence, which is why the young are forciblykept in a dependent position. Congruent with the difficult inclusion into professionallife, there is procrastination in starting a family, as well as a minimal inclusion ofyouth in other public spheres, especially the political one. Hence, it is common thateven after the young come of age and, in principle, receive all the rights of citizens,and even though some of them already occupy certain permanent social roles, they arekept away from the decision-making process. The problems that trouble the youngare, thus, still mediated into the public sphere by the older population who, in thesame time, makes decisions. The reaction of the young to this situation is different -from a relatively unproblematic adaptation to the given society, through retreat intoseparate sub-cultural patterns of life, to open rebellion and/or manifestation ofdifferent forms of deviant behaviour. But, regardless of the type of reaction, it iswithout doubt, that most young people isolate themselves, more or less, from the adultworld, what additionally affects the speed and quality of their full social integration.
Fourthly, the recognition of youth (understood integrally) as a beneficiary of specificpolicies is of the latest origin. These policies have appeared recently at international,European and same state levels, with a view to counter disadvantageous position ofyoung people as a means of promoting economic growth and well-being of the societyas a whole. Nevertheless, the formulation of international, regional and/or nationalyouth priorities, policies and action plans of a comprehensive nature need to be

11
viewed in two ways. In the one hand, they introduce common standards ofachievement which are particularly important for those countries that do not recogniseyouth as a coherent social group with specific needs and, thus, disintegrate youthinterests treating them as part of education, health, employment, culture etc. policies.On the other hand, since economic, political, social and cultural contexts of youthdevelopment varies intra-nationally and inter-nationally, these standards may actuallyappear inappropriate for many developing countries in the world, as well as inEurope. Namely, the governments may, under international pressure, developambitious youth priorities and policies that match global and regional standards butare ‘thin’ at the level of implementation strategies and resources, as well as in analyticand empirical basis for promoting and evaluating the changes. If the implementationmeasures do not accompany national youth policies and if international/regionalassistance is not provided to support the implementation of international/regionalstandards especially in those counties that lack necessary organisational and financialresources, the whole process may turn to be nothing but political rhetoric. This "threatof rhetoric" is also possible if youth priorities and policies remain solely inspired byeconomic needs and if the request for youth participation and empowerment is seen asan instrument for gaining economic benefits, apart from a complex set of vital youthneeds.
1.2. Burden of transition
These threats especially concern young people living in transitional societies who arein a more disadvantaged position than their peers in Western Europe or the previousgenerations of youth (Young People in Transition 2000). Their development ismarked by a double passage: the one that reflects the universal stages of growing upand the other that has to do with fundamental transformations of their societies. In thesame time, while social institutions, processes and norms that are important for theirgrowth have weakened, become disabled or are thoroughly transformed, newperspectives, as well as hopes have also emerged. Consequently, young peopleexperiencing transitional changes are much more exposed to risks unknown to thegeneration of their parents or to their peers living in stable European democracies.
An analysis of youth problems in 27 transitional countries made by the UNICEFInnocenti Research Centre (Young People in Changing Societies 2000) detects basicdiscrepancy between the attitudes and capabilities of the young, on the one hand, andtheir actual achievements, on the other. The survey has shown that the young intransitional countries are more supportive of market and democratic reforms than theolder population, but participate less in the political processes; they are interested insocial and political life of their countries, but are critical and sceptical towards thefunctioning of new democratic institutions; they are exposed to higher health risksthan before, and their access to relevant information and services is insufficient; theyshow considerable tolerance toward different forms of illegal behaviour and are inconflict with the law more often than the previous generations of youth; they ascribegreater importance to education than earlier, but are less likely to complete highereducation levels; they accept family values, but are more likely to postpone or avoidestablishing their own family than the previous generations; they show a high degreeof flexibility and acceptance of new economic strategies but the unemployment rate is

12
still at least twice as high among the young as among the older population. If wecompare these trends with the ones from the pre-transition period, it may be said thatthe condition of today’s youth has worsened.
This analysis also points to the similarities and differences between the young intransitional and developed European societies. For example, smaller number of youngpeople from transitional societies tend to finish higher levels of education along withthe trend of lower educational achievements of those having lower social background;the rate of underage pregnancies is higher; they use psycho-active substances as muchas their Western peers, but will rarely describe themselves as healthy and happy; theyhave less conflicts with the law but are more likely to be more severely punished; theyare more affected by unemployment; the discrepancy between the earnings of theyoung and the old is somewhat smaller than in the developed countries, but thesalaries are generally much lower; they are more exposed to exploitation by theemployers on the so-called black market and within the increasing grey economy;they are less likely to participate in the political and social life of their countries thanthe young from the developed countries, etc.
Having in mind that participation, empowerment, solid knowledge and employabilityare proclaimed as the top priorities in promoting and strengthening youth capital inthe world, in general, and in Europe, in particular, one should ask, aware of thedifferences between the position of youth in the transitional and developed Europeandemocracies, how the goals may be attained efficiently under such circumstances. Theenthusiasm that now accompanies the idea of youth participation and empowermentas a means to democratic development and economic growth may turn to be a short-lasted experimentation with the hopes of millions of young people if the conditionsfor the realisation of that idea are not taken into account seriously and if no suggestionis made on how to deal efficiently with the obstacles.
It has often been stressed in recent years that Western and Eastern Europe now sharesame goals (prosperity and well-being of all) and utilise same tools (democracy, therule of law, pluralism, free market, etc.). Notwithstanding, it is well known that thedeveloped and transitional democracies have different positions in the process ofchange, including the quest for mainstreaming the youth into such process. In WesternEurope the changes are promoted through advancing of existing structures, while inthe East they require building up of an entirely new social order by neutralising theone from the past, as well as by removing the obstacles that have emerged in thecourse of transition (Education for All 1998; Women in Transition 2000). More than adecade long decline in the average real income per capita; increase in poverty;weakening of welfare support systems; the rise of gender segregation; sharp decreasein the development of human potential; the rise of lawlessness, nepotism, corruption,violence and crime; the hostilities on national/ethnic/religious grounds; brain-drain ofthe highly educated, in short - a degradation of the quality of life of all – more or lessmark the background against which young people in transitional democracies areexpected to fight their position in the society. Although the outcome of this battlelargely depends on knowledge, skills and commitment of young people, a great dealof responsibility still lies within the governments for opening far more space for anactive participation of their youth in the process of change.

13
1. 3. Croatian youth at the crossroads
Croatian youth share many characteristics with their peers living in transitional, aswell as in the developed European democracies. In the same time, they have somespecific features due to their experience of war and war-triggered processes. Someauthors (Županov, 1995; Ilišin, 1999) even argue that contemporary Croatian societyis marked by anomie, i.e., by the lack of shared social visions and norms that guideyoung people in their personal and social development. The transition from socialismto democracy did not only mean national sovereignty and independence but four yearsof aggression and war, as well as a decade of nationalism and economic instabilitythat has particularly targeted young people. Instead of democratisation and economicrecovery, Croatian citizens were faced with an autocratic regime and an ill-definedprivatisation process that deprived the majority of their right to have a share in thedistribution of society’s resources which they themselves or their parents hadaugmented during socialism (Spajić-Vrkaš, 2003). Such political and social climate inwhich the words did not match the deeds, i.e. in which the idea of liberal democracywas washed out by arbitrariness and the lack of responsibility on the side of politicalleadership, created political and moral confusion that had detrimental impactespecially on younger people.
It is understandable, therefore, that the so-called ‘institutional optimism’ (Kasapović,1993), according to which it was expected that institutional and politicaltransformation will automatically produce other desirable social changes, was soonreplaced by disappointment of a great many people not only with the country’spolitical leadership but with the politics of the developed countries, as well as with therhetorically protected values of liberal democracies. Consequently, the enthusiasmthat accompanied the gaining of the state independence, national affirmation and theabolition of political totalitarianism gradually turned into resignation anddissatisfaction, while the democratisation of society occurred to a very limited extent.
This is the background against which young people have been, especially after theelection of 2000, expected to play an important, if not the major, role in the country’stransition processes. However, as it has been documented in The National Programmeof Action for Youth (2002), there are many obstacles to an active and responsibleparticipation of Croatian youth in the process of democratic development, includingthe following:
• Croatian population on the average is becoming older - According to the data ofthe State Institute for Statistics based on the 2001 population census, there are898,734 young people between 15 and 29 years of age in Croatia (20.25% of thetotal population). When this number is compared to earlier data, it becomesobvious that the percentage of young persons in the total population has been onconstant decline since the beginning of 1950s. In 1953 the young made 27.73%of the population. In only eight years (until 1961) their number fell to 23.75%and continued to fall slowly until 1981 when they made 23.34%. Anotherimportant decline was registered in 1991 when young people comprised only20.67% of the total population. If this trend continues in the future and noaffirmative measures are implemented, today's youth will have to deal with the

14
problem of supporting an ever-increasing number of non-active and retiredpopulation of Croatia.
• The number of young persons among the unemployed is increasing - Accordingto the data of the State Institute for Statistics, a total of 96,757 persons had beenregistered as unemployed by the Croatian Institute for Employment in 1984,while in 1991 this number rose to 160,397. In 1999 the unemployment rateamong the young was 34% during the first part and 39% during the second partof the year. By the end of December 2001, 395,141 unemployed persons wereregistered, of which 164,365 or 42% were between 15 and 29. In this age group,78.5% had secondary, high school or bachelor’s degrees; 7% had completedelementary school or were semiskilled, and 14% were unskilled.
A particular problem for the unemployed youth is the requirement of workexperience for employment. At the end of October 2001, there were 82,472young persons or 51% of all looking for job without suitable work experience.On average, 57% of young persons wait up to one year for job; 31% from one tothree years, and 12% wait longer than three years. According to educationallevel, in 2001 skilled and highly skilled workers had the highest rate ofemployment (33,152 and 46%, respectively), whereas those with collegedegrees had the lowest rate (3,462 or 5%).
• Education and training of young people does not meet their professional needssatisfactorily – Elementary school in Croatia, which is compulsory, lasts foreight years, while secondary school, which is not compulsory, lasts for 2-4years. According to the data of the Ministry of Education and Sports, about 95–97% of the elementary school graduates enrol in secondary schools andapproximately 85–90% of the secondary school students graduate within aregularly allotted time period. In addition, during 2000/2001 academic yearthere were approximately 120,000 new students at tertiary education level.Some 33% of the enrolled complete university study, 8% of which finish itwithin the allotted time period.
In reference to young school leavers, Croatia has no systemic data on those whocontinue their training in adult education institutions. The report of the Ministryof Education and Sports show that during 2000/2001 there were some 370Croatian institutions (secondary schools, open universities, etc.) that offeredaccredited programmes in which approximately 25,000 persons were trained, ofwhich 11,000 acquired new profession either through retraining or additionaltraining programmes. However, no information on young people in theseprogrammes is available. Moreover, pupils and students’ loans and grants are either non-existent orinsufficient, as are all other aspects of students’ life, including the capacities ofdormitories for secondary school and college/university students, enrolmentpolicy, the regime of study, etc.
• Young persons enter marriage at an increasingly later age - The number ofyoung persons who enter marriage prior to 29 years of age is declining (from38% in 1981 to 32% in 1991), while the number of divorces among those who

15
are younger than 29 is increasing (from 2.5% in 1981 to 3% in 1991), and thepercentage of unmarried persons between 25-29 years of age has lately been35%. When analysed together with the data on employment and training, thesefigures indicate that young people in Croatia are forced to remain dependent ontheir parents' support and assistance far beyond the age of their legalindependence.
• The number of young persons using psychoactive substances is increasing - Theresults of investigations conducted in 1999 (ESPA99) among first-yearsecondary school students in Croatia demonstrated that 30% of the boys and25% of the girls smoked more than one cigarette daily; 37% of the boys and19% of the girls had become drunk three or more times in their lives; 18% of theboys and 13% of the girls had used marijuana at least once in their lives, and 4%of the boys and 5% of the girls had used heroin. Besides, some studies onsecondary school students have shown that 30% of them are emotionally, 16%physically and 8% sexually abused, as well as that 13% are neglected and 34%have witnessed violence.
• The influence of young people in social and political matters is extremelyreduced - Despite the fact that young persons aged 18-29 make 22% of theCroatian electoral body and that they constitute 15-30% of the total membershipof political parties, they are extremely poorly represented in the structures ofboth local and central government. While under socialism young peoplecomprised 5-9% of all the seats in the Parliament, from 1990 the percentage ofyoung representatives has not exceeded the level of 2%. In addition, during thelast decade the interest in politics and political events among the young hasdecreased significantly. By the end of the 1990s, only 5% of them declared tohave particularly great interest in politics.
• The participation of young persons in civil initiatives is increasing but remainslargely unrecognised by the authorities - Among 360 associations in Croatiafocused in their work on children and youth, there are 130 associations run byby young persons, as well as 30 active informal youth groups. Since there are noappropriate institutional mechanisms responsible for youth in Croatia, theiractivities are based on self-initiative and independent voluntary organizationalforms, such as NGOs, associations of citizens, informal youth groups, etc. Themajor part of their activities has not been recognised by law (e.g. volunteerwork). Besides, due to a non-existent system of care and support for their freetime, a vast majority of young people are still dependent on NGOs, religiouscommunities and, partly, on local and regional self-management.
Being aware of the impact these obstacles may have on the participation of youngpeople in democratic development of Croatia, two more issues remain to be discussedhere. The first issue relates to the way how young persons perceive themselves in thecontext of a changing society; how they assess their needs and define their personaland professional aspirations, while the second issue relates to the government policiesand programmes that, beyond mere rhetoric, aim at supporting young people toassume their social roles in building up their future. Since both of these topics areimportant for the interpretation of results of our present research that will be discussed

16
in detail later, we shall briefly describe the findings of previous research, as well asthe initiatives undertaken by Croatian government in this field.
2. EARLIER RESEARCH ON YOUTH IN CROATIA
Croatia has relatively long and well-established tradition of research on youth datingback to the 1970s (Mihovilović 1978; Ilišin, Radin and Županov 1986; Radin 1988;Omladina i politika 1988; Štimac 1989; Ilišin at al. 1990a, 1990b; Magdalenić 1991;Lalić and Nazor 1997; Ilišin 1999; Grubišić and Zrinšćak 1999; Sakoman, Kuzmanand Raboteg-Šarić 1999; Mladi i zapošljavanje 2000; Goja 2000; MarinovićJerolimov 2000; Labus 2000; Mladi Hrvatske 2002)
One of the most comprehensive recent studies is the Value System of Youth and SocialChanges in Croatia that was conducted in 1999 on a representative sample of 1700young people aged 15 to 29 by the Institute for Social Research in Zagreb. Since itsreport (Ilišin and Radin 2002) includes comparison with earlier studies, especially theone on the Position, Perceptions and Behaviour of the Croatian Young Generationconducted by the same research team in 1986, we shall, in our present discussion,mostly rely on its findings.
In the middle of 1980s, when the first comprehensive research on youth wasconducted, Croatia was part of the Socialist Federate Republic of Yugoslavia. Itspolitical system was known as self-management socialism that was based on a set ofideological values, such as the supreme authority of the Communist Party and itsleader J.B. Tito, brotherhood and unity of the constitutional nations and ethnic groups,social ownership, workers’ self-management, class conflict-free society, etc. Contraryto political and civil rights, which were rather limited, citizens were guaranteed arelatively high minimum of social rights (employment, solid health care andretirement insurance, equal chances in education, the right to public housing, etc.).Following Tito’s death, the system faced economic and political crisis that reached itspeak by the end of 1980s. This was accompanied by, in the one hand, an increase inliberal-democratic ideas and, in the other hand, an escalation of inter-nationalconflicts that soon ended up in war bringing about the fall of both political regime andYugoslavia.
Due to decrease in political pressure and in the importance of moral-political‘adaptability’ of the individual, as well as due to an increase in the quality ofeducation and to greater opportunities for travelling abroad, young people, by the endof 1980's, became most pronounced critics of the proclaimed socialist value systemand the most outstanding promoters of fundamental social and political changespertinent to, in the one hand, liberal-democratic ideas and, in the other hand, nationaland religious renewal. Although largely ignored in the beginning, this division soonbecame an important factor of Croatian youth identification and developmentprocesses.

17
More than a decade later, when the second research was completed, the context inwhich young people grew up was quite different. The pace of recovery from theeffects of the four-year aggression was rather slow. The new political system of 1991that nominally stressed the importance of liberal-democratic values, such as marketeconomy, private property, political pluralism, the rule of law, the protection ofhuman rights and the rights of minorities, in reality promoted the idea of nationalhomogenisation and integration, the renewal of traditionalist values, non-transparentand arbitrary privatisation processes and the monopoly of one political party and itsleader. The ill-guided process of privatisation of social property significantly reducedeconomic and social rights of the majority of Croatian citizens in terms of thedeterioration of living standards, mass unemployment and sharp inequalities. By theend of 1990s, the advantages that Croatia had enjoyed in the beginning of thetransition processes had disappeared, and the country was faced with the fact that itwas lagging far behind in the processes of transition and European integration. Thiswas the strongest impetus for the majority of Croatian citizens, including the young,to require new social changes in the end of 1990s.
The research on the Value System of Youth and Social Changes in Croatia was set upwith a view to find out how a decade long social and political changes were reflectedon Croatian youth. Here are some of the most interesting findings:
• Young people in Croatia believe that the pre-adult period lasts up to 29 years ofage. In reference to this, they are divided into a youth-centric and an adult-centric group. The youth-centric group has slightly increased in number whencompared to the 1980 research. It is mainly composed of those who have bettersocial origin, who are younger and still enrolled in education at secondary ortertiary level. The group is characterized by the desire to stay different from theadults for as long as possible, including the avoidance of socio-economicindependence and the tendency to move the upper limit of youth period into thethirties. The adult-centric group does not think of itself as different from theadult population and is more prone to accepting paternalistic attitudes of theadults towards the young. The group consists mainly of young people who areclose to their thirties, who belong to lower-class families, hold blue-collar jobsand are either employed or unemployed. In regards to their perception of future,optimism prevails although it slightly decreases with age and working condition.Interestingly, there is no significant difference in the expressions of optimism orpessimism between the young from the 1990's and those from the 1980's,despite the fact that social and political contexts of their coming of age hadchanged essentially.
• The value hierarchies and structures of the young follow basic social changes. Insum, the young see their future more as a goal that can be achieved exclusivelyby depending on one's own strengths, including the support of their friends andthe family, and not on the institutions of society, least on the political ones. Thegreatest differences between the 1986 and the 1999 samples are found inrelation to material status, independence and professional achievement, as wellas to political power and tradition (especially nationality and religion), all ofwhich are more appreciated by the 1999 sample. However, the later opted lessfor political affirmation, which is a general trend among young Europeans. In

18
reference to the value of religious belief, it seems that the young from 1999sample are much more religious than their peers fifteen years earlier. Theincrease has been registered on all dimensions observed. Interestingly, the youthdoes not perceive as inconsistent to have secular attitudes, e.g. towards sexualbehaviour or morality, that oppose the official standings of their religion.
• The structure of youth’s national awareness in all dimensions (attitudes towardone’s own nation, the European integration processes and other Europeannations) is heterogeneous. When compared to earlier research, the findings ofthe 1999 sample demonstrate an increase in the value of the nation andnationality while preserving openness towards the value of cosmopolitanism,pluralism and interculturalism. In relation to the issue of European integrationprocesses, the young differ as to whether they are more pro-European or anti-European oriented. Regardless of these divisions, Europe is perceived, by themajority of youth, as an attractive social space that offers better opportunities forpersonal development. However, the data on social distance that is greatertowards the neighbouring Eastern European and non-catholic nations thantowards geographically more distant Western European and catholic nations ismost probably the outcome of political ideology of ethnic nationalism (includinga hierarchical division between the developed West and underdeveloped East)that dominated during the 1990’s.
• The young from the 1999 sample show an increase in distancing from the publiclife but, at the same time, think they should be more present in the political lifeof the country. In addition, they demonstrate a relatively solid understanding ofsocial reality. As the greatest problems of Croatian society, they emphasizeunemployment and economic stagnation. Thus, political priorities they mentionfocus on the fight against unemployment, social justice and security. They alsostress the importance of basic democratic values while showing distrust towardsmain government institutions. In addition, they are more inclined to social thanto political activism, and they believe they are politically marginalized morebecause of distrust the society has towards them than because of their ownincompetence. The data about their political party preferences demonstrate thatthe young are divided into two groups. The first group that supports more leftistpolitical parties is composed of those young persons who are better educatedand are non-religious, who have higher social and urban background, whounderstand democratic principles better and who refuse paternalistic attitudestoward the young in the society. The other group that is more inclined to rightistpolitical options is made of those young persons who are less educated and arereligious, of lower social and rural origin, the youngest, who understanddemocratic principles less, who see their own generation as incompetent, and, toa larger extent, accept the tutorial function of society towards the young.
• The young from the 1999 sample have relatively pragmatic expectations fromeducation; they see it as a means for personal development (solving existentialproblems, getting a desired job and becoming socio-economically independent).The importance of education as a means for social promotion (gaining a bettermaterial standard and a prestigious social status) is not so pronounced. School isleast mentioned as an instrument for developing youth interests for participationand responsibility taking in the course of political and social changes. The

19
results indicate that higher expectations from education appear in aneconomically and culturally deprived segment of youth, to whom education, inthe absence of other mechanisms, still presents the main, if not the only meansof economic and social promotion. Contrary to them, the young with highereducation, living in developed urban areas and having highly educated parents,are much more critical while assessing the importance of school for their ownprofessional and social promotion.
• The assessment of work values in the 1986 and 1999 research show that theexpressive meaning of work became equated with its instrumental function.There is also an indicative increase in the value of social interaction. The twomost important values mentioned are self-realization through work and materialorientation. Another difference appears in relation to work as an opportunity forself-actualisation through the development of one’s own potentials. The researchdata confirm that the acceptance of such a typical intrinsic value is the outcomeof the influence of education.
• Since the growth of unemployment within the youngest work-active populationthe young see as their most pronounced problem, it is understandable that theyfeel frustration (for not being able to step into the world of adults), apathy(which is manifested in their avoiding of social and political engagement) anddistrust in important institutions of the system, and that, because of this, they aremore and more ready to leave the country in search for a job and better life.When compared to the 1986 research, one notices a decrease in the share ofyoung people who have to provide for a family, as well as an increase in thenumber of those forced to earn for living. Almost two fifths of the young,mostly of urban background, with completed high school education and fromolder age cohort, have participated in some form of unregistered or greyeconomy employment.
• In reference to the young leisure activities, the comparison of data from the1986 and 1999 research indicate that there has been an increase in the youngpeople’s interest in most investigated phenomenon, but that their hierarchicalstructure stayed unchanged. The most preferred activities of both samplesbelong to private sphere of life (friends and acquaintances, fun andentertainment, sex and love, travel), while the interest in the public sphere(politics, army) is smaller than before. These interests are structured into fourorientations: cognitive, sociable, traditionalist and competitive. In addition, theparticipation in most leisure activities has weakened and the most commonpattern of spending leisure time is urban one (socializing, going to cafés, discos,parties and concerts). The analysis also indicates that youth people with highereducation, of urban background and higher social origin tend to accept cognitiveand sociable interest orientations more than their rural and less educated peers.
• The abuse of psychoactive substances (tobacco, alcohol, psycho-pharmatics andthe so-called, soft and hard drugs) increased during the 1990s. The youngbetween the age of 20 and 24, especially students of urban background weredetected as the risk group.

20
Due to an increase in unemployment, decrease in the quality of everyday life andincrease in socially inappropriate forms of behaviour among the young, the 1999research report comes to the conclusion that transitional societies are not only thesocieties of greater opportunities but of greater risks and insecurity. The reaction ofyoung people to such challenges is manifested in their retreat into privacy, theirhigher level of self-dependence, as well as in their greater distancing form social andpolitical affairs. Having in mind the shift in political power after the elections of 2000,it is important to detect the changes, if any, among the youth studied in 1986, 1999and 2002. This is the issue that we intend to discuss later while reporting on thefindings of our present research.
3. NATIONAL PROGRAMME FOR YOUTH
3.1. Goals
The National Programme of Action for Youth the Republic of Croatia was launched in2002 as a means of implementing the Article 62 of the Constitution of the Republic ofCroatia that establishes the duty of the state 'to protect maternity, children and youth,as well as to create social, cultural, educational and material and other preconditionsfor promoting the right to live in dignity'. The Programme defines a set offundamental principles of the government policy on youth between 15 and 29 years ofage, and defines the working plan that guides different segments of central and localgovernment and self-government, as well as public institutions and non-governmentaland civil organisations in the implementation of these principles.
The strategic goals of the Programme are as follows:
• promotion of legislation addressing the needs and problems of youth;
• defining the tasks of individual spheres of competence, the authorized bodies ofthe government administration and the public institutions in fulfilling theinternational, constitutional and legal obligations of the Republic of Croatiarelated to youth;
• improvement of the quality of life of all the citizens, especially youth, takingtheir interests into consideration and pursuant to the European standards andmodels of good practice;
• inclusion of the greatest possible number of young persons in decision-makingprocesses, especially in regard to their needs and problems;
• reducing the average age of the administrative structure;
• mobilization of all factors in the society, especially youth, for creating newvalues pertinent to promoting self-sustaining development, European integrationprocesses, democratic society and the rule of law;

21
• promoting the prerequisites for the affirmation of youth, the reduction of theiremigration rate and the return and integration of emigrants into the Croatiansociety;
• building a constructive partnership with NGOs and local and regional self-government for the benefit of youth.
The realization of these goals is based on the principle of multilevel and cross-levelco-ordination and co-operation. Relying on the principles of decentralization, the taskof the governmental bodies that are the primary implementers of the Programme isnot only to co-ordinate but, whenever possible, to leave the realization of goals tolocal self-government units, youth NGOs and NGOs for youth, universities and otherautonomous segments of civil society pursuant to assigned tasks in the Working Plan,with a view to enable them to accept gradually the role of the organizers andindependent implementers of the Programme.
Some of the basic goals of the national policy toward youth refer to the following:• protection of human rights and the fundamental freedoms; • promotion of mutual respect and understanding among young persons of
different sexes, races, nationalities, social origins, religious affiliations,cultural orientation, political convictions and other characteristics;
• prevention of all forms of violence, intolerance and discrimination;• promotion of active participation of youth in decision making at all levels;• the promotion of peaceful resolution of social conflicts, cooperation, and
mutual respect among the nations;• promotion of volunteer work and socially beneficial activities;• the introduction of an open system of formal and informal education, as well
as the promotion of a continuous and life-long skill-oriented learning;• reduction of social marginalisation, exclusion and inequality;• promotion of all forms of employment, self-employment and entrepreneurship
for young people;• encouragement of young scientists, researchers, innovators and technologists;• solving of the youth housing problems;• promotion of youth mobility, infrastructure and funds;• provision of adequate healthcare and family planning services;• support of youth NGOs and NGOs for youth;• advancement of youth information and counseling systems;• promotion of scientific research on youth, etc.
3.2. Working Plan It is expected that the implementation of the Programme is performed according tooperative plans containing specified activities together with deadlines, financialindicators and resources, and the bodies within the public administration systemresponsible for implementation. Thus, the Working Plan defines the measures andidentifies the primary implementers of the Programme within a five-year period(2003–2008). Public administration body in charge of youth issues (at present the
22
State Institute for the Protection of Family, Maternity and Youth) is responsible forco-ordination of implementation of the National Programme, as well as for annualreports to the Government of the Republic of Croatia on the progress made in itsimplementation. The Working Plan turns the above-mentioned goals into the implementation measuresand defines the governmental bodies, public institutions and other relevant bodies thatare either individually or collectively responsible for their implementation. It alsocontains recommendations to local and regional self-government units and NGOspursuant for the realization of the Plan. The measures and their implementers aredivided into eight areas previously defined by the National Programme, as follows:
1) education and informatization2) employment and entrepreneurship3) social policies4) health care and reproductive health5) active participation by youth in the society6) building civil society and volunteer work7) youth culture and free time, and8) mobility, dissemination of information and counseling.
In principle, each measure is related to more than one implementer. Respective oftheir area of responsibility, among the main implementers at the level of governmentare the Ministry of Education and Sports; Ministry of Science and Technology;Ministry of Health; Ministry of Labour and Social Welfare; Ministry of Justice;Ministry of Trades, and Small and Medium-Sized Entrepreneurship; Ministry forEuropean Integration; Ministry of Culture; Ministry of Public Works, Renewal andConstruction; Ministry of Interior Affairs; Ministry of Maritime Affairs, Transportand Communications; Ministry of Agriculture and Forestry; Ministry ofEnvironmental Protection and Spacial Planning; Ministry of Defense; Ministry ofFinance; and the Ministry of Tourism. In many instances the ministries share their responsibility for the implementation ofparticular measures with their special institutions, such as the State Institute for theProtection of Family, Maternity and Youth and the Institute for the Advancement ofEducation, as well as with number of governmental offices, committees and otherbodies, including the Office for Co-operation with NGOs of the Government of theRepublic of Croatia; Office of the Government of the Republic of Croatia for HumanRights; Office of the Government of the Republic of Croatia for the Prevention ofAddiction; Office of the Government of the Republic of Croatia for NationalMinorities; the Committee of the Government of the Republic of Croatia for Personswith Disabilities; the Committee of the Government of the Republic of Croatia for thePrevention of Disorders in Behaviour of Children and Young Persons; and theInstitute of the Government of the Republic of Croatia for the Prevention ofAddiction. There are, as well, number of public institutions with the mandate to co-operate withthe above mentioned implementers in the realization of the Plan, including theInstitute of Public Health of the Republic of Croatia; Office for Employment of theRepublic of Croatia; Croatian Institute for Employment; Croatian Institute for PublicHealth; Croatian Institute for Statistics; Croatian Council for Traffic Safety on the

23
Roads; the Office for the Prevention of Addiction Abuses and CARNet (CroatianAcademic and Research Network), as well as local organisations and local self-government units, NGOs and civil associations, in particular Croatian Red Cross andCroatian Student Organization.

24
Part two:
PRESENT RESEARCH ON CROATIAN YOUTH

25
1. THE PURPOSE AND OBJECTIVES OF RESEARCH
The main aim of the project was to provide empirical data on life, needs, attitudes andexpectations of young people from Southeastern Europe in the context of the Councilof Europe’s process on youth policy reviews focused on improving youthparticipation in democratic changes of the countries in the region. Thus, one of themost important practical objectives of the project was to present the results to thepublic with a view to initiate the discussions about young people in the media andamong politicians and decision-makers, as well as to assist youth organisations indeveloping national youth strategies that better respond to the needs and aspirations ofyoung people.
2. METHODOLOGY
2.1. Questionnaire
The research instrument was jointly developed in form of a questionnaire by regionaland Swedish experts. The original version consists of 36 questions encompassing awide range of topics, such as:
• Basic socio-demographic characteristics of the respondents; • Family conditions;• The use of computer; • Respondents’ and their parents’ educational background and occupation; • Attitudes towards present and future life of their own, their closest friends and their
peers in Western Europe; • Plans for the future: education, occupation and a residence place;• Feelings about school or university;• The abuse of psycho-active substances;• Main sources of information about the country and the world;• Free time; • Self-(dis)content;• Perception of relations with parents, friends and teachers;• Imagining himself/herself in a 10-year time;• Respondents’ comments on the content of the questionnaire.
Croatian version of the questionnaire consists of five more questions that wereincluded in the original form with the purpose to obtain the country specific data onthe following issues:
• Perception of major youth problems in Croatia today;• Perception of those social actors who bear greatest responsibility for solving
youth problems;• Perception of measures that should be taken to start solving youth problems
more efficiently;

26
• Personal importance of certain values;• Perception of importance of certain values for individual promotion in
Croatian society.
2.2. Sample
The research subjects were randomly chosen among the members of the householdsaged 15-25 and living on the territory of the Republic of Croatia. The settlementswere selected by the following criteria:
number of households type of settlement (rural-urban) number of inhabitants that satisfy basic demografic criteria (15-25 years of
age) other demographic variables spacial arrangement.
The number of subjects in the sample was determined on the basis of a total Croatianpopulation aged 15-25. The representativenes of the sample (+ 4%) was controlled inreference to age, gender, place of living and other demographic variables (level ofeducation, marital status etc.) of the subjects.
During the data collection process a total of 9993 phone calls were made. All phonecalls were divided into the following categories:
o no answer call (1317 calls – 13.18%) o phone numbers belonging to enterprises (149 calls – 1.49%) o inadequate person by one or
more criteria (age, sickness, foreigner) (5784 calls – 57.88%) o fax/modem number (47 calls – 0.47%) o non-existing number (403 calls – 4.03%) o disconnected questioning (80 calls – 0.80%)o phone orders (194 calls – 1.94%) o persons who accepted to be questioned (1003 calls – 10.04%) o refused to answer (571 calls – 5.71%) o busy line (396 calls – 3.96%) o automatic machine (49 calls – 0.49%)
In all, 1003 or 10.03% of the total number of persons called by phone answered thequestionnaire. Other persons were labeled either as inadequate (5784 or 57.88%), i.e.as those who failed to satisfy one or more criteria of selection (age, health, etc.) or asnon-reachable persons.
In the end, the answers of a total of 946 respondents were processed. The remaining57 respondents, i.e. those having 25 years of age, were removed from the list in orderto make our findings comparable to earlier Croatian research on youth, all of whichhad the samples divided into three age-groups: 15-19; 20-24 and 25-29.

27
The number of respondents per county is presented in the following table:
County Frequency Percent of a totalsample
1) Zagreb County 68 7,22) Dubrovnik-Neretva County 28 3,03) Split-Dalmatia County 100 10,64) Sibenik-Knin County 20 2,15) Zadar County 37 3,96) Osijek-Baranja County 69 7,37) Vukovar-Srijem County 47 5,08) Virovitica-Podravina County 21 2,29) Pozega-Slavonia County 20 2,110) Brod-Posavina County 38 4,011) Medjimurje County 27 2,912) Varazdin County 41 4,313) Bjelovar-Bilogora County 29 3,114) Sisak-Moslavina County 38 4,015) Karlovac County 28 3,016) Koprivnica-Krizevci County 25 2,617) Krapina-Zagorje County 29 3,118) Primorje-Gorski County 66 7,019) Istria County 42 4,420) Lika-Senj County 8 0,821) The City of Zagreb 165 17,4
Valid
Total 946 100,0
2.3. Methods
A. DATA COLLECTION
The collection of data was based on the CATI (Computer Assisted TelephoneInterviewing) method, which is well known for its speed, efficacy and precision. Itallows the administrator to sit by the computer while a specialized programme selectspreviously defined units of the representative sample that the administrator contactsby phone. The content of the questionnaire is displayed on the screen in front of theadministrator who marks the answers of the respondent on the keyboard. The result ofsuch a process is the creation of a dataset developing together with the collection ofdata. A high level of control throughout the process is one of the most importantadvantages of the CATI method. It is assured by the following:
an administrator is controlled by the main researcher throughout the process ofdata collection;
registration of answers is controlled by the AC programme on a daily basiswhich neutralizes the registration of inadequate (non-existent) values in caseof structured questions;
phone calls, quality of answers and duration of questionnaire are controlled bythe use of SPSS programme analysis.

28
With a view to meet the requirements of this research, a qualitative pilot-study wascarried on prior to the application of the CATI method. The study encompassed 8focus-groups and its aim was to test the adequacy of the method for the purpose ofthis research. Since phone contacts and the use of AUTOCATI programme proved tobe adequate as a means of data collection on a sample of young people, field visitswere conducted only in some rural areas where phone coverage was inadequate.
B. STATISTICAL ANALYSIS
SPSS programme (version 10.00) was used for statistical processing of data in boththe frequency and correlation analysis. The results of the former were presented infrequency tables, while the results of the latter were demonstrated in cross-tabs.
3. RESULTS
3.1. Frequency analysis and discussion: Regional Questionnaire
A. BASIC SOCIO-DEMOGRAPHIC CHARACTERISTICS
According to the data of the State Institute for Statistics based upon the 2001population census, a total of 4,437.460 people live in the Republic of Croatia. Thereare 898.734 young people between 15 and 29 years of age that comprise 20.25% ofthe total population. The total of the youngest youth sub-group (between 15 and 19years of age) is 298.606; middle youth sub-group (20-24 years of age) comprises305.634 people, while the total of the oldest youth sub-group (25-29 years of age) is294.493.
In the age-group that corresponds to our sample (15-24) there are 604.237 of youngpeople or 13.62% of the total population with 308.415 (or 51%) of males and 295.822(or 49%) of females.
Table 1: Gender
Frequency Percent
1) male 485 51.3
2) female 461 48.7Valid
Total 946 100.0
Table 2: Age

29
Frequency Percent
1) 15-19 498 52.6
2) 20-24 448 47.4Valid
Total 946 100.0
As Tables 1 and 2 demonstrate the distribution of the two features of our sample, i.e.of gender and age, corresponds to the distribution of these characteristics in Croatianyouth population. Although those belonging to the lower age sub-group (15-19) areslightly over-represented, the aberrations are minimal and have no significant impacton the representativeness of the sample.
Table 3: Nationality
Frequency Percent
1) Croat 902 96.2
2) Bosniak 10 1.1
3) Serb 12 1.3
6) Italian 3 .3
7) Albanian 2 .2
8) Roma 1 .1
9) Jew 1 .1
10) Montenegrin 5 .5
11) Other 2 .2
Valid
Total 938 100.0
According to national background (Table 3), young Croats are significantly over-represented in this research. This has been a constant feature of all studies carried onin Croatia from the middle of 1990s. In the 1991 population census, Croats made78.1% of the total population while, according to the Constitutional Law on HumanRights and the Rights of National Minorities, the remaining 21.9% was shared by 22minority groups: Albanians, Austrians, Bosniaks, Bulgarians, Czechs, Germans,Greeks, Hungarians, Italians, Jews, Macedonians, Montenegrins, Poles,Roma/Gypsies, Romanians, Russians, Russinians, Serbs, Slovenes, Turks, Ukrainiansand Vlachs. Five out of 22 were the so-called ‘new minorities’, i.e. the groups thatwere recognised as constitutive peoples/nations in former Yugoslavia (Bosniaks -formerly Muslims, Macedonians, Montenegrins, Serbs and Slovenes).
The census of 2001 has documented that Croatian society is becoming morenationally homogenised than it was a decade ago. Its ethnic structure went throughdeep changes during the 1990s mainly as the consequence of war-triggered(e)migration.
Table 4: Marital status
Frequency Percent

30
1) single 885 93.6
2) married 59 6.2
3) divorced 2 .2Valid
Total 946 100.0
Table 5a: Having children
Frequency Percent
1) yes 50 5.3
2) no 896 94.7Valid
Total 946 100.0
Table 5b: Number of children
Frequency Percent
1 39 78.0
2 11 22.0Valid
Total 50 100.0
Graph 1:
Expected age of parenthood
25-29
69% (534)
before 25
16% (122)
after 29
15% (116)
As we have expected, only 6.4% of the surveyed are married, including the divorced(Table 4), and only 5.3% of them have children (Table 5a). A great majority of thosethat are already parents have one child (78%) while the remaining one fifth (22%) hastwo children (Table 5b).
Similarly, as Graph 1 demonstrates, more than two thirds (69.2%) of those that aresingle and have no children plan to become parents between the age of 25 and 29.Almost the same small number of our respondents belonging to this group plans tohave children either before the age of 25 or after 29. It is interesting to note that over18% of the total number of respondents either did not answer this question or said thatthey had no idea when they would have their own children.

31
B. FAMILY CONDITIONS
We have seen above that only 59 or 6.2% of the total number of our respondents(N=946) are married. Data in Table 6a further show that almost half of the marriedlive separately - in their own households, while the rest live in co-habitation with theirparents.
Table 6a: Family pattern
Frequency Percent
1) living in his/her own household (spouse, children...) 34 3.6
2) living in his/her own household with parents 22 2.3
3) living with parents 225 23.8
4) living with parents, brother(s) & sister(s) 472 49.9
5) living with parents, brother(s) & sister(s) and grandma/grandpa
111 11.7
6) other 57 6.0
7) single 25 2.6
Valid
Total 946 100.0
Table 6b: Number of brothers & sisters in the household
Frequency Percent
1) single 300 34.7
2) 1 brother/sister 441 51.0
3) 2 brothers/sisters 96 11.1
4) 3 brothers/sisters 28 3.2
Valid
Total 865 100.0
Half of all non-married respondents live in families that comprise parents and onebrother or sister (Table 6b). About one fourth of all (23.8% of the total) live withparents only; more than one tenth (11.7% of the total) belongs to three-generationhouseholds and only 2.6% live single. In addition, half of the non-married live withone brother or sister; one tenth of them (11.1%) have two brothers or sisters and 3.2%have three brothers and sisters. The remaining one third (34.7%) of the total numberhave no brother or sister. Our sample’s typical two-child nuclear family pattern corresponds to nationalstatistics. Most Croatian families today live in two-generation households. This trendemerged after WW2 as part of socialist transformation and modernisation throughwhich large number of village inhabitants were moved to towns and large cities. Thisshift from a predominantly rural to an urban style of living led to a decrease innumber of persons per household reaching the level of 3.1 in the beginning of 1990s.Decrease in the average number of children per family has been observed especiallyin the last two decades due to many interrelated factors, including limited capacity ofpre-school child-care institutions (even today, only 35% of all Croatian children aged

32
1-5 are enrolled in pre-school institution which is far less favourable than in mostdeveloped European countries) and economic crisis.
Table 7: Number of rooms in the house
Frequency Percent
1) kitchen only 2 .2
2) kitchen with 1 room 32 3.4
3) kitchen with 2 rooms 184 19.6
4) kitchen with 3 rooms 265 28.2
5) kitchen with 4 rooms 287 30.5
6) kitchen with 5 rooms 170 18.1
Valid
Total 940 100.0
Table 8: Having a separate room
Frequency Percent
1) yes 763 80.7
2) no 182 19.3Valid
Total 945 100.0
Tables 7 and 8 provide more accurate picture on the family life of young people inCroatia. As the data from other sources confirm, majority of Croatian citizens live intheir own houses. Therefore, it should not come as surprise that one half of ourrespondents (48.6%) live in houses consisting of one kitchen with 4 or 5 rooms andthat other half (47.8%) have houses with one kitchen and 2 or 3 rooms. Only 3.6% ofthe total number of respondents live in unfavourable (kitchen with one room) orextremely restrained conditions (kitchen only). Notwithstanding, such interpretationshould be taken with precaution due to the fact that the term ‘room’ may havedifferent meaning in Croatian language. In its broader usage it means ‘space’ and thusmay refer to bedroom or a dining room, as well as to bathroom or a larder.
If our data are reliable, and having in mind that a typical family pattern of our sampleis a two-child-two-parent unit, as well as that majority of our respondents belong tofamilies that live in houses with three and more rooms, it is understandable thatalmost four fifth of them (80.7%) have no need to share his or her room with anybodyelse.
C. THE USE OF COMPUTER
In 1997, according to the UNESCO statistics, Croatia had 184 Internet hosts per100,000 (less than 0.2%) as compared to, e.g., 3,936 in Sweden. By the end of 2001there were 480,000 users registered which makes 10.8% of the total Croatianpopulation (at the same time, e.g., the number of computer users in Sweden rose to6.02 mil.).

33
Graph 2:
Use of computer
yes
69% (657)
no
31% (289)
Graph 2 confirms that the situation with the use of computers among Croatian youthin the end of 2002, when the research was conducted, was far more favourable than afew years ago. Almost two thirds (69.5%) of our young respondents confirm theirfamiliarity with new information-communication technologies. Moreover, as Table 9aand Graph 3 show, almost two thirds (77.8%) of all computer users in the samplehave computers at home; 12% have such access in education institutions (school anduniversities); about 4% use it either at their friends’ home or at work and less than 1%visit Internet cafés for the same purpose.
Table 9a: Place where computer is used?
Frequency Percent
1) at home 511 77.8
2) in friend’s house 27 4.1
3) in school 40 6.1
4) at the faculty 39 5.9
5) at work 25 3.8
6) Internet café 4 .6
7) other 11 1.7
Valid
Total 657 100.0
Graph 3:
77,8
124,1 3,8 2,3
0
10
20
30
40
50
60
70
80
home school friends work other
Place where computer is used

34
Table 9b: Reasons for not using the computer
Frequency Percent
1) has no computer 171 59.2
2) has no interest 94 32.5
3) he/she has no time 13 4.5
4) does not know how to use 11 3.8
Valid
Total 289 100.0
As presented in Table 9b above, among those young people that do not use computers(30.5 % of the sample), three fifths state that they have no computer while one third(or 10% of the total) declare that they have no interest in using it. In addition, a smallnumber of the computer non-users (less than 10% of the total) state that they eitherhave no time to work with the computer or that they do not know how to use it.
D. RESPONDENTS’ AND THEIR PARENTS’ EDUCATIONAL BACKGROUNDAND OCCUPATION
An additional feature of a demographic structure of our respondents refers to theirparents’ educational and occupational background. The data of the State Institute forStatistics based upon the 2001 population census show that the rate of illiteracyamong the population aged 15 and over is 2.9% and that it almost solely refers to theoldest age-cohort. Illiterate men make 0.6% and women 2.3% of the total population.
The data from Table 10a and 11a below confirm other studies conducted in Croatia,namely, that education between fathers and mothers, at the average level, is almostsimilar. Our findings demonstrate that 61% of our respondents’ fathers and 59.8% ofmothers have secondary school completed. However, despite the fact that numbers arenot high, the difference between these two groups exists at pre-secondary and post-secondary education level. There are 9.4% of our respondents’ fathers and 17.9% oftheir mothers with no education at all or with basic education only. Similarly, onefourth of fathers (25.2%) and one fifth of mothers (20.9%) have tertiary educationcompleted, including post-graduate degrees, while in the total Croatian populationaged 15 and over the share of those with higher education and university diploma is11.3%.
Table 10a: Father's educational background
Frequency Percent
1) no school 4 .4
2) primary school not completed 8 .9
3) primary school completed 76 8.1
4) secondary school completed 570 61.0
Valid
5) higher education completed 67 7.2

35
6) faculty degree 157 16.8
7) M.A. / Ph.D. 11 1.2
8) has no father 41 4.4
Total 934 100.0
Table 10b: Father's occupation
Frequency Percent
1) unemployed 32 3.6
2) retired 73 8.3
3) industrial, service and shop worker 393 44.7
4) clerk 185 21.0
5) professional with a high school or faculty diploma 114 13.0
6) director/manager 26 3.0
7) craftsman 13 1.5
8) employer/entrepreneur 16 1.8
9) individual farmer 28 3.2
Valid
Total 880 100.0
The fact that educational status of our respondents’ parents is higher than it is reportedfor the total Croatian population, especially for the tertiary education attainment, hasbeen largely expected. The parents of our respondents belong to generations born in1950s and 1960s and they received more education averagely than their own parentswho had attended schools a generation earlier.
Table 11a: Mother’s educational background
Frequency Percent
1) no school 7 .7
2) primary school not completed 24 2.6
3) primary school completed 137 14.6
4) secondary school completed 561 59.8
5) higher education completed 66 7.0
6) faculty degree 126 13.4
7) M.A./Ph.D. 5 .5
8) has no mother 12 1.3
Valid
Total 938 100.0
Table 11b: Mother’s occupation
Frequency Percent
1) unemployed 196 21.3Valid
2) retired 45 4.9

36
3) industrial, service and shop worker 263 28.6
4) clerk 299 32.5
5) professional with a high school or faculty diploma 89 9.7
6) director/manager 13 1.4
7) craftswomen 3 .3
8) employer/entrepreneur 6 .7
9) individual farmer 5 .5
Total 919 100.0
In reference to occupation (Table 10b and 11b), the majority of our respondents’fathers and mothers are employed as industrial, service and shop workers and clerks(65.7% of fathers and 61.1% of mothers) while 13% of fathers and 9.7% of mothersare professionals. This means that young people in our sample mostly come frommiddle social strata, far less of them have high-rank background in socio-economicterms and in terms of education and even lesser number belongs to the lower socialgroups.
Notwithstanding, it should be noted that there are important disbalances in thedistribution of occupation between our respondents’ fathers and mothers, especially inreference to unemployment (3.6% of all fathers and 21.3% of all mothers), as well asto workers’ and clerks’ jobs. Fathers dominate in workers’ jobs (44.7% as comparedto 28.6% of mothers) while mothers are over-represented in clerks’ jobs (32.5% ascompared to 21% of fathers). It is obvious, therefore, that women suffer more fromunemployment than men, which may only be partially explained by a lower level ofeducational attainment of the former. Also, the over-representation of men inworkers’ jobs and of women in clerks’ jobs corresponds to a long tradition of labourforce divisions by gender that may be found all over the world.
Table 12a: Level of school achieved by the respondent
Frequency Percent
2) primary school not completed 6 .6
3) primary school completed 375 39.6
4) secondary school completed 532 56.2
5) higher education completed 17 1.8
6) faculty degree 16 1.7
Valid
Total 946 100.0
Table 12b: Respondent’s occupation
Frequency Percent
1) secondary school student 372 39.3
2) high school/faculty student 263 27.8
3) unemployed 117 12.4Valid
4) employed 194 20.5

37
Total 946 100.0
Table 12a and 12b give an overview of the distribution of the sample by the highestlevel of school achievement and occupation. According to table 12a, majority of ourrespondents (56.2%) have secondary school completed; two fifths or 39.6% haveeight years of primary school completed and only 3.5% are with university and non-university diploma. When the data from Tables 10a, 11a and 12a are compared ittriggers our attention that an average educational background of our respondents islower than of their parents.
The reason for such aberration lies in the nature of the sample. Our respondents areyoung people aged 15-24. Those that are still in education at the post-secondary level(Table 12b) actually have only secondary school completed and are, therefore,included in Table 12a in the same category. Most Croatian university and some non-university higher education institutions (e.g. teacher academies preparing lowerelementary school teachers) last for four years and the average duration for thecompletion of the four-year study is between 7 and 8 years. This means that majorityof university and higher education students in Croatia finish their education after theyare 24 years of age. In addition, since there are 52.6% of young people aged 15-19 inour sample, a great many of them (39.3% according to Table 12b) is still enrolled insecondary schools and, thus, have no professional qualification.
Apart from the two fifth or 39.3% of our respondents who are still enrolled insecondary education, the data on their socio-professional status in Table 12b showthat more than one fourth (27.8%) of the sample is made of tertiary education levelstudents; that one fifth (20.5%) of them are already employed and that 12.4% considerthemselves as unemployed. These figures point out at important socio-professionaldifferences among young people, especially when we add those from 24-29 years ofage to the sample. Among relatively younger population there are more students andless employed or unemployed. The later two socio-professional groups get morerepresented later which means that more accurate social profile of Croatian youth maybe obtained by extending the age limits of the present sample to young people in theage of 24-29.
E. ATTITUDES TOWARDS PRESENT AND FUTURE LIFE
Tables 13, 14 and 15 below present data on our respondents’ attitudes towards theirpresent life, as well as towards the life of their closest friends and of young people inWestern Europe. As the results illustrate, three quarters (76%) of young people assesstheir present condition as good or excellent; slightly less (69%) have the same opinionabout the quality of life of their closest friends and about their peers in WesternEurope (71%). The average scores (Mean) are 3.9 (for their own present life); 3.7 (forthe life of their friends); and 3.9 for the life of young Westerners. Having in mind thatCroatia has not yet managed to pull its economy out of recession and that anunemployment rate, especially among the youth, is one of the highest in Europe, it isinteresting that a majority of young people in our sample has no significant objectionto their own way of living and, moreover, think of it, averagely, as having almost the

38
same quality as the way of living of young people in Western Europe (see Graph 4below for the comparison of data).
Table 13: Attitude towards own present life
Frequency Percent
1) extremely bad 8 .8
2) bad 24 2.5
3) neither bad nor good 194 20.5
4) good 539 57.0
5) excellent 180 19.0
Valid
Total 945 100.0
Mean 3.91
Table 14: Attitude towards present life of the closest friends
Frequency Percent
1) extremely bad 7 .7
2) bad 39 4.2
3) neither bad nor good 245 26.1
4) good 560 59.7
5) excellent 87 9.3
Valid
Total 938 100.0
Mean 3.73
Table 15: Attitude towards present lifeof young people in Western Europe
Frequency Percent
1) extremely bad 12 1.4
2) bad 73 8.5
3) neither bad nor good 162 18.8
4) good 376 43.7
5) excellent 237 27.6
Valid
Total 860 100.0
Mean 3.88
Graph 4: Comparison

39
Attitudes towards present life
73
3,3
69
4,9
71,3
9,9
0
10
20
30
40
50
60
70
80
good
+ex
celle
nt
bad+
extr
emel
yba
d
good
+ex
celle
nt
bad+
extr
emel
yba
d
good
+ex
celle
nt
bad+
extr
emel
yba
d
own friends WE peers
perc
ent
To what extent such finding should be contributed to genuine satisfaction withpersonal living conditions, and to what extent to the fact that youth, at least in part,project their own social concerns to somebody or something else, rather than tothemselves, remains unanswered in this study. It is also possible that their responsesreflect two other features of Croatian youth. Firstly, the lack of understanding of theiractual social and economic position may be the result of socialisation into apredominantly child-centred and paternalistic culture in which the period ofchildhood, in terms of self-responsibility, is significantly prolonged, also due to thefact that the principle of seniority still prevails in the word of work and is stillimportant for upward mobility in one's career. Secondly, this may be the outcome of aglobalising virtual world of new information and communication technologies inwhich young people live an illusion of global equality through the fact that, despitetheir actual economic and social constraints, they can easily enter a rapidlyglobalising world of 'infotainment'.
In any case, the conclusions need to be drawn with precaution due to differencesamong our respondents in attaching the terms ‘very good’ and 'excellent' to theirpresent situation, to the situation of their friends and of their Western peers. Aboutone fifth (19%) see their own life as excellent, 9.3% are ready to define the life oftheir closest friends in the same way, while more than one fourth (27.6%) definepresent way of living of Western youth as excellent.
Whatever the reason and despite considerable differences in the use of the term‘excellent’, there is little doubt that Croatian youth look at their present life and futurepossibilities in optimistic terms. Their optimism and self-content remain constantthroughout this study. Tables 16, 17 and 18 below reflect their opinion about theirfuture, the future of their closest friends and of their peers in Western Europe. Herewe find similar tendencies that have been found in a set of questions about theirpresent life. A high percentage (84.9) of our respondents expect their future to beeither good or excellent; 83.1% believe the same for their closest friends and 83.7% ofthe surveyed think that good or excellent future awaits their peers in Western Europe(see Graph 5 below for the comparison of data).

40
Table 16: Attitude towards own future
Frequency Percent
1) extremely bad 7 .8
2) bad 28 3.1
3) neither bad nor good 103 11.3
4) good 584 64.0
5) excellent 191 20.9
Valid
Total 913 100.0
Mean 4.01
Table 17: Attitude towards futureof the closest friends
Frequency Percent
1) extremely bad 4 .5
2) bad 19 2.1
3) neither bad nor good 127 14.3
4) good 587 66.2
5) excellent 150 16.9
Valid
Total 887 100.0
Mean 3.97
Table 18: Attitude towards future of young people in Western Europe
Frequency Percent
1) extremely bad 4 .5
2) bad 34 4.1
3) neither bad nor good 98 11.7
4) good 429 51.4
5) excellent 270 32.3
Valid
Total 835 100.0
Mean 4.11
Graph 5: Comparison

41
Attitudes towards future
84,9
3,9
83,1
2,6
83,7
4,6
0102030405060708090
good
+ex
celle
nt
bad+
extr
emel
yba
d
good
+ex
celle
nt
bad+
extr
emel
yba
d
good
+ex
celle
nt
bad+
extr
emel
yba
d
own friends WE peers
perc
enta
ge
This means that, despite the concern of many over youth perspectives in Croatia dueto number of unresolved development issues, young people nevertheless believe thatthey be better off in the future (both in individual and collective terms). Theiroptimism is somewhat even higher than it was in the end of the 1990s when a nation-wide research was conducted (Ilišin and Radin 2002). The reason behind this could beeither that there is a view that an overall situation in Croatia has improved ascompared to the one 4-5 years ago, or simply it is the consequence of age of thesurveyed, since some studies have shown that, even among the youth, pessimismincreases with age.
And again, since there are differences in attaching the term ‘excellent’ to their ownfuture, the future of their closest friends and of their peers in Western Europe (20.9%;16.9% and 32%, respectively), it is possible that the attitudes of our respondents arefar more the expressions of modest optimism based on hope that is not only thecharacteristic of their age but of post-communist transitional processes, as well.
E. PLANS FOR THE FUTURE: EDUCATION, OCCUPATION AND RESIDENCEPLACE
Professional and educational aspirations of youth, as seen from Graph 6 below,correspond to their current social status: 64.3% want to continue education, whichcorrelates with 67% of them being presently within education system (secondaryschool, higher education and university students). Almost 26% want to getemployment as soon as possible (among them there are certainly all of the 12% of theunemployed, while the rest are currently secondary and tertiary students who shallprobably soon obtain high school or university diploma, and hence want to getemployed right afterwards). It is interesting that only 10% of our respondents want topursue their current job, which is only half of the total number of the employed youngpeople in the sample.
Graph 6:

42
Professional and educational aspirations
continue
work10% (95)
find a job
26% (240)
continue
educat ion64% (605)
This implies that every second young person in the sample who is employed isdissatisfied with the job she/he holds, which is certainly an alarming figure as itrelates to persons whose professional career has just started and who are subject tohigh expectations as concerns their working engagement. Further, it could bepresumed that some of them belong to the category of those willing to find anemployment. In their case, they do not merely target any job, but either employmentin their profession or a better position.
Graph 7:
Plans on moving to ensure a better future
yes
44% (392)
no
56% (491)
Table 19: Destination
Frequency Percent
1) city 116 35.9
2) town 21 6.5
3) abroad 169 52.3
4) other 17 5.3
Valid
Total 323 100.0

43
While thinking of meeting their expectations in the future, young people are almostpolarised between those who plan to move from their present place of residence(44.4%) and those who have no such intention (55.6%), as presented by Graph 7. Thechoice of destination of the former (Table 19) has been largely expected. Majority ofthose who plan to move (52.3% or 19.1% of the total sample) think of leaving thecountry. The rest chooses to move inside the country: one third (35.9% or 13.2% ofthe total sample) prefer major cities while only 6.5% (or 2.4% of the total sample)think of smaller towns as their destination. Equally small number (2% of the total),express their wish to move to another region, climate or geographic area either inCroatia or abroad.
Our findings correspond to other studies that have been conducted in Croatia recently.In the study on youth and transition (Ilišin and Radin 2002) the readiness forresidential and professional mobility was investigated in relation to a high rate ofyouth unemployment. Its data show that less than 10% of the surveyed would notaccept job outside their permanent place of residence under no circumstances while60.8% of the sample state that they would accept to move on two conditions: if thejob is well paid and if the working conditions are good. The comparison of the resultsof this study with the results of the study carried on more than a decade earlier (Ilišin,Radin and Županov 1986) demonstrate that the number of young people willing toleave the country for good rose from 11.1% in 1986 to 18.1% in 1999. The number ofthose who would like to go abroad for a long time but not forever remained the same(38.8% in 1986 and 39.7% in 1999). The biggest difference emerges among thosewho would neither go for a longer period nor forever (33.2% in 1986 as compared to18.1% in 1999).
Table 20: Opinion on large cities as places that offerbetter opportunities
Frequency Percent
1) yes 579 65.0
2) no 312 35.0Valid
Total 891 100.0
Our data on the willingness of Croatian youth to leave their place of living in order tobetter meet their personal and professional aspirations lead us to conclude that bothCroatian rural and urban youth are in preparation for moving to bigger towns or majorcities. City is perceived as the place that offers better opportunities for career andsocial positioning by 65% of the total number of respondents (Table 20). Theremaining 35% have doubts about such opportunities and think of migrating abroad ormoving to smaller urban settlements. However, more accurate picture on this issue isobtained through comparation with the data presented by Graph 9 and 10 and Table21 below.
Whether their plans would be met in the future depends on many interrelated factorsdefined by international, national and local contexts of personal change. Residentialand professional mobility, which has been well known to Westerners for decades, is anew phenomenon in transitional countries. In Croatia, it is highly dependent on deepstructural changes in the society, the liberalisation of national economy and the

44
prospects of integration into the new European labour market in which personalwishes may play only a minor role.
Graph 8:
Preferred accommodationwith
parents/relat16% (153)
separate
apartment84% (782)
Over four fifths of young people (83.6%), as presented by Graph 8 above, haveexpressed their desire to live on their own in a separate apartment, if this would bepossible. If we compare their wishes with their actual housing situation presented inTable 6a on family patterns in which it has appeared that only 6.2% of the surveyedlive in their own apartments (either alone or with the family they have established), itis easy to see how difficult it is, for the majority of Croatian youth, to reach their fullindependence, as well as to develop and maintain important feeling of self-relianceand self-responsibility. Since the chances of securing their own apartment are minimalnot only due to difficulties in finding appropriate job but due to extremely highmarket prices in the sector of housing, as well, it can be presumed that such unwantedand prolonged co-habitation with parents and/or other relatives at the beginning of theage of independence is a source of constant frustration for a great number of Croatiancitizens.
Graph 9:
Preferred place for living
present place
59% (552)
other country
24% (220)
other p lace in
country17% (158)
Table 21: Preferred place for livingother than present
Frequency Percent
Valid 1) city 97 71.9

45
2) town 31 23.0
3) other 7 5.2
Total 135 100.0
Questions regarding preferred place for living (Graph 9 and 10; Table 21) bringresults that are quite similar to those on residential migration plans (Graph 7; Table19). However, there are certain differences that need furher explanation. The numberof youth preferring to remain in their present place of residence and the number ofthose having no migratory plans are almost identical (59.4% and 55.6%, respectively).If they could choose, 17% of all our respondents would like to go to some other placeinside the country. Two thirds of them (or 71.9% of that group) prefer large citieswhile one third (or 23%) are more is inclined to remain in smaller urban settlements.
If we compare our data with those from the study carried on in 1999 in relation to apreferred place to work (Ilišin and Radin 2002) we see that, in the last several years,the number of young people preferring large cities has increased while the number ofthose who opt for smaller towns has decreased (54.5% and 38.2%, respectively). Theconclusion should not be taken for granted due to differences in wording. The figuresfrom the 1999 study relate to the preferred place for working while the figures inTable 21 above demonstrate young peoples’ choice for living. It is, therefore, possiblethat we deal here with two different dimensions of youths’ aspirations, which shouldbe taken into account in further research.
Graph 10:
Preferred destination abroad
70% (141)5% (10)
20% (41)5% (9)
Western Europe
transit ionalcountryNorth America
Other
Of all the surveyed, 23.7% express their preference for living abroad. Out of these,two thirds (or 70.1% of the group which makes 15.1% of the total sample) opt for aWestern European country, while one fifth (or 20.4% of the group or 4.4% of the totalsample) speak in favour of North America. The difference in number between thosewho have plans to migrate abroad (19.1% of the sample; Table 19) and those whoprefer living abroad (23.7%; Graph 9) indicates that there are actually two dimensionsof youth migration issue (the same as with their preference of location for living andwork) what needs to be taken into account in the interpretation of planning to, and ofpreferring living abroad. While preference for other counties may mean only an

46
inclination towards them, having plans on migrating abroad most certainly includesactive search for such possibilities. Having in mind the level of dissatisfaction ofCroatian youth with their present living conditions, it is possible to argue that at leastone fifth of them not only dream of leaving the country but actually make plans onhow to make it in order to escape the constraints at home.
The distribution of answers to the question about preferred occupation presented inTable 22 provides more information on professional aspirations of young people inCroatia, thus, helping us to gain more understanding of the results presented above inthis report. It is important to note that 9.8% of the surveyed did not give answers tothis question either because they were not sure of what they would like to be in thefuture or simply because they refused to answer with no further explanation.
Table 22: Preferred occupation (3 responses possible)
FrequencyPercent ofall answers
Percent ofrespondents
1) industrial worker 39 4.1 4.52) shop assistant, service worker 148 15.6 17.33) policemen, soldier, firemen, traffic 27 2.9 3.24) businessman/-woman, manager/director 92 9.9 10.85) public employee 40 4.2 4.76) politician 4 .4 .57) journalist/reporter 19 2.0 2.28) farmer 6 .6 .79) medical, dentist 20 2.1 2.310) nurse, physiotherapist, etc. 53 5.6 6.211) teacher 56 5.9 6.612) entrepreneur 58 6.1 6.813) sportsman/-woman 25 2.6 2.914) banker 20 2.1 2.315) tourist agent 48 5.0 5.616) university professor/scientist 71 7.5 8.317) social worker 14 1.5 1.618) engineer 74 7.8 8.719) computer expert 60 6.3 7.020) lawyer 23 2.4 2.721) art, fashion 52 5.4 6.122) does not know/no answer 93 - -Total number of answers 951 100.0 -
Valid
Total number of respondents 853 100
In all, our respondents mention 21 professional categories while listing theirpreferences. Over one fifth of them or 22% express their preference for jobs in theservice sector (shop assistant, public employee, etc.); almost identical number (19.9%of the total sample) appears in relation to occupations in the business sector(entrepreneur, businessman/woman, banker etc.); 16.8% opt for more creative and/ordynamic fields of profession, such as journalism, sport, tourism, art and fashion; thesame number (16.7%) would like to work in education, health and social servicessector (teacher, physician, dentist, nurse or social worker); 15.7% would like to earnfor living as engineers or computer experts; and 8.3% would like to seehimself/herself among university professors or scientists in the future.

47
Only a few of our respondents opt for a prestigious lawyer position (2.7%) and evenless would like to see themselves in the role of a politician (0.5%). Equallyunatractive (3.2%) to our sample are occupations in the public security sector(policeman/woman, fireman/woman, traffic police), including the army, and lowskilled jobs in industry (4.5%). Apart from politicians, the least preferred is the life ofa farmer (0.7%).
When compared to the structure of the employed force in Croatia and having in minda rapidly changing labour market in all transitional countries, professional preferencesof our respondents are far from being unrealistic and unrealisable. According to thedata of the State Institute for Statistics based upon the 2001 population census twomajor categories of the employed in Croatia are, on the one hand, clerks, serviceworkers and shop and market sales workers (26.4% of the employed) and, on theother hand, craft and relative workers, and plant and machine operators (24.3% of theemployed); additional 7.8% are skilled agricultural and fishery workers. Over onefourth of the employed are university-trained professionals, including 14% oftechnicians and associate professionals, 8.3% of other professionals while 3.7% arelegislators, senior officials and managers.
Our sample’s responses should be interpreted in the light of two earlier studies of1986 and 1999 which, inter alia, investigated the hierarchy and structure of valuesamong young people. The comparison of value ranks in 1986 and 1999 demonstratesthat, apart from religion and nationality, the greatest increase is reached in relation tothe power (from 10.6% in 1986 to 28.6% in 1999), material position (from 36.0% in1986 to 59.1% in 1999), independence (from 35% in 1986 to 52.2% in 1999) andprofessional success (from 37.5 in 1986 to 50.1% in 1999). On the other hand, thepreference for political affirmation has significantly decreased among Croatian youth(from 13% in 1986 to 4.6 in 1999).
The shift in value desirability shows that young people are today more the advocatesof an individualistic value orientation and less of a collectivistic one. The comparisonof the hierarchy of work values between 1986 and 1999 is also interesting. First fiveranks in 1986 were given to self-realisation, material security, habit, obligation andpleasure. First two values (self-realisation and material position) kept the samepositions in 1999 as well as the fifth one (pleasure). The shift emerged in relation tovaluing work as habit and obligation (3rd and 4th ranks in the 1986 study). In the 1999study these work values disappeared and were replaced by social intereaction andstatus.
The shift to more individualistic value system, including preference for independenceand power, and the predominance of self-realisation and material security among thevalues of work, contribute to our better understanding of the figures presented inTable 22. Probably due to their awareness of a comprehensive crisis in Croatia wherethe productive sector has not been recovered yet, as well as of the possibilities createdby a common European market, young people are becoming more and more self-oriented and pragmatic in thinking of their professional career and, thus, more open tothose occupations that they perceive as more needed in the labour market.
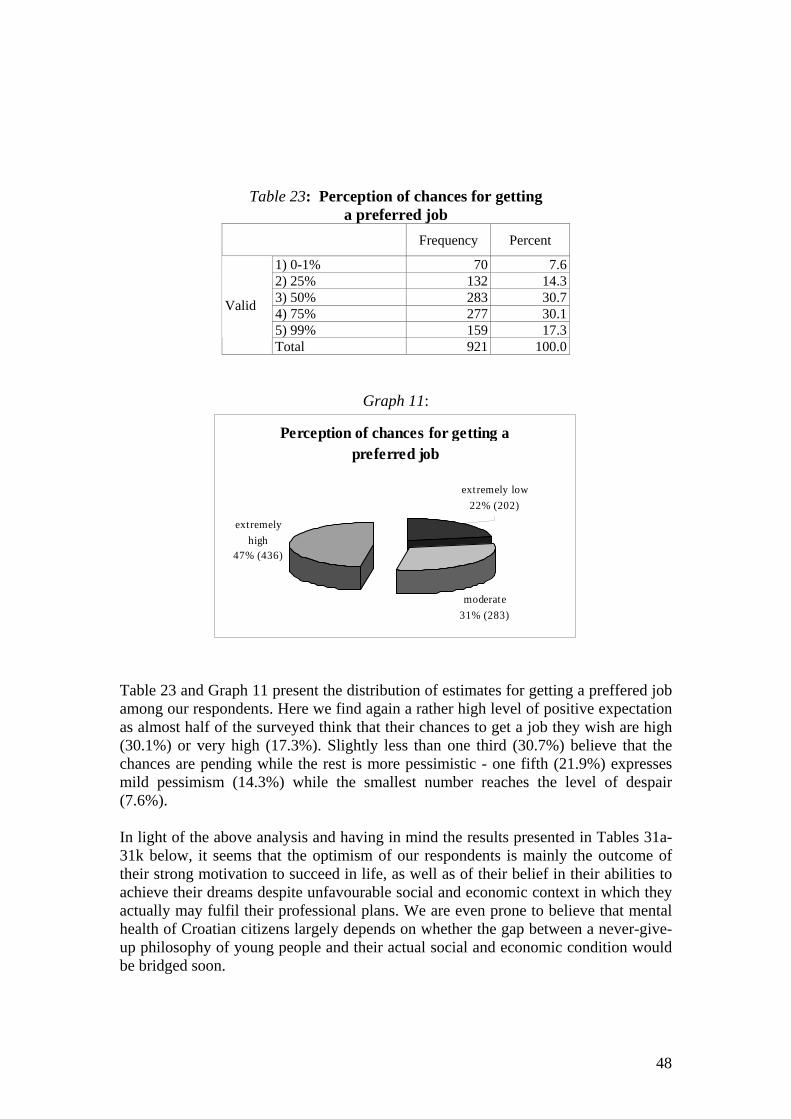
48
Table 23: Perception of chances for gettinga preferred job
Frequency Percent
1) 0-1% 70 7.62) 25% 132 14.33) 50% 283 30.74) 75% 277 30.15) 99% 159 17.3
Valid
Total 921 100.0
Graph 11:
Perception of chances for getting a preferred job
extremely
high47% (436)
extremely low
22% (202)
moderate
31% (283)
Table 23 and Graph 11 present the distribution of estimates for getting a preffered jobamong our respondents. Here we find again a rather high level of positive expectationas almost half of the surveyed think that their chances to get a job they wish are high(30.1%) or very high (17.3%). Slightly less than one third (30.7%) believe that thechances are pending while the rest is more pessimistic - one fifth (21.9%) expressesmild pessimism (14.3%) while the smallest number reaches the level of despair(7.6%).
In light of the above analysis and having in mind the results presented in Tables 31a-31k below, it seems that the optimism of our respondents is mainly the outcome oftheir strong motivation to succeed in life, as well as of their belief in their abilities toachieve their dreams despite unfavourable social and economic context in which theyactually may fulfil their professional plans. We are even prone to believe that mentalhealth of Croatian citizens largely depends on whether the gap between a never-give-up philosophy of young people and their actual social and economic condition wouldbe bridged soon.

49
F. FEELINS ABOUT SCHOOL OR UNIVERSITY STUDY
Having in mind strong criticism the school has been exposed to by the public in thelast decade on the ground that it neither prepares young people for life nor assist thesociety at large in its reconstruction, as well as the fact that Croatia still lacks anofficially pproved comprehensive strategy for education reform, one may expect thata large number of youth is extremely dissatisfied with educational institutions.However, the figures in Table 24 indicate that this might not be the truth. Over half ofthe respondents (51.9%) state that they feel happy and satisfied when thinking of theirschools or universities and an additional 5.6% feel proud and excited. In contrast tothem, one third (33.9%) of the surveyed describe their feelings in negative terms, assadness, boredom, worrying, dissatisfaction or irritation, while 8.6% do not have anyspecific feeling about its formal education (see Graph 12 for comparison).
Table 24: Feelings about school
Frequency Percent
1) sad and bored 54 5.92) worried 126 13.83) dissatisfied 47 5.24) irritated 82 9.05) excited 21 2.36) happy/satisfied 472 51.97) proud 30 3.38) nothing/irrelevant 78 8.6
Valid
Total 910 100.0
Graph 12:
Feelings about school
positive
57% (523)
negative
34% (309)
irrelevant
9% (78)
The above figures may be interpreted in two ways: a) that majority of Croatian youthis actually satisfied with the schooling system and b) that they are satisfied not with

50
the system as such, in terms of learning in the context of a subject-matter, but in termsof learning in the context of school life as a whole. Despite a decades long andworldwide growing tendency to reduce the perception on the function of formaleducation institutions to a subject-matter-related knowledge and skills, schools arestill and for many students important socialising institutions in where they establishlong-lasting friendships, develop their responsibility, strengthen their sense ofbelonging, challenge their self-respect and prepare for the world of adults.
The study of 1999 (Ilišin and Radin 2002) has documented that education should beobserved in a broader context of interrelated institutional tasks and personalexpectations. Here we see that the young have multi-dimensional relations towardseducation. The respondents see education primarily as a means for satisfying theirintrinsic needs, such as acquiring new knowledge and skills, strengtheningindependence, obtaining a desired job, solving existential problems, developingpersonal identity, etc. Moreover, depending on their professional status, parents’ levelof education, rural/urban residential status and some other variables, young peopleapproach to education with more or less criticism and attach to it more or lessinstrumental goals.
G. THE USE OF PSYCHO-ACTIVE SUBSTANCES
Tables 25, 26 and Table 27a-27k give us additional information on the quality of lifeof Croatian youth. They present the answeres to the questions on smoking tabacco,alcohol consumption and the abuse of different types of drugs.
Table 25: Cigarette smoking
Frequency Percent
1) never 560 59.3
2) occasionally (several times a year) 76 8.0
3) regularly 309 32.7Valid
Total 945 100.0
Table 26: Alcohol consumption
Frequency Percent
1) never 200 21.1
2) occasionally (several times a year) 230 24.3
3) once a month 172 18.2
4) once a week 268 28.3
5) at least twice a week 70 7.4
6) daily 6 .6
Valid
Total 946 100.0

51
While three fifths (59.3%; Table 25) of young people do not smoke cigarettes, onlyone fifth (21.1%; Table 26) never drink alcohol. Approximately one third smoke(32.7%; Table 25) and drink (35.7%; Table 26) regularly in daily and weeklyintervals. The number of irregular smokers (8%; Table 25) is far fewer than thenumber of those who drink alcohol infrequently (42.5%; Table 26), that is severaltimes a year up to once a month. Smoking cigarettes and drinking alcohol certainlybelong to the most widespread addictions among young people (and adults) inCroatia, already for decades. However, differences between the smolking of tobaccoand alcohol consumption are indicative, as the consumption of alcohol is morefrequent than that of tobacco.
Our findings on the frequency of smoking and alcohol consumption among the youngare more favourable than most recent reserch on incidence and characteristics ofsubstance abuse among Croatian high school students shows. The latest study(Sakoman, Raboteg-Šarić and Kuzman 2002) documents that within the monthproceeding the reserch, 62.2% of students consumed alcohol and 47.1% hadsuccesively five or more drinks in a day. In addition, four fifths of the studentssmoked cigarettes once or twice in their lives, half of them smoked in the month priorto the reserch, and one third of them smoke daily.
These comparisons make it clear that the consumption of alcohol (especially if takinginto account social consequences of alcohol addiction) is really and potentially amuch more acute problem in the contemporary Croatian society than theconsummation of tobacco. Notwithstanding, an anti-smoking campaign in Croatia hasbeen backed up much stronger on many levels than anti-alcohol campaign,irrespective of the fact that research on youth during the last twenty years has shownthat the discrepancy between tobacco and alcohol use increases: the number ofsmokers has been reduced while the number of alcohol users slightly but constantlygrows. Earlier studies have also demonstrated that both numbers increase with age.Therefore, it may be presumed that anti-smoking campaign actually has a positiveimpact on smokers and potential smokers, whereas non-existence of similar anti-alcohol campaign points to the fact that there is in Croatia relatively high socialtolerance for alcohol use. In other words, youth behaviour in this respect does notdivert from dominant social and cultural trends, which are still unquestioned,probably due to the fact that they are deeply rooted in the tradition of alcohol-consummation in the country.
Table 27a: Abuse of drugs: marijuana
Frequency Percent
1) never 616 65.1
2) tried once 132 14.0
3) tried twice or more 198 20.9Valid
Total 946 100.0
Table 27b: Abuse of drugs: hashish
Frequency Percent

52
1) never 867 91.6
2) tried once 30 3.2
3) tried twice or more 49 5.2Valid
Total 946 100.0
Table 27c: Abuse of drugs: LSD
Frequency Percent
1) never 912 96.4
2) tried once 18 1.9
3) tried twice or more 16 1.7Valid
Total 946 100.0
Table 27d: Abuse of drugs: cocaine or crack
Frequency Percent
1) never 917 96.9
2) tried once 13 1.4
3) tried twice or more 16 1.7Valid
Total 946 100.0
Table 27e: Abuse of drugs: methadone
Frequency Percent
1) never 935 98.9
2) tried once 4 .4
3) tried twice or more 6 .6Valid
Total 945 100.0
Table 27f: Abuse of drugs: heroine
Frequency Percent
1) never 932 98.5
2) tried once 9 1.0
3) tried twice or more 5 .5Valid
Total 946 100.0
Table 27g: Abuse of drugs: amphetamine
Frequency Percent
1) never 908 96.0
2) tried once 19 2.0
3) tried twice or more 19 2.0Valid
Total 946 100.0

53
Table 27h: Abuse of drugs: ecstasy
Frequency Percent
1) never 868 91.8
2) tried once 31 3.3
3) tried twice or more 47 5.0Valid
Total 946 100.0
Table 27i: Abuse of drugs: inhalants
Frequency Percent
1) never 933 98.6
2) tried once 10 1.1
3) tried twice or more 3 .3Valid
Total 946 100.0
Table 27j: Abuse of drugs: anabolic steroids
Frequency Percent
1) never 943 99.7
2) tried once 2 .2
3) tried twice or more 1 .1Valid
Total 946 100.0
Table 27k: Abuse of drugs: speed
Frequency Percent
1) never 944 99.9
2) tried once 1 .1Valid
Total 945 100.0
The set of questions on abuse of different types of drugs presented in tables above andin the Summary Table 27a-k below reveals that the youth use the so-called 'soft' drugsmuch more often than the 'hard' ones. As expected, most young people (34.9%) havetried or used twice or more only marijuana. Second most frequent used drugs arehashish and ecstasy (slightly over 8% each), whereas other 'hard' drugs have beentried or are used by 1-3% of the surveyed.
Table 27a-k: Abuse of drugs: Summary
Drugs Never % Tried twiceor more %
Marijuana 65.1 20.9Hashish 91.6 5.2LSD 96.4 1.7

54
cocaine or crack 96.9 1.7Methadone 98.9 .6Heroine 98.5 .5Amphetamine 96.0 2.0Ectasy 91.8 5.0Inhalants 98.6 .3anabolic steroids 99.7 .1Speed 99.9 .1
the youth use the so-called 'soft' drugs much more often than the 'hard' ones. Asexpected, most young people (34.9%) have tried or used twice or more onlymarijuana. Second most frequent used drugs are hashish and ecstasy (slightly over 8%each), whereas other 'hard' drugs have been tried or are used by 1-3% of the surveyed (Lalić and Nazor 1997; Ilišin and Radin 2002). Besides, the most recent research onthis problem (Sakoman, Raboteg-Šarić and Kuzman 2002) has shown that 21.2% ofhigh school students had experimented with drugs and a total of one fourth of thosewho tried drugs did it by the age of 15. The abuse of drugs is most widespread in thesouthern and northern coastal area and in the capital of Zagreb. Discussing substanceabuse in general, the writers point out that older and male high school students usesubstances more often and that younger generation start experimenting with drugs,drinking acohol and smoking regularly at an earlier age.
More complex analysis of our data should disclose whether the youth surveyed in ourresearch have some of the above characteristics.

55
H. THE MAIN SOURCES OF INFORMATION ABOUT THE COUNTRY AND THEWORLD
Table 28a and 28b, as well as Graph 13 below display data on the distribution of themost often used channels for obtaining information about Croatia and the world. Thetwo tables are almost identical. In each case the largest majority of our respondentsmention TV and radio as the main source of information (81.6 for the news about thecounty and 83.5% for the news about the world). The second most frequently usedsource relates to newspapers and magazines (65.3% for the news about the countryand 59.3% for the news about the world). In replying to both questions, school, familyand friends are chosen by a small number of respondents. Only 13.2% of the surveyedinclude them among the three main sources of information about the country and only7.4% consider them as important sources of information about the world.
Table 28a: Sources of information about the events in the country (3 responses possible)
FrequencyPercent ofall answers
Percent ofrespondents
1) TV/radio 766 44.3 81.6
2) newspapers/magazines 613 35.3 65.3
3) school 22 1.3 2.3
4) family 12 .7 1.3
5) friends 90 5.2 9.6
6) Internet 233 13.4 24.8
7) other 3 .2 0.3
Total number of answers 1,739 100.0
Valid
Total number of respondents 939
Table 28b: Sources of information about the events in the world (3 responses possible)
FrequencyPercent of
totalAnswers
Percent ofrespondents
1) TV/radio 784 46.1 83.5
2) newspapers/magazines 557 32.7 59.3
3) school 11 .6 1.2
4) family 8 .5 0.8
5) friends 51 3.0 5.4
6) Internet 289 17.0 30.8
7) other 1 .1 0.1
Total number of answers 1,701 100.0
Valid
Total number of respondents 939
A relatively high level of the use of Internet (24.8% for news about the country and30.8% for the news about the world) has come as a surprise solely becase it was notprovided among the items in the questionnaire. If we look back to the figures in Graph2 and Table 9a, where we find that almost two thirds (69.5%) of the respondents have

56
confirmed the use of computers and that almost two thirds of the computer users(77.8%) or over half (54%) of the total number of the surveyed have computers athome, than it is very much possible that at least half of the computer users are also theusers of Internet. Moreover, since the Internet users make 10.8% of the totalpopulation in Croatia, this may mean that a vast majority of them actually are youngpeople who are becoming well adjusted to the world of knowledge and globalisedinformation in which access to, and skills for new information and communicationtechnologies are the basis for better understanding the events in the country and theworld. This may also explain why none of the surveyed has mentioned church as thesource of information either about the country or the world (see Graph 13 for acomparison).
Graph 13: Comparison
Sources of information
0102030405060708090
TV/radio
newspapers
Internet
family+frie
nds
aboutcountry
aboutworld
I. FREE TIME
The figures on leisure activities presented in Table 29 below relativelly well confirmearlier research findings regarding the activities that youth in Croatia is engaged induring their free time. The most common activity among youth is associating withfriends (58.1%) although this level decreases with age, marital status and parenthood.Other relatively frequent activities among our respondents are sports (19.4%), visits todisco-clubs (19.3%), watching TV (16.5%) and outdoor activities (15.2%). Earlierresearch of youth and adults has demonstrated that with becoming middle-aged, sportsand visits to disco-clubs become less frequent, while the frequency of watching TVincreases. Moreover, the comparison of the studies conducted in 1986 and 1999 (Ilišinand Radin 2002) demonstrates a number of changes in the nature of using free timeamong the young. Young generation of 1999 went to parties and cafés or was idlingmore often than the young of 1986. On the other hand, the latter spent more time incinema, on trips and walks and was more interested in folk music, art exhibitions,theatre, sports and public gathering, as well as in lottery and other competition games.
Table 29: Free time and its use (3 responses possible)

57
FrequencyPercent ofall answers
Percent ofrespondents
1) no free time 29 1.7 3.1
2) sports 183 10.6 19.4
3) listening to music, reading, visitingexhibitions
92 5.4 9.8
4) helping parents at home 47 2.7 5.0
5) outdoor activities (climbing, fishing etc.) 62 3.6 15.2
6) dico-clubs 182 10.5 19.3
7) searching through Internet 78 4.5 8.3
8) sleeping, doing nothing 83 4.8 6.7
9) spending time with friends 549 31.8 58.1
10) playing video/computer games 97 5.6 10.3
11) watching TV 156 9.0 16.5
12) family gathering 93 5.4 9.8
13) hobbies 55 3.2 5.8
14) earning pocket money 10 .6 1.1
15) other (voluntary work, dating etc.) 12 .8 1.2
Total number of answers 1,728 100.0
Valid
Total number of respondents 945
Somewhat unexpected among our data is the finding that less than 10% of youth listenmusic, read books and visit exhibitions, since these were some of the most oftenmentioned youth free time activities in earlier studies (e.g. rock music was oftenlistened by 60.8% of the surveyed in 1986 and by 55.3% in 1999). Another curiousfigure is that every eleventh (6.7%) respondent claims that he/she spends her/hisleisure time in a passive way, either as doing nothing or simply sleeping. Our figuresare much lower then in earlier studies (e.g. sleeping or idling was mentioned as oftenpracticed by 19.7% in 1986 and by 26.8 in 1999). The difference may appear as theoutcome of the differences in wording the questions on free time (in earlier studies thequestion was ‘how often’).
Finally, the fact that only 3.1% of the sample claim that they have no free timewhatsoever; that 5% help their parents at home; that less than 1% are committed tovoluntary work and that, moreover, only 1.1% work to earn pocket money, tells usthat the number of those young people with daily obligations, except in relation toschool, is minimal. Having in mind, in addition, that, on the whole, one sixth of youthhave absolutely no other free time activities besides idling, sleeping and playingvideo-games, and that the majority of our respondents are engaged almost solely inthe so-called receptive activities for entertainment, it is obvious that the quality ofspending leisure time among the youth in Croatia is far from satisfying.
Table 30: Satisfaction with the way free time is spent
Frequency Percent
1) very much pleased 191 20.2
2) pleased 484 51.3
3) displeased 240 25.4Valid
4) very much displeased 29 3.1

58
Total 944 100.0
Graph 14:
Satisfaction with the way free time is spent
displeased
29% (269)
(very)pleased
71% (675)
Notwithstanding, Croatian youth has different opinion. The data on their(dis)satisfaction with the way they spend leisure time presented in Table 30 andGraph 14 are relatively favourable: a bit less than three fourths (71.5%) of thesurveyed are more or less satisfied, while more than one fourth (28.5%) areunsatisfied. Since the group of unsatisfied youth bears importance for us, it would beuseful to know more about their reasons. Earlier research (Ilišin and Radin 2002) hasindicated that the most common reasons are insufficient amount of free time and thelack of satisfactory contents and activities, as well as the lack of financial resources. Itmay be presumed that similar problems trouble our respondents, which trigger theissue of responsibility of local and national community for the young. Since only fewof the respondents claim no free time whatsoever, we may suppose that thedissatisfaction arises mainly due to low quality of leisure activities, both in terms ofpoor contents and in terms of restricted financial resources. Nevertheless, the factremains that significant majority of youth manage to find, within means available tothem, activities and contents that attend to their needs and, probably, theirexpectations.
J. SELF-(DIS)CONTENT
Table 31a together with additional 10 below present the distribution of agreement ordisagreement of our respondents with a set of statements describing feelings a personmay have towards himself/herself. The data in Table 31a that refer to the level of self-content demonstrate that four fifth (79.6%) of young people are, generally speaking,satisfied with themselves.

59
Table 31a: I am satisfied with myself
Frequency Percent
1) agree 746 79.62) disagree 191 20.4ValidTotal 937 100.0
Table 31b: Sometimes I think I am not good at all
Frequency Percent
1) agree 291 30.92) disagree 652 69.1ValidTotal 943 100.0
Table 31c: I feel I have a good number qualities
Frequency Percent
1) agree 938 99.52) disagree 5 .5ValidTotal 943 100.0
The tendency of our respondents to see themselves mostly in positive and self-assuring terms permeates all the data in this section. It is confirmed in Table 31c inwhich almost all young people in the sample (99.5%) think of themselves as having agood number of personal qualities; in Table 31d in which one reads that 95.9% of therespondents believe that they are as capable as other people; in Table 31g in which95.7% state that they are self-confident and feel that they are somebody; in Table 31jin which only 6.3% disagree with the statement on having positive attitudes abouthimself/herself; and in Table 31k in which 96.2% of the young claim that they havethe impression that most people they know like them.
Table 31d: I think I am as capable as others
Frequency Percent
1) agree 902 95.92) disagree 39 4.1ValidTotal 941 100.0
Table 31e: I feel I have little to be proud of
Frequency Percent
1) agree 95 10.12) disagree 844 89.9ValidTotal 939 100.0

60
Positive attitudes about oneself are confirmed once again by the data in Table 31e inwhich only 10.1% of the surveyed agree with the statement 'I feel I do not have muchto be proud of', as well as by Table 31i in which we read that only 9.5% of the youngoften think of themselves as being a failure.
Table 31f: I feel useless sometimes
Frequency Percent
1) agree 432 45.82) disagree 512 54.2ValidTotal 944 100.0
Table 31g: I am self-confident (I feel that I am someone)
Frequency Percent
1) agree 898 95.72) disagree 40 4.3ValidTotal 938 100.0
Table 31h: I wish I had more self-respect
Frequency Percent
1) agree 518 55.12) disagree 422 44.9ValidTotal 940 100.0
Table 31i: I often feel as being a failure
Frequency Percent
1) agree 90 9.52) disagree 853 90.5ValidTotal 943 100.0
Table 31j: I have positive attitude towards myself
Frequency Percent
1) agree 873 93.72) disagree 59 6.3ValidTotal 932 100.0
Table 31k: I think most people like me
Frequency Percent
1) agree 886 96.2Valid 2) disagree 35 3.8

61
Total 921 100.0
Since our respondents show a high level of consistency in their positive attitudestowards themselves on a majority of questions, it might come as a surprise, whilelooking at the Summary Graph 15 below (presenting the ‘agree’ answers) that 30.9%of them sometimes feel they are no good at all (Table 31b) and that 45.8% have afeeling that they are useless from time to time (Table 31f), as well as that more thanhalf of the sample (55.1%, according to the data in Table 31h) wish they had moreself-respect. Although a detailed analysis would bring more light on this issue, thisrelative aberration may be the characteristic of, at least, the youngest in our samplewho, in general, are still in a demanding process of consolidating and strengtheningtheir personal self by ballancing the pressures of the society and their personal needs.

62
Graph 15: Summary
9,5
30,9
45,8
55,1
79,6
93,7
95,7
95,9
96,2
99,5
0 20 40 60 80 100
I have many qualit ies
Most people like me
I am capable as others
I feel I am someone
I have posit ive self-at t itudes
I am self-sat isfied
I wish I had more self-respect
I feel useless sometime
I feel as being of no good sometimes
I often feel as a failure
Attitudes about oneself (agree)
K. PERCEPTION OF RELATIONS WITH PARENTS, FRIENDS ANDTEACHERS
A set of the following tables (32a-32m, including Graphs 16 and 17) present ourrespondents' answer to several categories of statements about their understanding oftheir parents and relatives, teachers, friends, as well as about their relation to schooland the future. The respondents were asked to mark an approprate answer dependingon how often the content of the statements applies to them.
Table 32a: I can easily get warmth and care from my parents
Frequency Percent
1) almost always 813 86.02) sometimes 109 11.53) hardly ever 23 2.4
Valid
Total 945 100.0
Table 32b: I can easily get support from my parents

63
Frequency Percent
1) almost always 821 86.92) sometimes 107 11.33) hardly ever 17 1.8
Valid
Total 945 100.0
Table 32c: My parents are willing to support mefinancially
Frequency Percent
1) almost always 800 84.72) sometimes 121 12.83) hardly ever 24 2.5ValidTotal 945 100.0
Table 32d: I can easily get support from my friends
Frequency Percent
1) almost always 746 78.92) sometimes 188 19.93) hardly ever 12 1.3ValidTotal 946 100.0
Table 32e: I can easily get assistance from my teachers
Frequency Percent
1) almost always 280 44.02) sometimes 257 40.43) hardly ever 99 15.6
Valid
Total 636 100.0
Tables 32a-32e contain data on personal opinion of the surveyed about the supportand/or assistance they may expect from their parents, friends and teachers, i.e. thesignificant others, what is generally accepted as extremely important for the youngpeoples’ emotional, social and intellectual development. Tables 32a-32c demonstratea high level of security young people in Croatia feel in the family context. A vastmajority of them is convinced they can almost always easily get warmth and carefrom their parents (86%; Table 32a) and easily be supported by them (86.9%; Table32b), as well as that their parents are ready to assist them financially when in need(84.7%; Table 32c). Unexpectedly high number also think they can easily get supportfrom their friends (78.9%; Table 32d) while less than half (44%; Table 32e) has thesame opinion in relation to their teachers (see Graph 16 below for ‘almost always’answers in relation to the perception of support).
Graph 16:

64
86,978,9
34,7
0
20
40
60
80
100
from parents from friends from teachers
Perception of support
As no studies of this aspect of teacher-student relations have been done in Croatiarecently (Vujčić 1993), we are not able to conclude whether our data confirm adecrease or an increase in support and assistance students think can get from theirteachers. However, some analyses do confirm that Croatian teachers are becomingmore and more over-burdened with the task of transmitting the subject-matter to theirstudents, mainly due to predominantly fact-oriented curricula and textbooks and to thefailure of policy-makers to introduce a dynamic, comprehensive and more student-and society-oriented educational reform, which may have an impact on increasingformal while decreasing personal teacher-student relations in school
Table 32f: I am worried about my future
Frequency Percent
1) almost always 202 21.42) sometimes 486 51.43) hardly ever 257 27.2ValidTotal 945 100.0
Table 32g: I am worried about my friends’ future
Frequency Percent
1) almost always 178 18.82) sometimes 537 56.83) hardly ever 230 24.3
Valid
Total 945 100.0
Tables 32f and 32g disply the results on on the existance of concern of the surveyedabout their future and of their friends. Over half of them (51.4% for themselves and56.8% for their friends) state that they sometimes feel uneasy when thinking abouttomorrow; one fifth (21.4%) is almost always worried about their own future and littleless of them (18.8%) is equally concerned about the future of their friends. Moreover,one fourth (27.2% for themselves and 24.3% for their friends) hardly ever feel anyuneasiness about tomorrow. When compared to figures discussed above, these resultsseem very plausible, since 84.9 (Table 16) of our respondents expect their future to be

65
either good or excellent and 83.1% (Table 17) think the same way for their closestfriends. On the other hand, when compared to the results from Table 32m, where weread that 41.3 respondents think their parents are almost always worried about theirchildren future, it is clear that our respondents are far less concerned about that aspectof their life than are their parents.
In reference to the issue of parents/relatives’ monitoring and control of youth’sbehaviour and his/her school success, the figures in Tables 32h-32k demonstrate that,according to youth’s opinion, majority of Croatian families have managed toestablished more flexible and covert control in the course of their children growth anddevelopment (see Graph 17 and Summary Table 32a-m below). In over half of thecases (55.7%; Table 32h) parents or relatives hardly ever define rules for what theirchildren may do and over three fifths of parents or relatives (65%; Table 32i) almostalways know where and with whom their children spend evenings when going out.
Table 32h: My parents/relatives define rules for whatI can do
Frequency Percent
1) almost always 128 13.52) sometimes 291 30.83) hardly ever 527 55.7
Valid
Total 946 100.0
Table 32i: My parents/relatives know where and withwhom I spend my evenings
Frequency Percent
1) almost always 614 65.02) sometimes 212 22.43) hardly ever 119 12.6
Valid
Total 945 100.0
The parents/relatives’ monitoring of school progress is even more pronounced amongour respondents. As figures in Tables 32j and 32k below demonstrate, some nine tenth(89.8%; Table 32j) of parents/relatives almost always ask their children about theirprogress in school and regularly keep records on their children school situation(87.3%; Table 32k).
Table 32j: My parents/relatives ask about my progressin school
Frequency Percent
1) almost always 573 89.82) sometimes 51 8.03) hardly ever 14 2.2
Valid
Total 638 100.0

66
Table 32k: My parents/relatives know about my school situation
Frequency Percent
1) almost always 557 87.32) sometimes 73 11.43) hardly ever 8 1.3
Valid
Total 638 100.0
Graph 17: Monitoring and control: Summary
My parents almost always...
39%53%
8%
define myrules
knowwhere I go
know aboutmy school
Approximately equal number of parents/relatives is found among those that arealmost always (32.2%) and those that are hardly ever (38.3%) worried about theirchildren’s school situation (see Table 32l below) probably relying on marks theirchildren bring home from school. When the data from Table 32m below are analysed,it seems that there are more parents/relatives who are almost always concerned abouttheir children future than about their school situation. The difference is small butcould prove the opinion heard often in public that school success is not as muchrelevant for success in life of an individual as it is good connection to, acquaintancewith, and linkage to political and economic elite in the country.
Table 32l: My parents/relatives are worried about myschool situation
Frequency Percent
1) almost always 205 32.22) sometimes 188 29.53) hardly ever 244 38.3
Valid
Total 637 100.0
Table 32m: My parents/relatives are worried about my future
Frequency Percent
1) almost always 386 41.32) sometimes 316 33.83) hardly ever 233 24.9
Valid
Total 935 100.0

67
Table 32a-m: Opinions about parents, teachers, etc.: Summary
Opinion Almostalways %
I can easily get warmth and care from my parents. 86.0I can easily get support from my parents. 86.9My parents are willing to support me financially. 84.7I can easily get support from my friends. 78.9I can easily get assistance from my teachers. 44.0I am worried about my future. 21.4I am worried about my friends’ future. 18.8My parents/relatives define rules for what I can do. 13.5My parents/relatives know where and with whom I spend my evenings. 65.0My parents/relatives ask about my progress in school. 89.8My parents/relatives know about my school situation. 87.3My parents/relatives are worried about my school situation. 32.2My parents/relatives are worried about my future. 41.3
L. IMAGINING HIMSELF/HERSELF IN A 10-YEAR TIME
Although the question on imagining oneself in 10-year time presented in Table 33 andGraph 19 below was answered by 53.8% of the surveyed, the data again confirm theoptimism that has been discussed above. Apart for 14.7% of those who expect onlyhard life, all others of the surveyed state that they believe they would have a good life,either in general terms (16.5%) or in relation to specific field of their interest. Thus,34.6% expect a successful career, including those that link their professional successwith migration to other countries (13.8%). An additional 27.9% believe they wouldhave a good family life while 6.3% see his/her success in achieving high economicstatus.
Table 33: Imagining himself/herself in 10 years
Frequency Percent
1) successful career and happy family life 34 6.72) happy family life 142 27.93) successful career 106 20.84) high economic status 32 6.35) professional career abroad 70 13.86) happy and good life in general 50 9.87) hard life 75 14.7
Valid
Total 509 100.0

68
Graph 18:
Imagining his/her life in 10 years
succesful career
34% (176)
happy family
28% (142)
good life
generally17% (84)
hard life
15% (75)
high economic
status6% (32)
Whether these figures are the outcome of a period in which the survey was conducted,since the data were collected throughout October-December 2002 when youth is stillrefreshed by summer and in waiting for Christmas holidays, or the reflection of‘general hopes’ embedded in the process of transition’ and thus, a reliable picture ofCroatian youth today, is hard to say. In any case, we see such a high level of optimismamong young people in Croatia as an extremely valuable contribution to developinghuman capital in the country that, neither the government not the society as a wholemay spend in vain. On the other hand, even more social and administrative attentionshould be given to those young people that are trapped in their personal andprofessional development because they live in unfavourable social and/orpsychological condition that irreparably turn them into the victims of misfortune.
M. RESPONDENTS’ COMMENTS ON THE CONTENT OF THE QUESTIONNIRE
.
Table 34: Respondents’ comments on the issues omitted
Frequency Percent
1) problem of youth unemployment,passivity and emigration
10 17.5
2) quality of education 6 10.53) inefficiency of the state and thequestion of law and justice
11 19.3
4) free time of young people 14 24.68) problems with drugs and thelegalisation of drugs
10 17.6
5) other 6 10.5
Valid
Total 57 100.0
Table 34 presents the comments and suggestions received from only 6% of ourrespondents. One fourth of them (24.6%) suggest more topics on free time; one fifth(19.3%) opt for more issues focused on the inneficiency of state, the question of law

69
and justice, in particular; equal number (17.5%) would like to see more questionsrelated to youth unemployment, passivity and emigration or to abuse of drugs; onetenth (10.5%) wants to say more about the quality of education etc.

70
3.2. Frequency analysis and discussion: Croatian Supplement
Below is the frequency analysis of answers of our respondents to five questions thatwere added to the original instrument by Croatian research team. The purpose of theextension was to put more light on how the young perceive their problems and whatvalues they deem important as members of the society in which the process oftransition to democracy was and, in some way, still is intermingled with nation-building and war. As the most recent research in a thirty-year-long tradition ofstudying youth in Croatia, it was also expected that it would help us document thechanges, if any, among young people in the context of post-2000 political changes inthe country.
Thus, the following questions were integrated into the original survey:
a) What do you think are major problems of youth in Croatia today?
b) What or who, do you think bears responsibility for solving youth problems inour society?
c) What do you think needs to be done in order to start solving youth problemsmore efficiently?
d) How important to you is each of the following values: social power;democratic system; economic security; national sentiments; rights andfreedoms of the individual; protection of minorities; respect for differences(pluralism); high economic standard; the rule of law; European integration;inviolability of property; religion; solidarity among people; gender equality;peace in the world; free market; social justice; civil society; freedom of themedia; and healthy environment?
e) How important you think are the following values for the promotion of anindividual in Croatian society: personal endeavour; ‘connections’ to, andacquaintance with important people; knowledge and skills (competencies);national background; mere luck; bribing people holding important positions;university diploma; money and wealth; destiny; membership in the rulingparty; adaptive behaviour; and submissiveness and obedience to the boss?
The results of the first three questions and the summary of the two last questions arepresented in Tables 35-39 below, each followed by discussion. A detailed account ofresults obtained for the last two questions, is presented in the annex.
A. PERCEPTION OF MAIN YOUTH PROBLEMS AND THEIR SOLUTIONS
Table 35 below presents the distribution of answers of our respondents to the questionon what they conceive as major problems of youth in Croatia today. The figuresabove demonstrate that the majority of the surveyed (58.5%) consider sociallyunacceptable forms of youth behaviour, including the abuse of drugs, alcoholconsumption, violence, etc. as the most severe problem of their generation; a bit lessthan half of them (48.6%) stress unemployment, while over one third (36.4%)highlights the problem of low standard of living. In addition, one fifth emphasizes the

71
lack of prospects in life (19.9%) and a concomitant mass migration (20.4%) of youngexperts abroad. The preoccupation with entertainment and consumption is seen as themain issue by 14.7% of the respondents, while two more issues, the lack of thesociety’s responsibility for youth and low level of education quality, are stressed by13% and 12.1% of the respondents, respectively. The remaining four problems, suchas the lack of interest among the young in social and political issues, low level ofyouth occupying public jobs, the importance of ‘good connections’ instead ofcompetencies, and the rule of the “old”, are mentioned by one tenth of the sample.
Table 35: Perception of major youth problems in Croatia today(3 responses possible)
FrequencyPercent of
respondents
1) preoccupation with entertainment and consumption 139 14,7
2) low standard of living 343 36,4
3) lack of interest in social and political issues 102 10,8
4) lack of perspective in life 188 19,9
5) socially unappropriate behaviour (drugs, alcohol, violence,etc.)
552 58,5
6) low level of education quality 114 12,1
7) low level of youth occupying public jobs 95 10,1
8) importance of ‘good connections’ instead of competencies 99 10,5
9) mass migration of young professionals to other countries 192 20,4
10) unemployment 458 48,6
11) the rule of the “old” 92 9,8
12) lack of the society’s care and responsibility for youth 123 13,0
13 other 8 0,8
Total number of answers 2,505
Valid
Total number of respondents 943
Our results are somewhat at odds with the social reality as well as with the results ofearlier research on youth. Findings of earlier decades had repeatedly displayedunemployment as the major problems of young generation. The same was true duringthe transitional period of late 1990s, when unemployment rate in Croatia reached itsuppermost level ever (Ilišin and Radin 2002). The fact that the participants in thisresearch place socially unacceptable youth behaviour before unemployment may beaccounted for either by the sample structure or general social climate.
On the one hand, majority of the respondents are still within educational process.Thus, at least to some of them job search may appear too remote from their studentposition to be perceived as the top problem of youth in Croatia. On the other hand, inpublic debates on youth the so-called moral panics predominates, wherein youth ingeneral comes into focus of social interest mainly in terms of deviant behaviouramong certain youth groups.
Hence it is possible to assert that these debates, also accompanied by aggressivemedia campaigns (e.g against smoking and drug abuse but not as much against

72
alcohol consumption, except for safe driving), are based on a socially-inducedperception of youth as prone to violating social norms, in spite of the fact that, instatistical terms, less than one tenth of youth population may be described as sociallydeviant. Certainly, this is not to say that the problem does not exist or that it isirrelevant. Rather, we want to point out that numerous other problems affectingprimarily youth or quite large portions of young population in Croatian society today,are being disregarded and neglected both by relevant social actors and by youngpeople, as well.
Table 36: Opinion on who has the greatest responsibility for solvingyouth problems in Croatian society
(3 responses possible)
FrequencyPercent of
respondents
1) parents 447 47,9
2) non-governmental organisations 60 6,4
3) youth organisations 101 10,8
4) government 440 47,2
5) media 106 11,4
6) school/university 213 22,8
7) each young person for himself/herself 482 51,7
8) church 33 3,5
9) other 15 1,6
Total number of answers 1,897
Valid
Total number of respondents 933
The answers of our respondents, presented in Table 36 above on the question whobears the greatest responsibility for solving the problems of youth in Croatian society,are rather interesting. Firstly, comment must be made of the fact that every secondrespondent (51.7%) holds each young person to be responsible for herself/himself,while little less in number also hold that responsibility should be exercised by parents(47.9%) and the government (47.2%). In other words, half of the youth distribute theresponsibility for their wellbeing equally among the three actors: young personhimself/herself, her/his parents, and the authorities. Indeed, this seems rather arealistic vision of the present situation, since the three actors specified are verilyimportant for creating optimal conditions for development and social integration ofyouth.
At this point it is important to underline that the emphasis on individual responsibilityby over half of youth actually counter a relatively widely shared opinion on youth asbeing lazy and passive, i.e., as those that wait inactively for someone else to settletheir problems. Notwithstanding, the fact that other half of our respondents failed tomention personal responsibility of young people among those who they think areresponsible for solving their problems, justifies the position of critics who claim thattoday's young generation evades responsibility for themselves.

73
It remains unanswered whether such unawareness of one’s own responsibility comesfrom the youth conviction that they are too immature to perform permanent socialroles (such as professional engagement, family responsibility or political decision-making) and, thus, have no personal responsibility for their own destiny, or that they,as individuals who lack necessary power and social positioning, are not able to settletheir problems, irrespective of how hard they try and how much they troublethemselves.
Other actors (see overall ranking in Graph 19 below) that are recognized as thebearers of responsibility for youth by our respondents are mentioned less frequently:22.8% has stressed the role of educational institutions; one tenth (11.4%) the mediaand youth organizations (10.8%); every fifteenth perceives the responsibility ofnongovernmental organizations (6.4%); and only every thirtieth (3.5%) theresponsibility of religious institutions.
Graph 19:
1,6
3,5
6,4
10,8
11,4
22,8
47,2
47,9
51,7
0 10 20 30 40 50 60
other
church
NGOs
youth organisations
media
school
government
parents
young person
Perception of actors responsible for solving youth problems
While comparing the actors mentioned, it comes out that most young people attributeresponsibility to those actors that function at the private level (personal and parents’responsibility), followed by the public sectors (government, educational system) and,finally, the civil society (nongovernmental organizations, youth associations andreligious institutions). This implies that youth rely principally on their strength and onfamily support, as well as that they have explicit expectations of state institutions,whereas they rely on the assistance of the civil sector only exceptionally. On thefringes of this scheme there are the media, of which the youth probably expect toreport on their problems in a manner that should not be chiefly sensationalist andapocalyptic, and perhaps to become a platform for public voices of those youngleaders who can best affirm their generation.

74
Table 37: Perception of the most important measures to solve youth problems in Croatian society
(3 responses possible)
FrequencyPercent of
respondents
1) ensure the participation of youth in decision making at all levels 310 33.6
2) introduce legal provisions to reduce the number of. and to ensurethe monitoring of places where young people meet (disco clubs, etc.)
117 12.7
3) ensure equal chances in education and employment for all 510 55.3
4) introduce strict sanctions for drug dealers and limit the selling ofalcohol
470 50.9
5) establish an independent ministry for youth affairs 171 18.5
6) develop national strategy for promoting well-being of youngpeople
156 16.9
7) establish funds for youth initiatives in different sectors of society 156 16.9
8) bring secondary and higher education closer to new life needs 275 29.8
9) other 7 0.8
Total number of answers 2,172
Valid
Total number of respondents 923
Since young people find, in addition to themselves and their parents, state institutionsmost responsible for solving their problems, a question arises as to what activities theyouth think these institutions should undertake to efficiently tackle their problems(Table 37; for an overall ranking see Graph 20). The majority of youth deem twothings to be the most efficient: ensuring equal education and career opportunities(55.3%), and strict punishing of drug dealers and restrictions on alcohol selling(50.9%). The latter requirement is in accord with the finding from above that themajority of youth consider socially unacceptable behaviour, including drug-addiction,to be the gravest problem of their generation. Obviously, the youth hold that the bestway to repress drug abuse is to punish drug dealers, rather than consumers, which isstill a prevailing tendency in Croatian law. Putting equal education and careeropportunities at the top of the youth affirmation measures, also correlates to theirperception of unemployment as one of their two major problems, though it seems thatthis requirement is broader in meaning, as it calls for building of society of equalchances.
Interestingly, one third of young people (33.6%) are of the opinion that youthparticipation in decision-making at all levels should be ensured, despite the fact thatonly one tenth of them mentioned insufficient social engagement of youth (10.8%;Table 35) among main youth problem sin Croatia. The fact that three times morerespondents hold that the participation of youth in decision-making ought to beensured, suggests that a significant number of young people see themselves not asthose who are not interested in political and social issues but as those who aredissatisfied with the fact that these issues are attempted to be solved without anyinfluence from their side.
Graph 20:

75
0,8
12,7
16,9
16,9
18,5
29,8
33,6
50,9
55,3
0 10 20 30 40 50 60
other
monitoring places for youth
funds for youth
national youth strategy
ministry for youth
reform of education
participation of youth
sanctions for drug dealers
equal chances
Perception of most important steps to solve youth problems
Fourth in a rank (29.8%) is the requirement for better adapting secondary and highereducation school to the needs of contemporary life. This aspect is underlined byalmost three times more respondents than in the case of defining major youthproblems in Croatia (Table 35), when slightly over one tenth (12.1%) mentionededucation quality. The figures suggest that there is more a latent dissatisfaction witheducational system that is not always brought to surface by the respondents. This issurely due to the fact that the majority of young people surveyed, being still withineducation process, come to the conclusion that, in the light of their daily experience,teaching contents correspond insufficiently to their contemporary needs.
Further, 17-19% of young people hold it advisable to establish a ministry for youthaffairs (18.5%), work out a national strategy for promoting youth wellbeing (16.9%)or set up special funds for youth initiatives (16.9%). These demands resemble eachother since they all target towards the need to devise national youth policy. Theseactivities have commenced in Croatia by the development of the National YouthAction Strategy, as an initial step for articulation and realization of an efficient youthpolicy.
Finally, a bit more than one tenth (12.7%) of the surveyed favour legal regulation inthe sphere of youth leisure with an aim to reduce the number of, and better monitor theyouth gathering places. A provision of the Croatian Family Law restricts freedom ofmovement of those below 16 years of age after 11 p.m. However, public discussionshave made it clear that restrictions should be shifted from youth to the owners ofdisco clubs and cafés since, by their business policy, they actually stimulate late nightgatherings of youth. It seems that our respondents are more inclined to the latteroption, or at least prefer social intervention at very places where they meet, to legalrestrictions of their rights.

76
B. IMPORTANCE OF CERTAIN VALUES FOR ONESELF AND FOR SOCIALPROMOTION
Table 38a-u: Personal importance of certain values: Summary
ValuesImportant/Very
importantpercent of
respondents
Mean
social power 61.6 3.64
democratic system 64.5 3.67
economic security 87.5 4.23
national sentiments 59.3 3.56
rights and freedoms of the individual 93.4 4.46
protection of minorities 72.3 3.86
respect for difference (pluralism) 85.4 4.19
high economic standard 52.0 3.44
the rule of law 82.8 4.12
European integration 57.0 3.53
inviolability of property 81.3 4.07
Religion 68.4 3.77
solidarity among people 93.9 4.38
gender equality 95.3 4.53
peace in the world 95.3 4.57
free market 77,5 3.94
social justice 90.1 4.25
civil society 80.0 3.99
freedom of the media 72.5 3.91
healthy environment 96.3 4.59
Table 38a-u summarises the tables given in Annex that show distribution of personalvalues of our respondents. When their choices are viewed as a whole, one primarilynotices that all 20 values are considered important or very important, ranging from52% to 96%, to most examinees (this is confirmed also by average scores on the 5-grade scale, ranging from 4.59 to 3.4). Still, within generally favourable receptionthere is a certain hierarchy that needs to be discussed further.

77
Graph 21: Ranking
Personal values (Mean)
3,44
3,53
3,56
3,64
3,67
3,77
3,86
3,91
3,94
3,99
4,07
4,12
4,19
4,23
4,25
4,38
4,46
4,54
4,57
4,59
0 1 2 3 4 5
high economic standard
European integrat ion
nat ional sent iment
social power
democrat ic system
religion
minority protect ion
freedom of media
free market
civil society
ownership inviolability
rule of law
respect for differences
economic security
social just ice
solidarity among people
rights and freedoms
gender equality
peace in the world
healthy environment
The values that are considered to be very important by one half to two thirds of therespondents are healthy environment (M=4.59), peace in the world (M=4.57), genderequality (M=4.53), and rights and freedoms of the individual (M=4.46). Such choiceis a combination of classical, modern and postmodern values that are not unexpected.However, knowing the present Croatian context, a high placement of gender equalityis rather unusual. In fact, during the 1990s the Croatian society went through aprocess re-traditionalisation that brought in its wake the revitalization of patriarchalpatterns of thinking and acting. This research has demonstrated that, at least in thesphere of gender relations, patriarchal influence has been of a limited scope and thatsocial affirmation of women, initiated during socialist period, is an irreversibleprocess.
Approximately one fourth to two fifths of the respondents deem as very important thevalues of solidarity among people (M=4.38), social justice (M=4.25), economicsecurity (M=4.23), respect for differences (M=4.19), rule of law (M=4.12),inalienability of property (M=4.07), civil society (M=3.99), free market (M=3.94),freedom of the media (M=3.91), protection of minorities (M=3.86%), religion(M=3.77) and democratic system (M=3.67). Most of these values belong to thehorizon of key classical liberal-democratic principles. A significant number of youngpeople accept them in their entirety, and if we add this to the number of those who

78
deem them to be the ‘only’ important values, it becomes evident that democraticpotential of youth in Croatia stands on a relatively respectable level, as already shownby other recent studies.
The bottom of the scale is occupied by the values of social power (M=3.64), nationalsentiment (M=3.56), European integration (M=3.53), and high economic standard(M=3.44), all of which are accepted as very important by one tenth to one less thanone fifth of the surveyed. These data are interesting primarily due to the placement ofhigh economic standard to the very bottom of the scale, contrary to research findingsof 4-5 years ago, when young people placed living standard on top of the value scale.It may be presumed that the discrepancy is due to age differences between thesamples (since it has been shown that as the age increases, the value of living standardgets more appreciated). However, it is more probable that the factor of economicsecurity ranked higher in the present research (M=4.23), is equivalent to the value ofliving standard from the earlier research. In other words, it seems that young peopledo not aspire to being rich but to live comfortably and with no crisis. A low rank ofnational sentiment and social power is in accord with earlier research results, whileEuropean integration holds such a weak position probably because it still presents, atleast for this generation of Croatian youth, more a political objective than a valuerecognizable at the level of their environment.
Table 39a-l: View on the importance of certain values for social promotion inCroatia: Summary
ValuesImportant/Very
importantpercent of
respondents
Mean
personal endeavour 89.0 4.29
‘connections’ to, and acquaintance with important people 84.3 4.18
Knowledge and skills (competencies) 85.9 4.29
national background 47.4 3.20
mere luck 50.0 3.37
Bribing people holding important positions 38.6 2.89
university diploma 73.0 3.93
money and wealth 65.8 3.67
Destiny 46.8 3.23
Membership in the ruling party 31.2 2.83
adaptive behaviour 95.1 4.42
submissiveness and obedience to the boss 58.5 3.51
Opinions of young people about factors determining social promotion in Croatiansociety presented in Summary Table 39a-l are extremely interesting, since they alsoreflect their perception of social reality. Among the factors that 84-95% ofrespondents assess as 'very important' or 'important' are the following: adaptivebehaviour (95.1%; M=4.42), personal endeavour (89.0%; M=4.29), knowledge andskills (85.9%; M=4.29), and connections and acquaintances (84.3%; M=4.18).
We deal here with diverse list of factors some of which follow ideal social norms,while others disregard them. That is to say, in an ideal society, or at least in a well

79
organized society that is focused on well-being of its citizens, knowledge, abilitiesand effort should be major ‘functional’ instruments of social promotion, and a largenumber of young people evidently believe this is or should be the case. Nevertheless,as an extremely large number of the surveyed believe both in power of adaptation(which may be seen in a negative sense, as lack of scruples or as ‘hunting in troubledwaters’, or in a neutral sense, as making full use of all opportunities offered) and inconnections to, and acquaintances with powerful people, these attitudes actuallydiminish the importance of personal abilities and knowledge.
Graph 22: Ranking
Important for promotion in Croatian society (Mean value)
2,83
2,89
3,2
3,23
3,37
3,51
3,67
3,93
4,18
4,29
4,29
4,42
0 1 2 3 4 5
ruling party membership
bribing
national background
dest iny
mere luck
obedience
money/wealth
university diploma
good connect ions
personal endevour
competencies
adaptive behaviour
It may be said that youth learn about social reality in, at least, three ways: a) byobserving their environment; b) by socialising into the so-called 'folk theories' ofsuccess; and c) by being exposed to rhetoric of social promotion heard in public. In asociety in which the latter two differ, while information from the environmentactually disapproves rhetoric of sucsess, it is possible that young people accept asituationally defined dual-attitude-system with hidden and overt values. If we recallthe discussion from above, we see that young people believe that their problemswould be resolved more efficiently if equality of education and career opportunitieswould be ensured. Thus, it comes out that adaptive behaviour and a widespreaddependency on connections and acquaintances are powerful factors that directlycontribute to the creation of social inequality in Croatia which, at least until today,neither competencies nor personal endeavour has altered.
The second group of factors contributing to social promotion consists of those factorsthat enjoy middle-level acceptance by our respondents (50-73% consider them eitheras very important or important), such as university degree (73%; M=3.93), money andwealth (65.8%; M=3.67) and obedience and submissiveness to the 'boss' (58.5%;M=3.51). Here again we find a combination of socially appropriate and inappropriatefactors. On the one hand, the respondents mention the necessity of university

80
credentials, while on the other hand they stress the importance of both socio-economic background and submissiveness to the 'boss'. Since these factors areimportant or very important to over half of the surveyed, they provide the supplementto a complex picture of ways and means of social promotion in the Croatian societyseen from the eyes of young people.
The smallest number of respondent consider very important or important thefollowing factors: luck (50.9%; M=3.37) and destiny (46.8%; M=3.23) whichcertainly do not succumb to individual control; this fact being indicative of theexistence of fatalism among Croatian youth; national background (47.4%; M=3.20);corruption or bribing persons in power (38.6%; M=2.89) and membership in theruling party (31.2%; 2.83). Most of these factors belong to the category ofinappropriate ways of social promotion. Although it is encouraging that they areplaced low, the fact remains that at least one third of the respondents perceive them asimportant.
From the perspective of the values of human rights, equality and justice, it is highlytroublesome that one third to one half of young people think that belonging to certainnation or political party or merely bribing and corruption influence their opportunitiesin life. Moreover, it is also troublesome that several young people think thatcorruption is present in Croatian society to such an extent that it can affect numerouslives.
Upon overall examination of the above data, the thesis may be established that manyyoung people believe in importance of individual abilities and effort, but such‘idealism’ is noticeably supplemented by the perception of reality that suggests theimportance of other factors deviating from desired norms. As a whole, the dataobtained are an index of the youth's perception of Croatian society as a society wherethe principle of equal opportunities has not yet been sufficiently realised. It isinteresting to note that during the last decade of socialism, the then students alsoperceived the Croatian society as society of unequal chances. At that time studentswere emphasizing the importance of wealth and moral and political conformity, morethan today’s youth. On the other hand, the youth of today lay more stress on diligenceat workplace, luck and bigotry, while all of them equally value adaptability,connections and acquaintances, university education, knowledge and skills, andcorruption.
Therefore, although there are certain differences in ranking which need furtheranalysis, the basic youth's perception of factors pertaining to social promotion inCroatia, in both socialist and democratic system, is the same. This means that not onlythen young people saw socialism as a system that failed to realise the principle ofequal opportunities for all, despite the fact that it was one of its basic premises fordecades, but that today’s youth, who live in a democracy-in-the-making, do not seetoday's Croatian society as the society of equal chances (which, again, is said to beone of its basic premises). A worthy addition to our data is the thesis obtained in theabove-mentioned research that as the age increases, ethical idealism decreases, whileat the same time acceptance of traits and behaviour bearing socially inappropriatefeatures grows. This kind of social maturing undoubtedly contains an implicit critiqueof the Croatian society in the years of transition.

81
3.3. Correlation analysis: Differences among youth
Frequency analysis of the collected data on young people in Croatia is supplementedby the results of a bi-variant analysis of certain phenomena under examination, viz.findings indicating differences among the respondents with respect to their socio-demographic and social features. The analysis covers a total of 12 questions regardingthe following: the use of computer, perception of the respondents' present and futurelife, professional and educational aspirations, housing arrangements, preferable placefor living, estimation of opportunities for getting a preferred job, feelings about schoolor faculty study, use of tobacco, alcohol and marijuana, and (dis)satisfaction with theway free time is spent.
In order to determine possible differences among our respondents within thesefeatures, a total of 6 independent variables have been chosen. They are: sex, age,father's educational background, respondents' socio-professional status, residentialstatus and regional background. In this analysis the respondents' educationalbackground - a feature that, in general, substantially affects interpersonal and inter-group differences, as proved by earlier research on various groups - has not been used,since in the present sample only those respondents who completed secondaryeducation have been statistically relevant for further analysis. As the number ofrespondents with completed tertiary education is low, and, furthermore, educationlevels of our respondents largely correspond to age, an analysis based on respondents'education would be redundant. In the following passages we shall bring forward andinterpret only those results that are relevant at p=.001, and more.
A. THE USE OF COMPUTER
Table 40: Use of computer in relation to the type ofsettlement
Type of settlement
town village ZagrebTotal
Count 362 157 138 657yes
% 73.0% 55.1% 83.6% 69.5%
Count 134 128 27 289Use of computer
no% 27.0% 44.9% 16.4% 30.5%
Count 496 285 165 946Total
% 52.4% 30.1% 17.4% 100.0%
χ2=46.28; df=2; p=.0001

82
Table 41: Use of computer in relation to father’s educationalbackground
Father's educational background
elementary school
or less
Secondary school higher educationand university
Total
Count 29 394 206 629yes
% 33.0% 69.1% 87.7% 70.4%
Count 59 176 29 264Use of computer
No% 67.0% 30.9% 12.3% 29.6%
Count 88 570 235 893Total
% 9.9% 63.8% 26.3% 100.0%
χ2=93.32; df=2; p=.0001
Table 42: Use of computer in relation to regional backgroundRegion
Zagreb NorthernCroatia
MiddleCroatia
Istria andCroatianLittoral
EasternCroatia
DalmatiaTotal
Count 138 148 46 78 122 125 657Yes
% 83.6% 67.6% 62.2% 72.2% 62.6% 67.6% 69.5%
Count 27 71 28 30 73 60 289Use ofcomputer
No% 16.4% 32.4% 37.8% 27.8% 37.4% 32.4% 30.5%
Count 165 219 74 108 195 185 946Total
% 17.4% 23.2% 7.8% 11.4% 20.6% 19.6% 100.0%
χ2=22.92; df=5; p=.0001
Table 43: Use of computer in relation to ageAge
15-19 20-24Total
Count 384 273 657yes
% 77.1% 60.9% 69.5%
Count 114 175 289Use of computer
no% 22.9% 39.1% 30.5%
Count 498 448 946Total
% 52.6% 47.4% 100.0%
χ2=29.07; df=1; p=.0001

83
Table 44: Use of computer in relation to socio-professional statusSocio-professional status
pupil student unemployed employedTotal
Count 301 225 39 92 657yes
% 80.9% 85.6% 33.3% 47.4% 69.5%
Count 71 38 78 102 289Use of computer
no% 19.1% 14.4% 66.7% 52.6% 30.5%
Count 372 263 117 194 946Total
% 39.3% 27.8% 12.4% 20.5% 100.0%
χ2=171.48; df=3; p=.0001
Although over two thirds of the surveyed use computer, a comparison of this fact andthe respondents' features reveals that in respect to this, young people are stillconsiderably differentiated. Altogether, the five tables make it obvious that computersare used most frequently by young people living in Zagreb, whose fathers havetertiary education, who are below 19 years of age and are still pupils or universitystudents. Conversely, computers are used less frequently by rural young people, thoseliving in Middle or Eastern Croatia (the areas most heavily destroyed in war), whosefathers have no qualifications, who are over 20 years of age and who are currentlyeither unemployed or employed.
The afore-mentioned tendencies clearly designate that computer use is sociallyconditioned, since life in an urban environment and in educated families stimulatesuse of new information and communication technologies. These data confirm that oneof the major reasons for not using computer is the family’s lack of means to purchaseit.
By average Croatian living standard computer remains a weighty investment andpeople with low salaries find it hard to buy one. In addition, it should be mentionedthat younger respondents use computers more often than the older ones, this beingindicative of the fact that to each new generation computers become more and morepart and parcel of their everyday life. Hence it is understandable that computers areused more by pupils and university students than by the employed (some of whomundisputedly do not use computers at work) and the unemployed youth (who probablylack means for purchasing a quality computer).

84
B. PERCEPTION OF PRESENT LIFE
Table 45: Perception of present life in relation to ageAge
15-19 20-24Total
Count 87 139 226Bad
% 17.5% 31.0% 23.9%
Count 291 248 539Good
% 58.6% 55.4% 57.0%
Count 119 61 180
Perception of present life
excellent% 23.9% 13.6% 19.0%
Count 497 448 945Total
% 52.6% 47.4% 100.0%
χ2=31.63; df=2; p=.0001
Table 46: Perception of present life in relation to socio-professional statusSocio-professional status
pupil student unemployed employedTotal
Count 51 56 54 65 226Bad
% 13.7% 21.3% 46.2% 33.5% 23.9%
Count 223 155 55 106 539Good
% 60.1% 58.9% 47.0% 54.6% 57.0%
Count 97 52 8 23 180
Perception of present life
excellent% 26.1% 19.8% 6.8% 11.9% 19.0%
Count 371 263 117 194 945Total
% 39.3% 27.8% 12.4% 20.5% 100.0%
χ2=75.80; df=6; p=.0001
Most young people assess their own present life similarly, the only differences beingdue to age and socio-professional status. Satisfaction with their own present life isespecially strong among those between 15-19 years of age, primarily pupils. On theopposite end there are respondents aged between 20-24 as well as those employed andunemployed, all of who are inclined to proclaim their present life as bad. These trendsare disturbing insofar as dissatisfaction grows with age and with the ability to enterthe world of work and the world of adults. Here it is of particular importance to stressthat not only the unemployed young people are dissatisfied, but also the employed.This may lead to a proposition that entrance into the world of work generated littlesatisfaction, and even had an opposite effect.
At this point it should be noticed that young people’s features under examination hadno effect upon their differentiation in reference to attitudes towards their own future.In other words, optimism is ‘the name of the game’ among all categories of youngpeople, including those not too satisfied with their own present life. Probably all ofthem consider themselves young enough to trust that a desired, prosperous futureawaits them.

85
C. PROFESSIONAL AND EDUCATIONAL ASPIRATIONS
Table 47: Professional and educational aspirations in relation to the type ofsettlement
Type of settlement
town village ZagrebTotal
Count 108 101 31 240find a job assoon as possible % 22.0% 35.7% 18.9% 25.6%
Count 338 146 120 604continue education % 68.7% 51.6% 73.2% 64.3%
Count 46 36 13 95
Professional and educational Aspirations
continue work% 9.3% 12.7% 7.9% 10.1%
Count 492 283 164 939Total
% 52.4% 30.1% 17.5% 100.0%
χ2=30.27; df=4; p=.0001
Table 48: Professional and educational aspirations in relation to father’seducational backround
Father's educational background
elementaryschool Or less
secondaryschool
highereducation and
university
Total
Count 29 156 35 220find a job assoon aspossible % 33.7% 27.4% 15.1% 24.8%
Count 46 348 186 580continueeducation % 53.5% 61.2% 80.2% 65.4%
Count 11 65 11 87
Professional and educationalaspirations
continuework % 12.8% 11.4% 4.7% 9.8%
Count 86 569 232 887Total
% 9.7% 64.1% 26.2% 100.0%
χ2=32.70; df=4; p=.0001

86
Table 49: Professional and educational aspirationsin relation to age
Age
15-19 20-24Total
Count 95 145 240find a job assoon as possible % 19.2% 32.7% 25.6%
Count 385 219 604continue education
% 77.6% 49.4% 64.3%
Count 16 79 95
Professional and educational
Aspirationsecontinue work
% 3.2% 17.8% 10.1%
Count 496 443 939Total
% 52.8% 47.2% 100.0%
χ2=95.13; df=2; p=.0001
Table 50: Professional and educational aspirations in relations to socio-professional status
Socio-professional status
pupil student unemployed employedTotal
Count 63 48 80 49 240find a job as soon aspossible % 17.0% 18.3% 69.0% 25.7% 25.6%
Count 304 211 30 59 604continue education
% 82.2% 80.5% 25.9% 30.9% 64.3%
Count 3 3 6 83 95
Professional andeducationalaspirations
continue work% .8% 1.1% 5.2% 43.5% 10.1%
Count 370 262 116 191 939Total
% 39.4% 27.9% 12.4% 20.3% 100.0%
χ2=455.45; df=6; p=.0001
More conspicuous differentiation exists in relation to professional and educationalaspirations of young people, naturally, due to their varied present social position. Tocontinue education is a primary aspiration of pupils and university students (18% ofwhom nevertheless prefer to find a job) aged 15-19, notably those living in Zagreb, infamilies of higher social status. On the other end there are either those young peoplewho aspire to find a job (e.g. the unemployed) or to continue their current job (e.g. theemployed, half of whom however prefer to discontinue their current job). Bothoptions are embraced most intensely by rural young people (unlike those fromZagreb) from low-status families, and older than 20. Apparently, professional andeducational aspirations depend on whether young people have already finishededucation or are still within educational process. Young people of lower social statusprefer earlier employment, whereas respondents of higher social status prefereducational attainment.
D. ACCOMMODATION PREFERENCES

87
Table 51: Accomodation preferences in relation to father’s educationalbackground
Father's educational background
elementaryschool and
less
secondaryschool
higher schooland
university
Total
Count 22 97 20 139with parents/relatives % 25.6% 17.1% 8.7% 15.7%
Count 64 469 211 744Accomodationpreferences in separate
apartment % 74.4% 82.9% 91.3% 84.3%
Count 86 566 231 883Total
% 9.7% 64.1% 26.2% 100.0%
χ2=15.85; df=2; p=.0001
Table 52: Accomodation preferences in relation to ageAge
15-19 20-24Total
Count 104 49 153with parents/relatives % 21.0% 11.1% 16.4%
Count 391 391 782Accomodationpreferences in separate
apartment % 79.0% 88.9% 83.6%
Count 495 440 935Total
% 52.9% 47.1% 100.0%
χ2=16.59; df=1; p=.0001
Table 53: Accomodation preferences in relation to socio-professional statusSocio-professional status
pupil student unemployed employedTotal
Count 81 25 21 26 153with parents/relatives % 21.9% 9.5% 18.1% 14.0% 16.4%
Count 289 238 95 160 782Accomodationpreferences in separate
apartment % 78.1% 90.5% 81.9% 86.0% 83.6%
Count 370 263 116 186 935Total
% 39.6% 28.1% 12.4% 19.9% 100.0%
χ2=18.33; df=3; p=.0001
Frequency analysis has already shown that every sixth respondent finds it desirable tolive with parents and/or relatives, while over four fifths want to live separately, in anapartment of their own. Such a firm desire for housing independence is prominentamong those whose fathers have tertiary education, who are university students andolder than 20. Further, the same desire, at the level somewhat above the average, isthe characteristic of pupils aged 15-19, whose fathers’ educational background is low.These trends suggest that aspirations for housing independence are motivated by socio-economic and maturity factors: the better social background of a person and themore mature a person, a desire for own living space grows.

88
E. PREFERRED PLACE FOR LIVING
Table 54: Preferred place for living in relationto the type of settlement
Type of settlement
Town village ZagrebTotal
Count 287 147 118 552same place asnow % 59.2% 52.3% 72.0% 59.4%
Count 78 69 11 158other place inthe country % 16.1% 24.6% 6.7% 17.0%
Count 120 65 35 220
Preferredplace forliving
some othercountry % 24.7% 23.1% 21.3% 23.7%
Count 485 281 164 930Total
% 52.2% 30.2% 17.6% 100.0%
χ2=27.29; df=4; p=.0001
Table 55: Preferred place for living in relation to regional backgroundRegion
Zagreb NorthernCroatia
MiddleCroatia
Istria andCroatianLittoral
EasternCroatia
DalmatiaTotal
Count 118 120 38 64 92 120 552sameplace asnow % 72.0% 55.3% 52.1% 61.5% 48.2% 66.3% 59.4%
Count 11 39 14 17 53 24 158otherplace inthecountry
% 6.7% 18.0% 19.2% 16.3% 27.7% 13.3% 17.0%
Count 35 58 21 23 46 37 220
Preferredplace forliving
someothercountry % 21.3% 26.7% 28.8% 22.1% 24.1% 20.4% 23.7%
Count 164 217 73 104 191 181 930Total
% 17.6% 23.3% 7.8% 11.2% 20.5% 19.5% 100.0%
χ2=39.23; df=10; p=.0001
A place young people think desirable for living, depends only on their residentialstatus in its narrow and broad sense, viz. on the conditions in place and region wherethey actually live. Thus, young people from Zagreb are more than others unwilling tochange their place of permanent residence. Rural respondents and respondents fromEastern Croatia want to migrate to another place in Croatia more than any othergroup, while all groups equally (do not) want to settle abroad, except for youngpeople from Middle and Northern Croatia, who want that somewhat more than others.Certainly not unexpected, young people living in rural and less developed regionswould like to migrate to some other place.

89
F. ESTIMATION OF CHANCES FOR GETTING A PREFERRED JOB
Table 56: Estimation of chances for gettinga preferred job in relation to age
Age
15-19 20-24Total
Count 86 116 20225%
% 17.6% 26.8% 21.9%
Count 168 115 28350%
% 34.4% 26.6% 30.7%
Count 160 117 27775%
% 32.8% 27.0% 30.1%
Count 74 85 159
Estimation of
Chances
100%% 15.2% 19.6% 17.3%
Count 488 433 921Total
% 53.0% 47.0% 100.0%
χ2=18.60; df=3; p=.0001
Table 57: Estimation of chances for getting a preferredjob in relation to socio-professional status
Socio-professional status
pupil student unemployed employedTotal
Count 56 47 50 49 20225%
% 15.5% 18.0% 43.5% 26.8% 21.9%
Count 118 80 33 52 28350%
% 32.6% 30.7% 28.7% 28.4% 30.7%
Count 134 91 19 33 27775%
% 37.0% 34.9% 16.5% 18.0% 30.1%
Count 54 43 13 49 159
Estimation of
chances
100%% 14.9% 16.5% 11.3% 26.8% 17.3%
Count 362 261 115 183 921Total
% 39.3% 28.3% 12.5% 19.9% 100.0%
χ2=72.75; df=9; p=.0001
Unsurprisingly, the estimation of chances for obtaining a preferred job depends onrespondents’ age and socio-professional status. Perceived directions of influence arealso far from surprising. Namely, chances for getting a desired job are seen asminimal primarily by the unemployed who are over 20, while teenagers between 15-19 years of age rate them as medium. On the other hand, pupils and universitystudents (unlike the unemployed and the employed), that is to say, yet another groupof younger respondents, perceive their chances as very good. Full confidence asconcerns obtaining a desired job is demonstrated by the employed (unlike theunemployed) more than others. Consequently, unemployment bears a decisive impactupon perception of chances for obtaining a preferred job, as it results in heavypessimism. Similar, but less continual, is the effect of age, that is to say, pessimism ofyoung people concerning obtaining a preferred job grows with age. This means that

90
approaching the world of work (and especially waiting in vain to enter it) and facingthe working reality dwindle professional optimism of young people.
G. FEELING ABOUT SCHOOL OR FACULTY STUDY
Table 58: Feeling about school or faculty studyin relation to gender
Gender
male FemaleTotal
Count 155 154 309Negative
% 33.0% 35.0% 34.0%
Count 259 264 523Positive
% 55.1% 60.0% 57.5%
Count 56 22 78
Feeling about schoolor faculty study
Indifferent% 11.9% 5.0% 8.6%
Count 470 440 910Total
% 51.6% 48.4% 100.0%
χ2=13.90; df=2; p=.0001
Table 59: Feeling about school or faculty study in relation tosocio-professional status
Socio-professional status
pupil student unemployed employedTotal
Count 131 91 39 48 309Negative
% 35.7% 35.3% 35.8% 27.3% 34.0%
Count 210 160 54 99 523Positive
% 57.2% 62.0% 49.5% 56.3% 57.5%
Count 26 7 16 29 78
Feeling about school
or faculty study
indifferent% 7.1% 2.7% 14.7% 16.5% 8.6%
Count 367 258 109 176 910Total
% 40.3% 28.4% 12.0% 19.3% 100.0%
χ2=33.90; df=6; p=.0001
Differences among the respondents based on sex and socio-professional status inrelation to feelings they have about their educational institutions, are quitesymptomatic. It has been established that attitude of the unemployed is most negativeof all. Indifference is found most often among young men as well as among theemployed and the unemployed (contrary to university students). These trends implythat strongest educational motivation can be found among university students andgirls, and that unemployed respondents are least satisfied with their educationalattainment. The latter tendency is understandable in light of the fact that futile waitingfor employment belittles one’s educational attainment post festum, as well as theinstitutions that offer education that is currently unnecessary to the society.
Particularly interesting are gender differences, which lead to conclusion that girls ingeneral are less indifferent and more satisfied with educational process andinstitutions than boys. This result correlates with earlier findings that female pupils

91
attain somewhat better average school grades than their male colleagues (better gradesbeing conducive to satisfaction with an institution and v.v.).
The census undertaken in Croatia in 2001 has shown that for the first time ever,among generations born after 1970 the hitherto stable difference between educationalstructure of women and men, has been changed. In a long period after the World WarII men have been on the average better educated than women. It was only amonggenerations born three decades ago and after, that trends have been reversed, withaverage education of women surpassing that of men. The number of young womenwithout any professional qualifications has diminished and the number of womengraduating from secondary school, college or faculty has increased.
However, research undertaken in Croatia during several last decades has shown thatyoung people (as well as adults) hold that education is not adequately valued insociety, which is confirmed also by statistical indicators of experts’ income. Onecannot but notice that two processes are running parallel: increase of women’seducational attainments and decrease of social value of knowledge. In addition, weshould take note of the fact that most probably due to the tendency of increase ingeneral education of women, sociological research in numerous fields exhibits lessand less gender-based differences.
H. THE ABUSE OF PSYCHO-ACTIVE SUBSTANCES
For the purpose of this part of analysis we have focused only on potential abuses oftobacco, alcohol and marijuana.

92
Table 60: Smoking in relation to ageAge
15-19 20-24Total
Count 344 216 560Never
% 69.2% 48.2% 59.3%
Count 31 45 76sometimes
% 6.2% 10.0% 8.0%
Count 122 187 309
Smoking
regularly% 24.5% 41.7% 32.7%
Count 497 448 945Total
% 52.6% 47.4% 100.0%
χ2=43.08; df=2; p=.0001
Table 61: Smoking in relation to socio-professional statusSocio-professional status
pupil student unemployed employedTotal
Count 275 151 61 73 560Never
% 74.1% 57.4% 52.1% 37.6% 59.3%
Count 22 25 13 16 76Sometimes % 5.9% 9.5% 11.1% 8.2% 8.0%
Count 74 87 43 105 309
Smoking
Regularly% 19.9% 33.1% 36.8% 54.1% 32.7%
Count 371 263 117 194 945Total
% 39.3% 27.8% 12.4% 20.5% 100.0%
χ2=80.73; df=6; p=.0001
As demonstrated by earlier research on youth, use of tobacco is rather equallydistributed among young people. It is related solely to age and socio-professionalstatus of respondents. Smoking of cigarettes increases in direct proportion to age.Pupils smoke least, whereas the employed smoke most. Thus, smoking is a habit andan addiction acquired gradually, as young people grow up and resume their permanentsocial roles (this is linked to managing of one’s own financial resources).

93
Table 62: Alcohol consumption in relation to genderGender
male FemaleTotal
Count 70 130 200Never
% 14.4% 28.2% 21.1%
Count 94 136 230several times a year
% 19.4% 29.5% 24.3%
Count 85 87 172Once a month at the most
% 17.5% 18.9% 18.2%
Count 236 108 344
Alcohol consumption
Once a week and more % 48.7% 23.4% 36.4%
Count 485 461 946Total
% 51.3% 48.7% 100.0%
χ2=72.76; df=3; p=.0001
Alcohol drinking is related solely to gender, and, what is of particular importance, tono other feature whatsoever, including respondents’ age. The Croatian society is stillmarked by traditionalism and patriarchal socialization patterns, which is probably thereason why young women drink less than their male peers. As a matter of fact, intraditional culture alcohol drinking still pertain a function of initiation into the worldof adult men. One cannot help noticing certain social tolerance of this phenomenon (atleast when compared to an enduring anti-smoking campaign). Taken together, thesefactors evidently do not discourage young people from trying alcohol at an early ageand acquiring it as a regular habit throughout the period of youth.
Table 63: Abuse of marijuana in relation tothe type of settlement
Type of settlement
town selo ZagrebTotal
Count 323 209 84 616Never
% 65.1% 73.3% 50.9% 65.1%
Count 68 37 27 132Tried once
% 13.7% 13.0% 16.4% 14.0%
Count 105 39 54 198
Abuse of Marijuana
tried twice
or more % 21.2% 13.7% 32.7% 20.9%
Count 496 285 165 946Total
% 52.4% 30.1% 17.4% 100.0%
χ2=27.11; df=4; p=.0001

94
Table 64: Abuse of marijuana in relation tofather’s educational background
Father's educational background
elementaryschool or less
secondaryschool
higher education
anduniversity
Total
Count 74 374 132 580Never
% 84.1% 65.6% 56.2% 64.9%
Count 5 81 38 124tried once
% 5.7% 14.2% 16.2% 13.9%
Count 9 115 65 189
Abuse ofmarijuana
tried twice ormore % 10.2% 20.2% 27.7% 21.2%
Count 88 570 235 893Total
% 9.9% 63.8% 26.3% 100.0%
χ2=22.91; df=4; p=.0001
Table 65: Abuse of marijuana in relation to regional backgroundRegion
Zagreb NorthernCroatia
MiddleCroatia
Istriaand
CroatianLittoral
EasternCroatia Dalmatia
Total
Count 84 146 60 65 142 119 616Never
% 50.9% 66.7% 81.1% 60.2% 72.8% 64.3% 65.1%
Count 27 35 8 18 25 19 132Triedonce % 16.4% 16.0% 10.8% 16.7% 12.8% 10.3% 14.0%
Count 54 38 6 25 28 47 198
Abuse ofmarijuana
Triedtwiceormore
% 32.7% 17.4% 8.1% 23.1% 14.4% 25.4% 20.9%
Count 165 219 74 108 195 185 946Total
% 17.4% 23.2% 7.8% 11.4% 20.6% 19.6% 100.0%
χ2=38.87; df=10; p=.0001

95
Table 66: Abuse of marijuana in relation to genderGender
male femaleTotal
Count 289 327 616Never
% 59.6% 70.9% 65.1%
Count 69 63 132tried once
% 14.2% 13.7% 14.0%
Count 127 71 198
Abuse of Marijuana
tried twice
or more % 26.2% 15.4% 20.9%
Count 485 461 946Total
% 51.3% 48.7% 100.0%
χ2=17.86; df=2; p=.0001
Table 67: Abuse of marijuana in relation to ageAge
15-19 20-24Total
Count 368 248 616never
% 73.9% 55.4% 65.1%
Count 57 75 132Tried once
% 11.4% 16.7% 14.0%
Count 73 125 198
Abuse of Marijuana
tried twice
or more % 14.7% 27.9% 20.9%
Count 498 448 946Total
% 52.6% 47.4% 100.0%
χ2=36.95; df=2; p=.0001
Table 68: Abuse of marijuana in relation to socio-professional statusSocio-professional status
pupil student unemployed employedTotal
Count 288 129 72 127 616Never
% 77.4% 49.0% 61.5% 65.5% 65.1%
Count 41 40 24 27 132tried once
% 11.0% 15.2% 20.5% 13.9% 14.0%
Count 43 94 21 40 198
Abuse ofmarijuana
tried twice Or more % 11.6% 35.7% 17.9% 20.6% 20.9%
Count 372 263 117 194 946Total
% 39.3% 27.8% 12.4% 20.5% 100.0%
χ2=69.18; df=6; p=.0001
The analysis displayed that use of marijuana is connected to all examined qualities ofthe respondents. This means that marijuana users form a socially profiled andrecognizable youth group. Their characteristics correspond to those affirmed by otherresearch of young people. A group of highest risk consists of young people between20 and 24, students (not pupils), living in Zagreb, Istria, Croatian Littoral and

96
Dalmatia, of male sex, and originating from families where father obtained highereducation level. Despite increase in use of the so-called soft drugs in Croatia duringthe 1990s, the use of marijuana - unlike the equally distributed and more widespreaduse of tobacco and alcohol – obviously remains a potential addiction not affecting allgroups of young people equally. The factors such as urban setting, independence fromfamily, and managing more substantial financial means, may stimulate frequentcontact with drugs and gradually lead to its use exceeding sheer experimental and‘recreational’ purpose.
I. (DIS)SATISFACTION WITH THE WAY FREE TIME IS SPENT
Table 69: (Dis)satisfaction with the way free time is spentin relation to age
Age
15-19 20-24Total
Count 119 72 191very pleased % 23.9% 16.1% 20.2%
Count 263 221 484pleased
% 52.8% 49.6% 51.3%
Count 116 153 269
The way free time is Spent
displeased% 23.3% 34.3% 28.5%
Count 498 446 944Total
% 52.8% 47.2% 100.0%
χ2=17.49; df=2; p=.0001
Table 70: (Dis)satisfaction with the way free time is spentin relation to socio-professional status
Socioprofesionalni status
pupil student unemployed employedTotal
Count 99 44 11 37 191very pleased
% 26.6% 16.7% 9.4% 19.3% 20.2%
Count 204 127 61 92 484Pleased
% 54.8% 48.3% 52.1% 47.9% 51.3%
Count 69 92 45 63 269
The way free time is spent
displeased% 18.5% 35.0% 38.5% 32.8% 28.5%
Count 372 263 117 192 944Total
% 39.4% 27.9% 12.4% 20.3% 100.0%
χ2=39.90; df=6; p=.0001
Satisfaction or dissatisfaction with spending own free time depends on respondents’age and socio-professional status. Respondents aged 15-19, pupils, most frequentlyexpress particular satisfaction, while those aged 20-24, and the unemployed, exhibitparticular dissatisfaction. These findings reveal that a tendency of dissatisfactionrelated to free time increases with age, followed by young people’s increasingdemands. A finding that dissatisfaction is the strongest among the unemployed is anindicator of their general dissatisfaction with their living conditions, due to which freetime loses the meaning it has for other young people, who still have school or work-

97
place duties. Besides, most leisure activities require financial means that are the leastat disposal of the unemployed.
Concluding comments
The results of the research described above were obtained on a representative sampleof Croatian youth from 15-24 years of age in the second half of 2002. The researchwas carried on in the context of a regional research project on youth under theauspices of the PRONI institute from Sweden. The main objective of the project wasto provide empirical data on life, needs, attitudes and aspirations of young people as ameans of assisting the process of youth policy review. The process was initiated bythe Council of Europe with a view to strengthen youth participation in democraticchanges of the countries in the region.
This report is the most recent one in a long and well-established tradition of studyingyouth issues in Croatia. Therefore, it often includes comments and references toearlier research findings for the purpose of determining the changes in youth trends,as well as for the purpose of validity testing of our data. On the other side, the datapresented in this report may, together with earlier studies, be used as a reference pointin the process of reviewing the National Programme of Action for Youth, as well as indeveloping a comprehensive, efficient and youth-centred national youth policy. Thecore of the findings is probably that the criteria for determining the upper age-level ofyouth period should be reviewed and extended to include those who are 30 years ofage. The fact that more and more young people remain longer in education, that theydecide to marry and have children later in their life, that they consider changing theirjob and probably, if possible, enrol in re-training programmes for that purpose, as wellas that they desire to reach full independence by relying on their own abilities andendeavour, speaks in favour of the need to redesign our traditional approaches toyouth upper age-limits. Other findings that help us understand some importantdimensions and trends of contemporary life of Croatian youth are summarised below:
• The most basic socio-demographic data demonstrate that very few youngpeople from our research who are 24 and below are married and few think ofhaving children before the age of 25. About half of them live in a two-childnuclear family in a house/apartment of their own that, averagely, comprisesmore than two rooms. Very few have an opportunity to live in an apartment oftheir own, although four fifths express desire to live separately. The aspirationtowards such independence is mainly motivated by socio-economic andmaturity factors: it is a prominent feature of young people who are universitystudents, whose fathers have more education, and who are over 20. Since thechances of having their own apartment in a reasonable period of time arerather minimal, not only due to the difficulties in finding a job but due toextremely high prices in the housing sector, such prolonged co-habitation anddependency on parents and/or relatives is a frequent cause of young people’sfrustrations and is probably related to, together with other factors such aspoverty and limited capacity of pre-school child-care institutions, a constantdecrease in the average number of children per family.

98
• On average, young people are satisfied with their present life and expect nochange in the future. Despite a high unemployment rate especially amongthem, approximately three quarters assess their own present and future life, thelife of their closest friends and their peers in Western Europe as good orexcellent. Their optimism is somewhat even higher than it was found in theend of 1990s. When asked to imagine their life in 10 years ahaed majority seeit as a success, either in general terms or in specific terms of their professionaladvancement or family happiness. Dissatisfaction with present life grows withage and with opportunities to enter the world of work and become fullyindependent, since the young between 20-24 years of age, both employed andunemployed are more inclined to perceive their present life as unsatisfactory.Interestingly enough, the age does not have influence on the assessment offuture, which means, in the context of this research, that young people ingeneral, irrespective of age, equally believe that future brings betteropportunities.
• In reference to their professional and educational aspirations, almost twothirds of the young want to continue education, while one fourth of them thinkof finding a job. The differences are mainly determined by residential, social,and age factors. Thus, a primary aspiration of pupils and university students,as well as of those who live in Zagreb or in families of higher socio-economicstatus, is to continue their education. Contrary to them, rural young people,those who live in low-income families, as well as those who are over 20 aremore inclined to seek for a job or to continuing the job they currently hold.
• Over two fifths of young people plan to leave their present place of residenceso as to be able to meet their professional and educational aspirations. Almosthalf of this group prefer to move somewhere inside the country, most often toa bigger city which is perceived as the place that offers better opportunities forcareer and social positioning, while other half think of going abroad. Thepercentage of the young planning to leave the country for good rose from 11%in 1986 and 18% in 1999 to 19% in 2002. Their migratory plans are connectedto their residential status, i.e. to the conditions in the place or region where theyoung actually live. Young people from Zagreb are less willing to gosomewhere else; rural youth and youth from Eastern Croatia wish to migrateto another place inside Croatia more than any other group, while all groups(except youth from Middle and Northern Croatia who want that somewhatmore than others) equally (do not) want to settle abroad.
• Data on a desired place for living are quite similar to those on migratory plans.The number of youth preferring to remain in their present place of residenceand the number of those having no migratory plans are almost identical. Whencompared to earlier studies, we see an increase in the number of young peoplepreferring to live in large cities. In addition, almost one quarter express theirpreference for living abroad, majority of which opt for a Western Europeancountry. The fact that almost one fifth of all has plans and almost one fourthprefer to live abroad indicate the existence of two closely related but,nevertheless, separate dimensions of youth migratory thinking. While thepreference for other counties may mean only an inclination, having plans on

99
migrating abroad most certainly includes active search for such a possibility.In light of our findings it means that at least one fifth of Croatian youth notonly dream of leaving the country but actually make plans how to make it areality.
• Employed youth is far from being satisfied with their jobs. Every secondconfirms his or her disappointment. Approximately one fifth of both them andthose that are still in the process of education desire jobs in the service orbusiness sector; little less in number think of entering more creative and/ordynamic professions or professions related to education, health care and socialservices. This means that their professional aspirations are somehow higherthat those of their parents, majority of whom have secondary school completedand are mainly employed as industrial, service and shop workers or clerks.Nevertheless, if their choices are compared to the structure of the employedforce in Croatia and if we add to it a rapidly changing labour market in alltransitional countries, their professional preferences seem rather realistic. Thisis probably why almost half of the young hold that their chances for getting apreferred job are high or very high. The data also confirm that theirestimations are related to age and socio-professional status since pessimismincreases with age (except for the university students) and is tightly linked tounemployment status. In any case, optimism prevails among the young and it,as well, may be linked to their strong motivation to succeed in life by relyingon their own abilities despite unfavourable social and economic context inwhich they live.
• It is also possible, at least partly, that self-assurance of young people comesfrom positive educational experience. Over half of the young state they feelhappy and satisfied when thinking of their schools or universities. However, itis not clear whether their satisfaction should be understood in terms ofacquiring subject-matter knowledge and skills or in terms of developingcertain personal qualities through participating in school life. Earlier studieson youth have proven that the young have complex relations towardseducation which are the outcomes of both institutional tasks and personalexpectations. Moreover, our results document that feelings about school arecorrelated with sex and socio-professional status.Girls and university students,in general, are more satisfied with their education, while the unemployed areamong the least satisfied. It is also possible that positive feelings abouteducation also relate to school grades. Earlier studies have shown that femalepupils receive somewhat better average scores than their male schoolmates,which may explain why girls have more positive feelings about school thanboys.
• On the other hand, it is clear that school is by no means a source ofinformation about the events in the country and the world for young peoplesince a great majority of them actually receive news through ordinary media(TV, radio, newspapers and magazines). Moreover, Internet has become animportant source of information about the country and the world forapproximately one fifth and over one fourth of them, respectively. This shifthas to do with the fact that over two thirds of the young from our study arecomputer users and that more than half of them already have computer at

100
home. It is, therefore, obvious that new information and communicationtechnologies are becoming part and parcel of young people’s daily life whatneeds to be taken into account when policies and programmes of action forpromoting their wellbeing are designed, especially in reference tounderprivileged youth. Namely, our research confirms that the use ofcomputer correlates with residence (urban environment), family background(parents with higher education and higher socio-economic status), age, andeducation factors (younger population and students).
• Nevertheless, young people are not enslaved by new information-communication technologies. Most of them spend their free time associatingwith friends, engaging in sport activities, going to disco-clubs, watching TV orperforming outdoor activities, while far less enjoy music, reading books or artexhibitions. In addition, many young people have no daily obligations, exceptin relation to school and spend their free time idling or sleeping. This meansthat the majority of youth either do nothing or engage almost solely in the so-called passive and/or receptive activities for self-entertainment. Despite thatfact, almost three fourths of them claim they are more or less satisfied withhow they spend their free time what brings us to the conclusion that the mainproblem is not the quality of their free time activities but their lack ofawareness that the quality itself is being at stake. However, it should bepointed out that their opinions are related to age and socio-professional status.Young people who belong to an upper age-cohort and who are unemployedexhibit far more dissatisfaction with their free time than the youngest. Over-pronounced dissatisfaction among the unemployed seems to be an indicator ofan overall discontent with one’s own life. For the unemployed, free timebecomes a burden not only because they cannot perceive it in terms of an off-duty activity but because they can not afford it financially.
• In reference to the use of psychoactive substances, it seems that tobaccosmoking and alcohol consumption are the most widespread types of riskbehaviour among the youth. Approximately one third of them smokecigarettes or drink alcohol daily or weekly; three fifths are non-smokers andone fifth never drink alcohol. Smoking increases with age and employment.Alcohol, on the other hand, is solely related to gender in a way that youngwomen drink less than their male peers. Such trend may be the sign of a subtlemale initiation rite de passage that has outlived its traditional context. Sincethe data on smoking are more favourable than those from earlier research itmay be presumed that an anti-smoking media campaign, which has been goingon rather aggressively throughout the country, has brought positive effect,whereas non-existence of similar anti-alcohol campaign may be the sign of arelatively high level of a social tolerance for alcohol consumption. As far asdrug are concerned, Croatian youth is more inclined to the so-called 'soft'drugs. Over one third of the young have tried or used twice or more onlymarijuana; hashish and ecstasy is mentioned by less than one tenth of them,whereas other 'hard' drugs have been only tried or are consumed by 1-3% ofthem. The consumption of marijuana is associated with a recognizable youthgroup, what confirms earlier studies. A group of highest risk is made of youngpeople between 20 and 24, male, university students, the residents of Zagreb,

101
Istria, Croatian Littoral and Dalmatia, and whose fathers have highereducation level.
• A great majority of young people tend to see themselves in rather positiveterms: they are self-assured, think they have a good number of personalqualities; believe in their capabilities when compared to other people and haveno doubts that most people they know like them. This may be related tofeeling of security they experience in the context of their immediateenvironment since a great majority of the young claim that they can almostalways get warmth, care and support from their parents and support from theirfriends. On the other hand, only every second of them feel the same abouttheir teachers. It seems that most Croatian families are characterised by anexercise of indirect and flexible control over their children in the course oftheir growing up. In over half of the cases parents or relatives hardly everdetermine rules for their children’s behaviour although they do control thechoice of their friends, as well as their evening outdoor activities. Moreover,young people claim that their parents are especially keen of their schoolprogress since they almost regularly keep records on their children schoolsituation.
• When asked about the most serious problems of their generation, the majorityof young people in Croatia mention socially unacceptable behaviour, such asdrug abuse, alcohol consumption and violence, unemployment, low standardof living, the lack of life chances and mass migration of young experts abroad.Since unemployment was repeatedly displayed as the major problem of younggeneration in earlier studies, their present preoccupation with sociallyunacceptable behaviour may be related either to the sample structure (majorityof them are students) or to a general social climate which is, due topredominance of media campaigns mainly geared against smoking and drugabuse (but not against alcohol consumption, except for safe driving), inducingan over-sensitisation to behavioural issues causing, on the other side, the lackof awareness of existentially important issues of young people that are of anutmost importance for their independence and self-satisfaction.
• Young people are inclined to attribute responsibility for solving theseproblems primarily to themselves, their parents and public authorities, i.e.firstly to those actors that function at the private level (personal and parents’responsibility), than to public sector (government, education system) and,finally, to the civil society (nongovernmental organizations, youth associationsand religious institutions). This means that youth principally count on theirpersonal strength and family support, as well as that they have explicitexpectations of state institutions, whereas they think of receiving theassistance from the civil sector only exceptionally. Notwithstanding, since halfof the young studied have failed to mention personal responsibility, it clearlydemonstrates that both strong sense of self-responsibility and its avoidancestand side by side as two features of Croatian youth.
• Among the measures that Croatian youth see as the most efficient for solvingtheir problems two are underlined: equal education and career opportunities,on the one hand, and strict punishment of drug dealers and restrictions on

102
alcohol selling, on the other hand. Since the majority of youth considersocially unacceptable behaviour, including drug-addiction, to be the gravestproblem of their generation, it is understandable that they see the way out instrict punishing of drug dealers, (rather than consumers), what is stillinadequately determined by Croatian law. Other most frequently mentionedmeasure has to do with the youth quest for developing society of equalchances which is in line with their perception of unemployment as the secondmost frequently mentioned youth problem in Croatia. Although lesser innumber, the young refer to their under-representation and require theirparticipation in decision-making to be ensured at all levels. They also requirebetter adapting of secondary and higher education to the needs ofcontemporary life, as well as better quality of education, in general; somespeak in favour of establishing a ministry for youth affairs, developingnational strategy for promoting youth well-being, setting up of funds for youthinitiatives, better legal regulations of the places of youth entertainment, i.e.,the issues majority of which have already been integrated into the recentlyadopted National Programme of Action for Youth that is seen as an initial stepin developing a national youth policy.
• The values that the majority of young people hold personally important orvery important are healthy environment, peace in the world, gender equality,and rights and freedoms of the individual. Second group of the mostpersonally preferable values encompasses solidarity among people, socialjustice, economic security, respect for differences, rule of law, inalienability ofproperty, civil society, free market, freedom of the media, protection ofminorities, religion and democratic system. The bottom of the scale isoccupied by social power, national sentiment, European integration, and higheconomic standard. The review of their preferences demonstrates a relativelyrespectable level of democratic potential of young people in Croatia. They aremore oriented towards comfortable life based on key principles of democracyand civil society, which is in correspondence with earlier research that havedocumented the shift to a more individualistic value system, including youth’spreference for independence and their focus on self-realisation and materialsecurity. However, their relative devaluation of the importance of Europeanintegration may be, on the one hand, the sign of either their dissatisfactionwith, or their criticism of the way new European order has been established,partly due to the fact that Croatia has been somehow unjustly left behind. Onthe other hand it may be the consequence of their perceiving the integrationmerely in terms of a political objective of which very little they experience ineveryday life. This is not to say that they devaluate the importance ofEuropean integration for Croatia as such. It would be more accurate to say thatCroatian young people are becoming more and more pragmatic in their socialpositioning of which many think not only in the context of Croatia but in thecontext of Europe and the world. Having in mind a long tradition of Croatianyouth emigration to Europe and the fact that almost 20% of contemporaryyouth plan to leave the country for good (mostly for a European country), theirrelation toward European integration may mean that they see it only as anadded value to an already established youth migratory pattern in Croatia.

103
• Opinions of young people about the determinants of upward social mobility inCroatia reflect their accurate perception of social anomalies that, if leftunquestioned, threaten to deepen social inequalities and diminish democraticpotential of the society. Namely, a great majority of the young see asimportant or highly important for social promotion in Croatia a combination ofthe following variables: adaptive behaviour, personal endeavour, knowledgeand skills, and connections and acquaintances. University degree, money andwealth, and the obedience and submissiveness to the 'boss', are identified lessbut, nevertheless, reflect a combination of appropriate and inappropriatemeans of social promotion. Somehow more troublesome is the finding that onethird to one half of the young consider belonging to certain nation or politicalparty, as well as bribing and corruption as important determinants of one’ssuccess in Croatia. These data present an index of youth's perception ofCroatian society as the society of unequal chances since it, by allowing non-democratic practice to play an important role in social promotion, actuallydiscriminates against those who in this matter believe in, and rely on their ownabilities and efforts. When compared to earlier studies, it is highlytroublesome that almost the same factors of social promotion are estimated asimportant by both socialist and ‘transitional’ young people in Croatia.
Overall examination of the above results may be seen as an indicator of a process ofrelative homogenisation of young people in today’s Croatia – certainly, within theissues here examined and at the present level of analysis. There is no doubt that youngpeople here described have many characteristic in common, especially in reference totheir marital status, family pattern, housing conditions, parent’s educationalbackground, attitudes towards present and future life, professional and educationalaspirations, desired accommodation, sources of information, satisfaction with freetime, positive feelings about themselves, feeling of security in relation to their parentsand friends, as well as in reference to their abuse of psychoactive substances. Theyalso share their desire for autonomy and independence, and for the recognition by thesociety at large, as well as their dreams of a more just society in which lifeopportunities would match individual abilities and endeavour. When they differ, it ismostly due to their varied socio-professional status and age. Residential status,father’s educational background, gender, and regional background are less important.The tendencies that have been deocumented suggest that youth are divided primarilyby their actual social status and stage of attained maturity, and only secondarily bysocialization factors, such as social origin in a narrow and broad sense of the term,and a gender socialization patterns. However, further analysis of data should discloseyouth dominating trends with more accuracy.

104
References
Education for All? The MONEE Project. Regional Monitoring Reports, No. 5.UNICEF, 1998, Doc. CEE/CIS/Baltics.
Goja, J. ‘Neki aspekti religioznosti hrvatske mladeži 1986. i 1999. godine’. Političkamisao 37 (1), 2000, 148-160.
Grubišić, I. and Zrinšćak, S. (eds.) Religija i integracija. Zagreb, Institut društvenihznanosti Ivo Pilar, 1999.
Ilišin, V. at al. Ogledi o omladini osamdesetih. Zagreb: IDIS, 1990;
Ilišin, V. (ed.) Omladina i društvene promjene. Zagreb, IDIS, 1990
Ilišin, V. Mladi na margini društva i politike. Zagreb, Alinea, 1999.
Ilišin, V. and Radin, F. (eds.) Youth and Transition in Croatia. Zagreb, Institute forSocial Research Zagreb and the State Institute for the Protection of Family, Maternityand Youth, 2002.
Ilišin, V.; Radin, F. and Županov, J. Kultura radničke omladine. Zagreb, CDD SSOH,1986.
Kasapović, M. ‘Transition and Neoinstitutionalism: the Example of Croatia.’Croatian Political Science Review 30(2), 1993, 71-80.
Labus, M. ‘Vrijednosne orijentacije u hrvatskom društvu.’ Sociologija sela 147/148(1/2), 2000, supplement, 169-203.
Magdalenić, I. Društveni profil zagrebačkih studenata krajem osamdesetih. Zagreb,IDIS, 1991.
Marinović Jerolimov, D. ‘Religijske promjene u tranzicijskim uvjetima u Hrvatskoj.’Sociologija sela 147/148 (1/2), 2000, supplement, 43-80.
Mihovilović, M. Konflikti generacija, Zagreb, CDD, 1978.
Mladi Hrvatske: Socijalizacija, vrednote, devijacije. Društvena istraživanja 11 (2-3),2002.
Lalić, D. and Nazor, M. Narkomani: Smrtopisi. Zagreb, Alinea, 1997.
Omladina i politika. Split: Marksistički centar MKSKH za Dalmaciju, 1988.
Radin, F. (ed.) Fragmenti omladine. Zagreb, RK SSOH/IDIS, 1988.
Sakoman, S.; Kuzman, M. and Raboteg-Šarić, Z. ‘Čimbenici rizika i obilježja pijenjaalkohola među srednjoškolcima.’ Društvena istraživanja 2-3 (40-41), 1999, 373-396.
Sakoman, S. Raboteg-Šarić and Kuzman, M. ‘Raširenost zlopuporaba sredstavaovisnosti među hrvatskim srednjoškolcima.’ Društvena istraživanja 11 (2-3), 2002,311-334.

105
Spajić-Vrkaš, V. ‘Visions, provisions and reality: Political changes and education fordemocratic citizenship in Croatia.’ Cambridge Journal of Education 33 (1), 2003, 33-51.
Štimac, H. ‘Prilog istraživanju radnih vrijednosti mladih.’ Revija za sociologiju 20 (3-4), 1989, 437-449.
The National Programme of Action for Youth. Zagreb, The State Institute for theProtection of Family, Maternity and Youth, January 2003.
Vujčić, V. Politička kultura i politička socijalizacija, Zagreb, Alinea, 1993.
Women in Transition: The MONEE Project. Regional Monitoring Reports, No. 6.UNICEF, 1999, Doc. CEE/CIS/Baltics.
Young People in Changing Societies. Regional Monitoring Reports, No. 7. Florence:UNICEF Innocenti Research Centre, 2000.
Youth in Transition. International Social Science Journal 164, 2000.
Županov, J. (1995). Poslije potopa. Zagreb, Globus, 1995.

106
Annexes
Individual tables for questions 38 and 39 from Croatian supplement
Tables 38a-u: PERSONAL IMPORTANCE OF CERTAIN VALUES
Table 38a: Social power
Frequency Percent
1) least important 32 3,4
2) not important 96 10.2
3) irrelevant 235 24.9
4) important 399 42.3
5) very important 182 19.3
Total 944 100.0
Valid
Mean 3.64
Table 38b: Democratic system
Frequency Percent
1) least important 30 3.2
2) not important 131 13.9
3) irrelevant 173 18.4
4) important 388 41.3
5) very important 218 23.2
Valid
Total 940 100.0
Mean 3..67
Table 38c: Economic security
Frequency Percent
1) least important 4 .4
2) not important 30 3.2
3) irrelevant 84 8.9
4) important 456 48.3
5) very important 370 39.2
Valid
Total 944 100.0
Mean 4.23

107
Table 38d: National sentiments
Frequency Percent
1) least important 37 3.9
2) not important 144 15.3
3) irrelevant 203 21.5
4) important 374 39.6
5) very important 186 19.7
Valid
Total 944 100.0
Mean 3.56
Table 38e: Rights and freedoms of the individual
Frequency Percent
1) least important 3 .3
2) not important 21 2.2
3) irrelevant 38 4.0
4) important 359 38.0
5) very important 524 55.4
Valid
Total 945 100.0
Mean 4.46
Table 38f: Protection of minorities
Frequency Percent
1) least important 21 2.2
2) not important 72 7.6
3) irrelevant 169 17.9
4) important 440 46.6
5) very important 243 25.7
Valid
Total 945 100.0
Mean 3.86
Table 38g: Respect for difference (pluralism)
Frequency Percent
1) least important 4 .4
2) not important 44 4.7
3) irrelevant 90 9.5
4) important 442 46.7
5) very important 366 38.7
Valid
Total 946 100.0
Mean 4.19

108
Table 38h: High economic standard
Frequency Percent
1) least important 18 1.9
2) not important 173 18.3
3) irrelevant 263 27.8
4) important 362 38.3
5) very important 130 13.7
Valid
Total 946 100.0
Mean 3.44
Table 38i: The rule of law
Frequency Percent
1) least important 12 1.3
2) not important 52 5.5
3) irrelevant 99 10.5
4) important 430 45.5
5) very important 353 37.3
Valid
Total 946 100.0
Mean 4.12
Table 38j: European integration
Frequency Percent
1) least important 31 3.3
2) not important 120 12.7
3) irrelevant 255 27.0
4) important 395 41.9
5) very important 142 15.1
Valid
Total 943 100.0
Mean 3.53

109
Table 38k: Inviolability of property
Frequency Percent
1) least important 6 .6
2) not important 44 4.7
3) irrelevant 126 13.4
4) important 467 49.5
5) very important 300 31.8
Valid
Total 943 100.0
Mean 4.07
Table 38l: Religion
Frequency Percent
1) least important 38 4.0
2) not important 109 11.5
3) irrelevant 152 16.1
4) important 383 40.5
5) very important 264 27.9
Valid
Total 946 100.0
Mean 3.77
Table 38m: Solidarity among people
Frequency Percent
1) least important 5 .5
2) not important 13 1.4
3) irrelevant 40 4.2
4) important 447 47.3
5) very important 441 46.6
Valid
Total 946 100.0
Mean 4.38
Table 38n: Gender equality
Frequency Percent
1) least important 3 .3
2) not important 10 1.1
3) irrelevant 31 3.3
4) important 336 35.5
5) very important 566 59.8
Valid
Total 946 100.0
Mean 4.53

110
Table 38o: Peace in the world
Frequency Percent
1) least important 7 .7
2) not important 14 1.5
3) irrelevant 23 2.4
4) important 289 30.5
5) very important 613 64.8
Valid
Total 946 100.0
Mean 4.57
Table 38p: Free market
Frequency Percent
1) least important 9 1.0
2) not important 71 7.5
3) irrelevant 133 14.1
4) important 485 51.4
5) very important 246 26.1
Valid
Total 944 100.0
Mean 3.94
Table 38r: Social justice
Frequency Percent
1) least important 1 .1
2) not important 25 2.6
3) irrelevant 67 7.1
4) important 494 52.2
5) very important 359 37.9
Valid
Total 946 100.0
Mean 4.25
Table 38s: Civil society
Frequency Percent
1) least important 4 .4
2) not important 38 4.0
3) irrelevant 147 15.6
4) important 534 56.5
5) very important 222 23.5
Valid
Total 945 100.0
Mean 3.99

111
Table 38t: Freedom of the media
Frequency Percent
1) least important 13 1.4
2) not important 89 9.4
3) irrelevant 158 16.7
4) important 399 42.2
5) very important 287 30.3
Valid
Total 946 100.0
Mean 3.91
Table 38u: Healthy environment
Frequency Percent
1) least important 1 .1
2) not important 10 1.1
3) irrelevant 24 2.5
4) important 309 32.7
5) very important 602 63.6
Valid
Total 946 100.0
Mean 4.59
Tables 39a-l: VIEW ON THE IMPORTANCE OF CERTAIN VALUES FOR SOCIALPROMOTION IN CROATIA
Table 39a: Personal endeavour
Frequency Percent
1) least important 3 .3
2) not important 27 2.9
3) irrelevant 74 7.8
4) important 426 45.0
5) very important 416 44.0
Valid
Total 946 100.0
Mean 4.29

112
Table 39b: ‘Connections’ to. and acquaintance with important people
Frequency Percent
1) least important 16 1.7
2) not important 37 3.9
3) irrelevant 95 10.0
4) important 411 43.4
5) very important 387 40.9
Valid
Total 946 100.0
Mean 4.18
Table 39c: Knowledge and skills (competencies)
Frequency ValidPercent
1) least important 3 .3
2) not important 43 4.5
3) irrelevant 87 9.2
4) important 354 37.4
5) very important 459 48.5
Valid
Total 946 100.0
Mean 4.29
Table 39d: National background
Frequency Percent
1) least important 61 6.4
2) not important 252 26.6
3) irrelevant 184 19.5
4) important 338 35.7
5) very important 111 11.7
Valid
Total 946 100.0
Mean 3.20
Table 39e: Mere luck
Frequency Percent
1) least important 46 4.9
2) not important 191 20.2
3) irrelevant 235 24.9
4) important 313 33.2
5) very important 159 16.8
Valid
Total 944 100.0
Mean 3.37

113
Table 39f: Bribing people holding important positions
Frequency Percent
1) least important 154 16.3
2) not important 289 30.6
3) irrelevant 136 14.4
4) important 241 25.5
5) very important 124 13.1
Valid
Total 944 100.0
Mean 2.89
Table 39g: University diploma
Frequency Percent
1) least important 10 1.1
2) not important 94 9.9
3) irrelevant 151 16.0
4) important 392 41.4
5) very important 299 31.6
Valid
Total 946 100.0
Mean 3.93
Table 39h: Money and wealth
Frequency Percent
1) least important 29 3.1
2) not important 123 13.0
3) irrelevant 171 18.1
4) important 428 45.2
5) very important 195 20.6
Valid
Total 946 100.0
Mean 3.67
Table 39i: Destiny
Frequency Percent
1) least important 52 5.5
2) not important 230 24.4
3) irrelevant 220 23.3
4) important 331 35.1
5) very important 110 11.7
Valid
Total 943 100.0
Mean 3.23

114
Table 39j: Membership in the ruling party
Frequency Percent
1) least important 99 10.5
2) not important 335 35.4
3) irrelevant 216 22.9
4) important 219 23.2
5) very important 76 8.0
Valid
Total 945 100.0
Mean 2.83
Table 39k: Adaptive behaviour
Frequency Percent
1) least important 2 .2
2) not important 18 1.9
3) irrelevant 26 2.7
4) important 436 46.1
5) very important 464 49.0
Valid
Total 946 100.0
Mean 4.42
Table 39l: Submissiveness and obedience to the boss
Frequency Percent
1) least important 29 3.1
2) not important 137 14.5
3) irrelevant 225 23.8
4) important 427 45.2
5) very important 126 13.3
Valid
Total 944 100.0
Mean 3.51

115
A. Questionnaire in Croatian
Ministarstvo prosvjete i športaRepublike Hrvatske
Centar za istraživanje, izobrazbu i dokumentaciju u obrazovanju zaljudska prava i demokratsko građanstvo
Filozofskog fakulteta Sveučilišta u Zagrebu
PRONI - Institut za socijalno obrazovanje, Kraljevina Švedska
U P I T N I K
Zagrebsvibanj 2002.

116
Prije ispunjavanja upitnika, molimo te da pozorno pročitaš sljedeće:
Ovaj upitnik je dio međunarodnog istraživanja o životu mladih, radu, obrazovanju,zdravlju, budućnosti, ljubavi i obitelji. Istraživanje se provodi u Hrvatskoj, Bosni iHercegovini, Srbiji, Crnoj Gori, na Kosovu i u Makedoniji. U njemu sudjeluje oko7.000 mladih u dobi između 15 i 25 godina. Projekt je pokrenuo PRONI – Institut zasocijalno obrazovanje, uz potporu SIDA-e - Švedske agencije za međunarodni razvoj isaradnju.
U Hrvatskoj projekt provodi Centar za istraživanje, izobrazbu i dokumentaciju uobrazovanju za ljudska prava i demokratsko građanstvo Filozofskog fakultetaSveučilišta u Zagrebu, u suradnji s Ministarstvom prosvjete i športa. Rezultatiistraživanja bit će objavljeni u nacionalnom i međunarodnom izvješću. Izvješće nećesadržavati pojedinačne rezultate.
Ti si slučajno izabran/na za sudjelovanje u istraživanju. Tako si se našao/la među7000 mladih iz Jugoistočne Europe i 1000 mladih iz Hrvatske koji će njime bitiobuhvaćeni.
Upitnik je anoniman – u njemu nije naznačeno tvoje ime niti on sadrži neki podatakkoji bi te mogao identificirati. Ispunjeni upitnik stavi u omotnicu, zalijepi je i predajnašem anketaru. Na omotnici nemoj pisati svoje ime.
Da bi istraživanje uspjelo, važno je da na svako pitanje odgovoriš iskreno. I nezaboravi - tvoji odgovori su povjerljive naravi.
Sudjelovanje u istraživanju je dragovoljno. Ako na neko pitanje iz bilo kojeg razlogaimaš primjedbu, na njega ne moraš odgovoriti. Tvoje sudjelovanje nam je vrlo važnokako bismo bolje razumjeli potrebe mladih u Hrvatskoj.
Ovaj upitnik nije ni ispit ni test. Tvoji odgovori se ne ocenjuju. Važna je iskrenost.Ako među ponuđenim odgovorima ne nađeš onaj koji ti u potpunosti odgovara,izaberi neki koji mu je najbliži ili sam/a dopiši neki drugi odgovor. (Odgovori napitanja se upisuju ili obilježavaju zaokruživanjem, odnosno stavljanjem znaka "X" uodgovarajući kvadratić.)
Nadamo se da će ti ispunjavanje upitnika biti zanimljivo. Ako ti neko pitanje nijejasno, zatraži pomoć anketara.
Ako želiš znati konačne rezultate istraživanja, molimo te da napišeš svoje ime,prezime i adresu na poseban papir i predaš ga anketaru.
Unaprijed ti zahvaljujemo na pomoći!
A sad možemo početi.

117
1. Kojeg si spola?
□ muškog □ ženskog
2. Koje godine si rođen/a? 19_____.
3. Što si po nacionalnosti?
□ Hrvat/Hrvatica □ Bošnjak/Bošnjakinja □ Srbin/Srpkinja □ Mađar/Mađarica □ Slovenac/Slovenka □ Talijan/Talijanka □ Albanac/Albanka □ Makedonac/Makedonka □ Rom/Romkinja □ Židov/Židovka □ Crnogorac/Crnogorka □ nešto drugo, što? _______________________________
4. Jesi li:
□ neoženjen/neudata □ oženjen/udata □ razveden/a □ udovac/udovica
5. Imaš li već djecu?
Ako da, koliko dece imaš? ____Ako nemaš, u kojim godinama planiraš imati decu? ______
6. S kim živiš?
□ sam/sama □ s ocem □ s majkom □ sa sestrom/sestrama. Koliko sestara imaš? _________ □ s bratom/braćom. Koliko braće imaš? _________
□ s nekim drugim (u kojemu si srodstvu s njima) ____________? Koliko ihje?_____
7. Koliko kuća/stan u kojemu živiš ima prostorija?
□ samo kuhinja □ kuhinja s jednom sobom □ kuhinja s dvije sobe □ kuhinja s tri sobe □ drugo ______________________________

118
8. Imaš li svoju sobu?
□ da □ ne
9. Koristiš li kompjuter?
□ Ne, zašto ne? __________________________________________________
_____________________________________________________________ □ Da, gdje?
□ u kući, □ kod prijatelja, □ u školi,□ na fakultetu, □ na poslu, □ u Internet caffeu□ negdje drugdje, gdje? ____________________________________
10. Obrazovanje tvoga oca je:
□ bez škole □ nezavršena osnovna škola □ završena osnovna škola □ završena srednja škola □ završeno više obrazovanje □ završen fakultet □ magisterij/doktorat
11. Zanimanje tvoga oca je ____________________________________
12. Obrazovanje tvoje majke je:
□ bez škole □ nezavršena osnovna škola □ završena osnovna škola □ završena srednja škola □ završeno više obrazovanje □ završen fakultet □ magisterij/doktorat
13. Zanimanje tvoje majke je _________________________________
14. Koja je najviša razina obrazovanja koju si ti do sada stekao/la?
□ bez škole □ nezavršena osnovna škola □ završena osnovna škola □ završena srednja škola □ završeno više obrazovanje □ završen fakultet □ magisterij/doktorat

119
15. Tvoje sadašnje zanimanje je ______________________________
16. Kako bi – općenito – odredio/odredila svoj sadašnji život?
□ izrazito loš □ loš □ osrednji □ dobar □ izvanredan
17. Kako bi – općenito – odredio/odredila sadašnji život svojih bliskihprijatelja?
□ izrazito loš □ loš □ osrednji □ dobar □ izvanredan
18. Kako bi - općenito – odredio/odredila sadašnji život mladih ljudi (tvojihvršnjaka) u Zapadnoj Evropi?
□ izrazito loš □ loš □ osrednji □ dobar □ izvanredan □ ne znam
19. Kako bi – općenito – odredio/la svoju budućnost?
□ bit će izrazito loša □ bit će loša □ bit će osrednja □ bit će dobra □ bit će izvanredna □ ne znam
20. Kako bi – općenito – odredio/la budućnost svojih bliskih prijatelja(vršnjaka)?
□ bit će izrazito loša □ bit će loša □ bit će osrednja □ bit će dobra □ bit će izvanredna
□ ne znam

120
21. Kako bi – općenito – odredio/la budućnost mladih (tvojih vršnjaka) uZapadnoj Evropi?
□ bit će izrazito loša □ bit će loša □ bit će osrednja □ bit će dobra □ bit će izvanredna □ ne znam
22. Da sad možeš birati, što bi najradije izabrao/la?
□ naći posao što je prije moguće □ nastaviti školovanje □ nastaviti posao koji imam
23. Planiraš li se odseliti iz svoga mjesta kako bi imao/la bolju budućnost?
□ Da, gdje? ________________________ □ Ne □ Ne znam
24. Smatraš li da bi ti veći grad pružio veće šanse u životu?
□ da □ ne □ ne znam
25. Kad bi mogao/la birati kako (s kim) ćeš živjeti, što bi izabrao/la?
□ živjeti s roditeljima/rođacima □ živjeti odvojeno u vlastitom stanu
26. Kad bi mogao/la birati gde ćeš živjeti, gdje bi to bilo?
□ u mjestu u kojemu i sada živim □ u nekom drugom mjestu u svojoj zemlji, gdje? _______________________ □ u nekoj drugoj zemlji, kojoj? _____________________________________
27. Što bi želio/la raditi? (Molimo te da obilježiš najviše tri odgovora.)
□ industrijski radnik/radnica □ liječnik, zubar □ trgovac/trgovkinja □ medicinski radnik/ca, fizioter □ policajac, vojnik, vatrogasac, itd. □ učitelj/učiteljica □ poslovni čovjek/žena □ poduzetnik □ državni službenik □ sportaš/sportašica □ političar/političarka □ bankovni službenik/službenica □ novinar/reporter □ turistički djelatnik/djelatnica □ sveučilišni profesor/istraživač/ica □ znanstvenik/znanstvenica □ poljoprivrednik □ socijalni radnik/radnica nešto drugo, što ______________________

121
28. Što misliš, kolike su tvoje šanse da ćeš sutra obavljati posao koji želiš?
%1-0 ڤ %25 ڤ%50 ڤ%75 ڤ%99 ڤ
29. Kad razmišljaš o školi (fakultetskom studiju), kako se najčešće osjećaš?
□ tužno □ zadovoljno □ zabrinuto □ ponosno □ iznervirano □ nikako □ uzbuđeno □ nešto drugo, što: _________________
30. Pušiš li?
□ ne, nikada □ povremeno zapalim cigaretu □ da, redovito
31. Piješ li alkohol?
□ ne, nikada □ ponekad (nekoliko puta godišnje) □ najviše jednom mjesečno □ jednom nedjeljno □ dva ili više puta nedjeljno □ skoro svakodnevno
32. Kako često uzimaš neku od navedenih droga? (Molimo te da zaokružiš samopo jedan križić u svakom redu.)
Nikad Probao/la samsamo jedanput
Više puta
marihuana: x x xhašiš: x x xLSD: x x xkokain (krek): x x xmetadon: x x xheroin: x x xAmfetamini: x x xecstasy: x x xudišuća sredstva: x x xanabolički steroidi x x xnešto drugo, što? __________________________________
x x x

122
33. Kako se i gdje najčešće informiraš o događajima?
U ZEMLJI: U SVIJETU:(Molimo te da obilježiš najviše tri odgovora.) (Molimo te da obilježiš najviše tri
odgovora.)
□ preko televizije/radija □ preko televizije/radija □ iz novina/časopisa □ iz novina/časopisa □ u školi □ u školi □ u crkvi, džamiji □ u crkvi, džamiji □ u obitelji □ u obitelji □ preko prijatelja □ preko prijatelja □ na drugi način, koji? ____________ □ na drugi način, koji?___________
34. Kako najčešće provodiš svoje slobodno vrijeme? (Molimo te da obilježišnajviše tri odgovora)
□ nemam slobodnog vremena □ pretražujem po Internetu□ bavim se sportom □ slušam glazbu□ spavam □ pomažem roditeljima u kući□ ne radim baš ništa □ aktivno provodim vrijeme u□ družim se s prijateljima prirodi (veslam, planinarim, □ igram video/kompjuterske igre lovim ribu itd.)□ izlazim noću u disko-klubove i sl.□ gledam TV□ nešto drugo, što? _________________
35. Što misliš o načinu na koji provodiš svoje slobodno vreme?
□ vrlo sam zadovoljan/na □ zadovoljan/na sam □ nisam zadovoljan/na □ vrlo sam nezadovoljan/na
36. Dolje navedene tvrdnje odnose se na stavove koje osoba može imati o sebi.Uz svaku tvrdnju označi slaže li se ona ili ne slaže s onim što ti misliš o sebi.(Molimo te da zaokružiš samo po jedan križić u svakom redu.)
Slažem se Ne slažem se
U cjelini sam zadovoljan/na sobom. x xPonekad mislim da ništa ne vrijedim. x xMislim da imam neke dobre osobine. x xMislim da sam sposoban/na koliko i drugi. x xMislim da se nemam čime ponositi. x xPonekad se osjećam beskorisnim/om. x xVjerujem u sebe. x xVolio/la bih da imam više samopoštovanja. x xSve u svemu, često mislim da sam gubitnik/ca. x xImam pozitivan stav o sebi. x xMislim da me ljudi uglavnom vole. x x

123
37. Koliko često dolje navedene tvrdnje važe za tebe? (Molimo te da zaokružišsamo po jedan križić u svakom redu.)
Skorouvijek
Ponekad Skoronikada
Moji roditelji mi pružaju toplinu i pažnju. x x xMoji roditelji mi daju podršku. x x xMoji roditelji su spremni novčano mi pomagati. x x xMoji prijatelji mi pružaju podršku. x x xZabrinut/a sam za svoju budućnost. x x xZabrinut/a sam za budućnost svojih prijatelja. x x xMoji roditelji/rođaci mi određuju pravila ponašanja. x x xMoji roditelji/rođaci znaju gde i s kim izlazim na večer. x x xMoji roditelji/rođaci su zabrinuti za moju budućnost. x x x
38. (Na ovo pitanje odgovaraju SAMO UČENICI I STUDENTI) Koliko često dolje navedene tvrdnje važe za tebe? (Molimo te da zaokružiš samo po jedan križiću svakom redu.)
Skorouvijek
Ponekad Skoronikada
Moji roditelji/rođaci se interesiraju za moj uspeh u školi (nafakultetu).
x x x
Moji roditelji/rođaci znaju moje stanje u školi (na fakultetu). x x xMoji roditelji/rođaci su zabrinuti za moje stanje u školi (nafakultetu).
x x x
Moji nastavnici u školi (na fakultetu) su mi spremni pomoći. x x xMoji nastavnici u školi (na fakultetu) mi pružaju podršku. x x x
39. Koji su po tvom mišljenju najveći problemi mladih danas u našem društvu? (Molimo te da obilježiš najviše tri odgovora.)
□ prevelika okupiranost zabavom i potrošnjom □ nizak životni standard
□ nedostatak interesa za društvena i politička zbivanja □ nedostatak životne perspektive
□ društveno neprihvatljivo ponašanje (narkomanija, alkoholizam, nasilje itd.)
□ nekvalitetno obrazovanje □ nedovoljna uključenost mladih u društvene poslove
□ važnost "veza", a ne sposobnosti i stručnosti□ masovni odlazak mladih stručnjaka u druge zemlje □ nezaposlenost□ vladavina "staraca"
□ nedovoljna briga društva za mlade□ nešto drugo, što? _______________________________________

124
40. Tko je po tvom mišljenju odgovoran za rešavanje problema mladih u našem društvu? (Molimo te da obilježiš najviše tri odgovora.)
□ roditelji□ nevladine udruge□ organizacije mladih□ vlada
□ mediji □ škola (fakultet)
□ svaka mlada osoba za sebe □ vjerske ustanove
□ netko drugi, tko? __________________________________
41. Što bi po tvom mišljenju trebalo učiniti da se problemi mladih kod naspočnu djelotvornije rješavati ? (Molimo te da obilježiš najviše tri odgovora.)
□ osigurati sudjelovanje mladih u procesu odlučivanja na svim razinama □ zakonom ograničiti i nadzirati sastajališta mladih (disco klubove i sl.) □ osigurati jednake šanse u obrazovanju i zapošljavanju za sve□ uvesti stroge kazne za dilere droge i ograničiti prodaju alkohola □ osnovati posebno ministarstvo za mlade□ izraditi nacionalnu strategiju za promicanje dobrobiti mladih□ osnovati posebne fondove za inicijative mladih u različitim sektorima □ srednje i visoko obrazovanje prilagoditi novim životnim potrebama□ nešto drugo, što? ______________________________________________
42. Koliko je za tebe važna svaka od dolje navedenih vrijednosti? (Molimo te daza svaku vrijednost uneseš po jedan križić u odgovarajuće polje.)
PAZI: 5 znači vrlo važna, a 1 potpuno nevažna.
5 4 3 2 1društvena moćdemokratski sustavEkonomska sigurnostnacionalni osjećajprava i slobode pojedinca zaštita manjinapoštivanje različitosti (pluralizam)visok materijalni standardvladavina prava (pravna država)europska integracijanepovredivost vlasništvaVjerasolidarnost među ljudimaravnopravnost muškarca i ženemir u svijetuslobodno tržištesocijalna Pravdacivilno društvoSloboda medijazdrav okoliš

125
43. Koliko je po tvom mišljenju svaki od dolje navedenih čimbenika važan zanapredovanje pojedinca u našem društvu? (Molimo te da za svaki čimbenikuneseš križić u odgovarajuće polje.)
PAZI: 5 znači vrlo važno, a 1 potpuno nevažno.
5 4 3 2 1zalaganje u raduveze i poznanstvaznanje i sposobnosti nacionalna pripadnost puka srećapodmićivanje osoba na visokim položajima
fakultetska diplomaNovac, imetakSudbinačlanstvo u vladajućoj stranci snalažljivostposlušnost i pokornost "šefu"
44. Ako sebe pokušaš zamisliti za 10 godina – kako se vidiš? (Molimo te da napišeš barem dvije-tri rečenice.)
_____________________________________________________________________
_____________________________________________________________________
_____________________________________________________________________
_____________________________________________________________________
_____________________________________________________________________
_____________________________________________________________________
_____________________________________________________________________
45. Ako smo propustili neko pitanje koje ti se čini važnim, molimo te da ganavedeš i na njega odgovoriš u dvije-tri rečenice.
_____________________________________________________________________
_____________________________________________________________________
_____________________________________________________________________
_____________________________________________________________________
_____________________________________________________________________

126
_____________________________________________________________________
_____________________________________________________________________
Hvala ti na suradnji!