properties of copper species stabilized in zeolite
TRANSCRIPT

HAL Id: tel-01661295https://tel.archives-ouvertes.fr/tel-01661295
Submitted on 11 Dec 2017
HAL is a multi-disciplinary open accessarchive for the deposit and dissemination of sci-entific research documents, whether they are pub-lished or not. The documents may come fromteaching and research institutions in France orabroad, or from public or private research centers.
L’archive ouverte pluridisciplinaire HAL, estdestinée au dépôt et à la diffusion de documentsscientifiques de niveau recherche, publiés ou non,émanant des établissements d’enseignement et derecherche français ou étrangers, des laboratoirespublics ou privés.
Properties of copper species stabilized in zeolitenanocrystals
Anastasia Kharchenko
To cite this version:Anastasia Kharchenko. Properties of copper species stabilized in zeolite nanocrystals. Organic chem-istry. Normandie Université, 2017. English. �NNT : 2017NORMC220�. �tel-01661295�

THESE
Pour obtenir le diplôme de doctorat
Spécialité : Chimie
Préparée au sein de l’ENSICAEN et de l’UNICAEN
Properties of copper species stabilized in zeolite nanocrystals
Présentée et soutenue par
Anastasia KHARCHENKO
Thèse dirigée par Svetlana Mintova et Vincent DE WAELE, Laboratoire Catalyse et Spectrochimie
Thèse soutenue publiquement le 06/06/2017
devant le jury composé de
Madame Tsvetanka BABEVA
Professeur, Institute of Optical Materials
and Technologies ‘‘Acad. J. Malinowski’’,
Bulgarian Academy of Sciences, Sofia,
Bulgaria
Rapporteur
Madam Tina M. NENOFF Senior scientist, Sandia National
Laboratories, Albuquerque, USA Rapporteur
Monsieur Marco DATURI Professeur, ENSICAEN, Caen, France Examinateur
Madame Svetlana MINTOVA DR1, CNRS, LCS ENSICAEN, Caen,
France Directeur de thèse
Monsieur Vincent DE WAELE CR1, CNRS, LASIR, Lille, France Codirecteur de thèse


i
To my Family

ii

iii
Acknowledgements
First and foremost, I would like to express my deepest gratitude to my research supervisors Dr.
Svetlana Mintova and Dr. Vincent De Waele for the great opportunity to do my PhD research
and for their scientific guidance. I would like to acknowledge the financial support from ANR
TAR-G-ED project.
Next, I would like to acknowledge Dr. Vladimir Zholobenko for many interesting, stimulating,
motivating and fruitful discussions. I am truly grateful to him for all his help, time and an extra-
ordinary will to share his knowledge and experience with people. I am also grateful to Prof.
Marco Daturi, Dr. Olivier Marie, Dr. Guillaume Clet, Dr. Aurélie Vicente, Dr. Mohamad El
Roz for having an opportunity to work with them and learn from them, for their time, guidance
and helpful discussions, and for their constant support and motivation. I would like to thank
Dr. Fredéric Thibault-Starzyk for welcoming me in LCS, Prof. Christian Fernandez, Prof.
Pierre Gilson, Dr. Sébastien Thomas, Dr. Hervé Vesin, Dr. Tzonka Mineva and Dr. Olivier
Poizat for their cooperation, advices, and interest in the present work.
Further, I am sincerely thankful to the members of the jury of my thesis, Prof. Tsvetanka
Babeva, Dr. Tina M. Nenoff and Prof. Marco Daturi for accepting the manuscript and providing
their suggestions for further improvements of my work.
I would like to thank all LCS and LASIR members for their help and support during my stay.
I would like to express my gratitude to Dr. Philippe Bazin, Dr. Jaafar El Fallah, Mme. Valérie
Ruaux, Mr. Yoann Levaque, Mr. Sébastien Aiello, Mr. Benjamin Foucault, Mr. Pascal Roland,
Mme. Marie Desmurs and Dr. Isabelle De Waele for their support and constant help on the
technical part of the experiments. I would also like to thank Mme. Nathalie Perrier, Mme

iv
Nathalie Maillot, Mme Blandin Rabelle and Mme Sophie Greard who helped me with the
administration work.
I want to express my gratitude to all my friends, that I have met for the past three years and my
friends from Moscow, and there are not enough words and not enough pages to say how
thankful I am. But I would like to acknowledge several people whose presence made my life
special, they are Olga Bulgakova, Aleksey Bolshakov, Mattéo Brykaert, Roman Gritsenko,
Roman Belykh, Igor and Anna Telegeiev, Moussa and Sarah Zaarour, Veselina Georgieva, Ana
Palčić, Lukasz Kubiak, Małgorzata Łukarska, Silvia Pompa, Eddy Dib, Shashikant Kadam, Nancy
Artioli, Elilzabeth Dominguez Garcia, Sandra Palma del Valle, Julien Grand, Aleksandr Shiskin,
Sergei Balashov and Ekaterina Blokhina.
Finally, I would like to express my deepest gratitude to my family for their support, faith, and
confidence in me. I thank with all my heart my beloved Dušan for being with me, sharing joys
and sorrows, for his patience and love.

v

vi

vii
Résumé
Il est connu que le progrès social à long terme et la croissance économique, mais aussi la
sécurité et la pérennité écologique, nécessitent des alternatives aux carburants et produits
chimiques à base de pétrole. Parmi les sources d'énergies renouvelables, la plus abondante est
de loin le soleil. Son utilisation pour la production d'énergie requiert une méthode de captage
et de stockage.
Le développement des nouveaux matériaux performants ne peut pas être considéré seulement
par rapport aux performances des matériaux récemment synthétisés. Donc, de nouvelles
méthodes pour la préparation de matériaux de taille nanométrique doivent être développées
tout en tenant compte des préoccupations économiques et environnementales mondiales. Ainsi,
avec ces idées en tête, le défi de ce travail a été de préparer des nanomatériaux de zéolithe
contenant du métal tout en étant fortement actifs, sélectifs, stables, robustes et peu coûteux. Le
cuivre a été choisi, en tant que métal non-noble abondant, de par sa haute conductivité, ses
propriétés catalytiques et son faible coût. Les zéolithes contenant du cuivre suscitent un vif
intérêt de par le prix faible du cuivre et son excellente activité catalytique pour une vaste
gamme de réactions, y compris la réduction catalytique sélective de NO, la synthèse et la
décomposition du méthanol et d’autres alcools supérieurs, etc. Dans ce travail, des zéolithes de
tailles nanométriques ont été utilisées comme hôte pour le cuivre de par leur haute capacité
d’échange ionique, grande surface, un système de pores et une topologie réguliers donnant des
emplacements définis pour le cuivre. La performance de ces matériaux dans les applications
mentionnées ci-dessus dépend de l'emplacement, la coordinence, la réactivité et la mobilité du
cuivre dans la charpente zéolithique.

viii
Les objectifs principaux de ce travail étaient d'étudier la nature des composés de cuivre formés
dans les nano-zéolithes en utilisant deux approches: (i) incorporation directe du Cu via une
synthèse mono pot et (ii) incorporation post-synthèse du Cu suivi par une réduction chimique.
Une étude détaillée de l'évolution des espèces de cuivre dans la suspension de nano-zéolithe
LTL réduite avec de l'hydrazine a révélé la formation de nanoparticules de cuivre avec des
dimensions limitées par la taille de canaux et des cages de la zéolithe. Cependant, avec un
temps de réduction prolongé, les NPs de Cu ont tendance à migrer vers la surface de la zéolithe
en raison de leur forte mobilité dans les milieux aqueux, et donne lieu à de grosses particules
de cuivre, tout en conservant la structure de la zéolithe.
La réduction du cuivre donne lieu à un système complexe contenant différentes espèces de
cuivre: des résidus de Cu2+, Cu+ et des NPs de Cu. Les études par spectroscopie IRTF montrent
l'hétérogénéité des cations Cu 2+ et Cu + dans la zéolithe Cu-LTL préparée par échange ionique.
Il a été prouvé, que l'état et le comportement du cuivre dans la zéolithe LTL dépendent
fortement de la méthode utilisée pour l'incorporation du Cu, soit par échange ionique, soit par
incorporation directe du Cu. Il est devenu évident que le cuivre ajouté au mélange de synthèse
possède un environnement distinct et occupe une position différente quand il est comparé à
celui de l’échange ionique. Il est vraisemblablement partiellement localisé dans la charpente
zéolithique ou /caché dans la structure et est inaccessible pour les molécules adsorbées. De
plus, les modifications post-synthèse du matériau obtenu par synthèse directe entrainent un
déplacement vers des positions hors structure d’un nombre important de Cu.
De plus, les films minces de zéolithes contenant du métal avec des épaisseurs différentes ont
été obtenue par un procédé de revêtement par centrifugation de supports de silicium et/ou des
supports optiques CaF 2. Ce dernier a été utilisé pour la détection de CO en faible concentration
à température ambiante et l’étude de la réponse optique ultrarapide du matériau photo-excité
en résonance avec la bande du plasmon des NPs métalliques.

ix
En résume, ce travail couvre entièrement toutes les étapes de la synthèse, la modification, la
caractérisation complète et l’utilisation de nano-cristaux de zéolithe contenant du métal. La
combinaison des propriétés uniques des nanoparticules de cuivre et de la polyvalence des nano-
zéolites donne lieu à des matériaux avancées intéressants pour de nombreuses d'applications
dans des dispositifs de taille nanométrique, la détection sélective de produit chimique, la
catalyse, etc...

x
Abstract
It is well recognized that long term social progress and economic growth, as well as security
and environmental sustainability, require alternatives to petroleum-based fuels and chemicals.
Between the various renewable energy sources, by far the largest resource is provided by the
sun. The use of solar energy for energy production requires a capture and storage process.
The development of the new effective materials cannot be only considered based on the
efficiency of the lately synthesized materials. Therefore, new methods for preparation of
nanosized materials must be developed considering the global economic and environmental
concerns. Thus, in the scope of this work the challenge was to prepare metal-containing zeolite
nanomaterials that are highly active, selective, stable, robust, and inexpensive. Copper is
chosen as an abundant non-noble metal because of its high conductivity, catalytic properties,
and low cost. Copper containing zeolites are of great interest due to the low cost of copper and
its excellent catalytic activity in a wide range of reactions, including selective catalytic
reduction of NO, synthesis and decomposition of methanol and higher alcohols, etc. In this
work, nanosized zeolites have been utilized as a host for copper owing to their high ion
exchange capacity, large surface area, regular pore systems and topology giving defined
locations for copper species. The performance of these materials in the above applications
depends on the location, coordination state, reactivity, and mobility of copper species in the
zeolite frameworks.
The thesis consists of the five main chapters, literature overview, methods and conclusions. In
the introduction the general information about zeolites, nanosized zeolites, their properties,
preparation and applications, as well as preparation of metal nanoparticles, in particular,
copper, methods of reduction of metal precursors and stabilization are emphasized. The

xi
importance of developing new material, such as zeolite nanocrystals functionalized with copper
nanoparticles, for advanced applications are shown.
The methodical part includes the detailed description of materials preparation: LTL type zeolite
synthesis, introduction of copper by ion exchange, reduction of copper species, assembly of
copper containing zeolites suspensions in thin films and direct incorporation of copper in the
zeolite structure. A brief description of all characterization technics used (XRD, SEM, TEM,
DLS, N2 sorption/desorption, TG, ICP-OES, EDX, XPS, NMR, EPR, in situ IR, UV-vis,
Raman, Operando, nano indentation) is given in the chapter, as well.
The first chapter entitled “Metal copper nanoparticles in LTL nanosized zeolite: kinetic study”
addresses the detailed analysis of preparation of copper nanoparticles with desired properties.
The inclusion of copper NPs in the nanosized zeolite matrix is a promising route for the
development of advanced materials with improved diffusion within the host combined with
chemical reactivity of metal NPs. Copper was introduced to the zeolite host by ion exchange
post synthesis method. The results showed the entire preservation of zeolite host after the ion
exchange process. Chemical analysis and EDX results showed partial substitution of potassium
by Cu (amount of copper was found to be in 1-1.5 wt.%). In addition, it was shown that copper
was homogeneously distributed along the zeolite matrix. Stable aqueous suspension of copper
exchanged LTL nanozeolite was further reacted by three reducing agents, hydrazine
monohydrate, triethylamine and sodium borohydride. With triethylamine no reduction of
copper occurred. When NaBH4 was used there was a rapid reduction leading to formation of
big nanoparticles outside the LTL structure, whereas reaction with hydrazine led to slower
formation of stable and small nanoparticles. Hence, the system Cu2+-LTL/hydrazine was used
for further studies. This made possible the investigation of evolution of copper nanoparticles
with UV-Vis spectroscopy and TEM technique. The results showed that after 290 minutes of
reduction the yield of Cu0 species is about 50% and copper nano particles are stable and well

xii
dispersed all over the host matrix with a narrow size distribution from 0.4 – 2.2 nm. While
longer reduction leads to the migration of copper towards surface of the hostage with the
following growth of large copper particles.
The second chapter entitled “Metal copper nanoparticles in LTL nanosized zeolite:
spectroscopic study” is dedicated to the nature and the amount of the copper species introduced
in the zeolite framework and their quantification by set of spectroscopic techniques. In order
to identify the nature of copper species and to describe their local environment, the samples
were examined by means of X-ray diffraction (XRD), 29Si and 63Cu solid state nuclear magnetic
resonance (NMR), X-ray photoelectron spectroscopy (XPS), UV-vis spectroscopy, Electron
Paramagnetic Resonance (EPR) and high resolution transmission electron microscopy
(HRTEM) together with EDX mapping. In addition, to probe the acidity of copper-containing
zeolites, temperature programmed desorption of pyridine followed by infrared spectroscopy
has been performed. Complementary characterization of Cu-LTL zeolites was also carried out
using TEM, N2 adsorption, DLS and chemical analysis. The investigation of the nature of the
copper species proved to be a difficult task that demands multi technique approach. However,
it was demonstrated that copper in the final material is present mainly in the Cu0, Cu+ oxidation
state and there are reseals of Cu2+ species.
In the third chapter “Cu species introduced in nanosized LTL zeolites by in-situ and ion-
exchange approaches” the synthesis of a new material is presented, where copper was
introduced into a zeolite structure. The incorporation of copper in the zeolite structures with
LTL topology has been proved by combination of various technics. X-ray diffraction (XRD)
and the Pawley fit of the obtained patterns allowed seeing the changes in the unit cell parameters
of the new material in comparison to the parent LTL zeolite. Different sites were probe by
Fourier transformed infrared spectroscopy (FTIR) of adsorbed probe molecules (CO, NO), and
it was shown that in the sample prepared by direct incorporation of copper, only carbonils and
xiii
nitrosils of K+ were formed. X-ray photoelectron spectroscopy (XPS), 29Si magic angle
spinning nuclear magnetic resonance (MAS-NMR) and Electron Paramagnetic Resonance
(EPR) allowed determination of the oxidation state and coordination of copper species
presented in the zeolite structures. The size of zeolite nanocrystals and copper distribution along
the particles were confirmed by high-resolution transmission electron microscopy (HRTEM)
combined with EDX mapping. In addition, to probe the acidity of copper-containing zeolites,
temperature programmed desorption of pyridine followed by infrared spectroscopy has been
performed. The results showed that copper could be partially situated in the structure of the
zeolite, however such kind of structure is not stable, and copper tends to leave its position during
multi-step post-synthesis treatments, such as ion exchange with ammonium chlorate and
calcination.
In the fourth chapter entitled the preparation on various substrates and mechanical properties,
such as thickness and roughness, of copper containing zeolite thin films are discussed. Zeolite
thin films were used for detection of low concentration of CO at RT. By using Operando IR
set-up, it was observed, that Cu-LTL show films high sensitivity and fast response toward low
concentrations of CO (1-100 ppm).
The fifth chapter deals with LTL nanosized zeolites used as a host for nm-sized silver NPs. the
potential of this material for hot-electrons driven chemistry applications is explored. This issue
is addressed by using UV-vis transient absorption spectroscopy, which proved to be a method
of choice to characterize the hot-electrons dynamics, and their coupling with the surrounding
media. The plasmonic response of silver nanoparticles (Ag NPs) in LTL-type zeolite films
under vacuum atmosphere has been investigated. The preparation of Ag NPs in the nanosized
LTL- type zeolites, followed by the preparation of the transparent films, and testing of their
compatibility with the requirements of the transient absorption spectroscopy are presented. The
ultrafast plasmonic response of these materials is reported.

xiv
In conclusion, the combination of unique properties of copper nanoparticles with versatility of
nanozeolites give rise to the development of advanced materials which are interesting for many
applications in nanoscale devices, selective chemical sensing, catalysis etc.

xv

xvi

xvii
Table of contents
Literature overview ................................................................................................................. 1
Introduction ............................................................................................................................ 1
General information about zeolites ........................................................................................ 3
Basic principles of zeolite synthesis....................................................................................... 7
Zeolites synthesized by using heteroatom substitution .......................................................... 8
Nanosized zeolites .................................................................................................................. 9
Metal nanoparticles .............................................................................................................. 12
Supported copper nanoparticles ........................................................................................... 15
Growth mechanism of copper nanoparticles ........................................................................ 19
a. LaMer Mechanism .................................................................................................... 19
b. Ostwald Ripening and Digestive Ripening ............................................................... 19
c. The Finke – Watzky two step mechanism ................................................................ 20
d. Coalescence and Orientated Attachment................................................................... 20
Goals..................................................................................................................................... 20
References ............................................................................................................................ 22
Preparation and characterization of metal-containing zeolite crystals ............................ 28
Synthesis and post synthesis modification of zeolites ......................................................... 28
Preparation of pure and copper-containing nanosized LTL zeolite ................................. 28
Reduction of copper cations in zeolite suspensions ......................................................... 29
One-pot synthesis of copper-containing LTL nanocrystals .............................................. 30
Preparation of zeolite thin films via spin-coating approach ............................................. 31
Characterization of zeolite suspensions, powders and films ................................................ 32
X-Ray Diffraction (XRD) ................................................................................................. 32
Nitrogen adsorption .......................................................................................................... 34
Thermogravimetric analysis ............................................................................................. 35
Dynamic light scattering ................................................................................................... 36
Elemental analysis ............................................................................................................ 36
Electron microscopy ......................................................................................................... 37
a. Scanning electron microscopy .................................................................................. 38
b. Transmission electron microscopy ............................................................................ 39
X-ray photoelectron spectroscopy (XPS) ......................................................................... 40

xviii
Solid-state nuclear magnetic resonance (MAS NMR) spectroscopy ............................... 41
UV-visible spectroscopy................................................................................................... 43
Electron paramagnetic resonance (EPR) .......................................................................... 44
Fourier transformed infrared spectroscopy (FTIR) .......................................................... 44
a. In situ FTIR spectroscopy ......................................................................................... 45
b. Operando reflection FTIR spectroscopy ................................................................... 47
References ............................................................................................................................ 49
Chapter 1 ................................................................................................................................ 55
Formation of copper nanoparticles in LTL nanosized zeolite: kinetic study ................... 55
Introduction .......................................................................................................................... 55
Experimental ........................................................................................................................ 57
Materials ........................................................................................................................... 57
Preparation of copper containing LTL-type zeolite nanocrystals .................................... 57
Chemical reduction of copper cations in zeolite suspensions .......................................... 58
Characterization ................................................................................................................... 58
Results and discussion .......................................................................................................... 60
Preparation and characterization of nanosized zeolite crystals ........................................ 60
Kinetics of formation of Cu nanoparticles in LTL zeolite suspensions via chemical reduction ........................................................................................................................... 65
Conclusions .......................................................................................................................... 79
References ............................................................................................................................ 81
Chapter 2 ................................................................................................................................ 84
Formation of copper nanoparticles in LTL nanosized zeolite: spectroscopic characterization...................................................................................................................... 84
Introduction .......................................................................................................................... 84
Experimental ........................................................................................................................ 86
Results and discussion .......................................................................................................... 88
FTIR spectroscopy ............................................................................................................ 88
CO adsorption on copper-LTL samples followed by FTIR spectroscopy ........................ 89
NO adsorption on copper-LTL samples followed by FTIR spectroscopy ....................... 99
UV-Vis characterization of copper containing zeolite samples ..................................... 102
EPR characterization of copper containing zeolites ....................................................... 103
29Si and 63Cu MAS NMR characterization of copper containing zeolites ..................... 104
Conclusions ........................................................................................................................ 107

xix
References .......................................................................................................................... 108
Chapter 3 .............................................................................................................................. 110
Cu species introduced in nanosized LTL zeolites by in-situ and ion-exchange approaches ............................................................................................................................ 110
Introduction ........................................................................................................................ 110
Experimental ...................................................................................................................... 110
Materials ......................................................................................................................... 110
In-situ synthesis of copper-containing LTL zeolite nanocrystals ................................... 111
Ion-exchanged copper-containing LTL zeolite nanocrystals ......................................... 112
Characterization ................................................................................................................. 112
Results and discussion ........................................................................................................ 114
Adsorption of CO probe molecule on copper containing samples study by FTIR spectroscopy ................................................................................................................... 125
Adsorption of NO probe molecule on copper containing samples study by FTIR spectroscopy ................................................................................................................... 128
Hydroxyl Region in the IR spectra of copper containing zeolite samples ..................... 132
Pyridine Adsorption on copper containing zeolite samples ........................................... 133
Conclusions ........................................................................................................................ 134
References .......................................................................................................................... 135
Chapter 4 .............................................................................................................................. 137
Copper containing LTL films for sensor application ....................................................... 137
Introduction ........................................................................................................................ 137
Experimental ...................................................................................................................... 138
Materials ......................................................................................................................... 138
Preparation of Cu-LTL thin films ................................................................................... 138
Characterization ................................................................................................................. 139
Results and discussion ........................................................................................................ 139
Detection of carbon monoxide ........................................................................................... 147
Conclusions ........................................................................................................................ 149
References .......................................................................................................................... 151
Chapter 5 .............................................................................................................................. 152
The plasmonic chemistry of silver containing nanosized zeolite film revealed by transient absorption spectroscopy ...................................................................................... 152
Introduction ........................................................................................................................ 152
Experimental ...................................................................................................................... 154

xx
Synthesis and characterization of silver-containing LTL zeolite crystals ...................... 154
Preparation and characterization of silver-containing LTL zeolite films ....................... 156
FTIR measurements of silver-containing LTL zeolite films .......................................... 157
Femtosecond transient absorption measurements of silver-containing LTL zeolite films ........................................................................................................................................ 157
Broadband UV-vis transient absorption set-up .............................................................. 158
Optical cell ...................................................................................................................... 158
Results and discussion ........................................................................................................ 159
Preparation of LTL zeolite crystals containing silver nanoparticles .............................. 159
Preparation and characterization of transparent silver-containing LTL zeolite films on CaF2 ................................................................................................................................ 160
Hot electrons photodynamics in AgLTL films ............................................................... 162
Conclusions ........................................................................................................................ 169
References .......................................................................................................................... 171
Appendix ............................................................................................................................ 173
Film thickness determination by FTIR spectroimaging ................................................. 173
Complementary fits by the TTM model ......................................................................... 174
General Conclusions ............................................................................................................ 176

1
Literature overview
Introduction
It is well recognized that long term social progress and economic growth, as well as security
and environmental sustainability, require alternatives to petroleum-based fuels and chemicals.
The consumption of fossil fuels at the actual rate produce a potentially significant global issue
resulting from the CO2 emission. Actual average CO2 concentration is around 410 ppm (April
2017 from www.co2now.org), whereas climate model predicts more or less moderated global
response starting from an average CO2 concentration equal to 550 ppm. To keep the CO2 level
below 550 ppm, the projected carbon intensity in 2050 is about 0.45 kg of C yr−1 W−1, which
is lower than that of any of the fossil fuels. The only way one can reach this value is through a
significant contribution of carbon-free power to the total energy mix. There are three main
routes for carbon-neutral power: (1) nuclear fission, (2) CO2 capture and storage, and (3) use
of renewable energy. Between the various renewable energy sources, by far the largest resource
is provided by the sun. The large gap between our present use of solar energy and its enormous
undeveloped potential defines a compelling imperative for science and technology in the 21st
century.
In this context, energy efficiency also is identified as a targeted objective to support the
development of alternative energy sources as well as to elaborate sustainable chemistry
strategies. Hence, the energy requirements of the chemical processes should be recognized for
their environmental and economic impacts and have to be minimized. Preferentially, synthetic
methods should be conducted at ambient temperature and pressure, for less hazard, more
selectivity, biocompatibility, etc. To fulfill these requirements a global strategy should be
undertaken, including: better selectivity of the reaction schemes, more efficient catalysts,

2
reactor size reduction, and selective deposition of the energy (in opposition to the usual global
heating practice).
The use of solar energy for energy production requires a capture and storage process. The
processes for the solar energy conversion are developed following photovoltaic or
photothermal approaches. The photothermal strategy in principle is very simple and based on
the absorption of the solar energy by materials to generate heat. The heat can be stored
thermodynamically in fluids or materials as energy source for electrical power-plants or
converted into chemical energy in the form of solar fuels (solar-to-chemical energy
conversion). The key concepts of the solar thermochemical conversion technology are well
established.1,2
Besides, alternative thermochemical routes must also be explored to perform solar-to chemical
energy conversion under mild conditions, compatible with small-sized local and transportable
reactors, and allowing for the exploitation of the water splitting reaction, the ultimate renewable
and sustainable energy source. Toward this end, a promising route is the so-called “smart
chemistry” that targets the size-reduction concept via the development of nanoreactors and
their integration as elementary building units in macroscopic assemblages.
Ultimately, a nanoreactor is a device in which thermodynamics and chemistry are operated at
the space scale of the molecular bonds and at the time scale of the molecular motions.
Combining such a nanoreactor methodology with a procedure allowing for the local deposition
of thermal energy close to the reaction center is expected to be of great importance and need
for (i) saving energy and (ii) improving the reaction yield and selectivity by limiting side
reactions in confined space (concomitant channels).
The development of the new effective materials cannot be only considered based on the
efficiency of the lately synthesized materials. Therefore, new methods for preparation of

3
nanosized materials must be developed considering the global economic and environmental
concerns.
Thus, in the scope of this work the challenge was to prepare metal-containing zeolite
nanomaterials that are highly active, selective, stable, robust, and inexpensive. Copper is
chosen as an abundant non-noble metal because of its high conductivity, catalytic properties
and much lower cost than for instance gold, silver and rhodium.
Copper, a 3d transition metal, is among the 25 most abundant elements in the earth’s crust,
occurring at an average of about 50–100 g ton-1. Copper metal has played an important role in
human technological, industrial, and cultural development since primitive times. Thus, along
with iron and gold, copper was one of the first metals used widely.3 Cu-based materials can
promote and undergo a variety of reactions due to its wide range of accessible oxidation states
(Cu0,CuI,CuII), which enable reactivity via both one- and two-electron pathways. Because of
their unique characteristics and properties, Cu-based nanocatalysts have found many
applications in nanotechnology, including catalytic organic transformations, electrocatalysis,
and photocatalysis.4 One economical way of creating advanced Cu-based nanomaterials for
catalysis is to anchor it on supports such as metal oxides, SiO2, carbon-based materials,
polymers, zeolites.4
General information about zeolites
The discovery of zeolites dates to 1756 when the Swedish mineralogist Axel Fredrik Cronstedt
observed the mineral stilbite emitting steam when being rapidly heated. For this reason the
term zeolite was coined, which is derived from the two Greek words zeo, to boil, and lithos,
stone, and thus can be translated as boiling stone.5
Zeolites are solids with intricate structures that possess channels and cages large enough to
contain extra-framework cations and to permit the uptake and desorption of molecules varying
from hydrogen to complex organics up to 1 nm in size. Their crystalline structure directly

4
controls their properties and consequently their performance in applications such as ion
exchange, separation, and catalysis, and is therefore of great interest to academics and
technologists alike.6
Strictly defined, zeolites are aluminosilicates with tetrahedrally connected framework
structures based on corner-sharing TO4 (basic building unit or BBU, where T besides Si and
Al, can be Ge, Ti, B, Ga, P, etc.) tetrahedral with O atoms connecting neighboring tetrahedra.
For a pure siliceous structure, combination of TO4 (T = Si) units leads to formation of an
uncharged solid. The aliovalent (Al3+ ↔ Si4+) substitution imparts an overall negative charge
to the framework, and requires the presence of extra framework cations (inorganic and organic
cations can satisfy this requirement) within the structure to keep the overall framework
neutral.6–9 These charge-balancing cations are occupying the micropore space and because they
are bonded to the lattice by Coulombic forces, different cations can exchange them. These
compensating cations are introduced primarily during the synthesis of the zeolites and can be
either inorganic, typically alkali metal ions, or organic such as quaternary ammonium ions.10
The zeolite composition can be best described as having three components:
Mm+y/m · [(Si O2)x· (AlO2)y] · zH2O
Extra framework cations Framework Sorbed phase
where M is a cation with the charge m, (x + y) is the number of tetrahedra per crystallographic
unit cell and x/y is the so-called framework silicon/aluminum ratio nSi /nAl (or simply Si/Al).
The extra framework cations are ion exchangeable and give rise to the rich ion-exchange
chemistry of these materials. Typically, in as-synthesized zeolites, water and organic non-
framework cations present during synthesis occupies the internal voids of the material and can
be removed by thermal treatment/oxidation, making the intercrystallite space available.11,12
Typically, Al-O and Si-O bond distances are 1.73 and 1.61 Å, respectively, with OTO angles
(T is the tetrahedral cation) close to the tetrahedral angle, 109.4˚. There is more variation in the

5
SiÔSi bond angles between tetrahedra, where the average angle is 154˚ with a range of 135-
180˚ and a mode of 148˚.8 Variation in TÔT angles enables a wide diversity of frameworks to
exist.13
The amount of Al within the framework can vary over a wide range, with Si/Al = 1 to ∞.
Löwenstein’s rule precludes that two neighboring tetrahedra containing aluminum on
tetrahedral positions, i.e. Al–O–Al linkages, are forbidden due to electrostatic repulsions
between the negative charges. As the Si/Al ratio of the framework increases, the hydrothermal
stability as well as the hydrophobicity increases.12,14
Zeolites are usually classified into three classes, namely
- zeolites with low Si/Al ratios (<5),
- zeolites with medium Si/Al ratios (5 to 10) and
- zeolites with high Si/Al ratios (> 10).15
One of the unique properties of zeolites are (i) their strictly uniform pore diameters and (ii) pore
widths in the order of molecular dimensions. According to IUPAC classification, the materials
can be sort as follows:
microporous: 2.0 �� ≥��, mesoporous: 2.0 �� <��≤50�� and
macroporous: ��≥50��
with dp being the pore diameter.16 Zeolites exhibit the pore size below 2 nm and thus belong to
the group of the microporous materials.6–9
The framework tetrahedra are considered as the primary building blocks, which can be
organized in secondary building units (SBU), containing up to 16 T-atoms. The condition for
considering a finite group of T-atoms as an SBU is that it is present in at least two different
tetrahedral framework topologies. The SBUs include rings with different numbers of
tetrahedral cations (three-rings, four-rings, etc.), double four-rings, D4Rs, (which contain two
6
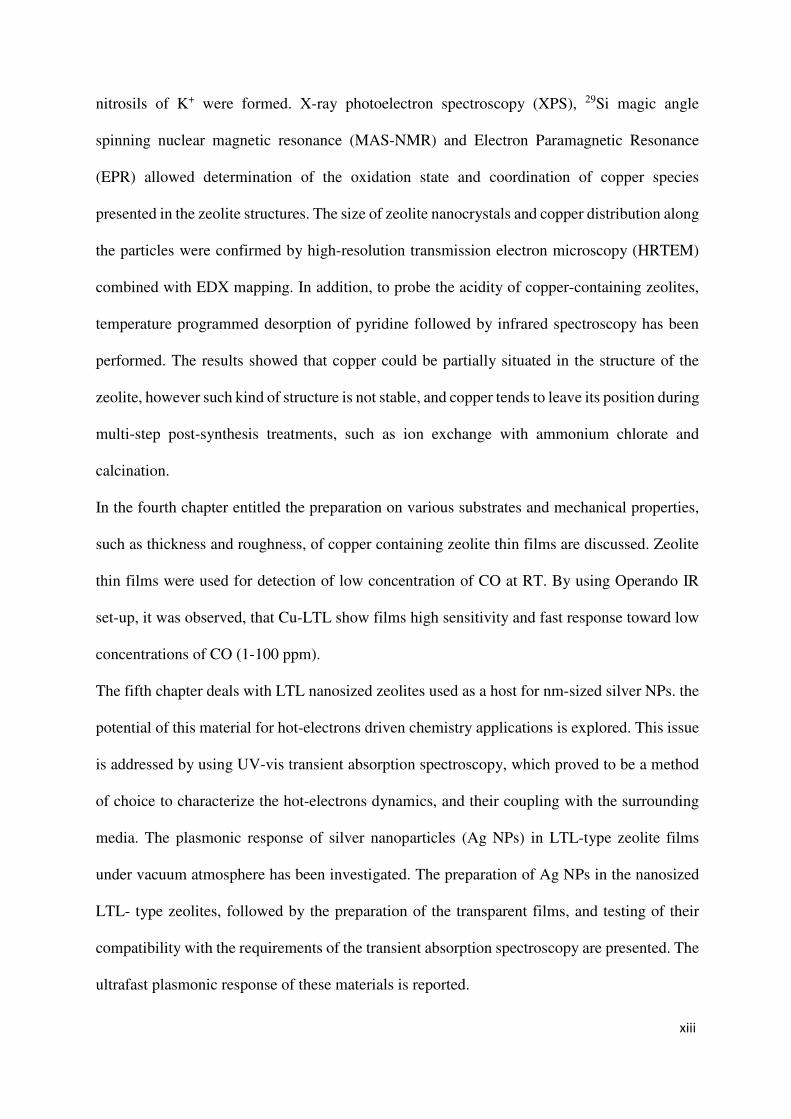
rings of four tetrahedral cations), D6Rs. These SBU are stacked together forming cages or
channels which will finally build up the three-dimensional (3D) structure, characteristic of a
given zeolite. The major part of this work has been performed on LTL-type zeolite; its SBUs
are presented in Figure 1.5,6
Figure 1 Schematic representation of building units (SBU): 4MR, D4R, and cancrinite cage in LTL-type zeolite
Pore openings are characterized by the size of the ring that defines the pore. An 8-ring is
considered to be a small pore opening, a 10-ring a medium one, and a 12-ring a large one, with
free diameters or effective pore widths (calculated using an oxygen radius of 1.35 Å) of ∼4.1,
5.5, and 7.4 Å, respectively.8 The pores will belong to a channel system, which can be mono-
(1D), di-dimensional (2D), or tri- dimensional, and that can be straight, sinusoidal, or follow a
zigzag pattern. The channel system can be independent, or it can be interconnected with a
second channel system.5,13
Following the rules of an IUPAC Commission on Zeolite Nomenclature in 1979, three capital
letters have been used throughout to designate the zeolite structures. The codes are generally
derived from the names of the type material, e.g., FAU from the mineral faujasite, LTA from
Linde Type A, and MFI from ZSM-5 (Zeolite Socony Mobil - five). The most recent Atlas of
Zeolite Framework Types lists about 225 framework structures. However, only a few of those
structure-types are of commercial interest and produced synthetically so far, viz. AEL, AFY,

7
*BEA, CHA, EDI, FAU, FER, GIS, LTA, LTL, MER, MFI, MOR, MTT, MWW, TON, and
RHO.8,17
Basic principles of zeolite synthesis
In general, zeolite materials are synthesized under hydrothermal–solvothermal conditions
(temperatures between 100ºC and 200ºC), and the reaction gel medium contains the framework
atoms, solvents, templates or structure-directing agents (SDAs), and mineralizers.18
Water is generally used as a solvent in zeolite synthesis. The main characteristics of water are
the non-toxicity, low cost, good thermal stability, and conductivity. Also, it helps to the
mineralizing agent to dissolve the species needed for the crystallization, and can act as template
in association with other templating species.7
The role of a mineralizer is to increase the solubility of the silicate or aluminosilicate species,
among others, in the synthesis gel by means of dissolution and precipitation, allowing the
formation of supersaturated solutions.7 The mineralizing agent acts as a catalyst in those
processes, which is consumed during the dissolution of species, and recovered after the zeolite
crystallization.
The OH- is the most extensively used mineralizing agent in the synthesis of zeolites. The
hydroxyl anion increases the solubility of silicon and aluminium sources, directing the
formation of soluble silicate and aluminate anions [Si(OH)4-nOnn-, Al(OH)4
-]. The fluoride
anions can be also used as mineralizing agent to reduce the alkalinity of the synthesis gel, that
helps increasing the stability of OSDA molecules and their degradation by Hoffman
mechanism.19
An alkali-metal hydroxide (NaOH, KOH…) in the synthesis gel leads to the formation of
aluminium-rich zeolites. Large amount of positive charges introduced in the final crystalline
solid by extra-framework small inorganic cations (Na+, K+…) must be balanced by the presence
of large number of aluminium atoms in the framework. In contrast, when an organic structure

8
directing agent (OSDA), such as an amine or a quaternary ammonium salt, is introduced in the
synthesis gel, the Si/Al ratio increases. This happens because bulky organic molecules occupy
the zeolite channels volume providing less positive charges in the final solid, and therefore,
less aluminium atoms in the framework are required.13
Zeolites synthesized by using heteroatom substitution
Until the late seventies, the extra framework species, such as exchangeable cations, have been
the primary focus of researchers. But the discovery of titanium silicalite-1 and its wide catalytic
potential by Taramasso et al.20 already had triggered interest in this area, since it was soon
realized that some rather specific coordination chemistry of lattice titanium ions was
responsible for the unique catalytic properties of this material.21
The introduction of some heteroatoms (except Si, Al, P) in the zeolite framework may generate
special chemical and physical properties. Moreover, heteroatoms have a great influence on the
formation of zeolites. With the low level of substitution new T atoms may not affect the
formation of the zeolite structure, or at higher concentrations, tend to give rise to novel
structures. For example, Ge, B, Ga, Zn, and Be favor the formation of some particular building
units (e.g., 4-rings, 3-rings, R4D, D3R, spiro-5 units, etc.) due to their suitable T–O bond and
T–O–T angles and to their different ionic radii compared to Si4+, that can stabilize these building
units. The initial work of heteroatom substitution is focused on the synthesis of the analogues
of known aluminophosphate or aluminosilicate zeolites but with different properties. In the past
few years, by introducing heteroatoms in the synthesis, many novel zeolites with low-
framework density, extra-large pores, and chiral pores have been synthesized.6,13,18
Silicon will be considered as the principal or key element of the framework. The probability of
isomorphous substitution Si4+ ↔ Men+ and the stability of the Men+ in the tetrahedral oxygen
surrounding can be estimated using the Pauling criterion (ρ). In the simplified version � =�� ��⁄ , where �� is the cation radius and �� is the radius of the oxygen ion. In accordance with
9
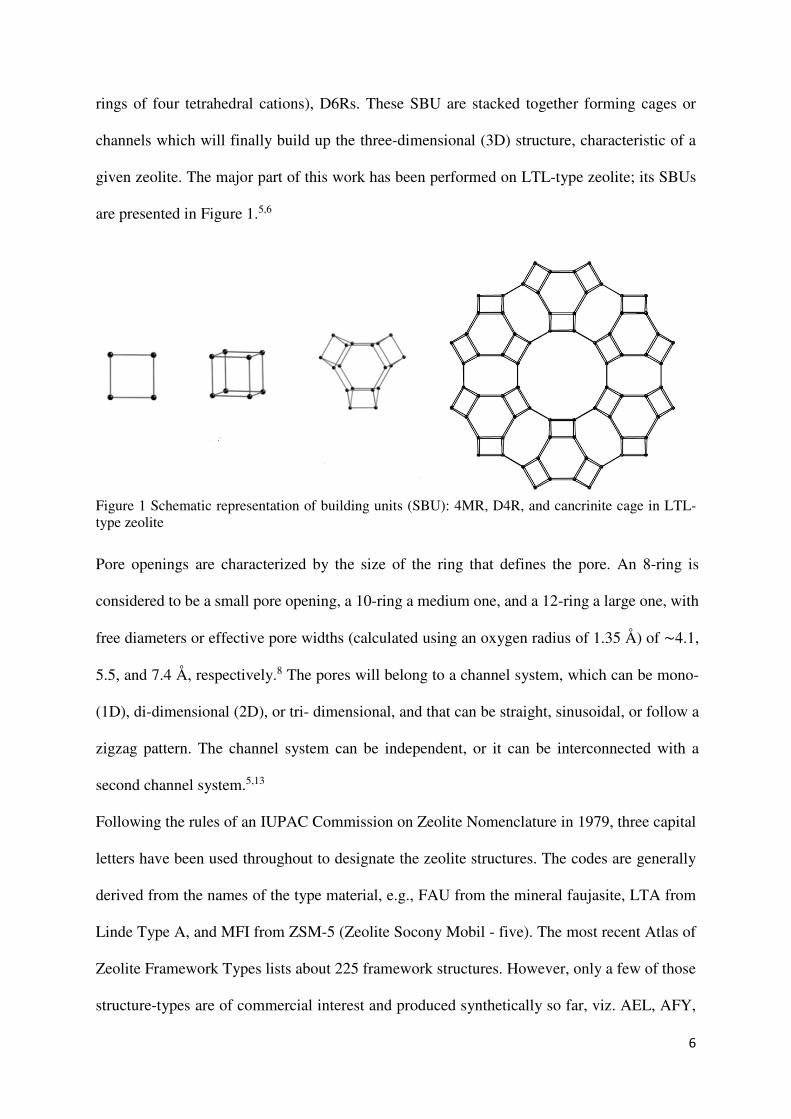
the literature, the tetrahedral surrounding should be stable for cations at 0.414 > ρ > 0.225. This
group of cations includes only few cations (Table 1). However, many cations, such as Fe3+,
Ga3+or B3+, have been proven to participate in the isomorphous substitution, if the
concentration of this cation is low.7,13,22–24
Table 1 Critical values (ρ) and preferred coordination numbers for chosen cations (adapted from [26])
Critical values (ρ) Coordination number Cations with the expected coordination number
0.225 > ρ > 0.147 3 B3+
0.414 > ρ > 0.225 4 Al3+, As5+, Be2+, Cr6+, Ge4+, Mn7+, P5+, Se6+, Si4+
0.732 > ρ > 0.414 6 As3+, Bi5+, Co2+, Cr3+, Cu2+, Fe2+, Fe3+, Ga3+, Hf4+, In3+, Mn2+, Mn4+, Sb5+, Sn4+, Ta5+, Ti3+, Ti4+, V4+, V5+, Zn2+, Zr4+
ρ > 0.732 8 Bi3+, Ce2+, Ce3+, Eu3+, Nd3+, Pb2+, Sn2+, Tl3+
The isomorphous substitution of Si by other tetrahedrally coordinated heteroatoms such as
B3+,25 Ti4+ (TS-1),26–31 Ga3+,32–36 and Fe3+,37–41 and Sn4+ 42–48 in small amounts (up to 2–3 wt.%)
gives rise to new materials with tunable acidity showing specific catalytic properties in
oxidation and hydroxylation reactions related to the coordination state of the heteroatom.49,50
Nanosized zeolites
The driving force for many physical and chemical processes is the difference in the local
environment of atoms exposed to solid surfaces compared to atoms in the bulk. There are two
approaches to increase the number of surface atoms in solids, namely, to decrease the size of
dense particles or to create an open pore network within the bulk of the solid. Both approaches
result in an increase in the specific surface area of materials. The way to combine the two
approaches and to maximize the amount of exposed to the surface atoms is to prepare nanosized
particles containing accessible and uniform nanopores.51 Hence, the zeolites with a size of a
crystal in the range of 5–1000 nm have attracted considerable attention during the last two
decades. The reduction in particle size from micrometers to the nanometer scale leads to

10
substantial changes in their properties and thus different performances even in traditional
applications are expected. The scaling down of zeolite crystals from the micrometer to the
nanometer scale leads to enhanced zeolite properties such as increased surface area and
decreased diffusion path lengths. As the crystal size is decreased below 100 nm, the zeolite
external surface area, which is negligible for micron-sized zeolites, increases drastically,
resulting in zeolites with over 25% of the total surface area on the external surface. If active
sites are incorporated onto the external surface, high surface reactivity results, leading to
zeolites with improved catalytic properties. Another advantage of nanocrystalline zeolites is
the shorter diffusion path length in comparison to micron-sized zeolites. The possibility to
obtain stable colloidal suspensions of microporous particles followed by assembling to
optically transparent thin films on different substrates by rapid techniques is also of great
importance for their advanced applications. The improved properties of nanocrystalline
zeolites for adsorption and intracrystalline diffusion give rise to their application in
environmental catalysis, environmental remediation, decontamination, and drug delivery.52–55
The outstanding properties of zeolites with reduced particle sizes are summarized in Figure 2.
Figure 2 Properties of nanosized zeolites (reprinted from [57])

11
Nevertheless, the considerable decrease of zeolite crystal sizes also poses some negative
consequences. For instance, the framework composition is influenced by the crystallization
under very mild synthesis conditions and the sole use of organic structure directing agents.
Zeolite materials synthesized under such conditions often exhibit a larger number of framework
defects. The substantial decrease of crystalline domains often causes the broadening of the X-
ray diffraction peaks, which is more pronounced in the case of particles smaller than 20 nm.
Much larger external surface area of nanosized zeolites can not only bring some benefits to the
system but also can be disadvantageous, for instance in stereoselective reactions, thus
decreasing zeolite selectivity. The short diffusion path through zeolite channels could also have
both desired and undesired consequences. This improves the kinetics of the reaction and limits
coke formation, but on the other hand zeolite selectivity is corrupted.54,56
The different approaches have been explored to obtain nanosized zeolites, namely confined
space,57 microreactor,58 microwave (MW)59 and ultrasonic radiation synthesis.60 However
conventional hydrothermal crystallization is mostly used. Hydrogels are used as precursors,
but the way of preparation is particular in order to: i) favor the nucleation over the growth and
ii) limit the aggregation between the growing crystals.54
The post-synthesis treatment of the nanosized zeolites differs from one of micron-sized
crystals, since the aggregation among the particles should be avoided. The nonconverted
reactants are usually removed by high-speed centrifugation followed by the redispersion of
zeolite nanoparticles in distilled water. The procedure is repeated several times until the pH of
the resultant suspension is between 7 and 9. At this pH value the negative charge of the zeolite
crystals is high enough to ensure colloidal stability. Freeze drying limits the aggregation
between the crystallites during the drying procedure.54,56
The crystalline nature of the framework ensures the uniformity of the pore openings throughout
the crystal giving rise to a wide range of host–guest chemistry applications such as adsorption

12
and separation,61–63 ion exchange,5,64 catalysis,65,66 and sensor fabrication67 due to their specific
chemical compositions and unique porous structures. However, the potential uses of nanosized
zeolites are going much beyond traditional catalysis, sorption and ion exchanges processes.
These materials are considered in a number of advanced applications, where namely bulk
materials were used.51,52,54–56,68 Recent developments of synthesis procedures for nanosized
zeolites and their arrangements in thin-to-thick films, membranes and hierarchical forms
(Figure 3) have pushed them into new and advanced applications that have not been considered
before, including sensors, optical layers, medicine, pharmaceutical industry, cosmetics and
food.13,51,53,55,68–83
Figure 3 Nanosized zeolite crystals with a diverse morphology and size in colloidal suspensions, self-supported shapes, porous membranes, and optical quality films (reprinted from [56])
Metal nanoparticles
The importance of small metal clusters in catalysis and in many advanced applications
elucidates from the significant physical changes that occur when reducing the size of a material
down to a few nanometers; these systems often display unique nanochemical and nanophysical
properties. As for many heterogeneous catalysts, controlling the nature, location and
accessibility to catalytic sites are keys to ensuring optimal performance of metal‐containing
materials. The most active and selective catalysts, as well as novel optical and electronic
materials, require precise nanoparticle size, geometry, dimensionality and easy accessibility by

13
reactants. Those criteria can be fulfilled during the formation of metal nanoclusters in confined
matrices such as polymers, micro- and mesoporous materials.68,84–93
Nanoparticles prepared from earth-abundant and inexpensive metals have attracted
considerable attention because they are a viable alternative to the rare and expensive noble-
metal catalysts used in many conventional commercial chemical processes.94 These metal NPs
often exhibit activity different from that of the corresponding bulk materials because of their
different sizes and shapes, which give rise to distinctive quantum properties. In this context,
Cu NPs are particularly attractive because of its high natural abundance and low cost and robust
multiple ways of preparing Cu-based nanomaterials.95–98 Despite the strong background on the
applications of bulk Cu in various fields (e.g., optics, electronics, etc.), the use of Cu NPs is
restricted by instability under atmospheric conditions, which makes it prone to oxidation. Many
efforts to develop the methods and supporting materials that increase the stability of Cu NPs
by altering their sensitivity to oxygen, water, and other chemical entities has encouraged the
exploration of alternative host for Cu NPs.4Synthesis of copper nanoparticles
Numerous methods currently have been developed to produce copper nanoparticles.4,97,99
Utrasonic frequencies between 20 kHz and 15 MHz can be used to synthesize various
nanostructures. Sonication promotes chemical reactions via acoustic cavitation, in which
minute bubbles are formed and collapse to generate very high locale temperatures and
pressures. Sonochemical techniques make it possible to prepare nanomaterials under ambient
conditions without the need for high temperatures, high pressures, or extended reaction
times.100–103
Microwave-assisted methods are widely used in organic synthesis due to their efficiency. In
recent years, this method has also been used for preparing nanocrystals with high quality and
narrow size distribution. Microwave irradiation can provide rapid and homogeneous heating,
which is favorable for the synthesis of uniform and monodisperse nanoparticles.104

14
Radiolytic reduction methods is a promising technique to synthesize various metal
nanoparticles due to the simplicity, reproducibility, ambient conditions, and no additional
chemical contamination during the process. In a radiolytic reduction method, solvated
electrons, eaq- are firstly created by exposing aqueous solution to γ-rays. The solvated electrons
than reduce metal ions to metallic clusters. With this method, the size of metal nanoparticles
can be controlled by changing the stabilizer, radiation sources, concentration of precursors,
etc.105,106
A microemulsion is a type of thermodynamically and kinetically stable dispersion containing
two immiscible liquids phases, e.g. oil and water. A microemulsion, with either water dispersed
in oil or oil dispersed in water, provides a special liquid core–shell structure. The dimensions
of the liquid cores are at the nanoscale level and thus can be used as chemical nanoreactors.
Homogeneous metal nanoclusters could be formed and restricted inside the liquid core, and the
particle size can be easily tuned by adjusting the liquid core dimensions of
microemulsions.107,108
Electrochemical synthesis has attracted considerable attention in nanomaterial fabrication
mainly due to its low cost, low- temperature operation, high product purity, simplicity, and
environmental friendliness. In electrochemical syntheses of Cu NPs, a steady current flow is
applied through an electrolytic cell containing an aqueous solution of a Cu salt such as CuSO4.
This causes the electron transfer from the anode to the cathode, where the Cu ions are reduced
to Cu atoms that subsequently agglomerate to form Cu NPs. In addition, it is also possible to
obtain Cu NPs with specific morphologies by performing electrochemical synthesis in the
presence of templates.109–111
“Chemical treatment” stays for the methods in which Cu precursors are treated with external
reagents that lead to copper reduction. Among all methods listed above, chemical reduction is
the most favorable, because of the vast availability of reducing and capping agents, different

15
synthetic environments, and simpler laboratory techniques. It gives particles with various
properties (size, morphology, stability) by tailoring the conditions of the reduction process, the
nature of reducing agent, pH of reaction media and temperature, the molar ratio of the capping
agent with the precursor salt and the ratio of reducing agent with the precursor salt.112–115
Reducing agents used for this purpose often include sodium borohydride, hydrazine, 1,2-
hexadecane-diol, glucose, ascorbic acid, CO, or more recently introduced borane compounds.4
Supported copper nanoparticles
In most chemical reduction methods for synthesis of metal nanoparticles, protecting ligands
are usually needed.96 That is why special attention should be given to the materials used to
support Cu NPs. The choice of support largely depends on the ease of its synthesis, its
compatibility with different substrates/reagents, and, most importantly, the properties it poses
on the resulting supported nanomaterials. Therefore, by choosing an appropriate support, it is
possible to modify the properties of the NPs to suit specific applications.4
Several supports have been extensively used and have been summarized in several reviews.4,116
For example, activated carbon and diamond NPs have been used as supports for catalytically
active metals. A variety of metal oxides have been examined as supporting materials for Cu-
based NPs. Ceria is an important support material for various catalysts due to its oxygen
content, which is particularly high at its surfaces. Another important support materials that has
been widely used as a support for NPs are alumina, MgO, titania and zirconia.
Silica- and silicon-supported nanomaterials have been used extensively in fields ranging from
catalysis to adsorption and optics, among others. Silica supports contain surface silanols that
simplifies NPs binding, while silicon has unique electronic and optical properties allowing the
preparation of sophisticated multifunctional hybrid materials. Due to its controllable pore size
and shape as well as its large surface area mesoporous silica represents an ideal supporting
material for many types of NPs.

16
Zeolite have been broadly used as a support for metal NPs for different applications including
catalysis and adsorption, because of their unique porous morphology. Usually, the final
nanomaterials are prepared by copper ion exchange of the parent zeolite followed by the
reduction of the copper cations occluded in the zeolite channels. The steric hindrance imposed
by the zeolite cages controls the size of the resulting Cu nanoclusters, and the limited pore
diameter increases the catalytic selectivity.88,117 The variety of zeolite structures permits the
creation of diverse materials of reduced dimensionality. Copper containing zeolites are of great
interest due to the low cost of copper and its excellent catalytic activity in a wide range of
reactions, including selective catalytic reduction of NO, synthesis and decomposition of
methanol and higher alcohols, etc. The performance of these materials in the above applications
depends on the location, coordination state, reactivity and mobility of copper species in the
zeolite frameworks.118–126 Some examples of different metal nanoparticles stabilized in the
zeolites are summarized in the Table 2.86,87,92,127–144
Nanosized zeolites are alternative hosts (matrix) for stabilization of metal NPs. The
combination of the transport properties within the porous framework structures with the
chemical reactivity of the metal clusters is a promising pathway to the development of
advanced materials which are interesting for numerous applications in nanoscale devices,
selective chemical sensing, catalysis, nanoelectronics, data storage, molecular imaging,
biosensing, nanomedicine ect.91,145–152

17
Table 2 The examples of metal nanoparticles supported on zeolites
Literature source
Zeolite Me Me incorporation Reduction method Comments
[127] BEA Ag Ion exchange with AgClO4 Pulse radiolysis [128] FAU Ag Ion exchange with AgNO3 UV irradiation 0.75 – 1.12
nm [129] EMT Ag Ion exchange with AgClO4 Microwave reduction (120 °C, 10
min, 1000 W) in the presence of a triethylamine N(C2H5)3
0.5 – 0.7 nm
[130] LTL Ag Ion exchange with AgNO3 In hydrogen flow at 500 ºC; Under oxidative conditions
20 – 32 nm 3 – 4 nm
[92] Zeolite Y Ag Ion exchange with AgNO3 Resorcinol in aqueous solution all at room temperature in dark
2.45 nm after 120 min
[86] MOR Ag, Cu Ion exchange with AgNO3, Cu(NO3)2
In hydrogen flow, 20–450 ◦C, 240 min
[131] Zeolite Y Cu Ion exchange Hydrazine hydrate at 60 ºC for 180 min
8 nm
[87] LTL Cu Ion exchange with Cu(NO3)2 Hydrazine hydrate at RT for 280 min
1 – 2.2 nm
[132] Mordenites,erionite andclinoptilolite
Cu Ion exchange with Cu(NO3)2 In hydrogen flow under fixed temperatures 150, 250, 350 and 450 ºC
2 – 10 nm
[133] Zeolite Y Cu Caking with CuCl for 24 h at 420 ºC under high vacuum
In hydrogen flow at 460 and 600 ºC Aggregates of 5 nm
[134] GIS Cu Ion exchange with Cu(NO3)2 γ radiolysis 0.23 – 1.26 nm
[135] Zeolite Y Fe, Cu, Mn
Ion exchange with FeCl3·6H2O, CuCl2·2H2O, and MnCl2·4H2O
Sodium borohydride in aqueous solution at 20 ºC
Metallic and bimetallic nanoparticles

18
[136] Silicalite-1ZSM-5
Au Immobilization of as-prepared Au NPs in amorphous silica matrix
1 – 3 nm
[137] LTA Au, Pd, Pt
Hydrothermal assembly of LTA crystals around cationic precursors (HAuCl4·3H2O, Pd(NH3)4(NO3)2, H2PtCl6) stabilized by protecting mercaptosilane ligands
In hydrogen flow at 350 ºC 1.5 – 3 nm AuPd, AuPt, and PdPt bimetallic clusters
[138] Zeolite Beta Pt Ion exchange with [Pt (NH3)4](NO3)2 γ radiolysis 0.23 – 1.26 nm
[139] FAU–LTAhierarchicalporous composite
Pt Ion-exchanged with Pt(NH3)2Cl2 Reduction in hydrogen atmosphere 1 – 5 nm
[140] BEA Pt Ion-exchange with [Pt (NH3)4](NO3)2 Plasma treatment 2 nm [141] CHA Pt Hydrothermal assembly of CHA
crystals around cationic precursor (H2PtCl6·6H2O)
In hydrogen flow at 400 ºC 1 nm
[142] Natural zeolite(<10 μm powder,0.6 K2O: 4.0Na2O: 1 Al2O3:2.0 SiO2: H2O,Sigma Aldrich)
Pd Ion-exchange with palladium acetylacetonate Pd(acac)2
Hydrazine hydrate in aqueous solution
[143] Zeolite Y Os Ion exchange with OsCl3·3H2O Sodium borohydride in aqueous solution at room temperature
3 – 4 nm
[144] Silicalite-1 Ni Incipient wetness impregnation with Ni(NO3)2·6(H2O)
In hydrogen flow at 750 ºC 10 nm

19
Growth mechanism of copper nanoparticles
It has been wildly accepted that the process of the nucleation and growth of nanoparticles can
be described through the LaMer burst nucleation followed by Ostwald ripening. The process
was initially modeled by Reiss using the model developed by Lifshitz−Slyozov−Wagner (LSW
theory). However, thanks to in- and ex-situ UV-vis spectroscopy, Watzky and Finke formulated
an approach of constant slow nucleation followed by autocatalytic growth.153
a. LaMer Mechanism
Victor K. LaMer proposed the mechanism154,155 which involves the separation of the nucleation
and growth into two stages. The process of nucleation and growth by LaMer mechanism can
be divided into three stages: (i) A rapid increase in the concentration of free monomers in
solution, (ii) “burst-nucleation” of the monomer which significantly reduces the concentration
of free monomers in solution. Later, there is almost no nucleation occurring due to the low
concentration of monomers after this point; (iii) the growth occurs under the control of the
diffusion of the monomers through the solution.
Figure 4 Schematic representation of LaMer mechanism (reprinted from [126])
b. Ostwald Ripening and Digestive Ripening
Colloid particles become increasingly unstable with decreasing of the particle size due to the
relative increase in energy surface. The Gibbs – Thomson equation describes the change in the

20
particles solubility with the change of the size in terms of the solubility concentration, C(r), of
a particle with radius r.156
�(�) = �° exp �2������ �,
where Cº is the solubility of an atom taken from an infinite flat surface, Vm is the molar volume
of the particle, γ is the surface energy, R is the gas constant, and T is the temperature. This size-
dependent instability leads to Ostwald ripening, which is the transfer of atoms over time from
smaller, less stable particles to larger ones. Digestive ripening is effectively the inverse of
Ostwald ripening, where smaller particles grow at expense of the larger ones.153,156
c. The Finke – Watzky two step mechanism
The Finke-Watzky two step mechanism can be described as nucleation and growth happening
simultaneously. The first stage is a slow continuous nucleation (I) A → B, and the second is
the autocatalytic surface growth which is not diffusion controlled (II) A + B → 2B.157
d. Coalescence and Orientated Attachment
Coalescence and orientated attachment are very similar. The difference is in the orientation of
the crystal lattice at the grain boundary. There is no particular preference for the attachment
when the coalescence takes place, whereas for the orientated attachment, there is a common
crystallographic alignment of the attachment to occur, allowing the continuous crystallographic
planes.153
Goals
Literature overview shows the importance and tremendous interests in the preparation of metal-
containing nanosized zeolites, driven by their numerous promising applications, including
catalysis, photo-catalysis, gas separation, chemical sensing, etc. These materials are
particularly useful for addressing environmental issues and energy saving.
Hence, the main goal of this study is to develop synthesis and characterization strategies for
the preparation of copper and, also, silver-containing nanozeolites in the form of powders,

21
suspensions, and films, and to explore their abilities for photo-catalytical and chemical sensing
applications.
The first task was to study the kinetics of copper nanoparticles within the cavities of nanosized
LTL zeolite crystals prepared in the form of the water suspension.
Due to complexity of the system copper nanoparticles – zeolite matrix special attention has
been paid to the characterization and quantification of all copper species, that are present in the
host and can influence the activity of the new material in various applications.
The third objective is to compare the nature of copper species formed in the nanosized zeolites
using two approaches: (i) direct incorporation of Cu via one pot synthesis, and (ii) post
synthesis incorporation. Special attention is paid to the environment and location of the copper
species within the zeolite crystals.
The forth task is to reveal the potential and the current limitations of fabrication of chemical
sensors based on zeolite thin films. Spin-coating approach for deposition of metal-containing
nanosized zeolites for was applied with the ultimate goal of preparation of low cost detectors
for low concentrations on harmful gases, such as CO.
The final objective is to investigate the host-guest photoreactivity in silver-containing zeolites.
In order to address the ultrafast processes involved in the plasmonic behavior of Ag-zeolite
host-guest systems, a novel route consisting of transient absorption measurements on
transparent metal-containg zeolite thin films was applied.

22
References
1 A. Steinfeld, C.- Zurich and R. Palumbo, Encycl. Phys. Sci. Technol., 2001, 15, 237–256.
2 S. Licht, Chem. Commun. (Camb)., 2005, 2005, 4635–4646.3 R. R. Conry, Encycl. Inorg. Chem., 2006, 1–19.4 M. B. Gawande, A. Goswami, F.-X. Felpin, T. Asefa, X. Huang, R. Silva, X. Zou, R.
Zboril and R. S. Varma, Chem. Rev., 2016, 116, 3722–3811.5 C. Martínez and A. Corma, Compr. Inorg. Chem. II, 2013, 103–131.6 J. Cejka, A. Corma and S. Zones, Eds., Zeolites and Catalysis. Synthesis, Reactions
and Applications, Wiley-VCH Verlag GmbH & Co. KGaA., 2010.7 J. Weitkamp and L. Puppe, Eds., Catalysis and Zeolites. Fundamentals and
Applications, Springer-Verlag Berlin Heidelberg, 1st editio., 1999.8 J. Cejka, H. van Bekkum, A. Corma and F. Schueth, Introduction to Zeolite Science
and Practice- 3rd Revised Edition, Elsevier, 3rd editio., 2007.9 P. Eliášová, M. Opanasenko, P. S. Wheatley, M. Shamzhy, M. Mazur, P. Nachtigall,
W. J. Roth, R. E. Morris and J. Čejka, Chem. Soc. Rev., 2015.10 A. Primo and H. Garcia, Chem. Soc. Rev., 2014, 43, 7548–7561.11 S. M. Auerbach, K. A. Carrado and P. K. Dutta, Handbook of zeolite science and
technology, CRC Press, 2004, vol. 2004. 12 J. Weitkamp, Solid State Ionics, 2000, 131, 175–188.13 C. Martinez and J. Perez-Pariente, Eds., Structural Chemistry and Properties of
Zeolites, 1st edn., 2011. 14 P. Payra and P. K. Dutta, in Handbook of Zeolite Science and Technology, 2003.15 Catalysis and Zeolites, 1999. 16 D. H. Everett, Pure Appl. Chem., 1973.17 C. Baerlocher, L. McCusker and D. Olson, Atlas of zeolite framework types, 2007, vol.
12. 18 J. Li, A. Corma and J. Yu, Chem. Soc. Rev., 2015.19 C. S. Cundy and P. a Cox, 2003, 103, 663–702.20 G. Perego, G. Bellusi, C. Corno, M. Taramasso, F. Buonomo and A. Esposito, Stud.
Surf. Sci. Catal., 1986, 28, 129–136. 21 G. Bellussi and M. S. Rigutto, in Advanced Zeolite Science and Applications, eds. J.C.
Jansen, M. Stocker, H. G. Karge and J. Weitkamp, Elsevier B.V, 1994, vol. 85, pp. 177–213.
22 K. G. Ione, L. A. Vostrikova and V. M. Mastikhin, J. Mol. Catal., 1985, 31, 355–370.23 K. G. Ione and L. A. Vostrikova, Russ. Chem. Rev., 1987, 56, 393–427.24 B. Sulikowski, Heterog. Chem. Rev., 1996, 3, 203–268.25 G. Coudurier, A. Auroux, J. C. Vedrine, R. D. Farlee, L. Abrams and R. D. Shannon,
J. Catal., 1987, 108, 1–14.26 S. Bordiga, A. Damin, F. Bonino, G. Ricchiardi, C. Lamberti and A. Zecchina, Angew.
Chemie - Int. Ed., 2002, 41, 4734–4737. 27 G. Ricchiardi, A. Damin, S. Bordiga, C. Lamberti, G. Spanò, F. Rivetti and A.
Zecchina, J. Am. Chem. Soc., 2001, 123, 11409–11419. 28 R. Millini, E. Previde Massara, G. Perego and G. Bellussi, J. Catal., 1992, 137, 497–
503. 29 G. Tozzola, M. a. Mantegazza, G. Ranghino, G. Petrini, S. Bordiga, G. Ricchiardi, C.
Lamberti, R. Zulian and A. Zecchina, J. Catal., 1998, 179, 64–71. 30 C. Lamberti, S. Bordiga, A. Zecchina, A. Carati, N. N. Fitch, G. Artioli, G. Petrini, M.
Salvalaggio and G. L. L. Marra, J. Catal., 1999, 183, 222–231.

23
31 S. Bordiga, F. Boscherini, S. Coluccia, F. Genonic, C. Lamberti, G. Leofanti, L.Marchese, G. Petrini, G. Vlaic and A. Zecchina, Catal. Letters, 1994, 26, 195–208.
32 R. Fricke, H. Kosslick, G. Lischke and M. Richter, Chem. Rev., 2000, 100, 2303–2405.33 C. Lamberti, G. T. Palomino, S. Bordiga, A. Zecchina and G. Span, Science (80-. ).,
1999, 63, 213–216. 34 C. Otero Areán, G. Turnes Palomino, F. Geobaldo and a. Zecchina, J. Phys. Chem.,
1996, 100, 6678–6690. 35 X. Liu and J. Klinowski, J. Phys. Chem., 1992, 311, 3403–3408.36 C. R. Bayense, A. P. M. Kentgens, J. W. De Haan, L. J. M. Van de Ven and J. H. C.
Van Hooff, J. Phys. Chem., 1992, 96, 775–782. 37 G. Berlier, G. Spoto, S. Bordiga, G. Ricchiardi, P. Fisicaro, A. Zecchina, I. Rossetti, E.
Selli, L. Forni, E. Giamello and C. Lamberti, J. Catal., 2002, 208, 64–82. 38 S. Bordiga, R. Buzzoni, F. Geobaldo, C. Lamberti, E. Giamello, A. Zecchina, G.
Leofanti, G. Petrini, G. Tozzola and G. Vlaic, J. Catal., 1996, 158, 486–501. 39 A. Zecchina, F. Geobaldo, C. Lamberti, S. Bordiga, G. Turnes Palomino and C. Otero
Arean, Catal. Letters, 1996, 42, 25–33. 40 R. Szostak and T. L. Thomas, J. Catal., 1986, 100, 555–557.41 R. Kumar and P. Ratnasamy, J. Catal., 1990, 121, 89–98.42 S. N. Talapaneni, J. Grand, S. Thomas, H. A. Ahmad and S. Mintova, Mater. Des.,
2016, 99, 574–580. 43 S. Tolborg, A. Katerinopoulou, D. D. Falcone, I. Sádaba, C. M. Osmundsen, R. J.
Davis, E. Taarning, P. Fristrup and M. S. Holm, J. Mater. Chem. A, 2014, 2, 20252–20262.
44 T. Iida, A. Takagaki, S. Kohara, T. Okubo and T. Wakihara, ChemNanoMat, 2015, 1,155–158.
45 H. Y. Luo, L. Bui, W. R. Gunther, E. Min and Y. Román-Leshkov, ACS Catal., 2012,2, 2695–2699.
46 W. R. Gunther, Y. Wang, Y. Ji, V. K. Michaelis, S. T. Hunt, R. G. Griffin and Y.Román-Leshkov, Nat. Commun., 2012, 3, 1109.
47 S. Roy, K. Bakhmutsky, E. Mahmoud, R. F. Lobo and R. J. Gorte, ACS Catal., 2013,3, 573–580.
48 A. Corma, L. T. Nemeth, M. Renz and S. Valencia, Nature, 2001, 412, 423–425.49 R. Szostak, Molecular Sieves. Principles of Synthesis and Identification, 1988.50 R. Aiello, J. B. Nagy, G. Giordano, A. Katovic and F. Testa, Comptes Rendus Chim.,
2005, 8, 321–329. 51 V. Valtchev and L. Tosheva, Chem. Rev., 2013, 113, 6734–6760.52 S. Mintova and E.-P. Ng, in Comprehensive Inorganic Chemistry II: From Elements to
Applications, 2013, vol. 5, pp. 285–302. 53 S. C. Larsen, J. Phys. Chem. C, 2007, 111, 18464–18474.54 S. Mintova, J. Grand and V. Valtchev, Comptes Rendus Chim., 2016, 19, 183–191.55 M. Zaarour, B. Dong, I. Naydenova, R. Retoux and S. Mintova, Microporous
Mesoporous Mater., 2014, 189, 11–21. 56 S. Mintova, M. Jaber and V. Valtchev, Chem. Soc. Rev., 2015, 44, 7207–7233.57 C. Madsen, C. Madsen and C. J. H. Jacobsen, Chem. Commun., 1999, 673–674.58 Y. Pan, M. Ju, J. Yao, L. Zhang and N. Xu, Chem. Commun. (Camb)., 2009, 7233–5.59 C. Jo, J. Jung, H. S. Shin, J. Kim and R. Ryoo, Angew. Chemie - Int. Ed., 2013, 52,
10014–10017. 60 S. Askari, S. Miar Alipour, R. Halladj and M. H. Davood Abadi Farahani, J. Porous
Mater., 2012, 20, 285–302. 61 J. Gascon, F. Kapteijn, B. Zornoza, V. Sebastián, C. Casado and J. Coronas, Chem.

24
Mater., 2012, 24, 2829–2844. 62 N. Kosinov, V. G. P. Sripathi and E. J. M. Hensen, Microporous Mesoporous Mater.,
2014, 194, 24–30. 63 N. Kosinov, C. Auffret, V. G. P. Sripathi, C. Gücüyener, J. Gascon, F. Kapteijn and E.
J. M. Hensen, Microporous Mesoporous Mater., 2014, 197, 268–277.64 D. W. Breck, J. Chem. Educ., 1964, 41, 678–689.65 K. Li, J. Valla and J. Garcia-Martinez, ChemCatChem, 2014, 6, 46–66.66 I. Fechete, Y. Wang and J. C. V??drine, Catal. Today, 2012, 189, 2–27.67 R. Moos, Sensors, 2010, 10, 6773–6787.68 T. Bein and S. Mintova, Zeolites and Ordered Mesoporous Materials: Progress and
Prospects, Elsevier, 2005, vol. 157. 69 S. Mintova and T. Bein, Microporous Mesoporous Mater., 2001, 50, 159–166.70 Y. Zheng, X. Li and P. K. Dutta, Sensors, 2012, 12, 5170–5194.71 T. Baimpos, L. Gora, V. Nikolakis and D. Kouzoudis, Sensors Actuators A Phys.,
2012, 186, 21–31. 72 D. J. Wales, J. Grand, V. P. Ting, R. D. Burke, K. J. Edler, C. R. Bowen, S. Mintova
and A. D. Burrows, Chem. Soc. Rev., 2015. 73 M. Vilaseca, J. Coronas, A. Cirera, A. Cornet, J. R. Morante and J. Santamarıa, Catal.
Today, 2003, 82, 179–185. 74 K. Sahner, G. Hagen, D. Schönauer, S. Reiß and R. Moos, Solid State Ionics, 2008,
179, 2416–2423. 75 C. M. Lew, R. Cai and Y. Yan, Acc. Chem. Res., 2010, 43, 210–219.76 M. Moothanchery, I. Naydenova, S. Mintova and V. Toal, Opt. Express, 2011, 19,
25786–25791. 77 US pat., 20090130154 A1, 2009. 78 S. E. Lehman and S. C. Larsen, Environ. Sci. Nano, 2014, 1, 200–213.79 N. Tirtaatmadja, G. Mortimer, E.-P. Ng, H. A. Ahmad, S. Mintova, V. Serpooshan, R.
F. Minchin and M. Mahmoudi, J. Iran. Chem. Soc., 2014, 12, 317–323.80 A. Petushkov, J. Intra, J. B. Graham, S. C. Larsen and A. K. Salem, Chem. Res.
Toxicol., 2009, 22, 1359–1368. 81 J. A. Litch and R. A. Bishop, Wilderness Environ. Med., 2000, 11, 189–191.82 T. Babeva, H. Awala, M. Vasileva, J. El Fallah, K. Lazarova, S. Thomas and S.
Mintova, Dalton Trans., 2014, 43, 8868–8876. 83 E. Leite, T. Babeva, E. P. Ng, V. Toal, S. Mintova and I. Naydenova, J. Phys. Chem.
C, 2010, 114, 16767–16775. 84 A. Seidel, J. Loos and B. Boddenberg, J. Mater. Chem., 1999, 2495–2498.85 V. Gurin and V. Petranovskii, Stud. Surf. Sci. Catal., 2004, 154, 1661–1669.86 V. S. Gurin, V. P. Petranovskii, M. -a. Hernandez, N. E. Bogdanchikova and a. a.
Alexeenko, Mater. Sci. Eng. A, 2005, 391, 71–76. 87 A. Kharchenko, O. I. Lebedev, V. Zholobenko, V. de Waele and S. Mintova, J. Phys.
Chem. C, 2016, acs.jpcc.6b08045. 88 K.-L. Wong, A. Souici, V. De Waele, M. Mostafavi, T. H. Metzger and S. Mintova,
Langmuir, 2010, 26, 4459–64. 89 M. Zahmakıran, F. Durap and S. Özkar, Int. J. Hydrogen Energy, 2010, 35, 187–197.90 V. De Waele, J. Kecht, Z. Tahri, M. Mostafavi, T. Bein and S. Mintova, Sensors
Actuators B Chem., 2007, 126, 338–343. 91 J. Kecht, Z. Tahri, V. De Waele, M. Mostafavi, S. Mintova and T. Bein, Chem. Mater.,
2006, 18, 3373–3380. 92 M. Severance and P. K. Dutta, J. Phys. Chem. C, 2014, 118, 28580–28591.93 D. Farrusseng and A. Tuel, New J. Chem., 2016.

25
94 F. Zaera, Chem. Soc. Rev., 2013, 2, 2746–2762.95 G. Evano, N. Blanchard and M. Toumi, Chem. Rev., 2008, 108, 3054–3131.96 Y. Lu and W. Chen, Chem. Soc. Rev., 2012, 41, 3594–623.97 N. Cioffi, N. Ditaranto, L. Torsi and L. Sabbatini, Approaches to synthesis and
characterization of spherical and anisotropic copper nanomaterials, 2009. 98 P. Christian, F. Von Der Kammer, M. Baalousha and T. Hofmann, Ecotoxicology,
2008, 17, 326–343. 99 Y. Xia and N. J. Halas, MRS Bull., 2011, 30, 338–348.100 R. V. Kumar, Y. Mastai, Y. Diamant and a. Gedanken, J. Mater. Chem., 2001, 11,
1209–1213. 101 J. Moghimi-Rad, F. Zabihi, I. Hadi, S. Ebrahimi, T. D. Isfahani and J. Sabbaghzadeh,
J. Mater. Sci., 2010, 45, 3804–3811.102 M. Veerapandian, R. Subbiah, G. S. Lim, S. H. Park, K. Yun and M. H. Lee,
Langmuir, 2011, 27, 8934–8942. 103 B. K. Park, S. Jeong, D. Kim, J. Moon, S. Lim and J. S. Kim, J. Colloid Interface Sci.,
2007, 311, 417–424. 104 M. Blosi, S. Albonetti, M. Dondi, C. Martelli and G. Baldi, J. Nanoparticle Res., 2011,
13, 127–138. 105 S. S. Jushi, S. F. Patil, V. Iyer and S. Mahumuni, NanoStructured Mater., 1998, 10,
1135–1144. 106 J. Ryu, H.-S. Kim and H. T. Hahn, J. Electron. Mater., 2011, 40, 42–50.107 I. Lisiecki and M. P. Pileni, J. Am. Chem. Soc., 1993, 115, 3887–3896.108 M. P. Pileni, B. W. Ninham, T. Gulik-Krzywicki, J. Tanori, I. Lisiecki and a
Filankembo, Adv. Mater., 1999, 11, 1358–1362. 109 Y. G. Guo, J. S. Hu and L. J. Wan, Adv. Mater., 2008, 20, 2878–2887.110 G.-R. Li, H. Xu, X.-F. Lu, J.-X. Feng, Y.-X. Tong and C.-Y. Su, Nanoscale, 2013, 1–
35. 111 A. S. Arico, P. Bruce, B. Scrosati and J.-M. Arascon, Nature, 2005, 4, 366–377.112 T. M. D. Dang, T. T. T. Le, E. Fribourg-Blanc and M. C. Dang, Adv. Nat. Sci.
Nanosci. Nanotechnol., 2011, 2, 15009. 113 D. Deng, Y. Jin, Y. Cheng, T. Qi and F. Xiao, 2013.114 Y. Kobayashi, S. Ishida, K. Ihara, Y. Yasuda, T. Morita and S. Yamada, Colloid
Polym. Sci., 2009, 287, 877–880. 115 S. Mallick, S. Sharma, M. Banerjee, S. S. Ghosh, A. Chattopadhyay and A. Paul, ACS
Appl. Mater. Interfaces, 2012, 4, 1313–1323. 116 J. E. Mondloch, E. Bayram and R. G. Finke, J. Mol. Catal. A Chem., 2012, 355, 1–38.117 A. Souici, K.-L. Wong, V. De Waele, J. L. Marignier, T. H. Metzger, N. Keghouche,
S. Mintova and M. Mostafavi, J. Phys. Chem. C, 2014, 118, 6324–6334.118 S. a. Anderson, S. Manthata and T. W. Root, Appl. Catal. A Gen., 2005, 280, 117–124.119 W. X. Zhang, H. Yahiro, N. Mizuno, J. Izumi and M. Iwamoto, Langmuir, 1993, 9,
2337–2343. 120 M. Iwamoto, Stud. Surf. Sci. Catal., 1991, 327–334.121 C. Torre-Abreu, C. Henriques, F. . Ribeiro, G. Delahay and M. . Ribeiro, Catal. Today,
1999, 54, 407–418. 122 N. V. Beznis, B. M. Weckhuysen and J. H. Bitter, Catal. Letters, 2010, 138, 14–22.123 G. D. Pirngruber, Ordered Porous Solids, 2009, 749–771.124 F. Márquez, a. E. Palomares, F. Rey and a. Corma, J. Mater. Chem., 2001, 11, 1675–
1680. 125 S. Chassaing, A. Sani Souna Sido, A. Alix, M. Kumarraja, P. Pale and J. Sommer,
Chem. - A Eur. J., 2008, 14, 6713–6721.

26
126 W. Zhang, J. Xie, W. Hou, Y. Liu, Y. Zhou and J. Wang, 2016.127 Z. Tahri, F. Luchez, I. Yordanov, O. Poizat, A. Moissette, V. Valtchev, S. Mintova, M.
Mostafavi and V. De Waele, Res. Chem. Intermed., 2009, 35, 379–388. 128 M. Zaarour, M. El Roz, B. Dong, R. Retoux, R. Aad, J. Cardin, C. Dufour, F.
Gourbilleau, J.-P. Gilson and S. Mintova, Langmuir, 2014, 30, 6250–6. 129 B. Dong, R. Retoux, V. de Waele, S. G. Chiodo, T. Mineva, J. Cardin and S. Mintova,
Microporous Mesoporous Mater., 2017. 130 R. Bartolomeu, R. Bértolo, S. Casale, A. Fernandes, C. Henriques, P. Da Costa and F.
Ribeiro, Microporous Mesoporous Mater., 2013, 169, 137–147. 131 T. Subramanian and K. Pitchumani, Catal. Sci. Technol., 2012, 2, 296.132 A. N. Pestryakov, V. P. Petranovskii, A. Kryazhov, O. Ozhereliev, N. Pfänder and A.
Knop-Gericke, Chem. Phys. Lett., 2004, 385, 173–176. 133 A. Seidel, J. Loos and B. Boddenberg, J. Mater. Chem., 1999, 9, 2495–2498.134 L. Lakiss, J. Kecht, V. de Waele and S. Mintova, Superlattices Microstruct., 2008, 44,
617–625. 135 Y. Zeng, H. Walker and Q. Zhu, J. Hazard. Mater., 2016, 324, 605–616.136 K. T. Højholt, A. B. Laursen, S. Kegnæs and C. H. Christensen, Top. Catal., 2011, 54,
1026–1033. 137 T. Otto, J. M. Ramallo-L??pez, L. J. Giovanetti, F. G. Requejo, S. I. Zones and E.
Iglesia, J. Catal., 2016, 342, 125–137. 138 I. Yordanov and R. Knoerr, J. …, 2010, 20974–20982.139 X. Zou, K.-L. Wong, S. Thomas, T. H. Metzger, V. Valtchev and S. Mintova, Catal.
Today, 2011, 168, 140–146. 140 M. Rivallan, I. Yordanov, S. Thomas, C. Lancelot, S. Mintova and F. Thibault-
Starzyk, ChemCatChem, 2010, 2, 1074–1078. 141 M. Moliner, J. E. Gabay, C. E. Kliewer, R. T. Carr, J. Guzman, G. L. Casty, P. Serna
and A. Corma, J. Am. Chem. Soc., 2016, 354, jacs.6b10169. 142 J. Choi, S. Chan, G. Yip, H. Joo, H. Yang and F. K. Ko, Water Res., 2016, 101, 46–54.143 M. Zahmakiran, S. Akbayrak, T. Kodaira and S. Ozkar, Dalt. Trans., 2010, 39, 7521–
7527. 144 D. Laprune, C. Theodoridi, A. Tuel, D. Farrusseng and F. C. Meunier, Appl. Catal. B
Environ., 2017, 204, 515–524. 145 X. Zou, J.-M. Goupil, S. Thomas, F. Zhang, G. Zhu, V. Valtchev and S. Mintova, J.
Phys. Chem. C, 2012, 116, 16593–16600. 146 Y. Lee, J.-R. Choi, K. J. Lee, N. E. Stott and D. Kim, Nanotechnology, 2008, 19,
415604. 147 M. Kaya, M. Zahmakiran, S. Özkar and M. Volkan, ACS Appl. Mater. Interfaces,
2012, 4, 3866–3873. 148 A. P. Ingle, N. Duran and M. Rai, Appl. Microbiol. Biotechnol., 2014, 98, 1001–1009.149 X. Hu, J. Li and J. Wang, ECS Electrochem. Lett., 2014, 3, D13–D15.150 J. Ramyadevi, K. Jeyasubramanian, A. Marikani, G. Rajakumar and A. A. Rahuman,
Mater. Lett., 2012, 71, 114–116. 151 T. Tsoncheva, A. Gallo, I. Spassova, M. Dimitrov, I. Genova, M. Marelli, M.
Khristova, G. Atanasova, D. Kovacheva and V. Dal Santo, Appl. Catal. A Gen., 2013, 464–465, 243–252.
152 M. Vallet-Regí, F. Balas and D. Arcos, Angew. Chemie - Int. Ed., 2007, 46, 7548–7558.
153 N. T. K. Thanh, N. Maclean and S. Mahiddine, Chem. Rev., 2014, 114, 7610–7630.154 V. LaMer and R. Dinegar, J. Am. Chem. …, 1950, 72, 4847–4854.155 V. K. La Mer, Ind. Eng. Chem., 1952, 44, 1270–1277.

27
156 S. T. Gentry, S. F. Kendra and M. W. Bezpalko, J. Phys. Chem. C, 2011, 115, 12736–12741.
157 M. A. Watzky and R. G. Finke, Chem. Mater., 1997, 9, 3083–3095.158 M. Hölzl, S. Mintova and T. Bein, Stud. Surf. Sci. Catal., 2005, 158, 11–18.159 K. Norrman, A. Ghanbari-Siahkali and N. B. Larsen, Annu. Reports Sect. ‘C’ (Physical
Chem., 2005, 101, 174. 160 D. W. Schubert and T. Dunkel, Mater. Res. Innov., 2003, 7, 314–321.161 2016. 162 G. Perego, Catal. Today, 1998, 41, 251–259.163 A. W. Chester and E. G. Derouane, Zeolite characterization and catalysis: A tutorial,
2010. 164 H. van Bekkum, E. M. Flanigen, P. A. Jacobs and J. C. Jansen, Introduction to Zeolite
Science and Practice-2nd Revised Edition, Elsevier, 2nd edn., 2001. 165 M. Che and J. C. Védrine, Characterization of Solid Materials and Heterogeneous
Catalysts - From Structure to Surface Reactivity, Wiley-VCH Verlag GmbH & Co. KGaA., 2012.
166 G. Pál-Borbély, 2005, 65, 147–152.167 E. Kissa, Dispersions: characterization, testing, and measurement, CRC Press, New
York, 1999. 168 F. Rouessac and A. Rouessac, Chemical Analysis: Modern Instrumentation Methods
and Techniques, 2007. 169 G. Bergeret and P. Gallezot, Heterog. Katalyse, 2002, 738–765.170 D. B. Williams and C. B. Carter, Transmission Electron Microscopy: A Textbook for
Materials Science, 2009, vol. 1–4. 171 W. Wan, C. Xiao and X. Zou, Mesoporous Zeolites Prep. Charact. Appl., 2015, 425–
460. 172 S. Kaliaguine, 1996, vol. 102, pp. 191–230.173 M. Stoecker, Microporous Mater., 1996, 6, 235–257.174 H. Robson, Verified synrhesis of material - 2nd revised edition, 2001.175 J. Klinowski, Anal. Chim. Acta, 1993, 283, 929–965.176 R. a. Schoonheydt, Chem. Soc. Rev., 2010, 39, 5051.177 R. F. Howe, in Recent Advances and New Horizonts in Zeolite Science and
Technology, 1995, vol. 102, pp. 97–139. 178 A. Vimont, F. Thibault-Starzyk and M. Daturi, Chem. Soc. Rev., 2010, 39, 4928–4950.179 F. Zaera, Chem. Soc. Rev., 2014, 43, 7624–7663.180 S. Thomas, P. Bazin, L. Lakiss, V. De Waele and S. Mintova, Langmuir, 2011, 27,
14689–14695.

28
Preparation and characterization of metal-containing zeolite crystals
The syntheses methods applied for preparation of zeolites and the methods for their
characterization will be described in this chapter.
Information on the structural and physicochemical characteristics of zeolites is of high
importance, as it allows the rational development of the materials with the desired properties
for advanced applications, such as catalysis, sorption, sensing etc. Since individual analysis
technics typically probe only a specific feature of the material, it is necessary to apply the
combination of methods to have a balanced description of the system.
Synthesis and post synthesis modification of zeolites
Preparation of pure and copper-containing nanosized LTL zeolite
The precursor suspensions used for preparation of LTL-type zeolite were prepared as follows.
In the standard procedure, solution A was prepared by dissolving 2.19 g of KOH (ACS reagent,
≥85%, pellets, Sigma-Aldrich) and 0.49 Al(OH)3 (reagent grade, Sigma-Aldrich) in 6.94 g of
doubly distilled water at room temperature and stirred until water clear. Solution B was
prepared by dissolving of 1.09 g of KOH (ACS reagent, ≥85%, pellets, Sigma-Aldrich) and 10
g of LUDOX® SM 30 colloidal silica (30 wt. % suspension in H2O, Sigma-Aldrich) in 3.47 g
of doubly distilled water at room temperature and stirred until water clear. Solution A was then
added drop wise into solution B under vigorous stirring at room temperature to obtain a water
clear suspension with the following molar composition: 5 K2O : 10 SiO2 : 0.5 A12O3 : 200
H2O.158 The as-prepared precursor suspension was aged at room temperature for 24 hours prior
to hydrothermal treatment at 170 ºC for 18 hours. After the crystallization process was
accomplished, the nanosized zeolite crystals were recovered by multistep centrifugation
29
(20000 rpm, 40 min) and washed with doubly distilled water until pH = 7 - 8. Prior to
incorporation of copper, the LTL nanosized crystals were stabilized in water suspension with
a concentration of solids of 2.5 wt.%. The sample was denoted as parent LTL and was freeze-
dried prior to material characterization.
The ion exchange was performed directly in the colloidal suspensions without preliminary
calcination of the LTL zeolite. Samples were prepared by mixing Cu(NO3)2·3H2O (puriss. p.a.,
99-104%, Sigma-Aldrich) (0.1 M) with zeolite suspensions, giving solutions containing 0.3
mmol Cu+2/g zeolite. The ion-exchange process was carried out at room temperature for 2
hours, and then the solutions were purified by multi-step centrifugation to remove the excess
of copper ions, and finally re-dispersed in double distilled water to reach a concentration of
solids of 2.5 wt.%. Copper exchanged zeolite suspensions were reduced with the following
reducing agents under identical conditions: sodium borohydride, triethylamine and hydrazine.
In a typical experiment the Cu+2/reductant ratio is fixed at 1/1000 to maintain reducing
conditions and to avoid oxidation of copper nanoparticles, so complete reduction of copper
cations was expected. During the addition of the reductant, the mixture was kept at room
temperature under magnetic stirring and N2 atmosphere, due to the high sensitivity of the
copper to oxygen. The samples obtained after reduction with three different reducing agents
were further denoted as Cu0-LTL-RA.
For the kinetic study of copper nanoparticles growth, the aliquots of suspension were removed
periodically from the reaction mixture and freeze-dried with or without washing before further
studies. The samples were entitled as Cu0-LTL-x min.
The sample was named Cu2+-LTL was freeze-dried prior to material characterization.
Reduction of copper cations in zeolite suspensions
Copper exchanged zeolite suspensions were reduced with the following reducing agents under
identical conditions: sodium borohydride, triethylamine and hydrazine. In a typical experiment

30
the Cu+2/reductant ratio is fixed at 1/1000 to maintain reducing conditions and to avoid
oxidation of copper nanoparticles, so complete reduction of copper cations was expected.
During the addition of the reductant, the mixture was kept at room temperature under magnetic
stirring and N2 atmosphere, due to the high sensitivity of the copper to oxygen. The samples
obtained after reduction with three different reducing agents were further denoted as Cu0-LTL-
RA.
For the kinetic study of copper nanoparticles growth, the aliquots of suspension were removed
periodically from the reaction mixture and freeze-dried with or without washing before further
studies. The samples were entitled as Cu0-LTL-x min.
One-pot synthesis of copper-containing LTL nanocrystals
One-pot synthesis of copper-containing LTL nanocrystals was conducted as follows. Solution
A was prepared by dissolving 0.49 g of Al(OH)3 (reagent grade, Sigma-Aldrich) and 2.5 g of
KOH (ACS reagent, ≥85%, pellets, Sigma-Aldrich) in 4.2 g of doubly distilled water to give a
clear suspension; solution B was prepared by adding 10 g of LUDOX® SM colloidal silica
(30 wt. % suspension in H2O, Sigma-Aldrich) and 0.8 g of KOH (ACS reagent, ≥85%, pellets,
Sigma-Aldrich) in 4 g of doubly distilled water and stirred until transparent. Solution C was
prepared by mixing 0.12 g of Cu(NO3)2·3H2O (puriss. p.a., 99-104%, Sigma-Aldrich) with 2 g
of doubly distilled water and 0.34 mL of ammonium hydroxide solution (28%, Prolabo). Then,
solution A was mixed with solution C, and the obtained mass was poured slowly into solution
B under vigorous stirring. A blue dense gel was formed with the following molar composition:
5 K2O : 10 SiO2 : 0.5 A12O3 : 1 CuO : 200 H2O. The gel was aged for 60 h at room temperature
under vigorous stirring. In the end the bluish colloidal suspension was subjected to
hydrothermal treatment at 170 °C for 18 h. After crystallization process occurred, the nanosized
crystals were recovered by multistep centrifugation (20000 rpm, 40 min) and washed with
doubly distilled water until pH = 7; the sample was entitled. To obtain the H+-form of K-Cu-

31
LTL-IS sample, the latter was subjected to the three – step ion exchange with ammonium
chlorite (ACS reagent, ≥99.5%, Fluka) at 40 oC, followed by purification of the material by
multistep centrifugation (20000 rpm, 40 min). The sample was entitled H-Cu-LTL IS.
Preparation of zeolite thin films via spin-coating approach
Thin films of zeolites to flat substrates are prepared by spin coating procedure. An excess
amount of a solution is applied to a substrate (in this study using a syringe). The substrate is
then rotated at high speed (e.g. up to 10.000 rpm) in order to spread the fluid by centrifugal
force. Rotation is continued while the fluid spins off the edges of the substrate, until the desired
thickness of the film is achieved. The applied solvent is volatile, and simultaneously
evaporates. The final film thickness is defined by the rotational speed and concentrations of
coating suspensions.
Four distinct stages of the spin coating process are shown on the Figure 1.159,160
Figure 1 (a) Deposition of the coating fluid onto the wafer or substrate, (b) Acceleration of the substrate up to its final speed, (c) Spinning of the substrate at a constant rate; fluid viscous forces dominate the fluid thinning behavior, (d) Spinning of the substrate at a constant rate; solvent evaporation dominates the coating thinning behavior
There are several specific problems, that might occur during spin-coating. Some of them are
presented in Figure 2.

32
Figure 2 Deviations from the ideal spin coated film. (a) Streaks in the film, probably due to particulate matter on the substrate. (b) Non-uniform liquid expansion during spinning, due to imperfect substrate wetting. (c) Areas of the substrate remain uncoated, which occurs often if the initial liquid volume is too small161
The zeolite films were prepared as follows. The copper-containing zeolite suspensions with a
constant concentration of solids (1.5 wt.%) were mixed with the binders (Methylcellulose or
Polyvinylpyrrolidone (PVP)) to establish additional stability and high adhesivity in the films.
The mixture was dropped onto a preliminarily cleaned with ethanol and acetone Si-wafer. The
speed and duration of the spinning rotation were optimized and fixed at 2000 min−1 and 30 s,
respectively. The coating procedure was repeated until the desired thickness of the film was
obtained. At last, a high temperature treatment of the films at 450oC for 1 h was accomplished
to enlarge the mechanical properties of the films and to remove the binder. The attained zeolite
films have a thickness in the range of 350 – 1500 nm.
Characterization of zeolite suspensions, powders and films
X-Ray Diffraction (XRD)
X-ray diffraction is the most frequently used technique for investigation of the bulk structure
and phase purity of zeolites. Their unique structure, in terms of atom positions and unit cell
dimensions, is reflected in characteristic positions and relative intensities of the peaks for each
phase, a so-called “fingerprint”, distinct from one another allowing phase identification. XRD

33
provides information about the Bragg angles, θ, of the reflection of an incident monochromatic
X-ray beam on crystal planes, according to Bragg's law:
n λ = 2·dhkl sinθ,
where n represents the order of reflection, A the wavelength of the incident X-ray beam and d
the spacing between reflecting crystal planes.162 The following data can be extracted from a
powder diffraction pattern: the topological and long-range structure of a material, the
approximate crystal size of the material, strain or stress in the material, the approximate extent
of heteroatom substitution, crystallinity, or the presence of stacking disorder.163 It is important
to note, that the concentration and location of cations at the exchange positions in the material
may lead to additional reflections or different intensities of diffraction peaks, whereas the
sample microstructure, such as nano size of the crystallites, stacking faults, microstrain, may
cause the diffraction peak broadening. In addition, changes in the size of the unit cell resulting
from differences in the framework composition influence the positions and the intensity of the
XRD peaks.8
Generally, the unit cell parameters and the atomic positions of the asymmetric unit can be
refined by powder XRD pattern fitting, if a suitable model containing the space group and
appropriate starting values is available.162 Full profile fitting methods calculate theoretical peak
profiles and their characteristics until the difference between observed and calculated profiles
is minimized. These methods are often used to deconvolute strongly overlapping peaks, to
describe minor differences between a reference material and the unknown sample, for unit cell
refinements or for quantitative analysis.
In the present study, the crystalline structure of the samples was revealed by using a
PANalytical X'Pert Pro diffractometer with Cu Kα monochromatized radiation (λ = 1.5418 Å).
The samples were scanned in the range 3-80 ° with a step size of 0.02o. The XRD patterns were
fit in PANalytical X'Pert Pro HighScore Plus software using Pawley fit.

34
Nitrogen adsorption
According to the IUPAC classification, the diameter of micropores ranges from 0.3 to 2 nm,
of mesopores from 2 to 50 nm and of macropores from 50 nm up to 100 μm. Using relatively
inert gases such as Ar and N2 to measure the sorption isotherms at their condensation
temperature permits to estimate the size distribution, shape and total volume of the pores.8
There are six limiting cases for types of isotherm classified by IUPAC (Figure 3).
Figure 3 IUPAC classification of sorption isotherms
Microporous solids such as zeolites are usually characterized by Type I isotherms, where the
low-pressure adsorption corresponds to filling of the micropore volume. For the nonporous
solids stands Type II isotherms, nonporous and non-wetting solids – Type III, mesoporous
solids – Type IV, mesoporous non-wetting solids – Type V, and extremely well ordered
nonporous systems such as graphite systems where adsorption occurs layer by layer – Type VI.
The hysteresis loops observed for the Type IV and Type V isotherms correspond to a capillary
condensation phenomena associated with the mesporosity.8,164,165 The characteristics of the
different types of isotherms are summarized in Table 1.in

35
Table 1 Type and characteristics of sorption isotherms (adapted from [5])
Type of isotherm Characteristics
I Adsorption in micropores
II Multilayer adsorption on a flat surface
III Weak gas-solid interactions
IV Multilayer adsorption and pore condensation
V Weak gas-solid interactions
VI Non-porous adsorbent
In the present study, the surface and textural properties of the materials were measured by
nitrogen sorption. Nitrogen adsorption/desorption isotherms were obtained using a
Micrometrics ASAP 2020 volumetric adsorption analyzer. Samples were degassed at 300 °C
under vacuum overnight prior to the measurement. The external surface area (Sext / m2g-1) and
micropore volume (Vmic / cm3g-1) were estimated by t-plot method based on Harkins-Jura
equation using Silica-1000 (22.1 m2 g-1 assumed) as a reference. The micropore and mesopore
size distributions of the samples were estimated Nonlocal Density Functional Theory
(NLDFT), and the desorption branch using the Barret-Joyner-Halenda (BJH) algorithm,
respectively.8
Thermogravimetric analysis
Thermal analysis of solids provides important information about the temperature-dependent
properties (heat capacity, thermal stability) of materials and thermally induced processes
(dehydration, dehydroxylation, deammoniation, phase transitions, crystal collapse, oxidation,
or reduction of lattice constituents). Thermogravimetry (TG) allows to register the change in
the weight of a sample as a function of temperature or of time in the case of isothermal
measurements. The measurements can be conducted under inert or reactive gases or in vacuum
and at wide temperature range with a constant heating rate or using different non-linear

36
temperature programs. The derivative thermogravimetry (DTG) indicates the rate of the mass
loss (dm/dt). Differential thermal analysis (DTA) is based on the measurement of the
temperature difference, ∆T, between the sample and an inert material (reference) during a
temperature program. In combination with other technics, TG and DTA may be successfully
used to obtain the information on (i) the formation of coke during catalytic processes; (ii) the
decomposition behavior of organic guest molecules introduced by adsorption and template
molecules occluded during the synthesis in the channel system of zeolites; (iii) the dehydration
behavior.166
The typical TGA/DTA measurement was performed as follows: 10 – 30 mg of sample was
introduced in an alumina crucible loaded in the analyzer chamber of a SETSYS 1750 CS
evolution instrument (SETARAM). The sample was heated from 30°C to 800°C with a heating
ramp of 5°C/min under air (flow rate: 40 mL/min).
Dynamic light scattering
Dynamic Light Scattering (DLS), also known as photon correlation spectroscopy, is the
method which utilizes Brownian motion to measure the size of the particles. The velocity
of the dispersed particles is related to the fluctuations in the total intensity of the scattered
light caused by their Brownian motion, since the smaller particles move more rapidly that
large ones.167
In the following experiments, the particle size distribution (PSD) was determined using a
Malvern Zetasizer Nano instrument (scattering angle of 173º, laser wavelength of 632.8 nm,
output power of 3 mW). Prior to sample measurement, the samples were repeatedly diluted
with doubly distilled water and sonicated prior to the measurements.
Elemental analysis
In general, atomic emission spectroscopy, or optical emission spectroscopy (OES), implicates
an elemental analysis, based on registration of the radiation emitted by their atoms present in

37
an excited state after ionization. To convert a sample to free atoms, excited or ionized, various
procedures are employed based upon gas plasmas, sparks, lasers or glow discharges. The most
common instruments for OES contain a plasma torch (inductivelycoupled plasma – ICP) that
can reach temperatures of up to 8000 K. ICP-OES is the most widely used technique for the
determination of the elemental composition of zeolites due to the possibility of the
simultaneous determination, with good sensitivity and precision, of most compositional matrix
elements of interest, for example silicon, aluminum, phosphorous, titanium, and many others.
In ICP-OES atomic vapor is generated from an aqueous sample by plasma as the atomization
and excitation source. Each of the elements emits light at the characteristic wavelengths in the
ultraviolet or visible region. The concentration of specific element is proportional to the
emission intensities in the analyzed sample and can be found by comparison with calibration
curve.168
For all measurements in this study, the elements concentration (e.g. Al, Si, Na, K, Cu etc.) in
aqueous solution was performed by inductively coupled plasma-optical emission spectroscopy
using an OPTIMA 4300 DV (Perkin–Elmer) instrument. The sample solutions were prepared
according to the following procedure: (i) 50 mg of powder was dissolved in 3 ml of
hydrofluoric acid (HF) (Sigma Aldrich 40-45 %), then (ii) 0.5 ml of mixture (HNO3 : HCl ≡1:3
v/v) was added and heated at 100°C for 1 h in polytetrafluoroethylene (PTFE) bottle, and (iii)
finally 10 ml of double deionized water and 2.8 g of boric acid (H3BO3) were added. The
resulted solution was transferred to PTFE volumetric flask (100 mL) and diluted with double
deionized water to 100 ml, and shacked until full dissolution of the sample.
Electron microscopy
Electron microscopy is a powerful tool for structural characterization of porous materials,
because it provides a direct observation of catalyst morphology with a magnification tunable
in the range 10−4 – 10−10 m. There are many different electron microscopy techniques available,

38
such as scanning electron microscopy (SEM), electron diffraction (ED), transmission electron
microscopy (TEM), and scanning transmission electron microscopy (STEM). In addition, an
energy-dispersive X-ray spectroscopy (EDS) device attached to an electron microscope can
provide the chemical information of the sample. Accurate data on the shape, size and spatial
arrangement of particles of supports and active phases can be obtained. Structural information
such as symmetry and unit cell parameters of crystallites, crystal orientations and lattice defects
can also be obtained by electron diffraction and lattice imaging techniques.169
The advantage of using electrons as ionizing radiation is that it produces a wide range of
secondary signals from the specimen that can provide additional information about the
specimen. Some of the secondary signals are shown in the Figure 4.170,171
Figure 4 Signals generated when a high-energy beam of electrons interacts with a thin specimen. The directions shown for each signal do not always represent the physical direction of the signal, but indicate, in a relative manner, where the signal is strongest or where it is detected (reprinted from [170])
a. Scanning electron microscopy
SEM is an important technique for the characterization of conventional zeolites and
mesoporous zeolites. SEM makes available the information on the size, morphology, and point
group symmetry of the crystals. With the development of low-voltage electron beam

39
configuration, mesopore openings on the surfaces of zeolite crystals can be directly observed
by SEM. By combining the appropriate sample preparation techniques such as cross-section
polisher using argon ion beam, SEM can also be used for studying the interior structure of the
crystals.171 SEM has some advantages over TEM as SEM has a larger depth of focus for the
determination of crystal morphology and fine surface structures so that surface topology can
be observed as different contrast in the image by a relatively simple experiment.8
For the SEM characterization in this study, small amounts of zeolite suspension or films were
placed on a specimen holder using double stick carbon tapes. To improve the electrical
conductivity of the sample, they were coated with platinum using CRESSINGTON 108 auto
evaporative coating machine. SEM micrographs were recorded with TESCAN Mira field-
emission scanning electron microscope operating at 15 – 30 kV.
b. Transmission electron microscopy
TEM is used for structural analysis of zeolites and mesoporous zeolite crystals at higher
resolution (up to atomic) as compared with SEM. High-resolution transmission electron
microscopy (HRTEM) images are related to the projected electrostatic potential of the
materials. Electrons can be focused by magnetic lenses, and thus HRTEM images can be
obtained. Both the amplitude and the phase information of the crystal structure can be extracted
from the HRTEM images and used to solve the structures of complex zeolite materials and
ordered mesoporous silica materials. The HRTEM images provide direct, intuitive
representation of the object in real space.171 The images are formed either with the unscattered,
transmitted electrons or the scattered electrons, resulting in bright- and dark-field images,
respectively. The point-to-point resolution depends mainly on the size of the electron probe.
The point-to-point resolution of bright field images is not as good as in TEM, but STEMs are
equipped with annular detectors that allow the efficient collection of electrons scattered at high
angles, thus allowing high-angle annular dark field (HAADF) imaging. It is important to know,

40
that porous materials are often very electron beam sensitive. That is why low electron doses
are employed to minimize the radiation damage; thus, the signal-to-noise ratio and resolution
of the obtained HRTEM images are usually very low.
The HRTEM and EDX studies were performed using a Tecnai G2 30 UT (LaB6) microscope
operated at 300 kV with 0.17 nm point resolution and equipped with a EDAX EDX detector.
Besides, the size and distribution of copper particles were studied by high angle annular dark
field (HAADF) scanning transmission electron microscopy (STEM). High angle annular dark
field and annular bright field (ABF) – scanning TEM studies were performed using a JEOL
ARM200F cold FEG double aberration corrected electron microscope operated at 200 kV and
equipped with a large solid-angle centurio EDX detector and Quantum EELS spectrometer.
X-ray photoelectron spectroscopy (XPS)
X-ray photoelectron spectroscopy (XPS) is one of the most widely used tools of surface
analysis of zeolites.172,173 X-ray photoelectron spectroscopy is a technique whereby a beam of
monoenergetic X-ray photons interacts with the atoms of a solid.
In addition to the valence electrons, each atom present in the surface (except H2 and He)
possesses core electrons not directly involved in the bonding. The so-called 'binding energy'
(Eb) of each core electron is characteristic of the individual atom to which it is bound. In the
basic XPS experiment, the sample surface is irradiated by a source of low-energy X-rays under
ultra-high vacuum. Photoionization then takes place in the sample surface (depth of analysis
between 1.5 and 6nm). The resultant photo-electrons have a kinetic energy (Ek) in the range of
20 to 2000 eV.172,173
If the collided atom lies too deep below the surface, all emitted photoelectrons will undergo
inelastic collisions with other atoms before they can exit from the solid. By contrast if the atom
is located within a short distance from the surface, the extracted photoelectrons have a non-
zero probability to leave the solid without having experienced a collision.172

41
Figure 5 Photoemission (XPS) and the Auger process; adapted from [14]
The left side of the Figure 5 exhibits an absorbed incident X-ray photon and an emitted
photoelectron. Measurement of its kinetic energy allows one to calculate the binding energy of
the photoelectron. The atom stays behind as an unstable ion with a hole in one of the core
levels. On the right, the excited ion relaxes by filling the core hole with an electron from a
higher shell. The energy released by this transition is taken up by another electron, the Auger
electron, which leaves the samples with an element-specific kinetic energy.173
Solid-state nuclear magnetic resonance (MAS NMR) spectroscopy
Solid-state NMR is a complementary technique to XRD, since XRD provides information
about the long-range ordering and periodicities, while NMR allows investigations on the short-
range ordering and structure. During recent years, several techniques have been developed for
averaging chemical shift anisotropy (CSA), dipolar and quadrupolar interactions which lead to
excessive line broadening to zero, or reduce them to the isotropic values, allowing the
registration of high-resolution NMR spectra of solids. Depending on the nuclear spin I
responsible for the magnetic dipole moment, different line narrowing techniques are required
to reach highly resolved solid-state NMR spectra of zeolites. In the case of spin I = 1/2, the
application of the conventional magic angle spinning (MAS) technique leads to an averaging
of the most important nuclear interactions, such as anisotropic chemical shielding and dipolar

42
interactions. Isotopes with nuclear spin I > 1/2 are additionally characterized by an electric
quadrupole moment. These nuclei are involved in quadrupolar interactions and often require
more sophisticated solid- state NMR techniques, such as high-field MAS NMR, double-
oriented rotation (DOR), and multiple-quantum MAS (MQMAS) NMR spectroscopy.
All the relevant basic nuclei contributing to the framework of zeolites and AIPO4 molecular
sieves can be detected in NMR by their natural isotopes: 29Si, 27Al, 31P and 17O. Both 27Al and
31P spectra are easily detected within reasonable time, however, 27Al has a quadrupole moment
which can cause line broadening due to interaction with the electric field gradient.
Investigations of 17O NMR can be done by using enriched material, since the natural abundance
is low. 29Si chemical shift is sensitive to the number and type of tetrahedrally coordinated atoms
connected to a given SiO4 unit Si (n Al), with n = 0, 1, 2, 3 or 4, where n indicates the number
of Al atoms sharing oxygens with the SiO4 tetrahedron. Differences in chemical shifts between
Si (n Al) and Si (n+1 Al) are about 5-6 ppm. Furthermore, 29Si MAS NMR spectra can be used
to calculate the framework Si / Al ratio from the NMR signal intensities. 27Al NMR spectra
reveal the existence of extra-framework Al (about 0 ppm) besides the lattice aluminum
(tetrahedrally coordinated Al at about 40-65 ppm).
Solid-state 1H NMR of protons, OH groups, adsorbed water, organic sorbates and probe
molecules containing hydrogen in microporous and mesoporous molecular sieves has been
developed as a usable method for getting information about different kinds of hydrogens in
terminal or bridging OH groups, varying environments for hydrogen containing probe
molecules and acidity investigations as well. Other nuclei which can substitute the usual
framework elements in microporous and mesoporous materials can be probed by solid-state
NMR, for example, 11B, 73Ge and 69,7lGa. Also, some extra-framework cations, like 7Li, 23Na,
39K, 133Cs or 195Pt, are suitable for NMR measurements. However, most of those elements
possess a quadrupole moment which usually limits the application. 163,174,175

43
UV-visible spectroscopy
Ultraviolet–visible–near infrared spectroscopy (UV-VIS-NIR) covers the wavelength range
200–2500 nm or in wavenumbers 50 000–4000 cm-1. This range is usually divided in three
regions: UV: 200–400 nm or 50 000–25 000 cm-1
VIS: 400–800 nm or 25 000–12 500 cm-1
NIR: 800–2500 nm or 12 500–4000 cm-1
The application of UV-VIS-NIR spectroscopy in research on heterogeneous catalysts is related
to the study of transitionmetal ions, rare earth metal ions, adsorbed molecules, molecular ions
and radicals; and the support, which can be amorphous metal oxides with a high surface area
or porous crystalline materials such as zeolites and mesoporous materials. The electronic
transitions that may be involved in UV-VIS-NIR spectroscopy are summarized in Table 2.176
Table 2 Electronic transitions probed in heterogeneous catalysts
Center Transition
Transition metal ion D–d, metal-to-ligand charge transfer; ligand-to-metal charge transfer
Rare earth ion F–f, f–d
Molecules, radicals, molecular ions N-p*; p-p*
Support Band gap, impurities, defects
UV–vis spectroscopy is one of the primary methods to verify framework substitution of
transition metal cations into zeolites. The coordination or valence of the ion must be unique to
the framework species and different from extra-framework species. The valence and
coordination of transition metals introduced into zeolites via ion exchange can be evaluated be
UV–vis as well. Typically, changes in coordination, for instance, through hydration and
dehydration, can be observed. Moreover, through the adsorption of suitable molecules, the
location and mobility of the ions may be probed.

44
To quantify the concentrations of an absorbing species in solution the Beer-Lambert law is
used where the amount of light absorbed is proportional to the number of absorbing molecules
through which the light passes.165,168
In this study, the kinetics of copper nanoparticles growth was followed by in-situ UV-Vis
spectroscopy. Electronic absorption spectra of diluted suspensions were recorded on a Varian
Cary 4000 UV-Vis-NIR spectrometer. The measurements were performed in absorbance mode.
Also, the UV-vis spectra of the self-supported pellets of the copper-containing samples were
recorded in diffuse reflectance mode.
Electron paramagnetic resonance (EPR)
Using electron paramagnetic resonance (EPR) in principle can be used to observe any species
containing one or more unpaired electrons. For zeolites, this covers paramagnetic transition
metal or rare earth ions, solid state defects which are paramagnetic, and inorganic or organic
radicals. This sensitivity of the method imposes the need for caution in interpreting weak
signals, which can be caused by trace level impurities irrelevant to the chemistry being
studied.177
Continuous wave CW-EPR spectra were recorded at the X band (9.5 GHz) with a Bruker
ELEXSYS E500 spectrometer equipped with a high-sensitivity 4122SHQE/0111 microwave
cavity and with helium flow cryostat for low temperature measurements.
Fourier transformed infrared spectroscopy (FTIR)
FTIR spectroscopy is one of the most adapted tools for extensive characterization of the
catalysts active sites, being extremely sensitive to the molecular vibrations and able to
discriminate the different geometrical distortions of the molecules according to the adsorption
state on a site. The region of interest is mid-IR region, which covers the range of the
electromagnetic spectrum from 25 to 2.5 mm, that is, in wavenumber terms, from 400 to 4000
cm–1. The frequency of the radiation is denoted by ν, and the wavelength is λ=c/ν.

45
The best way to identify the potential active sites by IR spectroscopy is the direct recognition
of their IR fingerprint. If direct detection is not possible, the adsorption of probe molecules,
which provides IR spectra specific to the interaction with a single site can be employed, as the
most common the most used technique. However, it should be stressed that any probe molecule
generates a perturbation of the surface of the catalysts: indirect perturbations such as electron
withdrawing effect, or direct perturbations like chemical reactions (protonation, electron
transfer, decomposition etc.). It this case, the best way is to use the molecule that acts as a
reactant during the chosen catalytic reaction. 178
The easiest way to measure the IR spectrum of a solid is to place the powder as a suspension
in a neutral oil (Nujol) or to disperse it (0.5–1%) in potassium bromide (KBr). The resulting
powder is pressed form a pellet and placed directly in the IR beam. Such a method cannot be
used for characterizing the surface properties of catalysts (e.g., with probe molecule adsorption
studies), but can provide interesting information about the structure of the materials.165
a. In situ FTIR spectroscopy
Studies of adsorption and catalytic reactions on catalytic surfaces exposed to gas-phase
mixtures are the most common. To address surface characterization under more realistic
catalytic conditions, IR spectroscopic studies can be performed in situ, under conditions
resembling those encountered in catalysis. Characterization work on surface properties is
performed in the transmission mode. This is generally done with a self-supporting wafer of the
pure solid, that is, without any KBr matrix that would contaminate the surface and introduce
external ions. This wafer must be very thin (in this study all pellets are 20 mg) so that it remains
IR transparent, and must only be pressed very gently, so that neither gas diffusion nor the
structure of the solid are perturbed.165,179

46
Figure 6 In situ FTIR set-up
Prior to all in situ FTIR measurement, the solid materials were grinded and pressed into self-
supported thin pellets with the mass of 20 mg.
To study CO and NO adsorption, the disks were placed in a standard LCS in-situ FTIR set-up
(Figure 6) pretreated under vacuum (~10-6 Torr) or under chosen atmosphere (H2, O2) at 673
(723) K for 5 hours with ramp of 1.3 K/min. After cooling down to room temperature, the
spectrum of the surface was recorded for further use as a reference at room temperature. After,
the cell was cooled down to 100 K with liquid nitrogen, the spectrum of the surface was then
again collected to be used as a reference at 100 K. The small doses of gas were gradually
introduced in the cell at 100K and the spectra were recorded. In the end, the equilibrium
pressure of gas was introduced in the cell to collect the spectrum, then the desorption under
vacuum at 100K and at RT was performed.
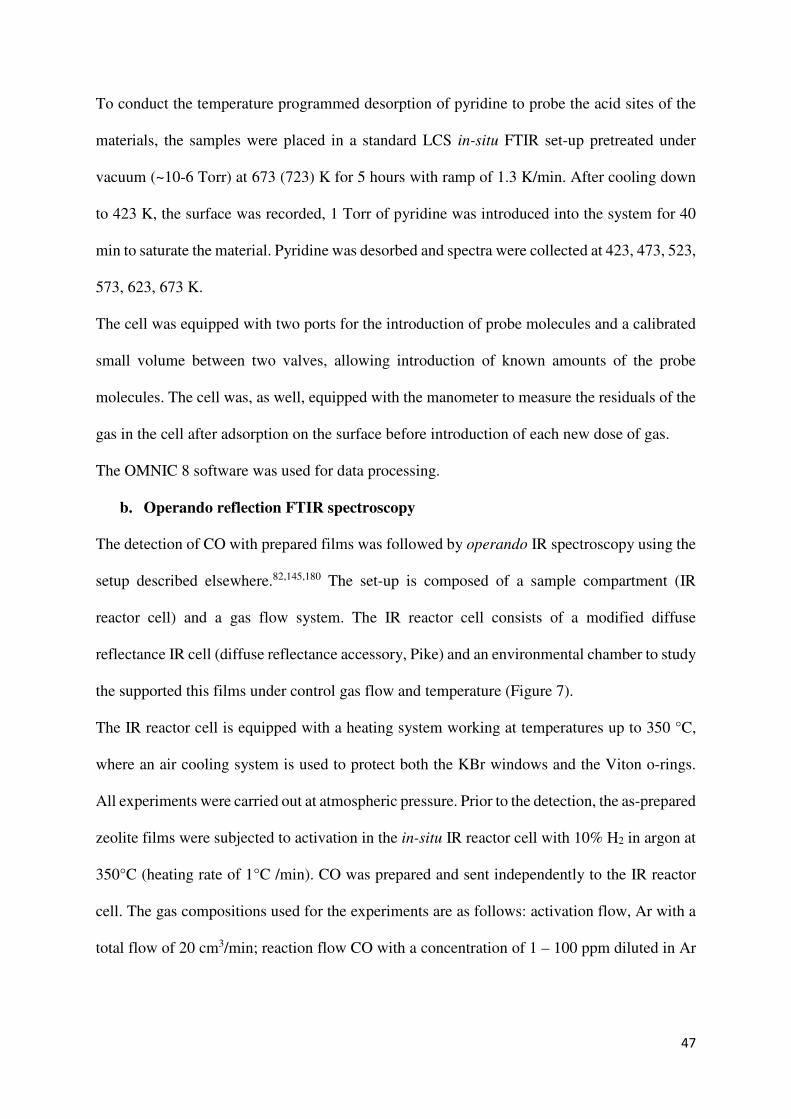
47
To conduct the temperature programmed desorption of pyridine to probe the acid sites of the
materials, the samples were placed in a standard LCS in-situ FTIR set-up pretreated under
vacuum (~10-6 Torr) at 673 (723) K for 5 hours with ramp of 1.3 K/min. After cooling down
to 423 K, the surface was recorded, 1 Torr of pyridine was introduced into the system for 40
min to saturate the material. Pyridine was desorbed and spectra were collected at 423, 473, 523,
573, 623, 673 K.
The cell was equipped with two ports for the introduction of probe molecules and a calibrated
small volume between two valves, allowing introduction of known amounts of the probe
molecules. The cell was, as well, equipped with the manometer to measure the residuals of the
gas in the cell after adsorption on the surface before introduction of each new dose of gas.
The OMNIC 8 software was used for data processing.
b. Operando reflection FTIR spectroscopy
The detection of CO with prepared films was followed by operando IR spectroscopy using the
setup described elsewhere.82,145,180 The set-up is composed of a sample compartment (IR
reactor cell) and a gas flow system. The IR reactor cell consists of a modified diffuse
reflectance IR cell (diffuse reflectance accessory, Pike) and an environmental chamber to study
the supported this films under control gas flow and temperature (Figure 7).
The IR reactor cell is equipped with a heating system working at temperatures up to 350 °C,
where an air cooling system is used to protect both the KBr windows and the Viton o-rings.
All experiments were carried out at atmospheric pressure. Prior to the detection, the as-prepared
zeolite films were subjected to activation in the in-situ IR reactor cell with 10% H2 in argon at
350°C (heating rate of 1°C /min). CO was prepared and sent independently to the IR reactor
cell. The gas compositions used for the experiments are as follows: activation flow, Ar with a
total flow of 20 cm3/min; reaction flow CO with a concentration of 1 – 100 ppm diluted in Ar
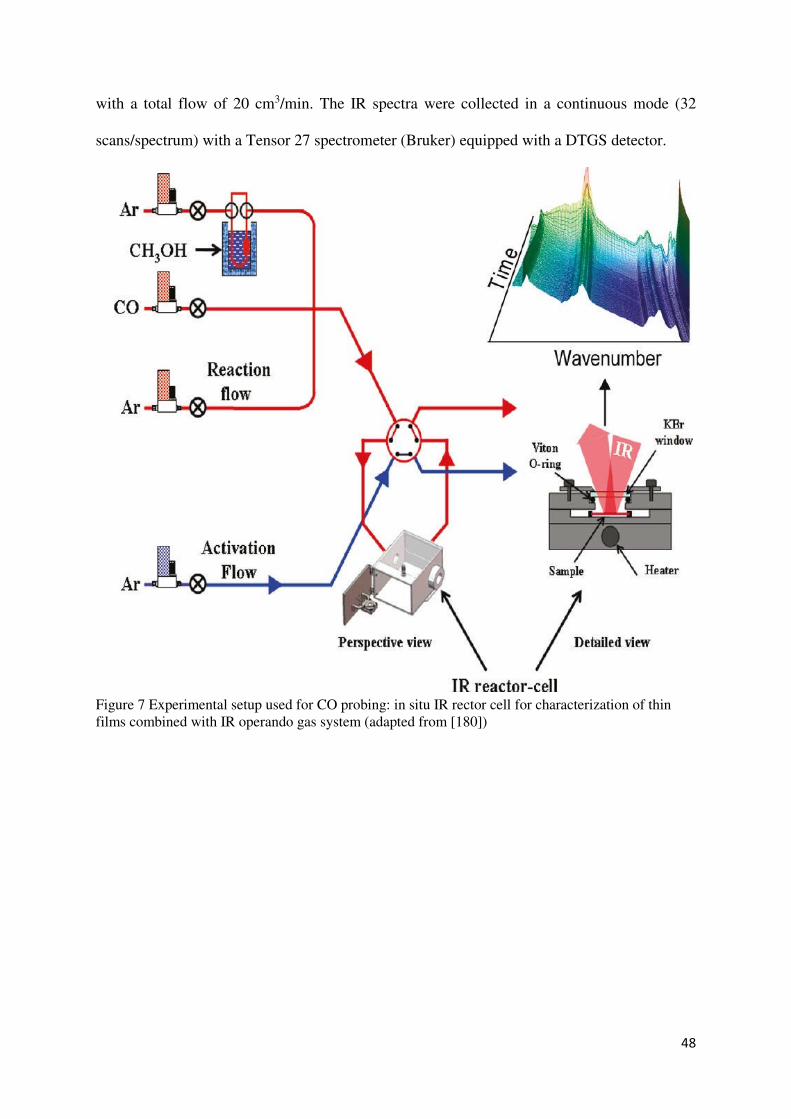
48
with a total flow of 20 cm3/min. The IR spectra were collected in a continuous mode (32
scans/spectrum) with a Tensor 27 spectrometer (Bruker) equipped with a DTGS detector.
Figure 7 Experimental setup used for CO probing: in situ IR rector cell for characterization of thin films combined with IR operando gas system (adapted from [180])

49
References
1 A. Steinfeld, C.- Zurich and R. Palumbo, Encycl. Phys. Sci. Technol., 2001, 15, 237–256.
2 S. Licht, Chem. Commun. (Camb)., 2005, 2005, 4635–4646.3 R. R. Conry, Encycl. Inorg. Chem., 2006, 1–19.4 M. B. Gawande, A. Goswami, F.-X. Felpin, T. Asefa, X. Huang, R. Silva, X. Zou, R.
Zboril and R. S. Varma, Chem. Rev., 2016, 116, 3722–3811.5 C. Martínez and A. Corma, Compr. Inorg. Chem. II, 2013, 103–131.6 J. Cejka, A. Corma and S. Zones, Eds., Zeolites and Catalysis. Synthesis, Reactions
and Applications, Wiley-VCH Verlag GmbH & Co. KGaA., 2010.7 J. Weitkamp and L. Puppe, Eds., Catalysis and Zeolites. Fundamentals and
Applications, Springer-Verlag Berlin Heidelberg, 1st editio., 1999.8 J. Cejka, H. van Bekkum, A. Corma and F. Schueth, Introduction to Zeolite Science
and Practice- 3rd Revised Edition, Elsevier, 3rd editio., 2007.9 P. Eliášová, M. Opanasenko, P. S. Wheatley, M. Shamzhy, M. Mazur, P. Nachtigall,
W. J. Roth, R. E. Morris and J. Čejka, Chem. Soc. Rev., 2015.10 A. Primo and H. Garcia, Chem. Soc. Rev., 2014, 43, 7548–7561.11 S. M. Auerbach, K. A. Carrado and P. K. Dutta, Handbook of zeolite science and
technology, CRC Press, 2004, vol. 2004. 12 J. Weitkamp, Solid State Ionics, 2000, 131, 175–188.13 C. Martinez and J. Perez-Pariente, Eds., Structural Chemistry and Properties of
Zeolites, 1st edn., 2011. 14 P. Payra and P. K. Dutta, in Handbook of Zeolite Science and Technology, 2003.15 Catalysis and Zeolites, 1999. 16 D. H. Everett, Pure Appl. Chem., 1973.17 C. Baerlocher, L. McCusker and D. Olson, Atlas of zeolite framework types, 2007, vol.
12. 18 J. Li, A. Corma and J. Yu, Chem. Soc. Rev., 2015.19 C. S. Cundy and P. a Cox, 2003, 103, 663–702.20 G. Perego, G. Bellusi, C. Corno, M. Taramasso, F. Buonomo and A. Esposito, Stud.
Surf. Sci. Catal., 1986, 28, 129–136. 21 G. Bellussi and M. S. Rigutto, in Advanced Zeolite Science and Applications, eds. J.C.
Jansen, M. Stocker, H. G. Karge and J. Weitkamp, Elsevier B.V, 1994, vol. 85, pp. 177–213.
22 K. G. Ione, L. A. Vostrikova and V. M. Mastikhin, J. Mol. Catal., 1985, 31, 355–370.23 K. G. Ione and L. A. Vostrikova, Russ. Chem. Rev., 1987, 56, 393–427.24 B. Sulikowski, Heterog. Chem. Rev., 1996, 3, 203–268.25 G. Coudurier, A. Auroux, J. C. Vedrine, R. D. Farlee, L. Abrams and R. D. Shannon,
J. Catal., 1987, 108, 1–14.26 S. Bordiga, A. Damin, F. Bonino, G. Ricchiardi, C. Lamberti and A. Zecchina, Angew.
Chemie - Int. Ed., 2002, 41, 4734–4737. 27 G. Ricchiardi, A. Damin, S. Bordiga, C. Lamberti, G. Spanò, F. Rivetti and A.
Zecchina, J. Am. Chem. Soc., 2001, 123, 11409–11419. 28 R. Millini, E. Previde Massara, G. Perego and G. Bellussi, J. Catal., 1992, 137, 497–
503. 29 G. Tozzola, M. a. Mantegazza, G. Ranghino, G. Petrini, S. Bordiga, G. Ricchiardi, C.
Lamberti, R. Zulian and A. Zecchina, J. Catal., 1998, 179, 64–71. 30 C. Lamberti, S. Bordiga, A. Zecchina, A. Carati, N. N. Fitch, G. Artioli, G. Petrini, M.
Salvalaggio and G. L. L. Marra, J. Catal., 1999, 183, 222–231.

50
31 S. Bordiga, F. Boscherini, S. Coluccia, F. Genonic, C. Lamberti, G. Leofanti, L.Marchese, G. Petrini, G. Vlaic and A. Zecchina, Catal. Letters, 1994, 26, 195–208.
32 R. Fricke, H. Kosslick, G. Lischke and M. Richter, Chem. Rev., 2000, 100, 2303–2405.33 C. Lamberti, G. T. Palomino, S. Bordiga, A. Zecchina and G. Span, Science (80-. ).,
1999, 63, 213–216. 34 C. Otero Areán, G. Turnes Palomino, F. Geobaldo and a. Zecchina, J. Phys. Chem.,
1996, 100, 6678–6690. 35 X. Liu and J. Klinowski, J. Phys. Chem., 1992, 311, 3403–3408.36 C. R. Bayense, A. P. M. Kentgens, J. W. De Haan, L. J. M. Van de Ven and J. H. C.
Van Hooff, J. Phys. Chem., 1992, 96, 775–782. 37 G. Berlier, G. Spoto, S. Bordiga, G. Ricchiardi, P. Fisicaro, A. Zecchina, I. Rossetti, E.
Selli, L. Forni, E. Giamello and C. Lamberti, J. Catal., 2002, 208, 64–82. 38 S. Bordiga, R. Buzzoni, F. Geobaldo, C. Lamberti, E. Giamello, A. Zecchina, G.
Leofanti, G. Petrini, G. Tozzola and G. Vlaic, J. Catal., 1996, 158, 486–501. 39 A. Zecchina, F. Geobaldo, C. Lamberti, S. Bordiga, G. Turnes Palomino and C. Otero
Arean, Catal. Letters, 1996, 42, 25–33. 40 R. Szostak and T. L. Thomas, J. Catal., 1986, 100, 555–557.41 R. Kumar and P. Ratnasamy, J. Catal., 1990, 121, 89–98.42 S. N. Talapaneni, J. Grand, S. Thomas, H. A. Ahmad and S. Mintova, Mater. Des.,
2016, 99, 574–580. 43 S. Tolborg, A. Katerinopoulou, D. D. Falcone, I. Sádaba, C. M. Osmundsen, R. J.
Davis, E. Taarning, P. Fristrup and M. S. Holm, J. Mater. Chem. A, 2014, 2, 20252–20262.
44 T. Iida, A. Takagaki, S. Kohara, T. Okubo and T. Wakihara, ChemNanoMat, 2015, 1,155–158.
45 H. Y. Luo, L. Bui, W. R. Gunther, E. Min and Y. Román-Leshkov, ACS Catal., 2012,2, 2695–2699.
46 W. R. Gunther, Y. Wang, Y. Ji, V. K. Michaelis, S. T. Hunt, R. G. Griffin and Y.Román-Leshkov, Nat. Commun., 2012, 3, 1109.
47 S. Roy, K. Bakhmutsky, E. Mahmoud, R. F. Lobo and R. J. Gorte, ACS Catal., 2013,3, 573–580.
48 A. Corma, L. T. Nemeth, M. Renz and S. Valencia, Nature, 2001, 412, 423–425.49 R. Szostak, Molecular Sieves. Principles of Synthesis and Identification, 1988.50 R. Aiello, J. B. Nagy, G. Giordano, A. Katovic and F. Testa, Comptes Rendus Chim.,
2005, 8, 321–329. 51 V. Valtchev and L. Tosheva, Chem. Rev., 2013, 113, 6734–6760.52 S. Mintova and E.-P. Ng, in Comprehensive Inorganic Chemistry II: From Elements to
Applications, 2013, vol. 5, pp. 285–302. 53 S. C. Larsen, J. Phys. Chem. C, 2007, 111, 18464–18474.54 S. Mintova, J. Grand and V. Valtchev, Comptes Rendus Chim., 2016, 19, 183–191.55 M. Zaarour, B. Dong, I. Naydenova, R. Retoux and S. Mintova, Microporous
Mesoporous Mater., 2014, 189, 11–21. 56 S. Mintova, M. Jaber and V. Valtchev, Chem. Soc. Rev., 2015, 44, 7207–7233.57 C. Madsen, C. Madsen and C. J. H. Jacobsen, Chem. Commun., 1999, 673–674.58 Y. Pan, M. Ju, J. Yao, L. Zhang and N. Xu, Chem. Commun. (Camb)., 2009, 7233–5.59 C. Jo, J. Jung, H. S. Shin, J. Kim and R. Ryoo, Angew. Chemie - Int. Ed., 2013, 52,
10014–10017. 60 S. Askari, S. Miar Alipour, R. Halladj and M. H. Davood Abadi Farahani, J. Porous
Mater., 2012, 20, 285–302. 61 J. Gascon, F. Kapteijn, B. Zornoza, V. Sebastián, C. Casado and J. Coronas, Chem.

51
Mater., 2012, 24, 2829–2844. 62 N. Kosinov, V. G. P. Sripathi and E. J. M. Hensen, Microporous Mesoporous Mater.,
2014, 194, 24–30. 63 N. Kosinov, C. Auffret, V. G. P. Sripathi, C. Gücüyener, J. Gascon, F. Kapteijn and E.
J. M. Hensen, Microporous Mesoporous Mater., 2014, 197, 268–277.64 D. W. Breck, J. Chem. Educ., 1964, 41, 678–689.65 K. Li, J. Valla and J. Garcia-Martinez, ChemCatChem, 2014, 6, 46–66.66 I. Fechete, Y. Wang and J. C. V??drine, Catal. Today, 2012, 189, 2–27.67 R. Moos, Sensors, 2010, 10, 6773–6787.68 T. Bein and S. Mintova, Zeolites and Ordered Mesoporous Materials: Progress and
Prospects, Elsevier, 2005, vol. 157. 69 S. Mintova and T. Bein, Microporous Mesoporous Mater., 2001, 50, 159–166.70 Y. Zheng, X. Li and P. K. Dutta, Sensors, 2012, 12, 5170–5194.71 T. Baimpos, L. Gora, V. Nikolakis and D. Kouzoudis, Sensors Actuators A Phys.,
2012, 186, 21–31. 72 D. J. Wales, J. Grand, V. P. Ting, R. D. Burke, K. J. Edler, C. R. Bowen, S. Mintova
and A. D. Burrows, Chem. Soc. Rev., 2015. 73 M. Vilaseca, J. Coronas, A. Cirera, A. Cornet, J. R. Morante and J. Santamarıa, Catal.
Today, 2003, 82, 179–185. 74 K. Sahner, G. Hagen, D. Schönauer, S. Reiß and R. Moos, Solid State Ionics, 2008,
179, 2416–2423. 75 C. M. Lew, R. Cai and Y. Yan, Acc. Chem. Res., 2010, 43, 210–219.76 M. Moothanchery, I. Naydenova, S. Mintova and V. Toal, Opt. Express, 2011, 19,
25786–25791. 77 US pat., 20090130154 A1, 2009. 78 S. E. Lehman and S. C. Larsen, Environ. Sci. Nano, 2014, 1, 200–213.79 N. Tirtaatmadja, G. Mortimer, E.-P. Ng, H. A. Ahmad, S. Mintova, V. Serpooshan, R.
F. Minchin and M. Mahmoudi, J. Iran. Chem. Soc., 2014, 12, 317–323.80 A. Petushkov, J. Intra, J. B. Graham, S. C. Larsen and A. K. Salem, Chem. Res.
Toxicol., 2009, 22, 1359–1368. 81 J. A. Litch and R. A. Bishop, Wilderness Environ. Med., 2000, 11, 189–191.82 T. Babeva, H. Awala, M. Vasileva, J. El Fallah, K. Lazarova, S. Thomas and S.
Mintova, Dalton Trans., 2014, 43, 8868–8876. 83 E. Leite, T. Babeva, E. P. Ng, V. Toal, S. Mintova and I. Naydenova, J. Phys. Chem.
C, 2010, 114, 16767–16775. 84 A. Seidel, J. Loos and B. Boddenberg, J. Mater. Chem., 1999, 2495–2498.85 V. Gurin and V. Petranovskii, Stud. Surf. Sci. Catal., 2004, 154, 1661–1669.86 V. S. Gurin, V. P. Petranovskii, M. -a. Hernandez, N. E. Bogdanchikova and a. a.
Alexeenko, Mater. Sci. Eng. A, 2005, 391, 71–76. 87 A. Kharchenko, O. I. Lebedev, V. Zholobenko, V. de Waele and S. Mintova, J. Phys.
Chem. C, 2016, acs.jpcc.6b08045. 88 K.-L. Wong, A. Souici, V. De Waele, M. Mostafavi, T. H. Metzger and S. Mintova,
Langmuir, 2010, 26, 4459–64. 89 M. Zahmakıran, F. Durap and S. Özkar, Int. J. Hydrogen Energy, 2010, 35, 187–197.90 V. De Waele, J. Kecht, Z. Tahri, M. Mostafavi, T. Bein and S. Mintova, Sensors
Actuators B Chem., 2007, 126, 338–343. 91 J. Kecht, Z. Tahri, V. De Waele, M. Mostafavi, S. Mintova and T. Bein, Chem. Mater.,
2006, 18, 3373–3380. 92 M. Severance and P. K. Dutta, J. Phys. Chem. C, 2014, 118, 28580–28591.93 D. Farrusseng and A. Tuel, New J. Chem., 2016.

52
94 F. Zaera, Chem. Soc. Rev., 2013, 2, 2746–2762.95 G. Evano, N. Blanchard and M. Toumi, Chem. Rev., 2008, 108, 3054–3131.96 Y. Lu and W. Chen, Chem. Soc. Rev., 2012, 41, 3594–623.97 N. Cioffi, N. Ditaranto, L. Torsi and L. Sabbatini, Approaches to synthesis and
characterization of spherical and anisotropic copper nanomaterials, 2009. 98 P. Christian, F. Von Der Kammer, M. Baalousha and T. Hofmann, Ecotoxicology,
2008, 17, 326–343. 99 Y. Xia and N. J. Halas, MRS Bull., 2011, 30, 338–348.100 R. V. Kumar, Y. Mastai, Y. Diamant and a. Gedanken, J. Mater. Chem., 2001, 11,
1209–1213. 101 J. Moghimi-Rad, F. Zabihi, I. Hadi, S. Ebrahimi, T. D. Isfahani and J. Sabbaghzadeh,
J. Mater. Sci., 2010, 45, 3804–3811.102 M. Veerapandian, R. Subbiah, G. S. Lim, S. H. Park, K. Yun and M. H. Lee,
Langmuir, 2011, 27, 8934–8942. 103 B. K. Park, S. Jeong, D. Kim, J. Moon, S. Lim and J. S. Kim, J. Colloid Interface Sci.,
2007, 311, 417–424. 104 M. Blosi, S. Albonetti, M. Dondi, C. Martelli and G. Baldi, J. Nanoparticle Res., 2011,
13, 127–138. 105 S. S. Jushi, S. F. Patil, V. Iyer and S. Mahumuni, NanoStructured Mater., 1998, 10,
1135–1144. 106 J. Ryu, H.-S. Kim and H. T. Hahn, J. Electron. Mater., 2011, 40, 42–50.107 I. Lisiecki and M. P. Pileni, J. Am. Chem. Soc., 1993, 115, 3887–3896.108 M. P. Pileni, B. W. Ninham, T. Gulik-Krzywicki, J. Tanori, I. Lisiecki and a
Filankembo, Adv. Mater., 1999, 11, 1358–1362. 109 Y. G. Guo, J. S. Hu and L. J. Wan, Adv. Mater., 2008, 20, 2878–2887.110 G.-R. Li, H. Xu, X.-F. Lu, J.-X. Feng, Y.-X. Tong and C.-Y. Su, Nanoscale, 2013, 1–
35. 111 A. S. Arico, P. Bruce, B. Scrosati and J.-M. Arascon, Nature, 2005, 4, 366–377.112 T. M. D. Dang, T. T. T. Le, E. Fribourg-Blanc and M. C. Dang, Adv. Nat. Sci.
Nanosci. Nanotechnol., 2011, 2, 15009. 113 D. Deng, Y. Jin, Y. Cheng, T. Qi and F. Xiao, 2013.114 Y. Kobayashi, S. Ishida, K. Ihara, Y. Yasuda, T. Morita and S. Yamada, Colloid
Polym. Sci., 2009, 287, 877–880. 115 S. Mallick, S. Sharma, M. Banerjee, S. S. Ghosh, A. Chattopadhyay and A. Paul, ACS
Appl. Mater. Interfaces, 2012, 4, 1313–1323. 116 J. E. Mondloch, E. Bayram and R. G. Finke, J. Mol. Catal. A Chem., 2012, 355, 1–38.117 A. Souici, K.-L. Wong, V. De Waele, J. L. Marignier, T. H. Metzger, N. Keghouche,
S. Mintova and M. Mostafavi, J. Phys. Chem. C, 2014, 118, 6324–6334.118 S. a. Anderson, S. Manthata and T. W. Root, Appl. Catal. A Gen., 2005, 280, 117–124.119 W. X. Zhang, H. Yahiro, N. Mizuno, J. Izumi and M. Iwamoto, Langmuir, 1993, 9,
2337–2343. 120 M. Iwamoto, Stud. Surf. Sci. Catal., 1991, 327–334.121 C. Torre-Abreu, C. Henriques, F. . Ribeiro, G. Delahay and M. . Ribeiro, Catal. Today,
1999, 54, 407–418. 122 N. V. Beznis, B. M. Weckhuysen and J. H. Bitter, Catal. Letters, 2010, 138, 14–22.123 G. D. Pirngruber, Ordered Porous Solids, 2009, 749–771.124 F. Márquez, a. E. Palomares, F. Rey and a. Corma, J. Mater. Chem., 2001, 11, 1675–
1680. 125 S. Chassaing, A. Sani Souna Sido, A. Alix, M. Kumarraja, P. Pale and J. Sommer,
Chem. - A Eur. J., 2008, 14, 6713–6721.

53
126 W. Zhang, J. Xie, W. Hou, Y. Liu, Y. Zhou and J. Wang, 2016.127 Z. Tahri, F. Luchez, I. Yordanov, O. Poizat, A. Moissette, V. Valtchev, S. Mintova, M.
Mostafavi and V. De Waele, Res. Chem. Intermed., 2009, 35, 379–388. 128 M. Zaarour, M. El Roz, B. Dong, R. Retoux, R. Aad, J. Cardin, C. Dufour, F.
Gourbilleau, J.-P. Gilson and S. Mintova, Langmuir, 2014, 30, 6250–6. 129 B. Dong, R. Retoux, V. de Waele, S. G. Chiodo, T. Mineva, J. Cardin and S. Mintova,
Microporous Mesoporous Mater., 2017. 130 R. Bartolomeu, R. Bértolo, S. Casale, A. Fernandes, C. Henriques, P. Da Costa and F.
Ribeiro, Microporous Mesoporous Mater., 2013, 169, 137–147. 131 T. Subramanian and K. Pitchumani, Catal. Sci. Technol., 2012, 2, 296.132 A. N. Pestryakov, V. P. Petranovskii, A. Kryazhov, O. Ozhereliev, N. Pfänder and A.
Knop-Gericke, Chem. Phys. Lett., 2004, 385, 173–176. 133 A. Seidel, J. Loos and B. Boddenberg, J. Mater. Chem., 1999, 9, 2495–2498.134 L. Lakiss, J. Kecht, V. de Waele and S. Mintova, Superlattices Microstruct., 2008, 44,
617–625. 135 Y. Zeng, H. Walker and Q. Zhu, J. Hazard. Mater., 2016, 324, 605–616.136 K. T. Højholt, A. B. Laursen, S. Kegnæs and C. H. Christensen, Top. Catal., 2011, 54,
1026–1033. 137 T. Otto, J. M. Ramallo-L??pez, L. J. Giovanetti, F. G. Requejo, S. I. Zones and E.
Iglesia, J. Catal., 2016, 342, 125–137. 138 I. Yordanov and R. Knoerr, J. …, 2010, 20974–20982.139 X. Zou, K.-L. Wong, S. Thomas, T. H. Metzger, V. Valtchev and S. Mintova, Catal.
Today, 2011, 168, 140–146. 140 M. Rivallan, I. Yordanov, S. Thomas, C. Lancelot, S. Mintova and F. Thibault-
Starzyk, ChemCatChem, 2010, 2, 1074–1078. 141 M. Moliner, J. E. Gabay, C. E. Kliewer, R. T. Carr, J. Guzman, G. L. Casty, P. Serna
and A. Corma, J. Am. Chem. Soc., 2016, 354, jacs.6b10169. 142 J. Choi, S. Chan, G. Yip, H. Joo, H. Yang and F. K. Ko, Water Res., 2016, 101, 46–54.143 M. Zahmakiran, S. Akbayrak, T. Kodaira and S. Ozkar, Dalt. Trans., 2010, 39, 7521–
7527. 144 D. Laprune, C. Theodoridi, A. Tuel, D. Farrusseng and F. C. Meunier, Appl. Catal. B
Environ., 2017, 204, 515–524. 145 X. Zou, J.-M. Goupil, S. Thomas, F. Zhang, G. Zhu, V. Valtchev and S. Mintova, J.
Phys. Chem. C, 2012, 116, 16593–16600. 146 Y. Lee, J.-R. Choi, K. J. Lee, N. E. Stott and D. Kim, Nanotechnology, 2008, 19,
415604. 147 M. Kaya, M. Zahmakiran, S. Özkar and M. Volkan, ACS Appl. Mater. Interfaces,
2012, 4, 3866–3873. 148 A. P. Ingle, N. Duran and M. Rai, Appl. Microbiol. Biotechnol., 2014, 98, 1001–1009.149 X. Hu, J. Li and J. Wang, ECS Electrochem. Lett., 2014, 3, D13–D15.150 J. Ramyadevi, K. Jeyasubramanian, A. Marikani, G. Rajakumar and A. A. Rahuman,
Mater. Lett., 2012, 71, 114–116. 151 T. Tsoncheva, A. Gallo, I. Spassova, M. Dimitrov, I. Genova, M. Marelli, M.
Khristova, G. Atanasova, D. Kovacheva and V. Dal Santo, Appl. Catal. A Gen., 2013, 464–465, 243–252.
152 M. Vallet-Regí, F. Balas and D. Arcos, Angew. Chemie - Int. Ed., 2007, 46, 7548–7558.
153 N. T. K. Thanh, N. Maclean and S. Mahiddine, Chem. Rev., 2014, 114, 7610–7630.154 V. LaMer and R. Dinegar, J. Am. Chem. …, 1950, 72, 4847–4854.155 V. K. La Mer, Ind. Eng. Chem., 1952, 44, 1270–1277.

54
156 S. T. Gentry, S. F. Kendra and M. W. Bezpalko, J. Phys. Chem. C, 2011, 115, 12736–12741.
157 M. A. Watzky and R. G. Finke, Chem. Mater., 1997, 9, 3083–3095.158 M. Hölzl, S. Mintova and T. Bein, Stud. Surf. Sci. Catal., 2005, 158, 11–18.159 K. Norrman, A. Ghanbari-Siahkali and N. B. Larsen, Annu. Reports Sect. ‘C’ (Physical
Chem., 2005, 101, 174. 160 D. W. Schubert and T. Dunkel, Mater. Res. Innov., 2003, 7, 314–321.161 2016. 162 G. Perego, Catal. Today, 1998, 41, 251–259.163 A. W. Chester and E. G. Derouane, Zeolite characterization and catalysis: A tutorial,
2010. 164 H. van Bekkum, E. M. Flanigen, P. A. Jacobs and J. C. Jansen, Introduction to Zeolite
Science and Practice-2nd Revised Edition, Elsevier, 2nd edn., 2001. 165 M. Che and J. C. Védrine, Characterization of Solid Materials and Heterogeneous
Catalysts - From Structure to Surface Reactivity, Wiley-VCH Verlag GmbH & Co. KGaA., 2012.
166 G. Pál-Borbély, 2005, 65, 147–152.167 E. Kissa, Dispersions: characterization, testing, and measurement, CRC Press, New
York, 1999. 168 F. Rouessac and A. Rouessac, Chemical Analysis: Modern Instrumentation Methods
and Techniques, 2007. 169 G. Bergeret and P. Gallezot, Heterog. Katalyse, 2002, 738–765.170 D. B. Williams and C. B. Carter, Transmission Electron Microscopy: A Textbook for
Materials Science, 2009, vol. 1–4. 171 W. Wan, C. Xiao and X. Zou, Mesoporous Zeolites Prep. Charact. Appl., 2015, 425–
460. 172 S. Kaliaguine, 1996, vol. 102, pp. 191–230.173 M. Stoecker, Microporous Mater., 1996, 6, 235–257.174 H. Robson, Verified synrhesis of material - 2nd revised edition, 2001.175 J. Klinowski, Anal. Chim. Acta, 1993, 283, 929–965.176 R. a. Schoonheydt, Chem. Soc. Rev., 2010, 39, 5051.177 R. F. Howe, in Recent Advances and New Horizonts in Zeolite Science and
Technology, 1995, vol. 102, pp. 97–139. 178 A. Vimont, F. Thibault-Starzyk and M. Daturi, Chem. Soc. Rev., 2010, 39, 4928–4950.179 F. Zaera, Chem. Soc. Rev., 2014, 43, 7624–7663.180 S. Thomas, P. Bazin, L. Lakiss, V. De Waele and S. Mintova, Langmuir, 2011, 27,
14689–14695.

55
Chapter 1
Formation of copper nanoparticles in LTL nanosized zeolite: kinetic study
Introduction
In the past decades, metal and semiconductor nanoparticles with sizes in the range of 1–100
nm have attracted significant attention due to their unique properties, such as
photoluminescence, electrochemical and catalytic characteristics.1–6 Their properties differ
from those of single atoms or bulk metals, which is a consequence of their size and high
number of sites available on their surface. It was reported that the catalytic activity of metal
nanoparticles (Ag, Au, Cu, Pt, etc.) is increasing with the decrease of their size and that the
most active catalysts were those for which the particles are below 5 nm.4 However, the small
metallic nanoparticles demonstrate low thermal stability and a tendency to sinter under harsh
reaction conditions, thereby limiting their application at a large scale. For these reasons,
development of effective methods for controlled preparation and stabilization of small metal
nanoparticles in order to obtain desirable properties remains one of the most important
issues.1–6 Substantial progress has been achieved in the synthesis of silver and gold
nanomaterials.7,8 In this regard, copper nanoparticles (Cu NPs) with controlled size and shape
are good alternative material for catalysis, production of conductive inks etc., because of their
high conductivity, catalytic properties and much lower cost.9 Indeed, supported copper
catalysts have been utilized successfully in a wide range of reactions, including selective
catalytic reduction of NOx and SO2,10,11 synthesis and decomposition of methanol,12–14 direct
dimethyl ether synthesis from syngas,15,16 dehydrogenation of cyclohexanol17 and acetone
hydrogenation.18 However, compared to the extensive studies on gold and silver, reports on

56
copper nanoparticles are still limited, primarily because of relatively low Cu0/Cu+2 redox
potential (+0.34 V), which causes spontaneous oxidation at ambient conditions.3,9,19 It has
been reported that aggregation and oxidation of Cu NPs can be avoided by using various
protecting agents, such as polymers, organic ligands or porous materials.20
Porous materials and, in particular, zeolites are promising hosts (matrix) for stabilization
metal nanoparticles. Particle size and distribution of metals are controlled by steric
restrictions originating from the zeolite topology; the regular pore systems of zeolites
provides the defined locations.21 Besides the protection of nanoparticles against the
aggregation, these materials allow free access of reactants and products to the metal surface.
Additionally, the zeolite structure imposes shape selectivity by excluding molecules that are
too bulky to diffuse in to the channels.22 However, encapsulated nanoparticles are often
hardly accessible by reactants due to diffusion limitations in sub-nanometer channels.23
Recent developments in the synthesis of nanosized zeolites offer materials in which the mean
diffusion path is considerably low. Indeed, the combination of the transport properties within
the porous framework of nanosized zeolite with the chemical reactivity of the metal
nanoparticles is a promising way to the development of advanced materials for catalysis and
new applications.24
Chemical reduction of metal ions (copper, platinum, palladium, etc.) confined in the zeolite
host, is the most favorable, because of its simplicity and cost effectiveness. It usually
involves the reduction of metal salts in some type of solvent and separation of the reducing
agent. It gives particles with various size, morphology, and stability by tailoring the
conditions of the reduction process including the time of the reduction, the nature of reducing
agent, pH of reaction media, and temperature.25 Accordingly, it requires careful consideration
of the reaction conditions, and a comprehensive study of the formation mechanism, as the

57
reduction of the metal can lead to its migration to the external surface of the matrix, and even
destruction of the zeolite crystal structure.26
In this work, we report a facile preparation method for copper nanoparticles, confined in the
LTL type nanosized zeolite, using chemical reduction under controlled conditions. The LTL
type zeolite was selected due to its one-dimensional pore system that is expected to provide
confined medium for narrow size distribution of copper nanoparticles. The copper cations
were introduced in zeolite nanocrystals via ion exchange post synthesis treatment directly in
the suspensions. Subsequently, the copper ions were treated with three reducing agents
(hydrazine monohydrate, triethylamine and sodium borohydride), among all the hydrazine
was found to be the most effective. Further, the evolution of copper species and formation of
copper nanoparticle (Cu0 NPs) was followed by in situ UV-vis absorption spectroscopy and
ex situ wide-angle powder X-ray diffraction (XRD), high-resolution transmission electron
microscopy (HRTEM), and nitrogen adsorption/desorption analysis.
Experimental
Materials
Aluminum hydroxide (reagent grade, Sigma-Aldrich), LUDOX® SM 30 colloidal silica
(30 wt. % suspension in H2O, Sigma-Aldrich), potassium hydroxide (ACS reagent, ≥85%,
pellets, Sigma-Aldrich), copper(II) nitrate trihydrate (puriss. p.a., 99-104%, Sigma-Aldrich),
ammonium hydroxide solution (28%, Prolabo), hydrazine monohydrate (64-65 %, reagent
grade, 98%, Prolabo), triethylamine (≥99%, Sigma-Aldrich) and sodium borohydride (Fluka),
were used as received.
Preparation of copper containing LTL-type zeolite nanocrystals
Zeolite nanocrystals with LTL-type structure were prepared from clear precursor suspensions
with the following molar composition: 5 K2O : 10 SiO2 : 0.5 A12O3 : 200 H2O.27 The as-
prepared precursor suspensions were aged at room temperature for 24 hours prior to

58
hydrothermal treatment at 170 ºC for 18 hours. After the crystallization process was
accomplished, the nanosized zeolite crystals were recovered by multistep centrifugation
(20000 rpm, 40 min) and washed with doubly distilled water until pH = 7 - 8. Prior to
incorporation of copper, the LTL nanosized crystals were stabilized in water suspension with
a solid concentration of 2.5 wt.% (the sample was denoted as parent LTL).
The ion-exchange was performed directly in the colloidal suspensions without preliminary
calcination of the LTL zeolite. Samples were prepared by mixing copper nitrate (0.1 M) with
zeolite suspensions, giving solutions containing 0.3 mmol Cu+2/g zeolite (the sample was
named as Cu2+-LTL). The ion-exchange process was carried out at room temperature for 2
hours, and then the solutions were purified by multi-step centrifugation to remove the excess
of copper ions, and finally redispersed in double distilled water.
Chemical reduction of copper cations in zeolite suspensions
Copper exchanged zeolite suspensions were reduced with the following reducing agents
under identical conditions: sodium borohydride, triethylamine and hydrazine. In a typical
experiment the Cu+2/reductant ratio is fixed at 1/1000 to maintain reducing conditions and to
avoid oxidation of copper nanoparticles, so complete reduction of copper cations was
expected. During the addition of the reductant, the mixture was kept at room temperature
under magnetic stirring and N2 atmosphere, due to the high sensitivity of the copper to
oxygen. Aliquots of samples were removed periodically from the reaction mixture and
freeze-dried with or without washing prior to further studies. The sample obtained after
reduction will be further denoted as Cu0-LTL.
Characterization
The crystalline structure of the samples was studied by using a PANalytical X'Pert Pro
diffractometer with Cu Kα monochromatized radiation (λ = 1.5418 Å). The samples were

59
scanned in the range 3-80 ° with a step size of 0.02o. The XRD patterns were fit in
PANalytical X'Pert Pro HighScore Plus software using Pawley fit.
The agglomeration and average size of particles in the crystalline product were determined by
dynamic light scattering (DLS) performed with a Malvern Zetasizer Nano instrument
(scattering angle of 173º, laser wavelength of 632.8 nm, output power of 3 mW).
The thermal stability of the Cu-LTL samples in comparison to parent LTL zeolite was studied
by thermo-gravimetric analysis (TG/DTG) using a Setaram TGDSC 111 analyzer; the
measurements were carried out with a heating rate of 5 °C·min-1 under a 40 ml·min-1 flow of
air from 25 – 800 °C.
The surface and textural properties of the materials were measured by nitrogen sorption.
Nitrogen adsorption/desorption isotherms were obtained using a Micrometrics ASAP 2020
volumetric adsorption analyzer. Samples were degassed at 300 °C under vacuum overnight
prior to the measurement. The external surface area and micropore volume were estimated by
alpha-plot method using Silica-1000 (22.1 m2 g-1 assumed) as a reference. The micropore and
mesopore size distributions of the samples were extracted from the adsorption branch using
the Nonlocal Density Functional Theory (NLDFT), and the desorption branch using the
Barret-Joyner-Halenda (BJH) algorithm, respectively.
Chemical composition of samples was analyzed by inductively coupled plasma optical
emission spectroscopy (ICP-OES) using a Varian ICP-OES 720-ES. Additionally, the size,
the shape and chemical composition of crystals were revealed by high resolution transmission
electron microscopy (HRTEM). The distribution of copper cations in the zeolite crystals was
investigated by energy dispersive analysis (EDX, element mapping). The HRTEM and EDX
studies were performed using a Tecnai G2 30 UT (LaB6) microscope operated at 300 kV with
0.17 nm point resolution and equipped with a EDAX EDX detector. Besides, the size and
distribution of copper particles were studied by high angle annular dark field (HAADF)

60
scanning transmission electron microscopy (STEM). High angle annular dark field and
annular bright field (ABF) – scanning TEM studies were performed using a JEOL ARM200F
cold FEG double aberration corrected electron microscope operated at 200 kV and equipped
with a large solid-angle centurio EDX detector and Quantum EELS spectrometer. Particles
size distribution was calculated from HAADF STEM images using an imageJ processing
software.
The evolution of copper species in the zeolite was studied by in situ UV-Vis spectroscopy
using a Varian Cary 4000 Spectrophotometer. The measurements were performed in a quartz
cuvette (0.5 cm) closed with the septic stopper under N2 atmosphere. The data acquisition
was performed in a cycle mode with a step of 10 min between the spectra.
Results and discussion
Preparation and characterization of nanosized zeolite crystals
X-ray diffraction patterns of parent and ion exchanged LTL (Cu2+-LTL) zeolite samples are
shown in Figure 1A. Only the Bragg peaks corresponding to pure crystalline LTL zeolite are
present in the XRD. The changes of the unit cell parameters of the parent LTL and copper
containing samples were studied using Pawley fit (the Pawley fit offers almost all
possibilities of a Rietveld refinement, but is does not require crystal structure data). This
methodology allows to generate peak positions from a unit cell and symmetry information.28
The simulated XRD patterns, the difference between calculated and experimental data, and
the agreement indices are presented in the Figure 2 and Table 2.
The unit cell parameters were refined; parent LTL zeolite: a = b = 18.37299 and c = 7.540921
and Cu2+-LTL zeolite: a = b = 18.374080 and c = 7.544786. As can be seen, the copper
incorporation causes the expansion of the unit cell, probably due to higher affinity of copper
cations occluded in the channels to water.29 Further discussion will be presented in Chapter 4.
No copper aluminates are detected in these XRD patterns that is in agreement with previous

61
reports; indeed, the formation of copper aluminates requires the annealing at 900 ºC.30–33 The
broadening of the diffraction peaks in Figure 1A suggests that the size of the LTL crystals is
in nanometer range. Their size distribution and morphology before and after incorporation of
copper cations were investigated by HRTEM.
HRTEM images (Figure 1B) show rectangular crystals (10 – 20 nm) and with well-defined
edges; these nanocrystals tend to align and aggregate to bigger entities (50-70 nm). This can
be explained with the several steps of post synthesis treatment (ion-exchange and
purification) of the suspensions, leading to change of the alkalinity of the suspensions.
The chemical composition of the samples separated from the suspensions before and after
copper incorporation was determined by EDX and ICP-OES techniques. The results are
presented in Table 1.
Table 1 Elemental composition of parent LTL and Cu2+-LTL zeolite samples measured by ICP-OES and EDX.
Sample Si/Al K/AL Cu/Al
ICP EDX ICP EDX ICP EDX
Parent LTL 2.85 2.37 2.05 0.88 / /
Cu2+-LTL 2.83 2.39 1.36 0.81 0.06 0.10
The results show that potassium was only partially exchanged by copper cations, and this is
explained by the stability of potassium cations (K+) occluded in the cancrinite cadges, that
cannot be exchanged by other cations.34 Moreover, the most common ion exchange Cu2+
complex [Cu(H2O)6]2+ in copper solutions is too large to diffuse through the 6MR’s.35 The
results indicate a copper loading of 1.2 wt. %, that corresponds to ∼0.6 Cu2+ ions per unit cell.

62
Figure 1 (A) XRD patterns of (a) parent LTL and (b) Cu2+-LTL samples. (B) TEM images of (a) parent LTL and (b) Cu2+-LTL samples
(B)

63
(A)
(B)
Figure 2 Pawley fit of the XRD patterns and difference diagram between calculated and experimental data of (A) parent LTL and (B) Cu0-LTL; a unit cell is used to generate the initial peak list, as a reference pattern the Zeolite LTL (K-exchanged) (No. 98-003-5486) was used

64
Table 2 Agreement indices for the Pawley fit of the parent LTL and Cu0-LTL
Agreement Indices Parent LTL Cu0-LTL
R expected 3.7244 3.6959
R profile 4.3126 4.1496
Weighted R profile 5.6025 5.8898
D-statistics 0.2734 0.3293
Goodness of Fit 1.5043 1.5936
In addition, the EDX-TEM mapping of the Cu2+-LTL sample is presented in Figure 3. The
homogeneous distribution of copper across the LTL nanosized zeolite is clearly observed,
which is required to obtain copper nanoparticles with narrow size distribution.
Figure 3 Qualitative elemental analysis of Cu2+-LTL sample by EDX-TEM mapping.

65
Kinetics of formation of Cu nanoparticles in LTL zeolite suspensions via chemical reduction
The kinetics of formation of copper nanoparticles in the Cu2+-LTL zeolite suspensions
(concentration of 2.5 wt.%) was studied (see Experimental section). Initially, the steady-state
UV-Vis spectra of the three samples prepared with different reducing agents were collected
(Figure 4). Based on the UV-vis spectra, the properties of the metal nanoparticles were
evaluated; it is known that the surface plasmon polarization resonance (SPP) of nanoparticles
is influenced by the size, shape, interparticle interactions, free electron density and
surrounding medium.36 The reduction of copper ions (Cu2+) to metal (Cu0) nanoparticles in
the presence of sodium borohydride occurred rapidly at ambient conditions. The absorption
peak at 570 nm (Figure 4a) is attributed to SPP resonance of the metallic copper
nanoparticles. The low intensity of the band is explained by the fast formation of black
precipitate, indicating the formation of large Cu nanoparticles.37 This result is also confirmed
with SEM studies showing cubic nanoparticles with a size of about 170 nm (Figure 5). The
reducing agent (NaBH4) has been used in excess (1/1000). The excess of sodium must have
resulted in back-exchange of copper facilitated by the small zeolite crystals and one-
dimensional topology of the channels. This would explain the large size of the copper metal
particles formed at the external surface of the zeolite crystals and in the solution. Sodium
borohydride is a very strong reducing agent, and the reduction occurs much faster than the
actual growth of the particles followed by aggregation and coalescence resulting in the
formation of bulky copper nanoparticles outside the zeolite matrix.38
The Cu2+-LTL sample treated with triethylamine shows two absorption bands located at 360
nm and 420 nm (Figure 4b); these are charge transfer bands of Cu-O-Cu and O-Cu-O
complexes, respectively according to previously reported data.19,39 The same bands were
assigned to the copper oligomers in polymer and inorganic matrices.40–42 Moreover, the same
peaks were assigned to CuІ species in the Cu2O microspheres and nanocrystals.4,43,44 The

66
plasmon band at 570 nm is not observed for this sample. The results suggest that the strong
reducing agent (triethylamine) previously applied for synthesis of other nanoparticles (Au
and Ag),45–47 does not participate in the reduction of CuІ species to Cu0.
The absorption spectrum of Cu2+-LTL sample treated with hydrazine demonstrates well
defined broad peak centered at 590 nm that appeared after 3 hours of the reduction (Figure
4c), which is a clear indication of the formation of Cu NPs. This suspension is stable and no
formation of black precipitate is observed. Hence, the kinetics of Cu0 formation in the LTL
zeolite suspension treated with hydrazine was studied in further details.
Figure 4 UV-vis spectra of Cu NPs formed in LTL zeolite suspensions under N2 atmosphere using (a) sodium borohydride, (b) triethylamine and (c) hydrazine as reducing agents

67
Figure 5 SEM image of Cu2+-LTL reduced with Sodium borohydride. Cubic shaped copper nanoparticles on the surface of nanosized LTL crystals are observed
In order to obtain more information about the formation of copper species during the
reduction process, the kinetic study was performed at room temperature under nitrogen
atmosphere in excess of hydrazine to prevent copper particles oxidation and to avoid the
reaction between oxygen and hydrazine.48
The exhalation of N2 bubbles indicates that reduction is proceeding according to the
following reaction: Cu2+ + N2H4 + 4OH¯ Cu0 + N2 + 4H2O.
The spectra of the reaction mixture were collected after equal intervals of time (10 minutes).
The evolution of the UV-vis spectra (200 – 800 nm) of the sample during reduction with
hydrazine is presented in Figure 6A. The initial spectrum of the Cu2+-LTL sample is
featureless. After 180 min, the color of the suspension changes drastically from light blue to
reddish, and a broad band at 590 nm arises, that is assigned to the SPP resonance band of
metallic copper (Cu0). The spectrum looks essentially similar to ones reported in the literature
for copper nanoparticles, but the peaks position is slightly “red-shifted”.49 This can be
explained by increase of optical contrast between the particles (ε) and surrounding matrix
(εm), which causes the growth of magnitude and shift to longer wavelengths of the SSP
resonance peaks in comparison to nanoparticles in vacuum.37,50 In our case the Cu NPs are
stabilized in the LTL zeolite crystals (refractive index, RI =1.164) and dispersed in DD water
(RI = 1.33 at 20 °C).

68
Figure 6 (A) Evolution of extinction spectra of copper containing LTL suspension (solid zeolite concentration of 2.5 wt. %) reduced with hydrazine with time (not all the spectra are shown). (B) Variation of peak intensity at λmax = 590 nm in the course of reduction reaction. The dashed vertical lines emphasize the reduction steps (I, II, III). The red arrows and red balls highlight the key times, when the materials were extracted for further characterization

69
As reduction process proceeds, no obvious change in the peak position and shape during the
first 16 h is observed, apart from the peak intensity during 430 min (step I and II); also, no
new peaks appeared in the spectra. According to Mie’s theory, a single SPP resonance peak is
expected for spherical nanoparticles, while particles with anisotropic shape could give two or
more SPP resonance peaks depending on their shape.49,51,52 It is worth noticing, that after 430
min a slight decrease in the absorbance peak intensity at the same λmax occurs. This might
indicate the aggregation of copper nanoparticles located outside the zeolite matrix and their
partial sedimentation. However, it is difficult to judge the size and location of the copper
particles by UV-vis spectra in this particular case due to the complexity of the surrounding
medium and possible migration of the particles from zeolite matrix to the solution followed
by aggregation. Therefore, the size of the CuNPs was studied by HRTEM and the results will
be discussed further.
Numerous models describing the mechanism of formation of metal nanoparticles are
discussed in the literature.8,38 The development of the absorption peak at 590 nm for the Cu-
LTL sample as a function of time is presented in Figure 6B. The process of formation of Cu
NPs could be conditionally divided in three steps. A long induction period (I step) is followed
by a rapid growth after 3 hours (II step), then the absorbance reaches maximum after 7 hours
and later on slightly decreases (III step). The induction period can be explained by the
intermediate formation of Cu+ species and Cun+ oligomers by the following dismutation
reaction: Cu2+ +Cu0 2Cu+,
since the atomic potential for E° (Cu+/Cu0) is -2.7VNHE (normal hydrogen electrode).19
However, there is no evidence of these species in the UV-vis spectra.
Assuming the molar extinction coefficient of copper is 2100 L mol-1 cm-1,42 the amount of
Cu0 can be calculated on the basis of the absorption spectra from the Beer-Lambert law. The

70
concentration of Cu0 is estimated to be around 0.5 mmol L-1 that corresponds to the reduction
of about 90 % of initial Cu2+ to Cu0.
Further, the aliquots of the reaction mixture at each reduction stage, were collected and
freeze-dried; the powder samples were stored in a glove box under argon to avoid copper
oxidation prior to further studies.
The formation of copper nanoparticles and their influence on the crystallinity of the LTL
zeolite matrix were followed by recording the XRD patterns at various times of reduction
(Table 3).53
Table 3 Analysis of Bragg peak area of the XRD patterns collected at different key times of the reaction
Sample Cu2+-LTL
Xbeg Xend Ymax X(YMax) Peak Area
0 min 42.90 43.70 43.08 43.61 0.04
70 min 42.90 43.70 37.19 43.65 -0.06
190 min 42.90 43.70 140.00 43.29 44.24
280 min 42.90 43.70 263.00 43.33 56.23
430 min 42.90 43.70 258.00 43.31 64.25
960 min 42.90 43.70 309.00 43.33 92.42
Xbeg-Xend – peak position
The XRD patterns of the material in the range 35 – 80 º2θ are presented in Figure 7A. During
step I (check point 1 at 70 min), no diffraction peaks for Cu0 are observed. It is known, that
pore opening of the LTL zeolite is 7.1-7.4 Å, and the Van der Waals size of the hydrazine
molecule is 3.43 Å, that permits its diffusion inside the zeolite pores (Figure 8).
Therefore, according to LaMer theory of nanoparticle growth, zero valence Cu0 is constantly
produced in the zeolite voids until the concentration of copper atoms reaches a critical point,
and then the Cu atoms would spontaneously condense.8,54 When the formed nuclei are too
small, their crystalline structure is not defined and therefore the Bragg peaks are not seen.

71

72
Figure 7 (A) XRD patterns of solid samples isolated during the reduction of copper containing LTL suspension in the range of 35 -80 º2θ after (a) 0 min, (b) 70 min, (c) 190 min, (d) 280 min, (e) 430min and (f) 960min. The characteristic metallic copper peaks at 43.3, 50.4 and 74.2 º2θ are indicated with dashed rectangles. (B) Reference patterns of (a) Cu0-LTL after reduction for 960 min, (b) Cu0 and (c) Cu2O and (d) CuO. The asterisk (*) indicate Cu0 peaks. No oxides are observed in the sample. (C) XRD patterns of samples at different reaction time in the region 4 - 50 º2θ. The LTL zeolite structure stays intact during the reduction process
Atoms d, Å
H1-H2 1.62
H1-H3 2.90
H1-H4 2.41
N1-N2 1.44
Atoms Radii, Å
H 0.53
N 0.56
Figure 8 Van der Waals size of Hydrazine molecule

73
There are three peaks in the XRD pattern attributed to metallic copper nanoparticles: at 43.3 º,
which can be readily indexed to the (111) crystalline plane, emphasizing the hexagonal
packing of the surface layer atoms; two more weak peaks at 50.3 and 74.2 º correspond to
(200) and (220) crystalline planes, respectively, can be observed.55 The latter appear after 3 h
(point 2 at t = 190 min, step II), indicating some copper nanoparticles are large and stable
enough to be detected with XRD. The acceleration of the nanoparticles growth continues up
to t = 430 min (point 3 t = 280 min, point 4 t = 430 min, step III), and reaches the maximum
and remains constant, thus indicating the steady-state of reduction (point 5 at t = 960 min). It
should be noted that no copper(I) or copper (II) oxides have been observed in the XRD
pattern (Figure 7B). During the reduction process there is no change in signal to noise ratio,
confirming that the zeolite structure stays intact (Figure 7C).53
The porosity of the parent LTL and copper containing LTL samples at different reduction
stages was monitored via low temperature nitrogen sorption (Figure 9A (a – g)). All
isotherms are a mixture of type I and type IV, typical for microporous materials, represented
by the rapid uptake at low relative pressures followed by nearly horizontal adsorption and
desorption branches. The hysteresis loop at high relative pressures appears due to the
formation of textural mesopores, which can be explained by the close packing of
monodispersed zeolite nanoparticles.56 Figure 9B, Figure 9C and Table 4 display the
variations in surface area and pore volume of the samples at different reaction steps. As can
be seen the BET surface area and the external surface area do not change significantly. The
micropore volume (t-plot method was applied) follows the same trend. This confirms the
previous observations, that the zeolite structure is stable and no amorphization is observed.

74
Table 4 The BET surface area (SBET), external surface area (SEXT), and micro- (Vmic), meso- (Vmeso) and total (Vtot) pore volumes of samples at different time of reduction with hydrazine
Sample SBET, m2 g-1
SEXT, m2 g-1
Vmic, cm3 g-1
Vtot, cm3 g-1
Vmes, cm3 g-1
Parent LTL 571.4 320.7 0.12 1.00 0.88
Cu2+-LTL (0 min)
571.9 339.8 0.11 1.04 0.93
70 min 544.4 343.9 0.11 1.03 0.93
190 min 568.4 378.6 0.10 1.05 0.95
280 min 553.4 345.2 0.11 1.04 0.93
430 min 573.9 349.5 0.12 1.08 0.96
960 min 518.3 327.1 0.10 0.93 0.83

75
Figure 9 (A) Nitrogen adsorption/desorption isotherms of (a) parent LTL, (b) Cu2+-LTL, and the Cu2+-LTL sample after reduction for (c) 70 min, (d) 190 min, (e) 290 min, (f) 430 min, and (g) 960 min; (B) (a) micropore volume (Vmic), (b) mesopore volume (Vmeso) and (c) total pore volume (Vtotal); (C)(a) BET surface area (SBET) and (b) external surface area (Sext) of copper containing LTL as a functionof reduction time

76
The size and location of Cu NPs in the samples during reduction were studied by HAADF-
STEM; the images of the samples at key reaction points with hydrazine are shown in Figure
10. After 70 min no sign for copper nanoparticles is detected (Figure 10a). The copper
nanoparticles are identified as the bright spots uniformly distributed in the Cu-LTL sample
after 190 min (Figure 10b), which are not found in the previous sample. The Cu NPs show a
narrow size distribution in the range of 0.2 – 1.6 nm (mean size of 1 nm, Figure 11A). That is
somewhat bigger than the pore opening of the LTL-type zeolite (0.74 nm) and the large
cavity diameter (1.07 nm).57 However, it was previously found that zeolitic and MOF’s
structures can be locally distorted by the metal particles with the size bigger than the cages
while still preserving the original crystalline structure.58,59 Bright field (BF) TEM images also
show part of the Cu particles oriented along the LTL-crystals channels, giving the idea of
their location inside the zeolite. Nevertheless, the exact position of particles cannot be
elucidated from the BF alone, because of the two-dimensional nature of the image.60 On the
other hand, nitrogen adsorption/desorption data demonstrate, that there is no noticeable
blockade of the zeolite pores with the growing copper nanoparticles. This phenomenon can
be explained by low concentration of copper in the sample (1.2 wt. %), so that the Cu NPs
formed do not affect the texture of the entire material. As seen from the XRD and N2 sorption
measurements in combination with the TEM, one can conclude that the copper nanoparticles
are both inside the channels and on the surface of the zeolite crystals. After 280 min
reduction (Figure 10c), more copper particles in the sample are observed. One can see, that
there are no copper nanoparticles with a size smaller than 0.4 nm, at the same time there are
particles with a diameter of 2.2 nm (this fraction of Cu NPs is situated on the surface of the
zeolite crystals, Figure 11B). It was reported earlier, that a dissolution of small particles
(radius < 0.5 nm) at temperatures lower than 200 °C is very unlikely. Since the reaction here
is performed at room temperature, the aggregation or coalescence of copper nanoparticles

77
caused by poor colloidal stability is a much more probable process than Ostwald ripening due
to particles dissolution.38 It was shown before, that in hydrated form metal nanoparticles are
extremely mobile.26 Consequently, the Cu NPs confined in the pores of the LTL zeolite can
migrate to the surface, initiating further increase of their size. The images taken from the
sample after 430 min of reduction (Figure 7d) display large copper particles (100 nm) on the
surface of aggregated zeolite crystals. Small copper NPs resemble those observed in the
beginning of the process are still presented within the host, but their amount is notably lower,
and the distribution is no longer homogeneous along the zeolite crystals (Figure 10d′). After
960 min of reduction (Figure 7e), there are no more small copper nanoparticles. Migration
and aggregation of Cu NPs from the channels of the LTL zeolite led to the generation of large
copper particles.
Figure 10 HAADF-STEM images of zeolite samples reduced with hydrazine for (a) 70 min, (b) 190 min, (c) 280 min, (d) and (d’) 430 min and (e) 960 min. The bright spots represent copper nanoparticles

78
(A)
(B)
Figure 11 The histograms of copper particle size distribution of zeolite samples reduced with hydrazine for (A) 190 min, (B) 280 min with
As has been stated in the introduction, the thermal and air stability of the Cu NPs particles is
of great importance for major applications, such as catalysis. To study the stability of Cu NPs
in LTL nanocrystals, Cu0-LTL-280 min sample has been chosen as the most relevant. The air
stability of the copper nanoparticles has been monitored using DR UV-vis. The spectra of
self-supported pellets of copper-containing LTL have been recorded first (i) after storing the
sample in Ar atmosphere and the second (ii) after storing in air for 48 hours (Figure 12).

79
Figure 12 UV-vis spectra of self-supported pellets of copper-containing LTL recorded after storing the sample in Ar atmosphere (black) and after storing in air for 48 hours (red). A new peak at 420 nm assigned to Cu2O61 appeared in the red spectrum
As can be seen, a new peak at 420 nm, which can be assigned to Cu2O,61 appeared in the
spectrum of the second sample.
Conclusions
A detailed study of the evolution of copper species in the LTL nanosized zeolite suspension
during reduction with various reducing agents is presented. The use of sodium borohydride
led to the rapid formation of large cubic shaped copper nanoparticles outside the zeolite
crystals, while the reaction with triethylamine did not result in the formation of copper
nanoparticles (Cu NPs). On the contrary, the copper cations were successfully reduced to Cu
NPs with a uniform dispersion within the zeolite crystals when hydrazine was applied as the
reducing agent. The dimension of the Cu NPs in the zeolite is limited by the size of zeolite
channels and cages. With prolonged reduction time, the Cu NPs tend to migrate to the zeolite

80
surface due to their high mobility in aqueous media. On the other hand, for the particles
located on the external surface of the zeolite crystals, the growth mechanism is more likely
driven by the colloidal stability of the latter, thus resulting in large copper particles.
Transmission electron microscopy shows the presence of 0.2-1.6 nm Cu NPs distributed
throughout the zeolite crystals after 190 min. After 280 min there are more Cu NPs formed
within the zeolite pores and on their surface with the maximum size of 2.2 nm. Finally, larger
copper particles formed on the zeolite surface, while the zeolite structure is preserved.
Further insight into the mechanism of the copper NPs formation allows to produce the
materials with desired properties under controlled conditions. By tailoring the reduction time,
it is possible to isolate supported copper nanoparticles with diverse sizes homogenously
distributed within the zeolite matrix. This enables to design the materials for applications
such as catalysis and plasmon-mediated chemistry requiring well defined particle size.

81
References
1 Y. Lu and W. Chen, Chem. Soc. Rev., 2012, 41, 3594–623.2 K. Jug, B. Zimmermann, P. Calaminici and A. M. Köster, J. Chem. Phys., 2002, 116,
4497–4507.3 Y. Lu, W. Wei and W. Chen, Chinese Sci. Bull., 2012, 57, 41–47.4 C. Vázquez-Vázquez, M. Bañobre-López, A. Mitra, M. A. López-Quintela and J.
Rivas, Langmuir, 2009, 25, 8208–16.5 X. Crispin, C. Bureau, V. Geskin, R. Lazzaroni and J.-L. Brédas, Eur. J. Inorg. Chem.,
1999, 1999, 349–360.6 Y. Wang, P. Chen and M. Liu, Nanotechnology, 2006, 17, 6000–6006.7 Y. Sun, Mater. Today, 2012, 15, 140–147.8 Y. Sun, Chem. Soc. Rev., 2013, 2497–2511.9 S. Wang, X. Huang, Y. He, H. Huang, Y. Wu, L. Hou, X. Liu, T. Yang, J. Zou and B.
Huang, Carbon N. Y., 2012, 50, 2119–2125.10 T. V. W. Janssens, H. Falsig, L. F. Lundegaard, P. N. R. Vennestrøm, S. B. Rasmussen,
P. G. Moses, F. Giordanino, E. Borfecchia, K. A. Lomachenko, C. Lamberti, S. Bordiga, A. Godiksen, S. Mossin and P. Beato, ACS Catal., 2015, 5, 2832–2845.
11 A. Corma, A. E. Palomares, F. Rey and F. Marquez, J. Catal., 1997, 170, 140–149.12 G. Meitzner and E. Iglesia, Catal. Today, 1999, 53, 433–441.13 A. Gallo, T. Tsoncheva, M. Marelli, M. Mihaylov, M. Dimitrov, V. Dal Santo and K.
Hadjiivanov, Appl. Catal. B Environ., 2012, 126, 161–171. 14 D. K. Kim and E. Iglesia, J. Phys. Chem. C, 2008, 112, 17235–17243.15 V. V. Ordomsky, M. Cai, V. Sushkevich, S. Moldovan, O. Ersen, C. Lancelot, V.
Valtchev and a. Y. Khodakov, Appl. Catal. A Gen., 2014, 486, 266–275. 16 G. Yang, N. Tsubaki, J. Shamoto, Y. Yoneyama and Y. Zhang, J. Am. Chem. Soc.,
2010, 132, 8129–8136. 17 V. Z. Fridman, A. A. Davydov and K. Titievsky, J. Catal., 2004, 222, 545–557.18 R. S. Rao, A. B. Walters and M. A. Vannice, J. Phys. Chem. B, 2005, 109, 2086–92.19 J. Kecht, Z. Tahri, V. De Waele, M. Mostafavi, S. Mintova and T. Bein, Chem. Mater.,
2006, 18, 3373–3380. 20 N. Cioffi, N. Ditaranto, L. Torsi and L. Sabbatini, Approaches to synthesis and
characterization of spherical and anisotropic copper nanomaterials, 2009. 21 D. Farrusseng and A. Tuel, New J. Chem., 2016.22 J. Shi, Y. Wang, W. Yang, Y. Tang and Z. Xie, Chem. Soc. Rev., 2015, 44, 8877–8903.23 A. Mazzocut, E. Coutino-Gonzalez, W. Baekelant, B. Sels, J. Hofkens and T. Vosch,
Phys. Chem. Chem. Phys., 2014, 16, 18690–3. 24 S. Mintova, M. Jaber and V. Valtchev, Chem. Soc. Rev., 2015, 44, 7207–7233.25 T. M. D. Dang, T. T. T. Le, E. Fribourg-Blanc and M. C. Dang, Adv. Nat. Sci. Nanosci.
Nanotechnol., 2011, 2, 15009. 26 M. Severance and P. K. Dutta, J. Phys. Chem. C, 2014, 118, 28580–28591.27 M. Hölzl, S. Mintova and T. Bein, Stud. Surf. Sci. Catal., 2005, 158, 11–18.28 G. S. Pawley, J. Appl. Crystallogr., 1981, 14, 357–361.29 P. O. Fritz, J. H. Lunsford and C.-M. Fu, Zeolites, 1988, 8, 205–208.30 B. Abdolpour, M. Saeed and K. Sanaz, Monatshefte für Chemie - Chem. Mon., 2016,
2–7. 31 P. H. Bolt, F. H. P. M. Habraken and J. W. Geus, J. Solid State Chem., 1998, 69, 59–
69. 32 C. Hu, K. Shih and J. O. Leckie, J. Hazard. Mater., 2010, 181, 399–404.33 L. M. Plyasova, T. M. Yur, I. Y. Molina, T. A. Kriger, A. M. Balagurov, L. P.

82
Davydova, V. I. Zaikovskii, G. N. Kustova, V. V Malakhov and L. S. Dovlitova, Kinet.
Catal., 2010, 41, 429–436. 34 S. M. Auerbach, K. A. Carrado and P. K. Dutta, Handbook of zeolite science and
technology, CRC Press, 2004, vol. 2004. 35 P. Vanelderen, J. Vancauwenbergh, B. F. Sels and R. A. Schoonheydt, Coord. Chem.
Rev., 2013, 257, 483–494. 36 R. Desai, V. Mankad, S. K. Gupta and P. K. Jha, Int. J. Nanosci., 2012,
121102044327005. 37 U. Kreibig, M. Quinten and D. Schoenauer, Optical Properties of Nanoparticle
Systems, 1986, vol. T13. 38 J. Polte, CrystEngComm, 2015, 17, 6809–6830.39 A. N. Pestryakov, V. P. Petranovskii, A. Kryazhov, O. Ozhereliev, N. Pfänder and A.
Knop-Gericke, Chem. Phys. Lett., 2004, 385, 173–176. 40 V. De Waele, J. Kecht, Z. Tahri, M. Mostafavi, T. Bein and S. Mintova, Sensors
Actuators B Chem., 2007, 126, 338–343. 41 B. G. Ershov, E. Janata, M. Michaelis and a Henglein, J. Phys. Chem., 1991, 95,
8996–8999. 42 J. Khatouri, M. Mostafavi, J. Amblard and J. Belloni, Chem. Phys. Lett., 1992, 191,
351–356. 43 M. Salavati-Niasari and F. Davar, Mater. Lett., 2009, 63, 441–443.44 Y. Yu, L. Zhang, J. Wang, Z. Yang, M. Long, N. Hu and Y. Zhang, Nanoscale Res.
Lett., 2012, 7, 347. 45 J. D. S. Newman and G. J. Blanchard, Langmuir, 2006, 22, 5882–7.46 P.-L. Kuo and C.-C. Chen, Langmuir, 2006, 22, 7902–6. 47 M. Zaarour, B. Dong, I. Naydenova, R. Retoux and S. Mintova, Microporous
Mesoporous Mater., 2014, 189, 11–21. 48 M. Grouchko, A. Kamyshny, K. Ben-Ami and S. Magdassi, J. Nanoparticle Res., 2007,
11, 713–716. 49 R. Sierra-Ávila, M. Pérez-Alvarez, G. Cadenas-Pliego, V. C. Padilla, C. Ávila-Orta, O.
P. Camacho, E. Jiménez-Regalado, E. Hernández-Hernández and R. M. Jiménez-Barrera, J. Nanomater., 2015, 2015, 1–9.
50 N. G. Bastus, J. Piella and V. Puntes, Langmuir, 2016, 32, 290–300.51 A. R. Tao, S. Habas and P. Yang, Small, 2008, 4, 310–325.52 A. Tao, P. Sinsermsuksakul and P. Yang, Angew. Chemie - Int. Ed., 2006, 45, 4597–
4601. 53 Q. Liu, M. R. Gao, Y. Liu, J. S. Okasinski, Y. Ren and Y. Sun, Nano Lett., 2016, 16,
715–720. 54 N. T. K. Thanh, N. Maclean and S. Mahiddine, Chem. Rev., 2014, 114, 7610–7630.55 P. K. Khanna, S. Gaikwad, P. V. Adhyapak, N. Singh and R. Marimuthu, Mater. Lett.,
2007, 61, 4711–4714. 56 H. Awala, J.-P. Gilson, R. Retoux, P. Boullay, J.-M. Goupil, V. Valtchev and S.
Mintova, Nat. Mater., 2015. 57 http://europe.iza-structure.org/IZA-SC/framework.php?STC=LTL 58 F. Schröder, D. Esken, M. Cokoja, M. W. E. Van Den Berg, O. I. Lebedev, G. Van
Tendeloo, B. Walaszek, G. Buntkowsky, H. H. Limbach, B. Chaudret and R. a. Fischer, J. Am. Chem. Soc., 2008, 130, 6119–6130.
59 F. W. H. Kampers, C. W. R. Engelen, J. H. C. Van Hooff and D. C. Koningsberger, J.
Phys. Chem., 1990, 94, 8574–8578. 60 S. Turner, O. I. Lebedev, F. Schröder, D. Esken, R. a. Fischer and G. Van Tendeloo,
Chem. Mater., 2008, 20, 5622–5627.

83
61 M. D. Susman, Y. Feldman, A. Vaskevich and I. Rubinstein, Chem. Mater., 2012, 24, 2501–2508.

84
Chapter 2
Formation of copper nanoparticles in LTL nanosized zeolite: spectroscopic characterization
Introduction
Metallic nanoparticles have attracted significant attention in catalysis science due to their
high catalytic activity and selectivity in many important chemical processes such as
hydrogenation/dehydrogenation1, isomerization2, oxidation and reduction of NOx with
hydrocarbons3. High catalytic activity is ascribed to a high proportion of atoms located at
corners and edges that have low coordination numbers and the ability to activate substrates4.
The number of such atoms is increasing with the decrease of particle size, and it has been
frequently reported that the catalytic activity increased when the particle size decreased. Most
active catalysts were those for which particles are below 5 nm4. Substantial progress has been
achieved in the synthesis of silver and gold nanoparticles5,6. In this context, copper
nanoparticles (Cu NPs) with controlled size and shape are good alternative materials for
catalysis, because of their high conductivity, catalytic properties, and lower price7. However,
reports on copper nanoparticles are rather limited, primarily because of relatively low
Cu0/Cu2+ redox potential (+0.34 V), which causes spontaneous oxidation at ambient
conditions8,9.
The main drawback of small metallic nanoparticles is low thermal stability and a tendency to
sinter under harsh reaction conditions, limiting their application at a large scale. These
obstacles can be overcome by confining the nanoparticles into the pores and/or cavities of
inorganic supports.

85
Zeolites are promising hosts (matrix) for stabilization of metal nanoparticles4. The size,
distribution and location of the nanoparticles are controlled by the steric constrains that
originate from the zeolite topology, i.e. regular system of pores and cavities10. Additionally,
the zeolite structure imposes shape selectivity by limiting the diffusion of the molecules with
the effective diameter bigger than the pore openings. However, exactly the existence of
strong confinements, giving on one hand the useful properties of the material, can
simultaneously affect their performance in catalysis and separation processes due to the
extremely slow mass transport through the micropores. Advances in synthesis of nanosized
zeolites gives the materials in which the mean diffusion path is significantly lower, compared
to their conventional micronsized counterparts. Indeed, the combination of superior
properties on nanosized zeolites with the exceptional reactivity of metallic nanoparticles
opens a way to the design of new advanced catalytic materials11.
In the previous chapter, we had investigated the formation of copper nanoparticles inside the
nanosized LTL zeolite. The copper cations were introduced in zeolite nanocrystals via ion
exchange after the synthesis directly in the suspensions.12 Subsequently, the copper ions were
treated with hydrazine monohydrate as a reducing agent. We had shown that by tailoring the
synthesis conditions, it is possible to isolate supported copper nanoparticles with diverse sizes
homogeneously distributed within the zeolite matrix. However, due to the nature of the
synthesis process, where the reduction reaction is interrupted in order to obtain the copper
nanoparticles of desired size, existence of various copper species should not be neglected.
The necessity of having well defined and characterized, not just Cu nanoparticles (NPs), but
also other copper species arises from the desired application, since the catalytic activity and
selectivity can be affected by the presence of unwanted active sites. Hence, an accurate
design of copper active sites and their complementary characterization are crucial steps in the
rational preparation of Cu NPs supported zeolites catalysts.

86
FTIR spectroscopy of adsorbed probe molecules has been extensively used to determine the
oxidation states of supported metal species.13–15 It is important to note that the choice of a
suitable probe molecule is a crucial point in the FTIR spectroscopy as it determines which
surface property will be probed.16 CO and NO probe molecules can provide highly valuable
information on the supported metal dispersion and coordination, as well as on the oxidation
degree of such species. Another positive point for the use of such probes is their small size,
allowing site accessibility even in the small cavities/channels of zeolites.
In this work, the adsorption of CO and NO molecules on copper containing LTL type zeolite
was investigated. The choice of CO was determined by its sensitivity towards Cu+ sites,
whereas the choice of NO was governed by the sensitivity to Cu2+ species. Experiments were
performed at liquid-nitrogen temperature that allows to detect the sites characterized by a
weak interaction with the probe and cannot be detected at higher temperatures.16
However, elucidating the nature of Cu species in zeolites is not an easy task and usually
demands a multi-technical approach. For these reasons the FTIR studies have been
complemented with EPR, 29Si and 63Cu MAS NMR and DR UV-Vis measurements. Indeed,
EPR and 29Si MAS NMR help to complement the information on the Cu2+ species and the
changes in their environment, whereas the 63Cu MAS NMR allows characterization of
metallic copper species. Additionally, DR UV-Vis is used to characterize copper in both
oxidation states, metallic copper and different Cu-O complexes.
Experimental
Nanosized LTL type zeolite with monomodal particle size distribution was synthesized as
described elsewhere.12 The as-prepared precursor suspensions were aged at room temperature
for 24 hours prior to hydrothermal treatment at 170 ºC for 18 hours. After the crystallization
process was accomplished, the nanosized zeolite crystals were recovered by multistep
centrifugation (20000 rpm, 40 min) and washed with doubly distilled water until pH = 7 – 8

87
(denoted parent LTL). Samples were ion-exchanged with copper nitrate (0.1 M) in colloidal
zeolite suspensions, giving solutions containing 0.3 mmol Cu+2/g zeolite to achieve ~10 % of
K+ cations exchange for copper. The ion-exchange process was carried out at room
temperature for 2 hours, and then the solutions were purified by multi-step centrifugation to
remove the excess of copper ions (this sample is denoted by Cu2+-LTL), and finally
incorporated copper cations were reduced in zeolite suspension using excess of hydrazine
(Cu2+/1000 N2H4) under N2 atmosphere. The reduction was carried out at room temperature
for 280 minutes, which corresponds to ~56% reduction of Cu2+ to Cu0 in obedience to UV-
Vis in situ studies.12 Subsequently the solids were freeze-dried. The final product was
identified as Cu0-LTL and stored in the glove box in Ar atmosphere to prevent the Cu NPs
from oxidation. According to HRTEM results, the copper nanoparticles are evenly distributed
in the pores and on the surface of the LTL matrix with the mean size of 0.4-2.2 nm. The
detailed description of the preparation procedure, the structural and textural characterization
of the copper nanoparticles-LTL zeolite material is described and reported in our previous
paper.12
FTIR spectra of CO and NO adsorption on self-supported zeolite pellets were recorded using
a Thermo-Nicolet Nexus instrument by accumulation of 128 scans and a spectral resolution
of 4 cm-1. Self-supporting pellets (d = 16 mm, m = 20 mg) were prepared from the powder
samples and studied using in situ transmission IR at ambient and low temperatures. Prior to
the IR measurements, the samples were activated under oxygen or hydrogen atmosphere or in
vacuum at 673 – 723 K, to study the effect of different oxidation and reducing pre-treatments
steps on the state of copper species. After the pre-treatment, small calibrated doses of CO and
NO were introduced into the IR cell up to an equilibrium pressure of 60 and 40 torr,
respectively. Additionally, in the case of CO adsorption the system was subsequently
evacuated at 100 K and at 423 K to investigate the stability of formed species.

88
The effective reduction of the copper species was studied by variable temperature pulsed
EPR carried out at X-band (9.64 GHz) using a Brüker ELEXSYS E580 FT spectrometer. The
state of copper was also characterized by diffuse reflectance UV-Vis spectroscopy utilizing a
Varian Cary 4000 spectrophotometer. Additionally, 63Cu and 29Si MAS NMR spectra were
recorded by Brüker 500 MHz spectrometer.
Results and discussion
FTIR spectroscopy
The FTIR spectra (OH stretching region) of the Cu2+-LTL and Cu0-LTL samples after
activation in vacuum at 673 K are presented in Figure 1. Both materials contain the bands at
3747–3744 cm-1, which are characteristic of the isolated external silanol groups.16 High
relative intensity of these bands reflects the low size of the crystals that has already been
reported in the literature as the spectral characteristic of the nanosized zeolites. The Cu0-LTL
sample exhibits additional bands at 3661 and 3628 cm-1, that can be assigned to extra
framework Al-sites and bridged hydroxyl ≡Si(OH)Al≡ groups, respectively.15–17 These bands
are the consequence of the chemical reduction and high temperature activation of this sample.
The presence of the latter can be explained by occupation of the vacant structure charge
balancing positions with proton after the reduction of Cu2+ species to Cu0. Appearance of
extra framework aluminum can then be explained by the partial distortion of the LTL
structure. This phenomena is often observed for zeolites with low Si/Al ratios as already
reported in the literature18. However, it should be noticed that this effect is not dominant, as
the intensity of the latter bands is not high.

89
Figure 1 FTIR spectra of samples after activation in OH-region at RT: (a) Cu2+-LTL and (b) – Cu0-LTL. Insert: IR spectra in the region 3500-3700 cm-1
CO adsorption on copper-LTL samples followed by FTIR spectroscopy
The state of the copper species in the ion-exchanged zeolites is of primary importance for
their possible catalytic applications. It is thus necessary to control as finely as possible not
only the amount of the desired sites (copper nanoparticles), which are necessary to realize the
targeted reaction but also to hinder as much as possible the number and action of the
undesired ones, such as various Cu1+ and Cu2+ species.
CO is a small molecule that forms a donor bond to the metal centres. FTIR spectroscopy is
used to study the carbonyl complex formed with transition metal cations by their carbonyl
stretching frequency that responds very sensitively to coordination onto cationic sites,
shifting the frequency of gaseous CO at 2143 cm-1. The frequency shifts give information
about the oxidation and coordination state of the cation. In the case of copper, CO is

90
preferentially adsorbed over Cu1+ ions since the formed carbonyl complex is stabilized by π-
back donation while no stable carbonyls are formed with the participation of Cu2+ ions at
room temperature.19 Additionally, CO forms mainly a π-bond with Cu0 atoms, and the
resulting complexes are unstable. Frequencies of Cu1+-CO and Cu0-CO fall in the same
spectral region, 2110-2080 cm-1, which makes their discrimination hard. However, the goal of
this work is not to detect the nanoparticles, since they have been already identified and
characterized in our previous article,12 but to characterize the residual copper species that
may have influence on their potential applications.
The adsorption of CO on copper containing zeolite samples was initially studied at low
temperature (100 K) by introduction of calibrated doses of CO from 5 to 60 torr. Figure 2A-D
shows the IR spectra (C-O-stretching region) of the Cu2+-LTL sample pre-treated in oxygen
(a), vacuum (b) or hydrogen (c), and Cu0-LTL sample pre-treated in vacuum at the same
temperature (d). For convenience, the observed CO stretching frequencies are summarized in
Table 1. Different pre-treatment conditions were used to monitor the behaviour of copper that
will help to determine the spectral features ascribed to specific species.
Careful spectral deconvolution of all spectra has permitted the differentiation of the number
of overlapped components with close maxima but different half width and allowed to see
their evolution with increasing of the CO pressure. The deconvolution has been performed
with MagicPlot software using Gaussian function. The peak positions have been determined
using the second derivative and were fixed for all spectra in order to fit properly the ν(CO)
band.
Adsorption of CO (5 – 20 torr) on the Cu2+-LTL sample, activated under O2 atmosphere,
(Figure 2A) leads to the appearance of intense bands at 2140 and 2128 cm-1 attributed to Cu+-
CO complexes at different locations in the zeolite framework, characterized by different
stability towards evacuation that will be shown further.20 The low intensity band at 2190 cm-1

91
can be assigned to Cu2+-CO species.21 After introduction of the 20 torr of CO, two bands at
2163 and 2150 cm-1 with a peak shoulder at 2121 cm-1, that rise simultaneously at higher
coverages, are also detected. These bands are contributed to C-O-stretching of K+· · ·CO
adducts and oxygen-bonded CO according to previous reports.13,22 The band at 2163 cm-1
could be also ascribed as the interaction of CO with the silanol OH groups at low
temperature.13 The uprising of the peak shoulder at 2177 cm-1 manifest the interaction of CO
with bridging OH groups or, which is more likely in this system, the formation of the
dicarbonils Cu+-(CO)2 complexes,13 since no OH bridging groups are observed for the
oxidized samples (Fig. 1).
Table 1 Assignment of the C–O stretching frequencies observed in the copper containing zeolite samples
No. Species Mode Frequency, cm-1 Notes
1 Cu+-CO ν(CO) 2140
2128
Populated first, stable upon evacuation at RT Populated first, stable upon evacuation at 423 K
2 Cu+-(CO)2 νs(CO) νas(CO)
2177 2150
Appear at high coverage at 100 K, not stable upon evacuation
3 Cu0-CO ν(CO) 2103 Unstable upon evacuation at 100 K 4 Cu2+-CO ν(CO) 2190 Unstable upon evacuation at 100 K 5 K+-CO νs(CO)
νas(CO) 2163 2150 2121
Appears at higher coverage at 100 K, unstable upon evacuation Oxygen-bonded CO
6 Al3+-CO ν(CO) 2230 Appear at 100 K, unstable upon evacuation
7 OH-group ν(CO) 2163 2177
Interaction with silanol group Interaction with bridging OH group
The IR spectra collected for the Cu2+-LTL sample, activated at 673 K in vacuum are similar
(Figure 2B). However, the evolution of their intensities with the coverage level differs
significantly. The bands at 2140, 2128 and 2177 cm-1, assigned to Cu1+-CO and Cu1+-(CO)2,
appear first, whereas the peaks at 2190, 2163 and 2150 cm-1 appear at higher coverage after
introduction of 20 torr CO. There is a peak at 2103 cm-1, which becomes evident only after

92
deconvolution, that appears at high coverage and generally is assigned to the formation of
Cu0 species.13 By comparing the spectra in Figures 2 A and B, significant oxidation of Cu1+
to Cu2+ in O2 atmosphere can be observed, however Cu1+ species are still preserved. The high
amount of Cu+1-CO and the presence of Cu0-CO species in the sample treated in vacuum can
be explained by so called “self-reduction” of Cu2+ at high temperature because of the
dehydration of the divalent Cu2+(H2O)n complexes, as their formation is favored upon the ion
exchange procedure.23,24 The IR spectra for Cu2+-LTL sample pre-treated in H2 and Cu0-LTL
sample, reduced with hydrazine and pre-treated at 723 K in vacuum are shown in Figure 2C
and Figure 2D, respectively. These two samples display almost identical spectra with similar
band intensities. The main difference from the previous spectra (Figure 2A, B) is the lower
intensity of the bands at 2190 and 2177 cm-1 that belong to Cu2+-CO, Cu+ dicarbonils and
possibly to bridging OH groups. This is obviously the consequence of the reduction treatment
applied to these two samples, and the very weak interaction of CO with the Cu2+ oxidation
state. Another important difference (see Figure 2B), is the lower intensity of the bands at
2140 and 2128 cm-1 (Cu1+-CO) and more pronounced peak at 2103 cm-1, assigned to the Cu0-
CO, that appears at lower pressure. Taking this into account and having in mind that the
amount of copper is the same in all samples these spectral changes can be assigned to the CO
coordination with CuNPs. This result agrees with the literature data, that shows that high
temperature treatment with hydrogen of copper exchanged zeolites leads to the formation of
Cu nanoparticles (CuNP). In addition, this is in agreement with our findings,12 that interaction
of Cu2+-LTL sample with hydrazine in aqueous phase creates CuNP. The stability of copper
carbonyls was further investigated. The decrease of the CO equilibrium pressure by
progressive evacuation at 100 K (Figure 3A-D), and at higher temperatures leads to the
diminution of most of the bands.

93
Figure 2 Evolution of the IR spectra in the 2300-2000 cm-1 range with increasing doses of CO at 100 K. Sample activated in O2 (A), vacuum (B), H2 (C), and Cu0-LTL sample in vacuum (D) at 673 K

94
Figure 3 Evolution of the IR spectra in the range 2300-2000 cm-1 upon evacuation at 100 K and activation at 673 K for Cu2+-LTL sample in O2 (A), vacuum (B), H2 (C), and Cu0-LTL in vacuum (D)

95
Figure 4 Evolution of the IR spectra (2300-2000 cm-1) of the Cu0-LTL sample prepared with hydrazine and activated at 723 K in vacuum upon evacuation at RT (a), after 10 min at RT (b) and after heating at 423 K (c)
Only the bands at 2140 and 2128 cm-1, attributed to Cu+-CO complexes (Figure 4), remain
after evacuation at ambient temperature. However, after evacuation at 423 K pronounced
peak at 2128 cm-1 still remains while the intensity of the band at 2140 cm-1 decreases
drustically.13 It should also be noted that all samples before and after reduction contain Cu+-
species that are the first to be populated with introducing CO.
If the made assumptions are correct that the transition moment for v(CO) adsorbed on a
particular site is independent of the pre-treatment conditions, then the change in relative
intensities of the IR bands can be associated with changes in the relative numbers of sites.20
Though, FTIR spectroscopy of adsorbed CO allows the estimation of the dispersion of Cu1+
sites in the samples and determination of the Cu+/Cutotal ratio, based on the number of

96
adsorbed CO molecules at the Cu+ species saturation. The integrated areas of the ν(CO) band
at 2140 and 2128 cm-1 were calculated after deconvolution of the recorded pattern (Figure
5A). Assuming the CO molar adsorption coefficient for the band at 2140 cm-1 is 13.5
cm/μmol and for the band at 2128 is 10 cm/μmol,13 and the surface of the pellet is 2 cm2, the
concentration of Cu1+ species was calculated by the following equation: � = ������������������� ,
where n is the concentration of Cu1+ (mol/g);
Area is from the CO adsorption bands at 2140 and 2128 cm-1obtained after the deconvolution
(cm-1);
ε is molar absorption coefficient of CO on Cu1+ (cm/mol);
Spellet is the surface of the pellet (2 cm2);
mpellet is the mass of the pellet (g).
The evolution of the integrated area of the ν(CO) band at 2140 cm-1 as a function of the
introduced CO displays an increment followed by a plateau as shown in Figure 5B. Therefore,
considering the Cu+ : CO stoichiometry to be 1 : 1,25 the CO adsorption monolayer on Cu+
can be determined by intersection of two trend lines built on the slope and plateau. The
results for the series of samples after different pre-treatment are reported in Table 2. The high
stability of Cu+ in the zeolites is clearly observed, while Cu+ is presented in all the samples in
significant amounts. The quantity of Cu+ species in the Cu0-LTL sample is 44% from the
total copper present in the sample, which is in agreement with the UV-Vis measurements12
that showed that the relative amount of Cu0 species was 56% with respect to the total copper
loading.

97
Figure 5 (A) Peak deconvolution for sample Cu0-LTL activated at 723 K in vacuum under CO (50 torr). (B) Integrated area of the ν(CO) band at 2140 cm-1 and (C) integrated area of the ν(CO) band at 2128 cm-1 bound to copper as a function of the CO introduced for a set of samples: Cu2+-LTL activated at 673 K in O2 (a), (b) Cu2+-LTL activated at 673 K in vacuum, (c) Cu2+-LTL activated at 673 K in H2 and (d) Cu0-LTL activated at 723 K in vacuum.

98
Table 2 Evaluation of number of Cu+ sites with respect to the total amount of copper in the samples based on IR study
Sample mpellet, g Area at 2140 cm-1 Area at 2128
cm-1 nCO, mol/g nCu+, mol/g mCu+1, g mCu, g Cu1+ (2140 cm-
1), % Cu1+ (2128 cm-
1), % (a) 0.01958 2.59 2.13 8.05E-05 2.93E-05 3.65E-05 2.43E-04 10.09 11.19
(b) 0.01958 10.98 7.97 1.94E-04 12.42E-05 15.45E-05 2.43E-04 42.78 41.92
(c) 0.01958 5.69 3.84 2.25E-04 6.43E-05 8.00E-05 2.43E-04 22.16 20.24
(d) 0.01941 5.08 4.47 1.97E-04 5.79E-05 7.14E-05 2.41E-04 19.95 23.73

99
NO adsorption on copper-LTL samples followed by FTIR spectroscopy
The Cu2+ cations form stronger bonds with NO than with CO. As a result, surface Cu2+-NO
species are easily formed at room temperature and detected in the spectral region 1964-1845
cm-1. NO bonds predominantly are formed by a σ-bond to the cations, and the higher the N-O
stretching frequency the stronger is the bond. On the other side, NO molecule has one more
electron than CO, which makes π-back donation more difficult. As a result, the Cu+-NO
species are not stabilized by a σ-π synergistic effect and are considered unstable.19 It should
also be mentioned that to the best of our knowledge there is no literature data published on
the interaction of nitric oxide with copper nanoparticles using FTIR.
The adsorption of calibrated doses of NO from 10 to 40 torr at low temperature on the same
series of samples, pre-treated in the same way as for the CO adsorption, was performed. The
IR spectra contain the groups of bands in the region 1980–1850 cm-1 (Figure 6A-D) and the
region 1850 – 1650 cm-1 (Figure 6 (a, b)).14 The bands and the corresponding assignments are
summarized in Table 2.
The bands at 1953, 1938, 1905, 1886 cm-1 are characteristic for Cu2+-NO species and
correspond to probably four different Cu2+ sites. According to the literature,14,26 the intense
bands at lower frequencies can be assigned to isolated Cu2+ ions, while the bands at higher
frequencies belong to nitrosyls formed with associated Cu2+-O-Cu2+ sites or isolated Cu2+
cations in the square planar coordination. As shown in Figure 6A, B, the intensity of the
bands with lower frequency (1886 cm-1) are less affected by treatment of the sample in
vacuum or in H2 than the ones at higher frequency. Indeed, the isolated Cu2+ sites are
expected to be more difficult to reduce.27–29 The second set of bands includes peaks at 1825,
1810, 1797 and 1730 cm-1, that generally represent the interaction of NO with Cu+-sites.14
They can be assigned as follows: the peaks at 1810 and 1797 cm-1 correspond to Cu+-NO
mono-nitrosyls, that has been previously observed in zeolite Y, that evolve with increasing

100
pressure to Cu+-(NO)2 di-nitrosyls characterized by doublet with νs and νas at 1825 and 1730
cm-1.14,29 In general, the behaviour of NO adsorption on Cu+ species in the samples follows
the same trend as for CO adsorption. There is a significant increase in the amount Cu+ species
for the sample prepared in vacuum compared to the one pre-treated in O2. For the sample
reduced under H2 and Cu0-LTL sample pre-treated in vacuum, there is an evident decrease in
the bands associated with Cu+ and Cu2+ species. This can be again attributed to the formation
of metallic nanoparticles (CuNP) that do not interact with NO molecules. However, spectral
lines associated to both (1+) and (2+) copper oxidation states are still present.
It should also be mentioned that other bands were observed. The bands at 1770 and 1863 cm-1
stay for cis-(N2O2) weakly adsorbed in the zeolite channels, that appear due to isomerisation
of NO at low temperatures.17,27,30 The peaks centred at 1886 and 1874 cm-1 become visible
for the Cu0-LTL sample, which are assigned to K+· · ·NO monomers (Figure 6C).17 The latter
are masked in the case of the Cu2+-LTL pre-treated in O2 or under vacuum by Cu2+-NO
species (Figure 6A, B). All four samples contain the peak at 2245 cm-1, that has been
previously described as weakly bonded N2O with the zeolite.17 The peaks centred at 1683,
1712 and 1749 cm-1, in its turn, can be attributed to N2O4 or NO2. The band at 1749 cm-1 is
typical of N2O4 adsorbed on zeolite acidic hydroxyls, as can be seen this band is more
pronounced in case of the reduced and self-reduced samples. The later confirms the
assumption concerning the occupation of the vacant structure charge balancing positions with
proton after the reduction of Cu2+ species to Cu0. The presence of various NxOy in the spectra
should be explained by NO disproportion or by the contamination of the NO. It is known that
the following equilibrium exists for NO: 3NO ⇌ NO2 + N2O, that is shifted to the right at
higher pressures. Also, NO2 is known to be easily dimerized to N2O4.14
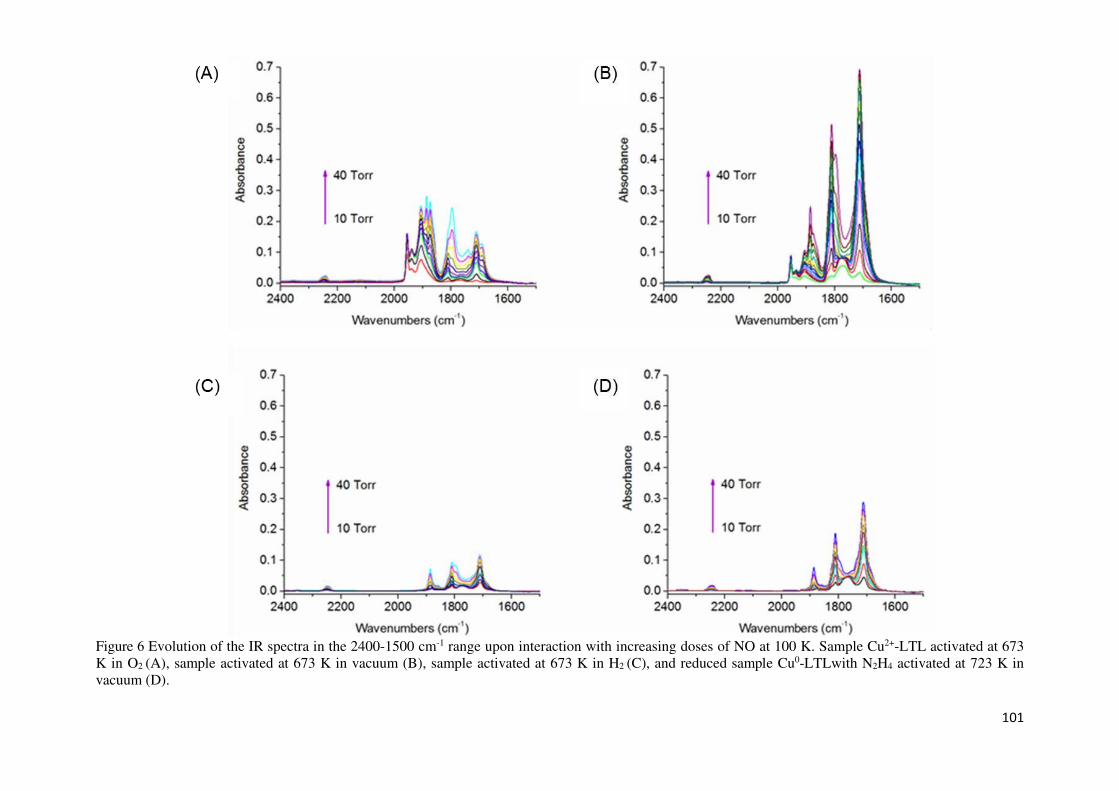
101
Figure 6 Evolution of the IR spectra in the 2400-1500 cm-1 range upon interaction with increasing doses of NO at 100 K. Sample Cu2+-LTL activated at 673 K in O2 (A), sample activated at 673 K in vacuum (B), sample activated at 673 K in H2 (C), and reduced sample Cu0-LTLwith N2H4 activated at 723 K in vacuum (D).

102
Table 3 Assignment of the N–O stretching frequencies observed in this study
No. Species Mode Frequency,
cm-1
Notes
1 Cu+-NO ν(NO) 1797 1810
Converts to dinitrosyls, not stable upon evacuation
2 Cu+-(NO)2 νs(NO) νas(NO)
1825 1730
Appear at high coverage at 100 K, not stable upon evacuation
3 Cu2+-NO ν(NO) 1955 Correspond to associated Cu2+ sites, unstable upon evacuation at 100 K
1938
1905 Cu2+ sites in square pyramidal configuration
1886 Cu2+ sites in square planar configuration
4 K+-NO ν(NO) 1886 1874
Unstable upon evacuation at 100 K
5 cis-(N2O2) νs(NO) νas(NO)
1863 1770
Weakly adsorbed in the zeolite channels, unstable upon evacuation at 100 K
6 N2O ν(N-N) 2245 Weakly bonded in zeolite channels, unstable upon evacuation at 100 K
7 N2O4/NO2 νas(NO2) 1683 1712 1749
Weakly bonded in zeolite channels, unstable upon evacuation at 100 K
UV-Vis characterization of copper containing zeolite samples
The self-supported pellets of the Cu2+-LTL sample pre-treated in O2 and the Cu0-LTL sample
pretreated in vacuum have been examined using diffuse reflectance UV-Vis spectroscopy
(Figure 7). The Cu2+-LTL sample contains absorption bands in the regions 240 – 450 nm and
600 – 800 nm, that are described in the literature as mononuclear Cu2+ ← O2− charge-transfer
transitions and d – d transitions of isolated distorted octahedral Cu2+ ions, respectively.21,31
The presence of metallic copper species in the Cu0-LTL sample was revealed by an
absorption peak at about 550 nm, which is attributed to surface plasmon polarization (SPP)
resonance of the metallic Cu.31,32 This sample also shows band at 240 nm that is already
assigned to Cu2+ species. Additional transitions at 360 nm belongs to O-Cu-O, and at 430 nm
belongs to Cu-O-Cu complexes are recorded.33

103
EPR characterization of copper containing zeolites
EPR spectroscopy characterizes the content of paramagnetic Cu2+ cations and changes in
their local environment, while other copper oxidation states (Cu+, Cu0) are EPR silent.34
Figure 8 shows a drastic decrease in the amount of Cu2+ species upon reduction and partial
re-oxidation upon calcinations in air.
Rasia et al. have shown the correlation between hyperfine coupling constant A// and g-factor
(g//) in the EPR spectra of Cu(II) complexes.35
Figure 7 UV-Vis spectra of self-supported pellets of (a) Cu0-LTL and (b) Cu2+-LTL activated under oxygen atmosphere at 673K
Table 4 The values of hyperfine coupling constant A// and g-factor (g//) obtained for copper containing LTL samples from EPR spectra
Sample Spin Hamiltonian Parameters
g// A//
Cu2+-LTL 2.4 132
Cu0-LTL 2.27 177
Cu0-LTL-reox 2.39 130

The dependence of these parameters allows determining the type of ligands coordinated to
Cu2+ ions at different stages of preparation. The initial Cu2+-LTL sample contains copper
coordinated to four oxygen atoms, while after reduction the unreduced copper species are
coordinated to the sphere of mixed ligands of nitrogen from hydrazine and oxygen. The
above observations are in good agreement with previous reports, where Cu2+ closely interacts
with four framework oxygen atoms in the 6MR’s rings of copper-containing erionite, LTL Y,
and CHA-zeolites.36
Figure 8 EPR spectra of (a)Cu2+-LTL sample, (b) Cu0-LTL sample obtained by treatment with hydrazine and (c) Cu0-LTL sample upon thermal treatment in air
29Si and 63Cu MAS NMR characterization of copper containing zeolites
Due to a lower natural abundance of 4.7% and a long spin-lattice relaxation time (T1) of 29Si
nuclei, the 29Si MAS NMR measurements of porous silicates require long measuring time.
While T1 varies from a few microseconds to around 30 s for most of the zeolites, it can reach
5000 seconds in layered silicate nacrite.37 However, it has been shown previously, that
introducing paramagnetic centres into mesoporous and microporous silicate crystals has
strong impact on shortening of the relaxation times due to effective nuclear relaxation by
104

105
direct interaction between the 29Si nucleus and the electron spin.37,38 Hence, the measurement
of the relaxation rate changes in 29Si MAS NMR signal of copper-containing LTL zeolite
allows monitoring the effective reduction of Cu2+ cations.
The 29Si MAS spectra of parent LTL, Cu2+-LTL and Cu0-LTL samples are shown in Figure 9.
Four peaks at -90, -96, -101, and -106 ppm are assigned to Si(0Si4Al), Si(1Si3Al),
Si(2Si2Al), Si(3Si1Al), Si(4Si0Al), respectively.39 The T1 values for different sites in the
parent LTL and copper-containing zeolites are summarized in Table 5. As can be seen, 29Si
T1 values of different silica sites in the parent zeolite are in the range of 9-12 s, while after
the introduction of 1 paramagnetic Cu2+ ion per unit cell, the relaxation rate decreases
drastically. It is worth noticing, that based on T1 values analysis of different Si sites, the
preferable coordination of Cu2+ is revealed. The enhancement of relaxation time follows the
order Si(4Al) > Si(3Al) > Si(2Al) ≥ Si(A1) ≥ Si(0Al), suggesting that the most favourable
coordination sites for Cu2+ species are Si(4Al) and Si(3Al). After reduction, the relaxation
times have the values of same order of magnitude as for the parent LTL. These results
suggest significant reduction of the amount of paramagnetic Cu2+ species in the sample.
Table 5 Relaxation time (T1) of different Qn sites in the parent LTL and copper containing LTL zeolite samples
Sites T1(s)
Parent LTL Cu2+-LTL Cu0-LTL
Q4(4Al) 11.6 2.9 x10⁻² 23.3
Q4(3Al) 10.0 5.5 x10⁻² 19.0
Q4(2Al) 9.2 8.4 x10⁻² 13.9
Q4(1Al) 9.2 9.2 x10⁻² 12.3
Q4(0Al) 9.1 8.5 x10⁻² 12.0

106
Figure 9 29Si MAS NMR spectra of parent LTL, Cu2+-LTL and Cu0-LTL samples
The Cu0-LTL sample was than examined with 63Cu MAS NMR. The anisotropic resonance at
2330 ppm prevails in the 63Cu NMR spectra of parent LTL and Cu2+-LTL samples, which
arises due to the Cu radio frequency coil in the probe (Figure 10). No other signals are
observed in these materials. Two extra resonances at 2340 ppm and 360 ppm are detected in
the spectrum of the Cu0-LTL sample. The peak at 2340 ppm well-resolved from the peak of
the Cu coil (at 2330 ppm) has been previously assigned to metal Cu particles.40 Based on the
FTIR study it was shown that the Cu0-LTL sample contains Cu+ species that allows us to
assign the peak at 360 ppm to Cu+.

107
Figure 10 63Cu MAS NMR spectra of (a) parent LTL, (b) Cu2+-LTL and (c) Cu0-LTL samples
Conclusions
The examination of oxidation states of supported copper species in LTL nanosized zeolites
has been proved to be a demanding task, since the reduction of copper results in a complex
system, containing different species including residuals of Cu2+, Cu+, and CuNPs. Adsorption
of probe molecules such as NO and CO allows monitoring of the modifications in the system
upon oxidation and reduction; both the Cu2+ and Cu+ were selectively probed. The FTIR
results evidence the heterogeneity of Cu2+ and Cu+ cations in the Cu-LTL zeolite prepared by
ion-exchange procedure. Furthermore, the FTIR quantitative analysis based on CO adsorption
shows that the relative amount of copper in (1+) state is 44%. This agrees with the UV-Vis
results demonstrating that 56% CuNP were formed. The actual reduction of Cu2+ species and
the presence of Cu2+ residuals (probably isolated ions) have been evidenced by adsorption of
NO, as well as by complementary study using 29Si MAS NMR and EPR. The 29Si MAS
spectra showed that the most favourable coordination sites for Cu2+ species are Si(4Al) and
Si(3Al), whereas the 63Cu MAS NMR confirms the presence of CuNPs.

108
References
1 W. Sheng, Curr. Org. Chem., 2011, 15, 3692–3705.2 M. Hitrik, A. Dandapat, Y. Sasson, A. G. Livingston, K. K. Hii, G. Strukul, E. J.
Mozeleski, D. W. Brown and E. M. Staudt, RSC Adv., 2016, 6, 68041–68048.3 T. V. W. Janssens, H. Falsig, L. F. Lundegaard, P. N. R. Vennestrøm, S. B. Rasmussen,
P. G. Moses, F. Giordanino, E. Borfecchia, K. A. Lomachenko, C. Lamberti, S.Bordiga, A. Godiksen, S. Mossin and P. Beato, ACS Catal., 2015, 5, 2832–2845.
4 D. Farrusseng and A. Tuel, New J. Chem., 2016, 40, 3933–3949.5 Y. Sun, Chem. Soc. Rev., 2013, 2497–2511.6 Y. Sun, Mater. Today, 2012, 15, 140–147.7 S. Wang, X. Huang, Y. He, H. Huang, Y. Wu, L. Hou, X. Liu, T. Yang, J. Zou and B.
Huang, Carbon N. Y., 2012, 50, 2119–2125.8 Y. Lu, W. Wei and W. Chen, Chinese Sci. Bull., 2012, 57, 41–47.9 J. Kecht, Z. Tahri, V. De Waele, M. Mostafavi, S. Mintova and T. Bein, Chem. Mater.,
2006, 18, 3373–3380.10 J. Shi, Y. Wang, W. Yang, Y. Tang and Z. Xie, Chem. Soc. Rev., 2015, 44, 8877–8903.11 S. Mintova, M. Jaber and V. Valtchev, Chem. Soc. Rev., 2015, 44, 7207–7233.12 A. Kharchenko, O. I. Lebedev, V. Zholobenko, V. de Waele and S. Mintova, J. Phys.
Chem. C, 2016, acs.jpcc.6b08045. 13 K. I. Hadjiivanov, Adv. Catal., 2002, 47, 307–511.14 K. Hadjiivanov, Catal. Rev., 2000, 42, 71–144.15 A. Vimont, F. Thibault-Starzyk and M. Daturi, Chem. Soc. Rev., 2010, 39, 4928–4950.16 S. Bordiga, C. Lamberti, F. Bonino, A. Travert and F. Thibault-Starzyk, Chem. Soc.
Rev., 2015, 44, 7262–7341. 17 C. Lamberti, A. Zecchina, E. Groppo and S. Bordiga, Chem. Soc. Rev., 2010, 39,
4951–5001. 18 G. T. Kerr, J. Phys. Chem., 1969, 73, 2780–2782.19 K. Hadjiivanov and H. Knozinger, Phys. Chem. Chem. Phys., 2001, 3, 1132–1137.20 J. Howard and J. M. Nicol, 5.21 A. Gallo, T. Tsoncheva, M. Marelli, M. Mihaylov, M. Dimitrov, V. Dal Santo and K.
Hadjiivanov, Appl. Catal. B Environ., 2012, 126, 161–171. 22 G. Turnes Palomino, C. Otero Areán, F. Geobaldo, G. Ricchiardi, S. Bordiga and A.
Zecchina, J. Chem. Soc. Faraday Trans., 1997, 93, 189–191. 23 E. Borfecchia, K. a. Lomachenko, F. Giordanino, H. Falsig, P. Beato, a. V. Soldatov,
S. Bordiga and C. Lamberti, Chem. Sci., 2014, 8, 548–563.24 G. . T. Palomino, P. Fisicaro, S. Bordiga, A. Zecchina, E. Giamello and C. Lamberti, J.
Phys. Chem. B, 2000, 104, 4064–4073. 25 V. Zdravkova, N. Drenchev, E. Ivanova, M. Mihaylov and K. Hadjiivanov, J. Phys.
Chem. C, 2015, 119, 15292–15302. 26 P. Kaminski, I. Sobczak, P. Decyk, M. Ziolek, W. J. Roth, B. Campo and M. Daturi, J.
Phys. Chem. C, 2013, 117, 2147–2159. 27 M. Tortorelli, K. Chakarova, L. Lisi and K. Hadjiivanov, J. Catal., 2014, 309, 376–
385. 28 G. Centi and S. Perathoner, Appl. Catal. A, Gen., 1995, 132, 179–259.29 I. Sobczak, M. Ziolek, M. Renn, P. Decyk, I. Nowak, M. Daturi and J. C. Lavalley,
Microporous Mesoporous Mater., 2004, 74, 23–36. 30 A. Penkova, K. Hadjiivanov, M. Mihaylov, M. Daturi, J. Saussey and J.-C. Lavalley,
Lagmuir, 2004, 20, 5425–5431. 31 D. Esquivel, A. J. Cruz-Cabeza, C. Jiménez-Sanchidrián and F. J. Romero-Salguero,

109
Microporous Mesoporous Mater., 2013, 179, 30–39. 32 U. Kreibig, M. Quinten and D. Schoenauer, Optical Properties of Nanoparticle
Systems, 1986, vol. T13. 33 A. N. Pestryakov, V. P. Petranovskii, A. Kryazhov, O. Ozhereliev, N. Pfander and A.
Knop-Gericke, Chem. Phys. Lett., 2004, 385, 173–176. 34 U. Deka, I. Lezcano-Gonzalez, B. M. Weckhuysen and A. M. Beale, ACS Catal., 2013,
3, 413–427. 35 R. M. Rasia, C. W. Bertoncini, D. Marsh, W. Hoyer, D. Cherny, M. Zweckstetter, C.
Griesinger, T. M. Jovin and C. O. Fernández, Proc. Natl. Acad. Sci. U. S. A., 2005, 102, 4294–4299.
36 R. a. Schoonheydt, Catal. Rev. Sci. Eng., 1993, 35, 129–168.37 S. Inagaki, I. Kawamura, Y. Sasaki, K. Yoshida, Y. Kubota and A. Naito, Phys. Chem.
Chem. Phys., 2013, 15, 13523–13531. 38 L. Zhou, S. Li, Y. Su, B. Li and F. Deng, Solid State Nucl. Magn. Reson., 2015, 66–67,
29–32. 39 L. Mafra, J. A. Vidal-Moya and T. Blasco, Annual Reports on NMR Spectroscopy,
2012, vol. 77. 40 N. Yamakawa, M. Jiang and C. P. Grey, Chem. Mater., 2009, 21, 3162–3176.

110
Chapter 3
Cu species introduced in nanosized LTL zeolites by in-situ and ion-exchange approaches
Introduction
Isomorphous substitution of Si4+ cations in the silicon-oxygen skeleton of silicates and zeolites
by transition metal cations Mn+ with n≠4 is of great interest due to potentially imparted capacity
for acid-base catalytic activity. Ione et al. systematically studied the problem of isomorphous
substitution Si4+ ⇌ Mn+, and the stability of the Mn+ in the tetrahedral position by applying the
Pauling criteria was evaluated (ρ = rc/ro, where rc is the cation radius and ro is the radius of the
oxygen ion).1,2 Based on the values of ρ, the tetrahedral coordination should be stable only for
cations with ρ in the range 0.414–0.225. This group of cations includes only A13+, Mn4+, Ge4+,
V4+, Cr6+, Si4+, P5+, Se6+ and Be2+. However, it was shown later that any cation, that does not
satisfy the rule above could be occluded in the isomorphous position at low concentration of
the metal, the importance of geometrical parameters can be neglected.3
The aim of this work is to study the possibility of introducing copper in nanosized LTL zeolites
by in-situ and ion exchange approaches and to follow the changes in their textural, structural,
and surface properties.
Experimental
Materials
Aluminum hydroxide (reagent grade, Sigma-Aldrich), LUDOX® SM colloidal silica (30 wt. %
suspension in H2O, Sigma-Aldrich), potassium hydroxide (ACS reagent, ≥85%, pellets, Sigma-
Aldrich), copper(II) nitrate trihydrate (puriss. p.a., 99-104%, Sigma-Aldrich), ammonium
hydroxide solution (28%, Prolabo) were used as received.

111
In-situ synthesis of copper-containing LTL zeolite nanocrystals
Copper-containing zeolite nanocrystals with LTL-type structure were prepared from clear
precursor suspension, free of organic template, forming a suspension with the following molar
composition: 5 K2O : 10 SiO2 : 0.5 A12O3 : 0.1 CuO : 200 H2O. The suspension was prepared
using the following procedure: solution A was prepared by dissolving 0.49 g of aluminum
hydroxide and 2.5 g of potassium hydroxide in 4.2 g of distilled water to give a clear
suspension; solution B was prepared by adding 10 g of colloidal silica and 0.8 g of potassium
hydroxide in 4 g of distilled water and stirred until transparent; and solution C was prepared
by mixing 1.2 g of copper (II) nitrate with 2 g of distilled water and 0.34 mL of ammonium
hydroxide solution. Then, solution A was mixed with solution C, and the resulted mixture was
poured slowly into solution B under vigorously stirring. The resulted gel (Figure 1) was aged
for 60 h at room temperature under vigorous stirring till the bluish colloidal suspension was
obtained. Then bluish colloidal suspension was subjected to hydrothermal treatment at 170 °C
for 18 h. After the crystallization process was terminated, the nanosized zeolite crystals were
recovered by multistep centrifugation (20000 rpm, 40 min) and washed with doubly distilled
water until pH = 7 (sample K-Cu-LTL IS). To obtain the NH4+-form of the K-Cu-LTL IS
zeolite, the following three – step ion exchange procedure with ammonium chlorate at 40 ºC
was performed, followed by purification of the material by multistep centrifugation (20000
rpm, 40 min); this sample was named H-Cu-LTL IS.

112
Figure 1 The image of the synthesis gel after 60 h of aging (left) and after hydrothermal crystallization (right)
Ion-exchanged copper-containing LTL zeolite nanocrystals
The ion exchange LTL sample with copper was prepared following the procedure described in
Chapter 2. The Cu2+-LTL sample obtained by ion exchange treatment, that was thoroughly
characterized in the Chapters 2 and 3, was named Cu-LTL IE here for the convenience.
Characterization
The crystalline structure of the samples was studied by using a PANalytical X'Pert Pro
diffractometer with Cu Kα monochromatized radiation (λ = 1.5418 Å). The samples were
scanned in the range 3-80 ° with a step size of 0.02o.
The agglomeration and average size of particles aggregates in the crystalline product were
determined using dynamic light scattering (DLS) performed with a Malvern Zetasizer Nano
instrument (scattering angle of 173º, laser wavelength of 632.8 nm, output power of 3 mW).
The surface and textural properties of the materials were measured by nitrogen
sorption/desorption. Nitrogen adsorption/desorption isotherms were obtained using a
Micrometrics ASAP 2020 volumetric adsorption analyzer. Samples were degassed at 300 °C
under vacuum overnight prior to the measurement. The external surface area and micropore
volume were estimated by alpha-plot method using Silica-1000 (22.1 m2 g-1 assumed) as a
reference. The micropore and mesopore size distributions of the samples were determined from

113
the adsorption branch by the Nonlocal Density Functional Theory (NLDFT) and from the
desorption branch using the Barret-Joyner-Halenda (BJH) algorithm, respectively.
Chemical composition of the zeolite powders was analyzed by inductively coupled plasma
optical emission spectroscopy (ICP-OES) using a Varian ICP-OES 720-ES.
The copper sites were studied by variable temperature pulsed EPR carried out at X-band (9.64
GHz) using a Brüker ELEXSYS E580 FT spectrometer. 63Cu and 29Si MAS NMR spectra were
recorded by a Brüker 500 MHz spectrometer.
Additionally, in situ study of adsorption of probe molecules (NO, CO) on copper containing
zeolite samples was performed. The FTIR spectra of self-supported zeolite pellets (d = 16 mm,
m = 20 mg) were recorded using a Thermo-Nicolet Nexus instrument in an in situ transmission
cell both at standard temperature (298 K) and at 100 K. Prior to the IR measurements, the
samples were activated under oxygen atmosphere or in vacuum at 673 – 723 K, in order to
study different copper species.
The state of copper was also characterized by diffuse reflectance UV-vis spectroscopy utilizing
a Varian Cary 4000 spectrophotometer under ambient conditions (room temperature, air) and
under heating up to 623 K in argon flow; the UV-vis spectra were plotted using the Kubelka–
Munk function.
The X-ray photoelectron (XPS) measurements were carried out on an ESCALAB Mk II (VG
Scientific) electron spectrometer (base vacuum of 10-8 Pa). XPS spectra were recorded using
electron spectrometer equipped with a twin Mg/Al anode X-ray source and the instrumental
resolution was of 1.06 and 1.18 eV for Mg Kα and AI Kα excitation sources, respectively. The
energy scale was corrected with respect to the C1s - peak maximum at 285.0 eV for electrostatic
charging. The processing of the measured spectra included a subtraction of X-ray satellites and
Shirley-type background. The peak positions and areas were evaluated by a symmetrical
Gaussian-Lorentzian curve fitting. The relative concentrations of the different species were

114
determined by normalization of the peak areas in regard to their photoionization cross-sections
calculated by Scofield.4,5
Results and discussion
The copper containing LTL nanosized zeolite (K-Cu-LTL IS) is prepared via a template-free
synthesis route. The XRD patterns indicate that the K-Cu-LTL IS sample exhibits typical peaks
associated with the LTL zeolite structure (Figure 2).6 It should be noted, that either CuO (35.5°
and 38.6° 2θ) or Cu2O (36.44° 2θ) phases are not detected in the XRD pattern of the K-Cu-
LTL IS.7 The influence of the copper introduced by in situ and ion exchange approaches on the
change of the unit cell parameters of the as-prepared hydrated samples was evaluated by
applying the Pawley fit (see Chapter 2). The unit cell parameters of parent LTL, K-Cu-LTL IS
and K-Cu-LTL IE samples are presented in Table 1.

115
Figure 2 XRD patterns of (a) parent LTL, (b) K-Cu-LTL IE and (c) K-Cu-LTL IS samples.
Table 1 Unit cell parameters of samples and size of the crystals determined by Pawley fit using X’Pert HighScore Plus software
Sample a = b, Å c, Å V, Å3 Size, nm*
Parent LTL 18.372990 7.540921 2204.523 11
K-Cu-LTL IE 18.374080 7.544786 2205.916 11
K-Cu-LTL IS 18.359850 7.533496 2199.205 15
*Obtained from the X’Pert HighScore Plus software, that used Scherrer algorithm
It is known from the literature, that the incorporation of metal cations with ionic radius distinct
from Si4+ and Al3+ can affect the unit cell parameter.8 Table 1 reviles the moderate expansion
of the unit cell parameters in the K-Cu-LTL IE sample. On the contrary, a contraction of the
unit cell parameters for sample K-Cu-LTL IS is observed. Since the effective ionic radius of

116
Cu2+ (0.062 nm for coordination number IV) is larger than those of Si4+ (0.026 nm for
coordination number IV) and Al3+ (0.039 nm for coordination number IV),9 one would expect
the expansion of the unit cell in case of the incorporation of Cu ions into the framework sites
of the LTL type zeolite structure (K-Cu-LTL IS). While in the case of copper introduction via
ion exchange, the smaller Cu2+ ion (0.062 nm) substitutes K+ with larger ionic radius (0.138
nm). In earlier papers, it has been found, that the hydration of the zeolites influences the unit
cell parameters and more specifically FAU type zeolite was considered.10 Therefore,
thermogravimetrical analysis (TG) of the hydrated samples were performed. The TG curves
show similar shapes, the weight loss below 180 ºC corresponds to the water removal from the
zeolite structure (Figure 3).11 The weight loss of the K-Cu-LTL IE sample is higher (18 %)
than for the K-Cu-LTL IS (13 %), which indicates higher hydrophobicity of the K-Cu-LTL IE
in comparison to parent LTL and K-Cu-LTL IS samples. This could explain the increase in the
unit cell parameters of the ion exchanged K-Cu-LTL IS sample.

117
Figure 3 TG/DTG curves for (a) parent LTL, (b) K-Cu-LTL IE and (c) K-Cu-LTL IS samples
Copper complexes are known in oxidation states ranging from 0 to 4+, however the most
common are the 2+ (cupric) and the 1+ (cuprous) oxidation states, with the divalent state
prevailing. The coordination numbers and geometries of copper complexes vary with oxidation
state. Thus, the majority of the characterized Cu (III) complexes are square planar and
diamagnetic, for the spherically symmetric Cu (I) d10 ion; the common geometries are two-
coordinate linear, three-coordinate trigonal planar, and four-coordinate tetrahedral. Some
distortions from these ideal geometries are observed, particularly with chelating ligands. The
d9 Cu (II) ion is commonly found in a tetragonal coordination environment, with four shorter
equatorial bonds and another one or two longer axial bonds and less often with two shorter
axial bonds and four longer equatorial bonds. Four-coordinate tetrahedral and planar
complexes are also known, for instance, the CuCl42− ion, which crystallized in geometries
ranging from square planar (usually green) to almost ideal tetrahedral (usually orange).

118
Additionally, five-coordinate trigonal bipyramidal to square-planar complexes have been
reported.12 The Cu (II) oxides M2CuO3 (M = Ba, Sr) contain linked CuO4 planar units. The
crystal structures of some pyrophosphate-containing compounds comprise square-planar CuO4
units in open-framework structures. Also square planar, trigonal bipyramidal, and distorted
octaheral geometries are found for the copper ions in mixed strontium-copper phosphate
structures.12 It has been emphasized, that oxides containing transition metal ions with partially
filled eg orbitals like Cu2+ will undergo strong Jahn-Teller (JT) distortion.13 From the above
considerations, the Cu – O – Cu angles and Cu – O bond distances will be affected by the
environment of the copper, which in turn could affect the unit cell parameter of the materials
(in our case zeolite) and lead to its diminution, as it has been shown for substitution of Si by
Al.14,15
The porosity of the samples was analyzed by N2 sorption (Figure 4). The N2 sorption isotherm
of the K-Cu-LTL IS sample exhibits mixed type I and IV with a sharp uptake at low relative
pressure and a slowly increasing one at higher relative pressure, similar to the ones observed
for parent LTL and K-Cu- LTL IE samples, which are typical for micro/mesoporous materials.

119
Figure 4 Nitrogen adsorption/desorption isotherms of (a) parent LTL, (b) K-Cu- LTL IE and (c) K-Cu-LTL IS samples
Table 2 BET surface area (SBET), micro- (Vmic), meso- (Vmeso) and total (Vtot) pore volumes of parent LTL, K-Cu- LTL IE and K-Cu-LTL IS samples
Sample SBET, m2 g-1
Vmic, cm3 g-1
Vtot, cm3 g-1
Vmes, cm3 g-1
Parent LTL 571.4 0.12 1.00 0.88
K-Cu-LTL IE 571.9 0.11 1.04 0.93
K-Cu-LTL IS 511.4 0.11 0.91 0.80
As can be seen from the Table 2, all samples show a large BET surface area and pore volume,
suggesting the existence of abundant open pores. Compared to parent material and the material
obtained via ion exchange, the K-Cu-LTL IS samples demonstrate a slight decrease in the BET
surface area which is probably due to the negligible change in the particle size distribution.
Indeed, according to the XRD results, the size of the crystallites in the K-Cu-LTL IS sample is
slightly larger in comparison to the other two samples (Table 1). The size of the parent LTL

120
crystals is 11 nm, and reaches 15 nm when Cu is introduced by in situ approach (sample K-Cu-
LTL IS). In addition, the pore blockage does not take place, since the samples do not
demonstrate a decrease in the micropore volume neither for K-Cu-LTL IS nor K-Cu-LTL IE.
The chemical composition of all samples as prepared (LTL, K-Cu-LTL IE, K-Cu-LTL IS) and
in proton form (H-Cu-LTL IS) measured by ICP-OES and EDX is presented in Table 3.
Table 3 Chemical composition of samples measured by ICP-OES and EDX (the elemental ratios are obtained from the atomic percent of the elements)
Sample ICP-OES EDX
Si/Al K/Al Cu/Al Si/Al K/Al Cu/Al
Parent LTL 2.90 2.18 - 2.46 0.89 -
K-Cu-LTL IE 2.83 1.37 0.06 2.59 0.82 0.12
K-Cu-LTL IS 2.91 1.99 0.07 2.60 0.95 0.08
H-Cu-LTL IS - - - 2.56 0.36 0.08
As can be seen, the amount of copper in both series of experiments is similar, that allows further
comparison of the copper species in the zeolite crystals obtained via ion exchange and in situ
synthesis approaches. The amount of copper introduced in the samples corresponds to one
copper atom per unit cell of LTL crystals, though the silicon to aluminum ratio Si/Al is not
expected to change significantly with incorporation of Cu species in the framework.
Interestingly, the chemical analysis of the sample after NH4Cl ion exchange (H-Cu-LTL IS)
indicates that only K+ ions have been eliminated.
It is well known, that the UV−vis spectroscopy is sensitive to the oxidation state and
coordination of metals.16–18 Electronic spectra analysis involving d–d transitions is possible
only for Cu2+ (3d9) systems, since Cu+ ion has a fully occupied d shell (3d10).19 For copper, the
following transitions should be noted in the UV-vis spectral range (Table 4).18

121
Absorption range Nature of transitions Symmetry (valency)
16670-12500 cm-1 d-d of Cu2+ Octahedral (~tetragonally distorted)
13500-12500 cm-1 d-d of Cu2+ Octahedral
16670 cm-1 d-d of Cu2+ Strong distortion (nearly square planar)
11765-11111 cm-1 d-d of Cu2+ Square pyramid
10000-5880 cm-1 d-d of Cu2+ Tetrahedral
25000-22222 cm-1 Emission/adsorption of a photon
Cu+ three-dimensional clusters in CuO
44444-16949 (edge at 17241-16949) cm-1
Conduction band Metallic Cu0
40000-35714, 32258 and 28571 cm-1
Charge transfer O2- → Cu2+ Cu2+
31250 and 22727 cm-1 Charge transfer Cu2+-O2−-Cu2+
UV up to 31250 cm-1 d10-d9s1 (d104s-d104p) Cu+ (Cu0)
15385 nm d-d of Cu2+ Distorted octahedral (square planar
The diffuse reflectance UV-vis spectra of the samples before and after dehydration under Ag
flow at 623 K are depicted in Figure 5. Several signals in the UV−vis spectra of the samples
reveal the existence of various copper species. The strong band at ∼38460 cm-1 is assigned to
charge transfer transitions from oxygen in the zeolite crystal lattice O2- to isolated copper ion
Cu2+ (O2- → Cu2+), suggesting the existence of mononuclear Cu2+ ions in both ion exchanged
(K-Cu-LTL IE) and in situ (K-Cu-LTL IE) prepared samples, while this signal is absent in the
parent LTL material. The K-Cu-LTL IE additionally exhibits broad adsorption band between
33333 and 16670 cm-1. It has been reported, that Al sites distribution in the material affects the
concentration and the type of the hydrated Cu2+ complexes presented in the Cu-exchanged
SSZ-13: (i) divalent complexes charge compensated by a pair of nearby Al, e.g. [Cu(H2O)6]2+
or [Cu–O(L)6−n(H2O)n]2+ (where O(L) are oxygen framework atoms coordinated to Cu2+); (ii)
“monovalent” complexes charge compensated by one Al atom, e.g. [Cu–OH(H2O)5]+ or [Cu–
(OH)O(L)5−n(H2O)n]+.19 Hence, the presence of one or more ligands with different
Table 4 Assignments of the DRS adsorption maxima of copper compounds (adapted from [12])

122
electronegativity (e.g. OH−, framework oxygen) yield in a more distorted site and in a shift of
the absorption band to higher frequencies.19 Even though, the band is too broad to discriminate
the co-presence of the transitions of different species, the observed band might be assigned to
some Cu+ clusters or oligomeric species [Cu2+-O2−-Cu2+], or most probably to hydrated
distorted square planar Cu2+, since after dehydration at 623 K this broad band disappears, and
copper species change their coordination to octahedral or distorted octahedral coordination
(transition at 12500 cm-1). This can be explained with a tendency of Cu2+ to migrate inside the
zeolite cavities and lose the ligands upon heating, which is in agreement with previous
reports.18,20 Unlike ion-exchanged sample, the K-Cu-LTL IS sample displays a tail peak around
31642 cm- 1 that emerges before and after dehydration at 623 K, suggesting the presence of
[Cu2+-O2−-Cu2+] that are stable upon heating. Yet, no information can be extracted on the
coordination of the isolated Cu2+ ions.

123
Figure 5 DR UV-vis spectra of (a) parent LTL, (b) K-Cu-LTL IE hydrated, (c) K-Cu-LTL IE dehydrated at 623 K, (d) K-Cu-LTL IS hydrated and (e) K-Cu-LTL IS dehydrated at 623 K samples
XPS was used to gain insight on the relation between distribution and environment of Cu sites
and the synthesis procedure applied for the preparation of copper containing zeolite samples.
In the literature, copper is characterized by the 2p3/2 level with an energy 932.5±0.24 eV for
copper (I), while for copper(II) these values are 933.57 ± 0.39 eV for oxides, and 934.75 ± 0.50
eV for hydroxides and the presence of high-energy shake-up satellites for 2p bands.5,21–24

124
Figure 6 XPS spectra of (A) K-Cu-LTL IE and (B) K-Cu-LTL IS samples
Figure 6 shows a comparison between samples obtained by direct synthesis (K-Cu-LTL IS)
and ion exchange (K-Cu-LTL IE) approaches. For the K-Cu-LTL IS sample, the Сu 2p3/2 band
consists of two components: 934.9 eV (86%) and 933.4 eV (80%) with satellite features at
about 943 eV. In case of the copper(I) valence state, an additional spectral component with a
lower (about 932 eV) binding energy would appear. Accordingly, both high and low-energy
spectral components have been assigned to two different types of Cu2+ with different
environment.24
The XPS spectrum of the K-Cu-LTL IE consists of two components: 934.7 eV (65%) and 932.5
eV (35%) with the satellite at about 943 eV, thus suggesting the existence of both Cu2+ and
Cu+ species at the same time. The presence of Cu+ state in the hydrated sample can be explained
by the partial reduction under long X-ray exposure or ion bombardment under ultrahigh
vacuum conditions treatments.25 In summary, the above results denote the occurrence of
several types of Cu2+ species with different environment. Some occluded extra-framework Cu2+
species in the K-Cu-LTL IS sample, that could not be removed together with K+ during the
exchange with NH4Cl are seen. In the ion-exchanged sample (K-Cu-LTL IE) mainly isolated
Cu2+ cations in different coordination, that can be easily reduced to Cu+ are measured.

125
Adsorption of CO probe molecule on copper containing samples study by FTIR spectroscopy
The distribution of copper species is also studied by adsorption of probe molecule (CO) on K-
Cu-LTL IS and H-Cu-LTL IS samples. The IR spectra (C-O-stretching region) of the K-Cu-
LTL IS sample are shown in Figure 7 (A, B). The CO adsorption spectra of both pre-treated in
oxygen and in vacuum at 673 K for H-Cu-LTL IS sample are depicted in Figure 8 (A, B); CO
stretching frequencies are summarized in the Tables 5 to 8. Various pretreatment conditions
were used to monitor the changes of copper species occurring after exposing the sample to
different atmosphere and after converting the material in NH4+-form.
Figure 7 Evolution of the IR spectra in the 2300-2000 cm-1 range upon interaction with CO probe molecule (5-60 Torr) at 100 K. K-Cu-LTL IS sample activated at 673 K in vacuum (A) and activated at 673 K in O2 (B)
Table 5 Assignment of C–O stretching frequencies observed for the K-Cu-LTL IS sample
No. Species Mode Frequency, cm-1
Notes
1 Cu+-(CO)2 / K+-CO
νas(CO) 2150 Appear at 100 K, unstable upon evacuation at RT
2 Cu+-CO / K+-CO
νs(CO) 2161 Appear at 100 K, unstable upon evacuation at RT
3 Cu+-CO ν(CO) 2128 Appear at 100 K, unstable upon evacuation at RT
4 Cu+-CO / Cu0-CO
ν(CO) 2103 Populated first at 100K, unstable upon evacuation at RT

126
Adsorption of CO (5 – 20 torr) on the K-Cu-LTL IS sample, activated under vacuum at 673 K,
leads to the appearance of band at 2103 cm-1, that can be presumably assigned to both Cu0-CO
and Cu+-CO (Figure 7A). The bands at 2150 and 2163 cm-1, that appear simultaneously and in
the first approximation are assigned to C-O-stretching of K+· · ·CO adducts according to
previous reports.26 The IR spectra collected for K-Cu-LTL IS sample, activated at 673 K under
oxygen at 673 K leads to the appearance of mainly the bands at 2150 and 2163 cm-1 (Figure
7B). High intensity of these bands in comparison to the results obtained under vacuum suggests
that there is spectral overlapping of several different species. The intensity of the band at 2103
cm-1 decreases substantially after samples treatment under O2; a peak shoulder at 2127 cm-1 is
observed as well. Comparison of the results presented in Figures 7 A and B shows significant
oxidation of copper in O2 atmosphere. Zecchina et al. show that in the presence of pre-adsorbed
Lewis bases, such as NH3, a downward shift of the ν(CO) was observed.27 Since ammonium
hydroxide was used in the synthesis, it could be assumed that some residue could be still
presented in the K-Cu-LTL IS sample. However, the initial IR spectrum of the K-Cu-LTL IS
sample does not reveal a complex absorption in the 3500-3100 cm-1 range due to ν(NH); a peak
at 1610 cm-1 due to δ(NH) is not present either.27 In addition, the TG data reveals the weight
loss attributed to the water only. On the other hand, the lower frequencies of CO coordinated
to Cu+ ions may be explained by the higher coordination of the latter when supported on oxides
rather than on zeolites, that leads to a lower electrophilicity and a weaker σ bond with CO.
Thus, the complexes are less stable and the frequency of adsorbed CO is at lower
wavenumbers.28 Indeed, reduced bulk CuO has been characterized by two bands at 2115-2100
cm-1 and 2135 cm-1, while the Cu+-CO band for bulk Cu2O has been found at 2127 cm-1. The
band at 2150 cm-1, that appears at higher coverage, has been considered as an evidence of the
formation of the Cu+-(CO)2 dicarbonyls. While the peak at 2160 cm-1 as previously found in
zeolite CuY was assigned to Cu+-CO complexes.

127
Figure 8 Evolution of the IR spectra of sample H-Cu-LTL IS in the 2300-2000 cm-1 range upon interaction with CO (5-60 Torr) at 100 K: sample activated at 673 K in vacuum (A) and O2 (B).
Table 6 Assignment of the C–O stretching frequencies measured for the H-Cu-LTL IS sample.
No. Species Mode Frequency, cm-1 Notes1 Cu+-CO ν(CO) 2140
2128
2160
Populated first, stable upon evacuation at RT Populated first, stable upon evacuation at 423 K
2 Cu+-(CO)2 νs(CO) νas(CO)
2177 2150
Appear at high coverages at 100 K, not stable upon evacuation
3 Cu2+-CO ν(CO) 2190 Unstable upon evacuation at 100 K
4 K+-CO νs(CO) νas(CO)
2163 2150
Appears at higher coverages at 100 K, unstable upon evacuation
5 OH-group ν(CO) 2160 2177
Interaction with silanol group Interaction with bridging OH group
6 Al3+-CO ν(CO) 2230 Appears at 100 K, unstable upon evacuation
Figure 8 shows H-Cu-LTL IS sample pretreated at 673 K in vacuum and under oxygen
atmosphere. The modification of the spectra in comparison to the K-Cu-LTL IS samples is
evident. These two samples show identical spectral features as the K-Cu-LTL IE sample
obtained via ion exchange approach; the bands at 2140 and 2128 cm-1 (Cu+-CO) are the first to
be populated. The first difference from the previous observations for the ion-exchanged sample
is the intensity of the two bands at 2177 and 2163 cm-1. The peak at 2177 cm-1 corresponds to

128
the interaction of CO with bridging OH-groups, thus confirming the success of the ion
exchange with NH4Cl.28 Another important difference compared to K-Cu-LTL IE sample, is
the lower intensity of the bands at 2140 and 2128 cm-1 (Cu+-CO). It is worth reminding, that
the amount of copper is the same in both samples obtained by in situ (K-Cu-LTL IS) and ion
exchange (K-Cu-LTL IE) approaches. The results indicate a lower concentration of Cu+-species
able to interact with CO in the K(H)-Cu-LTL IS sample.
Adsorption of NO probe molecule on copper containing samples study by FTIR spectroscopy
Figure 9 Evolution of the IR spectra of sample K-Cu-LTL IS in the 2400-1500 cm-1 range upon interaction with NO (10-40 Torr) at 100 K: sample activated at 673 K in vacuum (A) and O2 (B).

129
Table 7 Assignment of the N–O stretching frequencies measured for the K-Cu-LTL IS sample.
No. Species Mode Frequency, cm-1
Notes
1 Cu+-NO ν(NO) 17952 Cu2+-NO ν(NO) 1858
1870 Two different Cu2+-sites on the CuO
1884 Cu2+ sites in square planar configuration3 K+-NO ν(NO) 1870
1886 Detected at 100 K, unstable upon evacuation
4 N2O ν(N-N) 22505 NO2/N2O4 νas(NO2) 1670
1746
The NO adsorption of calibrated doses from 10 to 40 torr on the samples at low temperature
was performed. The IR spectra for K-Cu-LTL IS sample is shown in Figure 9A, B.29 The
observed bands and their assignments are summarized in Table 7.
The K-Cu-LTL IS sample pretreated in vacuum at 673 K reveals several bands. The peaks at
1858 and 1870 cm-1 are characteristic for Cu2+-NO species of CuO and correspond to two
different Cu2+ sites. While the peak at 1884 cm-1 corresponds to Cu2+ sites in square planar
coordination.16,29,30 The second set of bands includes peaks at 1795 cm-1 represents the
interaction of NO with Cu+-sites.29 One more peak shoulder centered at 1870 cm-1 and 1886
cm-1 has been assigned to the K+· · ·NO monomers.31 The latter are masked in the case of the
samples pretreated in O2 or under vacuum. All four samples contain the peak at 2245 cm-1, that
has been previously described as weakly bonded N2O with zeolites.31 The peaks centered at
1670 cm-1 and 1746 cm-1 have been attributed to N2O4 or NO2, respectively. The presence of
various NxOy in the spectra could be explained by NO disproportion or by the contamination
of the NO.29 It can be clearly observed, that the appearance of the latter bands strongly depends
on the properties of the surface of the samples that are tailored during the pretreatment, but not
on the contamination of NO. The bands at 2245 cm-1 and 1680 cm-1 disappear after interaction
of the samples with oxygen at 673 K (Figure 9B). The main peaks are still present, however
the bands assigned to Cu2+ species are of higher intensity, while the band at 1796 cm-1 has
lower intensity.

130
In general, the behavior of NO adsorption in the K-Cu-LTL IS samples follows the same trend
as for CO adsorption, sustaining the presence of the CuO extra-framework species in the
system.
Figure 10 Evolution of the IR spectra of sample H-Cu-LTL IS in the 2400-1500 cm-1 range upon interaction with NO (10-40 Torr) at 100 K activated at 673 K in vacuum (A) and O2 (B).
Table 8 Assignment of the N–O stretching frequencies observed for the H-Cu-LTL IS sample.
No. Species Mode Frequency, cm-1
Notes
1 Cu+-NO ν(NO) 1790 1810
Converts to dinitrosyls, not stable upon evacuation
2 Cu2+-NO ν(NO) 1910 1936 1958
Isolated Cu2+ sites in square pyramidal configuration Correspond to associated Cu2+ sites
3 Cu2+-NO ν(NO) 1858 1870
Two different Cu2+-sites on the CuO
4 Cu+-(NO)2 νs(NO) νas(NO)
1825 1725
Appear at high coverages at 100 K, not stable upon evacuation
5 K+-NO ν(NO) 1870 1890
Detected at 100 K, unstable upon evacuation
6 N2O4 νas(NO2) 1747 1715
Weakly adsorbed, unstable upon evacuation at 100 K
7 NO2 or N2O4
νas(NO2) 1685
8 Bridging nitrates
ν3(split
mode)
1663 Extra- framework copper site
9 Bidentate nitrate
ν3(split
mode)
1566, 1304 Adsorption on isolated copper–oxygen species
10 cis-(NO)2 νs(NO) νas(NO)
1863 1778
Weakly adsorbed in the zeolite channels, unstable upon evacuation at 100 K
11 N2O ν(N-N) 2245 Weakly bonded in zeolite channels, unstable upon evacuation at 100 K
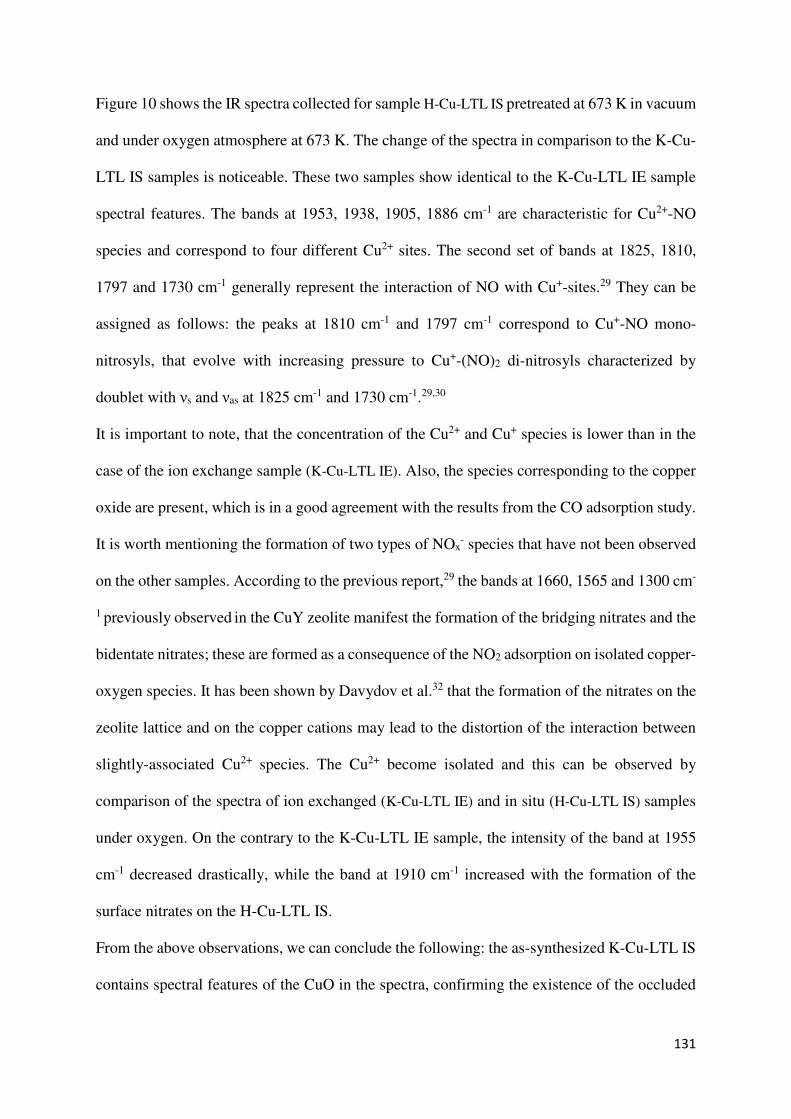
131
Figure 10 shows the IR spectra collected for sample H-Cu-LTL IS pretreated at 673 K in vacuum
and under oxygen atmosphere at 673 K. The change of the spectra in comparison to the K-Cu-
LTL IS samples is noticeable. These two samples show identical to the K-Cu-LTL IE sample
spectral features. The bands at 1953, 1938, 1905, 1886 cm-1 are characteristic for Cu2+-NO
species and correspond to four different Cu2+ sites. The second set of bands at 1825, 1810,
1797 and 1730 cm-1 generally represent the interaction of NO with Cu+-sites.29 They can be
assigned as follows: the peaks at 1810 cm-1 and 1797 cm-1 correspond to Cu+-NO mono-
nitrosyls, that evolve with increasing pressure to Cu+-(NO)2 di-nitrosyls characterized by
doublet with νs and νas at 1825 cm-1 and 1730 cm-1.29,30
It is important to note, that the concentration of the Cu2+ and Cu+ species is lower than in the
case of the ion exchange sample (K-Cu-LTL IE). Also, the species corresponding to the copper
oxide are present, which is in a good agreement with the results from the CO adsorption study.
It is worth mentioning the formation of two types of NOx- species that have not been observed
on the other samples. According to the previous report,29 the bands at 1660, 1565 and 1300 cm-
1 previously observed in the CuY zeolite manifest the formation of the bridging nitrates and the
bidentate nitrates; these are formed as a consequence of the NO2 adsorption on isolated copper-
oxygen species. It has been shown by Davydov et al.32 that the formation of the nitrates on the
zeolite lattice and on the copper cations may lead to the distortion of the interaction between
slightly-associated Cu2+ species. The Cu2+ become isolated and this can be observed by
comparison of the spectra of ion exchanged (K-Cu-LTL IE) and in situ (H-Cu-LTL IS) samples
under oxygen. On the contrary to the K-Cu-LTL IE sample, the intensity of the band at 1955
cm-1 decreased drastically, while the band at 1910 cm-1 increased with the formation of the
surface nitrates on the H-Cu-LTL IS.
From the above observations, we can conclude the following: the as-synthesized K-Cu-LTL IS
contains spectral features of the CuO in the spectra, confirming the existence of the occluded

132
extra-framework Cu. However, after ion exchange with ammonium chlorite the H-Cu-LTL IS
sample reveal the Cu+-CO complexes characteristic for sample obtained via ion exchange (K-
Cu-LTL IE). There are two possible explanations: part of Cu which interacts with CO and NO
is in the extra-framework sites of the K-Cu-LTL IS sample and the other part is in the
framework (1) or is not accessible to the probe molecules (2); the copper become accessible
after interaction with NH4Cl due to partial distortion of the crystal structure of the zeolite.
Hydroxyl Region in the IR spectra of copper containing zeolite samples
Figure 11 FTIR spectra for zeolite samples after evacuation at 673 K in the range of (A) 3800 – 3500 cm-1 and (B) 3700 – 3600 cm-1: (a) as-prepared parent K-LTL, (b) H-LTL, (c) K-Cu-LTL IE, (d) K-Cu-LTL IS and (e) H-Cu-LTL IS.
The hydroxyl region of the IR spectra was evaluated after thermal activation of samples in
vacuum; under this treatment mainly water was removed from the zeolites.33 The FTIR spectra
of samples after pretreatment at 673 K for 14 h are shown in Figure 11. The bands at high
frequencies result from the stretching vibrations of hydroxyl groups.16 The sharp maximum at
3747 cm−1 reflects the presence of the silanol hydroxyl groups located on the internal surface
of the zeolite. Almost the same relative intensity of these bands is observed and this
demonstrates the small size of the zeolite crystals. A weak band at 3725 cm−1 in the spectra of
parent K-LTL and H-LTL samples may be due to stretching vibrations of hydroxyl groups of
internal silanol defects.16,33 No band at about 3670 cm−1 is found that is generally assigned to

133
hydroxyl groups of Al(OH) described as extra framework aluminum species (EFAS) in all
samples.33 The weak band at 3650 cm−1 for samples H-LTL and H-Cu-LTL IS appears, which is
a consequence of the ion exchange with NH4Cl; this is typical for stretching vibrations of
unperturbed Brønsted acid sites (bridging ≡Si(OH)Al≡ hydroxyl groups).
Figure 12 FTIR spectra of samples after pyridine adsorption at 423 K and evacuation at 523 K for 30 min: (a) as-prepared K-LTL, (b) K-Cu-LTL IE, (c) H-LTL, (d) K-Cu-LTL IS and (e) H-Cu-LTL IS
Pyridine Adsorption on copper containing zeolite samples
Pyridine (Py) adsorption on copper containing zeolite samples was carried out at 423 K
followed by evacuation at 423-673 K with the step of 50 K for 30 min at each temperature. The
FTIR spectra of the samples taken after evacuation at 523 K for 30 min are shown on Figure
12. The parent LTL, and K-Cu-LTL IS and K-Cu-LTL IE samples contain the Lewis acid sites
(LAS). The pyridine is coordinated with extra-framework aluminum and copper cations, which
is evidenced by the presence of bands at 1623 and 1455 cm-1 and 1608 and 1453 cm-1,
respectively.16 It is important to mention that the intensity of the latter bands increases after
post-synthesis modification of the samples, probably due to partial destruction of the zeolite

134
structure. The LTL zeolite in proton form (H-LTL) and sample H-Cu-LTL IS contain Brønsted
acid sited (BAS) as indicated by the presence of IR bands at 1545 and 1637 cm-1. This confirms
that the copper cations were exchanged by NH4+; the LAS are also measured, i.e. the bands at
1453-1455 cm-1 and 1623 and 1608 cm-1 are present. An important observation can be deduced
from the spectrum of the copper-containing H-Cu-LTL IS sample. The intensity of the IR band
at 1608 cm-1 is much higher than that for the K-Cu-LTL IS zeolite and is of the same intensity
as for the K-Cu-LTL IE material, which shows the accessibility of extra-framework Cu2+
species after interaction with ammonium chlorate, thus confirming the above findings.
Conclusions
New copper-containing LTL type zeolite has been prepared by the facile organic template-free
synthesis approach and systematically compared to the sample obtained via ion exchange
method. It has been shown, that the state and behavior of copper in LTL zeolite strongly depend
on the method used for the Cu inclusion. The direct incorporation of copper into the zeolite
synthesis gel leads to the shrinkage of the unit cell parameters of the final crystals, while the
post synthesis inclusion of copper leads to its expansion, which is probably cause by different
affinity towards water of these two samples. The copper introduced by in situ synthesis
approach shows distinct environment and occupies different position in comparison to the ion
exchange sample. The copper is partially located in the zeolite framework and is
unapproachable by the probe molecules (CO, NO and Pyridine). The post-synthesis
modification of the sample with ammonium chlorate and high temperature treatment under
oxygen cause the displacement of a significant amount of Cu to the extra-framework positions.
This makes the copper species accessible for probe molecules. Some Brønsted acid sites are
detected as well, that were not present in as-prepared materials, thus confirming the successful
substitution of K+ cations for NH4+, while copper species remain intact.

135
References
1 K. G. Ione and L. A. Vostrikova, Russ. Chem. Rev., 1987, 56, 393–427.
2 K. G. Ione, L. A. Vostrikova and V. M. Mastikhin, J. Mol. Catal., 1985, 31, 355–370.
3 G. Perego, R. Millini and G. Bellussi, Mol. Sieves, 1998, 1.
4 A. Sachse, V. Hulea, K. L. Kostov, E. Belamie and B. Alonso, Catal. Sci. Technol.,2015, 5, 415–427.
5 M. Milanova, R. Iordanova, K. L. Kostov and Y. Dimitriev, J. Non. Cryst. Solids,2014, 401, 175–180.
6 http://europe.iza-structure.org/IZA-SC/framework.php?STC=LTL
7 A. Kharchenko, O. I. Lebedev, V. Zholobenko, V. de Waele and S. Mintova, J. Phys.
Chem. C, 2016, acs.jpcc.6b08045.
8 H. Van Bekkum, E. M. Flanigen, P. A. Jacobs and M. S. Rigutto, in Studies in Surface
Science and Catalysis, 2001, pp. 911–955.
9 R. D. Shannon and C. T. Prewitt, Acta Crystallogr. Sect. A Found. Crystallogr., 1967,III.
10 P. O. Fritz, J. H. Lunsford and C.-M. Fu, Zeolites, 1988, 8, 205–208.
11 O. Larlus, S. Mintova and T. Bein, Microporous Mesoporous Mater., 2006, 96, 405–412.
12 R. R. Conry, Encycl. Inorg. Chem., 2006, 1–19.
13 B. Murphy and B. Hathaway, Coord. Chem. Rev., 2003, 243, 237–262.
14 M. A. Camblor, S. B. Hong and M. E. Davis, Chem. Commun., 1996, 425–426.
15 G. E. Bnown, G. V. Gibbs and P. H. Ribbe, Am. Mineral., 1969, 54, 1044–1061.
16 P. Kaminski, I. Sobczak, P. Decyk, M. Ziolek, W. J. Roth, B. Campo and M. Daturi, J.
Phys. Chem. C, 2013, 117, 2147–2159.
17 M. Rutkowska, U. Diaz, A. E. Palomares and L. Chmielarz, Appl. Catal. B Environ.,2015, 168–169, 531–539.
18 H. Praliaud, S. Mikhailenko, Z. Chajar and M. Primet, Appl. Catal. B Environ., 1998,16, 359–374.
19 F. Giordanino, P. N. R. Vennestrøm, L. F. Lundegaard, F. N. Stappen, S. Mossin, P.Beato, S. Bordiga and C. Lamberti, Dalt. Trans., 2013, 42, 12741–61.
20 G. Centi and S. Perathoner, Appl. Catal. A, Gen., 1995, 132, 179–259.
21 H.-Y. Zheng, J.-Z. Wang, Z. Li, L.-F. Yan and J. Z. Wen, Fuel Process. Technol., 2016, 152, 367–374.
22 M. NARAYANA, S. CONTARINI and L. Kevan, 1985, 375, 370–375.
23 S. Contarini and L. Kevan, 1986, 1630–1632.
24 Y. M. Zhukov, A. Y. Efimov, E. V Zhizhin, D. A. Pudikov and V. P. Petranovskii,2016, 103, 448–451.
25 http://xpssimplified.com/elements/copper.php
26 G. Turnes Palomino, C. Otero Areán, F. Geobaldo, G. Ricchiardi, S. Bordiga and A.Zecchina, J. Chem. Soc. Faraday Trans., 1997, 93, 189–191.

136
27 A. Zecchina, S. Bordiga, G. Turnes Palomino, D. Scarano, C. Lamberti and M.Salvalaggio, J. Phys. Chem. B, 1999, 103, 3833–3844.
28 K. I. Hadjiivanov, Adv. Catal., 2002, 47, 307–511.
29 K. Hadjiivanov, Catal. Rev., 2000, 42, 71–144.
30 I. Sobczak, M. Ziolek, M. Renn, P. Decyk, I. Nowak, M. Daturi and J. C. Lavalley,Microporous Mesoporous Mater., 2004, 74, 23–36.
31 C. Lamberti, A. Zecchina, E. Groppo and S. Bordiga, Chem. Soc. Rev., 2010, 39,4951–5001.
32 A. A. Davydov and Y. A. Lokhov, React. Kinet. Catal. Lett., 1978, 8, 47–52.
33 S. Bordiga, C. Lamberti, F. Bonino, A. Travert and F. Thibault-Starzyk, Chem. Soc.
Rev., 2015, 44, 7262–7341.

137
Chapter 4
Copper containing LTL films for sensor application
Introduction
In the past decades, there is an increasing need in the selective sensors, that are able to detect
gaseous pollutants such as CO, CO2 and NOx at low concentrations (ppm levels).1
The versatility of the zeolites in terms of the pore structure, surface area, catalytic activity,
particle dimensions, and morphology makes them attractive for sensor and membrane
applications. Specifically, the high adsorption capacity, high surface area and porosity,
presence of mobile ions, and catalytic activity are of interest for the selective chemical sensors
preparation.2–5
Recent developments of synthesis procedures for zeolite nanocrystals and their arrangements
in thin-to-thick films, membranes and hierarchical bodies have pushed them into new, diverse
and economically significant applications that have not been recognized before. Zeolites can
be grown or assembled as thin films on a variety of supports, both inorganic (e.g. glass,
ceramic, metal) and organic (e.g. plastics, cellulose, wood). This allows to transfer some of the
characteristic properties of zeolites (adsorption, catalysis, molecular recognition and diffusion)
to a 2-dimensional structure and pushed their applications into a vastly expanded fields
including low-dielectric constant (low-k) insulating materials for computer chips, membrane
reactors, corrosion-resistant protective coatings for metallic alloys, and hydrophilic and
antimicrobial coatings for gravity-independent water separation in space.6–8
Various techniques have been developed for deposition of zeolite crystals onto supports such
as direct synthesis, seed methods and attachment of crystals on functionalized surfaces. Among
these methods, a spin coating approach is widely applied due to its simplicity. Spin-on process

138
is fast and offers operating precision, flexibility, and high uniformity over different surfaces.
Also, spin coating provides effective control on film thicknesses by varying the concentration
of suspensions and the spin-on rotation rates.8,9
It is also of great importance to evaluate the mechanical, interfacial and tribological properties
of zeolite films as these are critically important in providing the necessary mechanical strength,
fracture and wear resistance for the final integrated systems. 7
Hence, this work focuses on the preparation and characterization of copper-containing LTL
thin films assembled on silicon wafer, followed by measuring its capability for CO detection
as single analyte. The copper-containing LTL films have been exposed to low concentrations
of CO in the presence of water and characterized by operando IR spectroscopy.
Experimental
Materials
Cu-LTL zeolite was prepared according to the procedure described in Chapter 1.
Preparation of Cu-LTL thin films
Polyvinylpyrrolidone (PVP10, average molecular wt. 10000, Sigma-Aldrich), ethanol and
water were used as solvents for the preparation of the films.
The zeolite films were prepared by spin-coating approach on silicon wafers using Wafer
Spinner SPIN150-NPP. The silicon wafers with both polished sides were pre-cleaned with
ethanol and acetone prior to film deposition. The Cu-LTL suspension with a concentration of
solid particles (1 – 2 wt.%) was mixed with PVP10 (5 wt.% in ethanol or water) in the ratio of
1:10. This suspension was treated in the ultrasonic bath for 30 minutes and filtrated through
syringe filters (450 nm) prior to spin deposition on the substrate. The rotation speed of 2000
min-1 and duration of spinning for 30s were applied for the preparation of the films. This
coating procedure was repeated until the desired film thickness was obtained. High temperature

139
treatment of the films at 450 °C for 3 h under argon atmosphere was applied to improve the
mechanical properties of the films and to remove the binder (PVP).
Characterization
The short-range surface features and thickness of Cu-LTL films were examined by using a
field-emission scanning electron microscope MIRA TESCAN at an accelerating voltage 30.0
kV.
Nanoindentation tests were conducted on a MTS NanoXP system using a Berkovich diamond
indenter (minimal radius tip of 20 nm), in CSM (Continuous Stiffness Measurement) mode,
allowing to measure of hardness and modulus all along the tip penetration. Load measurement
sensitivity was 75 nN, displacement measurement sensitivity was 0.1 nm.
The detection of CO with copper containing zeolite films was followed by operando FTIR
spectroscopy using the procedure described elsewhere 3,10,11. Prior to CO delivery, the films
were subjected to activation in Argon atmosphere containing 5 % of hydrogen at 350 oC
(heating rate of 2 oC/min) for 4 hours. All the experiments were performed at atmospheric
pressure in argon flow containing 100 ppm of water by stepwise introduction of CO in the cell.
The IR spectra were collected in a continuous mode (32 scans/spectrum) with a Tensor 27
spectrometer (Bruker) equipped with a DTGS detector.
Results and discussion
The suspensions of Cu-containing LTL crystals in water were spin-coated on square-shaped
silicon wafers to form thin, quasi-continuous films. SEM top view images of the samples reveal
that the nanosized crystals cover the entire surface of the substrate (Figure 1A). The size of the
individual crystals is very difficult to estimate from the top and side views of the SEM pictures.
However, the high density and the homogeneity of the films along the support can be clearly
observed from the SEM pictures. The nanosized zeolite crystals are well packed and form dense

140
and homogeneous films with various thicknesses, which is achieved by several deposition steps
(Figure 1B).
Figure 1 SEM pictures of Cu-LTL film after calcination: (A) top view and (B) cross-section images taken for Cu-LTL film with different thicknesses (from top to bottom the film thickness is1200, 350 and 500 nm)
Nanoindentation test with a Berkovich diamond indenter was performed on the films with
various thickness.7 The targeted depths were 20 nm, 50 nm, 100 nm, 150 nm, 200 nm, 500 nm,
1µm, and 2 µm. However, the focus has been on measurements with a maximum depth of 200
nm (Figure 2).
5 µm
(A) (B)

141
(A)
(B)
Figure 2 Loading curves for Cu-LTL films with a thickness of (A) 350 nm, (B) 500 nm (for 1200 nm is not shown). Good reproducibility of the measurements with a good superposition of the load-displacement curves for each measurement is obtained
0
0,1
0,2
0,3
0,4
0,5
0,6
0,7
0 50 100 150 200 250 300
Loa
d (
mN
)
Displacement (nm)
20 nm
50 nm
100 nm
150 nm
200 nm
1 µm
0
0,05
0,1
0,15
0,2
0,25
0,3
0 50 100 150 200 250 300
Loa
d (
mN
)
Displacement (nm)
20 nm
50 nm
100 nm
150 nm
200 nm
500 nm
1 µm
2 µm

142
The films show permanent deformation, the so called plastic behaviour which is linked to a
residual deformation after unloading. This is confirmed by microscope observation of the
indents after testing (see the light zone around the indents, reflecting the presence of the
material plastic bulging, Figure 3). This probably reflects the unsticking of the film from the
Si-wafer, caused by the deformation field induced by the indenter tip, as it penetrates the
sample. This result may also be linked to a plastic behaviour of the film, but must strongly be
correlated to the Si substrate visco-plastic deformation.
Figure 3 Micrographs of the indents for zeolite films with a thickness of 1200 nm with indentation depth of (A) 1 μm and (B) 2 μm
Evolution of modulus and hardness at different penetration depths has been measured using
CSM mode, that allows obtaining data continuously during a nanoindentation process (Figure
4A, B). Principle is to superimpose small oscillation amplitude on the displacement (or load)
signal and to measure the load (or displacement) response. These oscillations could be
considered as series of loading-unloading processes done on very small depth intervals, so that
the mechanical properties can be measured as a function of the indentation depth. This
technique is particularly helpful for the characterization of coatings.
The influence of the substrate, that is much harder than the zeolite film (Young’s modulus ESi
wafer = 150-180 GPa and hardness HSi wafer = 10-13 GPa of the silicon wafer),12,13 is clearly
visible with the significant increase of the mechanical parameters at a penetration depth up to
200 nm (Figure 4 C,D).
(A) (B)

143
(A) (B)
(C) (D)
Figure 4 The evolution of modulus (A) and hardness (B) as a function of penetration depth from measurements done on Cu LTL sample with a thickness of 500 nm (middle thickness). The zoom on the measurements of modulus (C) and hardness (D) with the penetration depth less than 200 nm. The results obtained for the other two other samples with thicknesses of 350 and 1200 nm are similar and are not shown
The increase of modulus and hardness during the first stages of indenter penetration probably
corresponds to surface phenomena due to mostly electrostatic interactions between sample and
indenter tip.
0
2
4
6
8
10
12
14
16
18
20
0 500 1000 1500 2000 2500
Mo
du
lus
(GP
a)
Penetration depth (nm)
20 nm
50 nm
100 nm
150 nm
200 nm
500 nm
1 µm
2 µm
0
0,1
0,2
0,3
0,4
0,5
0,6
0,7
0,8
0,9
0 500 1000 1500 2000 2500
Ha
rdn
ess
(G
Pa
)
Penetration depth (nm)
20 nm
50 nm
100 nm
150 nm
200 nm
500 nm
1 µm
2 µm
0
2
4
6
8
10
12
0 50 100 150 200 250
Mo
du
lus
(GP
a)
Penetration depth (nm)
20 nm
50 nm
100 nm
150 nm
200 nm
500 nm
1 µm
2 µm
0
0,05
0,1
0,15
0,2
0,25
0 50 100 150 200 250
Ha
rdn
ess
(G
Pa
)
Penetration depth (nm)
20 nm
50 nm
100 nm
150 nm
200 nm
500 nm
1 µm
2 µm

144
Table 1 Modulus and hardness values of Cu-LTL films with thickness of 350, 500 and 1200 nm at indentation depth from 150 nm to 2000 nm
Cu-LTL film 350 nm
Indentation depth
(nm)
Modulus from loading
(GPa)
Hardness from loading
(GPa)
Modulus from unloading
(GPa)
Hardness from unloading
(GPa)
150 11.8 ± 5.4 25.32 ± 15.63 0.29 ± 0.09
200 12.39 ± 1.1 0.18 ± 0.02 37.85± 7.17 0.48 ± 0.09
500 17.92 ± 2.15 0.21 ± 0.02 58.91 ± 1.48 3.94 ± 0.12
1 000 12.51 ± 2.17 0.16 ± 0.02 43.09 ± 0.41 4.26 ± 0.13
Cu-LTL film 500 nm
Indentation depth
(nm)
Modulus from loading
(GPa)
Hardness from loading
(GPa)
Modulus from unloading
(GPa)
Hardness from unloading
(GPa)
150 4.39 ± 0.36 0.12 ± 0.01
200 4.66 ± 0.53 0.12 ± 0.02 6.84 ± 0.73 0.16 ± 0.01
500 4.57 ± 0.32 0.12 ± 0.01 12.61 ± 0.26 0.59 ± 0.02
1 000 3.62 ± 0.34 0.11 ± 0.01 7.39 ± 2.78 0.79 ± 0.07
Cu-LTL film 1200 nm
Indentation depth
(nm)
Modulus from loading
(GPa)
Hardness from loading
(GPa)
Modulus from unloading
(GPa)
Hardness from unloading
(GPa)
150 3.27 ± 0.45 0.11 ± 0.01
200 3.27 ± 0.26 0.11 ± 0.01 5.65 ± 0.26 0.12 ± 0.01
500 3.54 ± 0.20 0.11 ± 0.01 26.54 ± 0.77 0.50 ± 0.03
1 000 3.20 ± 0.30 0.10 ± 0.01 23.69 ± 0.44 1.71 ± 0.07

145
Values of the modulus and hardness obtained from unloading are preferable and allow to get
more sensitive results correlated to the fact that during the first stage of unloading, only the
elastic behaviour of the material is expressed (Table 1).
The rather good superposition of the loading curves and the low dispersion of the numerical
results suggest a high homogeneity of the films. Increase of the hardness and modulus with the
indentation maximum depth is due to the great influence of the substrate, as has been mentioned
before. In order to eliminate the influence of the silica wafer on the results from the
measurements, the focus has been put on the results obtained up to maximum penetration depth
of 200 nm (Table 2).
Table 2 Modulus and hardness of Cu-LTL films with a thickness of 350, 500 and 1200 nm at indentation depth of 200 nm (upon loading)
Cu-LTL film 350 nm
Indentation depth
(nm)
Modulus
(GPa)
Hardness
(GPa)
200 26.848 0.280
500 35.339 0.339
1 000 25.657 0.216
Cu-LTL film 500 nm
Indentation depth
(nm)
Modulus
(GPa)
Hardness
(GPa)
200 5.496 0.118
500 6.543 0.145
1 000 4.303 0.113
Cu-LTL film 1200 nm
Indentation depth
(nm)
Modulus
(GPa)
Hardness
(GPa)
200 4.196 0.116
500 4.943 0.128
1 000 4.206 0.104

146
Table 3 Modulus and hardness of Cu-LTL films with a thickness of 350, 500 and 1200 nm at indentation depth of 50 nm (upon loading)
Modulus (GPa) Hardness (GPa)
Cu LTL 350 6.273 ± 0.916 0.124 ± 0.136
Cu LTL 500 3.893 ± 0.465 0.119 ± 0.018
Cu LTL 1200 2.597 ± 0.563 0.121 ± 0.018
According to the results for the samples with the thickness of 500 nm and 1200 nm, the modulus
and hardness of the films seems to be not much sensitive to the films thickness (Ef = 2.5-4.5
GPa and Hf = 0.1-0.2 GPa).
The higher values of the mechanical parameters measured for the film with a thickness of 350
nm is due to the influence of the Si-wafers. The measurements performed at very small
penetration depth (20 nm and 50 nm) have been set to avoid this matter; however, both the
surface interaction between the sample and the tip, and the roughness of the film even very
small is significant at this penetration depths. This leads to a huge dispersion in modulus and
hardness numerical values, thus not reliable mechanical parameters for such film thickness (t
= 350 nm) are obtained.
Compared to values found in the literature12 for the modulus and the hardness for zeolites
deposited on silicon wafers, produced for semiconductor electronic applications, the values
obtained in this study are a bit lower, but of the same order of magnitude (E = 10-18 GPa, H =
0.3-1.2 GPa). Such difference might be due to either a variation in the chemical composition
or a higher porosity of the films.

147
Detection of carbon monoxide
The Cu-LTL zeolite films were used for detection of low concentration of carbon monoxide as
a single analyte. The detection of CO was performed with Cu loaded zeolite film with a
thickness of 500 nm and followed by operando IR spectroscopy. The results were further
compared with the CO detection with parent LTL thin films of the same thickness. Prior to the
measurements, the films were activated at 350 ºC under argon atmosphere with 5% hydrogen,
and then different CO concentrations (1–100 ppm) were delivered to the reaction cell with the
film. The evolution of IR spectra of CO adsorbed on parent LTL and Cu-LTL films is shown
on Figure 5. The IR spectra for Cu-LTL film at 25 ºC represents a band around 2128 cm-1
characteristic of CO adsorbed on Cu+ species, that have been previously described in the
Chapter 3.14 As can be seen from Figure 5, 1 ppm of CO is the lowest concentration detected
by the Cu-LTL film, whereas pure LTL is not sensitive to CO. The increase of the CO
concentration measured at 25 ºC resulted in a Langmuir type evolution of the CO peak centered
at 2128 cm-1. The saturation of Cu-species is reached at higher concentration of CO, that is
expressed by a plateau on the graph (Figure 6), while for parent LTL the CO adsorption is
negligible at room temperature and could be attributed to its physisorption.

148
(A)
(B)
Figure 5 The evolution of IR spectra of CO (1 to 100 ppm) detected by (a) Cu-LTL and (b) parent LTL films with the thickness of 500 nm; the peak at 2128 cm-1 is marked with an asterix *
*

149
Figure 6 Evolution of the CO band area of the peak at 2128 cm-1 in the IR spectra of parent LTL and Cu-LTL films measured at 25 ºC
Conclusions
Copper containing LTL zeolite films (Cu-LTL) were deposited on silicon wafers and
thoroughly characterised by SEM and nanoindentation. The thickness of the Cu-LTL films can
be controlled by tailoring the concentration of the coating zeolite suspensions, number of
deposited layers and spinning speed during spin coating procedure. The modulus and hardness
of the Cu-LTL films were measured as a function of the indenter penetration depth for
maximum-targeted depth ranging from 20 nm to 2000 nm. Three samples with the same film
composition but with different thicknesses (350, 500 and 1200 nm) were investigated. The
thickness, modulus and hardness show the independence for the film thickness (Ef = 2.5-4.5
GPa and Hf = 0.1-0.2 GPa).
The Cu-LTL films were further employed for detection of low concentration of CO at ambient
conditions. Compared to the pure LTL, the Cu-LTL zeolite films exhibit high sensitivity and
fast response towards low concentrations of CO (1-100 ppm). The response of the Cu-LTL
films towards CO at 1 ppm has been measured; the results clearly point out that the Cu-LTL

150
films are good candidates for sensing application due to their remarkable mechanical and
thermal stability mainly determined by the method of preparation.
151
References
1 S. N. Talapaneni, J. Grand, S. Thomas, H. A. Ahmad and S. Mintova, Mater. Des., 2016, 99, 574–580.
2 S. M. Auerbach, K. A. Carrado and P. K. Dutta, Handbook of zeolite science and
technology, CRC Press, 2004, vol. 2004.3 S. Thomas, P. Bazin, L. Lakiss, V. De Waele and S. Mintova, Langmuir, 2011, 27,
14689–14695.4 H. Xiao, J. Zhang, J. Dong, M. Luo, R. Lee and V. Romero, Opt. Lett., 2005, 30,
1270–2.5 J. Zhang, M. Luo, H. Xiao and J. Dong, Chem. Mater., 2006, 18, 4–6.6 M. P. Pina, R. Mallada, M. Arruebo, M. Urbiztondo, N. Navascués, O. De La Iglesia
and J. Santamaria, Microporous Mesoporous Mater., 2011, 144, 19–27.7 M. C. Johnson, C. M. Lew, Y. Yan and J. Wang, Scr. Mater., 2008, 58, 41–44.8 T. Babeva, H. Awala, M. Vasileva, J. El Fallah, K. Lazarova, S. Thomas and S.
Mintova, 2013, 3009–3014.9 J. Kobler, H. Abrevaya, S. Mintova and T. Bein, J. Phys. Chem. C, 2008, 112, 14274–
14280.10 T. Babeva, H. Awala, M. Vasileva, J. El Fallah, K. Lazarova, S. Thomas and S.
Mintova, Dalton Trans., 2014, 43, 8868–8876. 11 X. Zou, J.-M. Goupil, S. Thomas, F. Zhang, G. Zhu, V. Valtchev and S. Mintova, J.
Phys. Chem. C, 2012, 116, 16593–16600. 12 M. Johnson, Z. Li, J. Wang and Y. Yan, Thin Solid Films, 2007, 515, 3164–3170.13 H. Sjöström, I. Ivanov, M. Johansson, L. Hultman, J. E. Sundgren, S. V. Hainsworth,
T. F. Page and L. R. Wallenberg, Thin Solid Films, 1994, 246, 103–109. 14 K. I. Hadjiivanov, Adv. Catal., 2002, 47, 307–511.

152
Chapter 5
The plasmonic chemistry of silver containing nanosized zeolite film revealed by transient absorption spectroscopy
Introduction
When an optical radiation excites a metal nanoparticle (NP) in resonance with the plasmon
band, the energy of the incident photons is absorbed by the free electrons (conduction
electrons), which in response populate the levels of energy located above the Fermi level of the
metal. These excited electrons are named “hot-electrons” because in this non-equilibrium state,
the electronic temperature (Te) is higher that the temperature of the metal lattice (Tph). The
main dissipation channel of the excess of energy injected in the hot-electrons is the
thermalization with the lattice by electron-phonon coupling. This mechanism induces an
increase of the temperature of the metal, and this is notably the origin of the photothermal
applications of the NP. Besides, the hot-electrons can also directly interact with molecules (or
solids) that are located near the surface of the NP, resulting in their excitation and possibly
their chemical activation. This particular reactivity of the hot-electrons, associated with the
recent advances in the preparation and characterization of nanosized materials have triggered
a widespread interest for researches in plasmonic chemistry.1–4 The main target is to exploite
the hot-electron-driven-chemistry for solar-to-chemical energy conversion applications. The
large-scale exploitation of this novel technology is conditioned by the discovery of efficient
materials. Conceptually, the performance of these materials depends on the optical and
electronic properties of the metal NPs, but the metal-support interactions have also been
identified as a critical parameter.5
Microporous materials and more specifically zeolites are recognized as appropriate supports
for metal NPs. For example, gold NPs supported on the external surface of zeolite crystals were

153
considered for plasmonic chemistry applications through an investigation of the photocatalytic
oxidation of aromatic alcohols.6,7 The benefits of using zeolites as support for metal NPs for
plasmonic chemistry are related to the ability (i) to disperse and stabilize very small metal NPs,
without the need of a capping agents, so that the surface of the NPs remains accessible to the
reactants, and (ii) to concentrate the reactants by adsorption on the zeolite surface, thus favoring
their interactions with the supported NPs. However, one major drawback of zeolite crystals for
light-driven applications is that most of them are prepared with a size in the range of several
micrometers that strongly scatter the visible light, and thus they are difficult to be implemented
into optical devices.
In the last decades, a lot of effort have been paid on the development of syntheses approaches
toward preparation of nanosized zeolites,8,9 i.e., zeolite crystallites with a size in the range 5-
100 nm. Recent papers reported on the preparation of the most industrially useful zeolites with
FAU, EMT, BEA, MFI, LTL- framework type structures with nanosized dimensions.10–14 The
nanosized zeolites possess characteristics similar to those of their bulky counterpart with, in
addition, a much higher external surface to bulk volume ratio. Besides the nanosized zeolites
can be easily assembled in the form of thin-to-thick films or three-dimensional bodies with
very good transport and optical properties.13,15,16 The nanosized zeolites are also hosts for
stabilization of metal or semiconductor nanoparticles,17,18 Pt,19 Pd,20 Ag21,22 or Cu.23 So far
metal-containing nanosized zeolites assembled in films have still never been considered as a
material for plasmonic chemistry.
This work deals with LTL nanosized zeolites used as a host for nm-sized silver NPs, and
explores the potential of this material for hot-electrons driven chemistry applications. This
issue is addressed by using UV-vis transient absorption spectroscopy, which proved to be a
method of choice to characterize the hot-electrons dynamics,24–27 and their coupling with the
surrounding media.26,28 Up to now, ultrafast pump-probe measurements in zeolites remain quite

154
seldom.29–33 These measurements are performed essentially either on micron-sized crystalline
powders or on colloidal suspensions consisting of nanosized zeolites.21,34,35 The latter approach
allows to perform transient absorption measurements in transmission, but it would be of limited
interest in the context of plasmonic chemistry due to the lack of control of the metal
surrounding in the solution. In order to address the ultrafast processes involved in the plasmonic
behavior of metal-zeolite host-guest systems, we explore a novel route consisting of transient
absorption measurements on transparent films consisting of nanosized zeolites. This approach
notably offers the possibility of controlling the micro-environment of the metal nanoparticles
in the zeolite host-guest systems. In the current study, we investigated the plasmonic response
of silver nanoparticles (Ag NPs) in LTL-type zeolite films under vacuum atmosphere. The
preparation of Ag NPs in the nanosized LTL- type zeolites, followed by the preparation of the
transparent films, and testing of their compatibility with the requirements of the transient
absorption spectroscopy are presented. The ultrafast plasmonic response of these materials is
reported too.
Experimental
Synthesis and characterization of silver-containing LTL zeolite crystals
Aluminum hydroxide (reagent grade, Sigma-Aldrich), ludox SM colloidal silica (30 wt. %
suspension in H2O, Sigma-Aldrich), and potassium hydroxide (ACS reagent, > 85 %, pellets,
Sigma-Aldrich). The initial precursor solution with a chemical composition: 5 K2O : 10 SiO2 :
0.5 Al2O3 : 200 H2O was prepared via dissolving 40.0 mmol Al(OH)3 (3.9 g, 80 wt.% Al(OH)3;
20 wt.% H2O; A2100) and 0.4 mol potassium hydroxide (23.3 g, KOH, Aldirch) in 86.0 g
double distilled water (dd H2O) and 0.4 mol SiO2 (83.1 g, Ludox SM30, Aldrich). This mixture
was stored for one day on an orbital shaker, and additionally stirred for one more day to obtain
a water-clear precursor suspension. Further the synthesis was performed at 170 C for 18h.

155
The nanosized LTL zeolite crystals with rectangular shape (20-40 nm) were recovered by
multistep centrifugation (20000 rpm, 40 min) and dispersed in doubly distilled water until the
pH of the decanted solution reached 8. Prior to incorporation of silver cations, the LTL
nanocrystals were stabilized in water at pH=7.5-8 with a concentration of solid particles of 7.5
wt %.
Silver nitrate (>99.9%, Alfa Aesar) or silver perchlorate (>99.9%, Alfa Aesar) were used for
the ion exchange treatment of the LTL zeolite. The ion-exchange was carried out directly in
the colloidal suspension without preliminary drying of the sample, as follows: 20 mL silver
perchlorate solution with a concentration of 0.05 M was added to the LTL zeolite suspension
(7.5 wt %, 12 mL) and the mixture kept for 4 h at room temperature. The ion-exchanged
samples were purified three times via high-speed centrifugation and re-dispersed in water. The
silver nanoparticles (Ag NPs) in the LTL zeolite suspensions (2 wt.%, 7 mL) were prepared
under microwave irradiation (120 ° C, 10 min, 1000 W) in the presence of a triethylamine (>99
%, Sigma-Aldrich) as a reducing agent (C2H5N, 2 mL). The reduced suspension was again
purified three times and dispersed in water.
The crystalline structure of the nanosized zeolite crystals before and after ion exchange with
silver was determined by recording the powder X-ray diffraction (XRD) patterns using a
PANalytical X’Pert Pro diffractometer with Cu Ka monochromatized radiation (1:5418 Å).
The samples were scanned in the range 4 to 80 °2θ, with a step size of 0.02 °2θ. The size and
location of the Ag NPs were further studied by high angle annular dark field (HAADF) and
annular bright field (ABF) scanning transmission electron microscope (STEM). These studies
were performed using a JEOL ARM200F cold FEG double aberration corrected electron
microscope operated at 200 kV equipped with a large solid-angle centurio EDX detector and
Quantum EELS spectrometer.

156
The UV−vis absorption spectra of the zeolite films containing Ag NPs were recorded on a
Varian Cary 4000 Spectrophotometer working in transmission mode.
Preparation and characterization of silver-containing LTL zeolite films
The CaF2 optical plates (1 mm thick) were used as film supports for all spectroscopic
measurements; the plates pre-cleaned with ethanol and acetone prior to film deposition.
Polyvinylpyrrolidone (PVP10, average mol. wt. 10,000, Sigma-Aldrich),
Poly(diallyldimethylammonium chloride) (PDADMAC, 20 wt. % in H2O) were used without
further purification as binders in order to prepare films with good mechanical properties.
Ethanol (Sigma-Aldrich, 98 %) and doubly distilled water were used as solvents.
The zeolite films were prepared by spin-coating approach on CaF2 optical plates (1 mm thick,
13 or 20 mm in diameter) using Wafer Spinner SPIN150-NPP. The surface of the plates was
modified by chemical anchoring of seed crystals (parent LTL) on
Poly(diallyldimethylammonium chloride) adsorbed on the surface of substrate. The pre-
cleaned plates were immersed in 5 wt.% solution of polymer for 20 minutes, thoroughly rinsed
with distilled water and dipped in the LTL solution for another 20 minutes. This procedure was
repeated three times, and the seed layer obtained (thickness of 50 nm) was calcined at 450°C
for 3 h at a heating ramp of 3°C mn-1.
The Ag-LTL suspension with a concentration of solid particles (2 wt.%) was mixed with
PVP10 (5 wt.% in ethanol or water) in the ratio of 1:10. This suspension was treated in the
ultrasonic bath for 30 minutes and filtrated through syringe filters (450 nm) prior to spin
deposition on the seeded CaF2 plates. The rotation speed of 5000mn-1 and duration of spinning
for 30 s were applied for the preparation of the films. This coating procedure was repeated until
the desired film thickness was obtained. High temperature treatment of the films at 450°C for
3 h under argon atmosphere was applied to improve the mechanical properties of the films and
to remove the binder.

157
The as-prepared films, hereafter named AgLTL, was further calcined under the same
conditions (450°C for 3 h) prior time-resolved measurements.
FTIR measurements of silver-containing LTL zeolite films
The spatial thickness variation of the AgLTL films over the support was characterized by FTIR
imaging. The spectra were obtained in transmission mode using a FTIR imaging system
consisting of a Bruker Hyperion 3000 microscope coupled with a FTIR spectrometer using a
x36-Cassegrain objective. The infrared images were recorded with a Focal Plane Array (FPA
64x64 pixels) detector covering a spatial area of 71*71 µm2 (1,1*1,1 µm2 per pixel). Single
point (60*60 µm2) IR spectra were acquired with a MCT detector. Typically, the spectra were
reconstructed from a total of 256 interferograms with a spectral resolution of 4cm-1.
Femtosecond transient absorption measurements of silver-containing LTL zeolite films
Figure 1 shows an overall scheme of the UV-vis transient absorption setup and vacuum sample
cell used to perform the femtosecond pump-probe measurements on nanozeolite thin films.
Figure 1 Transient absorption setup: a sample plate is mounted on a motorized XZ translation stage and placed inside a homemade optical vacuum cell. The 400 nm pump excitation beam is focused (lens L) slightly ahead of the sample. The super-continuum is split into signal (Sig) and reference (Ref) beams using a periscope (P) composed of a broadband beam-splitter (BS). Both Sig and Ref beams are passing through the sample and detected by a CCD camera

158
Broadband UV-vis transient absorption set-up
The pump and probe pulses are generated using an amplified 1kHz Ti:Sa laser system (Libra,
Coherent) that delivers 90 fs (1.1 mJ) laser pulses at 800 nm. The pump excitation at 400 nm
is generated by frequency-doubling the 800 nm fundamental in a BBO crystals (1 mm thick).
As a probe beam, a white light super-continuum is generated by focusing a part of the
fundamental beam (800 nm) in a 1 mm thick CaF2 rotating plate. The pump is polarized parallel
to the probe. The time delay between the pump and probe pulses is controlled by an optical
delay line (Microcontrol Model MT160-250PP driven by an ITL09 controller) placed in front
of the supercontinuum generation stage. The transient absorption spectra are recorded
according to an acquisition set-up already described elsewhere.36 Briefly, the 400 nm pump
excitation beam is focused before the sample so that the diameter of the excited area is slightly
larger than 0.5 mm (diameter). White light supercontinuum is split into a probe beam
overlapping the pump beam in the sample, and a reference beam parallel to it and passing
through the sample out of the pump beam is applied. The transmitted probe and reference lights
are dispersed with a spectrograph and detected on two different channels of a CCD optical
multichannel analyzer (Princeton Instrument LN/CCD-1340/400-EB detector with ST-138
controller). The acquisition is controlled by a pair of synchronized optical choppers that
modulate the pump (25 Hz) and the probe (50 Hz) beams. The CCD camera is read at 50 Hz.
Optical cell
A stainless steel optical vacuum cell has been purposely designed, and assembled for the
present spectroscopic investigation of nanosized zeolite films. It consists of an octagonal
vacuum chamber (Kimball Physics) equipped with 2-mm thick CaF2 windows mounted on CF
flanges (MDC vacuum). The CaF2 plate coated with the zeolite film is mounted on a motorized
translation stage (Owis) allowing its continuous displacement in the plane XZ perpendicular to
the light propagation. It is coupled to the optical cell via a flexible stainless steel bellow. The

159
ensemble is connected to a vacuum line equipped with a turbo-molecular pump. The set-up can
be evacuated below 10-6 mbar.
Results and discussion
Preparation of LTL zeolite crystals containing silver nanoparticles
Silver was first introduced in the nanosized LTL zeolite crystals by ion-exchange method. The
highly crystalline LTL-type structure of the zeolite samples before and after ion-exchanged
was confirmed by XRD measurements. The silver-containing colloidal zeolite suspension,
initially white, after chemical reduction became a green-yellow, which is the first indication
that the silver cations were reduced, and silver nanoparticles were formed. The as-prepared
silver containing LTL suspension (AgLTL) is stable for 24 months at room temperature. The
formation of Ag NPs was firstly confirmed by transmission electron microscopy. Figure 2
shows an HAADF-STEM image of nanosized zeolite crystals taken after the reduction of Ag+
to Ag0 in the LTL suspension (see experimental part for more details). The LTL nanosized
crystals with well-defined rectangular shape, sharp edges and a size of individual grain of 20-
40 nm are shown in Figure 2. The crystalline fringes associated with the LTL lattice appear
clearly, thus confirming the preservation of the crystal structure during the post-synthesis (ion
exchange) treatment. Homogeneously dispersed Ag NPs appearing as white spots located
mostly on the external surface of the LTL nanocrystals are seen in HAADF-STEM images.
The enlarged picture shows also small Ag NPs align along the LTL channels suggesting that
they fit inside the LTL nanocrystals. The size distribution of Ag NPs determined from the
HAADF-STEM images (Figure 2), is narrow with a maximum at 1.3 nm and with ~80 % of
the NPs having a diameter between 1.1 and 2.65 nm (500 particles measured). In Figure 2 a
curve giving the number of silver atoms per NP versus the NP diameter is also represented,
assuming an icosahedral NPs geometry. According to this model, silver NPs with a diameter
in the range 1.1-2.65 nm are constituted by 55 to 930 atoms.

160
Figure 2 (left) HAADF STEM image of nanosized LTL zeolite crystals containing silver nanoparticles. (right) Histogram of the particles size distribution determined from a set of HAADF-STEM images (pink bars), and plot of the number of silver atoms per nanoparticle, calculated assuming an icosahedral NP shape, as a function of the NP size (blue trace)
Preparation and characterization of transparent silver-containing LTL zeolite films on CaF2
Transient absorption measurements in thin zeolite layers have not been reported up to now. It
is, thus, particularly important to carefully control the optical characteristics of such films and
their resistance to light irradiation. Above all, the films must be transparent and weakly light
diffusing. Another important parameter for long-term development of pump-probe
measurements is a high spatial homogeneity of the films. To limit photodegradation during
pump-probe measurements, it is necessary to move the sample back and forth for continuously
refreshing the irradiated volume.
The zeolite nanocrystals from the AgLTL suspension were assembled in dense and
homogeneous films on 1 mm thick CaF2 plates. As can be seen in Figure 3-a, the as prepared
films, named AgLTL, present a good transparency over the UV-Vis spectral range, a weak
scattering background, and a maximum absorbance of the silver NPs of 0.3 (450 nm). The UV-
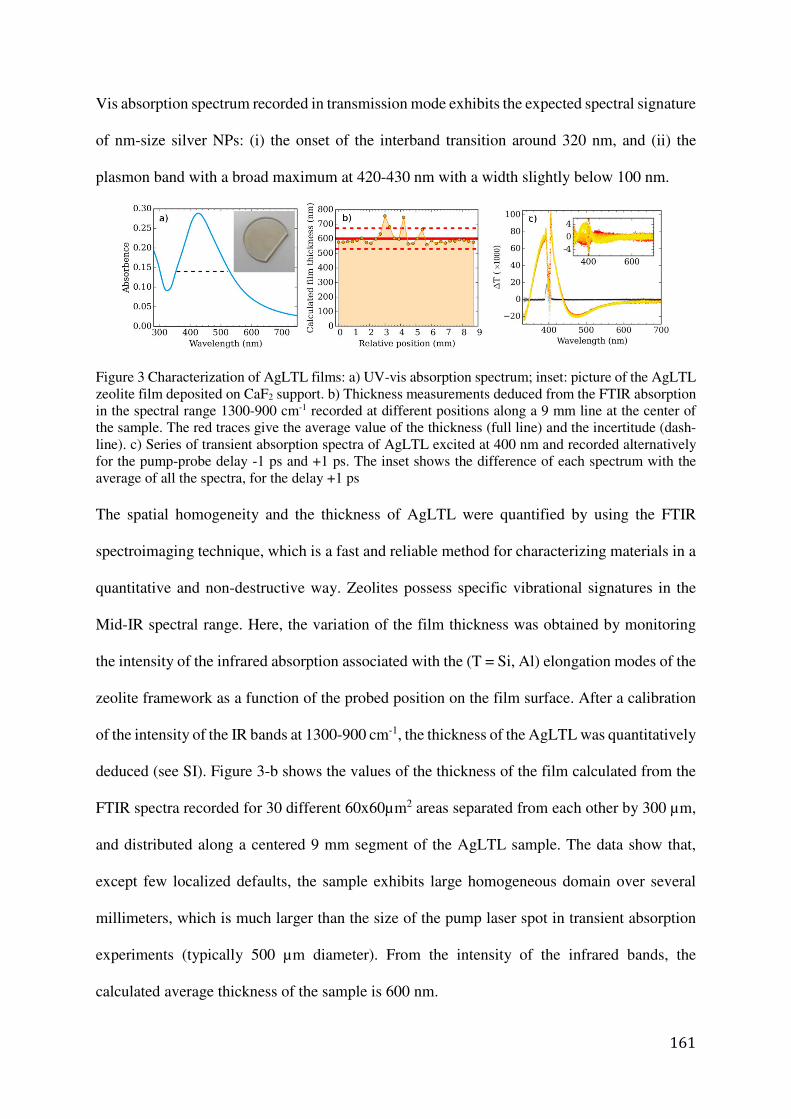
161
Vis absorption spectrum recorded in transmission mode exhibits the expected spectral signature
of nm-size silver NPs: (i) the onset of the interband transition around 320 nm, and (ii) the
plasmon band with a broad maximum at 420-430 nm with a width slightly below 100 nm.
Figure 3 Characterization of AgLTL films: a) UV-vis absorption spectrum; inset: picture of the AgLTL zeolite film deposited on CaF2 support. b) Thickness measurements deduced from the FTIR absorption in the spectral range 1300-900 cm-1 recorded at different positions along a 9 mm line at the center of the sample. The red traces give the average value of the thickness (full line) and the incertitude (dash-line). c) Series of transient absorption spectra of AgLTL excited at 400 nm and recorded alternatively for the pump-probe delay -1 ps and +1 ps. The inset shows the difference of each spectrum with the average of all the spectra, for the delay +1 ps
The spatial homogeneity and the thickness of AgLTL were quantified by using the FTIR
spectroimaging technique, which is a fast and reliable method for characterizing materials in a
quantitative and non-destructive way. Zeolites possess specific vibrational signatures in the
Mid-IR spectral range. Here, the variation of the film thickness was obtained by monitoring
the intensity of the infrared absorption associated with the (T = Si, Al) elongation modes of the
zeolite framework as a function of the probed position on the film surface. After a calibration
of the intensity of the IR bands at 1300-900 cm-1, the thickness of the AgLTL was quantitatively
deduced (see SI). Figure 3-b shows the values of the thickness of the film calculated from the
FTIR spectra recorded for 30 different 60x60µm2 areas separated from each other by 300 µm,
and distributed along a centered 9 mm segment of the AgLTL sample. The data show that,
except few localized defaults, the sample exhibits large homogeneous domain over several
millimeters, which is much larger than the size of the pump laser spot in transient absorption
experiments (typically 500 µm diameter). From the intensity of the infrared bands, the
calculated average thickness of the sample is 600 nm.

162
The optical homogeneity of the samples was further characterized by transient absorption
measurements using the experimental configuration described in Figure 1. The transmission
changes induced by the photoexcitation of AgLTL (λ = 400 nm, I = 0.25 mJcm-2) recorded for
a series of 20 consecutive measurements, each one consisting of two spectra recorded
alternatively at pump-probe delays of -1 ps (baseline recording) and +1 ps (transient spectrum
recording), are depicted (Figure 3-c). These repetitive measurements were performed during
an overall time period of about 30 min, which corresponds to the typical duration of transient
absorption experiments with our setup. During the measurements, the sample AgLTL was
continuously displaced in the XZ plane perpendicular to the light propagation. The plotted data
highlights three essential points: (i) high quality transient spectra can be recorded at these
conditions, thus proving the approachability of the films, (ii) good stability and repeatability of
the transient spectra (shape, intensity) along the experiments indicating that the recorded signal
is not perturbed neither by the displacement of the sample (spatial homogeneity), nor by the
cumulative irradiation time (photostability of the sample), and finally (iii) the flat and stable
zero baseline of the transient spectra recorded for the negative pump-probe delay (�t = -1 ps)
over the entire spectral window shows that the sample recovers its initial state between two
consecutive excitation by the laser pump. These results confirm the possible application of
nanosized zeolites assembled in films on CaF2 plates for transient absorption spectroscopy
measurements in transmission mode. In the current case, the photoresponse of Ag in the LTL
zeolite films was measured.
Hot electrons photodynamics in AgLTL films
The ultrafast photodynamics of the silver NPs in AgLTL films was investigated too. The optical
properties of metal nanoparticles with a size less than 20 nm are described by the Mie theory.
The absorption cross section of the NPs, (σext(ω)), is given by:

163
(1)
where, εd is the static dielectric constant of the medium around the NPs, assumed here real,
whereas ε1(ω) and ε2(ω) are the real and imaginary parts, of the dielectric constant of the metal
NPs, respectively. The formation of hot-electrons in the conduction band induces a
modification of the dielectric function of the metal and consequently, of the absorption
spectrum of the NPs. Hence, the time-evolution of the hot electrons can be followed by
transient absorption spectroscopy. The photodynamics of the electrons in silver NPs with
different particle sizes have been investigated by this technique previously.24–27 So far metal
NPs stabilized in zeolites as powders, suspensions and films were not subjected to such
characterizations.
Figure 4 Transient absorption spectra recorded for AgLTL sample upon excitation at 400 nm with a laser intensity of 0.1 mJ cm-1
Typical transient absorption spectra recorded in AgLTL after excitation at 400 nm (pulse
intensity I=0.25mJcm-2) for different pump-probe delays are depicted in Figure 4. All spectra
exhibit an increase of absorption above the edge of the interband transition (320 nm), and a
bipolar-like signal composed by a bleach contribution (420 nm), and an absorption (500 nm)
in the red part of the plasmon band. The shape of the transients exhibits the well-known spectral

164
characteristics and temporal evolution induced by the formation and cooling of hot electrons
in silver nanoparticles.37,38 The absorption contribution in the blue part of the spectrum is
assigned to the presence of new interband transitions resulting from the depletion of the low
energy levels of the conduction band. The bipolar contribution is due to the shift and
broadening of the plasmon band in response of the redistribution of the electrons inside the
conduction band. The transient signal decays within a few picoseconds, that is the typical
timescale of the electron-phonon coupling dynamics. Thus, the spectral evolution shown in
Figure 4 is undoubtedly assigned to the relaxation of the hot-electrons formed upon the
absorption of the laser pump.
To get a better insight into the processes governing this plasmonic response, the temporal
evolution of the transient spectra had to be analyzed. According to equation (1), the transient
spectra reflect the changes of the dielectric constant of the sample, and therefore the correlation
between the measured signal and a microscopic description of the hot-electron dynamics is not
straightforward. However, previous investigations24–27 have pointed out that for a probe
wavelength in the vicinity of the maximum of the bipolar contribution, the real part of the
dielectric constant dominates the optical response.37 Therefore, it is possible to establish a
relation between the transmission changes and the variation of the internal energy of the
electrons (ΔUe). Using the ratio: ΔUe =CeΔT, where Ce is the heat capacity of the electrons, the
time-evolution of the transmission can be related to the temperature (Te) of the hot-electron
distribution. Moreover, the kinetics of the heat dissipation between the electron (temperature
Te) and the phonons (temperature Tph) of the metal NPs follow the so-called Two-Temperature
Model (TTM) described by the following equation:
(2)

165
In this equation 2, the TTM expresses the cooling of the hot electrons using the electron-phonon
coupling constant G = 3.5 x 10¹⁶ Wcm-3K-1s-1 for silver. In equation 3, Cl = 2.2 x 10⁶ Jcm-3K-1
is the heat capacity of the silver metal lattice. The heat capacity of the electrons depends on the
temperature in the range 1000-7000 K according to the formula: Ce = γTe, where γ = 65 Jnm-
3K-2. Previously, this model was applied successfully to investigate the electron dynamics in
silver nanoparticles.24–27
An attractive aspect of the TTM model is that, for a given coupling constant G, the amplitude
and the temporal evolution of the decay are fully determined by the initial temperature of the
hot-electron (Te(0)) induced by the pump excitation. To compare the photodynamics of AgLTL
with the results from the literature, the TTM model was applied to fit the kinetics observed at
380 nm. The fit of the decay (λprobe = 380 nm) reconstructed from the data presented in Figure
4 is plotted in a linear and semi-log scale (inset) for a comparison (Figure 5). The fit was
performed for the pump-probe delays longer than 500 fs, in which case the thermalization of
the electrons by electron-electron scattering, and the subsequent establishment of the Fermi
distribution do not contribute anymore to the transient signal.37 It can be seen, that the fit
reproduces very well the experimental data and notably the specific temporal evolution of the
decay associated with the TTM model that is characterized by a progressive acceleration of the
temperature decay in the beginning of the process, followed by an asymptotic convergence to
the final equilibrium temperature (Figure 5). The fitted value for the initial hot-electron
temperature is Te(0)=4000 K. Solving the TTM equation also gives the theoretical final
equilibrium temperature of the metal at the end of the electron-phonon relaxation. The
calculated value is Te(>10ps) = Tph(>10 ps) = 500 K, that represents an ultrafast heating of
the metal NPs of about 200 °C above the ambient temperature. In addition, The TTM fit for
(3)

166
several probe wavelengths in the spectral range 370-390 nm was also performed. The results
are qualitatively similar, the value of Te(0) of the TTM varies only within the range 4100-
3700 K. To test the sensibility of the model, the same fitting routine was applied using a 2-
exponential model but in this case, the data were not reproduced.
Figure 5 Fit by the TTM model of the kinetics recorded at 380 nm upon excitation of AgLTL at 400 nm with a laser intensity I = 0.25 mJcm-2. The fit curve in red has been obtained for an initial electronic temperature Te(0) = 4100 K. The dotted curves show 95% confidence interval of the fit. Inset: experimental data and the fit plotted in a semi-log scale
The value of the initial hot electrons temperature of 4100 K obtained from the above fit is
compared with the theoretical value calculated from the energy absorbed by the Ag NPs in the
AgLTL. If we assume that the totality of the energy of the photons absorbed by a NP is
converted into internal energy of the hot-electrons, then the temperature of the hot-electrons
distribution Te(0) is given by equation 5 that depends only on the number of photons (n)
adsorbed within the volume (V) of the nanoparticle.
�� = ���2 + 2�ℎ���� (5)
Given the excitation conditions of the spectra in Figures 4 and 5 and using the σ = 1.5*10-17
cm2 of the absorption cross-section of a silver atom, the numerical application predicts that, in
our experiments, less than 1 photon per 300 silver atoms is absorbed. On this basis, the initial
electronic temperature was calculated for the different classes of NP presented in the histogram
in Figure 2, and using this yield of absorption of 1 photon/300 silver atoms. From the NPs size

167
distribution (Figure 2), we deduced the probability (P) that a photon is absorbed by the NPs of
a given size in AgLTL, and finally estimated the relative contributions of the different
populations of particle sizes to the transient absorption signal by assuming these contributions
proportional to P x Te2. The results are reported in Table 1.
Table 1 Calculated initial electronic temperature (Te(0)), probability that a photon is absorbed by a NP (P), and total contribution (Contrib) of a NP population to the overall transient absorption signal, as a function of the particle size. a) For this very small size Te is overestimated because the relationship Ce = γTe is not valid anymore. b) The contribution to the transient signal is calculated for the lowest temperature Te of a given class of particles. c) These values correspond to the absorption of a single photon/NP
NP Diameter Number of atoms Te(0) P Contribb)
(nm) - (Kelvin) (Norm.) (%)
0.5 -1.1 13-55 >7000a)-5725 0.05 31
1.1-1.6 55-147 5725-2900 0.12 24
1.6-2.2 147-309 2900-1900 0.19 15
2,2-2.75 309-561 1900-1378 0.22 9.5
2,75-3.3 561-923 1378-1477 (-xx)c) 0.17 9
3.3-3.8 923-1415 1477-1438 (-xx) 0.18 9
3.8-5 1415-2869 1438-2000 (-xx) 0.04 3
The NPs with sizes 0,5-2.2 nm contribute roughly to 70% of the initial transient signal, with an
initial electronic temperature Te(0) = 5725-1900 K . Although quite approximate, this
theoretical initial electronic temperature based on the optical properties of Ag NPs and on the
HRTEM particle size distribution is in reasonably good agreement with the value deduced from
the fit of the experimental transient data using the TTM model. Hence, the dynamics behind
the transient data can be assigned to the formation of a highly excited hot-electron distribution
that relax mainly by electron-phonon coupling as illustrated in Scheme 1. It can also be
concluded that the initial temperatures calculated (Table 1), and the distribution of the absorbed

168
photons based on the particles size distribution can be used to predict the plasmonic behavior
of AgLTL.
Scheme 1 Plasmonic photodynamics in the AgLTL film
Based on the plasmonic behavior of the AgLTL, the following conclusions are made: (i) the
metallic character of the nm-sized silver NPs formed on LTL nanosized zeolites is preserved,
in the sense that the hot-electrons remain localized into the Ag NPs and (ii) their dynamics is,
apparently, not strongly affected by the LTL framework. This is an important characteristic of
the AgLTL materials, notably in view of plasmonic chemistry applications. It is worth to point
out that these properties are far from being evident or even predictable without the experimental
results described here. Indeed, when metal NPs are in contact with a surrounding media,
electronic interactions can influence severely the optical plasmonic response39–41 and the
dynamics of the hot-electrons.26,28 In extreme cases, the electrons of the metal can be
photoinjected inside the support, and the plasmonic character lost.42 So, the role of the NP-
support interactions is crucial in determining the plasmonics chemistry properties of a material.
Zeolites are concerned with this potential issue. Recent theoretical calculations have shown
that the vacant orbitals of the oxygen atoms constituting the zeolite framework are lying closely
above the Fermi level of silver NPs.43 Therefore, these orbitals can act as accepting energy
levels for the hot-electrons and might potentially affect the plasmonic properties of silver-
containing zeolites. Here, by transient absorption spectroscopy, we demonstrate that the
169
coupling between the Ag NPs and the zeolite framework is not effective, and it can be
considered that the NPs behave essentially as free supported NPs.
A second major result demonstrated by the analysis of the transient data is that, due to the small
Ag NP size (less than 2.5 nm), a highly excited hot-electrons distribution, characterized by an
initial electron temperature above 2000 K, is generated in the major cases by the absorption of
a single photon by each Ag NPs. This implies that the reactive state can be populated under
monophotonic excitation conditions, and particularly under solar illumination. In addition, the
process of excitation is efficient, as we estimate the yield of absorption of a photon by the
smallest Ag NPs (< 2.5 nm) is higher than 30% (Table 1).
Conclusions
In this work, for the first time the potential of using silver containing nanosized zeolites for
hot-electrons driven chemistry applications has been considered. This issue has been addressed
by investigating the ultrafast optical response of the materials photo-excited in resonance with
the plasmon band of the Ag NPs. The preparation of Ag NPs highly dispersed in nanosized
LTL type is presented, followed by their immobilization in films. For the pump-probe
experiments, the silver containing nanosized zeolites were assembled as transparent layers on
CaF2plates. This is the first report on transient absorption measurements performed in zeolite
films. It has been shown that reliable transient spectra can be obtained under controlled
atmosphere, and authors believe that beyond the scope of the work, the experimental approach
described in the report is promising to investigate the host-guest photoreactivity in zeolites.
These transparent films are also well adapted for being engineered as optical devices.
It is demonstrated that the zeolite nanocrystals stabilized very small silver NPs without
perturbing their electronic properties, and therefore they behave as free Ag NPs. It is also
demonstrated that these materials can be potentially highly photoactive under solar illumination
conditions owing to the possible formation of hot-electrons with a high initial electronic

170
temperature by the absorption of a single photon per NP. In summary, these results reveal the
high potential of Ag containing LTL nanosized zeolites for plasmonic chemistry applications.

171
References
1 K. Watanabe, D. Menzel, N. Nilius and H. Freund, Chem. Rev., 2006, 106, 4301–4320.2 G. Baffou and R. Quidant, Chem. Soc. Rev., 2014, 43, 3898–907.3 P. Zhang, T. Wang and J. Gong, Adv. Mater., 2015, 27, 5328–5342.4 J. Y. Park, S. M. Kim, H. Lee and I. I. Nedrygailov, Acc. Chem. Res., 2015, 48, 2475–
2483.5 X. Y. Liu, A. Wang, T. Zhang and C. Y. Mou, Nano Today, 2013, 8, 403–416.6 X. Zhang, X. Ke, A. Du and H. Zhu, Sci. Rep., 2014, 4, 3805.7 X. Zhang, X. Ke and H. Zhu, Chem. - A Eur. J., 2012, 18, 8048–8056.8 S. Mintova, M. Jaber and V. Valtchev, Chem. Soc. Rev., 2015, 44, 7207–7233.9 T. Bein and S. Mintova, Zeolites and Ordered Mesoporous Materials: Progress and
Prospects, Elsevier, 2005, vol. 157.10 H. Awala, J.-P. Gilson, R. Retoux, P. Boullay, J.-M. Goupil, V. Valtchev and S.
Mintova, Nat. Mater., 2015. 11 E.-P. Ng, D. Chateigner, T. Bein, V. Valtchev and S. Mintova, Science (80-. )., 2012,
335, 70–73. 12 G. Majano, L. Delmotte, V. Valtchev and S. Mintova, Chem. Mater., 2009, 21, 4184–
4191. 13 G. Majano, S. Mintova, O. Ovsitser, B. Mihailova and T. Bein, Microporous
Mesoporous Mater., 2005, 80, 227–235. 14 M. Hölzl, S. Mintova and T. Bein, Stud. Surf. Sci. Catal., 2005, 158, 11–18.15 J. Kobler, H. Abrevaya, S. Mintova and T. Bein, J. Phys. Chem. C, 2008, 112, 14274–
14280. 16 S. Mintova, M. Jaber and V. Valtchev, Chem. Soc. Rev., 2015, 44, 7207–7233.17 A. Souici, K.-L. Wong, V. De Waele, J. L. Marignier, T. H. Metzger, N. Keghouche,
S. Mintova and M. Mostafavi, J. Phys. Chem. C, 2014, 118, 6324–6334.18 K.-L. Wong, A. Souici, V. De Waele, M. Mostafavi, T. H. Metzger and S. Mintova,
Langmuir, 2010, 26, 4459–64. 19 I. Yordanov and R. Knoerr, J. …, 2010, 20974–20982.20 R. Knoerr, I. Yordanov, V. De Waele, S. Mintova and M. Mostafavi, Sens. Lett., 2010,
8, 497–501. 21 F. Luchez, Z. Tahri, V. De Waele, I. Yordanov, S. Mintova, A. Moissette, M.
Mostafavi and O. Poizat, Microporous Mesoporous Mater., 2014, 194, 183–189. 22 B. Dong, S. Belkhair, M. Zaarour, L. Fisher, J. Verran, L. Tosheva, R. Retoux, J.-P.
Gilson and S. Mintova, Nanoscale, 2014, 6, 10859–10864. 23 J. Kecht, Z. Tahri, V. De Waele, M. Mostafavi, S. Mintova and T. Bein, Chem. Mater.,
2006, 18, 3373–3380. 24 S. Link and M. A. El-Sayed, J. Phys. Chem. B, 1999, 103, 8410–8426.25 N. Del Fatti, C. Voisin, M. Achermann, S. Tzortzakis, D. Christofilos and F. Vallée,
Phys. Rev. B, 2000, 61, 16956–16966. 26 J. Bigot, V. Halte, J. Merle and A. Daunois, 2000, 181–203.27 G. V Hartland, Chem. Rev. (Washington, DC, U. S.), 2011, 111, 3858–3887.28 C. Bauer, J. P. Abid and H. H. Girault, Chem. Phys., 2005, 319, 409–421.29 M. Bonn, M. J. P. Brugmans, A. W. Kleyn and R. A. van Santen, Chem. Phys. Lett.,
1995, 233, 309–314. 30 G. Flachenecker and A. Materny, J. Chem. Phys., 2004, 120, 5674–5690.31 M. Gil, M. Ziółek, J. A. Organero and A. Douhal, J. Phys. Chem. C, 2010, 114, 9554–
9562. 32 N. Alarcos, B. Cohen and A. Douhal, J. Phys. Chem. C, 2014, 118, 19431–19443.

172
33 K. S. Kumar, S. T and P. Natarajan, 2011, 126, 945–954.34 U. Schmidhammer, V. De Waele, S. Mintova, E. Riedle and T. Bein, Adv. Funct.
Mater., 2005, 15, 1973–1978. 35 T. Bein, 2004, 10640–10648.36 G. Buntinx, R. Naskrecki and O. Poizat, J. Phys. Chem., 1996, 100, 19380–19388.37 C. Voisin, C. Voisin, N. Del Fatti, N. Del Fatti, D. Christofilos, D. Christofilos, F.
Vallée and F. Vallée, J. Phys. Chem. B, 2001, 105, 2264–2280. 38 J. H. Hodak, I. Martini and G. V. Hartland, J. Phys. Chem. B, 1998, 102, 6958–6967.39 H. H??vel, S. Fritz, A. Hilger, U. Kreibig and M. Vollmer, Phys. Rev. B, 1993, 48,
18178–18188. 40 U. Kreibig, Appl. Phys. B Lasers Opt., 2008, 93, 79–89.41 A. Y. Stakheev and L. . Kustov, Appl. Catal. A Gen., 1999, 188, 3–35.42 E. Khon, A. Mereshchenko, A. N. Tarnovsky, K. Acharya, A. Klinkova, N. N. Hewa-
Kasakarage, I. Nemitz and M. Zamkov, Nano Lett., 2011, 11, 1792–1799. 43 S. G. Chiodo and T. Mineva, J. Phys. Chem. C, 2016, 120, 4471–4480.

173
Appendix
Film thickness determination by FTIR spectroimaging
The intensity of the zeolite framework vibration (integrated area between 1304 and 941cm-1)
is used to quantify the thickness of the film. The linear correlation between the area of the band
and the thickness was determined using a LTL film deposited on a silicon wafer. Figure SI-1
shows the optical image (A) On the optical image (A), the top of the picture corresponds to the
uncovered Si surface and the LTL film is on the bottom. The FTIR spectra were recorded for
the spatial area corresponding to the optical image with a spatial resolution of 1.1*1.1 µm2 per
pixel. An example of recorded spectrum is given in Figure 1. The most intense band (in grey)
corresponds to the zeolite framework vibration. In Figure1-C the IR image was reconstructed
by integrating the IR spectra in the range of 1304-941 cm-1 for each measured pixel.
Figure-SI-1 (A) Optical image of a LTL on Si, (B) Representative infrared spectra of the zeolite film and (C) 2D Map of the integrating absorbance of the zeolite band between 1304 and 941 cm-1. In image C, the color varies from blue-to-red as the intensity of the IR band increases.
For the FTIR image, the distribution of the intensity of the zeolite band was analyzed (Figure
SI-2 A), and the average value was determined: I = 8.1. The film thickness was measured by

174
SEM imaging (fig SI-2 B). So, the calibration is: Integrated intensity of zeolite framework band
= 3.2 / 100 nm (thickness of the film) This factor was applied to determine the thickness of
AgLTL film.
Figure SI-2 (Histogram showing the number of detector pixels for the different values of the Integrated intensity of the zeolite band between 1304 and 941 cm-1 (in green, the Gaussian fit of the curve) and SEM image of the film.
Complementary fits by the TTM model
Figure SI-3 Fit of the decay of the transient signal (380 nm) using a 2 exponential model. The fit is not satisfactory

175
Figure SI-4 Fit of the decay of the transient signal using the TTM model for different probe wavelength in the range 372-390 nm. The fitted temperature value (Te(0) varies in the range 3650 - 4070 Kelvins

176
General Conclusions
This manuscript has combined all stages from the preparation of copper containing LTL
zeolites to their possible applications. The synthesis and characterization protocols allow to
control the particle size, shape, and morphology of the materials, as well as the state of the
copper species in the zeolite matrix, which is of paramount importance in the development of
advanced nanomaterials. The properties of the Cu containing LTL zeolites are tailored and thus
the applications in sensing, selective adsorption on metals and photo catalysis were explored.
Within this work, the effect of the preparation conditions on the state of copper in the nanosized
zeolite matrix was studied in detail. The main experimental methods applied are powder X-ray
diffraction, in situ IR spectroscopy using probe molecules, UV-vis spectroscopy, nitrogen
sorption, scanning and transmission electron microscopies.
The most important findings in this study can be summarized as follows.
1. A detailed study of the evolution of copper species in the LTL nanosized zeolite
suspension reduced with hydrazine revealed the formation of copper nanoparticles with
dimensions limited by the size of the LTL zeolite channels and cages. However, with
prolonged reduction time, the Cu NPs tend to migrate to the zeolite surface due to their
high mobility in aqueous media, resulting in large copper particles. Transmission
electron microscopy shows the presence of 0.2-1.6 nm Cu NPs distributed throughout
the zeolite crystals after 190 min chemical reduction. After 280 min, there are more Cu
NPs formed within the zeolite pores and on their surface with a maximum size of 2.2
nm. Finally, larger copper nanoparticles were formed on the zeolite surface, while the
LTL zeolite structure was completely preserved.
2. The reduction of copper in zeolite matrix results in a complex system, containing
different copper species: residuals of Cu2+, Cu+, and CuNPs. The results of FTIR

177
spectroscopy show the heterogeneity of Cu2+ and Cu+ cations in the Cu-LTL zeolite
prepared by ion-exchange approach. Furthermore, the quantitative analysis based on
CO adsorption followed by FTIR shows that the relative amount of copper in (1+) state
is ~30%. This agrees with the amount of CuNP determined by UV-Vis measurements
(56%).
3. The state and behavior of copper in the LTL zeolite strongly depend on the method
used for the Cu inclusion. The copper introduced by in situ synthesis approach shows
distinct environment and occupies different position compared to the Cu introduced by
ion exchange method. The ion exchange approach leads to modifications of the samples
causing the displacement of a significant amount of Cu to the extra-framework
positions, as has been revealed by adsorbing various probe molecules.
4. The suspensions of copper-containing LTL zeolite were assembled in thin films on
silicon wafers and CaF2 plates via spin-coating approach. The films with different
thickness, mechanical and chemical stability were obtained by adjusting the deposition
parameters and using organic binders. The films were further employed for detection
of low concentration of CO at ambient temperature. The copper-containing zeolite films
demonstrate high sensitivity and fast response toward low concentrations of CO (1-100
ppm).
5. The ion exchange procedure was applied to prepare silver containing LTL type zeolite
nanocrystals. The potential of using the silver containing nanosized zeolites for hot-
electrons driven chemistry applications has been demonstrated. The ultrafast optical
response of the Ag-LTL nanocrystals photo-excited at the plasmon band of the Ag NPs
was studied. In addition, the Ag-LTL nanocrystals were assembled as transparent layers
on CaF2 plates. The first transient absorption measurements performed on Ag-LTL
zeolite films were performed. It has been shown that reliable transient spectra can be

178
obtained under controlled atmosphere. It has been demonstrated that the zeolite
nanocrystals stabilized very small silver NPs without perturbing their electronic
properties, and therefore they behave as free Ag NPs. It is also demonstrated that these
materials can be potentially highly photoactive under solar illumination conditions
owing to the possible formation of hot-electrons with a high initial electronic
temperature by the absorption of a single photon per Ag NP.
Although the important results on the copper-containing nanozeolites have been achieved in
the present work in terms of the kinetics of the Cu NPs growth and characterization of the
copper species introduces to the zeolite host by different approaches, there are still many
challenges to be addressed. In particular, the stability issues of Cu NPs and their tendency to
migrate from the zeolite matrix with time to form balk particles, especially under harsh
conditions have to be studied.
The results obtained reveal the high potential of metal containing LTL nanosized zeolites for
plasmonic chemistry applications. However, the structural transformations occurring during
the photocatalytic reaction require special attention, and it is prudent to characterize the
materials after photocatalytic tests and compare with the as-prepared materials to precisely
elucidate and identify the active catalytic sites. In situ and operando spectroscopy are ideal
tools for observation of the possible structural variation of the Cu species during catalytic
processes.


Résumé Les objectifs principaux de ce travail étaient d'étudier la nature des composés de cuivre formés dans les nano-zéolithes en utilisant deux approches: (i) incorporation directe du Cu via une synthèse mono pot et (ii) incorporation post-synthèse du Cu suivi par une réduction chimique. Une étude détaillée de l'évolution des espèces de cuivre dans la suspension de nano-zéolithe LTL réduite avec de l'hydrazine a révélé la formation de nanoparticules de cuivre avec des dimensions limitées par la taille de canaux et des cages de la zéolithe. Cependant, avec un temps de réduction prolongé, les NPs de Cu ont tendance à migrer vers la surface de la zéolithe en raison de leur forte mobilité dans les milieux aqueux, et donne lieu à de grosses particules de cuivre, tout en conservant la structure de la zéolithe. La réduction du cuivre donne lieu à un système complexe contenant différentes espèces de cuivre: des résidus de Cu2+, Cu+ et des NPs de Cu. Les études par spectroscopie IRTF montrent l'hétérogénéité des cations Cu2+ et Cu+ dans la zéolithe Cu-LTL préparée par échange ionique. Il a été prouvé, que l'état et le comportement du cuivre dans la zéolithe LTL dépendent fortement de la méthode utilisée pour l'incorporation du Cu, soit par échange ionique, soit par incorporation directe du Cu. Il est devenu évident que le cuivre ajouté au mélange de synthèse possède un environnement distinct et occupe une position différente quand il est comparé à celui de l’échange ionique. Il est vraisemblablement partiellement localisé dans la charpente zéolithique ou /caché dans la structureet est inaccessible pour les molécules adsorbées. De plus, les modifications post-synthèse du matériau obtenu par synthèse directe entrainent un déplacement vers des positions hors structure d’un nombre important de Cu. De plus, les films minces de zéolithes contenant du métal avec des épaisseurs différentes ont été obtenue par un procédé de revêtement par centrifugation de supports de silicium et/ou des supports optiques CaF2. Ce dernier a été utilisé pour la détection de CO en faible concentration à température ambiante et l’étude de la réponse optique ultrarapide du matériau photo-excité en résonance avec la bande du plasmon des NPs métalliques. En résume, ce travail couvre entièrement toutes les étapes de la synthèse, la modification, la caractérisation complète et l’utilisation de nano-cristaux de zéolithe contenant du métal. La combinaison des propriétés uniques des nanoparticules de cuivre et de la polyvalence des nano-zéolites donne lieu à des matériaux avancées intéressants pour de nombreuses d'applications dans des dispositifs de taille nanométrique, la détection sélective de produit chimique, la catalyse, etc. Mots clés: Zéolites; Cuivre; Nanoparticules de cuivre, Spectroscopie femtoseconde, Spectroscopie infrarouge
à transformée de Fourier; Spectroscopie ultraviolette sous vide, Couches minces
Abstract The main objectives of this work were to study the nature of copper species formed in the nanosized zeolites using two approaches: (i) direct incorporation of Cu via one pot synthesis, and (ii) post synthesis incorporation of Cu followed by chemical reduction. A detailed study of the evolution of copper species in the LTL nanosized zeolite suspension reduced with hydrazine revealed the formation of copper nanoparticles with the dimensions limited by the size of zeolite channels and cages. However, with prolonged reduction time, the Cu NPs tend to migrate to the zeolite surface due to their high mobility in aqueous media, resulting in large copper particles, while the zeolite structure is preserved. The reduction of copper resulted in a complex system, containing different copper species: residuals of Cu2+, Cu+, CuNPs. The results of FTIR spectroscopy show the heterogeneity of Cu2+ and Cu+ cations in the Cu-LTL zeolite prepared by ion-exchange procedure. It has been proven, that the state and behavior of copper in LTL zeolite strongly depend on the method used for Cu inclusion: ion exchange or direct Cu incorporation. It became evident, that copper added to the synthesis mixture shows distinct environment and occupies different position when compared to ion exchange. It is presumably partially located in the zeolite framework or occluded in its walls and is inaccessible by adsorbed molecules. In addition, the post-synthesis modifications of the material obtained by direct synthesis cause the displacement of a significant amount of Cu to the extra-framework positions. Further, the metal containing zeolite thin films with different thickness were obtained by spin-coating approach on silicon wafers and CaF2 optical plates. The latter were after employed for detection of low concentration of CO at ambient temperature and investigation of the ultrafast optical response of the materials photo-excited in resonance with the plasmon band of the Me NPs. In summary, the present PhD thesis fully covers the all steps from the synthesis, modification, thorough characterization, and application of metal-containing nanosized zeolite crystals. The combination of unique properties of copper nanoparticles with versatility of nanozeolites give rise to the development of advanced materials which are interesting for many applications in nanoscale devices, selective chemical sensing, catalysis etc. Keywords: Zeolites; Copper; Copper nanoparticles; Femtosecond spectroscopy; Fourier transformed
infrared spectroscopy; Ultraviolet-visible spectroscopy; Thin films