proposed budget - sound transit - ride the · pdf fileabout 50 participants completed this...
TRANSCRIPT

September 2015
2016BudgetProposed

Central Puget Sound Regional Transit Authority • Union Station 401 S. Jackson St., Seattle, WA 98104-2826 • Reception: (206) 398-5000 • FAX: (206) 398-5499 www.soundtransit.org
September 2015 To: Sound Transit Board of Directors
From: Mike Harbour, Acting Chief Executive Officer Subject: UProposed 2016 Budget The year 2016 will be a significant one for Sound Transit with the opening of two new light rail segments that will greatly increase ridership and change the way many people travel around our region. In the first quarter of 2016, the University Link Extension will open, connecting downtown Seattle, Capitol Hill, and the University of Washington. The project is $150 million under budget and six months ahead of schedule. In the fall, the South 200th Link Extension between Sea-Tac Airport and the new Angle Lake Station will open.
Sound Transit ridership, already at record highs, will jump to over 41 million in 2016 with the opening of the two light rail extensions. University Link will connect three busy urban centers in Seattle – downtown, Capitol Hill, and the University District. The extension south to the Angle Lake Station will include a new 1,000-space parking facility that will make it more convenient for residents of south King and Pierce counties to use Sound Transit’s light rail system.
Work will also continue in 2016 on more Link extensions going east, south, and north. Construction will begin on the 14-mile East Link Extension connecting Redmond, Bellevue, and Mercer Island to the existing light rail line at Seattle’s International District Station. Work continues on the Northgate extension from the University of Washington Station to serve the U District and Roosevelt neighborhoods and Northgate Mall. The two tunnel boring machines that are mining between Northgate and the University of Washington Station are expected to complete their work in 2016.
In addition, Sound Transit will continue exploring a major expansion of the region’s high-capacity transit system. New taxing authority was granted to Sound Transit by the Washington State Legislature and work is continuing to shape a Sound Transit 3 (ST3) ballot measure that could go to voters in November 2016.
2016 Budget Sound Transit’s proposed 2016 budget is $1.2 billion, 6.0 percent lower than the 2015 budget. We expect to collect revenues of $997.9 million in 2016, 6.9 percent higher than the 2015 budget. The 2015 forecast includes bond proceeds of $600 million. All revenue categories are trending higher — with the exception of federal grants — as construction on University Link winds down. We will seek a significant Full Funding Grant Agreement (FFGA) for the Lynwood Link Extension.
The proposed 2016 operating budget is $359.8 million, 13.3 percent higher than 2015. The increase includes the addition of 23 positions in 2016 and the full year’s cost of 31 positions added in 2015. Nearly 85 percent of the operating budget
CHAIR
Dow Constantine King County Executive
VICE CHAIRS
Paul Roberts Everett Councilmember
Marilyn Strickland Tacoma Mayor
BOARD MEMBERS
Claudia Balducci Bellevue Mayor
Fred Butler Issaquah Mayor
Dave Earling Edmonds Mayor
Dave Enslow Sumner Mayor
John Lovick Snohomish County Executive
John Marchione Redmond Mayor
Pat McCarthy Pierce County Executive
Joe McDermott King County Council Vice Chair
Mary Moss Lakewood Councilmember
Ed Murray
Seattle Mayor
Mike O’Brien Seattle Councilmember
Lynn Peterson Washington State Secretary of
Transportation
Larry Phillips King County Council Chair
Dave Upthegrove King County Councilmember
Peter von Reichbauer King County Councilmember
CHIEF EXECUTIVE OFFICER
Joni Earl
Central Puget Sound Regional Transit Authority • Union Station 401 S. Jackson St., Seattle, WA 98104-2826 • Reception: (206) 398-5000 • FAX: (206) 398-5499 www.soundtransit.org
increase is due to increased transit service levels. We will open two new Link segments and propose additional service hours on ST Express to address passenger overloads and on-time performance issues. The addition of 19,750 service hours in 2016 equates to an annualized amount of 32,000 hours in 2017, which will meet the full commitment to ST Express bus service made in the ST2 transit plan. An additional round trip will also be added on Sounder between Seattle and Lakewood. Our transit services operating budget for the year is $264.3 million to provide 988,000 service hours.
More than two-thirds of the 2016 budget, or $802.9 million, will be spent on project development, design, and construction. We will continue to perform quality and safety audits on major capital projects and carefully monitor project budgets and schedules. Also, we will continue to engage Small and Disadvantaged Business Enterprises to perform work for Sound Transit.
Major projects and initiatives driving the 2016 budget include: Service increases on Sounder, ST Express, and light rail service. Continued progress of the ST2 program with the completion of the U Link and South 200th
Street extensions, continuing construction on Northgate Link, the initiation of construction on East Link, and the continuing environmental and design work on Lynnwood Link, Federal Way Link, Tacoma Link, and the new Operations and Maintenance Satellite Facility.
Increased security and public safety spending as new stations open and ridership increases. Additional safety positions and expenditures reflecting new federal requirements, an
increased number of projects needing safety certification, and expanded light rail and commuter rail operations.
Increased operating costs in the Downtown Seattle Transit Tunnel as more light rail service reduces the number of buses in the tunnel, necessitating increased debt and maintenance payments and investments on surface streets and in-tunnel operations.
An increased number of active projects, continued technology improvements, and an increased level of operations requiring additional support positions in Finance and Information Technology, Diversity, and Procurement and Contracts.
Completion of the ST3 System Plan. A significant amount of work is needed to complete the technical analysis required to develop a System Plan for voter consideration in November 2016. This work requires specialized technical expertise as well as extensive engagement with other public agencies, local jurisdictions, business and community organizations, interest groups, and the general public.
Ridership Ridership will reach a new high in 2016 with the U Link and South 200th Street light rail openings, expanded ST Express bus service and increased Sounder service. The ridership forecast for 2016 is 41.5 million boardings, a 20 percent increase over 2015.
Sustainability Sustainability is a key part of how we do business, and that remains true in 2016 as we continue implementing our sustainability initiatives and seeking improvement. Sound Transit’s environmental program looks for ways to conserve natural resources, reduce construction-related pollution, increase the efficiency of our transit vehicles, and integrate sustainability measures in decision-making. In 2016 we will perform a sustainability analysis of the ST3 plan, update the ST Express and Sounder Fuel Efficiency Strategy, and integrate sustainability into the Federal Way and Lynnwood Link extensions.
Employee Engagement and Continued Process Improvement Key elements of Sound Transit’s success are the engagement, commitment, and quality of its employees. Our annual Employee Engagement Survey shows employees have a strong belief in the agency’s mission, high levels of job satisfaction, and trust for supervisors and fellow employees. The

Central Puget Sound Regional Transit Authority • Union Station 401 S. Jackson St., Seattle, WA 98104-2826 • Reception: (206) 398-5000 • FAX: (206) 398-5499 www.soundtransit.org
proposed 2016 budget reflects a commitment to continuous improvement throughout the organization and to maintaining the high levels of employee engagement. Continuous process improvement efforts will continue and accelerate in 2016 as we complete training in Rapid Office Kaizen for all employees and continue to initiate new Kaizen efforts to improve how we work. The budget also continues the commitment to a well-trained workforce with the Management Excellence Program expanding to 40 participants in 2016. About 50 participants completed this award-winning training in 2014 and 2015. Our Knowledge Transfer program and other training programs will be further enhanced in 2016.
Contents Introduction ............................................................................................................................... 1
Introduction to Proposed 2016 Budget .................................................................................... 1 2016 Agency Scorecard .......................................................................................................... 1
Budget Overview ...................................................................................................................... 6
2016 Budget Highlights ........................................................................................................... 6 Revenues & Other Financing Sources ................................................................................... 8 Operating Budgets ................................................................................................................. 10
Departments ......................................................................................................................... 10 Communications & External Affairs ................................................................................... 13 Design, Engineering & Construction Management ............................................................ 15 Executive .......................................................................................................................... 17 Finance & Information Technology .................................................................................... 19 Legal ................................................................................................................................. 21 Operations ........................................................................................................................ 23 Planning, Environment & Project Development ................................................................. 25
Transit Modes ....................................................................................................................... 27 Tacoma Link Light Rail ..................................................................................................... 30 Link Light Rail ................................................................................................................... 32 Sounder Commuter Rail ................................................................................................... 35 ST Express Bus ................................................................................................................ 38
Project Budgets ..................................................................................................................... 41
System Expansion ............................................................................................................ 41 Enhancement ................................................................................................................... 45 Rehabilitation & Replacement ........................................................................................... 48 Administrative .................................................................................................................... 49
Other Budgets ........................................................................................................................ 51
Appendices ............................................................................................................................ 52 Appendix A – Subarea Allocations ....................................................................................... 52

Introduction
Introduction to Proposed 2016 Budget New Look for Budget and TIP This year we have changed the format of the Proposed Budget and Proposed TIP documents to enhance readability and make them more sustainable. We have excluded supplemental materials, photos, and color printing, since the proposed books have a short shelf life. However, budget tables have not been abbreviated. The adopted budget and TIP documents will be longer as they will include several more appendices, photos, and charts. As usual, the books will be posted on the agency’s website—www.soundtransit.org—to improve access and enhance sustainability.
Change to Operating Budgets In prior years, direct transit mode costs appeared in transit mode budgets and non-modal costs appeared in separate department budgets. Beginning in 2016, all operating costs are budgeted by department. This approach makes clear which costs are managed by each department. Reports that show the direct and indirect costs charged to each transit mode are still included, unchanged from prior years.
Structural Changes
To reflect the new look and changes to operating budgets, we created a new section for Revenues and Other Financing Sources, combined Service Delivery and Agency Administration into Operating Budgets, and Project Delivery is now Project Budgets. Debt service, donations, and reserves are covered in Other Budgets.
Expanded Budget Discussion Although the Proposed Budget is shorter, we have enhanced the discussion of operating budgets by providing highlights of current activities and accomplishments, as well as 2016 budget highlights for each department. Transit modal budgets and performance statistics are also discussed.
2016 Agency Scorecard Every year the agency establishes objectives and priorities that align with the strategic direction set by the Board. In 2016, we will focus on improving our customers’ experiences and collaborating with our transit partners to deliver the most effective and efficient regional transit system possible. We will continue to strengthen our relationships with the citizens of the communities we impact, our many contractors, and employees. Will we renew the agency’s long-term commitments to financial stewardship, sustainability, transit-oriented development, and station access. The proposed budget for 2016 aligns with the strategic direction set in the following 2016 Agency Scorecard. Our priorities include continuing to:
Engage the community.
Maintain a balanced financial plan.
Maximize the use of disadvantaged and small businesses.
Implement transit-oriented development and parking management programs.
Integrate sustainable practices into all agency activities.
Seek integration opportunities with the region’s transportation providers.
Improve workforce programs to retain and engage talented staff.
2016 Proposed Budget
Sound Transit 1 of 56

Objective #1: Successfully deliver voter approved capital projects
Priorities Performance Measures
Deliver quality projects on schedule
80% of Agency Milestones relating to capital projects met
Deliver quality projects on budget
Cost of each project phase maintained within the approved budget
Cost of construction change orders issued for design conflicts or design errors and omissions kept below 5% of the contract value
Ensure project safety and safety certification requirements are met
Loss Time Injury rate on construction projects below the national average
Design and construction safety certification milestones met
Engage and inform communities and stakeholders
Positive response rate of 70% or higher on outreach surveys achieved
Objective #2: Increase ridership and deliver a safe, high quality customer experience
Priorities Performance Measures
Increase systemwide ridership
40 million riders served
Increase transit use for off-peak travel
Average weekly off-peak ridership increased by 5%
Improve service quality and efficiency
On-time performance objectives for each mode met
Fewer customer complaints received per 100,000 boardings than the modal targets
No preventable accidents occurred on rail modes. Less than 0.80 accidents occurred per 100,000 miles traveled on ST Express buses
Downtown Seattle Transit Tunnel nine minute travel time (less than 11 minutes for 90% of the time) between Stadium and Westlake Stations achieved
Customer Satisfaction Survey score of 3.3 or above
Rate of Transit Conduct incidents kept below 10 per 100,000 boardings
Sound Transit 2 of 56

Objective #2: Increase ridership and deliver a safe, high quality customer experience
Priorities Performance Measures
Increase transit mode split in commuter travel
Barriers to transit use for 500,000 potential boardings identified
Share of non-SOV (single occupancy vehicle) arrivals at Sound Transit facilities with parking increased by 5%
Maintain Sound Transit business and services during and after an emergency event
Service restoration plan developed within 48 hours in the case of a major service interruption
Continuity of Operations Plan implemented
Maintain Sound Transit facilities and assets to a state of good repair
80% of 2016 enterprise asset management plan goals met
Preventive maintenance targets for each mode met
Condition rating of 2.5 (as defined by the Federal Transit Administration) achieved for all assets undergoing condition assessment
Objective #3: Maintain and enhance effective business practices and improve financial and environmental sustainability
Priorities Performance Measures
Maintain a balanced financial plan
Debt service coverage ratio maintained above policy level (cash flow at least 1.5 times debt service costs)
Farebox recovery ratio of 23% for Sounder, 27% for Link and 20% for ST Express achieved
90% of grant drawdown goals in the Financial Plan achieved
Improve internal business processes
100% of Continuous Process Improvement events completed as scheduled
100% of priority policy changes completed as scheduled and in accordance with the agency’s Policy Development and Adoption Policy and Procedures
100% of audit recommendations addressed within the schedules set by management responses
Integrate or implement sustainability throughout the agency
85% of annual sustainability targets met
Maximize use of Disadvantaged Business Enterprises and local small businesses
Disadvantaged Business Enterprise agency goal of 12.4% on all federally funded contracts and all agency small business goals met
Ensure procurement activities maintain high performance, integrity and sustainability standards
Contract solicitations issued on time in accordance with targets for each procurement type
Green procurement goals established and tracked at the agency and department levels
Procurement integrity training completed by 90% of staff
2016 Proposed Budget
Sound Transit 3 of 56

Objective #3: Maintain and enhance effective business practices and improve financial and environmental sustainability
Priorities Performance Measures
Promote a safety culture Priority safety plans, programs and procedures (Safety System Management Plan, Safety System Certification Plan and Safety System Program Plans) reflecting current business practices adopted and implemented
Job Safety Training Assessments and all required safety trainings completed
Integrate service and planning efforts with partner agencies
Puget Sound Regional Council Transit Integration Report completed
Objective #4: Enhance talent management and organizational vibrancy
Priorities Performance Measures
Advance strategic workforce planning and continuous alignment of people, strategy and performance
Demographics of the region reflected in the Sound Transit workforce
100% of performance evaluations submitted to the Human Resources Division before the anniversary date
In-depth performance management training provided to at least 70% of managers
Enhance cross-departmental collaboration, inclusiveness and support
85% of staff trained in Rapid Office Kaizen
Interdepartmental relations score in the 2016 Employee Engagement Survey improved to 3.2 or above
Provide consistent, equitable, respectful and inclusive leadership and culture
Diversity and inclusion refresher training completed by 90% of staff
Three or fewer formal equal employment opportunity complaints filed
Maximize talent potential, preserving and further developing critical skills and knowledge
Department-level succession planning program piloted by Q3 2016
Internal promotions, transfers and job reclassifications tracked quarter-to-date for baselines of career growth opportunities
Support high level of personal engagement and pride in the agency’s work
2016 employee engagement scores received at or above national norms in all dimensions, including key engagement dimensions
Focus on employee retention: percent of voluntary turnover (excluding retirements) and percent of retirements
2016 Proposed Budget
Sound Transit 4 of 56

Objective #5: Plan for system expansion
Priorities Performance Measures
Deliver actionable information for the Sound Transit Board to use in adopting the next System Plan
System planning requirements met, and System Plan adopted by the Board on schedule to allow a November 2016 ballot measure
Deliver sustainable long-term financing scenarios for system expansion
ST3 financial plan finalized
Engage the community in system expansion planning
Support for system expansion maintained at 80% or greater
Deliver a ballot measure in time for the November 2016 election, if the Sound Transit Board elects to place a measure before the voters
Ballot measure adopted by the Board and forwarded to Snohomish, King and Pierce counties for action to place it on the November 2016 ballot
Objective #6: Open University Link and S. 200th Link extensions for passenger service
Priorities Performance Measures
Ensure readiness for passenger service
Safety certification completed as required in the activation schedule
Operations staff trained and ready to open the system
Substantial completion of construction and system integration testing completed 30 days before revenue service
Certificate of Occupancy Permit secured before opening day
Engage and inform communities and stakeholders
Communications and marketing plan for launches delivered
2.9 million residents of the Sound Transit district reached
Safety education campaign completed with 100% of priority audiences
Start up new service University Link opened in Q1 2016
South 200th Link Extension opened in Q3 2016
2016 Proposed Budget
Sound Transit 5 of 56
Budget Overview Sound Transit services are expanding. New Link light rail service to University of Washington and Angle Lake stations will launch in 2016. Sounder Southline will add another round trip between Seattle and Lakewood in September. ST Express buses will add 19,750 service hours in 2016, or approximately 92 weekday trips, to address immediate capacity needs and add connections to new Sounder and Link services. Total ridership on all modes is forecast to surpass 41 million.
Light rail design and construction projects are underway to extend light rail service north to Northgate and Lynnwood, south to Federal Way, and east to the Overlake area of Redmond. In addition, planning is ongoing for the next system expansion program.
2016 Budget Highlights The 2016 budget includes revenues of $997.9 million and outlays of $1.2 billion. The agency’s projected unrestricted cash balance of $645.6 million at the end of 2015 together with 2016 revenues will fund annual expenditures and reserve contributions, yielding a projected unrestricted cash balance of $440.9 million at the end of 2016.
Revenues & Other Financing Sources We expect to collect revenues of $997.9 million in 2016, which is 6.9 percent higher than the 2015 budget, mainly due to higher sales tax, motor vehicle excise tax, and passenger fare revenues. On August 4, 2015, Sound Transit executed a $1.0 billion bond sale, which closed on September 10, 2015. The bonds generated $601.1 million in new proceeds and $433.8 million in repayment of bonds issued previously, generating present value savings of over $30 million.
Operating Budgets Beginning in 2016, departments will report all operating expenses under their management, regardless of where the expenses are ultimately charged. All department costs are either direct charged or allocated to transit service modes or projects. Sound Transit employs a cost allocation model to allocate administrative overhead to transit modes and to construction in progress. Use of the approved model increases the amounts eligible for reimbursement through federal grants.
The total operating budget of $359.8 million is up 13.3 percent compared to the 2015 budget, driven primarily by transit service increases and specifically by the two new Link extensions, new Sounder service, and additional bus hours slated to begin in 2016. Of the total, $264.3 million or 73.5 percent will be charged to transit modes and the remaining $95.5 million or 26.5 percent to projects.
Project Budgets Total project spending is budgeted at $802.9 million for 2016. Almost 89.1 percent or $715.0 million is budgeted to continue with planning, design, and build-out of current voter-approved programs, Sound Move and ST2, and to plan for the next extension to the regional transit system. An additional $27.7 million is budgeted to enhance or maintain current service and operational capabilities. Administrative infrastructure projects, project staffing, and agency support are budgeted at $60.1 million.
2016 Proposed Budget
Sound Transit 6 of 56

2016 BUDGET SUMMARY (in thousands)
2014Actual
2015Budget
2015Forecast
2016Budget
$639,890 $651,825 $680,417 $708,39474,166 75,604 77,484 80,289
3,092 2,879 3,184 3,280184,719 121,420 131,719 104,988
10,940 3,934 4,475 6,66660,180 60,062 65,073 72,04614,759 6,952 3,753 10,25011,092 10,957 11,894 11,958
- - 601,141 -$998,837 $933,633 $1,579,141 $997,871
Departments$6,137 $7,405 $7,153 $7,80830,652 35,772 35,217 38,626
Executive 13,861 17,512 16,309 18,693Finance & Information Technology 29,782 38,327 33,593 42,915Legal 2,653 3,113 2,935 3,312Operations 196,062 207,732 208,812 241,215Planning, Environment & Project Development 6,692 7,599 6,748 7,201
285,837 317,460 310,768 359,769
Charges to Projects (78,411) (89,047) (87,371) (95,517)Charges to Transit Modes 207,426 228,413 223,397 264,252
672,045 805,705 801,631 715,04422,667 35,230 24,328 17,19227,750 27,292 29,473 10,54753,511 60,235 70,433 60,074
775,973 928,462 925,865 802,856
105,757 108,255 107,214 121,842
3,090 5,000 5,000 5,000
$1,092,246 $1,270,130 $1,261,476 $1,193,951
Design, Engineering & Construction Management
Debt Service
Donations to Other Governments
Total Expenditures & Outlays
System ExpansionEnhancementRehabilitation & ReplacementAdministrative
Subtotal Project Budgets
Motor Vehicle Excise Tax
Revenues and Other Financing SourcesRetail Sales And Use Tax
Rental Car Tax
Project Budgets
Passenger Fare RevenueInvestment IncomeMiscellaneous Revenues
Local & State ContributionsFederal Grants
Total Revenues and Other Financing Sources
Operating Budgets
Subtotal Department Budgets
Bonds Proceeds
Communications & External Affairs
Expenditures & Outlays
2016 Proposed Budget
Sound Transit 7 of 56
Revenues & Other Financing Sources Funding for Sound Transit’s operations and capital programs comes from local retail sales and use tax, motor vehicle excise tax (MVET), rental car tax, federal grants, passenger fare revenue, investment income on cash balances, bond issues, and miscellaneous revenues, such as advertising on our vehicles and property rentals. Our sales and use tax and MVET revenue forecasts are based on data and assumptions provided by an independent forecaster.
We expect to collect $997.9 million in total revenues in 2016, which is 6.9 percent or $64.2 million higher than the 2015 budget, mainly due to higher sales tax, MVET, and passenger fare revenues. The 2015 revenue forecast of $1.6 billion includes $601.1 million from the sale of bonds in August 2015, which was not included in the adopted 2015 budget.
Retail Sales and Use Tax Sound Transit receives 0.9 percent of transactions subject to sales and use taxes generated
within the Sound Transit district.
Retail Sales and Use Tax is Sound Transit’s largest revenue source at 71.0 percent of total revenues, with $708.4 million projected in 2016.
Receipts in 2016 are projected to be 8.7 percent or $56.6 million higher than the 2015 budget, and 4.1 percent or $28.0 million higher the 2015 forecast, reflecting a booming construction sector and stronger consumer spending in the regional economy.
Motor Vehicle Excise Tax (MVET) Sound Transit receives 0.3 percent of vehicle license renewals within the Sound Transit
district.
Receipts of $80.3 million in 2016 are 6.2 percent or $4.7 million higher than the 2015 budget.
Rental Car Tax Sound Transit receives 0.8 percent of rental car payments within the Sound Transit district.
Receipts of $3.3 million in 2016 are 13.9 percent or $401 thousand higher than the 2015 budget.
Federal Grants Federal grant revenues are projected to be $105.0 million in 2016 and include the following
projects:
o University Link - FTA grant of $25.0 million for construction, vehicles, startup, and capitalized interest.
o Point Defiance Bypass - construction costs reimbursed through Federal High Speed Rail grant administered by WSDOT at $26.0 million.
o Tacoma Trestle Track & Signal - FTA grant of $6.1 million for construction, TIGER Award of $5.0 million for construction, $4.0 million for construction costs reimbursed through Federal High Speed Rail grant administered by WSDOT.
o I-90 Two Way Transit & HOV Operations Stage 3 - construction TIGER Award of $10.5 million.
o Northgate Link Extension - FTA grant of $7.0 million for construction.
Federal grant revenues of $105.0 million are 13.5 percent or $16.4 million lower than the 2015 budget, and 20.3 percent or $26.7 million lower than the 2015 forecast, mainly due to lower
2016 Proposed Budget
Sound Transit 8 of 56
anticipated grant drawdowns for the University Link Extension, which will be transitioning to Operations.
Local & State Contributions This category includes state grants for projects and operating grants, as well as any
contributions from local jurisdictions.
The 2016 budget of $6.7 million includes reimbursements for Overlake Transit Center Bridge & Station improvements, Overlake Village Pedestrian Bridge and Infiltration Vault, and University District Station TOD Overbuild.
Passenger Fare Revenue Passenger fare revenues are projected to be $72.0 million in 2016, up 20.0 percent or $12.0
million over the 2015 budget, reflecting the launch of new light rail service in 2016 from downtown Seattle to the University of Washington and from SeaTac Airport to South 200th Street, the implementation of fare revenues for Tacoma Link from Q4 of 2016, and an additional Sounder trip.
Total 2016 ridership is forecast to increase by 26.5 percent over the 2015 budget. Boardings for bus, light rail, and commuter rail modes will increase over the 2015 budget; light rail increasing by 5.8 million boardings or 50.9 percent, ST Express bus boardings will increase by 2.3 million or 13.4 percent, and Sounder ridership will increase by 630 thousand or 20.3 percent. Only Tacoma Link is expected to lose ridership, approximately 5.0 percent due to the implementation of fare collection in Q4 2016.
Average fare per boarding assumptions for the 2016 budget: Link $1.42; Tacoma Link, $0.99; Sounder, $3.10; ST Express, $1.89.
Investment Income Sound Transit receives investment income on surplus cash and restricted funds invested in
accordance with Washington State law and overseen according to Board-approved investment policy (Asset Liability Management Policies).
Investment income is projected at $10.3 million for 2016, up 47.4 percent or $3.3 million compared to the 2015 budget, mainly due to additional investments resulting from the sale of bond proceeds in 2015.
Miscellaneous Revenue Miscellaneous revenues include advertising revenues, rental income from Sound Transit
properties, ORCA regional program billing reimbursements, operating & maintenance reimbursements for Sounder and ST Express, and federal government bond subsidy payments.
2016 revenues of $12.0 million are 9.1 percent or $1.0 million higher than the 2015 budget mainly due to higher reimbursements for the ORCA Regional Program.
Bond Proceeds Bonds are issued to finance capital projects. On August 4, 2015, Sound Transit executed a
$1.0 billion bond sale (including premiums), which closed on September 10, 2015. The bond sale generated $601.1 million in new proceeds, while $433.8 million of the bonds refinanced debt issued previously at higher interest rates. There are no current plans to issue debt in 2016; however, we will continue to evaluate this based on market conditions and liquidity needs.
2016 Proposed Budget
Sound Transit 9 of 56
Operating Budgets Sound Transit’s proposed 2016 operating budgets are $359.8 million, of which $264.3 million is allocated to transit modes and $95.5 million to projects and capital assets. Reporting operating budgets by the department responsible is a change from prior years, when direct charges to transit modes were included in modal budgets and not department budgets. For each department, this section includes a discussion of 2015 activities and accomplishments, 2016 budget highlights, and budget summary. Also, an overview of staffing changes by department is provided. Later in this section, transit mode budget reports, 2016 budget highlights, and performance statistics are included for all transit modes.
Departments Major drivers of the $42.3 million or 13.3 percent increase in department budgets are startup of light rail service to the University of Washington and South 200th Street in SeaTac. Purchased Transportation Services, Security & Safety, and Contract Maintenance account for two-thirds of the increase in the operating budgets. Salaries and Benefits contribute 14.1 percent of the increase due to an anticipated 3.5 percent average increase in existing salaries, a full year of costs for 31 positions added in 2015, along with 23 new positions proposed for 2016.
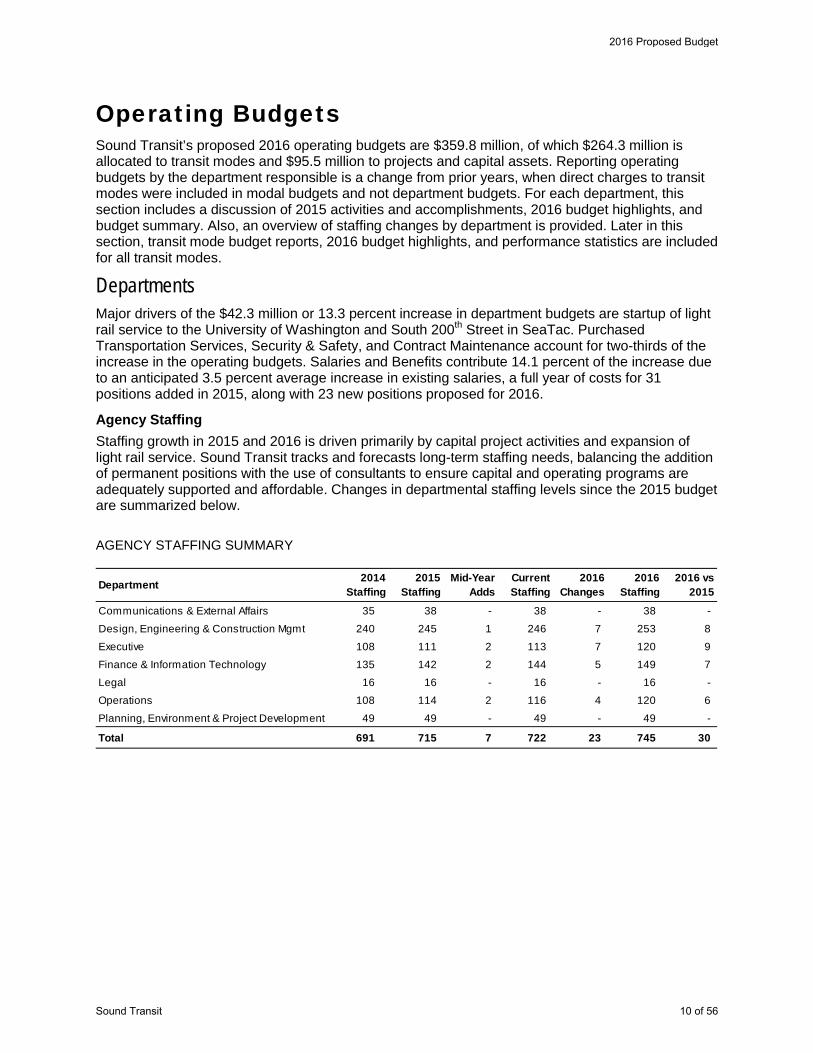
Agency Staffing Staffing growth in 2015 and 2016 is driven primarily by capital project activities and expansion of light rail service. Sound Transit tracks and forecasts long-term staffing needs, balancing the addition of permanent positions with the use of consultants to ensure capital and operating programs are adequately supported and affordable. Changes in departmental staffing levels since the 2015 budget are summarized below.
AGENCY STAFFING SUMMARY
Department 2014 Staffing
2015 Staffing
Mid-Year Adds
Current Staffing
2016 Changes
2016 Staffing
2016 vs 2015
Communications & External Affairs 35 38 - 38 - 38 -
Design, Engineering & Construction Mgmt 240 245 1 246 7 253 8
Executive 108 111 2 113 7 120 9
Finance & Information Technology 135 142 2 144 5 149 7
Legal 16 16 - 16 - 16 -
Operations 108 114 2 116 4 120 6
Planning, Environment & Project Development 49 49 - 49 - 49 -
Total 691 715 7 722 23 745 30
2016 Proposed Budget
Sound Transit 10 of 56
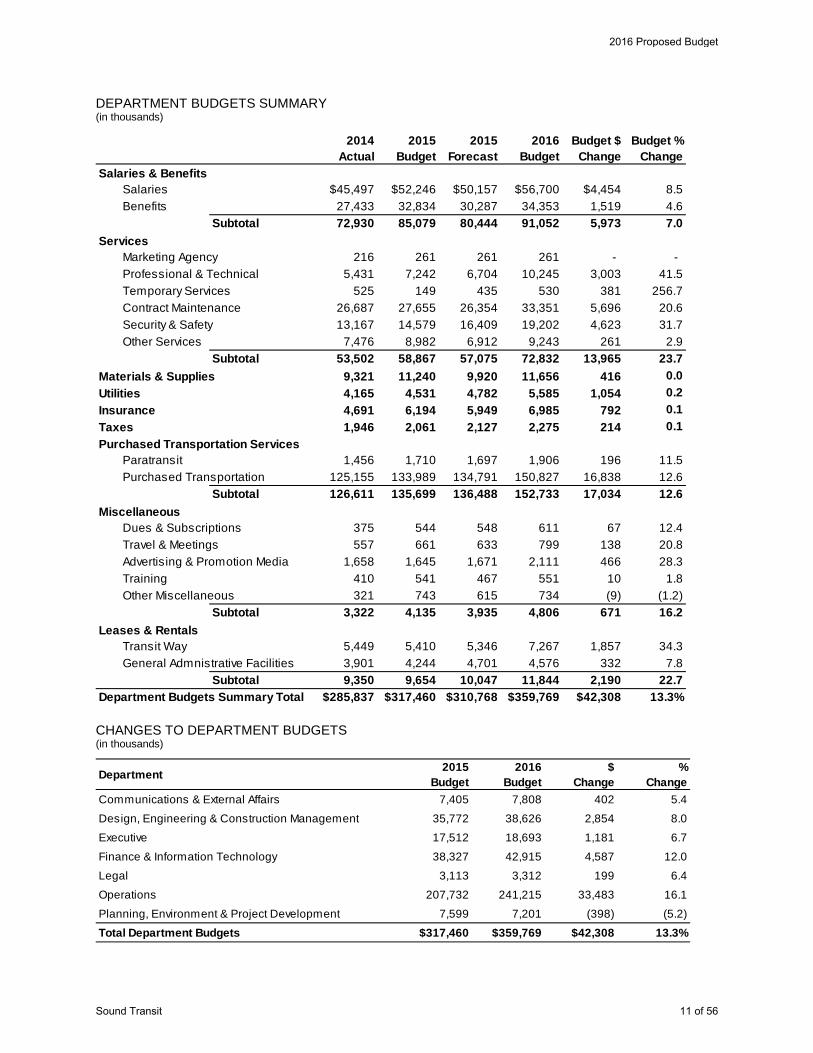
DEPARTMENT BUDGETS SUMMARY (in thousands)
CHANGES TO DEPARTMENT BUDGETS (in thousands)
2014Actual
2015Budget
2015Forecast
2016Budget
Budget $Change
Budget %Change
$45,497 $52,246 $50,157 $56,700 $4,454 8.527,433 32,834 30,287 34,353 1,519 4.6
Subtotal 72,930 85,079 80,444 91,052 5,973 7.0
216 261 261 261 - - 5,431 7,242 6,704 10,245 3,003 41.5
525 149 435 530 381 256.726,687 27,655 26,354 33,351 5,696 20.613,167 14,579 16,409 19,202 4,623 31.7
7,476 8,982 6,912 9,243 261 2.9Subtotal 53,502 58,867 57,075 72,832 13,965 23.7
9,321 11,240 9,920 11,656 416 0.04,165 4,531 4,782 5,585 1,054 0.24,691 6,194 5,949 6,985 792 0.11,946 2,061 2,127 2,275 214 0.1
1,456 1,710 1,697 1,906 196 11.5125,155 133,989 134,791 150,827 16,838 12.6
Subtotal 126,611 135,699 136,488 152,733 17,034 12.6
375 544 548 611 67 12.4557 661 633 799 138 20.8
1,658 1,645 1,671 2,111 466 28.3410 541 467 551 10 1.8321 743 615 734 (9) (1.2)
Subtotal 3,322 4,135 3,935 4,806 671 16.2
5,449 5,410 5,346 7,267 1,857 34.33,901 4,244 4,701 4,576 332 7.8
Subtotal 9,350 9,654 10,047 11,844 2,190 22.7$285,837 $317,460 $310,768 $359,769 $42,308 13.3%Department Budgets Summary Total
Advertising & Promotion Media
Other Services
Materials & SuppliesUtilitiesInsuranceTaxesPurchased Transportation Services
Paratransit
TrainingOther Miscellaneous
Leases & RentalsTransit WayGeneral Admnistrative Facilities
Services
Purchased Transportation
MiscellaneousDues & SubscriptionsTravel & Meetings
Marketing AgencyProfessional & TechnicalTemporary ServicesContract MaintenanceSecurity & Safety
Salaries & BenefitsSalariesBenefits
Department 2015Budget
2016Budget
$Change
%Change
Communications & External Affairs 7,405 7,808 402 5.4
Design, Engineering & Construction Management 35,772 38,626 2,854 8.0
Executive 17,512 18,693 1,181 6.7
Finance & Information Technology 38,327 42,915 4,587 12.0
Legal 3,113 3,312 199 6.4
Operations 207,732 241,215 33,483 16.1
Planning, Environment & Project Development 7,599 7,201 (398) (5.2)
Total Department Budgets $317,460 $359,769 $42,308 13.3%
2016 Proposed Budget
Sound Transit 11 of 56

SOUND TRANSIT ORGANIZATION CHART
Sound Transit
Board of Directors
Chief Executive Office
Diversity Program
Rail
Activation
Procurement &
Contracts
Government &
Community Relations
Board Administration
Safety & Quality
Assurance
Internal Audit
Design, Engineering &
Construction Management
Operations
Finance & Information
Technology
Communications &
External Affairs
Legal
Financial
Accounting
Budget & Financial
Planning
Grants
InformationTechnology
ORCA RegionalServices
RecordsManagement
RiskManagement
Treasury &Revenue
Business &
Construction Management
Project Control & Value Engineering
Design &
Engineering
Operations SupportServices
Transportation &Maintenance
Facilities & Asset
Control
Security &ST Police
Digital
Communications
Media Relations & Public Information
Legal GeneralCounsel
Human Resources
Executive
Department
Major Project
Delivery
Marketing &
Creative Services
Planning,
Environment & Project Development
Office of Environmental Affairs
& Sustainability
Office of Planning &
Development
Office of Capital
Project Development
2016 Proposed Budget
Sound Transit 12 of 56
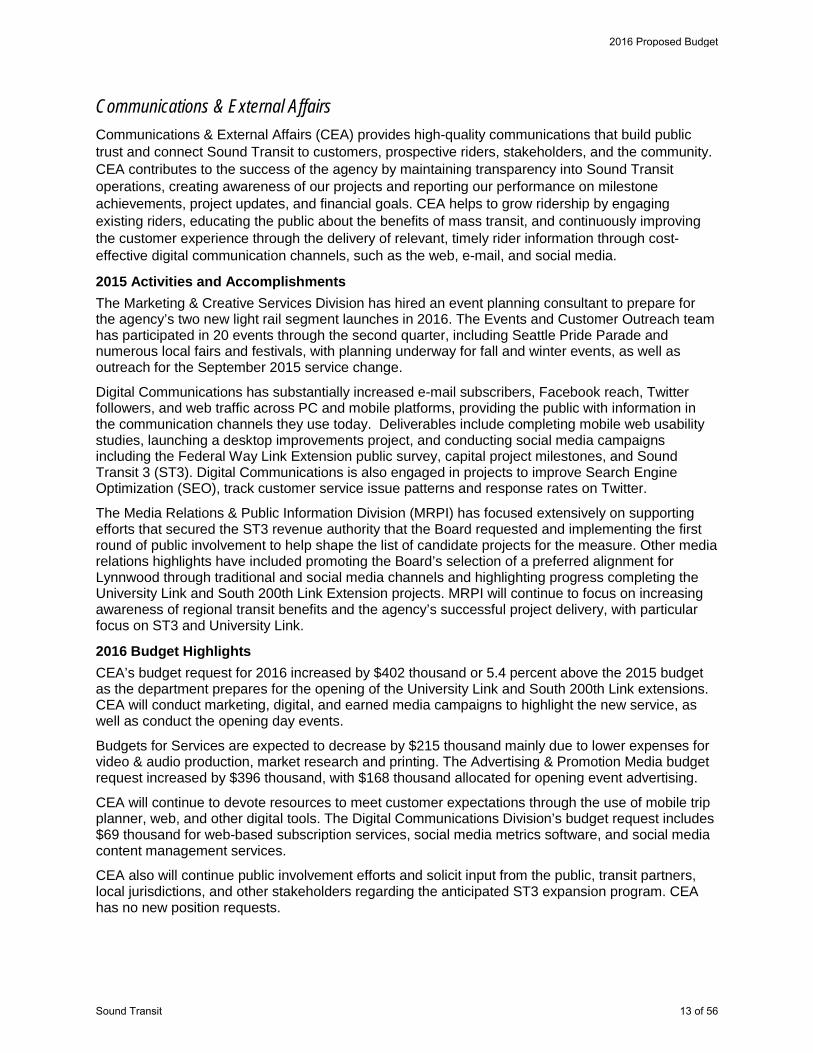
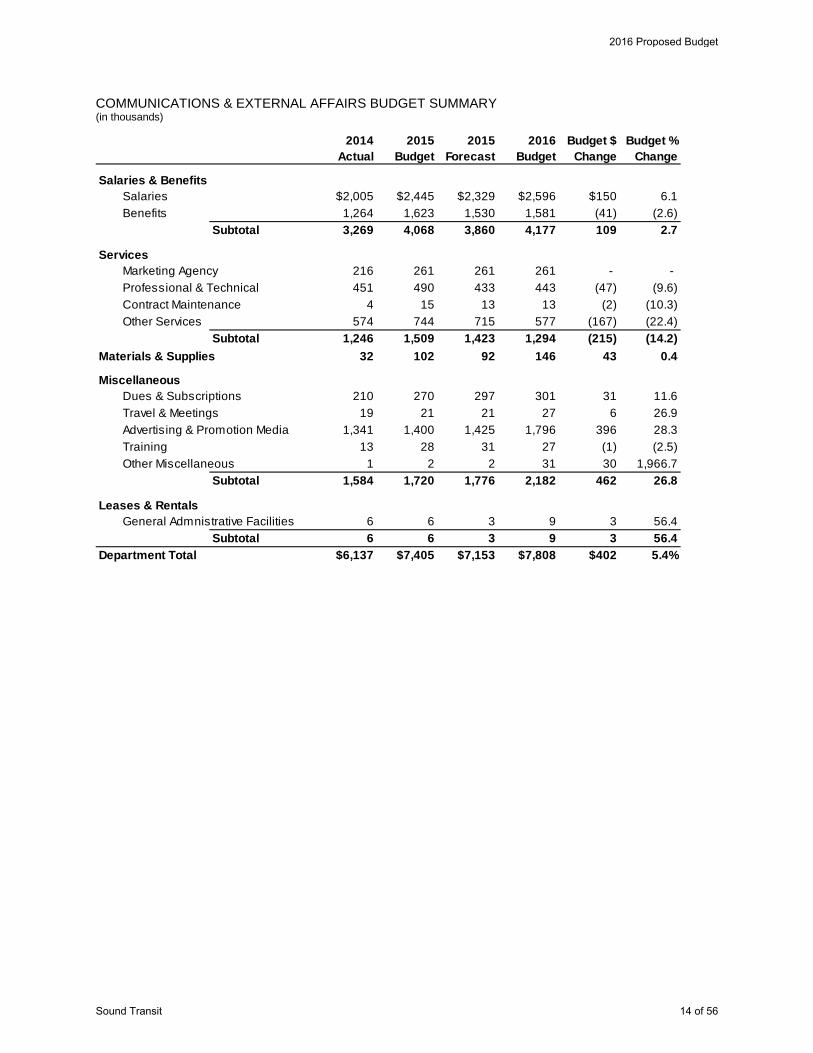
Communications & External Affairs Communications & External Affairs (CEA) provides high-quality communications that build public trust and connect Sound Transit to customers, prospective riders, stakeholders, and the community. CEA contributes to the success of the agency by maintaining transparency into Sound Transit operations, creating awareness of our projects and reporting our performance on milestone achievements, project updates, and financial goals. CEA helps to grow ridership by engaging existing riders, educating the public about the benefits of mass transit, and continuously improving the customer experience through the delivery of relevant, timely rider information through cost-effective digital communication channels, such as the web, e-mail, and social media.
2015 Activities and Accomplishments The Marketing & Creative Services Division has hired an event planning consultant to prepare for the agency’s two new light rail segment launches in 2016. The Events and Customer Outreach team has participated in 20 events through the second quarter, including Seattle Pride Parade and numerous local fairs and festivals, with planning underway for fall and winter events, as well as outreach for the September 2015 service change.
Digital Communications has substantially increased e-mail subscribers, Facebook reach, Twitter followers, and web traffic across PC and mobile platforms, providing the public with information in the communication channels they use today. Deliverables include completing mobile web usability studies, launching a desktop improvements project, and conducting social media campaigns including the Federal Way Link Extension public survey, capital project milestones, and Sound Transit 3 (ST3). Digital Communications is also engaged in projects to improve Search Engine Optimization (SEO), track customer service issue patterns and response rates on Twitter.
The Media Relations & Public Information Division (MRPI) has focused extensively on supporting efforts that secured the ST3 revenue authority that the Board requested and implementing the first round of public involvement to help shape the list of candidate projects for the measure. Other media relations highlights have included promoting the Board’s selection of a preferred alignment for Lynnwood through traditional and social media channels and highlighting progress completing the University Link and South 200th Link Extension projects. MRPI will continue to focus on increasing awareness of regional transit benefits and the agency’s successful project delivery, with particular focus on ST3 and University Link.
2016 Budget Highlights CEA’s budget request for 2016 increased by $402 thousand or 5.4 percent above the 2015 budget as the department prepares for the opening of the University Link and South 200th Link extensions. CEA will conduct marketing, digital, and earned media campaigns to highlight the new service, as well as conduct the opening day events.
Budgets for Services are expected to decrease by $215 thousand mainly due to lower expenses for video & audio production, market research and printing. The Advertising & Promotion Media budget request increased by $396 thousand, with $168 thousand allocated for opening event advertising.
CEA will continue to devote resources to meet customer expectations through the use of mobile trip planner, web, and other digital tools. The Digital Communications Division’s budget request includes $69 thousand for web-based subscription services, social media metrics software, and social media content management services.
CEA also will continue public involvement efforts and solicit input from the public, transit partners, local jurisdictions, and other stakeholders regarding the anticipated ST3 expansion program. CEA has no new position requests.
2016 Proposed Budget
Sound Transit 13 of 56
COMMUNICATIONS & EXTERNAL AFFAIRS BUDGET SUMMARY (in thousands)
2014Actual
2015Budget
2015Forecast
2016Budget
Budget $Change
Budget %Change
$2,005 $2,445 $2,329 $2,596 $150 6.11,264 1,623 1,530 1,581 (41) (2.6)
Subtotal 3,269 4,068 3,860 4,177 109 2.7
216 261 261 261 - - 451 490 433 443 (47) (9.6)
4 15 13 13 (2) (10.3)574 744 715 577 (167) (22.4)
Subtotal 1,246 1,509 1,423 1,294 (215) (14.2)32 102 92 146 43 0.4
210 270 297 301 31 11.619 21 21 27 6 26.9
1,341 1,400 1,425 1,796 396 28.313 28 31 27 (1) (2.5)
1 2 2 31 30 1,966.7Subtotal 1,584 1,720 1,776 2,182 462 26.8
6 6 3 9 3 56.4Subtotal 6 6 3 9 3 56.4
$6,137 $7,405 $7,153 $7,808 $402 5.4%
Materials & Supplies
Miscellaneous
General Admnistrative Facilities
Department Total
Dues & SubscriptionsTravel & MeetingsAdvertising & Promotion MediaTrainingOther Miscellaneous
Leases & Rentals
ServicesMarketing Agency Professional & TechnicalContract MaintenanceOther Services
Salaries & BenefitsSalariesBenefits
2016 Proposed Budget
Sound Transit 14 of 56

Design, Engineering & Construction Management Design, Engineering & Construction Management (DECM) is principally responsible for final design, engineering, and construction management for all major capital projects, as well as community outreach, right-of-way acquisition, and support for capital improvements to the existing transit system. Additionally, DECM manages agency-owned surplus and holding properties, and administers the agency’s public art program.
DECM is also engaged during earlier phases as projects progress from conceptual to preliminary engineering by matrixing technical staff to PEPD project teams. Collaboration with other departments ensures a smooth handoff of the engineering, enhances buildability, reduces project risks, and ultimately delivers effective transit facilities that operate efficiently.
2015 Activities and Accomplishments DECM has made significant progress in delivering voter-approved projects in 2015. By the end of the second quarter in 2015: University Link construction is approximately 96 percent complete; Capitol Hill Station is 95 percent complete; University of Washington Station is substantially complete; Angle Lake Station for South 200th Link Extension is now 75 percent complete. Construction of the I-90 two-way transit project will continue in 2016. DECM has hosted numerous community outreach public meetings in Bellevue and supported the Sound Transit Board in adopting permanent station names for East Link Extension. The department is on track to complete the installation of Positive Train Control (PTC) for Sounder by December 2015. PTC is an integrated communication and control system that utilizes real-time position tracking of trains in order to slow them down if necessary to prevent derailments and collisions. The installation of this cutting-edge technology complies with federal law and furthers the agency’s commitment to passenger safety. For ST Express, DECM has completed a bus storage facility that has been transitioned to the Operations Department.
2016 Budget Highlights DECM’s priorities in 2016 include successfully completing University Link and South 200th Link extension projects, and the startup of passenger service. 2016 marks the beginning of final design work for Lynnwood Link Extension and Link Operations & Maintenance Satellite Facility as well as the procurement of light rail vehicles for extensions. Breaking ground on East Link Extension and Tacoma Trestle Track and Signal will be key milestones in 2016.
The department has requested seven new positions to maintain appropriate levels of staffing to ensure on-time project completion.
Contract Maintenance for landscaping, security, janitorial, utilities, and structural services needs are expected to increase by $348 thousand to manage an increased number of properties acquired for East Link and Lynnwood Link extension projects. Requests for Professional & Technical consulting services will be augmented by approximately $238 thousand. DECM plans to develop specifications for Building Information Modeling (BIM) and Civil Information Modeling (CIM) to maximize collaboration with designers and construction consultants and adopt standard civil and structural design specifications.
2016 Proposed Budget
Sound Transit 15 of 56

DESIGN, ENGINEERING & CONSTRUCTION MANAGEMENT BUDGET SUMMARY (in thousands)
2014Actual
2015Budget
2015Forecast
2016Budget
Budget $Change
Budget %Change
$16,351 $18,712 $18,521 $19,970 $1,258 6.79,746 11,531 10,729 12,154 622 5.4
Subtotal 26,097 30,243 29,250 32,124 1,880 6.2
141 111 292 348 238 214.91 30 6 30 - -
758 926 873 1,274 348 37.66 155 167 325 170 109.7
59 10 7 9 (1) (7.4)Subtotal 965 1,232 1,345 1,986 755 61.3
54 79 66 70 (8) (0.1)50 183 206 271 89 0.5 32 35 36 35 - - 90 133 108 133 - -
39 69 60 67 (2) (3.4)108 151 123 171 20 13.4136 172 159 174 2 1.2(5) - - 6 6 100.0
Subtotal 278 392 342 418 26 6.5
3,085 3,475 3,865 3,588 113 3.3Subtotal 3,085 3,475 3,865 3,588 113 3.3
$30,652 $35,772 $35,217 $38,626 $2,854 8.0%Department Total
Salaries & BenefitsSalariesBenefits
ServicesProfessional & TechnicalTemporary ServicesContract MaintenanceSecurity & SafetyOther Services
Materials & SuppliesUtilitiesInsurance
Other Miscellaneous
Leases & RentalsGeneral Admnistrative Facilities
Taxes
MiscellaneousDues & SubscriptionsTravel & MeetingsTraining
2016 Proposed Budget
Sound Transit 16 of 56

Executive This department includes the Chief Executive Office and divisions that report directly to the CEO or Deputy CEO. The department’s staff support the agency’s mission by ensuring open public access to the Sound Transit Board’s proceedings, engaging local, state, and federal officials regarding public transit needs, managing purchasing and contracting for agency projects, and conducting independent audits to confirm the adequacy of internal controls and identify improvement opportunities. They also administer the agency’s human resources, diversity, construction safety and quality assurance programs.
2015 Activities and Accomplishments The Executive Department is actively engaged in improving the efficiency and effectiveness of the agency’s processes. Some important processes that are being tackled include IT procurement, agreement management, job order contracting, and architecture and engineering invoice processing. Support comes from both external consultants and employees trained to teach a process improvement methodology called Rapid Office Kaizen.
The Procurement & Contracts Division was an early adopter of Kaizen and has made significant improvements in the quality and timeliness of their processes. They lead the agency in the use of alternative contracting methods, including General Contracting/Construction Management (GC/CM) and job order contracting. Their Green Procurement Policy, along with guidelines and training, is under development and will be rolled out in 2016.
Human Resources, in partnership with Accounting, Budget, and Information Technology, has contracted with a vendor to develop and install a fully integrated Human Resources Information Management System. They continuously develop new ST University offerings and train their staff to be instructors.
The Safety & Quality Assurance Division’s role in the launch of new Link service in 2016 is to ensure safety certification is received on time. For the first half of 2015, they have achieved their goal of 100% of quality audits completed on design and construction projects. Annual reviews and updates of system safety program plans for all transit modes are near completion.
Government & Community Relations focused intensely on achieving its most significant goal for the year: the Governor of Washington State signed legislation authorizing $15 billion in new revenue authority for Sound Transit.
2016 Budget Highlights The Executive Department’s budget is higher by 6.7 percent with significant increases coming from Salaries & Benefits and Professional & Technical services. Seven additional positons are proposed for 2016 to support the agency’s procurements and contracts, diversity, and safety and quality assurance functions.
New federal safety regulations, increasing levels of design and construction activity, and hiring and training staff to prepare for the opening of new Link services in 2016 requires the addition of four positions in the Safety and Quality Assurance Division. Professional & Technical services for safety planning and auditing is adding $673 thousand to the department’s budget request.
The Executive Department leads the agency’s efforts in managing performance through scorecard development and broad employee engagement in continuous process improvement. All employees are trained to analyze and redesign processes in their own work groups and those that cross organizational boundaries. Approximately $220 thousand is budgeted within Professional & Technical services to support these ongoing programs.
2016 Proposed Budget
Sound Transit 17 of 56

Human Resources is budgeting $245 thousand in Advertising & Promotion Media to assist with recruitment of engineers, technology, finance, and various professionals as competition among employers in the local job market increases. Knowledge transfer and succession planning are supported with $100 thousand of Professional & Technical services to ensure a smooth transition as a number of key personnel reach retirement. Also, ST University continues to expand its Management Excellence Program, with plans to spend $76 thousand to train 40 employees in 2016.
Internal Audit has $240 thousand budgeted in Professional & Technical services for electrical and mechanical contract close-out audits for the University Link Station. Independent cost audits are required when GC/CM contracting is used.
EXECUTIVE BUDGET SUMMARY (in thousands)
2014Actual
2015Budget
2015Forecast
2016Budget
Budget $Change
Budget %Change
$6,812 $8,073 $7,265 $8,688 $615 7.64,314 5,124 4,686 5,259 136 2.6
Subtotal 11,126 13,197 11,951 13,947 750 5.7
1,426 2,257 2,195 2,735 478 21.2176 44 195 34 (10) (23.0)
0 3 27 28 26 1,020.0245 664 637 495 (168) (25.4)
Subtotal 1,847 2,967 3,055 3,292 325 10.9125 136 151 154 18 0.1
2 1 1 1 1 1.0
22 50 57 64 14 28.1175 207 239 264 57 27.6312 243 244 311 68 28.1
67 76 75 64 (12) (16.0)106 553 453 510 (43) (7.7)
Subtotal 682 1,128 1,068 1,213 85 7.5
79 83 84 86 3 3.6Subtotal 79 83 84 86 3 3.6
$13,861 $17,512 $16,309 $18,693 $1,181 6.7%
Materials & SuppliesUtilities
Leases & RentalsGeneral Admnistrative Facilities
Department Total
MiscellaneousDues & SubscriptionsTravel & MeetingsAdvertising & Promotion MediaTrainingOther Miscellaneous
ServicesProfessional & TechnicalTemporary ServicesContract MaintenanceOther Services
Salaries & BenefitsSalariesBenefits
2016 Proposed Budget
Sound Transit 18 of 56
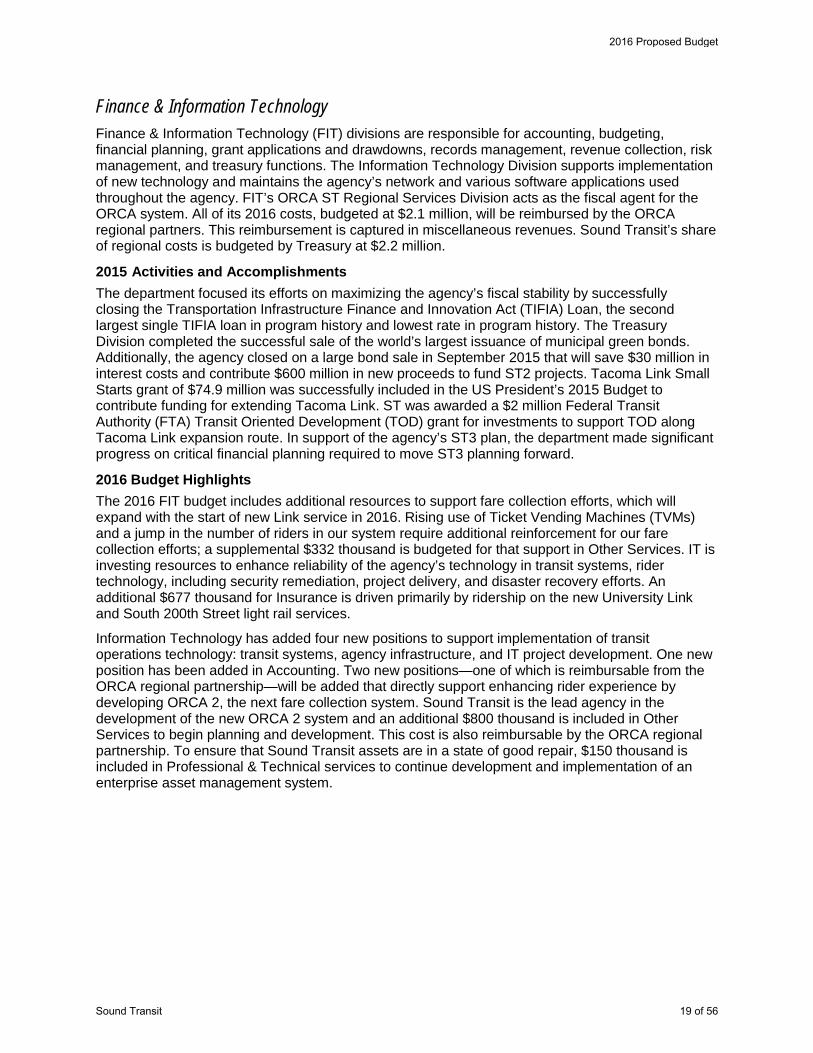
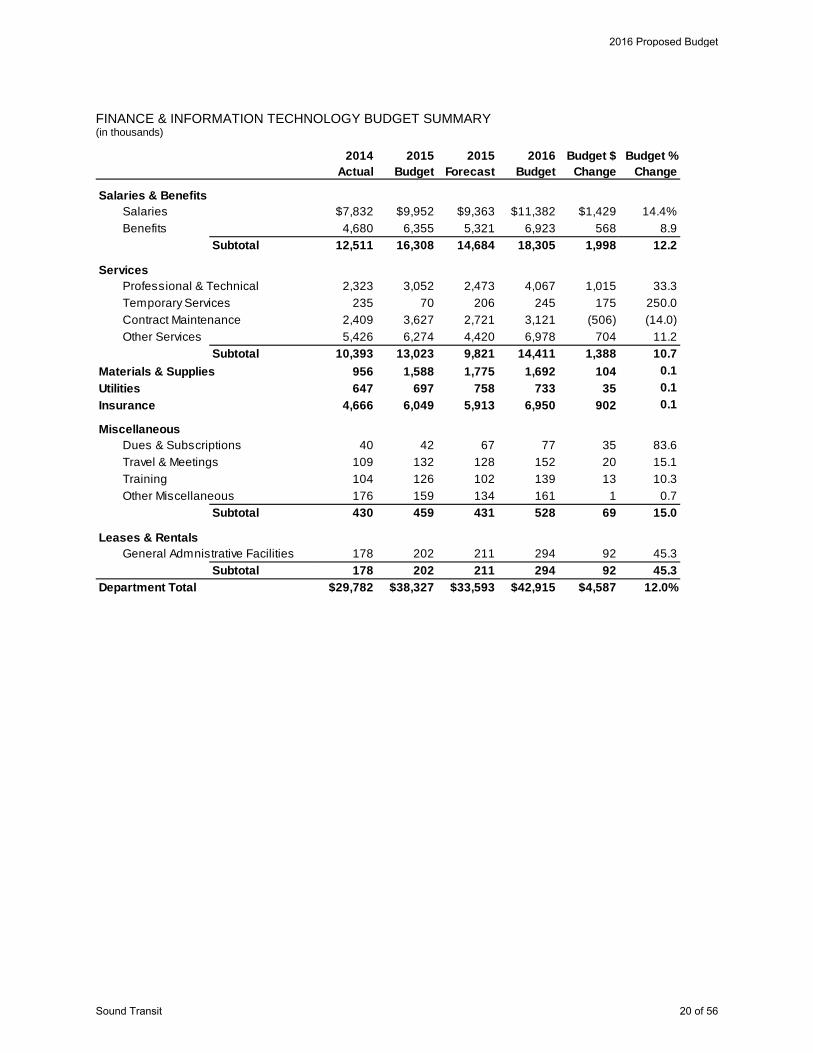
Finance & Information Technology Finance & Information Technology (FIT) divisions are responsible for accounting, budgeting, financial planning, grant applications and drawdowns, records management, revenue collection, risk management, and treasury functions. The Information Technology Division supports implementation of new technology and maintains the agency’s network and various software applications used throughout the agency. FIT’s ORCA ST Regional Services Division acts as the fiscal agent for the ORCA system. All of its 2016 costs, budgeted at $2.1 million, will be reimbursed by the ORCA regional partners. This reimbursement is captured in miscellaneous revenues. Sound Transit’s share of regional costs is budgeted by Treasury at $2.2 million.
2015 Activities and Accomplishments The department focused its efforts on maximizing the agency’s fiscal stability by successfully closing the Transportation Infrastructure Finance and Innovation Act (TIFIA) Loan, the second largest single TIFIA loan in program history and lowest rate in program history. The Treasury Division completed the successful sale of the world’s largest issuance of municipal green bonds. Additionally, the agency closed on a large bond sale in September 2015 that will save $30 million in interest costs and contribute $600 million in new proceeds to fund ST2 projects. Tacoma Link Small Starts grant of $74.9 million was successfully included in the US President’s 2015 Budget to contribute funding for extending Tacoma Link. ST was awarded a $2 million Federal Transit Authority (FTA) Transit Oriented Development (TOD) grant for investments to support TOD along Tacoma Link expansion route. In support of the agency’s ST3 plan, the department made significant progress on critical financial planning required to move ST3 planning forward.
2016 Budget Highlights The 2016 FIT budget includes additional resources to support fare collection efforts, which will expand with the start of new Link service in 2016. Rising use of Ticket Vending Machines (TVMs) and a jump in the number of riders in our system require additional reinforcement for our fare collection efforts; a supplemental $332 thousand is budgeted for that support in Other Services. IT is investing resources to enhance reliability of the agency’s technology in transit systems, rider technology, including security remediation, project delivery, and disaster recovery efforts. An additional $677 thousand for Insurance is driven primarily by ridership on the new University Link and South 200th Street light rail services.
Information Technology has added four new positions to support implementation of transit operations technology: transit systems, agency infrastructure, and IT project development. One new position has been added in Accounting. Two new positions—one of which is reimbursable from the ORCA regional partnership—will be added that directly support enhancing rider experience by developing ORCA 2, the next fare collection system. Sound Transit is the lead agency in the development of the new ORCA 2 system and an additional $800 thousand is included in Other Services to begin planning and development. This cost is also reimbursable by the ORCA regional partnership. To ensure that Sound Transit assets are in a state of good repair, $150 thousand is included in Professional & Technical services to continue development and implementation of an enterprise asset management system.
2016 Proposed Budget
Sound Transit 19 of 56
FINANCE & INFORMATION TECHNOLOGY BUDGET SUMMARY (in thousands)
2014Actual
2015Budget
2015Forecast
2016Budget
Budget $Change
Budget %Change
$7,832 $9,952 $9,363 $11,382 $1,429 14.4%4,680 6,355 5,321 6,923 568 8.9
Subtotal 12,511 16,308 14,684 18,305 1,998 12.2
2,323 3,052 2,473 4,067 1,015 33.3235 70 206 245 175 250.0
2,409 3,627 2,721 3,121 (506) (14.0)5,426 6,274 4,420 6,978 704 11.2
Subtotal 10,393 13,023 9,821 14,411 1,388 10.7956 1,588 1,775 1,692 104 0.1647 697 758 733 35 0.1
4,666 6,049 5,913 6,950 902 0.1
40 42 67 77 35 83.6109 132 128 152 20 15.1104 126 102 139 13 10.3176 159 134 161 1 0.7
Subtotal 430 459 431 528 69 15.0
178 202 211 294 92 45.3Subtotal 178 202 211 294 92 45.3
$29,782 $38,327 $33,593 $42,915 $4,587 12.0%
Benefits
Salaries & BenefitsSalaries
Services
Training
Professional & TechnicalTemporary ServicesContract MaintenanceOther Services
Materials & SuppliesUtilitiesInsurance
MiscellaneousDues & SubscriptionsTravel & Meetings
Other Miscellaneous
Leases & RentalsGeneral Admnistrative Facilities
Department Total
2016 Proposed Budget
Sound Transit 20 of 56

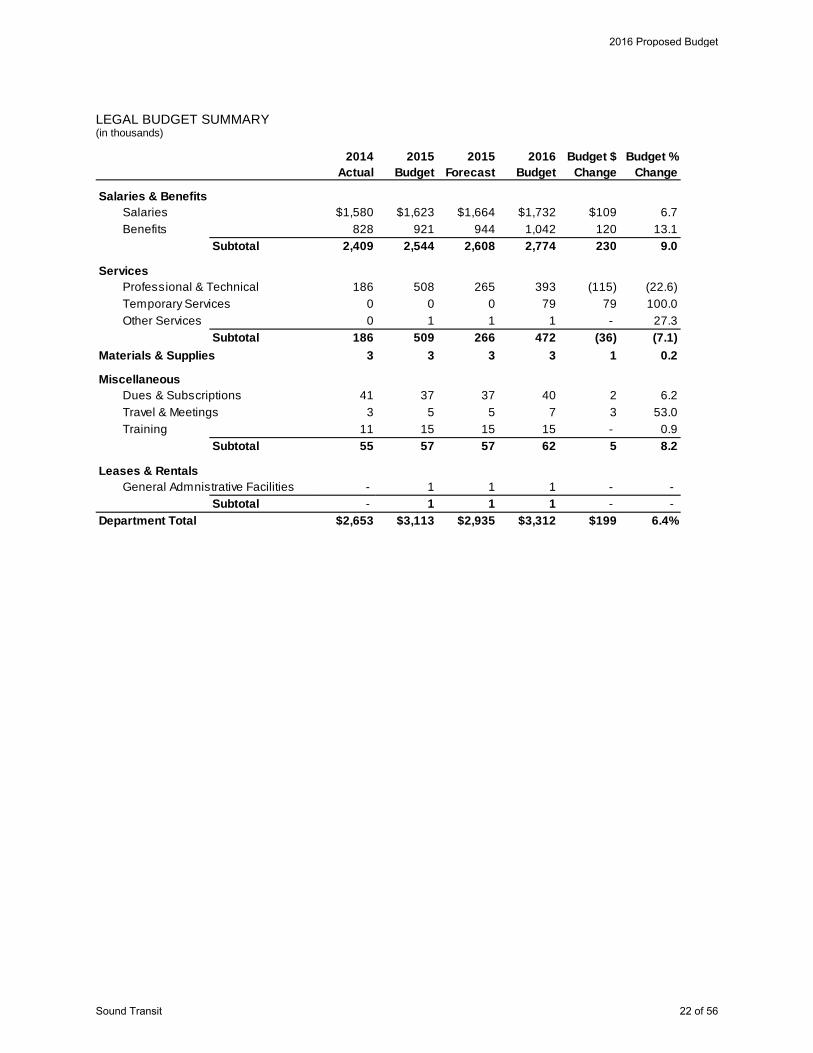
Legal The Legal Department monitors changes in law and regulations on behalf of the agency and provides analysis and advice on real estate acquisitions, labor and employment, municipal zoning and land use, environmental law, construction claims, permitting, litigation, railroad easements, contracts, and interagency issues.
2015 Activities and Accomplishments The Legal Department achieved a major milestone in 2015 with the negotiation and execution of the Bellevue Memorandum of Understanding (MOU), an agreement which will allow us to move forward with the construction of the East Link Extension and that finalizes Bellevue’s $100 million contribution of funds for the project. The MOU provides for the inclusion of a downtown tunnel, as well as terms for the mitigation of construction and operational impacts on neighborhoods and the environment. The department prevailed in attaining approval of the Bellevue shoreline permit, which removed the last legal obstacle prior to the commencement of East Link construction. The staff supported the agency’s efforts to seek approval from the Washington State legislature and the Governor of Senate Bill 5987–2015-16, which will allow Sound Transit to request up to $15 billion from taxpayers for system expansion in the ST3 ballot measure. Legal arranged for new agreements for Regional Express operations and maintenance, more financially sustainable payments on leases of state property, and licensing agreements to install wireless systems for mobile service in underground facilities. The department answered 207 public disclosure requests in the first two quarters of 2015, which furthers the agency’s goal of maintaining public trust through open accountability.
2016 Budget Highlights Legal will be focusing on the development of the ST3 ballot to ensure that all legal requirements are complete and the ballot is approved for placement in all three counties. Legal has no new position requests. Professional & Technical services is budgeted $115 thousand lower, or 22.6 percent lower, than in 2015, based on expected needs for external legal services in 2016.
2016 Proposed Budget
Sound Transit 21 of 56
LEGAL BUDGET SUMMARY (in thousands)
2014Actual
2015Budget
2015Forecast
2016Budget
Budget $Change
Budget %Change
$1,580 $1,623 $1,664 $1,732 $109 6.7828 921 944 1,042 120 13.1
Subtotal 2,409 2,544 2,608 2,774 230 9.0
186 508 265 393 (115) (22.6)0 0 0 79 79 100.00 1 1 1 - 27.3
Subtotal 186 509 266 472 (36) (7.1)3 3 3 3 1 0.2
41 37 37 40 2 6.23 5 5 7 3 53.0
11 15 15 15 - 0.9Subtotal 55 57 57 62 5 8.2
- 1 1 1 - - Subtotal - 1 1 1 - -
$2,653 $3,113 $2,935 $3,312 $199 6.4%
General Admnistrative Facilities
Department Total
MiscellaneousDues & SubscriptionsTravel & MeetingsTraining
Leases & Rentals
ServicesProfessional & TechnicalTemporary ServicesOther Services
Materials & Supplies
Salaries & BenefitsSalariesBenefits
2016 Proposed Budget
Sound Transit 22 of 56

Operations The Operations Department is responsible for all modal operations. They operate Tacoma Link directly and oversee agreements with our transit partners to provide operations and maintenance for Link light rail, ST Express bus, and paratransit services. Sounder commuter rail service and rail access is fulfilled through a contract with Burlington Northern Santa Fe (BNSF); maintenance is provided through a contract with Amtrak. Department personnel are also responsible for transit asset management, facilities maintenance, service planning, customer service, and Americans with Disabilities Act accessibility. The department also manages security for all transit and administrative facilities through a contract with Securitas Services and an agreement with the King County Sheriff’s Office.
2015 Activities and Accomplishments New bus operating agreements with Community and Pierce Transit were executed in June, and the current King County Metro agreement is expected to be completed in December 2015. Many departmental activities in 2015 are focused on supporting Link expansion, including adapting to a new SCADA system for train control and reporting, training staff, and supporting contractors. Other activities include testing and implementing the new positive train control system to improve Sounder safety, implementing a new Maintenance Management Information System for Link maintenance, and embarking on a fuel efficient driving program with Community Transit bus operators. The department is also coordinating with King County, City of Seattle, Community Transit and Washington State Department of Transportation on integrated service changes.
2016 Budget Highlights The Operations Department has requested four new positions for 2016 to support higher levels of transit services and an expanded number of facilities to manage and maintain.
The Services budget will increase by $12.2 million, driven primarily by increases in security services, the Downtown Seattle Transit Tunnel costs, Facilities Maintenance, Consulting Services, and Utilities:
Security services are anticipated to increase by $3.7 million to support Link expansion to University of Washington Station to the north, and Angle Lake Station to the south.
Downtown Seattle Transit Tunnel costs are anticipated to increase by approximately $3.1 million to support the expansion of Link service in the DSTT from eight to ten trains per hour with six minute headways.
Facilities Maintenance is anticipated to increase by $1.8 million to support 14 mid-life maintenance/repair projects at various stations, as well as increases to current contractual values, plus escalation.
Consulting and other Services are anticipated to increase by $1.4 million, to include Job Order Contracts and engineering consultant support.
Utilities are anticipated to increase by $570 thousand to cover increasing traction power costs and utilities at new stations related to Link expansion.
Purchased Transportation Services are anticipated to increase by $17.0 million to support service expansion across three Sound Transit modes in 2016.
ST Express will add 19,750 service hours over two service changes to relieve overloads and increase efficiencies due to traffic congestion. An initial 17,000 hours will be added in March 2016, followed by the remaining 2,750 hours in September 2016.
Sounder will add one more round trip between Seattle and Lakewood in September 2016.
2016 Proposed Budget
Sound Transit 23 of 56

Link will begin revenue service north to Capitol Hill and the University of Washington and south to Angle Lake in 2016.
OPERATIONS BUDGET SUMMARY (in thousands)
2014Actual
2015Budget
2015Forecast
2016Budget
Budget $Change
Budget %Change
$7,174 $7,290 $7,229 $8,233 $943 12.9%4,448 4,818 4,840 4,894 75 1.6
Subtotal 11,622 12,108 12,069 13,126 1,018 8.4
369 219 426 1,784 1,565 100.0113 2 24 143 141 100.0
23,304 22,801 22,697 28,915 6,114 26.813,154 14,424 16,242 18,877 4,453 30.9
1,147 1,284 1,130 1,179 (104) (8.1)Subtotal 38,087 38,730 40,518 50,899 12,168 31.4
8,148 9,325 7,827 9,584 260 - 3,494 3,650 3,818 4,580 930 0.3
(7) 110 - - (110) (1.0)1,855 1,928 2,019 2,142 214 0.1
1,456 1,710 1,697 1,906 196 11.5125,155 133,989 134,791 150,827 16,838 12.6
Subtotal 126,611 135,699 136,488 152,733 17,034 12.6
14 63 20 47 (16) (25.3)117 102 76 106 4 3.8
4 1 2 3 2 100.071 101 67 105 4 4.144 29 26 26 (3) (9.6)
Subtotal 249 296 191 287 (9) (2.9)
5,449 5,410 5,346 7,267 1,857 34.3553 476 537 596 121 25.4
Subtotal 6,002 5,885 5,883 7,863 1,978 33.6$196,062 $207,732 $208,812 $241,215 $33,483 16.1%
ServicesProfessional & TechnicalTemporary ServicesContract Maintenance
Salaries & BenefitsSalariesBenefits
Security & SafetyOther Services
Training
Materials & SuppliesUtilitiesInsuranceTaxes
Purchased Transportation ServicesParatransitPurchased Transportation
MiscellaneousDues & SubscriptionsTravel & MeetingsAdvertising & Promotion Media
Other Miscellaneous
Leases & RentalsTransit WayGeneral Admnistrative Facilities
Department Total
2016 Proposed Budget
Sound Transit 24 of 56

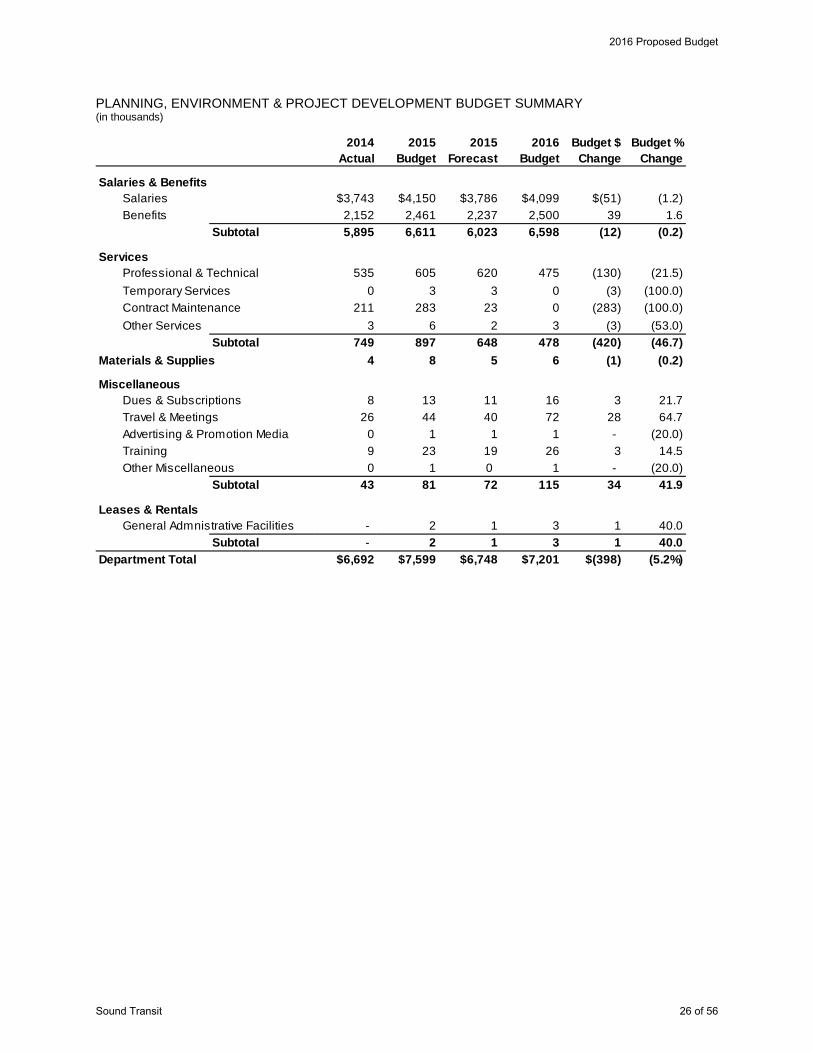
Planning, Environment & Project Development Planning, Environment & Project Development (PEPD) leads the initial project activities beginning with public outreach, environmental impact analysis, and system planning to ensure the integrity of our long-range plan, as well as potential future plans to be decided by voters. They provide preliminary engineering and environmental compliance pursuant to state and national regulations. Once project development is complete and project scopes are defined, project management responsibility shifts to the Design, Engineering and Construction Management (DECM) Department to oversee design and construction. In addition to project development, PEPD is responsible for the agency’s sustainability programs and efforts to encourage residential and commercial development near transit stations.
2015 Activities and Accomplishments PEPD completed public outreach efforts focused on the Draft Priority Project List, including six open houses in the three-county region. The department has engaged in critical work regarding reducing storm water runoff from construction sites and important mitigation plans to reduce the amount of waste generated during the construction process. These efforts are driven by the agency’s dedication to efficient project management, meeting or exceeding environmental requirements, and sustainability goals. They have obtained Federal Transit Authority (FTA) - National Environmental Policy Act (NEPA) approval for Northgate Link Expansion and Tacoma Link Expansion, and the Final Environmental Impact Study (FEIS) has been issued for Lynnwood Link Expansion. As part of the department’s goal to increase mass transit usage, reduced fare ORCA LIFT cards have been issued to 10,000 riders region-wide.
2016 Budget Highlights PEPD will focus on ST3 planning and corridor development in the coming year, resulting in a considerable increase in planning and design work. The department is now fully staffed in anticipation of the upcoming workload, and no new temporary services or permanent position requests have been made for 2016. The staff is committed to integrating sustainability initiatives in our projects, and we are proud that the agency has become only the second transit agency in the nation to earn Platinum Level recognition from the American Public Transportation Association (APTA). A significant portion of the budget includes $475 thousand for Professional & Technical consulting. Consulting services are intended to further study sustainable infrastructure design and construction techniques, waste reduction, and facility energy conservation. The use of new technologies and alternative fuels could increase fuel efficiency and decrease carbon emissions. These strategies are crucial for reducing the agency’s ecological footprint.
2016 Proposed Budget
Sound Transit 25 of 56
PLANNING, ENVIRONMENT & PROJECT DEVELOPMENT BUDGET SUMMARY (in thousands)
2014Actual
2015Budget
2015Forecast
2016Budget
Budget $Change
Budget %Change
$3,743 $4,150 $3,786 $4,099 $(51) (1.2)2,152 2,461 2,237 2,500 39 1.6
Subtotal 5,895 6,611 6,023 6,598 (12) (0.2)
535 605 620 475 (130) (21.5)0 3 3 0 (3) (100.0)
211 283 23 0 (283) (100.0)3 6 2 3 (3) (53.0)
Subtotal 749 897 648 478 (420) (46.7)4 8 5 6 (1) (0.2)
8 13 11 16 3 21.726 44 40 72 28 64.7
0 1 1 1 - (20.0)9 23 19 26 3 14.50 1 0 1 - (20.0)
Subtotal 43 81 72 115 34 41.9
- 2 1 3 1 40.0Subtotal - 2 1 3 1 40.0
$6,692 $7,599 $6,748 $7,201 $(398) (5.2%)
Materials & Supplies
Leases & RentalsGeneral Admnistrative Facilities
Department Total
MiscellaneousDues & SubscriptionsTravel & MeetingsAdvertising & Promotion MediaTrainingOther Miscellaneous
ServicesProfessional & TechnicalTemporary ServicesContract MaintenanceOther Services
Salaries & BenefitsSalariesBenefits
2016 Proposed Budget
Sound Transit 26 of 56
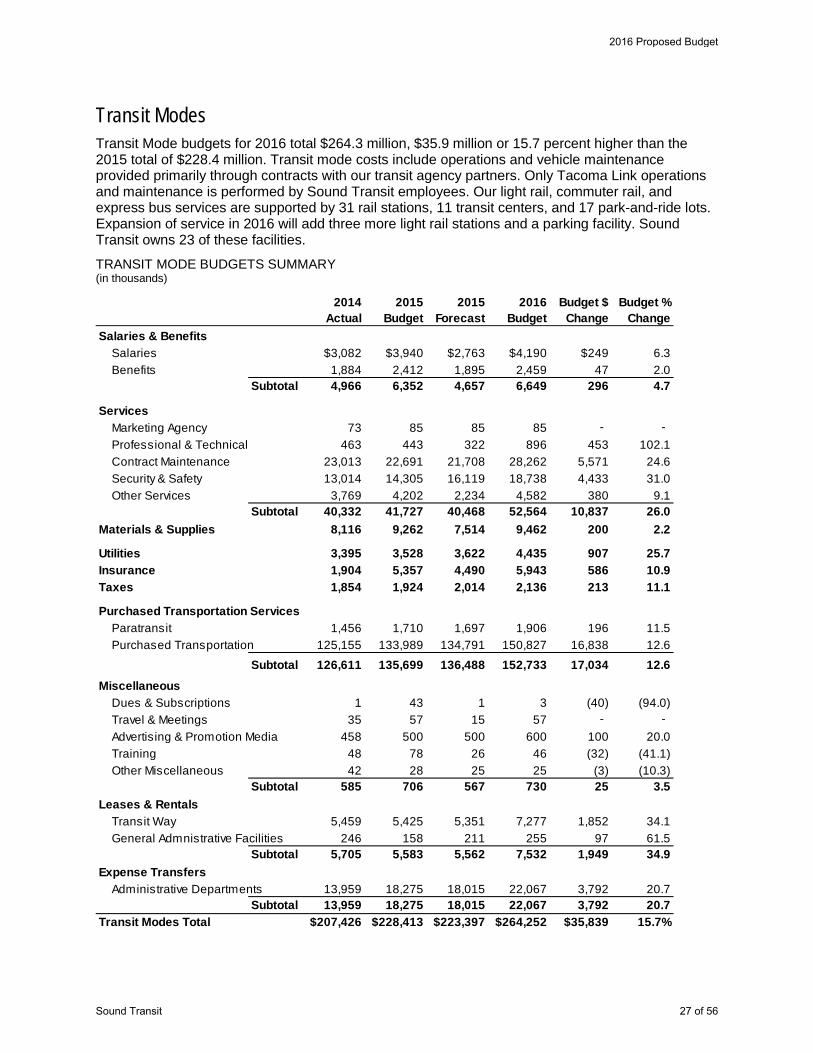
Transit Modes Transit Mode budgets for 2016 total $264.3 million, $35.9 million or 15.7 percent higher than the 2015 total of $228.4 million. Transit mode costs include operations and vehicle maintenance provided primarily through contracts with our transit agency partners. Only Tacoma Link operations and maintenance is performed by Sound Transit employees. Our light rail, commuter rail, and express bus services are supported by 31 rail stations, 11 transit centers, and 17 park-and-ride lots. Expansion of service in 2016 will add three more light rail stations and a parking facility. Sound Transit owns 23 of these facilities.
TRANSIT MODE BUDGETS SUMMARY (in thousands)
2014Actual
2015Budget
2015Forecast
2016Budget
Budget $ Change
Budget % Change
$3,082 $3,940 $2,763 $4,190 $249 6.31,884 2,412 1,895 2,459 47 2.0
Subtotal 4,966 6,352 4,657 6,649 296 4.7
73 85 85 85 - - 463 443 322 896 453 102.1
23,013 22,691 21,708 28,262 5,571 24.613,014 14,305 16,119 18,738 4,433 31.0
3,769 4,202 2,234 4,582 380 9.1Subtotal 40,332 41,727 40,468 52,564 10,837 26.0
8,116 9,262 7,514 9,462 200 2.2
3,395 3,528 3,622 4,435 907 25.71,904 5,357 4,490 5,943 586 10.91,854 1,924 2,014 2,136 213 11.1
1,456 1,710 1,697 1,906 196 11.5125,155 133,989 134,791 150,827 16,838 12.6
Subtotal 126,611 135,699 136,488 152,733 17,034 12.6
1 43 1 3 (40) (94.0)35 57 15 57 - -
458 500 500 600 100 20.048 78 26 46 (32) (41.1)42 28 25 25 (3) (10.3)
Subtotal 585 706 567 730 25 3.5
5,459 5,425 5,351 7,277 1,852 34.1246 158 211 255 97 61.5
Subtotal 5,705 5,583 5,562 7,532 1,949 34.9
13,959 18,275 18,015 22,067 3,792 20.7Subtotal 13,959 18,275 18,015 22,067 3,792 20.7
$207,426 $228,413 $223,397 $264,252 $35,839 15.7%Transit Modes Total
Leases & RentalsTransit WayGeneral Admnistrative Facilities
Expense TransfersAdministrative Departments
Salaries & BenefitsSalariesBenefits
ServicesMarketing AgencyProfessional & TechnicalContract MaintenanceSecurity & Safety
Insurance
Advertising & Promotion MediaTrainingOther Miscellaneous
Other Services
Materials & Supplies
Utilities
Purchased Transportation ServicesParatransit
Taxes
Purchased Transportation
MiscellaneousDues & SubscriptionsTravel & Meetings
2016 Proposed Budget
Sound Transit 27 of 56

Beginning in 2016, all costs will be reported by the department that manages them. The transit mode budgets include all operating budget activities associated with the mode, including agency overhead. Modal budgets are comprised of costs managed primarily by Operations, Finance & Information Technology, and Communications and External Affairs departments.
Operations Department staff manages our facilities, overseeing hundreds of contractors including many small and minority-owned businesses. Information Technology Division staff installs, repairs, and maintains ticket vending machines, closed-circuit television (CCTV) cameras, automatic passenger counters, passenger information systems, and other technology used in the delivery of service. The Marketing & Creative Services Division manages all advertising and promotions, including our attendance at community events and festivals to promote public transit ridership.
The table below shows the 2016 operating budget for each department and the amounts charged to the transit modes, as well as to projects. The remaining administrative costs are allocated to transit modes or projects. Therefore, the transit mode budget reports displayed in the following pages are a compilation of department costs charged to each mode.
DEPARTMENT BUDGETS CHARGED TO TRANSIT MODES (in thousands)
Service Changes
Service increases for 2016 are planned for three of the agency’s four modes:
Tacoma Link has no service changes planned for 2016.
Link extensions between Westlake and UW stations and from Airport to Angle Lake stations will begin in 2016.
Sounder will add an additional round trip from Seattle to Lakewood in late 2016.
ST Express hours will increase by 19,750, with additions in March and September to address overcrowding on some routes and to provide connections to new Link and Sounder services.
Ridership Forecast
2016 system-wide ridership is expected to pass the 41 million mark, 19.8 percent higher than the 2015 forecast.
Tacoma Link ridership is expected to decrease 5.0 percent from the 2015 forecast of 1,000,000 after the implementation of this line’s first passenger fares in the fourth quarter of 2016.
Department2016
BudgetTacoma
Link Central Link SounderST
Express ProjectsAllocated
Admin CostsCommunications & External Affairs $7,808 $18 $378 $278 $296 $ - $6,839Design, Engineering & Construction Mgmt 38,626 31,519 7,107
Executive 18,693 18,693
Finance & Information Technology 42,915 545 6,274 2,839 2,011 1,863 29,384
Legal 3,312 3,312
Operations 241,215 3,701 73,148 37,591 115,107 11,667
Planning, Environment & Project Dev 7,201 5,301 1,900
Overhead Alloc. to Transit Modes 804 7,797 5,056 8,410 (22,067)
Overhead Alloc. To Projects 56,834 (56,834)Total $359,769 $5,068 $87,596 $45,764 $125,823 $95,517 $ -
2016 Proposed Budget
Sound Transit 28 of 56

Link ridership is anticipated to rise sharply to 17.2 million, a 49.6 percent increase, as a result of new service to University of Washington and Angle Lake. Also, Link’s current ridership growth trend on the existing system will continue.
Sounder ridership is projected to increase to 3.7 million, due to continued ridership growth on both North and South lines, and the addition of one more round trip in September 2016.
ST Express ridership is expected to continue its strong growth, increasing to 19.5 million with service hours being added to address capacity issues on several routes.
Paratransit ridership is expected to grow as Link services increase since it connects eligible people who are unable to connect to our buses and trains. Costs for paratransit are included with Link operations.
2016 RIDERSHIP FORECAST (in thousands)
Transit Mode2013
Actual2014
Actual2015
Forecast2016
Budget
Change from
Forecast % Change Tacoma Link 1,000 964 1,000 950 (50) -5.0%
Link 9,681 10,950 11,500 17,200 5,700 49.6%
Sounder 3,036 3,361 3,645 3,730 85 2.3%
ST Express 16,605 17,662 18,406 19,500 1,094 5.9%
Paratransit 62 56 58 70 12 20.7%
Total 30,385 32,993 34,609 41,450 6,841 19.8%
2016 Proposed Budget
Sound Transit 29 of 56

Tacoma Link Light Rail Tacoma Link is a 1.6-mile light rail passenger line that runs through the heart of downtown Tacoma. There are six unique stations complete with artwork that reflects the history and community of Tacoma. Trains run every 12 minutes during peak hours and every 24 minutes at all other times.
Sound Transit performs routine maintenance work out of our operations and maintenance facility in the Tacoma Dome District. We typically contract for track, signal, and station maintenance services.
Tacoma Link 2016 Budget Highlights The total 2016 budget is $5.1 million, 9.6 percent higher than the 2015 budget.
Contract Maintenance is higher by $547 thousand driven by a $350 thousand repair project for concrete failure along the system right-of-way. There is also an increase in light rail vehicle maintenance contracts of $125 thousand to help maintain the aging fleet.
Administrative expense allocations in 2016 are budgeted higher than 2015 by $87 thousand, or 12.2 percent in 2016 due to a higher base budget.
TACOMA LINK (in thousands)
2014Actual
2015Budget
2015Forecast
2016Budget
Budget $ Change
Budget % Change
$1,171 $1,363 $1,107 $1,337 ($26) (1.9)792 912 743 762 (150) (16.5)
Subtotal 1,963 2,275 1,850 2,099 (176) (7.7)
29 31 6 18 (14) (44.3)283 381 345 928 547 143.6375 465 507 445 (20) (4.3)
36 20 18 22 2 10.3Subtotal 722 898 876 1,414 515 57.3
105 167 79 177 10 5.9
106 104 86 103 (1) (0.8)167 383 336 413 30 7.8
- - - 3 3 100.0
4 5 - 5 - - Subtotal 4 5 - 5 - -
11 12 - 13 1 4.242 50 - 30 (20) (40.0)
Subtotal 53 62 - 43 (20) (31.7)
10 11 4 8 (3) (28.7)Subtotal 10 11 4 8 (3) (28.7)
819 717 744 804 87 12.2Subtotal 819 717 744 804 87 12.2
$3,951 $4,623 $3,975 $5,068 $445 9.6%
Expense TransfersAdministrative Departments
Mode Total
Other Services
Materials & Supplies
Utilities
Salaries & BenefitsSalariesBenefits
ServicesProfessional & TechnicalContract MaintenanceSecurity & Safety
Leases & Rentals
Purchased Transportation ServicesPurchased Transportation
Miscellaneous
InsuranceTaxes
Travel & MeetingsTraining
General Admnistrative Facilities
2016 Proposed Budget
Sound Transit 30 of 56
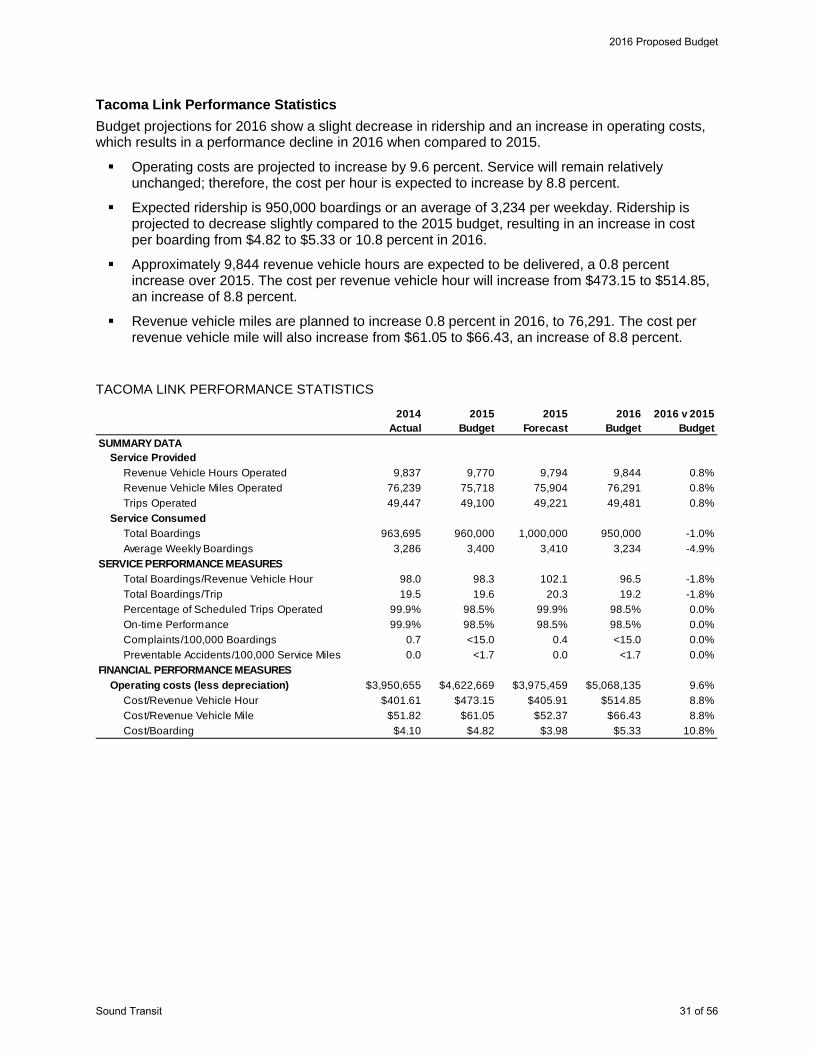
Tacoma Link Performance Statistics Budget projections for 2016 show a slight decrease in ridership and an increase in operating costs, which results in a performance decline in 2016 when compared to 2015.
Operating costs are projected to increase by 9.6 percent. Service will remain relatively unchanged; therefore, the cost per hour is expected to increase by 8.8 percent.
Expected ridership is 950,000 boardings or an average of 3,234 per weekday. Ridership is projected to decrease slightly compared to the 2015 budget, resulting in an increase in cost per boarding from $4.82 to $5.33 or 10.8 percent in 2016.
Approximately 9,844 revenue vehicle hours are expected to be delivered, a 0.8 percent increase over 2015. The cost per revenue vehicle hour will increase from $473.15 to $514.85, an increase of 8.8 percent.
Revenue vehicle miles are planned to increase 0.8 percent in 2016, to 76,291. The cost per revenue vehicle mile will also increase from $61.05 to $66.43, an increase of 8.8 percent.
TACOMA LINK PERFORMANCE STATISTICS
2014 Actual
2015Budget
2015 Forecast
2016 Budget
2016 v 2015Budget
Revenue Vehicle Hours Operated 9,837 9,770 9,794 9,844 0.8%Revenue Vehicle Miles Operated 76,239 75,718 75,904 76,291 0.8%Trips Operated 49,447 49,100 49,221 49,481 0.8%
Total Boardings 963,695 960,000 1,000,000 950,000 -1.0%Average Weekly Boardings 3,286 3,400 3,410 3,234 -4.9%
Total Boardings/Revenue Vehicle Hour 98.0 98.3 102.1 96.5 -1.8%Total Boardings/Trip 19.5 19.6 20.3 19.2 -1.8%Percentage of Scheduled Trips Operated 99.9% 98.5% 99.9% 98.5% 0.0%On-time Performance 99.9% 98.5% 98.5% 98.5% 0.0%Complaints/100,000 Boardings 0.7 <15.0 0.4 <15.0 0.0%Preventable Accidents/100,000 Service Miles 0.0 <1.7 0.0 <1.7 0.0%
$3,950,655 $4,622,669 $3,975,459 $5,068,135 9.6%Cost/Revenue Vehicle Hour $401.61 $473.15 $405.91 $514.85 8.8%Cost/Revenue Vehicle Mile $51.82 $61.05 $52.37 $66.43 8.8%Cost/Boarding $4.10 $4.82 $3.98 $5.33 10.8%
Operating costs (less depreciation)
SUMMARY DATAService Provided
Service Consumed
SERVICE PERFORMANCE MEASURES
FINANCIAL PERFORMANCE MEASURES
2016 Proposed Budget
Sound Transit 31 of 56

Link Light Rail Link light rail trains run between downtown Seattle and Sea-Tac Airport, serving 13 passenger stations, including the 4 stations in the Downtown Seattle Transit Tunnel. In 2016 Link service will be extended north to the University of Washington and to South 200th Street in the city of SeaTac.
Sound Transit operates Link light rail out of our operations and maintenance facility in Seattle’s SODO neighborhood. Operations and maintenance of the system is performed by King County Metro (KCM) through an inter-governmental agreement. Agency staff oversees operations and maintenance of the trains. Sound Transit is directly responsible for security, spare parts, insurance, traction power, and other utilities. Agency Information Technology staff provide maintenance for ticket vending machines, security cameras, and other passenger related technology.
Beginning in 2016, KCM will employ 247 staff, including control center personnel, service supervisors, maintenance-of-way personnel, maintenance technicians, facilities custodians, and light rail operators. King County staff provides supervision and operations of the trains, maintenance of the vehicles, and maintenance of the stations and track facilities.
The Link fleet consists of 62 single-car vehicles, including 27 vehicles to accommodate the extension of service to the University of Washington and Angle Lake in 2016. Each of these vehicles carries 74 seated passengers plus another 74 standing passengers.
The 17.2 million boardings for 2016 represent a 49.6 percent increase over the 2015 forecast. Increased service plus strong population growth in the Puget Sound area continue to push ridership upward.
Link 2016 Budget Highlights The budget for Link light rail is expected to increase 38.0 percent to $87.6 million in 2016.
Security services will increase by 56.8 percent, or $4.9 million, due to expanded service to University of Washington and to Angle Lake. In addition to a larger geographic area to patrol, the extensions will add three stations and a large parking facility. Contract rate increases also account for a portion of the increase.
Professional & Technical services will increase by $483 thousand, or 191.7 percent, due primarily to engineering consulting support for facilities repair projects.
Purchased Transportation Services will increase 29.2 percent, or $8.8 million over 2015 budget, due to increased operating and maintenance costs associated with the Link expansion. The higher 2016 budget is being driven by an increase in the number of King County Metro staff that operate Link as well as an increase in the contract rate.
Agency Administrative expense allocations are forecast higher by 51.8 percent, or $2.7 million, over last year due to a higher base budget, excluding Purchased Transportation Services.
2016 Proposed Budget
Sound Transit 32 of 56

LINK BUDGET SUMMARY (in thousands)
2014Actual
2015Budget
2015Forecast
2016Budget
Budget $ Change
Budget % Change
$815 $1,010 $681 $1,091 $81 8.0462 618 469 650 32 5.2
Subtotal 1,276 1,629 1,150 1,741 113 6.9
24 28 28 28 - - 272 252 260 735 483 191.7
5,387 5,280 4,907 7,930 2,651 50.28,432 8,561 9,579 13,423 4,862 56.81,080 1,047 440 1,507 460 43.9
Subtotal 15,196 15,168 15,215 23,624 8,456 55.71,901 2,214 2,229 2,431 216 9.8
2,115 2,172 2,572 3,408 1,236 56.91,488 3,504 2,505 3,956 452 12.9
400 411 517 596 185 45.0
1,456 1,710 1,697 1,906 196 11.525,634 28,468 28,415 37,095 8,627 30.3
Subtotal 27,090 30,177 30,112 39,001 8,823 29.2
0 1 1 1 - 3 15 26 6 28 2 9.3
157 175 175 270 95 54.34 16 3 11 (4) (27.9)1 - - - - 0.0
Subtotal 177 217 184 310 93 42.9
2,822 2,824 2,836 4,730 1,906 67.51 1 3 4 3 304.7
Subtotal 2,823 2,825 2,839 4,733 1,909 67.6
3,998 5,136 5,402 7,797 2,661 51.8Subtotal 3,998 5,136 5,402 7,797 2,661 51.8
$56,462 $63,453 $62,727 $87,596 $24,144 38.0%Mode Total
Leases & RentalsTransit WayGeneral Admnistrative Facilities
Expense TransfersAdministrative Departments
MiscellaneousDues & SubscriptionsTravel & MeetingsAdvertising & Promotion MediaTraining
Salaries & BenefitsSalariesBenefits
Other Miscellaneous
ServicesMarketing AgencyProfessional & TechnicalContract MaintenanceSecurity & SafetyOther Services
Materials & Supplies
Utilities
Purchased Transportation ServicesParatransit
InsuranceTaxes
Purchased Transportation
2016 Proposed Budget
Sound Transit 33 of 56
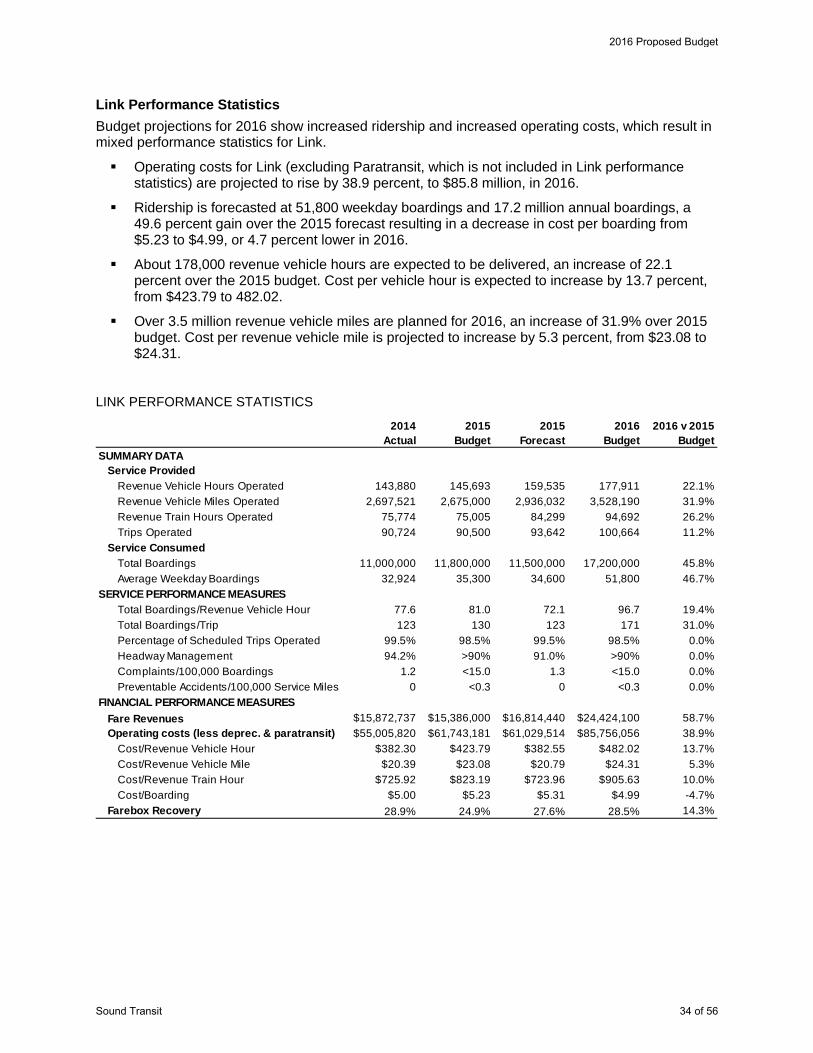
Link Performance Statistics Budget projections for 2016 show increased ridership and increased operating costs, which result in mixed performance statistics for Link.
Operating costs for Link (excluding Paratransit, which is not included in Link performance statistics) are projected to rise by 38.9 percent, to $85.8 million, in 2016.
Ridership is forecasted at 51,800 weekday boardings and 17.2 million annual boardings, a 49.6 percent gain over the 2015 forecast resulting in a decrease in cost per boarding from $5.23 to $4.99, or 4.7 percent lower in 2016.
About 178,000 revenue vehicle hours are expected to be delivered, an increase of 22.1 percent over the 2015 budget. Cost per vehicle hour is expected to increase by 13.7 percent, from $423.79 to 482.02.
Over 3.5 million revenue vehicle miles are planned for 2016, an increase of 31.9% over 2015 budget. Cost per revenue vehicle mile is projected to increase by 5.3 percent, from $23.08 to $24.31.
LINK PERFORMANCE STATISTICS
2014 Actual
2015Budget
2015 Forecast
2016 Budget
2016 v 2015Budget
Revenue Vehicle Hours Operated 143,880 145,693 159,535 177,911 22.1%Revenue Vehicle Miles Operated 2,697,521 2,675,000 2,936,032 3,528,190 31.9%Revenue Train Hours Operated 75,774 75,005 84,299 94,692 26.2%Trips Operated 90,724 90,500 93,642 100,664 11.2%
Total Boardings 11,000,000 11,800,000 11,500,000 17,200,000 45.8%Average Weekday Boardings 32,924 35,300 34,600 51,800 46.7%
Total Boardings/Revenue Vehicle Hour 77.6 81.0 72.1 96.7 19.4%Total Boardings/Trip 123 130 123 171 31.0%Percentage of Scheduled Trips Operated 99.5% 98.5% 99.5% 98.5% 0.0%Headway Management 94.2% >90% 91.0% >90% 0.0%Complaints/100,000 Boardings 1.2 <15.0 1.3 <15.0 0.0%Preventable Accidents/100,000 Service Miles 0 <0.3 0 <0.3 0.0%
Fare Revenues $15,872,737 $15,386,000 $16,814,440 $24,424,100 58.7%Operating costs (less deprec. & paratransit) $55,005,820 $61,743,181 $61,029,514 $85,756,056 38.9%
Cost/Revenue Vehicle Hour $382.30 $423.79 $382.55 $482.02 13.7%Cost/Revenue Vehicle Mile $20.39 $23.08 $20.79 $24.31 5.3%Cost/Revenue Train Hour $725.92 $823.19 $723.96 $905.63 10.0%Cost/Boarding $5.00 $5.23 $5.31 $4.99 -4.7%
Farebox Recovery 28.9% 24.9% 27.6% 28.5% 14.3%
FINANCIAL PERFORMANCE MEASURES
SUMMARY DATAService Provided
Service Consumed
SERVICE PERFORMANCE MEASURES
2016 Proposed Budget
Sound Transit 34 of 56

Sounder Commuter Rail Sounder commuter rail spans three counties, serving commuters making their way from Lakewood on the south end and Everett on the north end of central Puget Sound. Sounder service operates via a contract with Burlington Northern Santa Fe (BNSF), owner of the railway between Tacoma and Everett. Sound Transit owns the railway from M Street in Tacoma to Lakewood.
South line commuter service currently offers ten daily round trips between Seattle and Tacoma. Six of these round trips extend service to Lakewood. In late 2016 an additional round trip will be added between Lakewood and Seattle on the South line. North line Sounder service offers four daily round trips between Everett and Seattle. No service additions are scheduled for the North line in 2016.
Sounder service is supported by 12 stations and 11 parking facilities. The Sounder fleet consists of 14 locomotives, 40 coaches, and 18 cab cars that include an engineer’s cab. Nine cab cars are expected to be delivered in late 2016. All vehicles are maintained by Amtrak at their Holgate Yard in Seattle during the day with overnight storage for the four North line trains in Everett and the six South line trains in Tacoma. Sounder also benefits from numerous other supporting contracts, such as services for security, station agents, and facilities maintenance.
Sounder boardings in 2016 are expected to step-up from 3.2 million budgeted in 2015, to 3.7 million in 2016, an increase of 16.6 percent.
Sounder 2016 Budget Highlights The 2016 Sounder budget is $45.8 million, an increase of 5.1 percent, from $43.6 million in 2015.
Contract Maintenance is expected to increase $1.9 million primarily due to increased costs of vehicle maintenance by Amtrak. In addition to a 2.5% rate increase, there will be eight additional vehicles in September 2016. Positive Train Control requirements will add $70 thousand in operating and maintenance costs.
Purchased Transportation base costs charged by BNSF to operate our Sounder service are expected to increase $559 thousand or 5.9 percent, due to an increase in contracted rates for service and the addition of another round trip in September 2016.
Agency Administrative expense allocations will increase by $179 thousand or 3.7 percent in 2016 over last year due to a higher base budget.
2016 Proposed Budget
Sound Transit 35 of 56

SOUNDER BUDGET SUMMARY (in thousands)
2014Actual
2015Budget
2015Forecast
2016Budget
Budget $ Change
Budget % Change
$766 $1,022 $630 $1,235 $212 20.8437 608 450 729 121 19.9
Subtotal 1,203 1,630 1,081 1,964 333 20.5
24 28 28 28 - - 132 124 16 107 (17) (13.7)
12,258 12,196 11,702 14,088 1,892 15.52,856 3,063 3,428 2,583 (480) (15.7)1,368 1,522 1,212 1,466 (56) (3.7)
Subtotal 16,639 16,934 16,387 18,273 1,339 7.95,876 6,768 5,151 6,749 (19) (0.3)
827 923 682 661 (262) (28.4)296 1,275 1,457 1,355 80 6.3781 873 809 835 (39) (4.4)
8,926 9,433 9,291 9,992 559 5.9Subtotal 8,926 9,433 9,291 9,992 559 5.9
0 1 1 1 - 44.03 6 5 11 5 89.2
177 175 175 180 5 2.92 12 1 5 (8) (63.2)
42 28 25 25 (3) (10.3)Subtotal 223 222 206 221 - (0.2)
497 479 377 425 (54) (11.2)231 139 194 235 96 68.9
Subtotal 728 618 571 660 42 6.8
3,385 4,876 4,379 5,056 179 3.7Subtotal 3,385 4,876 4,379 5,056 179 3.7
$38,885 $43,552 $40,014 $45,764 $2,212 5.1%
Dues & Subscriptions
Marketing AgencyProfessional & TechnicalContract MaintenanceSecurity & SafetyOther Services
Materials & Supplies
Utilities
Purchased Transportation ServicesPurchased Transportation
Miscellaneous
InsuranceTaxes
Services
Salaries & BenefitsSalariesBenefits
General Admnistrative Facilities
Expense TransfersAdministrative Departments
Mode Total
Travel & MeetingsAdvertising & Promotion MediaTrainingOther Miscellaneous
Transit WayLeases & Rentals
2016 Proposed Budget
Sound Transit 36 of 56
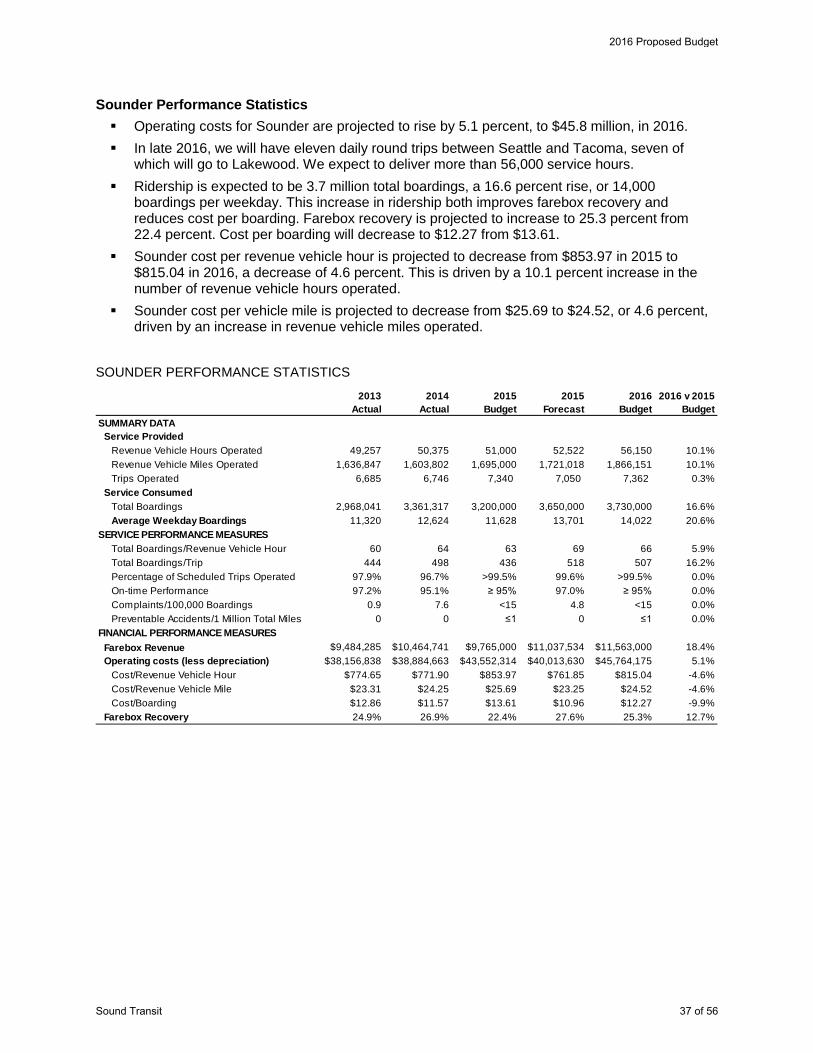
Sounder Performance Statistics Operating costs for Sounder are projected to rise by 5.1 percent, to $45.8 million, in 2016. In late 2016, we will have eleven daily round trips between Seattle and Tacoma, seven of
which will go to Lakewood. We expect to deliver more than 56,000 service hours. Ridership is expected to be 3.7 million total boardings, a 16.6 percent rise, or 14,000
boardings per weekday. This increase in ridership both improves farebox recovery and reduces cost per boarding. Farebox recovery is projected to increase to 25.3 percent from 22.4 percent. Cost per boarding will decrease to $12.27 from $13.61.
Sounder cost per revenue vehicle hour is projected to decrease from $853.97 in 2015 to $815.04 in 2016, a decrease of 4.6 percent. This is driven by a 10.1 percent increase in the number of revenue vehicle hours operated.
Sounder cost per vehicle mile is projected to decrease from $25.69 to $24.52, or 4.6 percent, driven by an increase in revenue vehicle miles operated.
SOUNDER PERFORMANCE STATISTICS
2013Actual
2014 Actual
2015Budget
2015 Forecast
2016 Budget
2016 v 2015Budget
Revenue Vehicle Hours Operated 49,257 50,375 51,000 52,522 56,150 10.1%Revenue Vehicle Miles Operated 1,636,847 1,603,802 1,695,000 1,721,018 1,866,151 10.1%Trips Operated 6,685 6,746 7,340 7,050 7,362 0.3%
Total Boardings 2,968,041 3,361,317 3,200,000 3,650,000 3,730,000 16.6%Average Weekday Boardings 11,320 12,624 11,628 13,701 14,022 20.6%
Total Boardings/Revenue Vehicle Hour 60 64 63 69 66 5.9%Total Boardings/Trip 444 498 436 518 507 16.2%Percentage of Scheduled Trips Operated 97.9% 96.7% >99.5% 99.6% >99.5% 0.0%On-time Performance 97.2% 95.1% ≥ 95% 97.0% ≥ 95% 0.0%Complaints/100,000 Boardings 0.9 7.6 <15 4.8 <15 0.0%Preventable Accidents/1 Million Total Miles 0 0 ≤1 0 ≤1 0.0%
Farebox Revenue $9,484,285 $10,464,741 $9,765,000 $11,037,534 $11,563,000 18.4%$38,156,838 $38,884,663 $43,552,314 $40,013,630 $45,764,175 5.1%
Cost/Revenue Vehicle Hour $774.65 $771.90 $853.97 $761.85 $815.04 -4.6%Cost/Revenue Vehicle Mile $23.31 $24.25 $25.69 $23.25 $24.52 -4.6%Cost/Boarding $12.86 $11.57 $13.61 $10.96 $12.27 -9.9%
24.9% 26.9% 22.4% 27.6% 25.3% 12.7%
Operating costs (less depreciation)
Farebox Recovery
SUMMARY DATAService Provided
Service Consumed
SERVICE PERFORMANCE MEASURES
FINANCIAL PERFORMANCE MEASURES
2016 Proposed Budget
Sound Transit 37 of 56
ST Express Bus ST Express offers fast, frequent, two-way service on 28 routes along 20 corridors, connecting Snohomish, King, and Pierce Counties. Sound Transit provides this bus service via contracts with transit partners, including King County Metro (KCM), Pierce Transit (PT), and Community Transit (CT).
Sound Transit provides 309 buses to support ST Express service. The bus fleet is maintained by our transit partners KCM (119 buses), PT (129 buses), and CT (61 buses). ST Express provides service to 25 transit centers and 33 park-and-ride lots.
Service levels will be increased by 19,750 hours in 2016 to address overcrowding on some routes, primarily in East King County, as well as to provide connections to new Link and Sounder service.
The third year of a Regional Mobility Grant awarded to Intercity Transit has enabled us to continue the extension of Route 592 to the south, beyond Lacy, to Olympia. With the extension, we are able to provide six rush-hour trips each weekday between Seattle and Olympia.
Boardings in 2016 are expected to continue a steady growth trend with an increase of 10.9 percent, or 1.9 million, over our 2015 budget.
ST Express 2016 Budget Highlights ST Express’s 2016 budget will increase to $125.8 million, up 7.7 percent, from $116.8 million in the 2015 budget.
Contract Maintenance is expected to increase by $481 thousand, to $5.3 million in 2016, as major repairs are scheduled at several ST Express stations.
Security and Safety costs are expected to increase $71 thousand, or 3.2 percent, in the ST Express mode due to contract rate increases.
Purchased Transportation Services are expected to increase by $7.7 million or 8.0 percent. This increase reflects increased rates with all three transit partners, as well as an increase of 19,750 service hours during 2016.
Agency Administrative expense allocations are forecast to increase by $864 thousand or 11.5 percent in 2016 over last year due to a higher base budget.
2016 Proposed Budget
Sound Transit 38 of 56
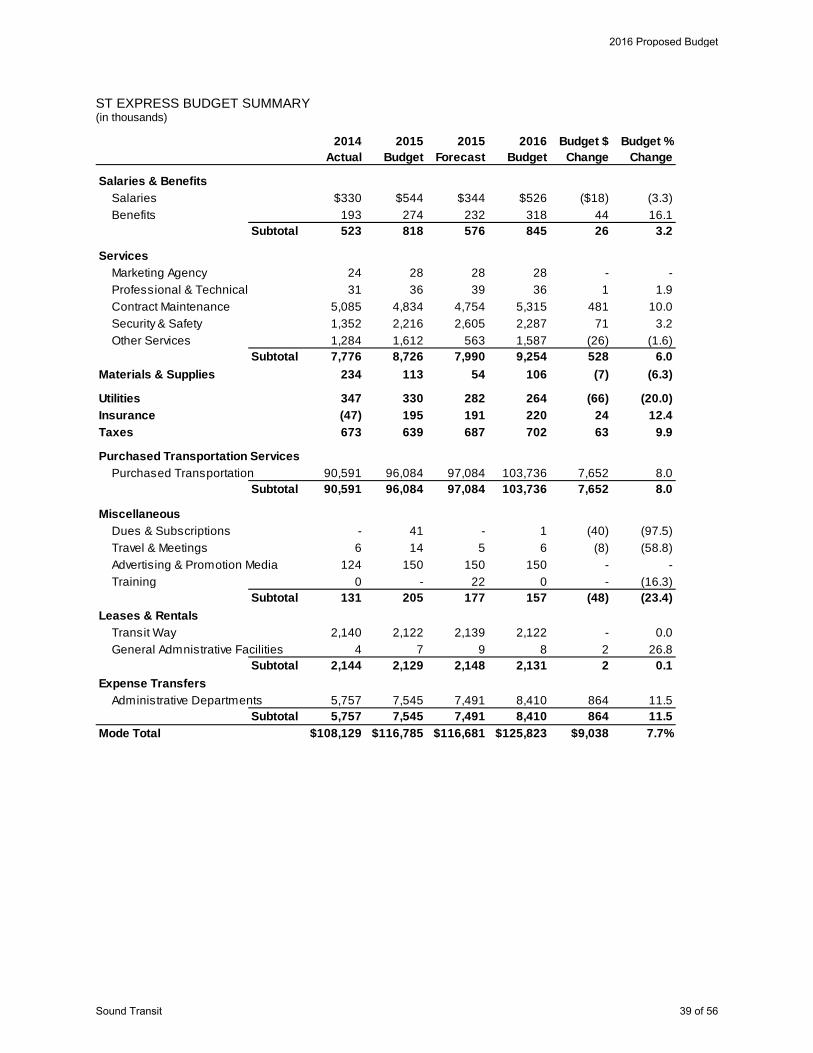
ST EXPRESS BUDGET SUMMARY (in thousands)
2014Actual
2015Budget
2015Forecast
2016Budget
Budget $ Change
Budget % Change
$330 $544 $344 $526 ($18) (3.3)193 274 232 318 44 16.1
Subtotal 523 818 576 845 26 3.2
24 28 28 28 - - 31 36 39 36 1 1.9
5,085 4,834 4,754 5,315 481 10.01,352 2,216 2,605 2,287 71 3.21,284 1,612 563 1,587 (26) (1.6)
Subtotal 7,776 8,726 7,990 9,254 528 6.0234 113 54 106 (7) (6.3)
347 330 282 264 (66) (20.0)(47) 195 191 220 24 12.4673 639 687 702 63 9.9
90,591 96,084 97,084 103,736 7,652 8.0Subtotal 90,591 96,084 97,084 103,736 7,652 8.0
- 41 - 1 (40) (97.5)6 14 5 6 (8) (58.8)
124 150 150 150 - - 0 - 22 0 - (16.3)
Subtotal 131 205 177 157 (48) (23.4)
2,140 2,122 2,139 2,122 - 0.04 7 9 8 2 26.8
Subtotal 2,144 2,129 2,148 2,131 2 0.1
5,757 7,545 7,491 8,410 864 11.5Subtotal 5,757 7,545 7,491 8,410 864 11.5
$108,129 $116,785 $116,681 $125,823 $9,038 7.7%
Administrative Departments
Mode Total
Advertising & Promotion MediaTraining
Transit WayGeneral Admnistrative Facilities
Expense Transfers
Salaries & BenefitsSalariesBenefits
ServicesMarketing AgencyProfessional & TechnicalContract MaintenanceSecurity & Safety
Leases & Rentals
Dues & Subscriptions
Other Services
Materials & Supplies
Utilities
Purchased Transportation ServicesPurchased Transportation
Miscellaneous
InsuranceTaxes
Travel & Meetings
2016 Proposed Budget
Sound Transit 39 of 56
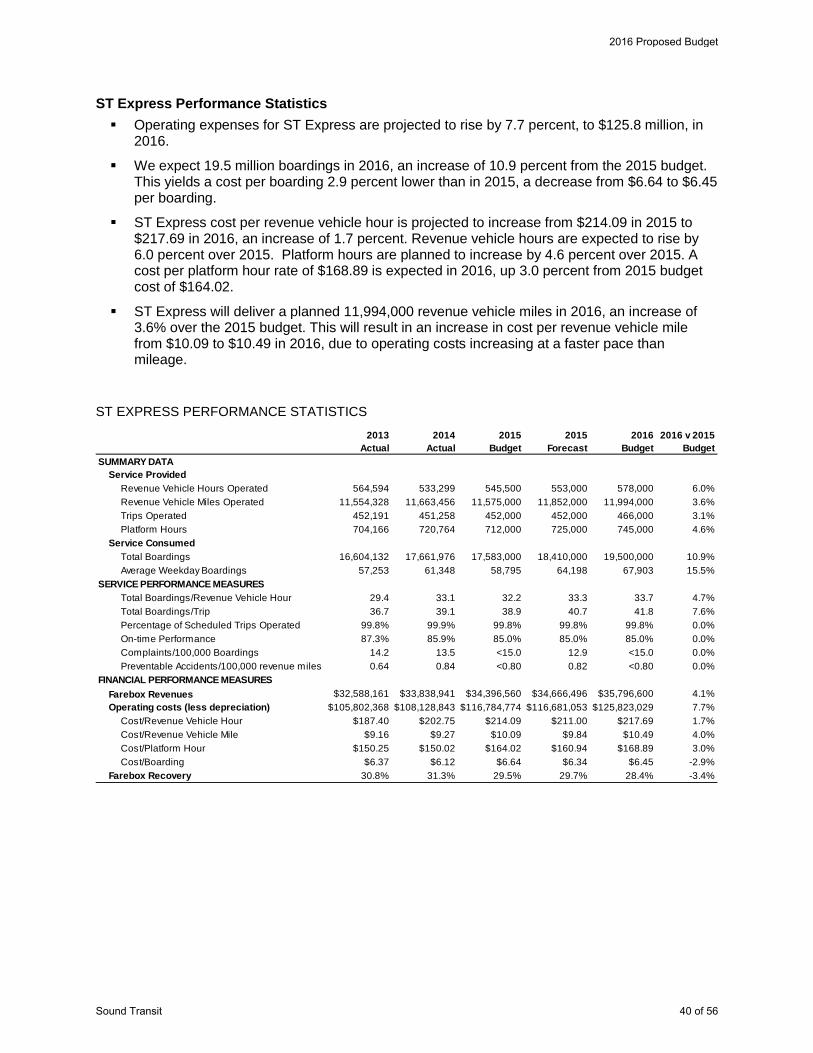
ST Express Performance Statistics Operating expenses for ST Express are projected to rise by 7.7 percent, to $125.8 million, in
2016.
We expect 19.5 million boardings in 2016, an increase of 10.9 percent from the 2015 budget. This yields a cost per boarding 2.9 percent lower than in 2015, a decrease from $6.64 to $6.45 per boarding.
ST Express cost per revenue vehicle hour is projected to increase from $214.09 in 2015 to $217.69 in 2016, an increase of 1.7 percent. Revenue vehicle hours are expected to rise by 6.0 percent over 2015. Platform hours are planned to increase by 4.6 percent over 2015. A cost per platform hour rate of $168.89 is expected in 2016, up 3.0 percent from 2015 budget cost of $164.02.
ST Express will deliver a planned 11,994,000 revenue vehicle miles in 2016, an increase of 3.6% over the 2015 budget. This will result in an increase in cost per revenue vehicle mile from $10.09 to $10.49 in 2016, due to operating costs increasing at a faster pace than mileage.
ST EXPRESS PERFORMANCE STATISTICS
2013Actual
2014 Actual
2015Budget
2015 Forecast
2016 Budget
2016 v 2015Budget
Revenue Vehicle Hours Operated 564,594 533,299 545,500 553,000 578,000 6.0%Revenue Vehicle Miles Operated 11,554,328 11,663,456 11,575,000 11,852,000 11,994,000 3.6%Trips Operated 452,191 451,258 452,000 452,000 466,000 3.1%Platform Hours 704,166 720,764 712,000 725,000 745,000 4.6%
Total Boardings 16,604,132 17,661,976 17,583,000 18,410,000 19,500,000 10.9%Average Weekday Boardings 57,253 61,348 58,795 64,198 67,903 15.5%
Total Boardings/Revenue Vehicle Hour 29.4 33.1 32.2 33.3 33.7 4.7%Total Boardings/Trip 36.7 39.1 38.9 40.7 41.8 7.6%Percentage of Scheduled Trips Operated 99.8% 99.9% 99.8% 99.8% 99.8% 0.0%On-time Performance 87.3% 85.9% 85.0% 85.0% 85.0% 0.0%Complaints/100,000 Boardings 14.2 13.5 <15.0 12.9 <15.0 0.0%Preventable Accidents/100,000 revenue miles 0.64 0.84 <0.80 0.82 <0.80 0.0%
Farebox Revenues $32,588,161 $33,838,941 $34,396,560 $34,666,496 $35,796,600 4.1%$105,802,368 $108,128,843 $116,784,774 $116,681,053 $125,823,029 7.7%
Cost/Revenue Vehicle Hour $187.40 $202.75 $214.09 $211.00 $217.69 1.7%Cost/Revenue Vehicle Mile $9.16 $9.27 $10.09 $9.84 $10.49 4.0%Cost/Platform Hour $150.25 $150.02 $164.02 $160.94 $168.89 3.0%Cost/Boarding $6.37 $6.12 $6.64 $6.34 $6.45 -2.9%
30.8% 31.3% 29.5% 29.7% 28.4% -3.4%
Operating costs (less depreciation)
Farebox Recovery
SUMMARY DATAService Provided
Service Consumed
SERVICE PERFORMANCE MEASURES
FINANCIAL PERFORMANCE MEASURES
2016 Proposed Budget
Sound Transit 40 of 56
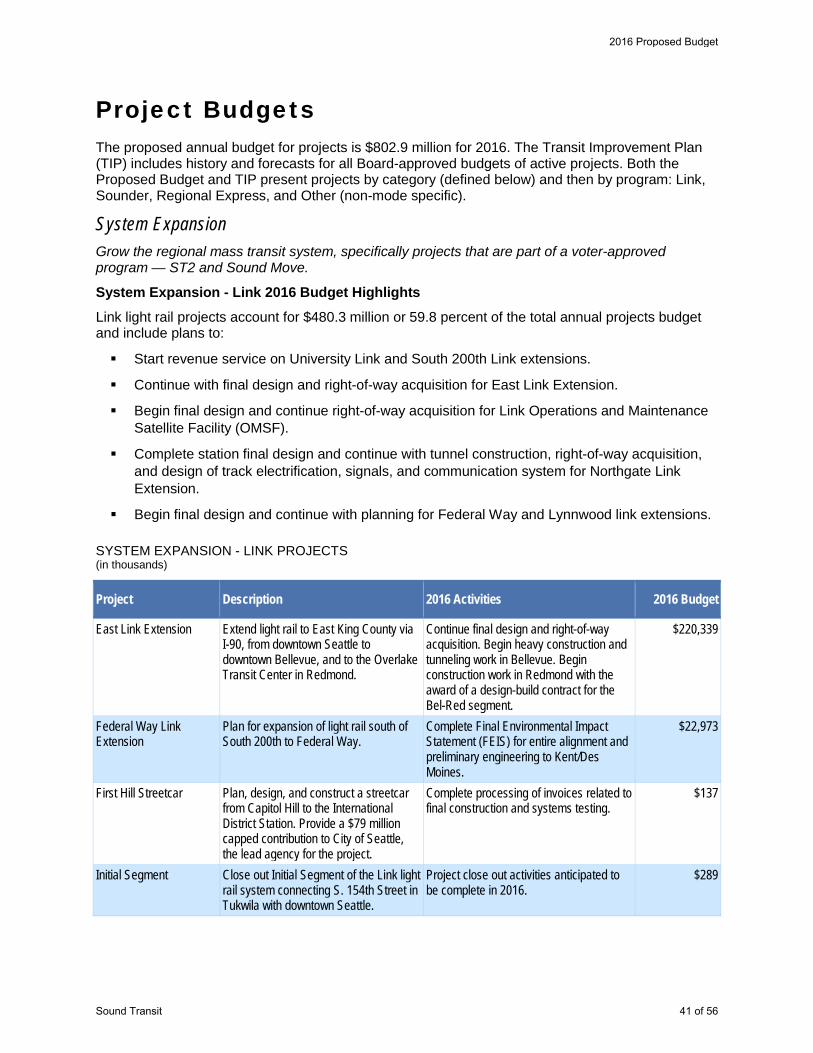
Project Budgets The proposed annual budget for projects is $802.9 million for 2016. The Transit Improvement Plan (TIP) includes history and forecasts for all Board-approved budgets of active projects. Both the Proposed Budget and TIP present projects by category (defined below) and then by program: Link, Sounder, Regional Express, and Other (non-mode specific).
System Expansion Grow the regional mass transit system, specifically projects that are part of a voter-approved program — ST2 and Sound Move.
System Expansion - Link 2016 Budget Highlights
Link light rail projects account for $480.3 million or 59.8 percent of the total annual projects budget and include plans to:
Start revenue service on University Link and South 200th Link extensions.
Continue with final design and right-of-way acquisition for East Link Extension.
Begin final design and continue right-of-way acquisition for Link Operations and Maintenance Satellite Facility (OMSF).
Complete station final design and continue with tunnel construction, right-of-way acquisition, and design of track electrification, signals, and communication system for Northgate Link Extension.
Begin final design and continue with planning for Federal Way and Lynnwood link extensions. SYSTEM EXPANSION - LINK PROJECTS (in thousands)
Project Description 2016 Activities 2016 Budget
East Link Extension Extend light rail to East King County via I-90, from downtown Seattle to downtown Bellevue, and to the Overlake Transit Center in Redmond.
Continue final design and right-of-way acquisition. Begin heavy construction and tunneling work in Bellevue. Begin construction work in Redmond with the award of a design-build contract for the Bel-Red segment.
$220,339
Federal Way Link Extension
Plan for expansion of light rail south of South 200th to Federal Way.
Complete Final Environmental Impact Statement (FEIS) for entire alignment and preliminary engineering to Kent/Des Moines.
$22,973
First Hill Streetcar Plan, design, and construct a streetcar from Capitol Hill to the International District Station. Provide a $79 million capped contribution to City of Seattle, the lead agency for the project.
Complete processing of invoices related to final construction and systems testing.
$137
Initial Segment Close out Initial Segment of the Link light rail system connecting S. 154th Street in Tukwila with downtown Seattle.
Project close out activities anticipated to be complete in 2016.
$289
2016 Proposed Budget
Sound Transit 41 of 56
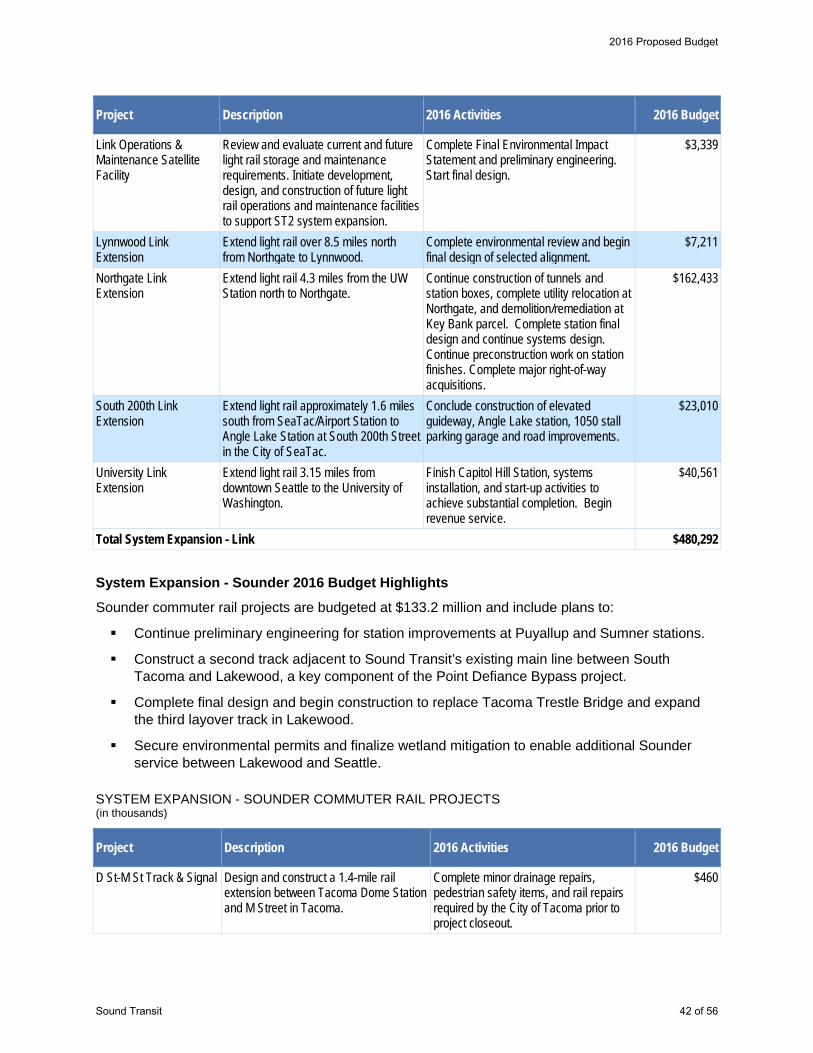
Project Description 2016 Activities 2016 Budget
Link Operations & Maintenance Satellite Facility
Review and evaluate current and future light rail storage and maintenance requirements. Initiate development, design, and construction of future light rail operations and maintenance facilities to support ST2 system expansion.
Complete Final Environmental Impact Statement and preliminary engineering. Start final design.
$3,339
Lynnwood Link Extension
Extend light rail over 8.5 miles north from Northgate to Lynnwood.
Complete environmental review and begin final design of selected alignment.
$7,211
Northgate Link Extension
Extend light rail 4.3 miles from the UW Station north to Northgate.
Continue construction of tunnels and station boxes, complete utility relocation at Northgate, and demolition/remediation at Key Bank parcel. Complete station final design and continue systems design. Continue preconstruction work on station finishes. Complete major right-of-way acquisitions.
$162,433
South 200th Link Extension
Extend light rail approximately 1.6 miles south from SeaTac/Airport Station to Angle Lake Station at South 200th Street in the City of SeaTac.
Conclude construction of elevated guideway, Angle Lake station, 1050 stall parking garage and road improvements.
$23,010
University Link Extension
Extend light rail 3.15 miles from downtown Seattle to the University of Washington.
Finish Capitol Hill Station, systems installation, and start-up activities to achieve substantial completion. Begin revenue service.
$40,561
Total System Expansion - Link $480,292
System Expansion - Sounder 2016 Budget Highlights
Sounder commuter rail projects are budgeted at $133.2 million and include plans to:
Continue preliminary engineering for station improvements at Puyallup and Sumner stations.
Construct a second track adjacent to Sound Transit’s existing main line between South Tacoma and Lakewood, a key component of the Point Defiance Bypass project.
Complete final design and begin construction to replace Tacoma Trestle Bridge and expand the third layover track in Lakewood.
Secure environmental permits and finalize wetland mitigation to enable additional Sounder service between Lakewood and Seattle.
SYSTEM EXPANSION - SOUNDER COMMUTER RAIL PROJECTS (in thousands)
Project Description 2016 Activities 2016 Budget
D St-M St Track & Signal Design and construct a 1.4-mile rail extension between Tacoma Dome Station and M Street in Tacoma.
Complete minor drainage repairs, pedestrian safety items, and rail repairs required by the City of Tacoma prior to project closeout.
$460
2016 Proposed Budget
Sound Transit 42 of 56

Project Description 2016 Activities 2016 Budget
Lakewood Station Improvements
In partnership with the city of Lakewood, design and construct a pedestrian overpass connecting Lakewood Station with the community northwest of the station.
Provide local grant match of $100 thousand for station improvements. Additional budget for associated administrative costs.
$138
M St-Lakewood Track & Signal
Reconstruction of approximately 7 miles of existing track between M Street in Tacoma and Lakewood.
Complete boundary survey and project closeout.
$5
Mukilteo Station, S Platform
Design and construction of a south boarding platform at Mukilteo Station.
Project close-out activities. $1,040
Point Defiance Bypass Construct a new second track adjacent to Sound Transit’s existing main line between South Tacoma and Lakewood. Upgrade Sound Transit’s existing track between Lakewood and Nisqually. Make improvements at the connection to BNSF’s main line near Nisqually and at some existing at-grade crossings.
Track and signal improvements from 66th Street in Tacoma to Nisqually.
$50,482
Puyallup Station Improvements
Improve station access at Puyallup Sounder station.
Continue preliminary engineering and environmental review.
$5,945
Sounder South Expanded Service
Purchase of four easements, track and signal improvements, and environmental permitting/mitigation for four additional daily round trips between Seattle and Lakewood.
Secure environmental permits through King County's Mitigation Reserve Program.
$4,300
Sounder ST2 Fleet Expansion
Expand fleet to add trips between Seattle and Lakewood.
Purchase of nine new passenger cab cars.
$8,897
Sounder Yard & Shops Facility
Evaluate commuter rail vehicle storage and maintenance requirements and strategies to identify cost efficient ways to develop commuter rail operations and maintenance facilities.
Continue preliminary engineering, environmental planning, and site selection.
$5,006
Sounder Yard Expansion Increase track capacity at the layover facility in Lakewood to store up to seven train sets.
Complete final design and begin construction under a design-build contract.
$11,405
Sumner Station Improvements
Improve station access at Sumner Sounder station.
Continue preliminary engineering and environmental review.
$1,177
Tacoma Trestle Track & Signal
Design and build additional track and bridge between Tacoma Dome Station and near M Street in Tacoma.
Complete final design and right-of-way acquisition. Begin construction.
$43,583
Tukwila Station Design and construct permanent boarding platform, parking, and station amenities.
Complete follow-on work. Project is substantially complete.
$730
Total System Expansion - Sounder $133,168
2016 Proposed Budget
Sound Transit 43 of 56

System Expansion - Regional Express 2016 Budget Highlights
Regional Express projects are budgeted at $83.1 million and include continuation of construction of I-90 High-Occupancy-Vehicle (HOV) lanes and preliminary engineering for a new bus base. SYSTEM EXPANSION REGIONAL EXPRESS PROJECTS (in thousands)
Project Description 2016 Activities 2016 Budget
Bothell Transit Related Improvements
Provide fixed contribution to the City of Bothell to improve rider access to transit service serving Bothell and operating in the SR 522 corridor.
Establish a memorandum of understanding with the city of Bothell that outlines the responsibilities of each party.
$5,032
I-90 Two-Way Transit & HOV Operations, Stage 3
Provide two-way transit and HOV lanes eastbound and westbound on I-90 between 80th Avenue SE in Mercer Island and Rainier Avenue/I-5 in Seattle.
Upgrade fire life safety components in outer tunnels of I-90, to include fire suppression, upgraded exhaust fans and integration of system into WSDOT control center.
$75,303
ST Express Bus Base Planning and preliminary design for a bus operations and maintenance base to improve cost efficiency of ST Express Bus operations and maintenance.
Continue with preliminary engineering, environmental planning and permitting, and site selection.
$2,793
Total System Expansion - Regional Express $83,128
System Expansion - Other 2016 Budget Highlights
Other projects are budgeted at $18.5 million and include finalizing a new system expansion plan ballot measure for voters to consider in November 2016. SYSTEM EXPANSION – OTHER (in thousands)
Project Description 2016 Activities 2016 Budget
Fare Administration Manage fares for Sound Transit. Support initiatives for generating earned revenue from services such as parking and concessions. Fund upgrades to the ORCA system.
Source an ORCA parking integration solution that allows validation of parking with ORCA cards for the parking permit program. Execute strategic planning initiatives in support of ORCA 2 as established by the Joint Board.
$1,494
Fare Collection Facilitate capital maintenance, support, and software/hardware upgrades and enhancements that ensure reliable and cost effective performance of fare collection enforcement systems.
Maintain TVMs already placed in service by installing systemwide upgrades and software enhancements that prolong the useful life of the TVM system and increase machine performance. Develop software and purchase hardware necessary to provide electronic citation equipment to fare enforcement officers.
$788
2016 Proposed Budget
Sound Transit 44 of 56

Project Description 2016 Activities 2016 Budget
Research & Technology Assess and implement technologies to improve passenger safety, security, service, and information.
Continue work on regional data repository, develop real time customer facing applications, and improve station signage systems. Deliver real time web and mobile applications for Sounder and Link passengers.
$2,727
ST3 Planning Plan next expansion of the regional transit system beyond Sound Move and ST2 programs. Develop project estimate methodologies, system alternatives, project priority list, and ridership forecasting, as well as election costs in support of a November 2016 public vote.
Develop project estimate methodologies, systems alternatives, project priority list, ridership forecasting, and administrative election cost estimates for a November 2016 public vote.
$11,942
STart Integrate public art into Sound Transit projects.
Manage public art development process for ten East Link stations, three Northgate Link stations, Angle Lake Station, Capitol Hill Station, and two locations along the Sounder Lakewood corridor as well as temporary art to mitigate construction impacts at the Northgate Link stations.
$1,254
STart Operations & Maintenance
Maintain Sound Transit art installations, including documentation, monitoring, cleaning, and repairing.
Restore existing art installations at Kent Station, repair art at Sumner Station, and repaint lamp posts on Pacific Overpass in Everett.
$250
Total System Expansion - Other $18,455
Enhancement Improve the public’s riding experience, increase the system’s functionality, or reduce operating costs.
Enhancement 2016 Budget Highlights
Enhancement projects are budgeted at $17.2 million and include plans to:
Finalize Positive Train Control project, which is scheduled to start up in December 2015.
Install a second light rail vehicle lift at Link Operations and Maintenance Facility.
Facilitate transit oriented development near transit stations.
2016 Proposed Budget
Sound Transit 45 of 56
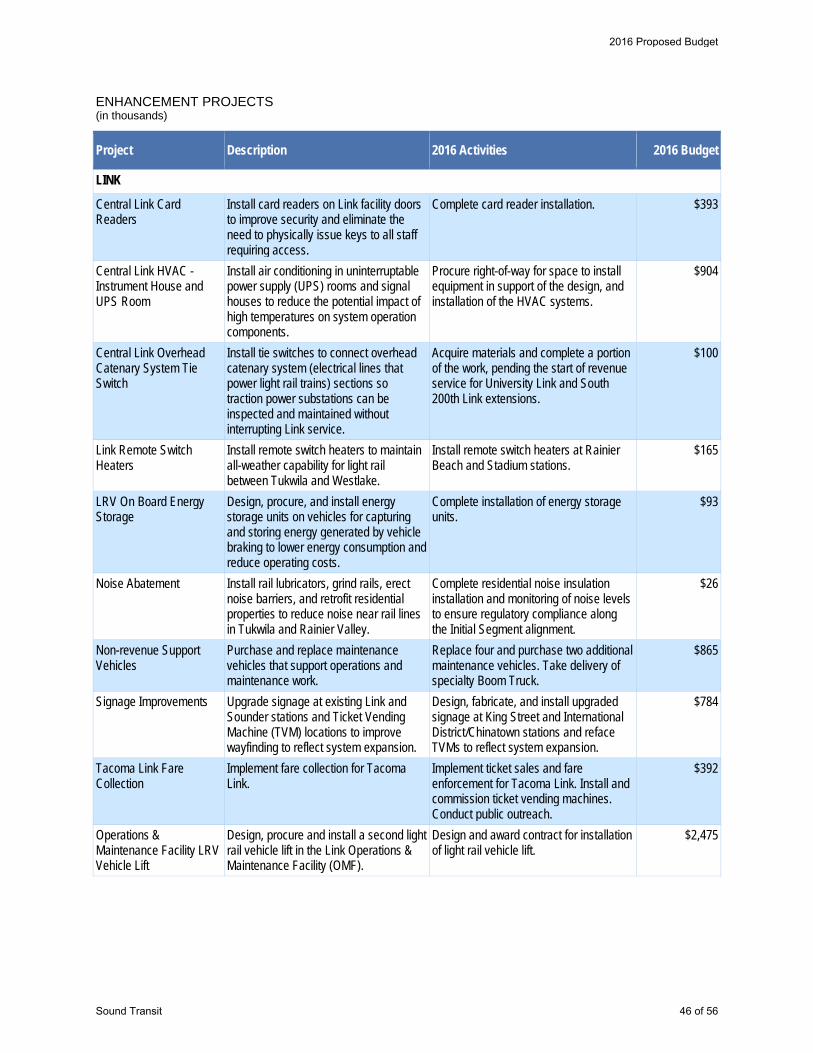
ENHANCEMENT PROJECTS (in thousands)
Project Description 2016 Activities 2016 Budget
LINK
Central Link Card Readers
Install card readers on Link facility doors to improve security and eliminate the need to physically issue keys to all staff requiring access.
Complete card reader installation. $393
Central Link HVAC - Instrument House and UPS Room
Install air conditioning in uninterruptable power supply (UPS) rooms and signal houses to reduce the potential impact of high temperatures on system operation components.
Procure right-of-way for space to install equipment in support of the design, and installation of the HVAC systems.
$904
Central Link Overhead Catenary System Tie Switch
Install tie switches to connect overhead catenary system (electrical lines that power light rail trains) sections so traction power substations can be inspected and maintained without interrupting Link service.
Acquire materials and complete a portion of the work, pending the start of revenue service for University Link and South 200th Link extensions.
$100
Link Remote Switch Heaters
Install remote switch heaters to maintain all-weather capability for light rail between Tukwila and Westlake.
Install remote switch heaters at Rainier Beach and Stadium stations.
$165
LRV On Board Energy Storage
Design, procure, and install energy storage units on vehicles for capturing and storing energy generated by vehicle braking to lower energy consumption and reduce operating costs.
Complete installation of energy storage units.
$93
Noise Abatement Install rail lubricators, grind rails, erect noise barriers, and retrofit residential properties to reduce noise near rail lines in Tukwila and Rainier Valley.
Complete residential noise insulation installation and monitoring of noise levels to ensure regulatory compliance along the Initial Segment alignment.
$26
Non-revenue Support Vehicles
Purchase and replace maintenance vehicles that support operations and maintenance work.
Replace four and purchase two additional maintenance vehicles. Take delivery of specialty Boom Truck.
$865
Signage Improvements Upgrade signage at existing Link and Sounder stations and Ticket Vending Machine (TVM) locations to improve wayfinding to reflect system expansion.
Design, fabricate, and install upgraded signage at King Street and International District/Chinatown stations and reface TVMs to reflect system expansion.
$784
Tacoma Link Fare Collection
Implement fare collection for Tacoma Link.
Implement ticket sales and fare enforcement for Tacoma Link. Install and commission ticket vending machines. Conduct public outreach.
$392
Operations & Maintenance Facility LRV Vehicle Lift
Design, procure and install a second light rail vehicle lift in the Link Operations & Maintenance Facility (OMF).
Design and award contract for installation of light rail vehicle lift.
$2,475
2016 Proposed Budget
Sound Transit 46 of 56

Project Description 2016 Activities 2016 Budget
SOUNDER
Kent Station Parking Lot Paving
Improve unused ST property adjacent to Kent Station to provide overflow parking.
Complete site survey, environmental review, and construction of 39 parking spaces.
$700
Kent Station Platform Lighting
Install energy efficient lighting at Kent Station.
Replace existing conventional lighting with energy efficient LED lighting.
$236
Positive Train Control Design and install remote operations monitoring and control system to minimize the risk of passenger train collisions.
Complete final testing and commissioning of fully operational positive train control system.
$2,694
Puyallup Station LED Lighting
Install energy efficient lighting at Puyallup Station.
Replace existing conventional lighting with energy efficient LED lighting.
$178
Sumner Station LED Lighting
Install energy efficient lighting at Sumner Station.
Replace existing conventional lighting with energy efficient LED lighting.
$134
REGIONAL EXPRESS
Bus Maintenance Facility Enhance capacity to maintain Sound Transit’s fleet.
Contribute funds to Pierce Transit for a maintenance base expansion study.
$275
Pierce Transit Radio System Upgrade
Replace mobile radios on Sound Transit buses operated by Pierce Transit. Upgrade infrastructure to comply with Federal Communications Commission regulations by December 2016.
Project completed. Any remaining funds are considered surplus.
$438
ST Express Mobile Communications
Upgrade mobile communications systems to be compatible with our transit partners, ensuring safety and improving customer service planning information.
Project completed. Any remaining funds are considered surplus.
$220
OTHER
Downtown Seattle Transit Tunnel Mitigation
Complete street improvements in Seattle to enable King County Metro buses to transition out of Downtown Seattle Transit Tunnel (DSTT) to accommodate an increase in light rail traffic.
Provide a fixed payment to fund Seattle street improvements.
$728
Regional Parking Pilot Project
Test and evaluate parking management strategies to implement customer parking permits.
Project completed. Any remaining funds are considered surplus
$115
Transit Oriented Development Property Disposition
Prepare properties for sale or lease that have been identified as having potential for transit oriented development.
Assess joint development and public/private or public/public partnerships opportunities to develop Sound Transit owned sites near stations.
$3,925
Union Station Garden Level Remodel
Renovate the Garden Level of Union Station to accommodate additional staff and consultants.
Complete renovations to increase work stations.
$1,353
Total Enhancement $17,192
2016 Proposed Budget
Sound Transit 47 of 56
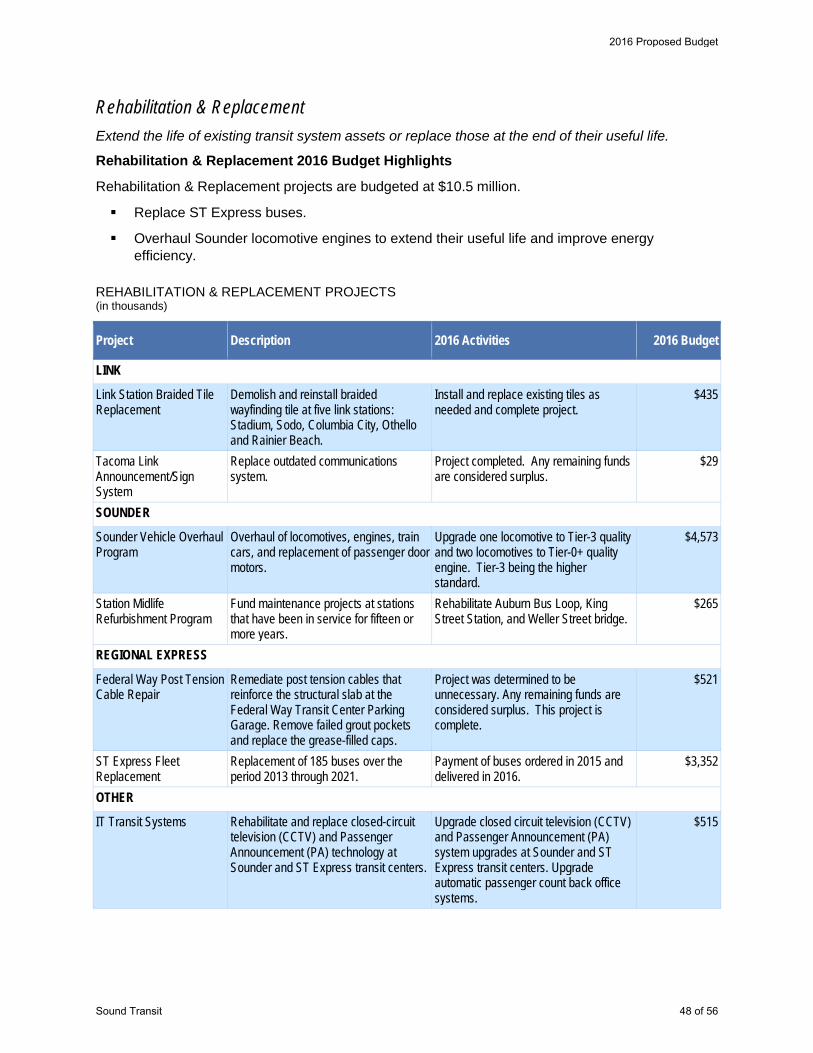
Rehabilitation & Replacement Extend the life of existing transit system assets or replace those at the end of their useful life.
Rehabilitation & Replacement 2016 Budget Highlights
Rehabilitation & Replacement projects are budgeted at $10.5 million.
Replace ST Express buses.
Overhaul Sounder locomotive engines to extend their useful life and improve energy efficiency.
REHABILITATION & REPLACEMENT PROJECTS (in thousands)
Project Description 2016 Activities 2016 Budget
LINK
Link Station Braided Tile Replacement
Demolish and reinstall braided wayfinding tile at five link stations: Stadium, Sodo, Columbia City, Othello and Rainier Beach.
Install and replace existing tiles as needed and complete project.
$435
Tacoma Link Announcement/Sign System
Replace outdated communications system.
Project completed. Any remaining funds are considered surplus.
$29
SOUNDER
Sounder Vehicle Overhaul Program
Overhaul of locomotives, engines, train cars, and replacement of passenger door motors.
Upgrade one locomotive to Tier-3 quality and two locomotives to Tier-0+ quality engine. Tier-3 being the higher standard.
$4,573
Station Midlife Refurbishment Program
Fund maintenance projects at stations that have been in service for fifteen or more years.
Rehabilitate Auburn Bus Loop, King Street Station, and Weller Street bridge.
$265
REGIONAL EXPRESS
Federal Way Post Tension Cable Repair
Remediate post tension cables that reinforce the structural slab at the Federal Way Transit Center Parking Garage. Remove failed grout pockets and replace the grease-filled caps.
Project was determined to be unnecessary. Any remaining funds are considered surplus. This project is complete.
$521
ST Express Fleet Replacement
Replacement of 185 buses over the period 2013 through 2021.
Payment of buses ordered in 2015 and delivered in 2016.
$3,352
OTHER
IT Transit Systems Rehabilitate and replace closed-circuit television (CCTV) and Passenger Announcement (PA) technology at Sounder and ST Express transit centers.
Upgrade closed circuit television (CCTV) and Passenger Announcement (PA) system upgrades at Sounder and ST Express transit centers. Upgrade automatic passenger count back office systems.
$515
2016 Proposed Budget
Sound Transit 48 of 56

Project Description 2016 Activities 2016 Budget
Small Works Program Repair or replace in-service assets when the total cost is less than $200,000.
Continue work in progress: Link OMF Entrance Gate Improvements, Canopy/Safety Cable Upgrades, Generator on Trailer for Sumner and Auburn, HVAC for Communications Room at Beacon Hill Station, and Wireless Microphone System for Sounder stations.
$856
Total Rehabilitation & Replacement $10,547 Administrative Support transit projects and operations indirectly including administrative infrastructure and overhead expenses.
2016 Budget Highlights
Administrative Projects are budgeted at $60.1 million and include projects to:
Continue implementation of enterprise asset management system and human resource information management systems.
Continue environmental monitoring and mitigation for several closed projects. ADMINISTRATIVE PROJECTS (in thousands)
Project Description 2016 Activities 2016 Budget
OTHER
Administrative Capital Maintain administrative facilities and purchase equipment or other assets to support administrative activities.
Procure and replace eight non-revenue administrative vehicles, replace asphalt shingle portion of Union Station roof, and procure furnishings for newly constructed maintenance of way building at the Link Operations & Maintenance Facility.
$762
Agency Administration Operating
Fund staff-related expenses that support projects and agency administration.
Fund department costs allocated to projects as administrative overhead that may be eligible for partial reimbursement from federal grants. Also, fund department costs that are unallocated.
$56,834
Environmental Mitigation, Monitoring & Maintenance
Monitor and maintain post-construction environmental mitigation including groundwater and plant establishment.
Monitor and maintain mitigation maintenance activities at Tukwila, McKinley Park, and Ashway.
$194
2016 Proposed Budget
Sound Transit 49 of 56

Project Description 2016 Activities 2016 Budget
Information Technology Program
Invest in IT hardware and software to improve productivity and ensure system integrity.
Continue design and implement Enterprise Asset Management System (EAMS), maintain agency IT infrastructure, finalize implementation of the Human Resource Information Management System (HRIMS), replace eBid (vendor solicitation) system, and begin development of Business Intelligence program.
$2,164
Surplus Property Disposition
Prepare agency-owned surplus property for sale. Includes properties not considered to have transit oriented development potential, due to size or location.
Prepare surplus properties for sale. $120
Total Administrative $60,074
2016 Proposed Budget
Sound Transit 50 of 56

Other Budgets For 2016, debt service costs of $121.8 million include interest, principal repayments, and financing fees. Cash donations to other governments are budgeted at $5.0 million. Reserves totaling $68.6 million will be set aside in 2016 but are not included in the spending authorization request.
Debt Service As of September 10, 2015, Sound Transit has $1.9 billion of outstanding long-term bonds. Bond proceeds finance construction of capital projects. Interest on long-term debt is capitalized to fixed assets to the extent that the underlying debt funds construction in progress; otherwise it is expensed.
Sound Transit executed a $1.0 billion (including premiums) bond sale which closed on September 10, 2015. The bond sale generated $601.1 million in new proceeds while $433.8 million refinanced previously issued debt, generating present value savings of over $30.0 million. $150.0 million of the new issue are variable interest rate bonds.
For 2016 debt service is budgeted at $121.8 million including:
$30.4 million of principal repayment
$91.1 million of capitalized interest
$0.3 million for financing expenses
Donations to Other Governments Sound Transit makes donations to other governments in the form of non-cash capital assets or cash contributions for operations and maintenance. A $5.0 million cash donation to the city of Seattle for First Hill Streetcar operating and maintenance expenses is budgeted for 2016 and annually through 2023.
Reserves Sound Transit maintains reserves in anticipation of future financial obligations. Amounts budgeted as reserves are not included in our spending authorization request. If reserved funds are to be used, the Board’s approval is required in advance.
$3.0 million contribution to the emergency/loss reserve to cover the retention/deductible in the event of an insured loss. Reserve balance is currently $11.9 million.
$5.6 million contribution to the insurance systemwide reserve, beginning in 2016, to partially pay for builders’ risk insurance in conjunction with funds provided by building contractors.
$60.0 million for an operating reserve consisting of two months of operating expenses consistent with the Board-adopted financial policies.
$300 million minimum reserve is maintained by the agency for unanticipated expenditures that may be necessary to keep the system in good working condition. In addition, the agency also maintains a forecast of the funds necessary to repair and replace existing assets to keep the regional transit system in a “state of good repair” consistent with industry standards. These long-term estimates are included in the agency’s long-term financial plan as a financial commitment. When such investments are identified as needed within the TIP time period, they are added to the budget and TIP as “repair and replacement” projects. The reserve balance is currently $306.4 million.
2016 Proposed Budget
Sound Transit 51 of 56
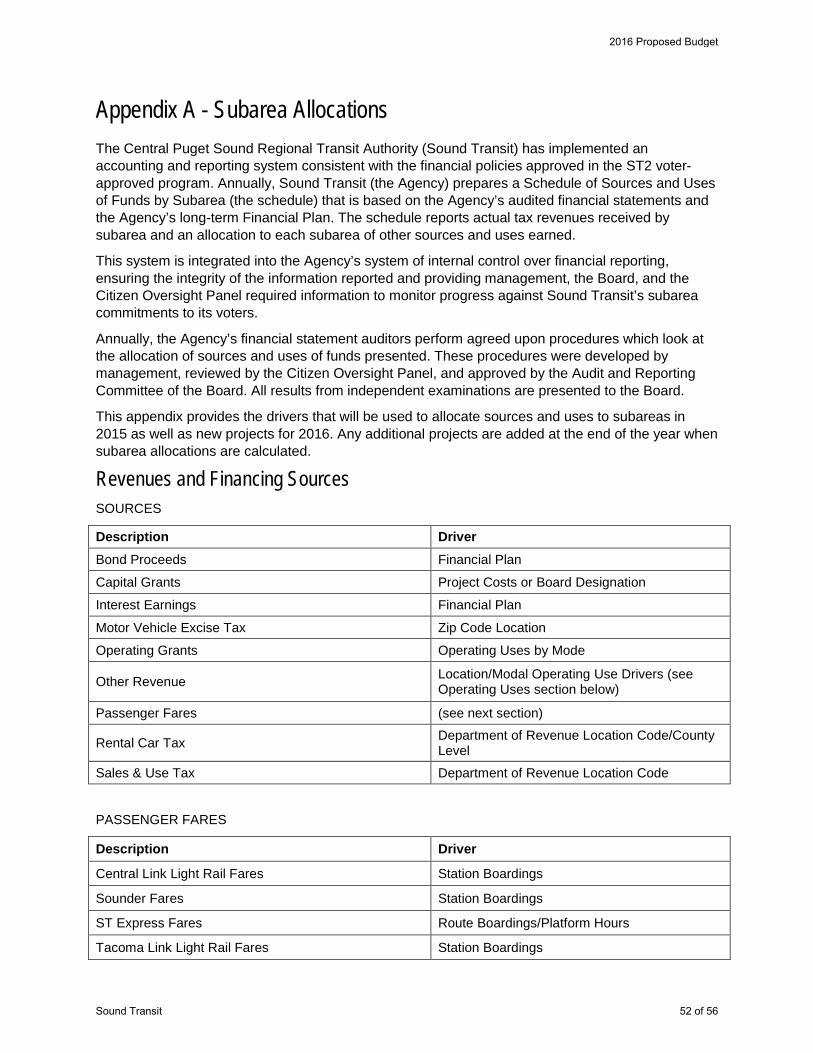
Appendix A - Subarea Allocations The Central Puget Sound Regional Transit Authority (Sound Transit) has implemented an accounting and reporting system consistent with the financial policies approved in the ST2 voter-approved program. Annually, Sound Transit (the Agency) prepares a Schedule of Sources and Uses of Funds by Subarea (the schedule) that is based on the Agency’s audited financial statements and the Agency’s long-term Financial Plan. The schedule reports actual tax revenues received by subarea and an allocation to each subarea of other sources and uses earned.
This system is integrated into the Agency’s system of internal control over financial reporting, ensuring the integrity of the information reported and providing management, the Board, and the Citizen Oversight Panel required information to monitor progress against Sound Transit’s subarea commitments to its voters.
Annually, the Agency’s financial statement auditors perform agreed upon procedures which look at the allocation of sources and uses of funds presented. These procedures were developed by management, reviewed by the Citizen Oversight Panel, and approved by the Audit and Reporting Committee of the Board. All results from independent examinations are presented to the Board.
This appendix provides the drivers that will be used to allocate sources and uses to subareas in 2015 as well as new projects for 2016. Any additional projects are added at the end of the year when subarea allocations are calculated.
Revenues and Financing Sources SOURCES
Description Driver Bond Proceeds Financial Plan
Capital Grants Project Costs or Board Designation
Interest Earnings Financial Plan
Motor Vehicle Excise Tax Zip Code Location
Operating Grants Operating Uses by Mode
Other Revenue Location/Modal Operating Use Drivers (see Operating Uses section below)
Passenger Fares (see next section)
Rental Car Tax Department of Revenue Location Code/County Level
Sales & Use Tax Department of Revenue Location Code
PASSENGER FARES
Description Driver
Central Link Light Rail Fares Station Boardings
Sounder Fares Station Boardings
ST Express Fares Route Boardings/Platform Hours
Tacoma Link Light Rail Fares Station Boardings
2016 Proposed Budget
Sound Transit 52 of 56

Operating Uses LINK LIGHT RAIL SERVICES OPERATING USES
Description Driver Central Link Operations Track Miles/Boardings
Tacoma Link Operations Location SOUNDER COMMUTER RAIL SERVICES OPERATING USES
Description Driver
BNSF North Line Track Miles
BNSF South Line Track Miles
All Other Sounder Operations Vehicle Miles ST EXPRESS SERVICES OPERATING USES
Description Driver Bus Operations Platform Hours
DSTT Operations Location OTHER USES
Description Driver
Art Maintenance Location
Other Expenses Location or Board Designation
Capital Project Uses (Outlays) System Expansion – Link Light Rail Projects Driver East Link Extension ST2 Adopted Financial Plan Location
Federal Way Transit Extension Location
First Hill Link Streetcar Location
Initial Segment 2009 Sound Move Reported Rules
Link Operations & Maintenance Satellite Facility ST2 Adopted Financial Plan
Lynnwood Link Extension ST2 Adopted Financial Plan
Northgate Link Extension Location
S. 200th Link Extension Location
Tacoma Link Expansion Location
University Link Extension Location System Expansion – Sounder Commuter Rail Projects Driver
D St-M St Track & Signal Location
2016 Proposed Budget
Sound Transit 53 of 56

System Expansion – Sounder Commuter Rail Projects Driver
Lakewood Station Improvements Location
M St.-Lakewood Track & Signal Location
Mukilteo Station, South Platform Location
Passenger Information System/CCTV Location
Point Defiance Bypass Location
Puyallup Station Improvements Location
Sounder South Expanded Service ST2 Adopted Financial Plan
Sounder ST2 Fleet Expansion ST2 Adopted Financial Plan
Sounder Yard & Shops Facility ST2 Adopted Financial Plan
Sounder Yard Expansion Track Miles
Sumner Station Improvements Location
Tacoma Trestle Track & Signal Location
Tukwila Station Location System Expansion – ST Express Projects Driver 85th Corridor, Kirkland Location
Bothell Transit Related Improvements Location
Federal Way Transit Center Location
I-90 Two-Way Transit & HOV Operations, Stage 3 Location
Kirkland Transit Center/3rd Location
ST Express Bus Base ST2 Adopted Financial Plan
ST Express Mid-Day Bus Storage Location System Expansion – Other Driver Central & East HCT Study Financial Policies
Fare Administration Financial Policies
Fare Collection Location
HCT Corridor Planning Studies Financial Policies
Research and Technology Financial Policies
South Corridor Alternatives Planning Location
ST3 Planning Financial Policies
STart Location Enhancement Projects Driver Bike Locker Program Location
Bus Maintenance Facility Platform Hours
Central Link Card Readers Boardings/Track Miles
2016 Proposed Budget
Sound Transit 54 of 56
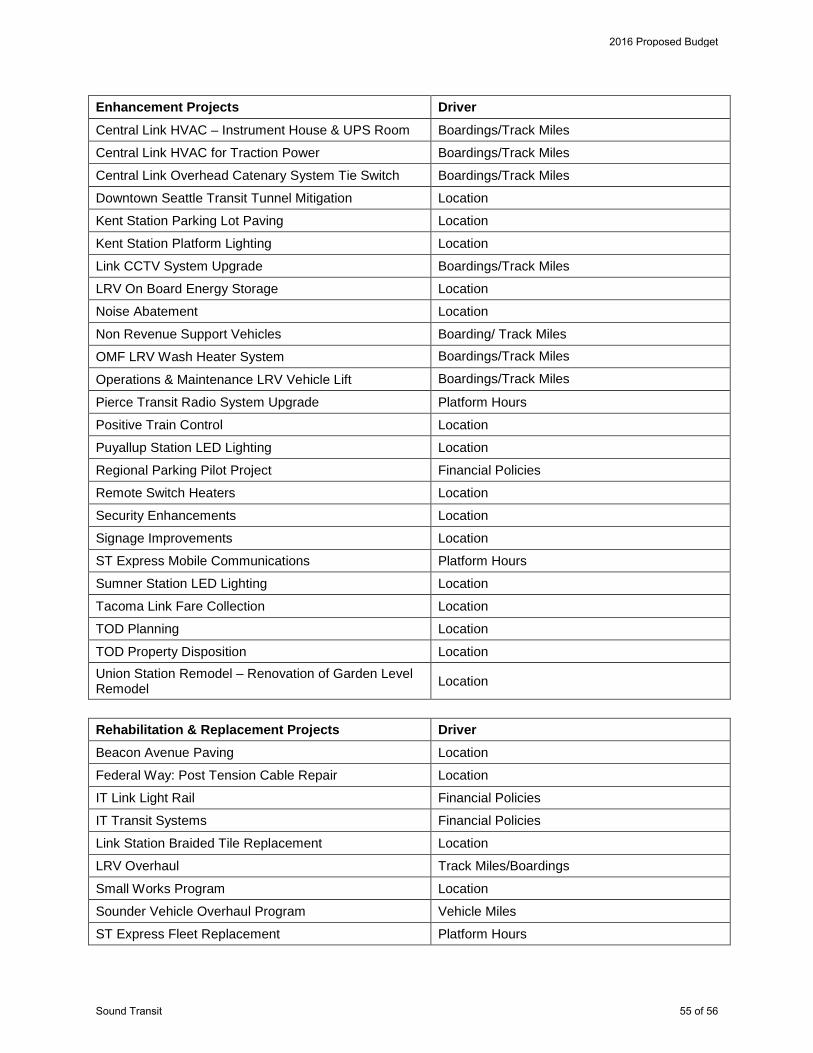
Enhancement Projects Driver Central Link HVAC – Instrument House & UPS Room Boardings/Track Miles
Central Link HVAC for Traction Power Boardings/Track Miles
Central Link Overhead Catenary System Tie Switch Boardings/Track Miles
Downtown Seattle Transit Tunnel Mitigation Location
Kent Station Parking Lot Paving Location
Kent Station Platform Lighting Location
Link CCTV System Upgrade Boardings/Track Miles
LRV On Board Energy Storage Location
Noise Abatement Location
Non Revenue Support Vehicles Boarding/ Track Miles
OMF LRV Wash Heater System Boardings/Track Miles
Operations & Maintenance LRV Vehicle Lift Boardings/Track Miles
Pierce Transit Radio System Upgrade Platform Hours
Positive Train Control Location
Puyallup Station LED Lighting Location
Regional Parking Pilot Project Financial Policies
Remote Switch Heaters Location
Security Enhancements Location
Signage Improvements Location
ST Express Mobile Communications Platform Hours
Sumner Station LED Lighting Location
Tacoma Link Fare Collection Location
TOD Planning Location
TOD Property Disposition Location Union Station Remodel – Renovation of Garden Level Remodel Location
Rehabilitation & Replacement Projects Driver Beacon Avenue Paving Location
Federal Way: Post Tension Cable Repair Location IT Link Light Rail Financial Policies
IT Transit Systems Financial Policies
Link Station Braided Tile Replacement Location
LRV Overhaul Track Miles/Boardings
Small Works Program Location Sounder Vehicle Overhaul Program Vehicle Miles
ST Express Fleet Replacement Platform Hours
2016 Proposed Budget
Sound Transit 55 of 56
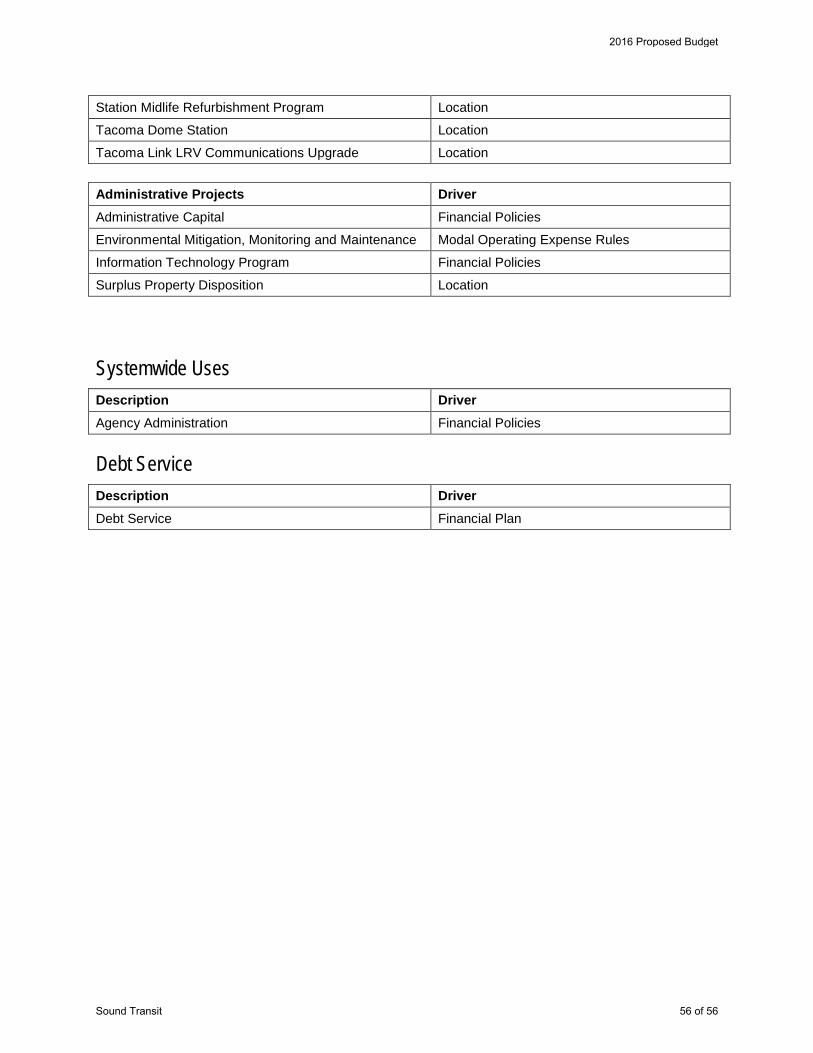
Station Midlife Refurbishment Program Location
Tacoma Dome Station Location
Tacoma Link LRV Communications Upgrade Location Administrative Projects Driver Administrative Capital Financial Policies
Environmental Mitigation, Monitoring and Maintenance Modal Operating Expense Rules
Information Technology Program Financial Policies
Surplus Property Disposition Location
Systemwide Uses Description Driver Agency Administration Financial Policies Debt Service Description Driver
Debt Service Financial Plan
2016 Proposed Budget
Sound Transit 56 of 56

Union Station 401 S. Jackson St. Seattle, WA 98104 1-888-889-6368 TTY Relay: 711 [email protected] soundtransit.org