proposed metallurgical coal mine woodhouse …
TRANSCRIPT
PROPOSED METALLURGICAL COAL MINE
WOODHOUSE COLLIERY
WHITEHAVEN
ADDENDUM TRANSPORT ASSESSMENT
AUGUST 2021
PROPOSED METALLURGICAL COAL MINE
WOODHOUSE COLLIERY
WHITEHAVEN
ADDENDUM TRANSPORT ASSESSMENT
AUGUST 2021
Project Code: BTP-2128
Issue Date: August 2021
Revision: A
Status: Final
Beacon Transport Planning LLP
Wyche Innovation Centre
Walwyn Road
Upper Colwall
Malvern
WR13 6PL
www.beacontransportplanning.co.uk
Proposed Metallurgical Coal Mine
Woodhouse Colliery, Whitehaven
Addendum Transport Assessment
List of Contents
Sections
1 Introduction ........................................................................................................................................ 1
2 Policy Context ..................................................................................................................................... 2
3 Base Conditions ................................................................................................................................... 3
4 Traffic Modelling ................................................................................................................................. 6
5 Operational Junction Assessment ..................................................................................................... 10
6 Updated Forecasts and Assessment ................................................................................................. 17
7 Summary ........................................................................................................................................... 18
8 Travel Plan Framework ..................................................................................................................... 19
9 Summary and Conclusion .................................................................................................................. 20
Tables
Table 3.1: Recorded Personal Injury Accidents for 2012-2016 & 2016-2020 .............................................. 4
Table 4.1: 2025 Peak Construction Trip Generation .................................................................................... 7
Table 4.2: 2025 Operational Trip Generation .............................................................................................. 8
Table 4.3: 2035 Operational Trip Generation .............................................................................................. 8
Table 5.1: 2025 Peak Construction – Junction Assessment Summary ....................................................... 11
Table 5.2: 2025 Operation – Junction Assessment Summary .................................................................... 13
Table 5.3: 2035 Operation – Junction Assessment Summary .................................................................... 15
Appendices
Appendix A: WCTM Technical Note
Appendix B: WCTM Traffic Forecast Diagrams
Appendix C: Junction Capacity Assessment Data
Proposed Metallurgical Coal Mine
Woodhouse Colliery, Whitehaven
Addendum Transport Assessment
Page 1
1 Introduction
1.1 This Addendum Transport Assessment (ATA) has been prepared on behalf of West Cumbria
Mining Ltd (WCM) in respect of development proposals for a metallurgical coal mine, known as
Woodhouse Colliery, at Whitehaven.
1.2 A planning application for the proposals was submitted to the Mineral Planning Authority
(MPA), Cumbria County Council (CCC), in May 2017 (MPA Ref. 4/17/9007) but was called in for
determination by the Secretary of State for Housing, Communities and Local Government on
11th March 2021 (PINS Ref APP/H0900/V/21/3271069). Following examination of the
Environmental Statement (ES) submitted in respect of the planning application, notification was
given by The Planning Inspectorate on 30th June 2021, on behalf of the Secretary of State and
pursuant to Regulation 22 of the 2011 EIA Regulations, that further information is required.
1.3 The Regulation 22 request for further information identifies that traffic modelling used to inform
the ES assessments was based upon peak construction occurring in 2019 and that a new peak
construction period should be identified and traffic reprofiled taking into account any new other
development that needs to be factored into the traffic modelling.
1.4 This ATA sets out the updated traffic modelling that has been undertaken, utilising new traffic
forecasts for the equivalent development scenarios previously assessed (peak construction,
scheme opening and scheme opening plus 10 years.) It accordingly presents an update to the
traffic impact elements of the transport assessment work presented in Chapter 8 – Road
Transport of the Environmental Statement prepared by AECOM in 2018 (‘the 2018 ES’.)
1.5 This ATA should be read in conjunction with the 2018 ES; each subsequent section of this ATA
revises the correspondingly titled section of the 2018 ES where appropriate.
Proposed Metallurgical Coal Mine
Woodhouse Colliery, Whitehaven
Addendum Transport Assessment
Page 2
2 Policy Context
National Planning Policy Framework (July 2021)
2.1 The National Planning Policy Framework (NPPF) sets out the Government’s policies in respect of
transport and development planning.
2.2 Section 9 of the NPPF (Promoting sustainable transport) states that it should be ensured that:
a) appropriate opportunities to promote sustainable transport modes can be – or have been
– taken up, given the type of development and its location;
b) safe and suitable access to the site can be achieved for all users;
c) the design of streets, parking areas, other transport elements reflects current national
guidance;
d) any significant impacts from the development on the transport network (in terms of
capacity and congestion), or on highway safety, can be cost effectively mitigated to an
acceptable degree (paragraph 110).
2.3 Sustainable transport modes are proposed to be taken up, through the transportation by rail of
all extracted and processed materials. Residual highway impacts are set out in this report.
2.4 The NPPF states that development should only be prevented or refused on highways grounds if
there would be an unacceptable impact on highway safety, or the residual cumulative impacts
on the road network would be severe (paragraph 111).
Cumbria Minerals and Waste Local Plan 2015-2030 (September 2017)
2.5 Policy DC1 (Traffic and transport) states that proposals for minerals and waste developments
should be located where they:
a. are well related to the strategic route network as defined in the Cumbria Local Transport
Plan, and/or
b. have potential for rail or waterborne transport and sustainable travel to work, and
c. minimise operational "minerals and waste road miles" where practicable.
2.6 The 2018 ES identifies that a key aspect of the development proposals is the ability to transport
coal away from the mine by rail and that this would ‘save’ 95,517 truck movements equalling 14
million road miles per annum. This however takes no accounts of the inbound trips for vehicles
(likely returning after a previous delivery); accounting for two-way movements, the ‘saving’
would be 28 million road miles per year.
Proposed Metallurgical Coal Mine
Woodhouse Colliery, Whitehaven
Addendum Transport Assessment
Page 3
3 Base Conditions
Site Accesses
3.1 The proposed access strategy, utilising existing accesses to the main part of the site along High
Road and to the Rail Loading Facility (RLF) along Mirehouse Road, remains unchanged.
Local Highway Network
3.2 To the south of the main site access, Wilson Pit Road is now subject to a 30mph speed limit;
traffic calming measures are provided in the form of carriageway narrowings (kerbed build-
outs.)
3.3 The junctions of Wilson Pit Road and Mirehouse Road with St Bees Road remain unchanged in
terms of their layout and operation but now have upgraded line markings (coloured central
hatching), bollards and lighting.
Existing Public Transport
3.4 The No.1 Lowca-Mirehouse bus service has been replaced by separate Lowca-Whitehaven
(No.1) and Mirehouse-Whitehaven (Nos. 3 and 3A) services, requiring a change at Whitehaven
to travel between Lowca and Mirehouse.
Future Public Transport
3.5 The previously identified NuGen scheme for Sellafield, including accommodation site and rail
platform at Mirehouse, is no longer proposed.
Reportable Injury Accidents
3.6 As the study area reported by the 2018 ES in respect of accidents is not identified, it is not
possible to undertake an equivalent updated analysis. Instead, a like-for-like comparative
analysis has been undertaken in respect of accidents recorded at each of the eight junctions
comprising the study area for the traffic modelling and operational assessment.
3.7 Road accident data has been obtained from CrashMap for the five-year period considered by the
2018 ES (2012-2016 inclusive) and the most recent five-year period for which data is currently
available (2016-2020 inclusive), as set out in Table 3.1.
Proposed Metallurgical Coal Mine
Woodhouse Colliery, Whitehaven
Addendum Transport Assessment
Page 4
Junction
No. of Personal Injury Accidents
Total (Slight/Serious/Fatal)
2012-2016 2016-2020
Egremont Road / Mirehouse Road 4 (4/0/0) 2 (2/0/0)
Egremont Road / Homewood Road 9 (8/1/0) 7 (5/2/0)
St Bees Road / Mirehouse Road 9 (9/0/0) 5 (4/1/0)
St Bees Road / Wilson Pit Road 2 (1/0/1) 1 (0/0/1)
Wilson Pit Road / High Road 0 (0/0/0) 0 (0/0/0)
Ginns-Kells Road / Meadow View 1 (1/0/0) 2 (2/0/0)
Preston Street / Coach Road 0 (0/0/0) 0 (0/0/0)
Main Site Access / High Road 0 (0/0/0) 0 (0/0/0)
TOTAL 25 (23/1/1) 17 (13/3/1)
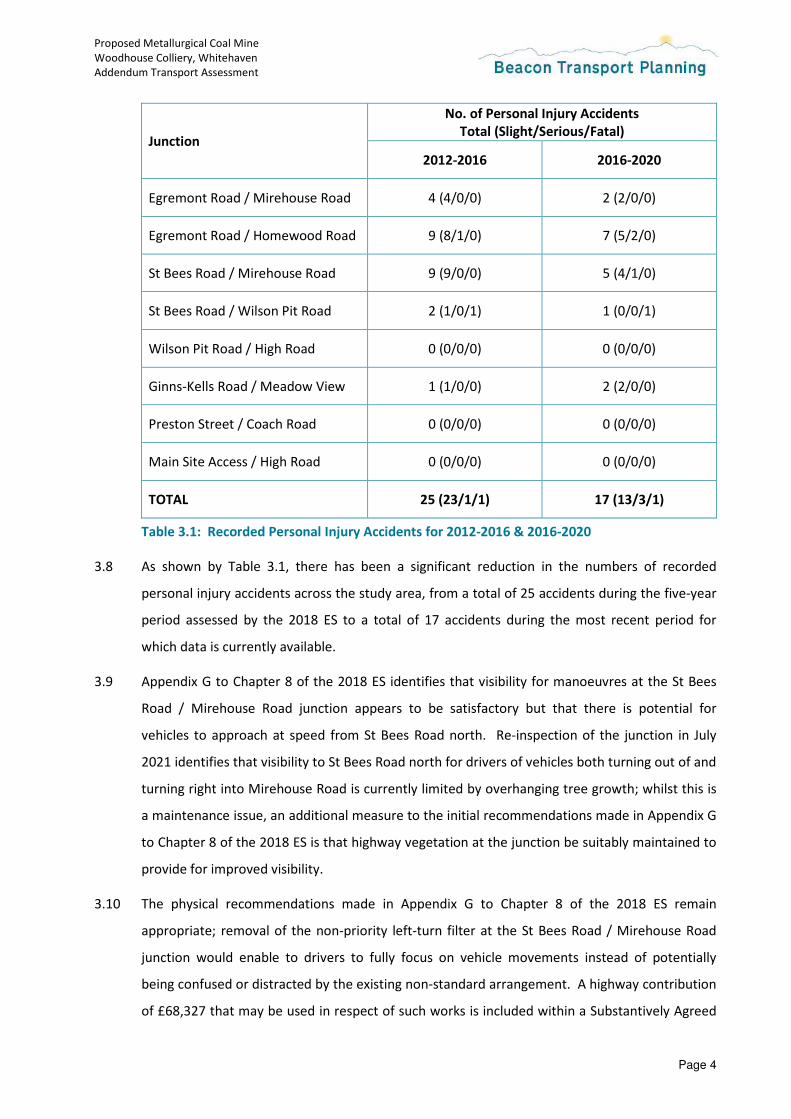
Table 3.1: Recorded Personal Injury Accidents for 2012-2016 & 2016-2020
3.8 As shown by Table 3.1, there has been a significant reduction in the numbers of recorded
personal injury accidents across the study area, from a total of 25 accidents during the five-year
period assessed by the 2018 ES to a total of 17 accidents during the most recent period for
which data is currently available.
3.9 Appendix G to Chapter 8 of the 2018 ES identifies that visibility for manoeuvres at the St Bees
Road / Mirehouse Road junction appears to be satisfactory but that there is potential for
vehicles to approach at speed from St Bees Road north. Re-inspection of the junction in July
2021 identifies that visibility to St Bees Road north for drivers of vehicles both turning out of and
turning right into Mirehouse Road is currently limited by overhanging tree growth; whilst this is
a maintenance issue, an additional measure to the initial recommendations made in Appendix G
to Chapter 8 of the 2018 ES is that highway vegetation at the junction be suitably maintained to
provide for improved visibility.
3.10 The physical recommendations made in Appendix G to Chapter 8 of the 2018 ES remain
appropriate; removal of the non-priority left-turn filter at the St Bees Road / Mirehouse Road
junction would enable to drivers to fully focus on vehicle movements instead of potentially
being confused or distracted by the existing non-standard arrangement. A highway contribution
of £68,327 that may be used in respect of such works is included within a Substantively Agreed

Proposed Metallurgical Coal Mine
Woodhouse Colliery, Whitehaven
Addendum Transport Assessment
Page 5
S106 Agreement dated 10th August 2021, this being in addition to a separate highway
contribution of £155,000 specified in respect of traffic calming.
Proposed Metallurgical Coal Mine
Woodhouse Colliery, Whitehaven
Addendum Transport Assessment
Page 6
4 Traffic Modelling
Overview
4.1 The approach to traffic modelling remains unchanged.
Modelling Methodology
4.2 The 2015 West Cumbria Traffic Model (WCTM) previously used was updated in 2019, with a
small extension to the model added in 2020. CCC’s consultants, Jacobs, have undertaken new
traffic modelling using the updated and revised model.
4.3 As previously, three development scenarios have been modelled, based on the peak
construction period and scheme opening now being forecast to occur in 2025:
• 2025 Construction (peak construction period);
• 2025 Operation (scheme opening year);
• 2035 Operation (scheme opening year plus 10 years).
4.4 2025 and 2035 Core (baseline) scenarios have also been modelled, these including all
development sites identified as ‘near certain’ and ‘more than likely’ and constrained traffic
growth factors using NTEM and NTM data. The same development sites and traffic growth
assumptions are included in the with-development scenarios.
4.5 The same eight hours have been modelled as previously, as reported within the Technical Note
(Jacobs, 30/07/21) provided in Appendix A to this report.
Trip Generation and Distribution
Peak Construction
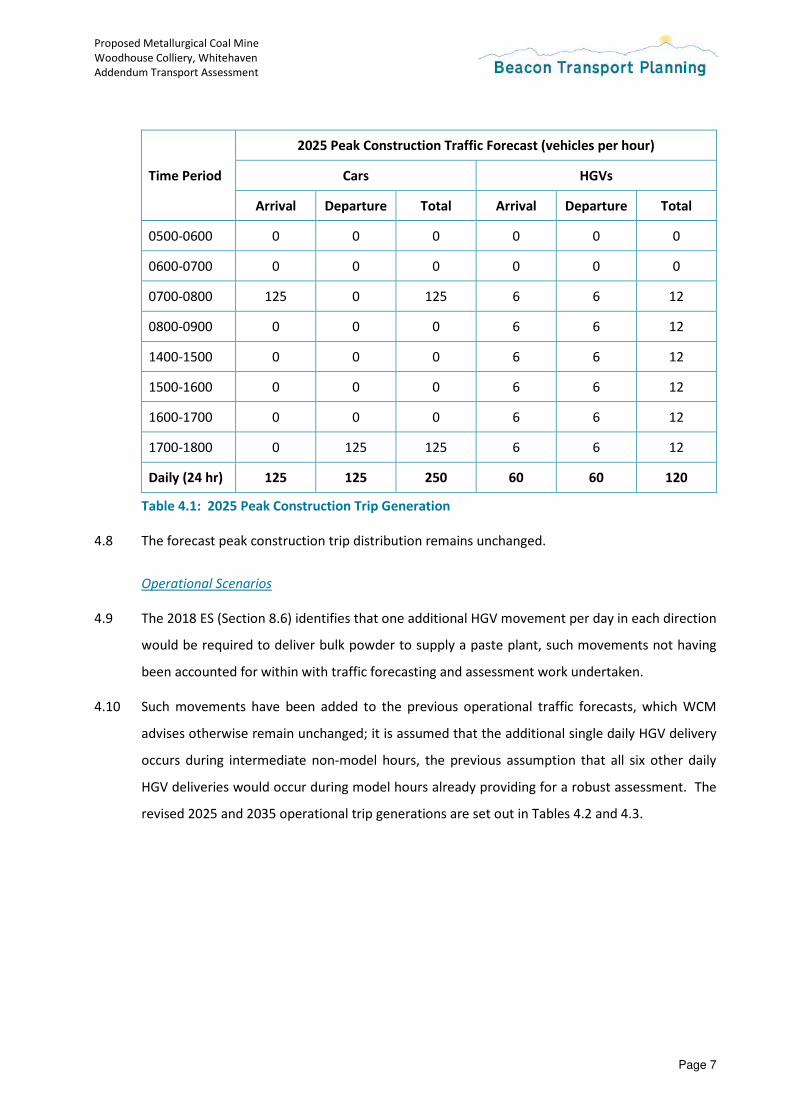
4.6 The 2018 ES (Section 8.6) identifies that one additional HGV movement per hour in each
direction may be required to remove contaminated soils from the site, such movements not
having been accounted for within with traffic forecasting and assessment work undertaken.
4.7 Such movements have been added to the previous construction traffic forecasts, which WCM
advises otherwise remain unchanged; it is assumed that the additional movements occur during
the same model hour periods as the other construction HGV movements already accounted for.
Additionally accounting for an error in the 2018 ES (which erroneously identifies a maximum of
43 instead of 50 HGV visits per day, further mis-stating the value in Table 8.4 to be 57 each
movements per day), the revised 2025 peak construction trip generation is set out in Table 4.1.
Proposed Metallurgical Coal Mine
Woodhouse Colliery, Whitehaven
Addendum Transport Assessment
Page 7
Time Period
2025 Peak Construction Traffic Forecast (vehicles per hour)
Cars HGVs
Arrival Departure Total Arrival Departure Total
0500-0600 0 0 0 0 0 0
0600-0700 0 0 0 0 0 0
0700-0800 125 0 125 6 6 12
0800-0900 0 0 0 6 6 12
1400-1500 0 0 0 6 6 12
1500-1600 0 0 0 6 6 12
1600-1700 0 0 0 6 6 12
1700-1800 0 125 125 6 6 12
Daily (24 hr) 125 125 250 60 60 120
Table 4.1: 2025 Peak Construction Trip Generation
4.8 The forecast peak construction trip distribution remains unchanged.
Operational Scenarios
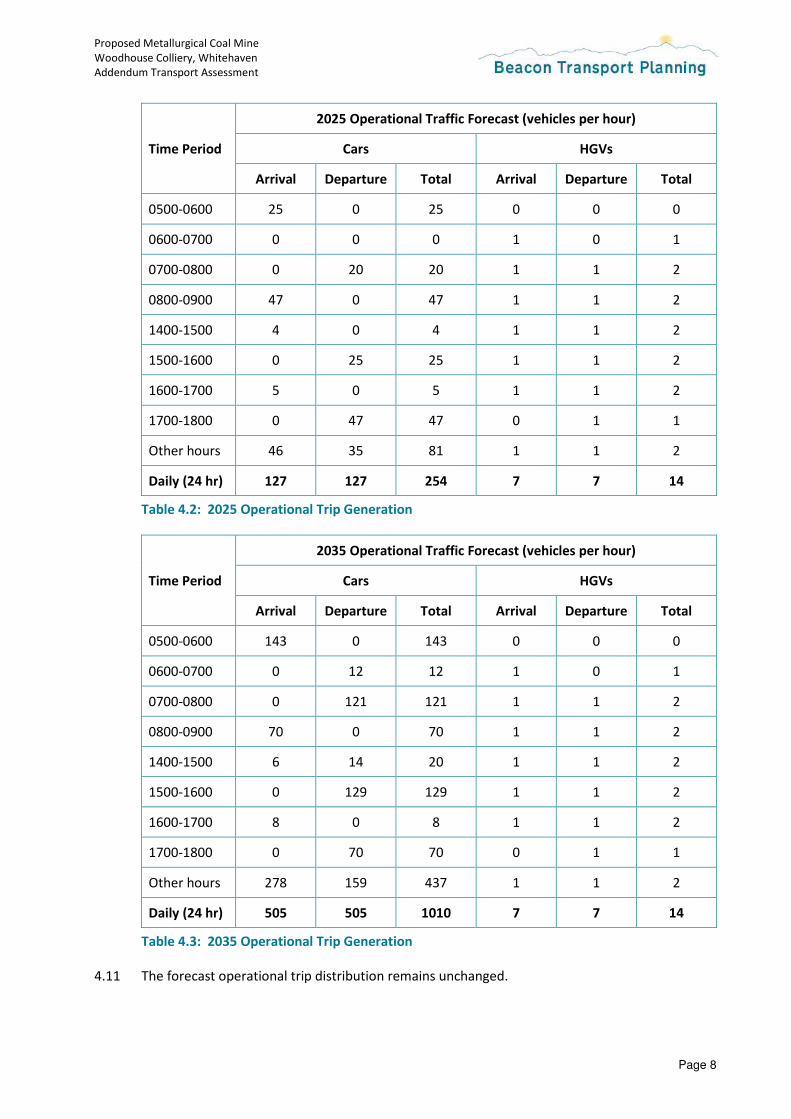
4.9 The 2018 ES (Section 8.6) identifies that one additional HGV movement per day in each direction
would be required to deliver bulk powder to supply a paste plant, such movements not having
been accounted for within with traffic forecasting and assessment work undertaken.
4.10 Such movements have been added to the previous operational traffic forecasts, which WCM
advises otherwise remain unchanged; it is assumed that the additional single daily HGV delivery
occurs during intermediate non-model hours, the previous assumption that all six other daily
HGV deliveries would occur during model hours already providing for a robust assessment. The
revised 2025 and 2035 operational trip generations are set out in Tables 4.2 and 4.3.
Proposed Metallurgical Coal Mine
Woodhouse Colliery, Whitehaven
Addendum Transport Assessment
Page 8
Time Period
2025 Operational Traffic Forecast (vehicles per hour)
Cars HGVs
Arrival Departure Total Arrival Departure Total
0500-0600 25 0 25 0 0 0
0600-0700 0 0 0 1 0 1
0700-0800 0 20 20 1 1 2
0800-0900 47 0 47 1 1 2
1400-1500 4 0 4 1 1 2
1500-1600 0 25 25 1 1 2
1600-1700 5 0 5 1 1 2
1700-1800 0 47 47 0 1 1
Other hours 46 35 81 1 1 2
Daily (24 hr) 127 127 254 7 7 14
Table 4.2: 2025 Operational Trip Generation
Time Period
2035 Operational Traffic Forecast (vehicles per hour)
Cars HGVs
Arrival Departure Total Arrival Departure Total
0500-0600 143 0 143 0 0 0
0600-0700 0 12 12 1 0 1
0700-0800 0 121 121 1 1 2
0800-0900 70 0 70 1 1 2
1400-1500 6 14 20 1 1 2
1500-1600 0 129 129 1 1 2
1600-1700 8 0 8 1 1 2
1700-1800 0 70 70 0 1 1
Other hours 278 159 437 1 1 2
Daily (24 hr) 505 505 1010 7 7 14
Table 4.3: 2035 Operational Trip Generation
4.11 The forecast operational trip distribution remains unchanged.
Proposed Metallurgical Coal Mine
Woodhouse Colliery, Whitehaven
Addendum Transport Assessment
Page 9
Study Area Junctions
4.12 The study area remains unchanged, comprising the following junctions:
1. Egremont Road / Mirehouse Road signal-controlled junction;
2. Egremont Road / Homewood Road roundabout;
3. St Bees Road / Mirehouse Road priority-controlled junction;
4. St Bees Road / Wilson Pit Road priority-controlled junction;
5. Wilson Pit Road / High Road priority-controlled junction;
6. Ginns-Kells / Meadow View priority-controlled junction;
7. Preston Street / Coach Road priority-controlled junction; and
8. Main Site Access / High Road priority-controlled junction.
Traffic Forecast
4.13 Updated traffic forecast diagrams, produced directly from the WCTM, are provided in Appendix
B. The reported values represent light and heavy vehicles (rather than equivalent Passenger Car
Units (PCUs) as calculated and reported in the 2018 ES.)
Proposed Metallurgical Coal Mine
Woodhouse Colliery, Whitehaven
Addendum Transport Assessment
Page 10
5 Operational Junction Assessment
Introduction
5.1 The operational junction capacity assessments previously undertaken and reported in the 2018
ES have been repeated using the updated traffic forecasts given by the WCTM for the new
assessment years.
5.2 The junction models previously prepared and used by AECOM have been obtained and
reutilised. In order to provide consistency with the previous assessment work, understood to
have been audited by CCC and Highways England, changes to the models have been kept to a
minimum (other than combining flow groups into single models for each junction to provide for
more efficient and accessible reporting.) The only exceptions to this are changes to the phases
and stages of the Egremont Road / Mirehouse Road signal-controlled junction (right turn
movements to Mirehouse Road not having previously been set to give way to oncoming traffic,
and the stage sequencing altered to match site observations) and corrections/improvements to
the format in which traffic flows at the other junctions are entered (the models previously
assuming default heavy vehicle percentages for flows erroneously entered as vehicles despite
the values representing PCUs.)
2025 Peak Construction
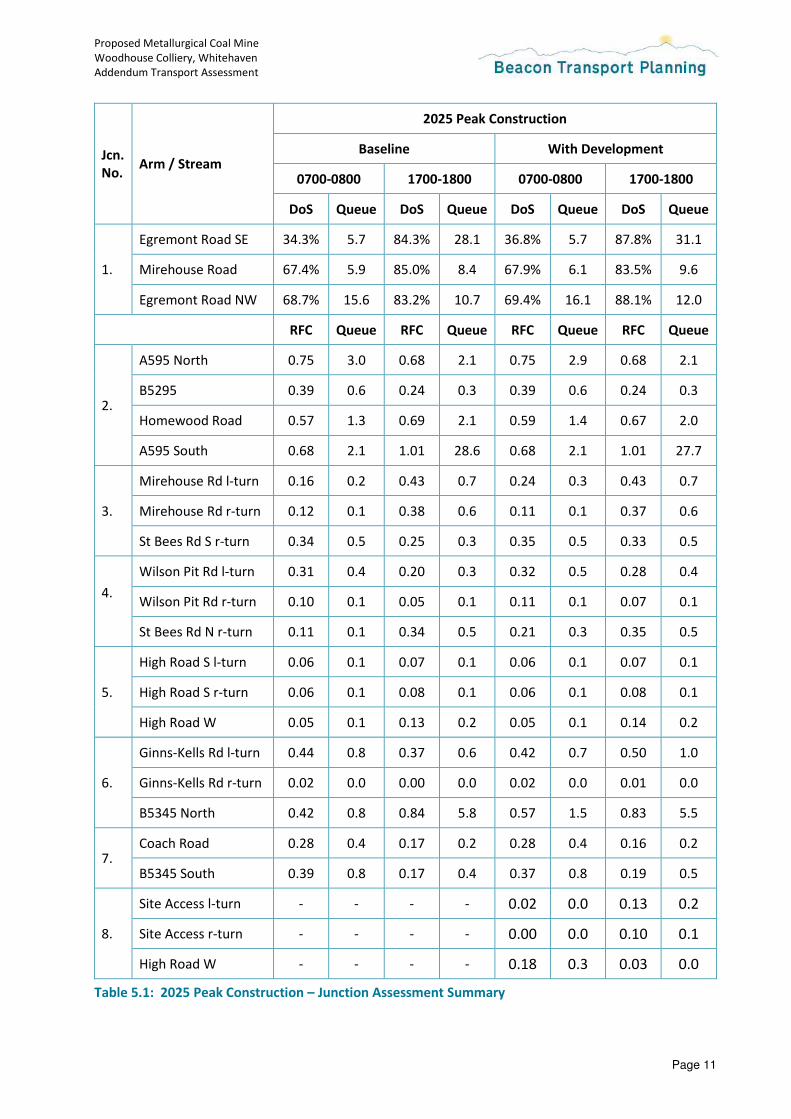
5.3 As previously, the peak hours assessed for the 2025 peak construction development scenario
are 0700-0800 and 1700-1800. Full details of the model inputs and outputs are provided in
Appendix C, with the results for the baseline and with-development scenarios summarised in
Table 5.1.
Proposed Metallurgical Coal Mine
Woodhouse Colliery, Whitehaven
Addendum Transport Assessment
Page 11
Jcn.
No. Arm / Stream
2025 Peak Construction
Baseline With Development
0700-0800 1700-1800 0700-0800 1700-1800
DoS Queue DoS Queue DoS Queue DoS Queue
1.
Egremont Road SE 34.3% 5.7 84.3% 28.1 36.8% 5.7 87.8% 31.1
Mirehouse Road 67.4% 5.9 85.0% 8.4 67.9% 6.1 83.5% 9.6
Egremont Road NW 68.7% 15.6 83.2% 10.7 69.4% 16.1 88.1% 12.0
RFC Queue RFC Queue RFC Queue RFC Queue
2.
A595 North 0.75 3.0 0.68 2.1 0.75 2.9 0.68 2.1
B5295 0.39 0.6 0.24 0.3 0.39 0.6 0.24 0.3
Homewood Road 0.57 1.3 0.69 2.1 0.59 1.4 0.67 2.0
A595 South 0.68 2.1 1.01 28.6 0.68 2.1 1.01 27.7
3.
Mirehouse Rd l-turn 0.16 0.2 0.43 0.7 0.24 0.3 0.43 0.7
Mirehouse Rd r-turn 0.12 0.1 0.38 0.6 0.11 0.1 0.37 0.6
St Bees Rd S r-turn 0.34 0.5 0.25 0.3 0.35 0.5 0.33 0.5
4.
Wilson Pit Rd l-turn 0.31 0.4 0.20 0.3 0.32 0.5 0.28 0.4
Wilson Pit Rd r-turn 0.10 0.1 0.05 0.1 0.11 0.1 0.07 0.1
St Bees Rd N r-turn 0.11 0.1 0.34 0.5 0.21 0.3 0.35 0.5
5.
High Road S l-turn 0.06 0.1 0.07 0.1 0.06 0.1 0.07 0.1
High Road S r-turn 0.06 0.1 0.08 0.1 0.06 0.1 0.08 0.1
High Road W 0.05 0.1 0.13 0.2 0.05 0.1 0.14 0.2
6.
Ginns-Kells Rd l-turn 0.44 0.8 0.37 0.6 0.42 0.7 0.50 1.0
Ginns-Kells Rd r-turn 0.02 0.0 0.00 0.0 0.02 0.0 0.01 0.0
B5345 North 0.42 0.8 0.84 5.8 0.57 1.5 0.83 5.5
7. Coach Road 0.28 0.4 0.17 0.2 0.28 0.4 0.16 0.2
B5345 South 0.39 0.8 0.17 0.4 0.37 0.8 0.19 0.5
8.
Site Access l-turn - - - - 0.02 0.0 0.13 0.2
Site Access r-turn - - - - 0.00 0.0 0.10 0.1
High Road W - - - - 0.18 0.3 0.03 0.0
Table 5.1: 2025 Peak Construction – Junction Assessment Summary
Proposed Metallurgical Coal Mine
Woodhouse Colliery, Whitehaven
Addendum Transport Assessment
Page 12
5.4 As set out in Table 5.1, most junctions are forecast to operate within usual design thresholds
(90% Degree of Saturation or 0.85 Ratio of Flow to Capacity) for both the baseline and with-
development scenarios. The only exception to this is the A595 south approach to the Egremont
Road / Homewood Road roundabout; it is forecast to reach capacity in the PM peak for the
baseline scenario, this remaining the case for the with-development scenario but with a slight
improvement in performance (there being a small reduction in forecast queues.)
2025 Operation
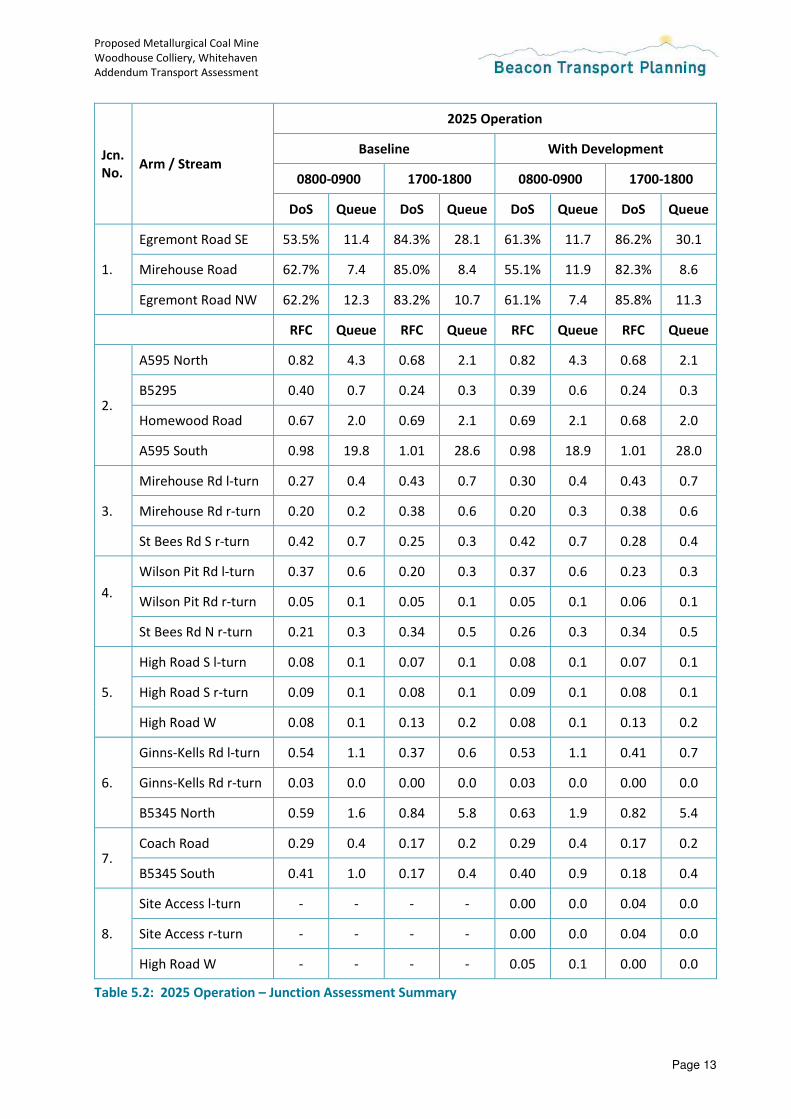
5.5 As previously, the peak hours assessed for the 2025 operational development scenario are 0800-
0900 and 1700-1800. Full details of the model inputs and outputs are provided in Appendix C,
with the results for the with and without development scenarios summarised in Table 5.2.
Proposed Metallurgical Coal Mine
Woodhouse Colliery, Whitehaven
Addendum Transport Assessment
Page 13
Jcn.
No. Arm / Stream
2025 Operation
Baseline With Development
0800-0900 1700-1800 0800-0900 1700-1800
DoS Queue DoS Queue DoS Queue DoS Queue
1.
Egremont Road SE 53.5% 11.4 84.3% 28.1 61.3% 11.7 86.2% 30.1
Mirehouse Road 62.7% 7.4 85.0% 8.4 55.1% 11.9 82.3% 8.6
Egremont Road NW 62.2% 12.3 83.2% 10.7 61.1% 7.4 85.8% 11.3
RFC Queue RFC Queue RFC Queue RFC Queue
2.
A595 North 0.82 4.3 0.68 2.1 0.82 4.3 0.68 2.1
B5295 0.40 0.7 0.24 0.3 0.39 0.6 0.24 0.3
Homewood Road 0.67 2.0 0.69 2.1 0.69 2.1 0.68 2.0
A595 South 0.98 19.8 1.01 28.6 0.98 18.9 1.01 28.0
3.
Mirehouse Rd l-turn 0.27 0.4 0.43 0.7 0.30 0.4 0.43 0.7
Mirehouse Rd r-turn 0.20 0.2 0.38 0.6 0.20 0.3 0.38 0.6
St Bees Rd S r-turn 0.42 0.7 0.25 0.3 0.42 0.7 0.28 0.4
4.
Wilson Pit Rd l-turn 0.37 0.6 0.20 0.3 0.37 0.6 0.23 0.3
Wilson Pit Rd r-turn 0.05 0.1 0.05 0.1 0.05 0.1 0.06 0.1
St Bees Rd N r-turn 0.21 0.3 0.34 0.5 0.26 0.3 0.34 0.5
5.
High Road S l-turn 0.08 0.1 0.07 0.1 0.08 0.1 0.07 0.1
High Road S r-turn 0.09 0.1 0.08 0.1 0.09 0.1 0.08 0.1
High Road W 0.08 0.1 0.13 0.2 0.08 0.1 0.13 0.2
6.
Ginns-Kells Rd l-turn 0.54 1.1 0.37 0.6 0.53 1.1 0.41 0.7
Ginns-Kells Rd r-turn 0.03 0.0 0.00 0.0 0.03 0.0 0.00 0.0
B5345 North 0.59 1.6 0.84 5.8 0.63 1.9 0.82 5.4
7. Coach Road 0.29 0.4 0.17 0.2 0.29 0.4 0.17 0.2
B5345 South 0.41 1.0 0.17 0.4 0.40 0.9 0.18 0.4
8.
Site Access l-turn - - - - 0.00 0.0 0.04 0.0
Site Access r-turn - - - - 0.00 0.0 0.04 0.0
High Road W - - - - 0.05 0.1 0.00 0.0
Table 5.2: 2025 Operation – Junction Assessment Summary
Proposed Metallurgical Coal Mine
Woodhouse Colliery, Whitehaven
Addendum Transport Assessment
Page 14
5.6 As set out in Table 5.2, most junctions are forecast to operate within usual design thresholds
(90% Degree of Saturation or 0.85 Ratio of Flow to Capacity) for both the baseline and with-
development scenarios. The only exception to this is the A595 south approach to the Egremont
Road / Homewood Road roundabout; it is forecast to reach capacity in the baseline scenario,
this remaining the case for the with-development scenario but with a slight improvement in
performance (there being a small reduction in forecast queues.)
2035 Operation
5.7 As previously, the peak hours assessed for the 2035 operational development scenario are 0800-
0900 and 1700-1800. Full details of the model inputs and outputs are provided in Appendix C,
with the results for the with and without development scenarios summarised in Table 5.3.

Proposed Metallurgical Coal Mine
Woodhouse Colliery, Whitehaven
Addendum Transport Assessment
Page 15
Jcn.
No. Arm / Stream
2035 Operation
Baseline With Development
0800-0900 1700-1800 0800-0900 1700-1800
DoS Queue DoS Queue DoS Queue DoS Queue
1.
Egremont Road SE 59.4% 13.4 89.4% 32.1 59.0% 12.6 91.5% 34.5
Mirehouse Road 73.8% 9.5 86.0% 9.5 77.2% 9.9 87.5% 10.9
Egremont Road NW 75.0% 19.7 89.4% 14.0 76.5% 19.6 91.5% 15.0
RFC Queue RFC Queue RFC Queue RFC Queue
2.
A595 North 0.90 7.8 0.74 2.8 0.88 6.5 0.74 2.8
B5295 0.50 1.0 0.30 0.4 0.49 0.9 0.30 0.4
Homewood Road 1.03 17.3 0.86 5.1 1.02 16.4 0.84 4.7
A595 South 1.01 25.3 1.00 25.6 1.01 25.1 1.00 26.0
3.
Mirehouse Rd l-turn 0.39 0.6 0.69 2.1 0.44 0.8 0.67 2.0
Mirehouse Rd r-turn 0.21 0.3 0.52 1.0 0.21 0.3 0.49 0.9
St Bees Rd S r-turn 0.64 1.7 0.36 0.6 0.64 1.7 0.41 0.7
4.
Wilson Pit Rd l-turn 0.65 1.8 0.33 0.5 0.65 1.8 0.38 0.6
Wilson Pit Rd r-turn 0.14 0.2 0.13 0.1 0.14 0.2 0.14 0.2
St Bees Rd N r-turn 0.35 0.5 0.60 1.5 0.41 0.7 0.60 1.5
5.
High Road S l-turn 0.10 0.1 0.08 0.1 0.10 0.1 0.08 0.1
High Road S r-turn 0.10 0.1 0.09 0.1 0.11 0.1 0.09 0.1
High Road W 0.10 0.2 0.14 0.3 0.10 0.2 0.14 0.3
6.
Ginns-Kells Rd l-turn 0.63 1.7 0.50 1.0 0.63 1.7 0.56 1.2
Ginns-Kells Rd r-turn 0.02 0.0 0.01 0.0 0.03 0.0 0.01 0.0
B5345 North 0.68 2.4 1.05 32.4 0.75 3.2 1.04 31.4
7. Coach Road 0.25 0.3 0.14 0.2 0.24 0.3 0.14 0.2
B5345 South 0.40 1.1 0.16 0.4 0.37 1.0 0.16 0.5
8.
Site Access l-turn - - - - 0.00 0.0 0.06 0.1
Site Access r-turn - - - - 0.00 0.0 0.07 0.1
High Road W - - - - 0.10 0.2 0.00 0.0
Table 5.3: 2035 Operation – Junction Assessment Summary
Proposed Metallurgical Coal Mine
Woodhouse Colliery, Whitehaven
Addendum Transport Assessment
Page 16
5.8 As set out in Table 5.3, most junctions are forecast to operate within usual design thresholds
(90% Degree of Saturation or 0.85 Ratio of Flow to Capacity) for both the baseline and with-
development scenarios. One exception is the Egremont Road / Mirehouse Road signal-
controlled junction, which is forecast to reach the design threshold in the PM peak for the with-
development scenario; it however remains forecast to operate substantially within actual
capacity, there being little difference in queues from the baseline scenario. Another exception is
the Egremont Road / Homewood Road roundabout, which is forecast to reach capacity in the
baseline scenario, this remaining the case for the with-development scenario but with a slight
improvement in performance (there being a small reduction in both saturations and forecast
queues.) A final exception is the Ginns-Kells Road / Meadow View junction, which is forecast to
reach capacity in the PM peak for the baseline scenario, this remaining the case for the with-
development scenario but with a slight improvement in performance (there being a small
reduction in both saturations and forecast queues.)
Proposed Metallurgical Coal Mine
Woodhouse Colliery, Whitehaven
Addendum Transport Assessment
Page 17
6 Updated Forecasts and Assessment
6.1 As set out in Section 4 of this report, the identified additional development traffic movements
that were identified by the 2018 ES but were not accounted for within with the traffic
forecasting and assessment work undertaken have been included within the updated forecasts
and assessments.
Process Change
6.2 Subsequent to the 2018 ES and as set out in an Addendum prepared by AECOM in April 2020
(‘the 2020 ES Addendum’), it was identified that a minor change to the proposed workings of
the Coal Handling and Processing Plant (CHPP) would enable premium metallurgical coal to be
produced without generating middlings coal as a by-product. As a result, instead of producing
2,430,000tpa of metallurgical coal plus 350,000tpa of middlings coal at full production, all
2,780,000tpa of the processed coal exported from the site would be metallurgical coal.
6.3 The process change would not alter the amount of coal exported from the site, which would all
be transported by rail in any case. It would also not alter the personnel numbers required to
operate the CHPP or the forecast development traffic movements during either the peak
construction or operational phases. On this basis, the 2020 ES Addendum concludes that the
process change has no material effect upon the impacts identified within the 2018 ES.
Proposed Metallurgical Coal Mine
Woodhouse Colliery, Whitehaven
Addendum Transport Assessment
Page 18
7 Summary
7.1 The updated junction capacity assessments undertaken indicate that the development proposals
will not have any material impacts upon the normal operation of the road network.
7.2 Most junctions are forecast to operate within usual design thresholds for all baseline and with-
development scenarios. The only exception for all scenarios is the Egremont Road / Homewood
Road roundabout; it is forecast to reach capacity for both baseline scenarios, this remaining the
case for the with-development scenarios but in all cases there being a slight improvement in
performance compared to the relevant baseline scenarios.
7.3 The Egremont Road / Mirehouse Road signal-controlled junction is forecast to reach the design
threshold in the PM peak for the 2035 Operational with-development scenario; it however
remains forecast to operate substantially within actual capacity, there being little difference in
queues from the baseline scenario.
7.4 The Ginns-Kells Road / Meadow View junction is forecast to reach capacity in the PM peak for
the 2035 Operational baseline scenario, this remaining the case for the with-development
scenario but with there being a slight improvement in performance compared to the baseline
scenario.

Proposed Metallurgical Coal Mine
Woodhouse Colliery, Whitehaven
Addendum Transport Assessment
Page 19
8 Travel Plan Framework
8.1 The proposed planning conditions include requirements for the submission, approval and
implementation of a Construction Travel Plan in respect of the construction phase of the
development and of an Operational Travel Plan in respect of the operational phase.
Proposed Metallurgical Coal Mine
Woodhouse Colliery, Whitehaven
Addendum Transport Assessment
Page 20
9 Summary and Conclusion
9.1 It remains concluded that the development proposals will not have any material impacts upon
the normal operation of the road network.
9.2 Having additional regard to highway safety, it remains considered that traffic movements
associated with the development proposals are able to be adequately accommodated by the
road network without need for mitigation. Notwithstanding this, it has been agreed that
highway contributions be secured in respect of minor junction improvements and traffic calming
works.
9.3 The development proposals continue to fully adhere to prevailing national and local transport
policy/guidance; in particular, sustainable transport modes are proposed to be taken up,
through the transportation by rail of all extracted and processed materials.
9.4 Having regard to NPPF guidance that development should only be prevented or refused on
highways grounds if there would be an unacceptable impact on highway safety or the residual
cumulative impacts on the road network would be severe, it is concluded that there are no
transportation or highways matters that preclude the granting of planning permission for the
development as proposed.

Appendix A: WCTM Technical Note
Technical Note
Rotterdam House
4th Floor
116 Quayside
Newcastle upon Tyne, NE1 3DY
United Kingdom
T +44 (0)191 206 4115
www.jacobs.com
1
Subject West Cumbria Mining Traffic
Modelling – Technical Note
Project Name West Cumbria Mining Traffic Modelling
From Jacobs
Date 30/07/21
West Cumbria Mining Traffic Modelling
1. Introduction
This technical note has been prepared by Jacobs in response to a request from Cumbria County Council
(CCC) to undertake transport modelling, using the West Cumbria Transport Model (WCTM), to assess
the transport impacts of West Cumbria Mining development on the road network.
2. Model Description and Forecast Networks
2.1 West Cumbria Transport Model
In 2019, CCC commissioned the update of the strategic transport model of West Cumbria, known as
the WCTM. The main objectives for the update of the WCTM were to:
• Update the model to base year 2019, incorporating mobile phone demand;
• To assess the construction and operation of new Sellafield developments on-site, satellite
offices and the movement of staff off-site, and park and ride locations;
• To assess the traffic benefits of the Whitehaven Relief Road at PCF Stage 2 and other potential
highway schemes; and
• To test the transport impacts of proposed Copeland Local Plan allocations and assess the
effectiveness of any associated transport infrastructure improvements.
An additional model update was undertaken in 2020 to provide more network and zone detail around
the village of Bothel on the A595 between Cockermouth and Carlisle. This was to enable the appraisal
of proposed improvements to the A595 in this area. The model including the Bothel extension has been
deemed suitable to assess the impacts of West Cumbria Mining on the road network. The demand from
the 2019 model will be uplifted using TEMPro to the forecast years discussed in the following section.
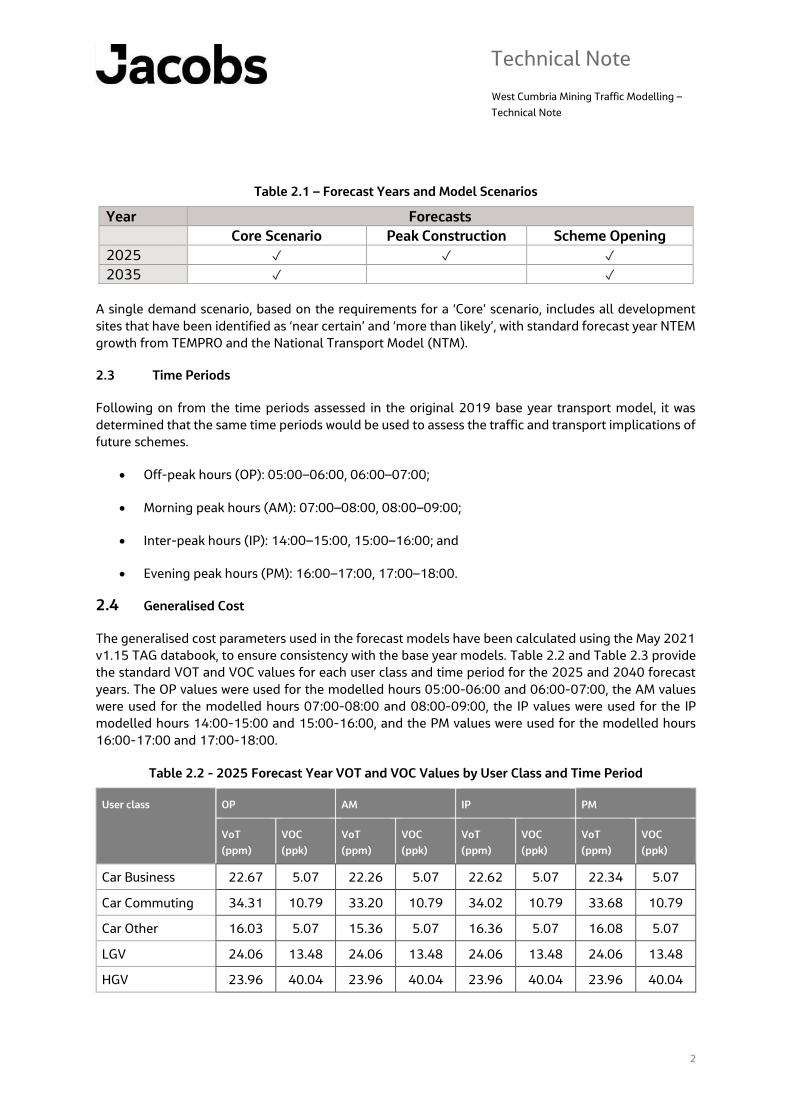
2.2 Forecast Years
Two forecast years have been assessed, 2025 and 2035 with demand matrices developed to reflect this.
The modelled forecasts for each year are shown in Table 2.1.
Technical Note
West Cumbria Mining Traffic Modelling –
Technical Note
2
Table 2.1 – Forecast Years and Model Scenarios
Year Forecasts
Core Scenario Peak Construction Scheme Opening
2025 ✓ ✓ ✓
2035 ✓ ✓
A single demand scenario, based on the requirements for a ‘Core’ scenario, includes all development
sites that have been identified as ‘near certain’ and ‘more than likely’, with standard forecast year NTEM
growth from TEMPRO and the National Transport Model (NTM).
2.3 Time Periods
Following on from the time periods assessed in the original 2019 base year transport model, it was
determined that the same time periods would be used to assess the traffic and transport implications of
future schemes.
• Off-peak hours (OP): 05:00–06:00, 06:00–07:00;
• Morning peak hours (AM): 07:00–08:00, 08:00–09:00;
• Inter-peak hours (IP): 14:00–15:00, 15:00–16:00; and
• Evening peak hours (PM): 16:00–17:00, 17:00–18:00.
2.4 Generalised Cost
The generalised cost parameters used in the forecast models have been calculated using the May 2021
v1.15 TAG databook, to ensure consistency with the base year models. Table 2.2 and Table 2.3 provide
the standard VOT and VOC values for each user class and time period for the 2025 and 2040 forecast
years. The OP values were used for the modelled hours 05:00-06:00 and 06:00-07:00, the AM values
were used for the modelled hours 07:00-08:00 and 08:00-09:00, the IP values were used for the IP
modelled hours 14:00-15:00 and 15:00-16:00, and the PM values were used for the modelled hours
16:00-17:00 and 17:00-18:00.
Table 2.2 - 2025 Forecast Year VOT and VOC Values by User Class and Time Period
User class OP AM IP PM
VoT
(ppm)
VOC
(ppk)
VoT
(ppm)
VOC
(ppk)
VoT
(ppm)
VOC
(ppk)
VoT
(ppm)
VOC
(ppk)
Car Business 22.67 5.07 22.26 5.07 22.62 5.07 22.34 5.07
Car Commuting 34.31 10.79 33.20 10.79 34.02 10.79 33.68 10.79
Car Other 16.03 5.07 15.36 5.07 16.36 5.07 16.08 5.07
LGV 24.06 13.48 24.06 13.48 24.06 13.48 24.06 13.48
HGV 23.96 40.04 23.96 40.04 23.96 40.04 23.96 40.04
Technical Note
West Cumbria Mining Traffic Modelling –
Technical Note
3
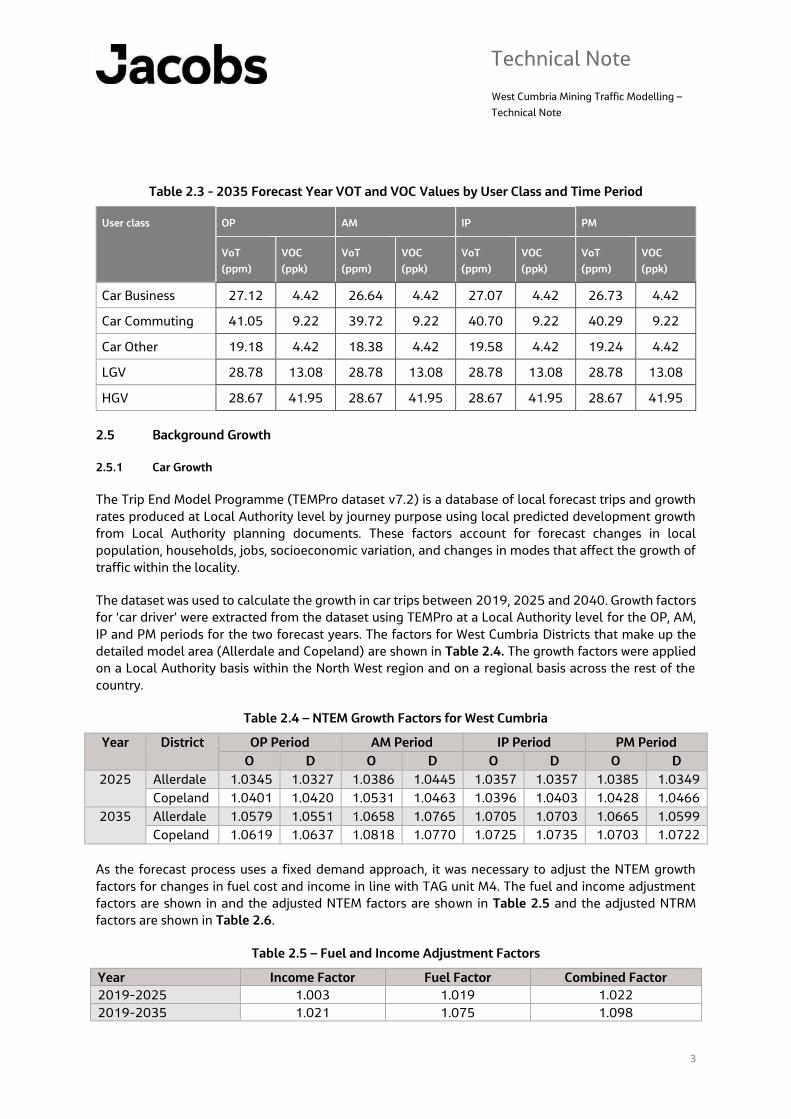
Table 2.3 - 2035 Forecast Year VOT and VOC Values by User Class and Time Period
User class OP AM IP PM
VoT
(ppm)
VOC
(ppk)
VoT
(ppm)
VOC
(ppk)
VoT
(ppm)
VOC
(ppk)
VoT
(ppm)
VOC
(ppk)
Car Business 27.12 4.42 26.64 4.42 27.07 4.42 26.73 4.42
Car Commuting 41.05 9.22 39.72 9.22 40.70 9.22 40.29 9.22
Car Other 19.18 4.42 18.38 4.42 19.58 4.42 19.24 4.42
LGV 28.78 13.08 28.78 13.08 28.78 13.08 28.78 13.08
HGV 28.67 41.95 28.67 41.95 28.67 41.95 28.67 41.95
2.5 Background Growth
2.5.1 Car Growth
The Trip End Model Programme (TEMPro dataset v7.2) is a database of local forecast trips and growth
rates produced at Local Authority level by journey purpose using local predicted development growth
from Local Authority planning documents. These factors account for forecast changes in local
population, households, jobs, socioeconomic variation, and changes in modes that affect the growth of
traffic within the locality.
The dataset was used to calculate the growth in car trips between 2019, 2025 and 2040. Growth factors
for ‘car driver’ were extracted from the dataset using TEMPro at a Local Authority level for the OP, AM,
IP and PM periods for the two forecast years. The factors for West Cumbria Districts that make up the
detailed model area (Allerdale and Copeland) are shown in Table 2.4. The growth factors were applied
on a Local Authority basis within the North West region and on a regional basis across the rest of the
country.
Table 2.4 – NTEM Growth Factors for West Cumbria
Year District OP Period AM Period IP Period PM Period
O D O D O D O D
2025 Allerdale 1.0345 1.0327 1.0386 1.0445 1.0357 1.0357 1.0385 1.0349
Copeland 1.0401 1.0420 1.0531 1.0463 1.0396 1.0403 1.0428 1.0466
2035 Allerdale 1.0579 1.0551 1.0658 1.0765 1.0705 1.0703 1.0665 1.0599
Copeland 1.0619 1.0637 1.0818 1.0770 1.0725 1.0735 1.0703 1.0722
As the forecast process uses a fixed demand approach, it was necessary to adjust the NTEM growth
factors for changes in fuel cost and income in line with TAG unit M4. The fuel and income adjustment
factors are shown in and the adjusted NTEM factors are shown in Table 2.5 and the adjusted NTRM
factors are shown in Table 2.6.
Table 2.5 – Fuel and Income Adjustment Factors
Year Income Factor Fuel Factor Combined Factor
2019-2025 1.003 1.019 1.022
2019-2035 1.021 1.075 1.098
Technical Note
West Cumbria Mining Traffic Modelling –
Technical Note
4
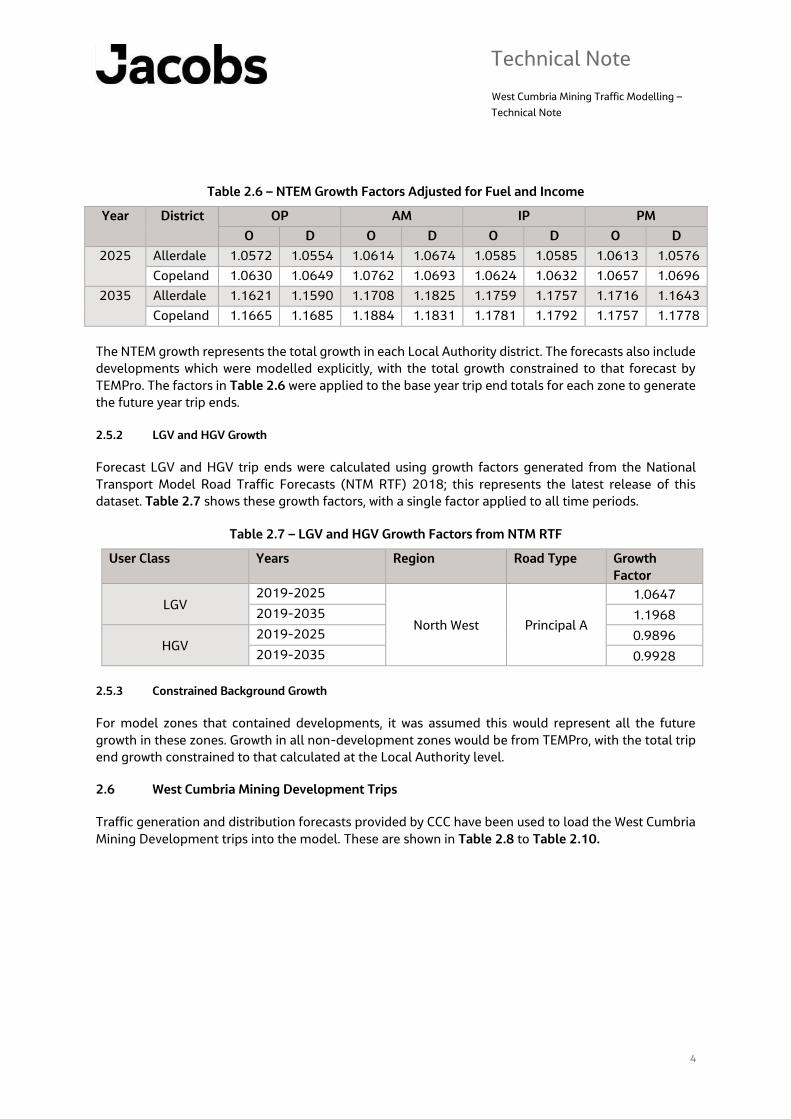
Table 2.6 – NTEM Growth Factors Adjusted for Fuel and Income
Year District OP AM IP PM
O D O D O D O D
2025 Allerdale 1.0572 1.0554 1.0614 1.0674 1.0585 1.0585 1.0613 1.0576
Copeland 1.0630 1.0649 1.0762 1.0693 1.0624 1.0632 1.0657 1.0696
2035 Allerdale 1.1621 1.1590 1.1708 1.1825 1.1759 1.1757 1.1716 1.1643
Copeland 1.1665 1.1685 1.1884 1.1831 1.1781 1.1792 1.1757 1.1778
The NTEM growth represents the total growth in each Local Authority district. The forecasts also include
developments which were modelled explicitly, with the total growth constrained to that forecast by
TEMPro. The factors in Table 2.6 were applied to the base year trip end totals for each zone to generate
the future year trip ends.
2.5.2 LGV and HGV Growth
Forecast LGV and HGV trip ends were calculated using growth factors generated from the National
Transport Model Road Traffic Forecasts (NTM RTF) 2018; this represents the latest release of this
dataset. Table 2.7 shows these growth factors, with a single factor applied to all time periods.
Table 2.7 – LGV and HGV Growth Factors from NTM RTF
User Class Years Region Road Type Growth
Factor
LGV 2019-2025
North West Principal A
1.0647
2019-2035 1.1968
HGV 2019-2025 0.9896
2019-2035 0.9928
2.5.3 Constrained Background Growth
For model zones that contained developments, it was assumed this would represent all the future
growth in these zones. Growth in all non-development zones would be from TEMPro, with the total trip
end growth constrained to that calculated at the Local Authority level.
2.6 West Cumbria Mining Development Trips
Traffic generation and distribution forecasts provided by CCC have been used to load the West Cumbria
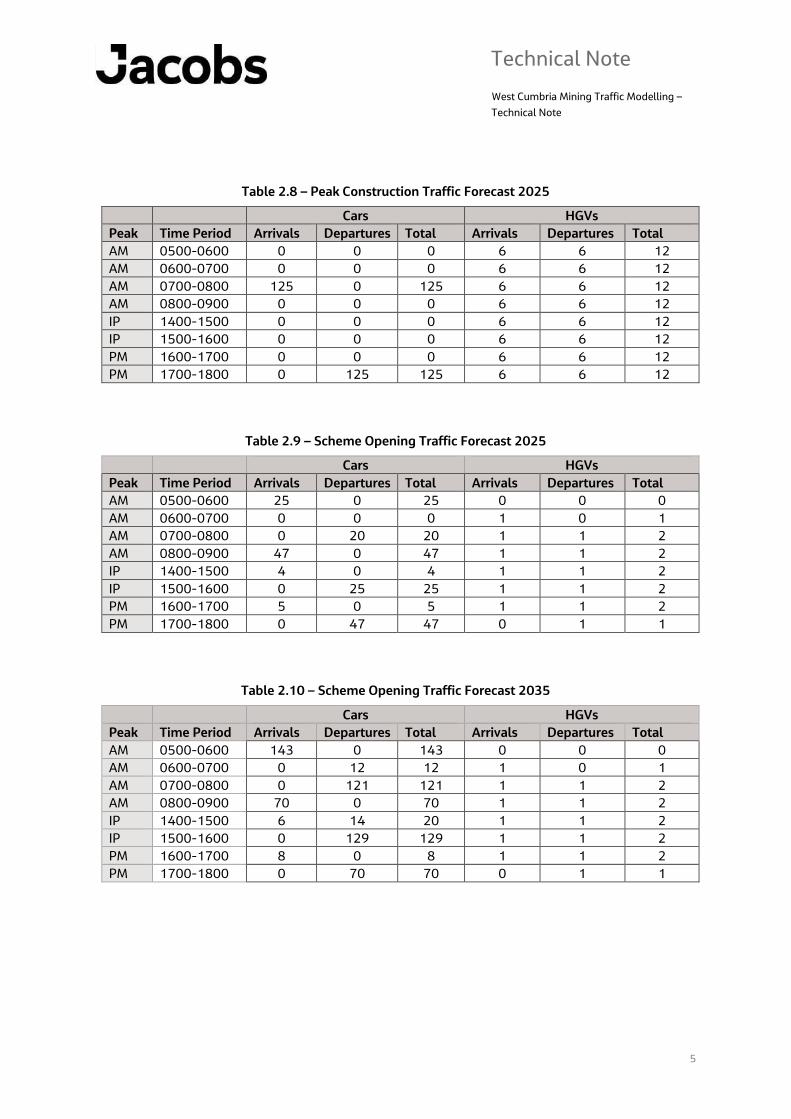
Mining Development trips into the model. These are shown in Table 2.8 to Table 2.10.
Technical Note
West Cumbria Mining Traffic Modelling –
Technical Note
5
Table 2.8 – Peak Construction Traffic Forecast 2025
Cars HGVs
Peak Time Period Arrivals Departures Total Arrivals Departures Total
AM 0500-0600 0 0 0 6 6 12
AM 0600-0700 0 0 0 6 6 12
AM 0700-0800 125 0 125 6 6 12
AM 0800-0900 0 0 0 6 6 12
IP 1400-1500 0 0 0 6 6 12
IP 1500-1600 0 0 0 6 6 12
PM 1600-1700 0 0 0 6 6 12
PM 1700-1800 0 125 125 6 6 12
Table 2.9 – Scheme Opening Traffic Forecast 2025
Cars HGVs
Peak Time Period Arrivals Departures Total Arrivals Departures Total
AM 0500-0600 25 0 25 0 0 0
AM 0600-0700 0 0 0 1 0 1
AM 0700-0800 0 20 20 1 1 2
AM 0800-0900 47 0 47 1 1 2
IP 1400-1500 4 0 4 1 1 2
IP 1500-1600 0 25 25 1 1 2
PM 1600-1700 5 0 5 1 1 2
PM 1700-1800 0 47 47 0 1 1
Table 2.10 – Scheme Opening Traffic Forecast 2035
Cars HGVs
Peak Time Period Arrivals Departures Total Arrivals Departures Total
AM 0500-0600 143 0 143 0 0 0
AM 0600-0700 0 12 12 1 0 1
AM 0700-0800 0 121 121 1 1 2
AM 0800-0900 70 0 70 1 1 2
IP 1400-1500 6 14 20 1 1 2
IP 1500-1600 0 129 129 1 1 2
PM 1600-1700 8 0 8 1 1 2
PM 1700-1800 0 70 70 0 1 1
Technical Note
West Cumbria Mining Traffic Modelling –
Technical Note
6
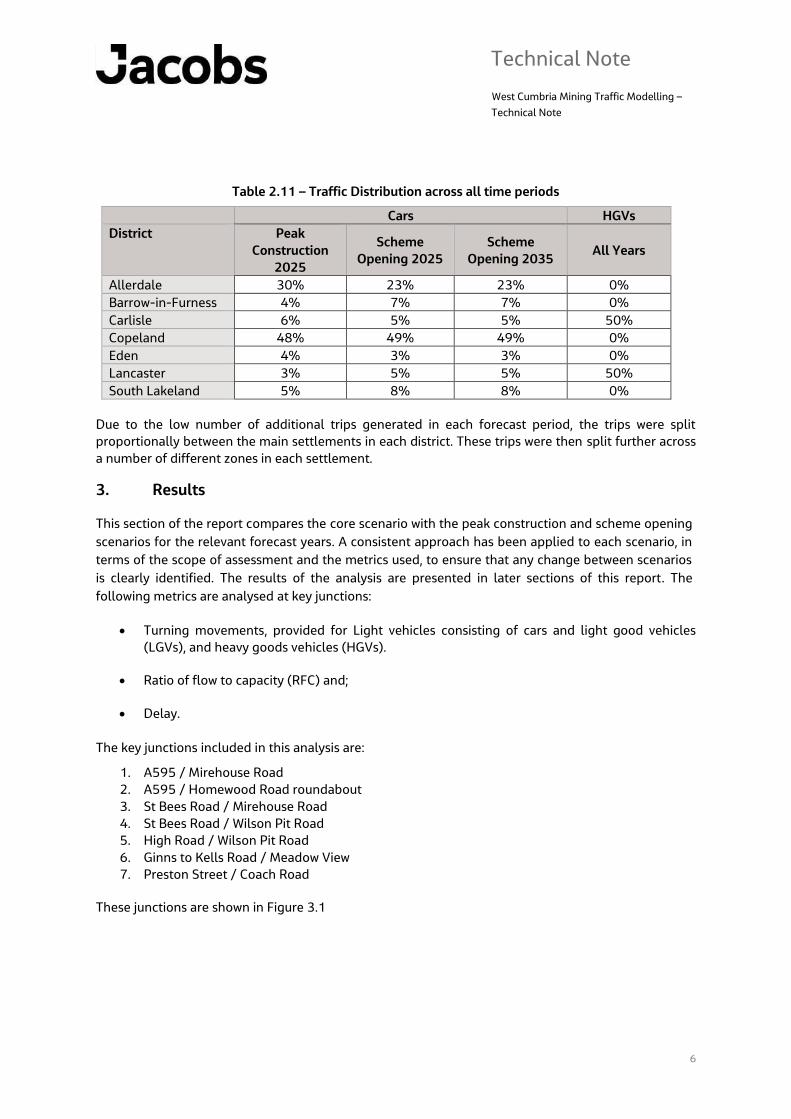
Table 2.11 – Traffic Distribution across all time periods
Cars HGVs
District Peak
Construction
2025
Scheme
Opening 2025
Scheme
Opening 2035 All Years
Allerdale 30% 23% 23% 0%
Barrow-in-Furness 4% 7% 7% 0%
Carlisle 6% 5% 5% 50%
Copeland 48% 49% 49% 0%
Eden 4% 3% 3% 0%
Lancaster 3% 5% 5% 50%
South Lakeland 5% 8% 8% 0%
Due to the low number of additional trips generated in each forecast period, the trips were split
proportionally between the main settlements in each district. These trips were then split further across
a number of different zones in each settlement.
3. Results
This section of the report compares the core scenario with the peak construction and scheme opening
scenarios for the relevant forecast years. A consistent approach has been applied to each scenario, in
terms of the scope of assessment and the metrics used, to ensure that any change between scenarios
is clearly identified. The results of the analysis are presented in later sections of this report. The
following metrics are analysed at key junctions:
• Turning movements, provided for Light vehicles consisting of cars and light good vehicles
(LGVs), and heavy goods vehicles (HGVs).
• Ratio of flow to capacity (RFC) and;
• Delay.
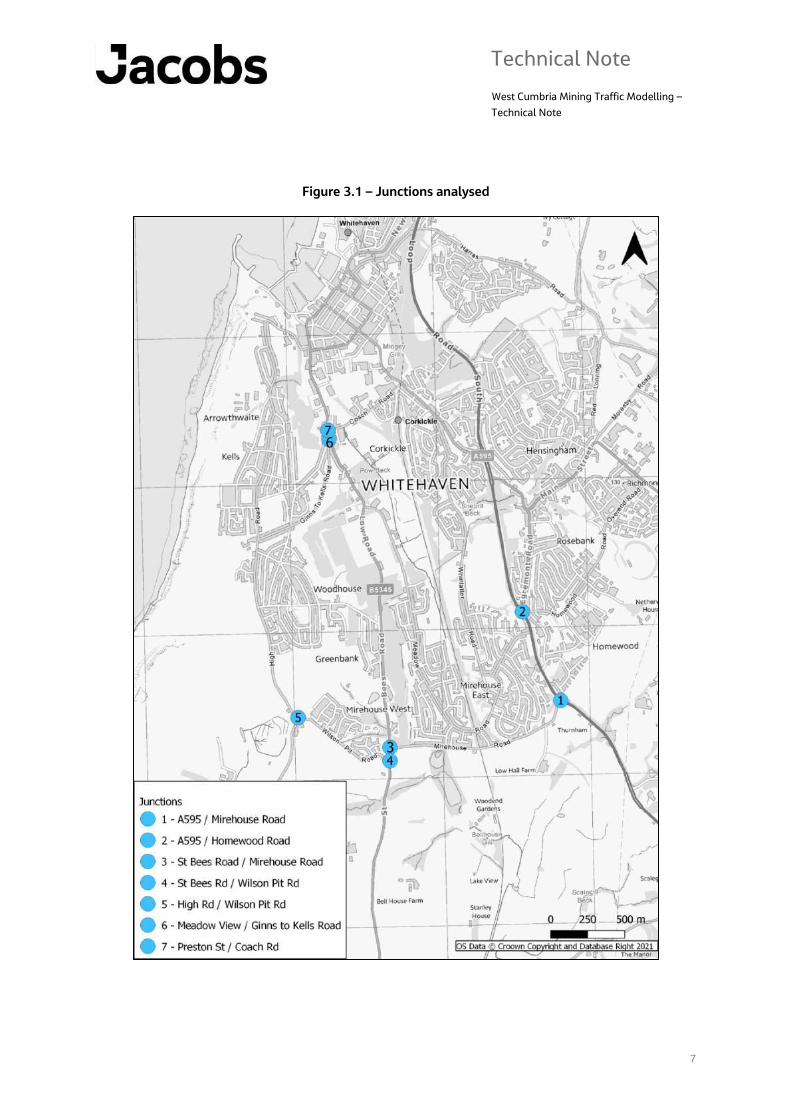
The key junctions included in this analysis are:
1. A595 / Mirehouse Road
2. A595 / Homewood Road roundabout
3. St Bees Road / Mirehouse Road
4. St Bees Road / Wilson Pit Road
5. High Road / Wilson Pit Road
6. Ginns to Kells Road / Meadow View
7. Preston Street / Coach Road
These junctions are shown in Figure 3.1
Technical Note
West Cumbria Mining Traffic Modelling –
Technical Note
7
Figure 3.1 – Junctions analysed

Technical Note
West Cumbria Mining Traffic Modelling –
Technical Note
8
3.1 Peak Construction 2025
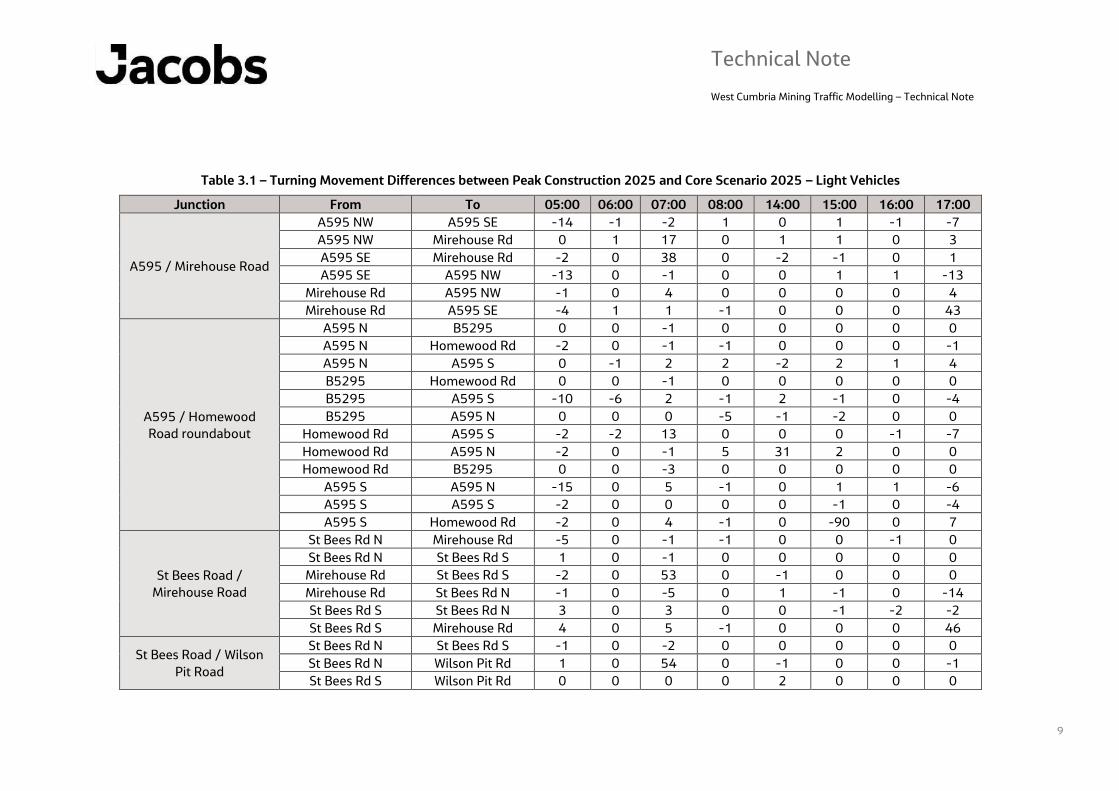
3.1.1 Turning movements impacts
The difference in car and light vehicle turning movements for each of the junctions between the peak
construction and core scenarios in 2025 is shown in Table 3.1. There are minimal changes in turning
movements at most junctions, and for arms which do experience larger changes in turning movements,
this only occurs during one time period and is therefore not an issue which is consistent throughout the
day.
Overall, the A595 / Mirehouse Road junction experiences minimal changes in turning movements. In
the peak construction scenario, there is a reduction of vehicles travelling along the A595 north west to
A595 south east during most time periods, with the largest reductions in the 05:00-06:00 time periods
and the 17:00-18:00 time period (14 and 7 fewer vehicles when compared to the core scenario
respectively). The opposite movement of A595 south east to A595 north west experiences similar
changes, again with the largest reduction in the same time periods (13 fewer vehicles during both peaks
when compared to the core scenario). The largest increase in vehicles at this junction are for the A595
south east to Mirehouse Road movement (increase of 38 vehicles in the 07:00-08:00 time period) and
the opposite movement in the 17:00-18:00 time period, where there are an additional 43 vehicles
compared to the core scenario.
The difference in vehicles travelling via the A595 / Homewood roundabout between the two scenarios
is generally small. There is an increase of 31 vehicles travelling from Homewood Road to the A595 north
during the 14:00-15:00 time period. There is also a large reduction of 90 vehicles travelling from the
A595 south to Homewood Road in the 15:00-16:00 time period.
At the St Bees Road / Mirehouse Road junction, there is an increase in 53 vehicles travelling from
Mirehouse Road to St Bees Road south in the 07:00-08:00 time period, and an increase in 46 vehicles
for the opposite movement in the 17:00-18:00 time period.
At the St Bees Road / Wilson Pit Road junction, there is an increase in 54 vehicles travelling from St Bees
Road north to Wilson Pit Road in the 07:00-08:00 time period, and an increase in 46 vehicles for the
opposite movement in the 17:00-18:00 time period.
At the High Road / Wilson Pit Road junction, there is an increase in 50 vehicles travelling from Wilson
Pit Road to Woodville Way in the 07:00-08:00 time period, and an increase in 51 vehicles for the
opposite movement in the 17:00-18:00 time period.
At the Ginns to Kells Road / Meadowview junction, there is an increase in 71 vehicles travelling from
B345 north to Ginns to Kells Road in the 07:00-08:00 time period, and an increase in 73 vehicles for
the opposite movement in the 17:00-18:00 time period.
At the Preston Street / Coach Road junction, there is an increase in 71 vehicles travelling from Preston
Street north to Preston Street south in the 07:00-08:00 time period, and an increase in 53 vehicles for
the opposite movement in the 17:00-18:00 time period.
Technical Note
West Cumbria Mining Traffic Modelling – Technical Note
9
Table 3.1 – Turning Movement Differences between Peak Construction 2025 and Core Scenario 2025 – Light Vehicles
Junction From To 05:00 06:00 07:00 08:00 14:00 15:00 16:00 17:00
A595 / Mirehouse Road
A595 NW A595 SE -14 -1 -2 1 0 1 -1 -7
A595 NW Mirehouse Rd 0 1 17 0 1 1 0 3
A595 SE Mirehouse Rd -2 0 38 0 -2 -1 0 1
A595 SE A595 NW -13 0 -1 0 0 1 1 -13
Mirehouse Rd A595 NW -1 0 4 0 0 0 0 4
Mirehouse Rd A595 SE -4 1 1 -1 0 0 0 43
A595 / Homewood
Road roundabout
A595 N B5295 0 0 -1 0 0 0 0 0
A595 N Homewood Rd -2 0 -1 -1 0 0 0 -1
A595 N A595 S 0 -1 2 2 -2 2 1 4
B5295 Homewood Rd 0 0 -1 0 0 0 0 0
B5295 A595 S -10 -6 2 -1 2 -1 0 -4
B5295 A595 N 0 0 0 -5 -1 -2 0 0
Homewood Rd A595 S -2 -2 13 0 0 0 -1 -7
Homewood Rd A595 N -2 0 -1 5 31 2 0 0
Homewood Rd B5295 0 0 -3 0 0 0 0 0
A595 S A595 N -15 0 5 -1 0 1 1 -6
A595 S A595 S -2 0 0 0 0 -1 0 -4
A595 S Homewood Rd -2 0 4 -1 0 -90 0 7
St Bees Road /
Mirehouse Road
St Bees Rd N Mirehouse Rd -5 0 -1 -1 0 0 -1 0
St Bees Rd N St Bees Rd S 1 0 -1 0 0 0 0 0
Mirehouse Rd St Bees Rd S -2 0 53 0 -1 0 0 0
Mirehouse Rd St Bees Rd N -1 0 -5 0 1 -1 0 -14
St Bees Rd S St Bees Rd N 3 0 3 0 0 -1 -2 -2
St Bees Rd S Mirehouse Rd 4 0 5 -1 0 0 0 46
St Bees Road / Wilson
Pit Road
St Bees Rd N St Bees Rd S -1 0 -2 0 0 0 0 0
St Bees Rd N Wilson Pit Rd 1 0 54 0 -1 0 0 -1
St Bees Rd S Wilson Pit Rd 0 0 0 0 2 0 0 0

Technical Note
West Cumbria Mining Traffic Modelling –
Technical Note
10
Junction From To 05:00 06:00 07:00 08:00 14:00 15:00 16:00 17:00
St Bees Rd S St Bees Rd N -1 0 0 0 0 -1 -2 -2
Wilson Pit Rd St Bees Rd N 8 0 8 -1 0 0 0 46
Wilson Pit Rd St Bees Rd S -14 0 0 0 0 0 1 5
High Road / Wilson Pit
Road
Woodville Way Wilson Pit Rd -5 0 5 -1 0 0 0 51
Woodville Way High Rd 0 0 -1 0 0 0 0 0
Wilson Pit Rd High Rd 0 0 1 0 0 0 0 0
Wilson Pit Rd Woodville Way 0 0 50 0 0 0 0 -1
High Rd Woodville Way -1 0 0 0 0 0 0 0
High Rd Wilson Pit Rd -1 0 0 0 0 0 0 0
Ginns to Kells Road /
Meadow View
B345 N B345 S -2 -1 -4 -1 0 -2 0 -2
B345 N Ginns to Kells Rd -5 -1 71 0 -1 1 -2 4
B345 S Ginns to Kells Rd 0 0 0 0 0 0 0 0
B345 S B345 N 0 0 -2 0 0 -1 -2 -17
Ginns to Kells Rd B345 N -7 0 -13 -2 0 -2 -3 73
Ginns to Kells Rd B345 S 0 0 0 0 0 0 0 0
Preston Street / Coach
Road
Preston St N Coach Rd -2 0 0 3 -2 -1 0 0
Preston St N Preston St S -3 -1 71 0 0 -2 -2 -3
Coach Rd Preston St S -4 0 -5 -1 -1 1 0 6
Coach Rd Preston St N -1 0 -2 0 -1 0 0 -5
Preston St S Preston St N -3 0 -1 1 2 -3 -5 53
Preston St S Coach Rd -3 0 -14 -3 -2 0 0 2
Technical Note
West Cumbria Mining Traffic Modelling –
Technical Note
11
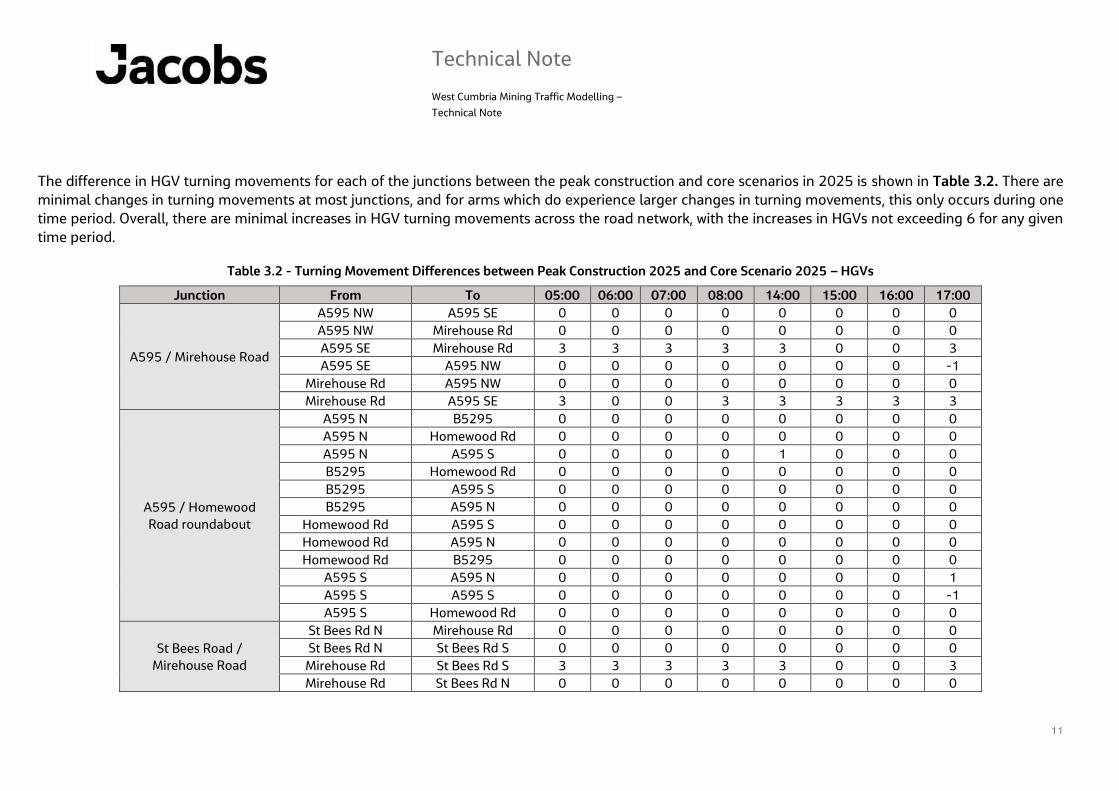
The difference in HGV turning movements for each of the junctions between the peak construction and core scenarios in 2025 is shown in Table 3.2. There are
minimal changes in turning movements at most junctions, and for arms which do experience larger changes in turning movements, this only occurs during one
time period. Overall, there are minimal increases in HGV turning movements across the road network, with the increases in HGVs not exceeding 6 for any given
time period.
Table 3.2 - Turning Movement Differences between Peak Construction 2025 and Core Scenario 2025 – HGVs
Junction From To 05:00 06:00 07:00 08:00 14:00 15:00 16:00 17:00
A595 / Mirehouse Road
A595 NW A595 SE 0 0 0 0 0 0 0 0
A595 NW Mirehouse Rd 0 0 0 0 0 0 0 0
A595 SE Mirehouse Rd 3 3 3 3 3 0 0 3
A595 SE A595 NW 0 0 0 0 0 0 0 -1
Mirehouse Rd A595 NW 0 0 0 0 0 0 0 0
Mirehouse Rd A595 SE 3 0 0 3 3 3 3 3
A595 / Homewood
Road roundabout
A595 N B5295 0 0 0 0 0 0 0 0
A595 N Homewood Rd 0 0 0 0 0 0 0 0
A595 N A595 S 0 0 0 0 1 0 0 0
B5295 Homewood Rd 0 0 0 0 0 0 0 0
B5295 A595 S 0 0 0 0 0 0 0 0
B5295 A595 N 0 0 0 0 0 0 0 0
Homewood Rd A595 S 0 0 0 0 0 0 0 0
Homewood Rd A595 N 0 0 0 0 0 0 0 0
Homewood Rd B5295 0 0 0 0 0 0 0 0
A595 S A595 N 0 0 0 0 0 0 0 1
A595 S A595 S 0 0 0 0 0 0 0 -1
A595 S Homewood Rd 0 0 0 0 0 0 0 0
St Bees Road /
Mirehouse Road
St Bees Rd N Mirehouse Rd 0 0 0 0 0 0 0 0
St Bees Rd N St Bees Rd S 0 0 0 0 0 0 0 0
Mirehouse Rd St Bees Rd S 3 3 3 3 3 0 0 3
Mirehouse Rd St Bees Rd N 0 0 0 0 0 0 0 0

Technical Note
West Cumbria Mining Traffic Modelling –
Technical Note
12
Junction From To 05:00 06:00 07:00 08:00 14:00 15:00 16:00 17:00
St Bees Rd S St Bees Rd N 0 0 0 0 0 0 0 0
St Bees Rd S Mirehouse Rd 3 0 0 3 3 3 3 3
St Bees Road / Wilson
Pit Road
St Bees Rd N St Bees Rd S 0 0 0 0 0 0 0 0
St Bees Rd N Wilson Pit Rd 3 3 3 3 3 0 0 3
St Bees Rd S Wilson Pit Rd 0 0 0 0 0 3 3 0
St Bees Rd S St Bees Rd N 0 0 0 0 0 0 0 0
Wilson Pit Rd St Bees Rd N 3 0 0 3 3 3 3 3
Wilson Pit Rd St Bees Rd S 0 0 3 0 0 0 0 0
High Road / Wilson Pit
Road
Woodville Way Wilson Pit Rd 3 0 3 3 3 3 3 3
Woodville Way High Rd 0 0 0 0 0 0 0 0
Wilson Pit Rd High Rd 0 0 0 0 0 0 0 0
Wilson Pit Rd Woodville Way 3 3 3 3 3 3 3 3
High Rd Woodville Way 0 0 0 0 0 0 0 0
High Rd Wilson Pit Rd 0 0 0 0 0 0 0 0
Ginns to Kells Road /
Meadow View
B345 N B345 S 0 0 0 0 0 0 0 0
B345 N Ginns to Kells Rd 3 3 3 3 3 3 3 3
B345 S Ginns to Kells Rd 0 0 0 0 0 0 0 0
B345 S B345 N 0 0 0 0 0 0 0 0
Ginns to Kells Rd B345 N 3 6 3 3 3 3 3 3
Ginns to Kells Rd B345 S 0 0 0 0 0 0 0 0
Preston Street / Coach
Road
Preston St N Coach Rd 0 0 0 0 0 0 0 0
Preston St N Preston St S 0 3 3 3 3 3 3 3
Coach Rd Preston St S 3 0 0 0 0 0 0 0
Coach Rd Preston St N 0 0 0 0 0 0 0 0
Preston St S Preston St N 3 6 3 3 3 3 3 3
Preston St S Coach Rd 0 0 0 0 0 0 0 0
Technical Note
West Cumbria Mining Traffic Modelling –
Technical Note
13
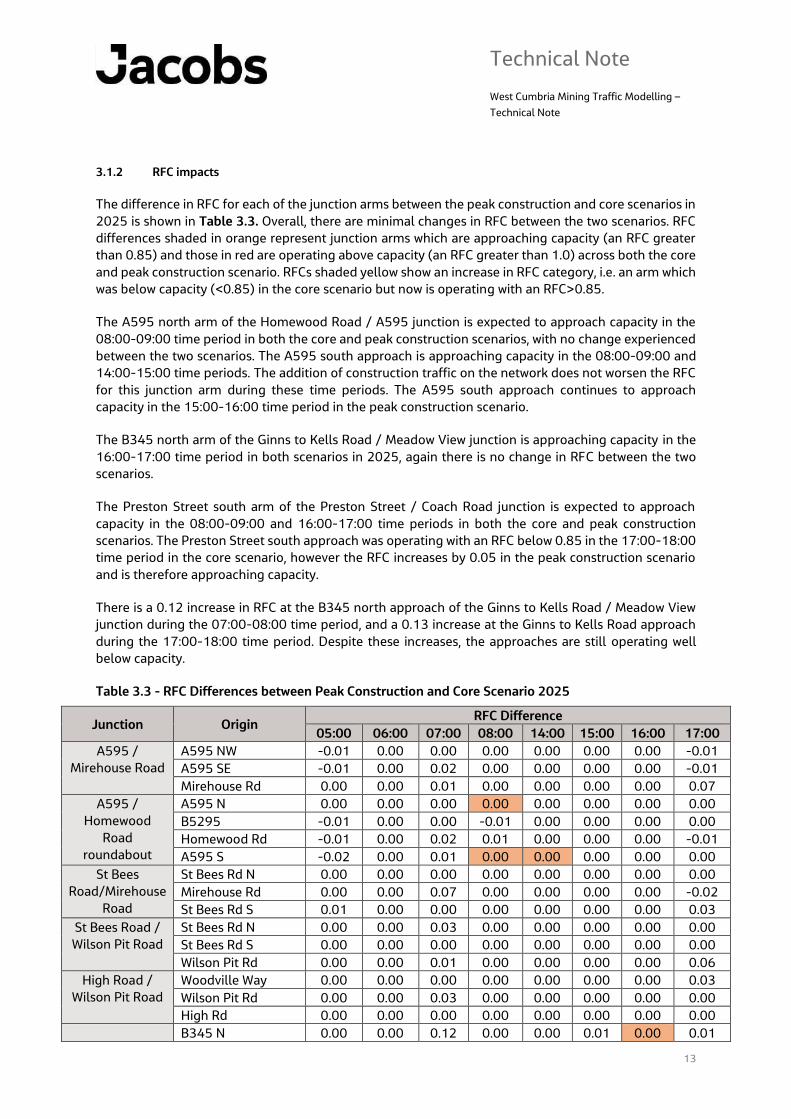
3.1.2 RFC impacts
The difference in RFC for each of the junction arms between the peak construction and core scenarios in
2025 is shown in Table 3.3. Overall, there are minimal changes in RFC between the two scenarios. RFC
differences shaded in orange represent junction arms which are approaching capacity (an RFC greater
than 0.85) and those in red are operating above capacity (an RFC greater than 1.0) across both the core
and peak construction scenario. RFCs shaded yellow show an increase in RFC category, i.e. an arm which
was below capacity (<0.85) in the core scenario but now is operating with an RFC>0.85.
The A595 north arm of the Homewood Road / A595 junction is expected to approach capacity in the
08:00-09:00 time period in both the core and peak construction scenarios, with no change experienced
between the two scenarios. The A595 south approach is approaching capacity in the 08:00-09:00 and
14:00-15:00 time periods. The addition of construction traffic on the network does not worsen the RFC
for this junction arm during these time periods. The A595 south approach continues to approach
capacity in the 15:00-16:00 time period in the peak construction scenario.
The B345 north arm of the Ginns to Kells Road / Meadow View junction is approaching capacity in the
16:00-17:00 time period in both scenarios in 2025, again there is no change in RFC between the two
scenarios.
The Preston Street south arm of the Preston Street / Coach Road junction is expected to approach
capacity in the 08:00-09:00 and 16:00-17:00 time periods in both the core and peak construction
scenarios. The Preston Street south approach was operating with an RFC below 0.85 in the 17:00-18:00
time period in the core scenario, however the RFC increases by 0.05 in the peak construction scenario
and is therefore approaching capacity.
There is a 0.12 increase in RFC at the B345 north approach of the Ginns to Kells Road / Meadow View
junction during the 07:00-08:00 time period, and a 0.13 increase at the Ginns to Kells Road approach
during the 17:00-18:00 time period. Despite these increases, the approaches are still operating well
below capacity.
Table 3.3 - RFC Differences between Peak Construction and Core Scenario 2025
Junction Origin RFC Difference
05:00 06:00 07:00 08:00 14:00 15:00 16:00 17:00
A595 /
Mirehouse Road
A595 NW -0.01 0.00 0.00 0.00 0.00 0.00 0.00 -0.01
A595 SE -0.01 0.00 0.02 0.00 0.00 0.00 0.00 -0.01
Mirehouse Rd 0.00 0.00 0.01 0.00 0.00 0.00 0.00 0.07
A595 /
Homewood
Road
roundabout
A595 N 0.00 0.00 0.00 0.00 0.00 0.00 0.00 0.00
B5295 -0.01 0.00 0.00 -0.01 0.00 0.00 0.00 0.00
Homewood Rd -0.01 0.00 0.02 0.01 0.00 0.00 0.00 -0.01
A595 S -0.02 0.00 0.01 0.00 0.00 0.00 0.00 0.00
St Bees
Road/Mirehouse
Road
St Bees Rd N 0.00 0.00 0.00 0.00 0.00 0.00 0.00 0.00
Mirehouse Rd 0.00 0.00 0.07 0.00 0.00 0.00 0.00 -0.02
St Bees Rd S 0.01 0.00 0.00 0.00 0.00 0.00 0.00 0.03
St Bees Road /
Wilson Pit Road
St Bees Rd N 0.00 0.00 0.03 0.00 0.00 0.00 0.00 0.00
St Bees Rd S 0.00 0.00 0.00 0.00 0.00 0.00 0.00 0.00
Wilson Pit Rd 0.00 0.00 0.01 0.00 0.00 0.00 0.00 0.06
High Road /
Wilson Pit Road
Woodville Way 0.00 0.00 0.00 0.00 0.00 0.00 0.00 0.03
Wilson Pit Rd 0.00 0.00 0.03 0.00 0.00 0.00 0.00 0.00
High Rd 0.00 0.00 0.00 0.00 0.00 0.00 0.00 0.00
B345 N 0.00 0.00 0.12 0.00 0.00 0.01 0.00 0.01
Technical Note
West Cumbria Mining Traffic Modelling –
Technical Note
14
Junction Origin RFC Difference
05:00 06:00 07:00 08:00 14:00 15:00 16:00 17:00
Ginns to Kells
Road / Meadow
View
B345 S 0.00 0.00 0.00 0.00 0.00 0.00 0.00 -0.02
Ginns to Kells Rd 0.00 0.01 -0.02 0.00 0.01 0.00 0.00 0.13
Preston Street /
Coach Road
Preston St N 0.00 0.00 0.04 0.00 0.00 0.00 0.00 0.00
Coach Rd 0.00 0.00 0.08 0.00 0.00 0.01 0.00 0.04
Preston St S -0.01 0.00 0.07 0.00 0.00 0.00 0.00 0.05
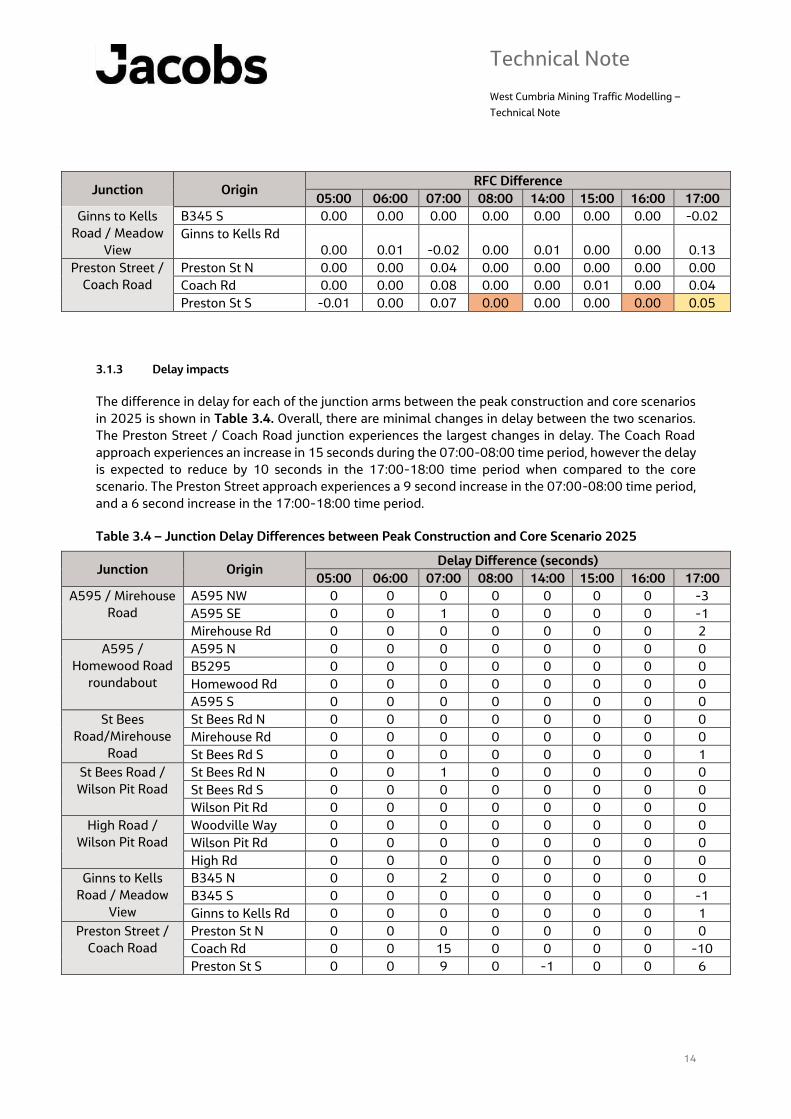
3.1.3 Delay impacts
The difference in delay for each of the junction arms between the peak construction and core scenarios
in 2025 is shown in Table 3.4. Overall, there are minimal changes in delay between the two scenarios.
The Preston Street / Coach Road junction experiences the largest changes in delay. The Coach Road
approach experiences an increase in 15 seconds during the 07:00-08:00 time period, however the delay
is expected to reduce by 10 seconds in the 17:00-18:00 time period when compared to the core
scenario. The Preston Street approach experiences a 9 second increase in the 07:00-08:00 time period,
and a 6 second increase in the 17:00-18:00 time period.
Table 3.4 – Junction Delay Differences between Peak Construction and Core Scenario 2025
Junction Origin Delay Difference (seconds)
05:00 06:00 07:00 08:00 14:00 15:00 16:00 17:00
A595 / Mirehouse
Road
A595 NW 0 0 0 0 0 0 0 -3
A595 SE 0 0 1 0 0 0 0 -1
Mirehouse Rd 0 0 0 0 0 0 0 2
A595 /
Homewood Road
roundabout
A595 N 0 0 0 0 0 0 0 0
B5295 0 0 0 0 0 0 0 0
Homewood Rd 0 0 0 0 0 0 0 0
A595 S 0 0 0 0 0 0 0 0
St Bees
Road/Mirehouse
Road
St Bees Rd N 0 0 0 0 0 0 0 0
Mirehouse Rd 0 0 0 0 0 0 0 0
St Bees Rd S 0 0 0 0 0 0 0 1
St Bees Road /
Wilson Pit Road
St Bees Rd N 0 0 1 0 0 0 0 0
St Bees Rd S 0 0 0 0 0 0 0 0
Wilson Pit Rd 0 0 0 0 0 0 0 0
High Road /
Wilson Pit Road
Woodville Way 0 0 0 0 0 0 0 0
Wilson Pit Rd 0 0 0 0 0 0 0 0
High Rd 0 0 0 0 0 0 0 0
Ginns to Kells
Road / Meadow
View
B345 N 0 0 2 0 0 0 0 0
B345 S 0 0 0 0 0 0 0 -1
Ginns to Kells Rd 0 0 0 0 0 0 0 1
Preston Street /
Coach Road
Preston St N 0 0 0 0 0 0 0 0
Coach Rd 0 0 15 0 0 0 0 -10
Preston St S 0 0 9 0 -1 0 0 6
Technical Note
West Cumbria Mining Traffic Modelling –
Technical Note
15
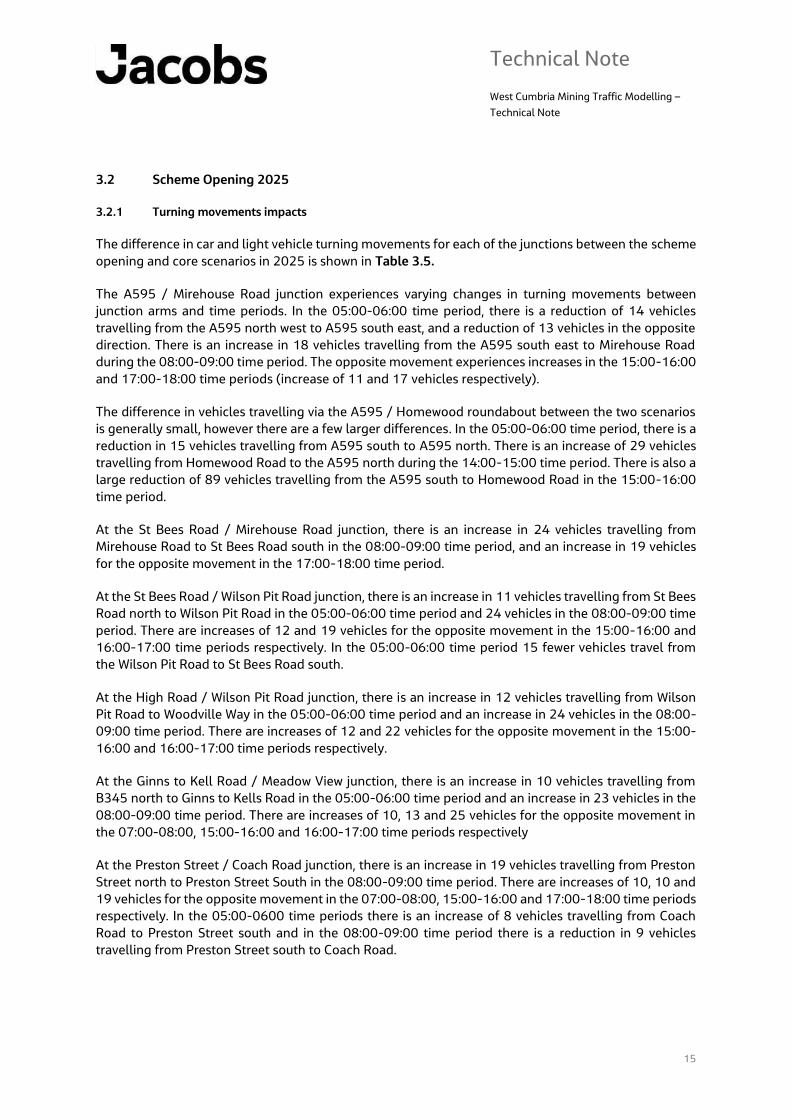
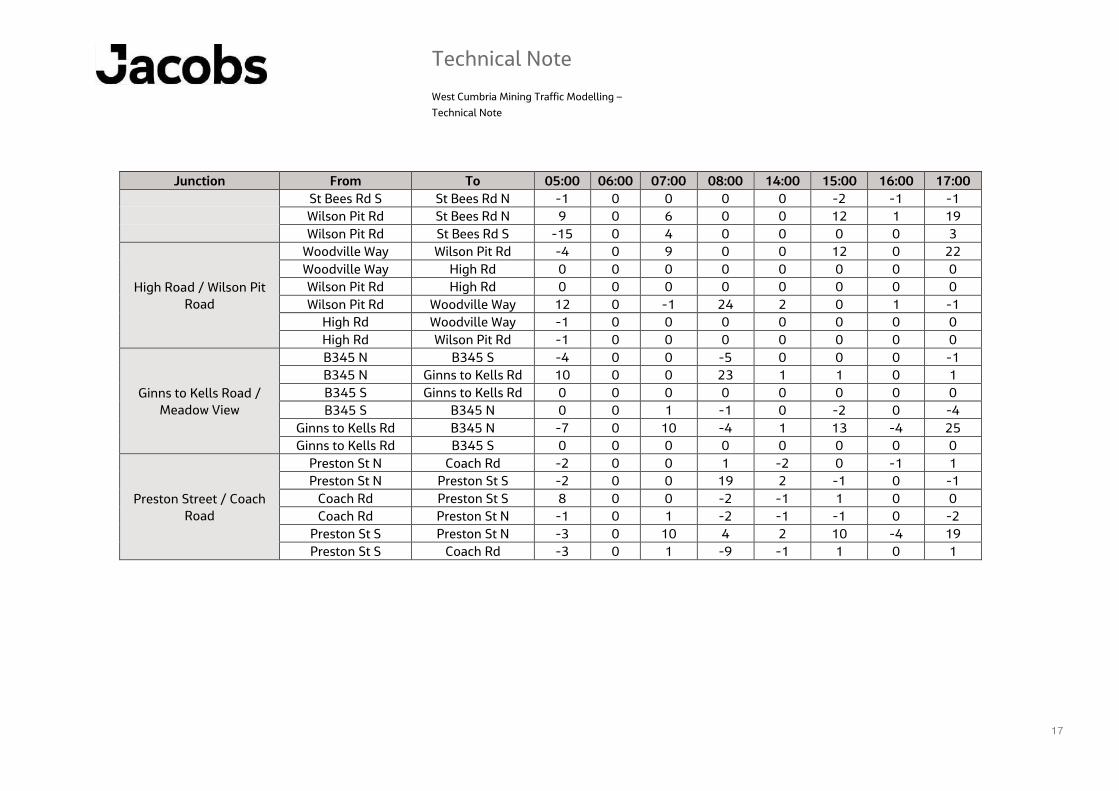
3.2 Scheme Opening 2025
3.2.1 Turning movements impacts
The difference in car and light vehicle turning movements for each of the junctions between the scheme
opening and core scenarios in 2025 is shown in Table 3.5.
The A595 / Mirehouse Road junction experiences varying changes in turning movements between
junction arms and time periods. In the 05:00-06:00 time period, there is a reduction of 14 vehicles
travelling from the A595 north west to A595 south east, and a reduction of 13 vehicles in the opposite
direction. There is an increase in 18 vehicles travelling from the A595 south east to Mirehouse Road
during the 08:00-09:00 time period. The opposite movement experiences increases in the 15:00-16:00
and 17:00-18:00 time periods (increase of 11 and 17 vehicles respectively).
The difference in vehicles travelling via the A595 / Homewood roundabout between the two scenarios
is generally small, however there are a few larger differences. In the 05:00-06:00 time period, there is a
reduction in 15 vehicles travelling from A595 south to A595 north. There is an increase of 29 vehicles
travelling from Homewood Road to the A595 north during the 14:00-15:00 time period. There is also a
large reduction of 89 vehicles travelling from the A595 south to Homewood Road in the 15:00-16:00
time period.
At the St Bees Road / Mirehouse Road junction, there is an increase in 24 vehicles travelling from
Mirehouse Road to St Bees Road south in the 08:00-09:00 time period, and an increase in 19 vehicles
for the opposite movement in the 17:00-18:00 time period.
At the St Bees Road / Wilson Pit Road junction, there is an increase in 11 vehicles travelling from St Bees
Road north to Wilson Pit Road in the 05:00-06:00 time period and 24 vehicles in the 08:00-09:00 time
period. There are increases of 12 and 19 vehicles for the opposite movement in the 15:00-16:00 and
16:00-17:00 time periods respectively. In the 05:00-06:00 time period 15 fewer vehicles travel from
the Wilson Pit Road to St Bees Road south.
At the High Road / Wilson Pit Road junction, there is an increase in 12 vehicles travelling from Wilson
Pit Road to Woodville Way in the 05:00-06:00 time period and an increase in 24 vehicles in the 08:00-
09:00 time period. There are increases of 12 and 22 vehicles for the opposite movement in the 15:00-
16:00 and 16:00-17:00 time periods respectively.
At the Ginns to Kell Road / Meadow View junction, there is an increase in 10 vehicles travelling from
B345 north to Ginns to Kells Road in the 05:00-06:00 time period and an increase in 23 vehicles in the
08:00-09:00 time period. There are increases of 10, 13 and 25 vehicles for the opposite movement in
the 07:00-08:00, 15:00-16:00 and 16:00-17:00 time periods respectively
At the Preston Street / Coach Road junction, there is an increase in 19 vehicles travelling from Preston
Street north to Preston Street South in the 08:00-09:00 time period. There are increases of 10, 10 and
19 vehicles for the opposite movement in the 07:00-08:00, 15:00-16:00 and 17:00-18:00 time periods
respectively. In the 05:00-0600 time periods there is an increase of 8 vehicles travelling from Coach
Road to Preston Street south and in the 08:00-09:00 time period there is a reduction in 9 vehicles
travelling from Preston Street south to Coach Road.

Technical Note
West Cumbria Mining Traffic Modelling – Technical Note
16
Table 3.5 - Turning Movement Differences between Scheme Opening 2025 and Core Scenario 2025 – Light Vehicles
Junction From To 05:00 06:00 07:00 08:00 14:00 15:00 16:00 17:00
A595 / Mirehouse Road
A595 NW A595 SE -14 -1 0 0 0 0 0 -2
A595 NW Mirehouse Rd 3 2 -1 11 2 0 0 1
A595 SE Mirehouse Rd 7 0 0 18 0 -2 1 -3
A595 SE A595 NW -13 0 -1 0 0 2 0 0
Mirehouse Rd A595 NW -1 0 2 2 0 0 0 0
Mirehouse Rd A595 SE -3 0 0 0 0 11 0 17
A595 / Homewood
Road roundabout
A595 N B5295 0 0 -1 0 0 0 0 0
A595 N Homewood Rd -2 0 -1 -5 0 0 0 -1
A595 N A595 S 0 2 3 4 -2 -1 -2 2
B5295 Homewood Rd 0 0 0 0 0 0 0 0
B5295 A595 S -9 9 0 -2 1 -1 -2 -1
B5295 A595 N 0 0 0 -5 0 -2 2 0
Homewood Rd A595 S 1 1 -1 6 1 -1 -1 -4
Homewood Rd A595 N -2 0 0 2 29 0 -1 0
Homewood Rd B5295 0 0 -3 0 0 0 0 0
A595 S A595 N -15 -1 0 -1 -1 5 1 -3
A595 S A595 S -2 0 -1 2 0 3 2 0
A595 S Homewood Rd -2 -1 4 -3 0 -89 0 1
St Bees Road /
Mirehouse Road
St Bees Rd N Mirehouse Rd -5 0 -1 2 0 0 0 0
St Bees Rd N St Bees Rd S 0 0 1 0 0 0 0 0
Mirehouse Rd St Bees Rd S 9 1 -1 24 1 0 1 -1
Mirehouse Rd St Bees Rd N -1 0 0 -1 1 -1 0 -5
St Bees Rd S St Bees Rd N 3 0 1 0 0 -2 0 -1
St Bees Rd S Mirehouse Rd 5 0 6 0 0 11 0 19
St Bees Road / Wilson
Pit Road
St Bees Rd N St Bees Rd S -2 1 -1 0 0 0 0 0
St Bees Rd N Wilson Pit Rd 11 0 0 24 1 0 1 -1
St Bees Rd S Wilson Pit Rd 0 0 0 0 1 0 1 0
Technical Note
West Cumbria Mining Traffic Modelling –
Technical Note
17
Junction From To 05:00 06:00 07:00 08:00 14:00 15:00 16:00 17:00
St Bees Rd S St Bees Rd N -1 0 0 0 0 -2 -1 -1
Wilson Pit Rd St Bees Rd N 9 0 6 0 0 12 1 19
Wilson Pit Rd St Bees Rd S -15 0 4 0 0 0 0 3
High Road / Wilson Pit
Road
Woodville Way Wilson Pit Rd -4 0 9 0 0 12 0 22
Woodville Way High Rd 0 0 0 0 0 0 0 0
Wilson Pit Rd High Rd 0 0 0 0 0 0 0 0
Wilson Pit Rd Woodville Way 12 0 -1 24 2 0 1 -1
High Rd Woodville Way -1 0 0 0 0 0 0 0
High Rd Wilson Pit Rd -1 0 0 0 0 0 0 0
Ginns to Kells Road /
Meadow View
B345 N B345 S -4 0 0 -5 0 0 0 -1
B345 N Ginns to Kells Rd 10 0 0 23 1 1 0 1
B345 S Ginns to Kells Rd 0 0 0 0 0 0 0 0
B345 S B345 N 0 0 1 -1 0 -2 0 -4
Ginns to Kells Rd B345 N -7 0 10 -4 1 13 -4 25
Ginns to Kells Rd B345 S 0 0 0 0 0 0 0 0
Preston Street / Coach
Road
Preston St N Coach Rd -2 0 0 1 -2 0 -1 1
Preston St N Preston St S -2 0 0 19 2 -1 0 -1
Coach Rd Preston St S 8 0 0 -2 -1 1 0 0
Coach Rd Preston St N -1 0 1 -2 -1 -1 0 -2
Preston St S Preston St N -3 0 10 4 2 10 -4 19
Preston St S Coach Rd -3 0 1 -9 -1 1 0 1
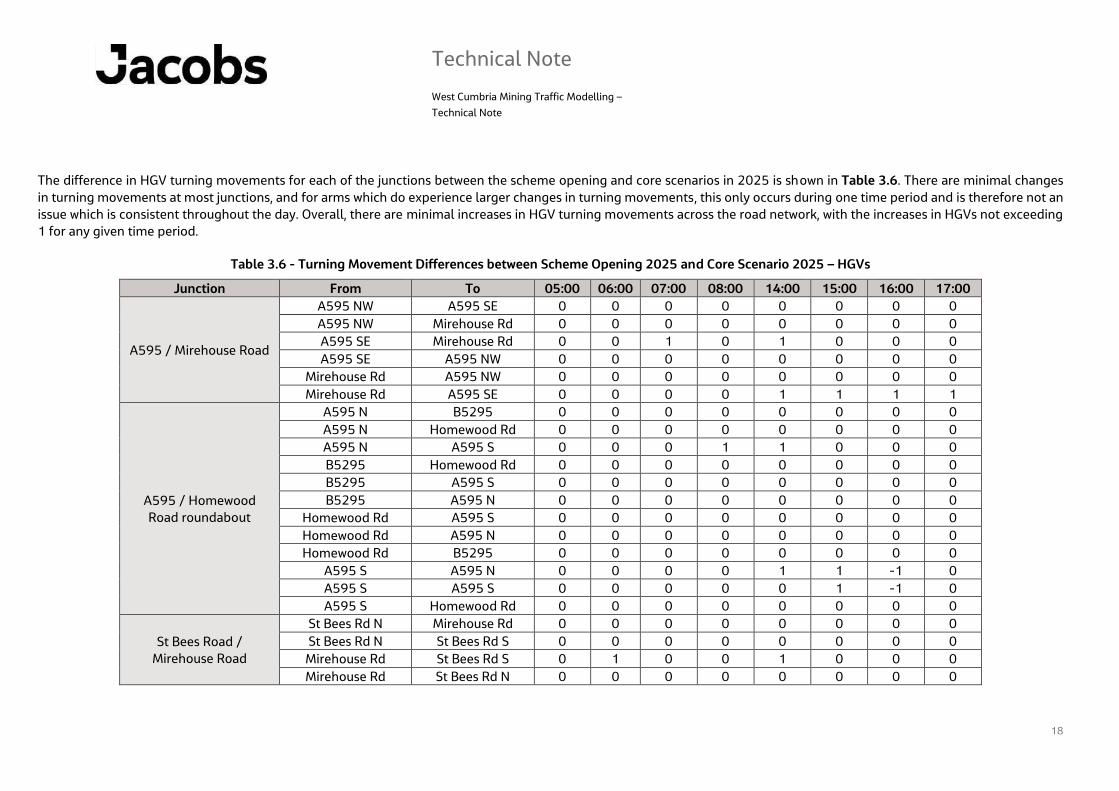
Technical Note
West Cumbria Mining Traffic Modelling –
Technical Note
18
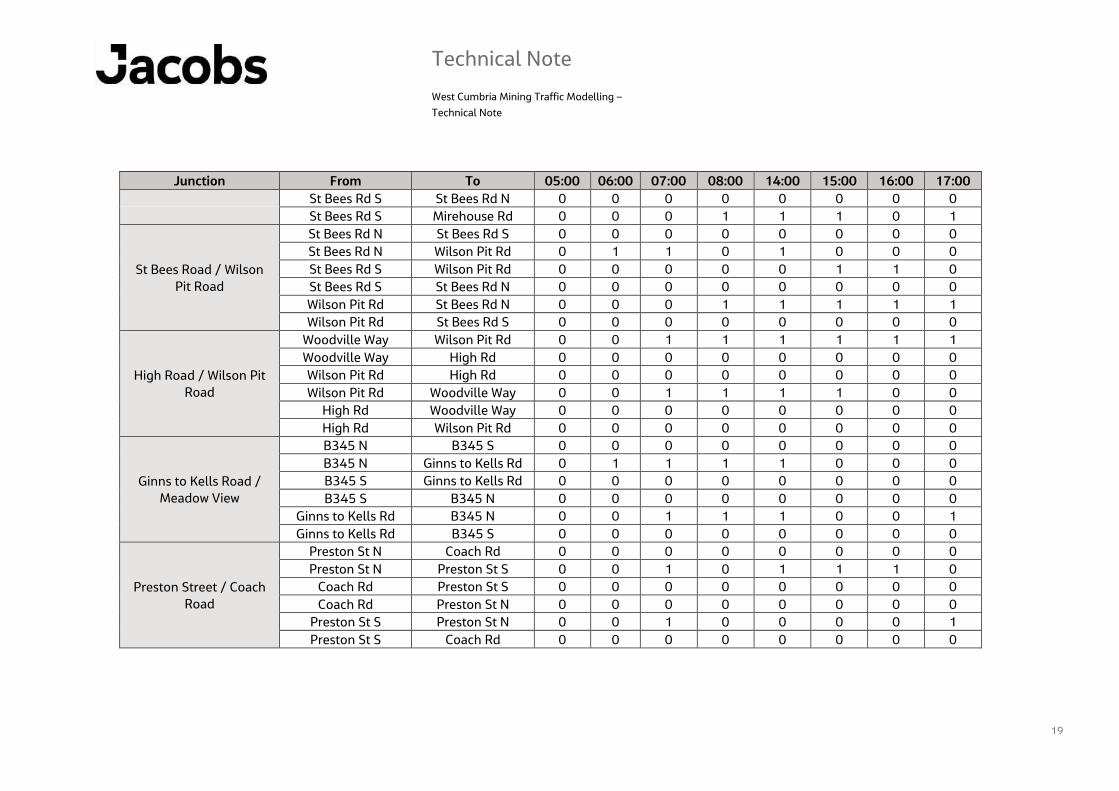
The difference in HGV turning movements for each of the junctions between the scheme opening and core scenarios in 2025 is shown in Table 3.6. There are minimal changes
in turning movements at most junctions, and for arms which do experience larger changes in turning movements, this only occurs during one time period and is therefore not an
issue which is consistent throughout the day. Overall, there are minimal increases in HGV turning movements across the road network, with the increases in HGVs not exceeding
1 for any given time period.
Table 3.6 - Turning Movement Differences between Scheme Opening 2025 and Core Scenario 2025 – HGVs
Junction From To 05:00 06:00 07:00 08:00 14:00 15:00 16:00 17:00
A595 / Mirehouse Road
A595 NW A595 SE 0 0 0 0 0 0 0 0
A595 NW Mirehouse Rd 0 0 0 0 0 0 0 0
A595 SE Mirehouse Rd 0 0 1 0 1 0 0 0
A595 SE A595 NW 0 0 0 0 0 0 0 0
Mirehouse Rd A595 NW 0 0 0 0 0 0 0 0
Mirehouse Rd A595 SE 0 0 0 0 1 1 1 1
A595 / Homewood
Road roundabout
A595 N B5295 0 0 0 0 0 0 0 0
A595 N Homewood Rd 0 0 0 0 0 0 0 0
A595 N A595 S 0 0 0 1 1 0 0 0
B5295 Homewood Rd 0 0 0 0 0 0 0 0
B5295 A595 S 0 0 0 0 0 0 0 0
B5295 A595 N 0 0 0 0 0 0 0 0
Homewood Rd A595 S 0 0 0 0 0 0 0 0
Homewood Rd A595 N 0 0 0 0 0 0 0 0
Homewood Rd B5295 0 0 0 0 0 0 0 0
A595 S A595 N 0 0 0 0 1 1 -1 0
A595 S A595 S 0 0 0 0 0 1 -1 0
A595 S Homewood Rd 0 0 0 0 0 0 0 0
St Bees Road /
Mirehouse Road
St Bees Rd N Mirehouse Rd 0 0 0 0 0 0 0 0
St Bees Rd N St Bees Rd S 0 0 0 0 0 0 0 0
Mirehouse Rd St Bees Rd S 0 1 0 0 1 0 0 0
Mirehouse Rd St Bees Rd N 0 0 0 0 0 0 0 0
Technical Note
West Cumbria Mining Traffic Modelling –
Technical Note
19
Junction From To 05:00 06:00 07:00 08:00 14:00 15:00 16:00 17:00
St Bees Rd S St Bees Rd N 0 0 0 0 0 0 0 0
St Bees Rd S Mirehouse Rd 0 0 0 1 1 1 0 1
St Bees Road / Wilson
Pit Road
St Bees Rd N St Bees Rd S 0 0 0 0 0 0 0 0
St Bees Rd N Wilson Pit Rd 0 1 1 0 1 0 0 0
St Bees Rd S Wilson Pit Rd 0 0 0 0 0 1 1 0
St Bees Rd S St Bees Rd N 0 0 0 0 0 0 0 0
Wilson Pit Rd St Bees Rd N 0 0 0 1 1 1 1 1
Wilson Pit Rd St Bees Rd S 0 0 0 0 0 0 0 0
High Road / Wilson Pit
Road
Woodville Way Wilson Pit Rd 0 0 1 1 1 1 1 1
Woodville Way High Rd 0 0 0 0 0 0 0 0
Wilson Pit Rd High Rd 0 0 0 0 0 0 0 0
Wilson Pit Rd Woodville Way 0 0 1 1 1 1 0 0
High Rd Woodville Way 0 0 0 0 0 0 0 0
High Rd Wilson Pit Rd 0 0 0 0 0 0 0 0
Ginns to Kells Road /
Meadow View
B345 N B345 S 0 0 0 0 0 0 0 0
B345 N Ginns to Kells Rd 0 1 1 1 1 0 0 0
B345 S Ginns to Kells Rd 0 0 0 0 0 0 0 0
B345 S B345 N 0 0 0 0 0 0 0 0
Ginns to Kells Rd B345 N 0 0 1 1 1 0 0 1
Ginns to Kells Rd B345 S 0 0 0 0 0 0 0 0
Preston Street / Coach
Road
Preston St N Coach Rd 0 0 0 0 0 0 0 0
Preston St N Preston St S 0 0 1 0 1 1 1 0
Coach Rd Preston St S 0 0 0 0 0 0 0 0
Coach Rd Preston St N 0 0 0 0 0 0 0 0
Preston St S Preston St N 0 0 1 0 0 0 0 1
Preston St S Coach Rd 0 0 0 0 0 0 0 0
Technical Note
West Cumbria Mining Traffic Modelling –
Technical Note
20
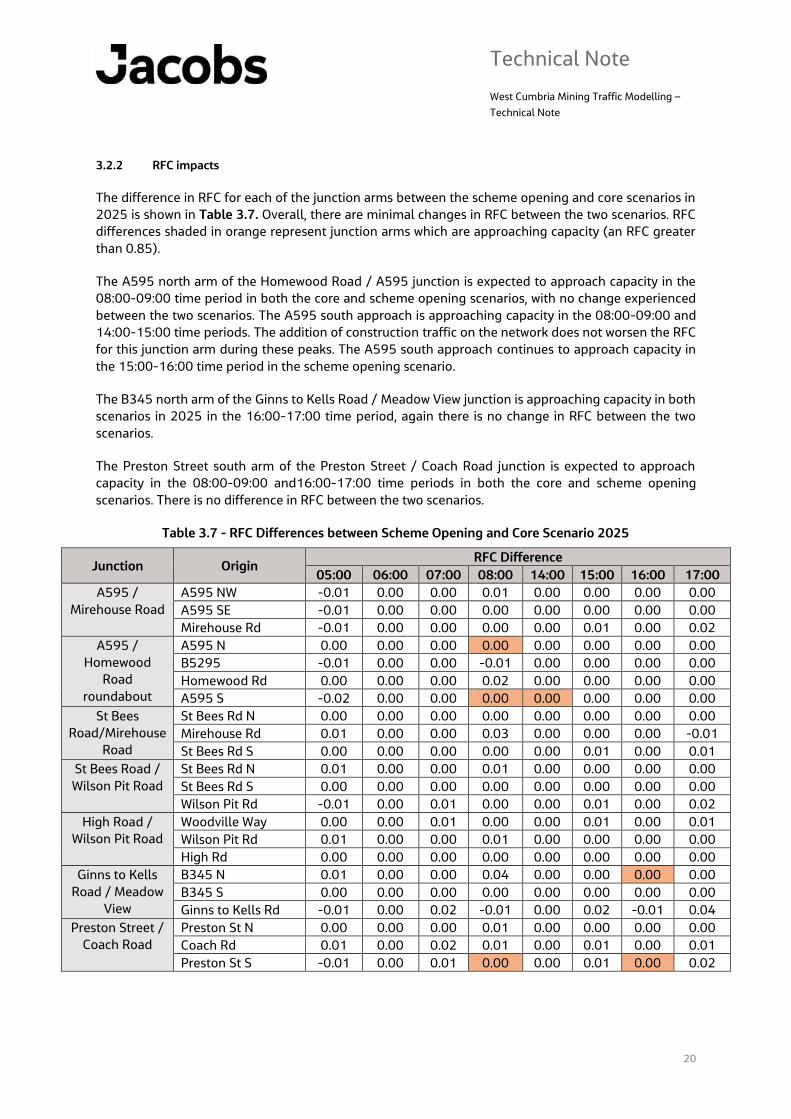
3.2.2 RFC impacts
The difference in RFC for each of the junction arms between the scheme opening and core scenarios in
2025 is shown in Table 3.7. Overall, there are minimal changes in RFC between the two scenarios. RFC
differences shaded in orange represent junction arms which are approaching capacity (an RFC greater
than 0.85).
The A595 north arm of the Homewood Road / A595 junction is expected to approach capacity in the
08:00-09:00 time period in both the core and scheme opening scenarios, with no change experienced
between the two scenarios. The A595 south approach is approaching capacity in the 08:00-09:00 and
14:00-15:00 time periods. The addition of construction traffic on the network does not worsen the RFC
for this junction arm during these peaks. The A595 south approach continues to approach capacity in
the 15:00-16:00 time period in the scheme opening scenario.
The B345 north arm of the Ginns to Kells Road / Meadow View junction is approaching capacity in both
scenarios in 2025 in the 16:00-17:00 time period, again there is no change in RFC between the two
scenarios.
The Preston Street south arm of the Preston Street / Coach Road junction is expected to approach
capacity in the 08:00-09:00 and16:00-17:00 time periods in both the core and scheme opening
scenarios. There is no difference in RFC between the two scenarios.
Table 3.7 - RFC Differences between Scheme Opening and Core Scenario 2025
Junction Origin RFC Difference
05:00 06:00 07:00 08:00 14:00 15:00 16:00 17:00
A595 /
Mirehouse Road
A595 NW -0.01 0.00 0.00 0.01 0.00 0.00 0.00 0.00
A595 SE -0.01 0.00 0.00 0.00 0.00 0.00 0.00 0.00
Mirehouse Rd -0.01 0.00 0.00 0.00 0.00 0.01 0.00 0.02
A595 /
Homewood
Road
roundabout
A595 N 0.00 0.00 0.00 0.00 0.00 0.00 0.00 0.00
B5295 -0.01 0.00 0.00 -0.01 0.00 0.00 0.00 0.00
Homewood Rd 0.00 0.00 0.00 0.02 0.00 0.00 0.00 0.00
A595 S -0.02 0.00 0.00 0.00 0.00 0.00 0.00 0.00
St Bees
Road/Mirehouse
Road
St Bees Rd N 0.00 0.00 0.00 0.00 0.00 0.00 0.00 0.00
Mirehouse Rd 0.01 0.00 0.00 0.03 0.00 0.00 0.00 -0.01
St Bees Rd S 0.00 0.00 0.00 0.00 0.00 0.01 0.00 0.01
St Bees Road /
Wilson Pit Road
St Bees Rd N 0.01 0.00 0.00 0.01 0.00 0.00 0.00 0.00
St Bees Rd S 0.00 0.00 0.00 0.00 0.00 0.00 0.00 0.00
Wilson Pit Rd -0.01 0.00 0.01 0.00 0.00 0.01 0.00 0.02
High Road /
Wilson Pit Road
Woodville Way 0.00 0.00 0.01 0.00 0.00 0.01 0.00 0.01
Wilson Pit Rd 0.01 0.00 0.00 0.01 0.00 0.00 0.00 0.00
High Rd 0.00 0.00 0.00 0.00 0.00 0.00 0.00 0.00
Ginns to Kells
Road / Meadow
View
B345 N 0.01 0.00 0.00 0.04 0.00 0.00 0.00 0.00
B345 S 0.00 0.00 0.00 0.00 0.00 0.00 0.00 0.00
Ginns to Kells Rd -0.01 0.00 0.02 -0.01 0.00 0.02 -0.01 0.04
Preston Street /
Coach Road
Preston St N 0.00 0.00 0.00 0.01 0.00 0.00 0.00 0.00
Coach Rd 0.01 0.00 0.02 0.01 0.00 0.01 0.00 0.01
Preston St S -0.01 0.00 0.01 0.00 0.00 0.01 0.00 0.02
Technical Note
West Cumbria Mining Traffic Modelling –
Technical Note
21
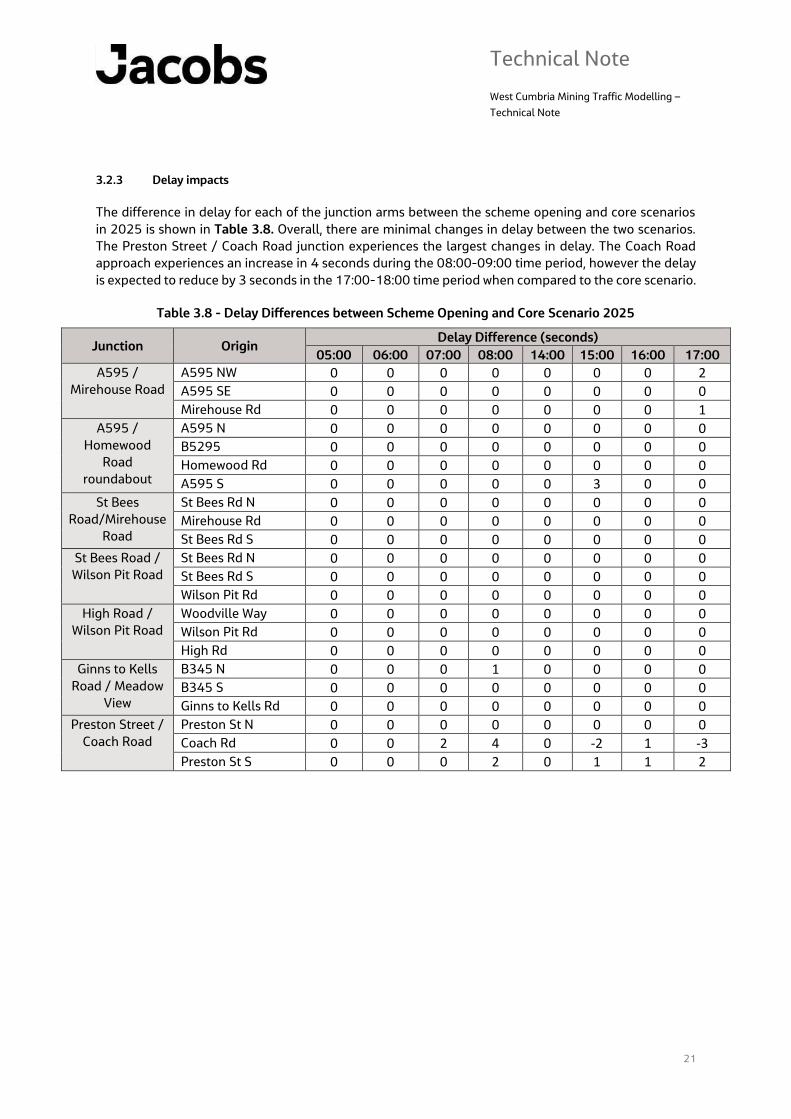
3.2.3 Delay impacts
The difference in delay for each of the junction arms between the scheme opening and core scenarios
in 2025 is shown in Table 3.8. Overall, there are minimal changes in delay between the two scenarios.
The Preston Street / Coach Road junction experiences the largest changes in delay. The Coach Road
approach experiences an increase in 4 seconds during the 08:00-09:00 time period, however the delay
is expected to reduce by 3 seconds in the 17:00-18:00 time period when compared to the core scenario.
Table 3.8 - Delay Differences between Scheme Opening and Core Scenario 2025
Junction Origin Delay Difference (seconds)
05:00 06:00 07:00 08:00 14:00 15:00 16:00 17:00
A595 /
Mirehouse Road
A595 NW 0 0 0 0 0 0 0 2
A595 SE 0 0 0 0 0 0 0 0
Mirehouse Rd 0 0 0 0 0 0 0 1
A595 /
Homewood
Road
roundabout
A595 N 0 0 0 0 0 0 0 0
B5295 0 0 0 0 0 0 0 0
Homewood Rd 0 0 0 0 0 0 0 0
A595 S 0 0 0 0 0 3 0 0
St Bees
Road/Mirehouse
Road
St Bees Rd N 0 0 0 0 0 0 0 0
Mirehouse Rd 0 0 0 0 0 0 0 0
St Bees Rd S 0 0 0 0 0 0 0 0
St Bees Road /
Wilson Pit Road
St Bees Rd N 0 0 0 0 0 0 0 0
St Bees Rd S 0 0 0 0 0 0 0 0
Wilson Pit Rd 0 0 0 0 0 0 0 0
High Road /
Wilson Pit Road
Woodville Way 0 0 0 0 0 0 0 0
Wilson Pit Rd 0 0 0 0 0 0 0 0
High Rd 0 0 0 0 0 0 0 0
Ginns to Kells
Road / Meadow
View
B345 N 0 0 0 1 0 0 0 0
B345 S 0 0 0 0 0 0 0 0
Ginns to Kells Rd 0 0 0 0 0 0 0 0
Preston Street /
Coach Road
Preston St N 0 0 0 0 0 0 0 0
Coach Rd 0 0 2 4 0 -2 1 -3
Preston St S 0 0 0 2 0 1 1 2
Technical Note
West Cumbria Mining Traffic Modelling –
Technical Note
22
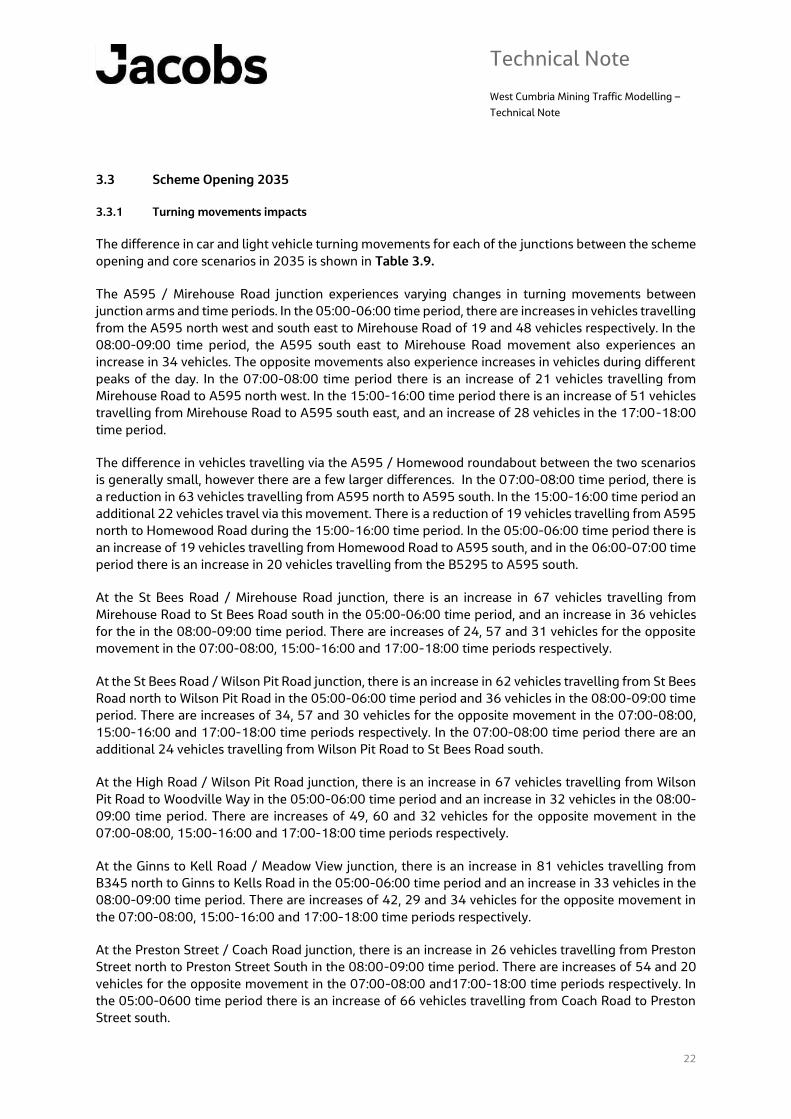
3.3 Scheme Opening 2035
3.3.1 Turning movements impacts
The difference in car and light vehicle turning movements for each of the junctions between the scheme
opening and core scenarios in 2035 is shown in Table 3.9.
The A595 / Mirehouse Road junction experiences varying changes in turning movements between
junction arms and time periods. In the 05:00-06:00 time period, there are increases in vehicles travelling
from the A595 north west and south east to Mirehouse Road of 19 and 48 vehicles respectively. In the
08:00-09:00 time period, the A595 south east to Mirehouse Road movement also experiences an
increase in 34 vehicles. The opposite movements also experience increases in vehicles during different
peaks of the day. In the 07:00-08:00 time period there is an increase of 21 vehicles travelling from
Mirehouse Road to A595 north west. In the 15:00-16:00 time period there is an increase of 51 vehicles
travelling from Mirehouse Road to A595 south east, and an increase of 28 vehicles in the 17:00-18:00
time period.
The difference in vehicles travelling via the A595 / Homewood roundabout between the two scenarios
is generally small, however there are a few larger differences. In the 07:00-08:00 time period, there is
a reduction in 63 vehicles travelling from A595 north to A595 south. In the 15:00-16:00 time period an
additional 22 vehicles travel via this movement. There is a reduction of 19 vehicles travelling from A595
north to Homewood Road during the 15:00-16:00 time period. In the 05:00-06:00 time period there is
an increase of 19 vehicles travelling from Homewood Road to A595 south, and in the 06:00-07:00 time
period there is an increase in 20 vehicles travelling from the B5295 to A595 south.
At the St Bees Road / Mirehouse Road junction, there is an increase in 67 vehicles travelling from
Mirehouse Road to St Bees Road south in the 05:00-06:00 time period, and an increase in 36 vehicles
for the in the 08:00-09:00 time period. There are increases of 24, 57 and 31 vehicles for the opposite
movement in the 07:00-08:00, 15:00-16:00 and 17:00-18:00 time periods respectively.
At the St Bees Road / Wilson Pit Road junction, there is an increase in 62 vehicles travelling from St Bees
Road north to Wilson Pit Road in the 05:00-06:00 time period and 36 vehicles in the 08:00-09:00 time
period. There are increases of 34, 57 and 30 vehicles for the opposite movement in the 07:00-08:00,
15:00-16:00 and 17:00-18:00 time periods respectively. In the 07:00-08:00 time period there are an
additional 24 vehicles travelling from Wilson Pit Road to St Bees Road south.
At the High Road / Wilson Pit Road junction, there is an increase in 67 vehicles travelling from Wilson
Pit Road to Woodville Way in the 05:00-06:00 time period and an increase in 32 vehicles in the 08:00-
09:00 time period. There are increases of 49, 60 and 32 vehicles for the opposite movement in the
07:00-08:00, 15:00-16:00 and 17:00-18:00 time periods respectively.
At the Ginns to Kell Road / Meadow View junction, there is an increase in 81 vehicles travelling from
B345 north to Ginns to Kells Road in the 05:00-06:00 time period and an increase in 33 vehicles in the
08:00-09:00 time period. There are increases of 42, 29 and 34 vehicles for the opposite movement in
the 07:00-08:00, 15:00-16:00 and 17:00-18:00 time periods respectively.
At the Preston Street / Coach Road junction, there is an increase in 26 vehicles travelling from Preston
Street north to Preston Street South in the 08:00-09:00 time period. There are increases of 54 and 20
vehicles for the opposite movement in the 07:00-08:00 and17:00-18:00 time periods respectively. In
the 05:00-0600 time period there is an increase of 66 vehicles travelling from Coach Road to Preston
Street south.
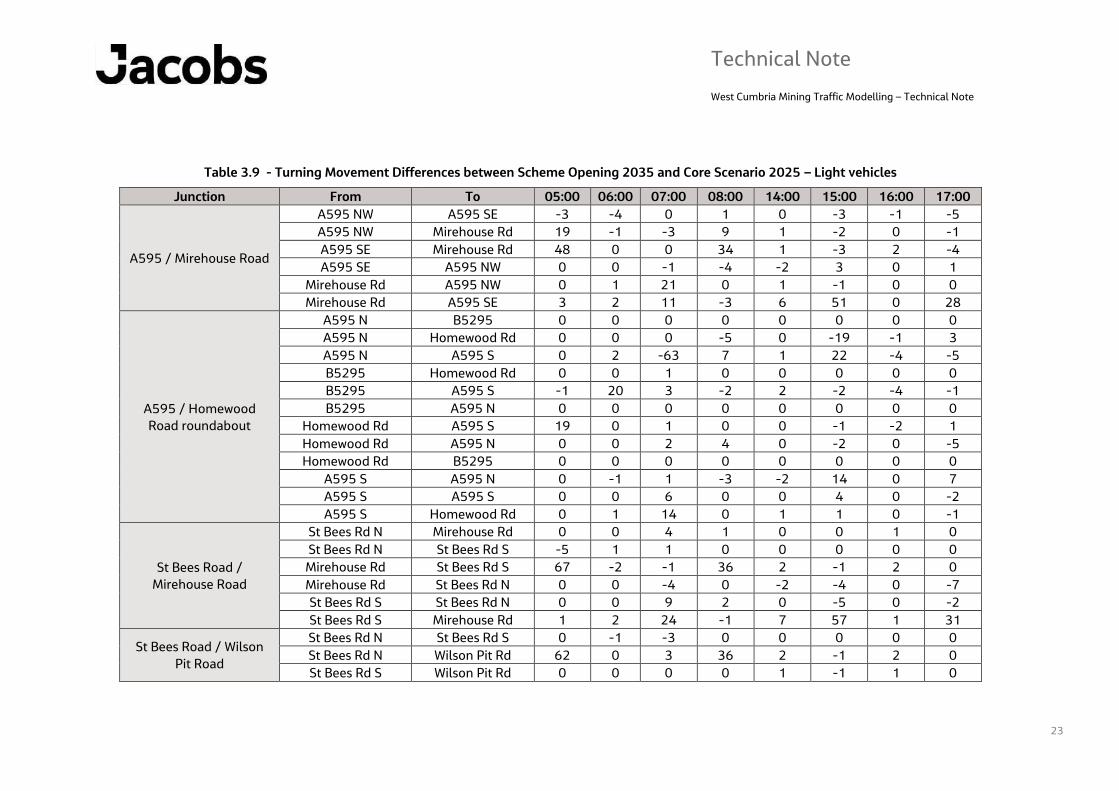
Technical Note
West Cumbria Mining Traffic Modelling – Technical Note
23
Table 3.9 - Turning Movement Differences between Scheme Opening 2035 and Core Scenario 2025 – Light vehicles
Junction From To 05:00 06:00 07:00 08:00 14:00 15:00 16:00 17:00
A595 / Mirehouse Road
A595 NW A595 SE -3 -4 0 1 0 -3 -1 -5
A595 NW Mirehouse Rd 19 -1 -3 9 1 -2 0 -1
A595 SE Mirehouse Rd 48 0 0 34 1 -3 2 -4
A595 SE A595 NW 0 0 -1 -4 -2 3 0 1
Mirehouse Rd A595 NW 0 1 21 0 1 -1 0 0
Mirehouse Rd A595 SE 3 2 11 -3 6 51 0 28
A595 / Homewood
Road roundabout
A595 N B5295 0 0 0 0 0 0 0 0
A595 N Homewood Rd 0 0 0 -5 0 -19 -1 3
A595 N A595 S 0 2 -63 7 1 22 -4 -5
B5295 Homewood Rd 0 0 1 0 0 0 0 0
B5295 A595 S -1 20 3 -2 2 -2 -4 -1
B5295 A595 N 0 0 0 0 0 0 0 0
Homewood Rd A595 S 19 0 1 0 0 -1 -2 1
Homewood Rd A595 N 0 0 2 4 0 -2 0 -5
Homewood Rd B5295 0 0 0 0 0 0 0 0
A595 S A595 N 0 -1 1 -3 -2 14 0 7
A595 S A595 S 0 0 6 0 0 4 0 -2
A595 S Homewood Rd 0 1 14 0 1 1 0 -1
St Bees Road /
Mirehouse Road
St Bees Rd N Mirehouse Rd 0 0 4 1 0 0 1 0
St Bees Rd N St Bees Rd S -5 1 1 0 0 0 0 0
Mirehouse Rd St Bees Rd S 67 -2 -1 36 2 -1 2 0
Mirehouse Rd St Bees Rd N 0 0 -4 0 -2 -4 0 -7
St Bees Rd S St Bees Rd N 0 0 9 2 0 -5 0 -2
St Bees Rd S Mirehouse Rd 1 2 24 -1 7 57 1 31
St Bees Road / Wilson
Pit Road
St Bees Rd N St Bees Rd S 0 -1 -3 0 0 0 0 0
St Bees Rd N Wilson Pit Rd 62 0 3 36 2 -1 2 0
St Bees Rd S Wilson Pit Rd 0 0 0 0 1 -1 1 0
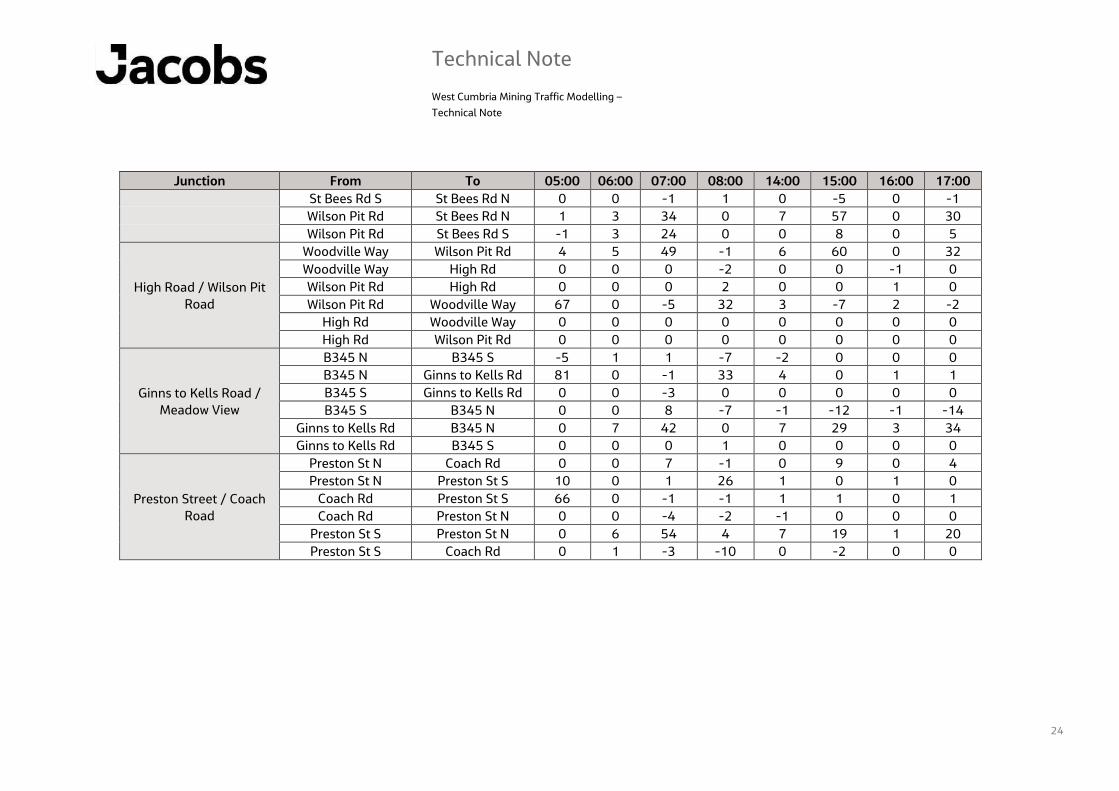
Technical Note
West Cumbria Mining Traffic Modelling –
Technical Note
24
Junction From To 05:00 06:00 07:00 08:00 14:00 15:00 16:00 17:00
St Bees Rd S St Bees Rd N 0 0 -1 1 0 -5 0 -1
Wilson Pit Rd St Bees Rd N 1 3 34 0 7 57 0 30
Wilson Pit Rd St Bees Rd S -1 3 24 0 0 8 0 5
High Road / Wilson Pit
Road
Woodville Way Wilson Pit Rd 4 5 49 -1 6 60 0 32
Woodville Way High Rd 0 0 0 -2 0 0 -1 0
Wilson Pit Rd High Rd 0 0 0 2 0 0 1 0
Wilson Pit Rd Woodville Way 67 0 -5 32 3 -7 2 -2
High Rd Woodville Way 0 0 0 0 0 0 0 0
High Rd Wilson Pit Rd 0 0 0 0 0 0 0 0
Ginns to Kells Road /
Meadow View
B345 N B345 S -5 1 1 -7 -2 0 0 0
B345 N Ginns to Kells Rd 81 0 -1 33 4 0 1 1
B345 S Ginns to Kells Rd 0 0 -3 0 0 0 0 0
B345 S B345 N 0 0 8 -7 -1 -12 -1 -14
Ginns to Kells Rd B345 N 0 7 42 0 7 29 3 34
Ginns to Kells Rd B345 S 0 0 0 1 0 0 0 0
Preston Street / Coach
Road
Preston St N Coach Rd 0 0 7 -1 0 9 0 4
Preston St N Preston St S 10 0 1 26 1 0 1 0
Coach Rd Preston St S 66 0 -1 -1 1 1 0 1
Coach Rd Preston St N 0 0 -4 -2 -1 0 0 0
Preston St S Preston St N 0 6 54 4 7 19 1 20
Preston St S Coach Rd 0 1 -3 -10 0 -2 0 0
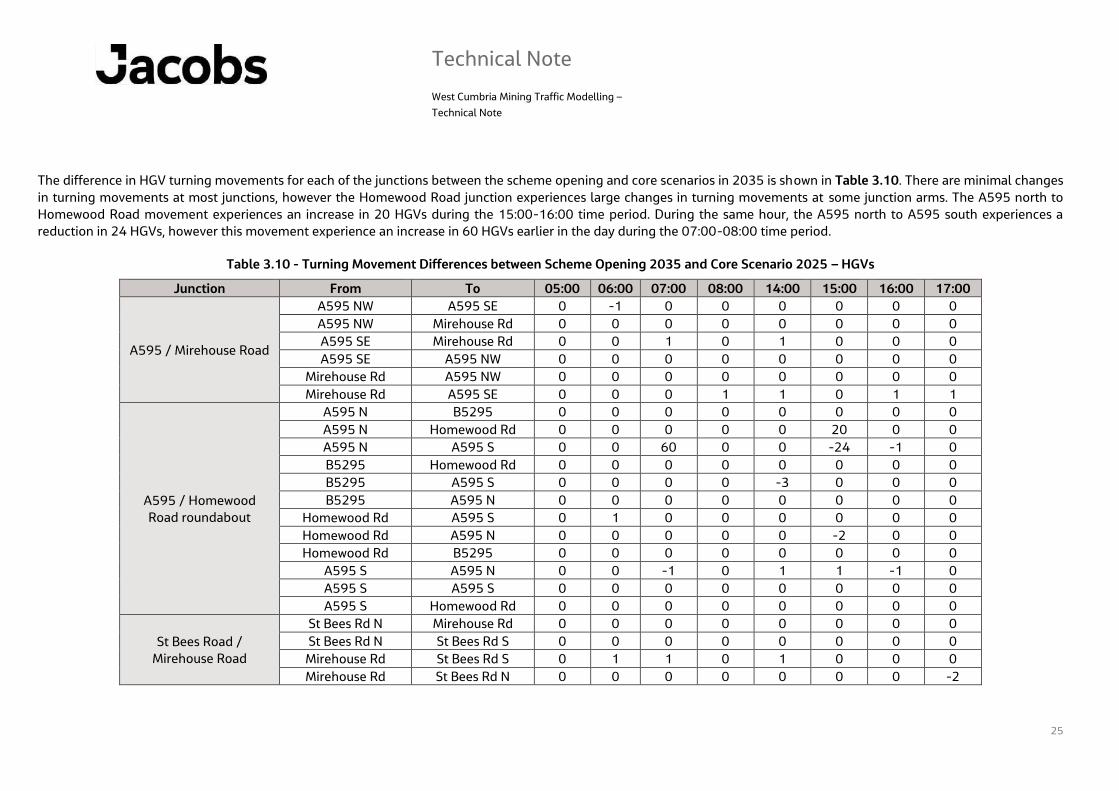
Technical Note
West Cumbria Mining Traffic Modelling –
Technical Note
25
The difference in HGV turning movements for each of the junctions between the scheme opening and core scenarios in 2035 is shown in Table 3.10. There are minimal changes
in turning movements at most junctions, however the Homewood Road junction experiences large changes in turning movements at some junction arms. The A595 north to
Homewood Road movement experiences an increase in 20 HGVs during the 15:00-16:00 time period. During the same hour, the A595 north to A595 south experiences a
reduction in 24 HGVs, however this movement experience an increase in 60 HGVs earlier in the day during the 07:00-08:00 time period.
Table 3.10 - Turning Movement Differences between Scheme Opening 2035 and Core Scenario 2025 – HGVs
Junction From To 05:00 06:00 07:00 08:00 14:00 15:00 16:00 17:00
A595 / Mirehouse Road
A595 NW A595 SE 0 -1 0 0 0 0 0 0
A595 NW Mirehouse Rd 0 0 0 0 0 0 0 0
A595 SE Mirehouse Rd 0 0 1 0 1 0 0 0
A595 SE A595 NW 0 0 0 0 0 0 0 0
Mirehouse Rd A595 NW 0 0 0 0 0 0 0 0
Mirehouse Rd A595 SE 0 0 0 1 1 0 1 1
A595 / Homewood
Road roundabout
A595 N B5295 0 0 0 0 0 0 0 0
A595 N Homewood Rd 0 0 0 0 0 20 0 0
A595 N A595 S 0 0 60 0 0 -24 -1 0
B5295 Homewood Rd 0 0 0 0 0 0 0 0
B5295 A595 S 0 0 0 0 -3 0 0 0
B5295 A595 N 0 0 0 0 0 0 0 0
Homewood Rd A595 S 0 1 0 0 0 0 0 0
Homewood Rd A595 N 0 0 0 0 0 -2 0 0
Homewood Rd B5295 0 0 0 0 0 0 0 0
A595 S A595 N 0 0 -1 0 1 1 -1 0
A595 S A595 S 0 0 0 0 0 0 0 0
A595 S Homewood Rd 0 0 0 0 0 0 0 0
St Bees Road /
Mirehouse Road
St Bees Rd N Mirehouse Rd 0 0 0 0 0 0 0 0
St Bees Rd N St Bees Rd S 0 0 0 0 0 0 0 0
Mirehouse Rd St Bees Rd S 0 1 1 0 1 0 0 0
Mirehouse Rd St Bees Rd N 0 0 0 0 0 0 0 -2

Technical Note
West Cumbria Mining Traffic Modelling –
Technical Note
26
Junction From To 05:00 06:00 07:00 08:00 14:00 15:00 16:00 17:00
St Bees Rd S St Bees Rd N 0 0 0 0 0 0 0 0
St Bees Rd S Mirehouse Rd 0 0 0 1 1 1 0 1
St Bees Road / Wilson
Pit Road
St Bees Rd N St Bees Rd S 0 0 0 0 0 0 0 0
St Bees Rd N Wilson Pit Rd 0 1 1 0 1 0 0 0
St Bees Rd S Wilson Pit Rd 0 0 0 0 0 0 1 0
St Bees Rd S St Bees Rd N 0 0 0 0 0 0 0 0
Wilson Pit Rd St Bees Rd N 0 0 0 0 1 1 0 1
Wilson Pit Rd St Bees Rd S 0 0 0 0 0 0 0 0
High Road / Wilson Pit
Road
Woodville Way Wilson Pit Rd 0 0 1 1 1 1 0 1
Woodville Way High Rd 0 0 0 0 0 0 0 0
Wilson Pit Rd High Rd 0 0 0 0 0 0 0 0
Wilson Pit Rd Woodville Way 0 1 1 1 0 0 0 0
High Rd Woodville Way 0 0 0 0 0 0 0 0
High Rd Wilson Pit Rd 0 0 0 0 0 0 0 0
Ginns to Kells Road /
Meadow View
B345 N B345 S 0 0 0 0 0 0 0 0
B345 N Ginns to Kells Rd 0 1 1 0 1 1 0 0
B345 S Ginns to Kells Rd 0 0 0 0 0 0 0 0
B345 S B345 N 0 0 0 -1 0 0 0 0
Ginns to Kells Rd B345 N 0 0 0 0 1 1 1 1
Ginns to Kells Rd B345 S 0 0 0 0 0 0 0 0
Preston Street / Coach
Road
Preston St N Coach Rd 0 0 0 0 0 0 0 0
Preston St N Preston St S 0 1 0 0 1 1 0 0
Coach Rd Preston St S 0 0 0 0 0 0 0 0
Coach Rd Preston St N 0 0 0 0 0 0 0 0
Preston St S Preston St N 0 0 0 0 1 1 0 0
Preston St S Coach Rd 0 0 0 0 0 0 0 0
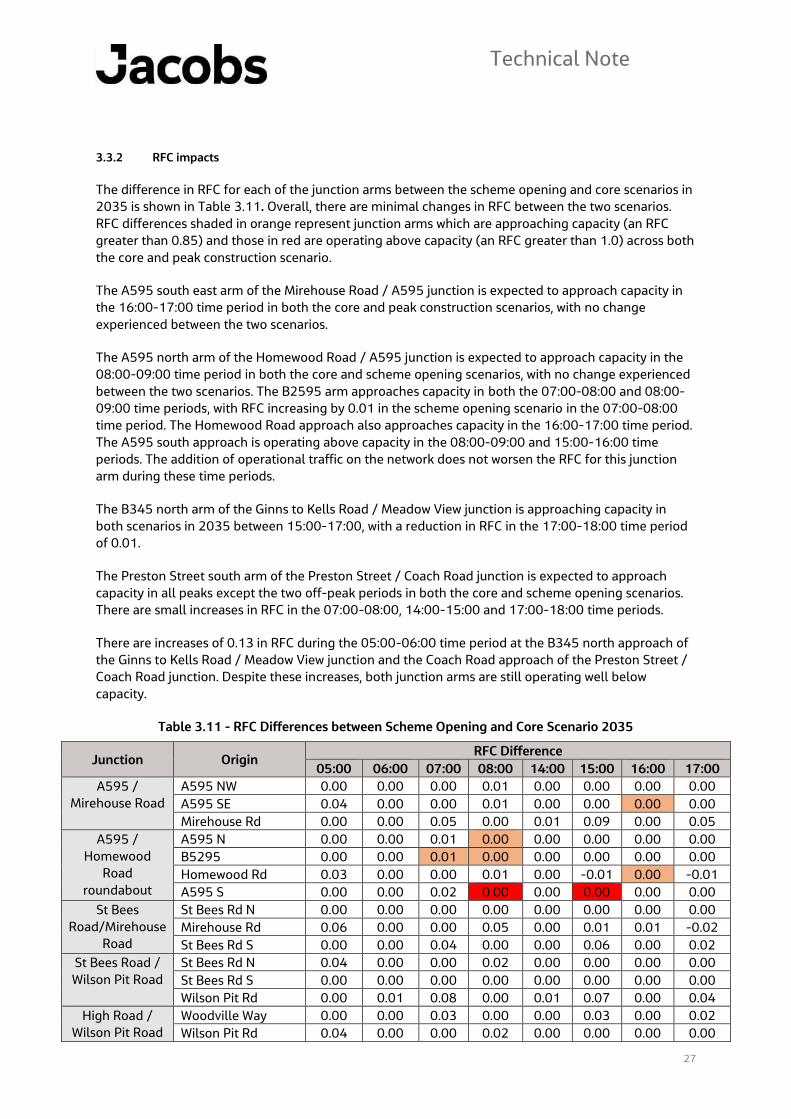
Technical Note
Rotterdam House
4th Floor
116 Quayside
Newcastle upon Tyne, NE1 3DY
United Kingdom
T +44 (0)191 206 4115
www.jacobs.com
27
3.3.2 RFC impacts
The difference in RFC for each of the junction arms between the scheme opening and core scenarios in
2035 is shown in Table 3.11. Overall, there are minimal changes in RFC between the two scenarios.
RFC differences shaded in orange represent junction arms which are approaching capacity (an RFC
greater than 0.85) and those in red are operating above capacity (an RFC greater than 1.0) across both
the core and peak construction scenario.
The A595 south east arm of the Mirehouse Road / A595 junction is expected to approach capacity in
the 16:00-17:00 time period in both the core and peak construction scenarios, with no change
experienced between the two scenarios.
The A595 north arm of the Homewood Road / A595 junction is expected to approach capacity in the
08:00-09:00 time period in both the core and scheme opening scenarios, with no change experienced
between the two scenarios. The B2595 arm approaches capacity in both the 07:00-08:00 and 08:00-
09:00 time periods, with RFC increasing by 0.01 in the scheme opening scenario in the 07:00-08:00
time period. The Homewood Road approach also approaches capacity in the 16:00-17:00 time period.
The A595 south approach is operating above capacity in the 08:00-09:00 and 15:00-16:00 time
periods. The addition of operational traffic on the network does not worsen the RFC for this junction
arm during these time periods.
The B345 north arm of the Ginns to Kells Road / Meadow View junction is approaching capacity in
both scenarios in 2035 between 15:00-17:00, with a reduction in RFC in the 17:00-18:00 time period
of 0.01.
The Preston Street south arm of the Preston Street / Coach Road junction is expected to approach
capacity in all peaks except the two off-peak periods in both the core and scheme opening scenarios.
There are small increases in RFC in the 07:00-08:00, 14:00-15:00 and 17:00-18:00 time periods.
There are increases of 0.13 in RFC during the 05:00-06:00 time period at the B345 north approach of
the Ginns to Kells Road / Meadow View junction and the Coach Road approach of the Preston Street /
Coach Road junction. Despite these increases, both junction arms are still operating well below
capacity.
Table 3.11 - RFC Differences between Scheme Opening and Core Scenario 2035
Junction Origin RFC Difference
05:00 06:00 07:00 08:00 14:00 15:00 16:00 17:00
A595 /
Mirehouse Road
A595 NW 0.00 0.00 0.00 0.01 0.00 0.00 0.00 0.00
A595 SE 0.04 0.00 0.00 0.01 0.00 0.00 0.00 0.00
Mirehouse Rd 0.00 0.00 0.05 0.00 0.01 0.09 0.00 0.05
A595 /
Homewood
Road
roundabout
A595 N 0.00 0.00 0.01 0.00 0.00 0.00 0.00 0.00
B5295 0.00 0.00 0.01 0.00 0.00 0.00 0.00 0.00
Homewood Rd 0.03 0.00 0.00 0.01 0.00 -0.01 0.00 -0.01
A595 S 0.00 0.00 0.02 0.00 0.00 0.00 0.00 0.00
St Bees
Road/Mirehouse
Road
St Bees Rd N 0.00 0.00 0.00 0.00 0.00 0.00 0.00 0.00
Mirehouse Rd 0.06 0.00 0.00 0.05 0.00 0.01 0.01 -0.02
St Bees Rd S 0.00 0.00 0.04 0.00 0.00 0.06 0.00 0.02
St Bees Road /
Wilson Pit Road
St Bees Rd N 0.04 0.00 0.00 0.02 0.00 0.00 0.00 0.00
St Bees Rd S 0.00 0.00 0.00 0.00 0.00 0.00 0.00 0.00
Wilson Pit Rd 0.00 0.01 0.08 0.00 0.01 0.07 0.00 0.04
High Road /
Wilson Pit Road
Woodville Way 0.00 0.00 0.03 0.00 0.00 0.03 0.00 0.02
Wilson Pit Rd 0.04 0.00 0.00 0.02 0.00 0.00 0.00 0.00
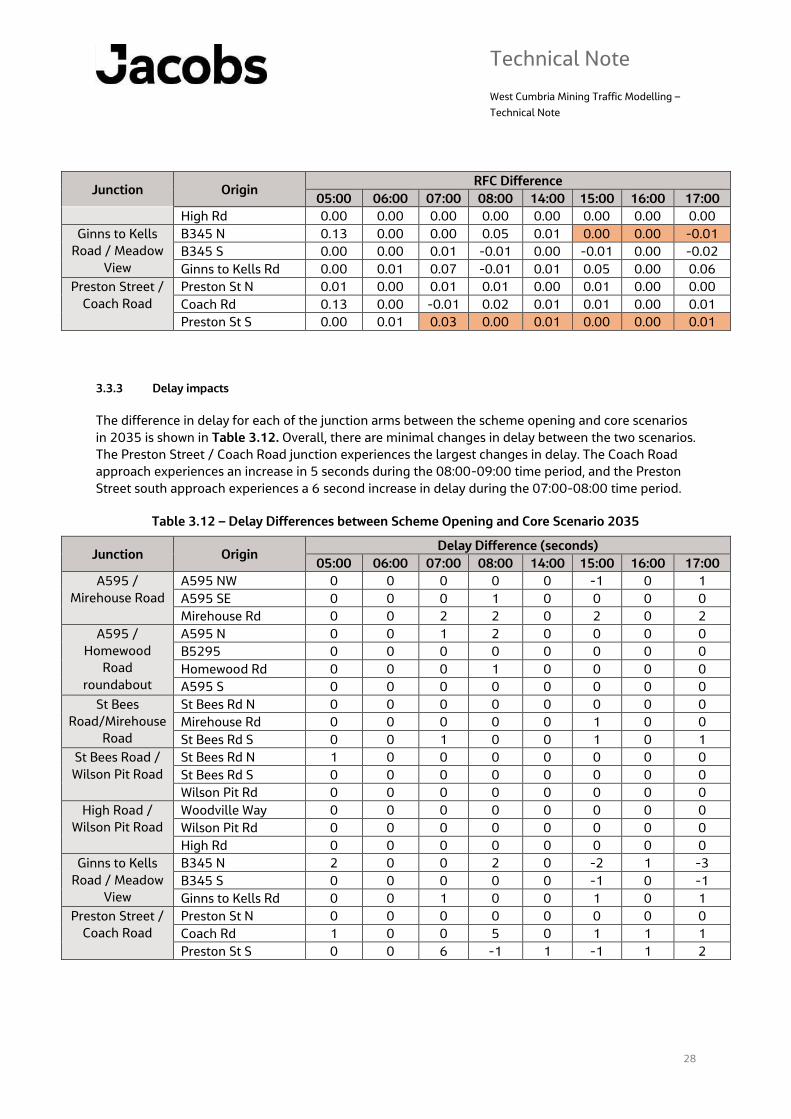
Technical Note
West Cumbria Mining Traffic Modelling –
Technical Note
28
Junction Origin RFC Difference
05:00 06:00 07:00 08:00 14:00 15:00 16:00 17:00
High Rd 0.00 0.00 0.00 0.00 0.00 0.00 0.00 0.00
Ginns to Kells
Road / Meadow
View
B345 N 0.13 0.00 0.00 0.05 0.01 0.00 0.00 -0.01
B345 S 0.00 0.00 0.01 -0.01 0.00 -0.01 0.00 -0.02
Ginns to Kells Rd 0.00 0.01 0.07 -0.01 0.01 0.05 0.00 0.06
Preston Street /
Coach Road
Preston St N 0.01 0.00 0.01 0.01 0.00 0.01 0.00 0.00
Coach Rd 0.13 0.00 -0.01 0.02 0.01 0.01 0.00 0.01
Preston St S 0.00 0.01 0.03 0.00 0.01 0.00 0.00 0.01
3.3.3 Delay impacts
The difference in delay for each of the junction arms between the scheme opening and core scenarios
in 2035 is shown in Table 3.12. Overall, there are minimal changes in delay between the two scenarios.
The Preston Street / Coach Road junction experiences the largest changes in delay. The Coach Road
approach experiences an increase in 5 seconds during the 08:00-09:00 time period, and the Preston
Street south approach experiences a 6 second increase in delay during the 07:00-08:00 time period.
Table 3.12 – Delay Differences between Scheme Opening and Core Scenario 2035
Junction Origin Delay Difference (seconds)
05:00 06:00 07:00 08:00 14:00 15:00 16:00 17:00
A595 /
Mirehouse Road
A595 NW 0 0 0 0 0 -1 0 1
A595 SE 0 0 0 1 0 0 0 0
Mirehouse Rd 0 0 2 2 0 2 0 2
A595 /
Homewood
Road
roundabout
A595 N 0 0 1 2 0 0 0 0
B5295 0 0 0 0 0 0 0 0
Homewood Rd 0 0 0 1 0 0 0 0
A595 S 0 0 0 0 0 0 0 0
St Bees
Road/Mirehouse
Road
St Bees Rd N 0 0 0 0 0 0 0 0
Mirehouse Rd 0 0 0 0 0 1 0 0
St Bees Rd S 0 0 1 0 0 1 0 1
St Bees Road /
Wilson Pit Road
St Bees Rd N 1 0 0 0 0 0 0 0
St Bees Rd S 0 0 0 0 0 0 0 0
Wilson Pit Rd 0 0 0 0 0 0 0 0
High Road /
Wilson Pit Road
Woodville Way 0 0 0 0 0 0 0 0
Wilson Pit Rd 0 0 0 0 0 0 0 0
High Rd 0 0 0 0 0 0 0 0
Ginns to Kells
Road / Meadow
View
B345 N 2 0 0 2 0 -2 1 -3
B345 S 0 0 0 0 0 -1 0 -1
Ginns to Kells Rd 0 0 1 0 0 1 0 1
Preston Street /
Coach Road
Preston St N 0 0 0 0 0 0 0 0
Coach Rd 1 0 0 5 0 1 1 1
Preston St S 0 0 6 -1 1 -1 1 2
Technical Note
West Cumbria Mining Traffic Modelling –
Technical Note
29
4. Summary
This technical note has been prepared by Jacobs in response to a request from Cumbria County Council
(CCC) to undertake transport modelling, using the West Cumbria Transport Model (WCTM), to assess
the transport impacts of West Cumbria Mining development on the road network.
The technical note summarises the work carried out in developing and testing the forecast scenarios
using an updated version of the WCTM which includes the Bothel extension. Two forecast years were
developed, 2025 and 2035, to compare a core scenario for each year with a peak construction scenario
(2025 only) and scheme opening scenarios (2025 and 2035). The additional trips generated as a result
of West Cumbria Mining and their distribution were provided by CCC and loaded into the model.
Turning movements, RFC and delay at seven junctions were analysed to assess the impact of the West
Cumbria Mining development on the road network. When compared to the core scenario, there are
minimal changes to RFCs and delay time for the peak construction scenario in 2025 and the scheme
opening scenario in both years. Changes in turning movements vary between the scenarios, time periods
and junctions, with the most significant differences occurring in the scheme opening scenarios.
Appendix B: WCTM Traffic Forecast Diagrams
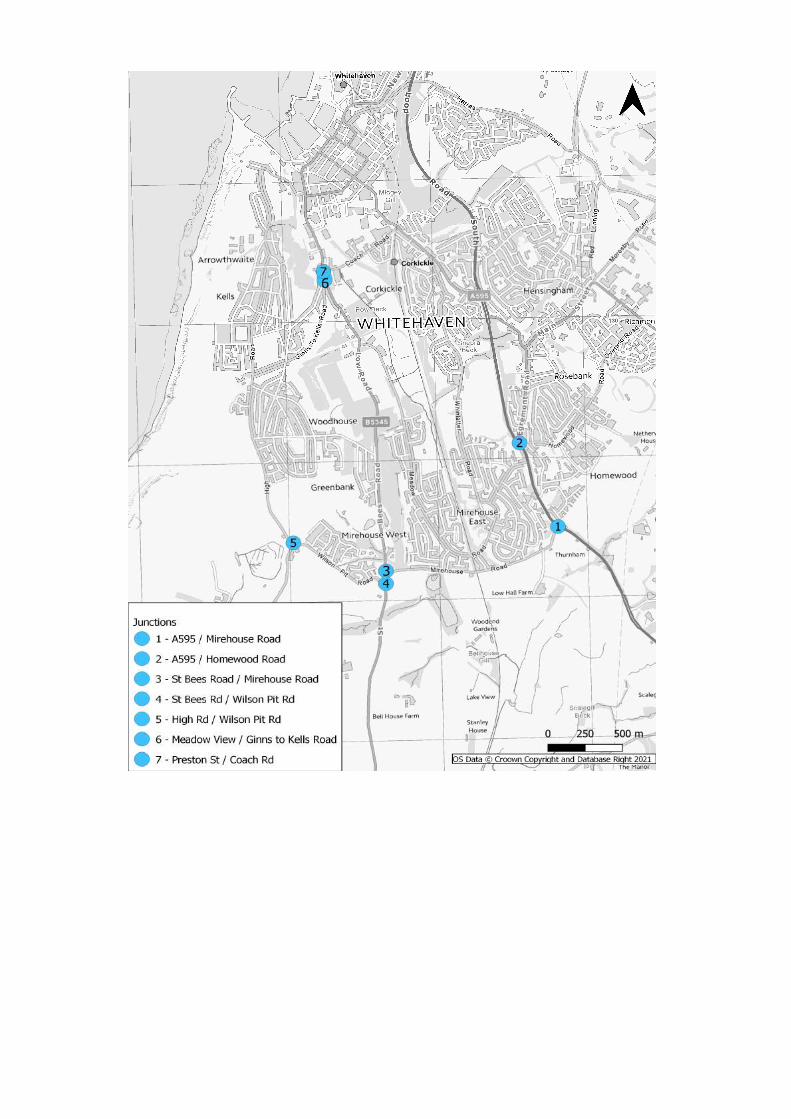

Time Period 05:00 Turning Movements - Lights
Turning Movements - HGVs 0.22
RFC 6.62
1. A595/Mirehouse Road Delay 2. A595/Homewood Road 0 1 0
0 175 0
0.54 0.48
13.11 10.90
15 0 0
16 730 511 19 0
1 33
0.18
13.81
165 4
15 0
0.13
6.80
0.36
52 110 35.98 0 0
0 1 18 0
75 0
3. St Bees Rd/Mirehouse Rd and St Bees Rd/Wilson Pit Rd
0.05
0 0 3.68 157 60 43 0.22
10 70 3 1 0 5.02
10 0
39 1 4. High Rd/Wilson Pit Rd
0.04
1.9 0.03
1.54
0.05
3.75 17 57 0 46
1 0 0 5
0 1 0.01
24 26 0.03 1.10
2.27
9 0
0.06 7 0
1.87
0 66
0 46 8 15
0 0
0.05
1 8 6.57
0.01 0 1
1.09
5. Meadow View/Ginns to Kells Rd 6. Preston St / Coach Rd
0 0 0.13
59 59 3.76 0.04
1.09
0 0
50 14
14 0
67 0
0.15
7.92
48 53
1 0
0.13
0.09 4.63
6.32
0.05
2.78
61 4
0 0
1 39
0 1
Homewood Rd
B5
29
5
Mirehouse Rd
Wilson Pit Rd
St B
ee
s R
d
Coach Rd
Pre
sto
nS
t

Time Period 06:00 Turning Movements - Lights
Turning Movements - HGVs 0.38
RFC 8.41
1. A595/Mirehouse Road Delay 2. A595/Homewood Road 0 4 0
0 257 0
0.66 0.62
19.42 15.85
23 0 0
27 927 622 31 0
1 59
0.19
13.88
156 10
13 0
0.26
8.82
0.37
95 71 35.93 0 0
0 2 26 0
120 1
3. St Bees Rd/Mirehouse Rd and St Bees Rd/Wilson Pit Rd
0.14
5 1 9.67 162 92 69 0.28
190 28 10 1 0 5.3
13 0
141 1 4. High Rd/Wilson Pit Rd
0.17
4.66 0.07
1.56
0.08
5.31 36 100 0 98
2 0 0 10
0 6 0.01
35 297 0.21 1.10
1.99
15 0
0.13 10 0
3.04
0 124
1 102 15 29
0 1
0.09
3 13 6.97
0.01 0 2
1.11
5. Meadow View/Ginns to Kells Rd 6. Preston St / Coach Rd
1 5 0.26
95 183 3.3 0.08
1.11
5 0
121 14
20 0
157 1
0.40
11.77
82 88
3 0
0.26
0.15 6.51
6.57
0.08
3.94
100 0
1 0
2 70
0 2
Homewood Rd
B5
29
5
Mirehouse Rd
Wilson Pit Rd
St B
ee
s R
d
Coach Rd
Pre
sto
nS
t

Time Period 07:00 Turning Movements - Lights
Turning Movements - HGVs 0.53
RFC 11.06
1. A595/Mirehouse Road Delay 2. A595/Homewood Road 0 4 0
0 324 1
0.65 0.77
19.83 20.69
29 1 0
30 891 628 78 1
1 100
0.40
19.84
386 14
54 1
0.43
11.10
0.52
166 140 39.43 3 0
1 1 78 1
149 0
3. St Bees Rd/Mirehouse Rd and St Bees Rd/Wilson Pit Rd
0.09
4 1 6.32 394 213 126 0.65
79 60 15 1 0 8.81
45 0
99 1 4. High Rd/Wilson Pit Rd
0.14
4.4 0.09
2.18
0.16
6 42 222 0 98
1 1 1 23
0 4 0.03
69 109 0.11 1.12
2.43
74 0
0.12 25 0
2.43
0 199
0 37 33 25
0 0
0.11
13 64 7.01
0.05 0 2
1.26
5. Meadow View/Ginns to Kells Rd 6. Preston St / Coach Rd
2 4 0.42
201 125 6.03 0.16
1.22
6 1
235 31
39 1
92 0
0.60
31.27
201 181
3 0
0.70
0.40 19.11
8.48
0.15
6.76
254 5
2 0
7 127
0 2
Homewood Rd
B5
29
5
Mirehouse Rd
Wilson Pit Rd
St B
ee
s R
d
Coach Rd
Pre
sto
nS
t

Time Period 08:00 Turning Movements - Lights
Turning Movements - HGVs 0.55
RFC 11.95
1. A595/Mirehouse Road Delay 2. A595/Homewood Road 0 4 0
5 315 0
0.55 0.86
16.8 25.15
31 3 0
31 663 508 190 0
1 175
0.53
27.19
556 24
63 1
0.51
10.50
0.72
233 194 45.38 0 0
1 2 143 2
164 0
3. St Bees Rd/Mirehouse Rd and St Bees Rd/Wilson Pit Rd
0.10
2 2 7.35 517 327 182 0.96
15 152 23 2 0 26.78
68 1
163 1 4. High Rd/Wilson Pit Rd
0.24
4.18 0.14
2.51
0.19
7.55 29 271 0 135
2 1 1 36
0 2 0.05
132 46 0.11 1.18
3.61
172 0
0.16 35 0
2.4
0 248
0 18 44 33
1 0
0.16
13 52 7.76
0.04 0 3
1.23
5. Meadow View/Ginns to Kells Rd 6. Preston St / Coach Rd
3 3 0.55
278 115 8.31 0.24
1.37
6 1
296 94
33 1
97 0
0.75
58.47
293 167
6 0
0.91
0.49 50.36
9.72
0.18
8.39
306 7
3 0
8 153
0 3
Homewood Rd
B5
29
5
Mirehouse Rd
Wilson Pit Rd
St B
ee
s R
d
Coach Rd
Pre
sto
nS
t

Time Period 14:00 Turning Movements - Lights
Turning Movements - HGVs 0.21
RFC 6.88
1. A595/Mirehouse Road Delay 2. A595/Homewood Road 0 1 0
1 159 0
0.43 0.56
17.04 12.25
19 2 0
18 431 408 107 0
1 168
0.76
40.72
836 24
117 1
0.33
7.09
0.40
98 95 36.45 0 0
0 2 67 0
159 1
3. St Bees Rd/Mirehouse Rd and St Bees Rd/Wilson Pit Rd
0.07
1 1 5.51 717 244 102 0.96
13 104 24 1 0 30.4
84 1
156 1 4. High Rd/Wilson Pit Rd
0.23
3.39 0.12
2.92
0.11
4.47 46 136 0 92
3 1 1 39
0 2 0.05
125 43 0.10 1.14
3.65
124 0
0.06 27 0
2.2
0 112
0 16 31 21
1 0
0.10
31 70 7.13
0.06 0 3
1.35
5. Meadow View/Ginns to Kells Rd 6. Preston St / Coach Rd
3 3 0.55
263 171 7.52 0.29
1.48
5 0
365 119
35 0
68 0
0.67
68.34
282 99
6 0
0.73
0.36 23.38
8.44
0.17
8.61
230 5
2 0
5 151
0 4
Homewood Rd
B5
29
5
Mirehouse Rd
Wilson Pit Rd
St B
ee
s R
d
Coach Rd
Pre
sto
nS
t

Time Period 15:00 Turning Movements - Lights
Turning Movements - HGVs 0.29
RFC 7.74
1. A595/Mirehouse Road Delay 2. A595/Homewood Road 0 2 0
2 205 0
0.57 0.67
21.49 15.91
12 1 0
12 531 510 114 0
1 250
0.74
39.17
833 22
94 1
0.50
9.02
0.45
95 132 37.36 0 0
0 3 143 1
211 1
3. St Bees Rd/Mirehouse Rd and St Bees Rd/Wilson Pit Rd
0.09
3 2 6.71 664 282 190 0.99
18 124 18 6 1 51.12
83 1
197 1 4. High Rd/Wilson Pit Rd
0.29
4.09 0.17
2.81
0.17
4.28 111 152 0 141
8 1 1 49
0 3 0.07
157 58 0.13 1.16
4.19
148 0
0.08 33 0
2.61
0 119
0 13 36 26
1 0
0.13
48 144 7.51
0.13 0 9
1.7
5. Meadow View/Ginns to Kells Rd 6. Preston St / Coach Rd
3 5 0.70
318 213 11.12 0.40
1.76
7 1
484 180
20 0
47 0
0.59
102.62
379 62
12 1
0.82
0.35 30.37
8.67
0.26
14.03
214 1
3 0
0 226
0 10
Homewood Rd
B5
29
5
Mirehouse Rd
Wilson Pit Rd
St B
ee
s R
d
Coach Rd
Pre
sto
nS
t

Time Period 16:00 Turning Movements - Lights
Turning Movements - HGVs 0.36
RFC 8.54
1. A595/Mirehouse Road Delay 2. A595/Homewood Road 0 1 0
0 249 0
0.69 0.76
25.41 19.04
8 1 0
8 641 613 101 0
1 294
0.85
47
833 15
253 3
0.77
15.18
0.47
65 174 38.16 0 0
0 2 207 0
289 0
3. St Bees Rd/Mirehouse Rd and St Bees Rd/Wilson Pit Rd
0.10
1 2 7.26 631 297 94 0.99
22 144 14 2 0 74.45
141 1
281 1 4. High Rd/Wilson Pit Rd
0.51
6.16 0.20
3.34
0.21
4.22 174 157 0 144
6 1 0 66
0 1 0.11
232 72 0.18 1.21
5.29
199 0
0.09 44 0
3.02
0 122
0 18 43 34
1 0
0.16
45 210 8.03
0.16 0 6
1.9
5. Meadow View/Ginns to Kells Rd 6. Preston St / Coach Rd
1 2 0.86
375 257 22.67 0.45
1.93
4 1
584 187
11 0
47 0
0.67
114.55
502 47
10 0
0.91
0.39 40.83
9.57
0.36
20.71
228 1
2 0
0 321
0 8
Homewood Rd
B5
29
5
Mirehouse Rd
Wilson Pit Rd
St B
ee
s R
d
Coach Rd
Pre
sto
nS
t
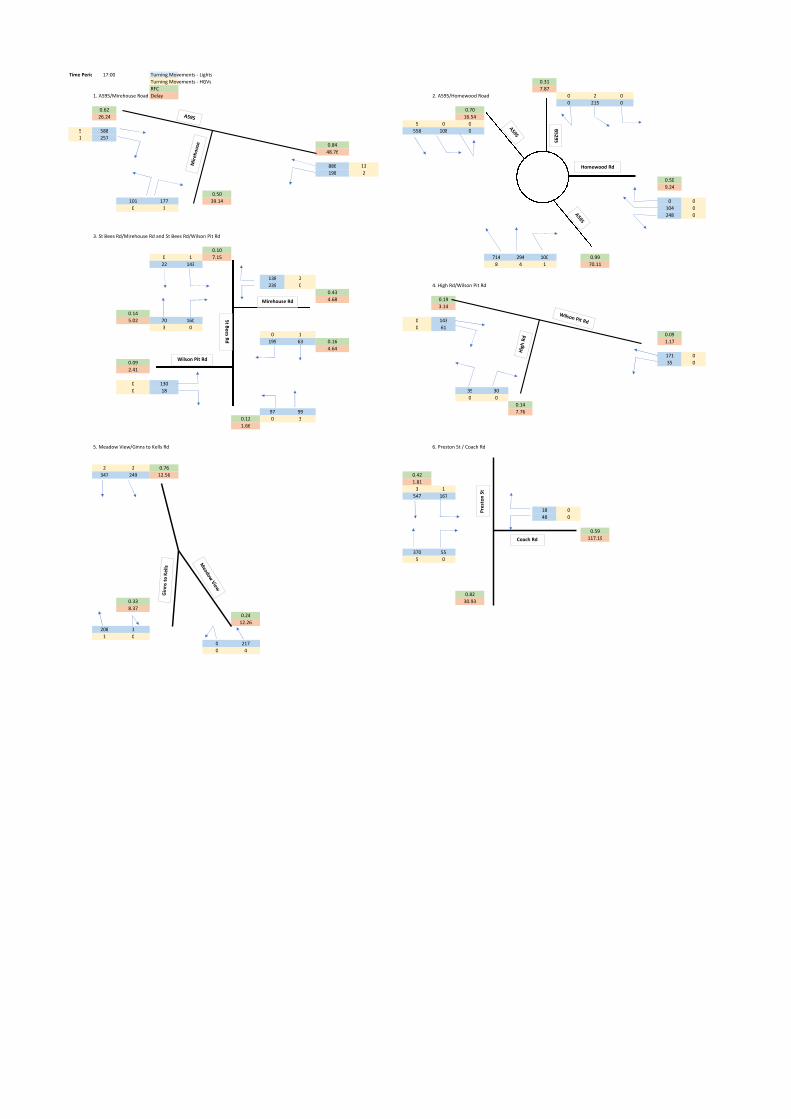
Time Period 17:00 Turning Movements - Lights
Turning Movements - HGVs 0.31
RFC 7.87
1. A595/Mirehouse Road Delay 2. A595/Homewood Road 0 2 0
0 215 0
0.62 0.70
26.24 16.54
5 0 0
5 588 558 108 0
1 257
0.84
48.76
886 13
198 2
0.50
9.24
0.50
101 177 39.14 0 0
0 1 104 0
248 0
3. St Bees Rd/Mirehouse Rd and St Bees Rd/Wilson Pit Rd
0.10
0 1 7.15 714 294 100 0.99
22 143 8 4 1 70.11
138 2
239 0 4. High Rd/Wilson Pit Rd
0.43
4.68 0.19
3.14
0.14
5.02 70 160 0 143
3 0 0 61
0 1 0.09
199 63 0.16 1.17
4.64
171 0
0.09 35 0
2.41
0 130
0 18 39 30
0 0
0.14
97 99 7.76
0.12 0 3
1.66
5. Meadow View/Ginns to Kells Rd 6. Preston St / Coach Rd
2 2 0.76
347 249 12.56 0.42
1.81
3 1
547 167
18 0
48 0
0.59
117.19
370 55
5 0
0.82
0.33 30.93
8.37
0.24
12.26
208 1
1 0
0 217
0 4
Homewood Rd
B5
29
5
Mirehouse Rd
Wilson Pit Rd
St B
ee
s R
d
Coach Rd
Pre
sto
nS
t

Time Period 05:00 Turning Movements - Lights
Turning Movements - HGVs 0.20
RFC 6.56
1. A595/Mirehouse Road Delay 2. A595/Homewood Road 0 1 0
0 165 0
0.53 0.48
12.82 10.84
15 0 0
16 716 511 17 0
1 33
0.17
13.61
151 4
14 2
0.12
6.73
0.36
51 107 35.96 0 0
0 2 16 0
73 0
3. St Bees Rd/Mirehouse Rd and St Bees Rd/Wilson Pit Rd
0.05
0 0 3.53 142 58 41 0.20
12 65 3 1 0 4.96
9 0
37 2 4. High Rd/Wilson Pit Rd
0.04
1.91 0.03
1.55
0.05
3.74 20 62 1 40
1 2 0 5
1 1 0.01
24 25 0.03 1.08
2.42
9 1
0.05 7 0
1.84
2 75
0 32 8 14
0 0
0.04
1 7 6.57
0.01 0 1
1.09
5. Meadow View/Ginns to Kells Rd 6. Preston St / Coach Rd
2 0 0.12
54 56 3.75 0.03
1.08
0 0
46 13
13 0
64 2
0.15
7.79
45 49
3 0
0.12
0.09 4.43
6.29
0.05
2.78
54 4
2 0
1 40
0 1
Homewood Rd
B5
29
5
Mirehouse Rd
Wilson Pit Rd
St B
ee
s R
d
Coach Rd
Pre
sto
nS
t
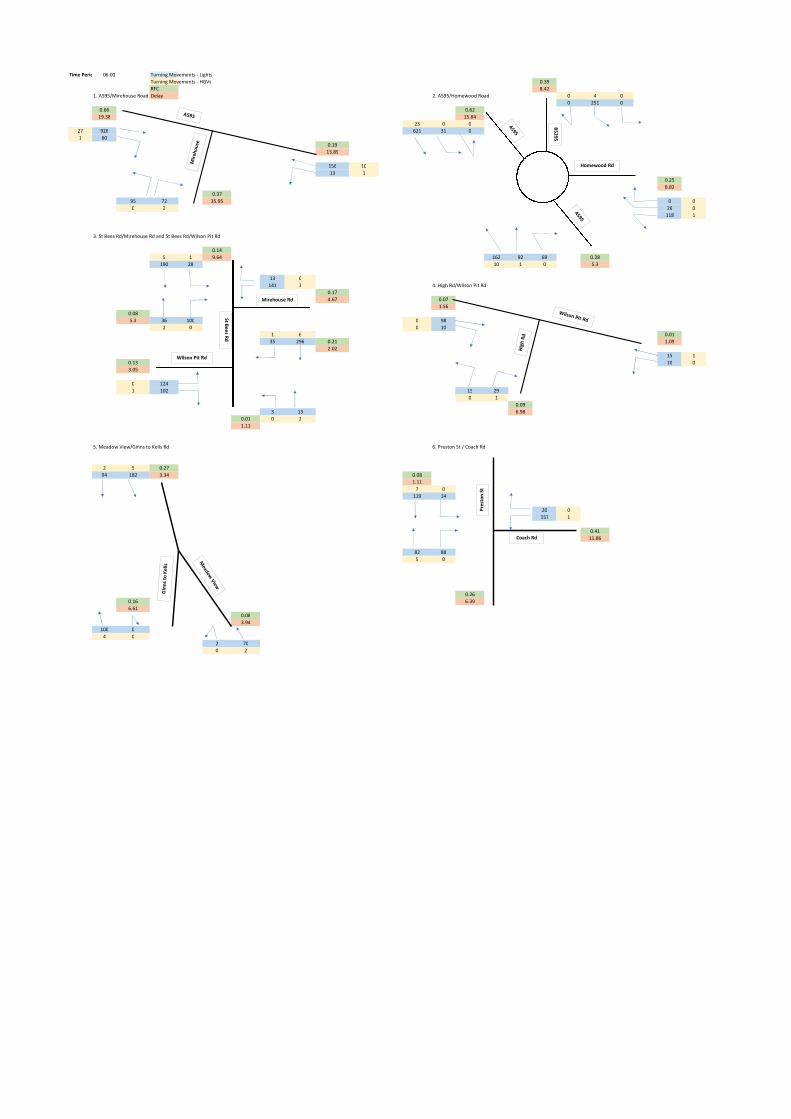
Time Period 06:00 Turning Movements - Lights
Turning Movements - HGVs 0.39
RFC 8.42
1. A595/Mirehouse Road Delay 2. A595/Homewood Road 0 4 0
0 251 0
0.66 0.62
19.38 15.84
23 0 0
27 926 621 31 0
1 60
0.19
13.89
156 10
13 1
0.25
8.82
0.37
95 72 35.95 0 0
0 2 26 0
118 1
3. St Bees Rd/Mirehouse Rd and St Bees Rd/Wilson Pit Rd
0.14
5 1 9.64 162 92 69 0.28
190 28 10 1 0 5.3
13 0
141 3 4. High Rd/Wilson Pit Rd
0.17
4.67 0.07
1.56
0.08
5.3 36 100 0 98
2 0 0 10
1 6 0.01
35 296 0.21 1.09
2.02
15 1
0.13 10 0
3.05
0 124
1 102 15 29
0 1
0.09
3 13 6.98
0.01 0 2
1.11
5. Meadow View/Ginns to Kells Rd 6. Preston St / Coach Rd
2 5 0.27
94 182 3.34 0.08
1.11
7 0
119 14
20 0
157 1
0.41
11.86
82 88
5 0
0.26
0.16 6.39
6.61
0.08
3.94
100 0
4 0
2 70
0 2
Homewood Rd
B5
29
5
Mirehouse Rd
Wilson Pit Rd
St B
ee
s R
d
Coach Rd
Pre
sto
nS
t

Time Period 07:00 Turning Movements - Lights
Turning Movements - HGVs 0.53
RFC 11.18
1. A595/Mirehouse Road Delay 2. A595/Homewood Road 0 4 0
0 326 0
0.65 0.77
20.13 20.85
29 1 0
30 888 630 77 0
1 117
0.42
20.51
386 14
92 2
0.46
11.41
0.53
170 141 39.61 0 0
1 1 77 1
162 0
3. St Bees Rd/Mirehouse Rd and St Bees Rd/Wilson Pit Rd
0.09
3 1 6.22 399 213 130 0.66
78 58 15 1 0 8.94
40 0
152 2 4. High Rd/Wilson Pit Rd
0.21
4.01 0.10
2.15
0.16
5.99 45 227 2 102
1 1 1 22
2 4 0.06
123 106 0.14 1.13
3.13
124 2
0.13 25 0
2.52
0 207
2 37 33 26
0 0
0.12
13 64 7.27
0.05 0 2
1.26
5. Meadow View/Ginns to Kells Rd 6. Preston St / Coach Rd
3 4 0.54
272 121 7.75 0.20
1.27
7 1
305 31
37 1
87 0
0.68
46.34
200 166
5 0
0.77
0.38 28.34
8.34
0.14
6.65
242 4
3 0
7 125
0 2
Homewood Rd
B5
29
5
Mirehouse Rd
Wilson Pit Rd
St B
ee
s R
d
Coach Rd
Pre
sto
nS
t
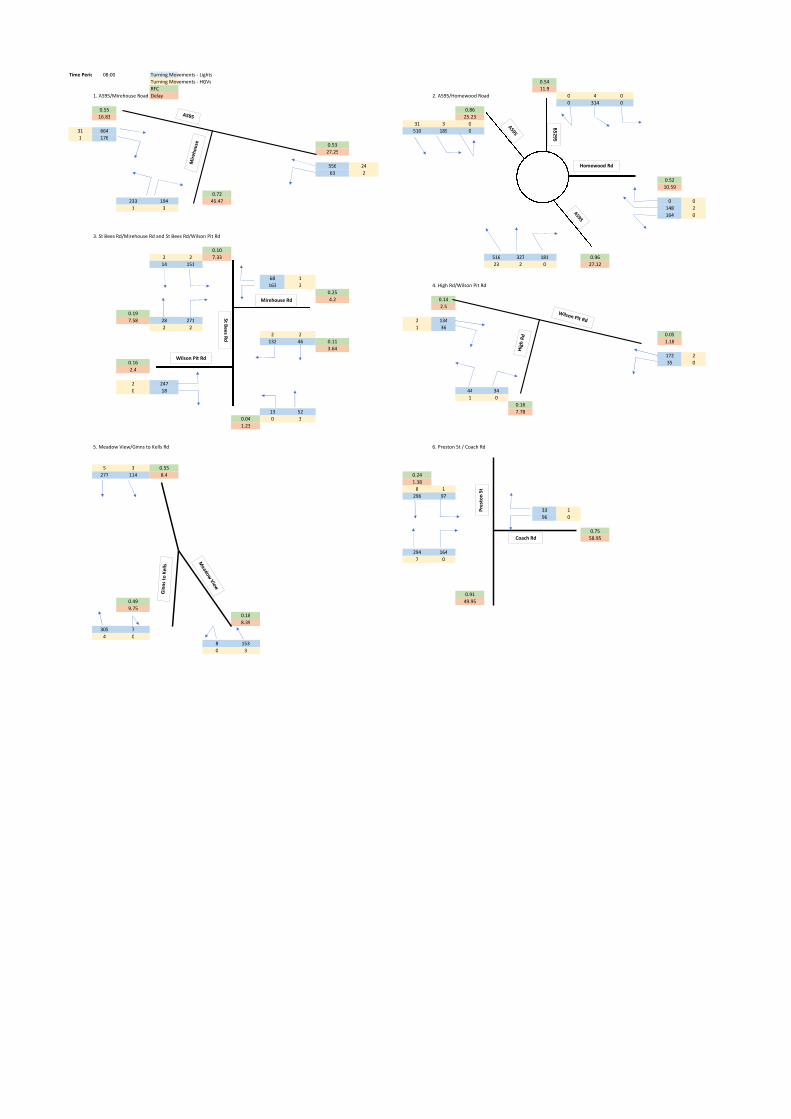
Time Period 08:00 Turning Movements - Lights
Turning Movements - HGVs 0.54
RFC 11.9
1. A595/Mirehouse Road Delay 2. A595/Homewood Road 0 4 0
0 314 0
0.55 0.86
16.83 25.23
31 3 0
31 664 510 189 0
1 176
0.53
27.25
556 24
63 2
0.52
10.59
0.72
233 194 45.47 0 0
1 3 148 2
164 0
3. St Bees Rd/Mirehouse Rd and St Bees Rd/Wilson Pit Rd
0.10
2 2 7.33 516 327 181 0.96
14 151 23 2 0 27.12
68 1
163 2 4. High Rd/Wilson Pit Rd
0.25
4.2 0.14
2.5
0.19
7.58 28 271 2 134
2 2 1 36
2 2 0.05
132 46 0.11 1.18
3.64
172 2
0.16 35 0
2.4
2 247
0 18 44 34
1 0
0.16
13 52 7.78
0.04 0 3
1.23
5. Meadow View/Ginns to Kells Rd 6. Preston St / Coach Rd
5 3 0.55
277 114 8.4 0.24
1.38
8 1
296 97
33 1
96 0
0.75
58.95
294 164
7 0
0.91
0.49 49.95
9.75
0.18
8.39
305 7
4 0
8 153
0 3
Homewood Rd
B5
29
5
Mirehouse Rd
Wilson Pit Rd
St B
ee
s R
d
Coach Rd
Pre
sto
nS
t

Time Period 14:00 Turning Movements - Lights
Turning Movements - HGVs 0.21
RFC 6.88
1. A595/Mirehouse Road Delay 2. A595/Homewood Road 0 1 0
0 161 0
0.43 0.56
17.09 12.21
19 2 0
18 431 406 107 0
1 169
0.76
40.78
836 24
116 2
0.33
7.10
0.41
98 95 36.51 0 0
0 3 98 0
159 1
3. St Bees Rd/Mirehouse Rd and St Bees Rd/Wilson Pit Rd
0.07
1 1 5.5 717 244 102 0.96
13 104 24 1 0 30.44
85 1
154 2 4. High Rd/Wilson Pit Rd
0.24
3.42 0.12
2.89
0.11
4.51 46 136 2 92
3 2 1 39
2 2 0.05
124 43 0.10 1.14
3.68
124 2
0.07 27 0
2.2
2 112
0 16 31 21
1 0
0.10
33 70 7.15
0.07 0 3
1.36
5. Meadow View/Ginns to Kells Rd 6. Preston St / Coach Rd
4 3 0.55
262 171 7.58 0.29
1.48
7 0
365 117
35 0
67 0
0.67
68.42
284 98
7 0
0.73
0.37 22.74
8.48
0.17
8.62
231 5
4 0
5 151
0 4
Homewood Rd
B5
29
5
Mirehouse Rd
Wilson Pit Rd
St B
ee
s R
d
Coach Rd
Pre
sto
nS
t
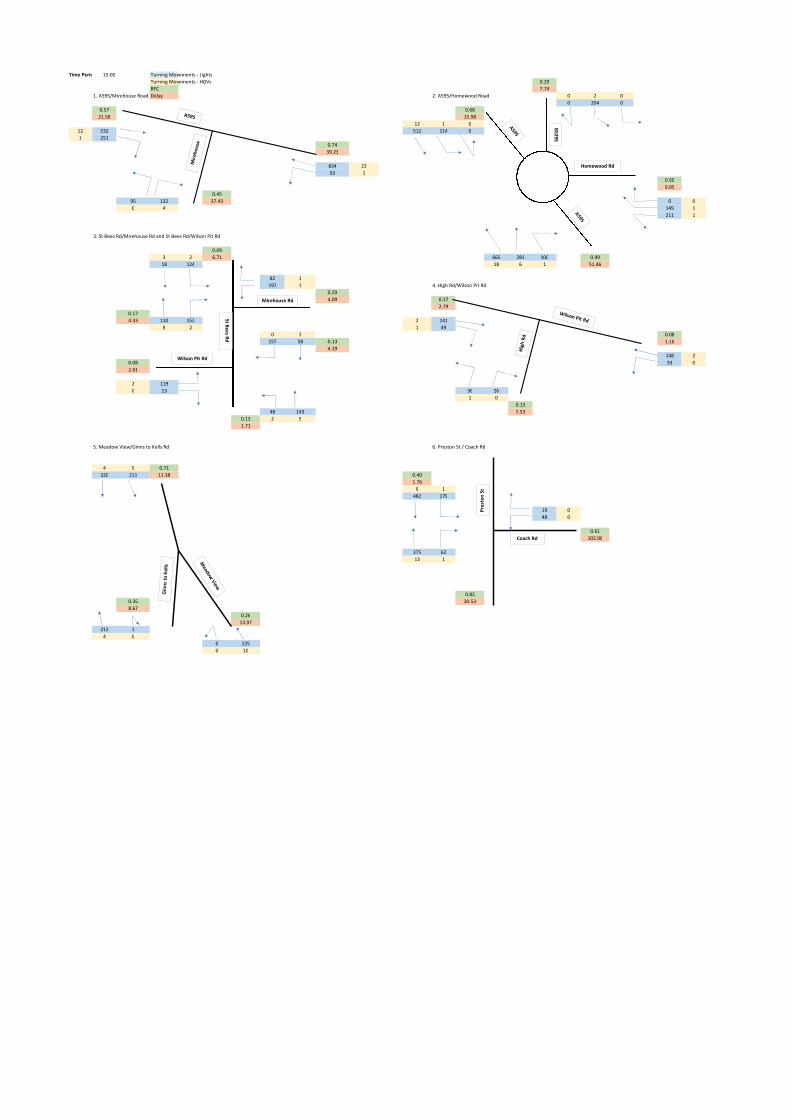
Time Period 15:00 Turning Movements - Lights
Turning Movements - HGVs 0.29
RFC 7.74
1. A595/Mirehouse Road Delay 2. A595/Homewood Road 0 2 0
0 204 0
0.57 0.68
21.58 15.98
12 1 0
12 532 512 114 0
1 251
0.74
39.23
834 23
93 1
0.50
9.05
0.45
95 132 37.43 0 0
0 4 145 1
211 1
3. St Bees Rd/Mirehouse Rd and St Bees Rd/Wilson Pit Rd
0.09
3 2 6.71 665 281 100 0.99
18 124 18 6 1 51.46
82 1
197 1 4. High Rd/Wilson Pit Rd
0.29
4.09 0.17
2.79
0.17
4.33 110 152 2 141
8 2 1 49
0 3 0.08
157 58 0.13 1.16
4.19
148 2
0.08 33 0
2.61
2 119
0 13 36 26
1 0
0.13
48 143 7.53
0.13 2 9
1.71
5. Meadow View/Ginns to Kells Rd 6. Preston St / Coach Rd
4 5 0.71
320 211 11.38 0.40
1.76
9 1
482 179
19 0
48 0
0.61
102.96
375 62
13 1
0.82
0.35 30.53
8.67
0.26
13.97
212 1
4 0
0 225
0 10
Homewood Rd
B5
29
5
Mirehouse Rd
Wilson Pit Rd
St B
ee
s R
d
Coach Rd
Pre
sto
nS
t

Time Period 16:00 Turning Movements - Lights
Turning Movements - HGVs 0.36
RFC 8.54
1. A595/Mirehouse Road Delay 2. A595/Homewood Road 0 1 0
0 249 0
0.69 0.76
25.34 19.07
8 1 0
8 640 614 101 0
1 294
0.85
47.1
834 15
253 3
0.77
15.18
0.47
65 175 38.27 0 0
0 3 207 0
288 0
3. St Bees Rd/Mirehouse Rd and St Bees Rd/Wilson Pit Rd
0.10
1 2 7.24 632 297 94 0.99
22 144 14 2 0 74.45
141 1
282 1 4. High Rd/Wilson Pit Rd
0.51
6.17 0.20
3.31
0.21
4.27 172 157 2 144
6 2 0 65
0 1 0.11
233 72 0.18 1.21
5.3
199 2
0.10 45 0
3.02
2 121
0 18 43 34
1 0
0.16
45 208 8.05
0.16 2 6
1.91
5. Meadow View/Ginns to Kells Rd 6. Preston St / Coach Rd
3 2 0.86
373 257 22.62 0.45
1.93
5 1
582 186
11 0
47 0
0.67
115.02
497 47
11 0
0.91
0.39 41.26
9.55
0.36
20.5
225 1
3 0
0 318
0 8
Homewood Rd
B5
29
5
Mirehouse Rd
Wilson Pit Rd
St B
ee
s R
d
Coach Rd
Pre
sto
nS
t
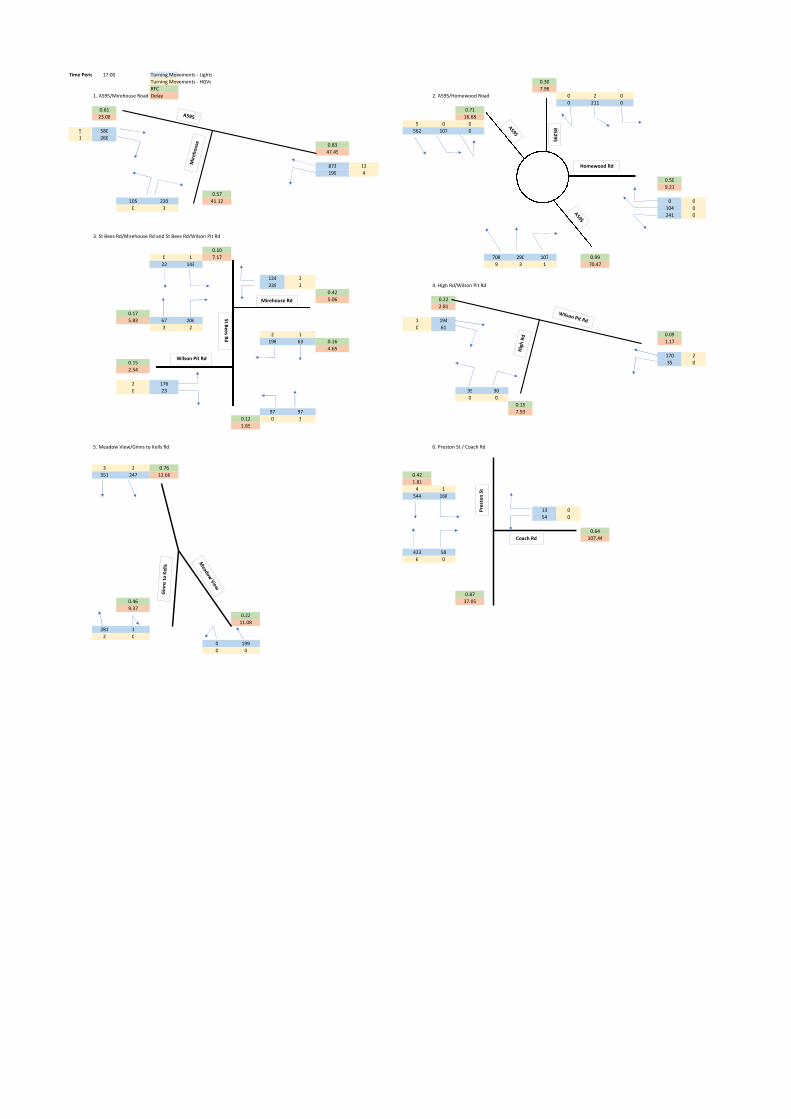
Time Period 17:00 Turning Movements - Lights
Turning Movements - HGVs 0.30
RFC 7.96
1. A595/Mirehouse Road Delay 2. A595/Homewood Road 0 2 0
0 211 0
0.61 0.71
23.08 16.68
5 0 0
5 580 562 107 0
1 260
0.83
47.45
873 13
199 4
0.50
9.21
0.57
105 220 41.12 0 0
0 3 104 0
241 0
3. St Bees Rd/Mirehouse Rd and St Bees Rd/Wilson Pit Rd
0.10
0 1 7.17 708 290 107 0.99
22 143 9 3 1 70.47
124 2
239 2 4. High Rd/Wilson Pit Rd
0.42
5.06 0.22
2.81
0.17
5.83 67 206 1 194
3 2 0 61
2 1 0.09
198 63 0.16 1.17
4.65
170 2
0.15 35 0
2.54
2 176
0 23 39 30
0 0
0.15
97 97 7.93
0.12 0 3
1.65
5. Meadow View/Ginns to Kells Rd 6. Preston St / Coach Rd
3 2 0.76
351 247 12.66 0.42
1.81
4 1
544 168
13 0
54 0
0.64
107.44
423 58
6 0
0.87
0.46 37.05
9.37
0.22
11.08
281 1
2 0
0 199
0 4
Homewood Rd
B5
29
5
Mirehouse Rd
Wilson Pit Rd
St B
ee
s R
d
Coach Rd
Pre
sto
nS
t

Time Period 05:00 Turning Movements - Lights
Turning Movements - HGVs 0.20
RFC 6.56
1. A595/Mirehouse Road Delay 2. A595/Homewood Road 0 1 0
0 166 0
0.53 0.48
12.85 10.84
15 0 0
16 716 511 17 0
1 37
0.18
13.63
151 4
22 0
0.12
6.75
0.36
51 107 35.9 0 0
0 1 16 0
76 0
3. St Bees Rd/Mirehouse Rd and St Bees Rd/Wilson Pit Rd
0.05
0 0 3.46 142 58 41 0.20
10 65 3 1 0 4.96
9 0
49 1 4. High Rd/Wilson Pit Rd
0.05
1.88 0.03
1.57
0.05
3.69 20 62 0 42
1 0 0 5
0 1 0.01
34 25 0.04 1.07
2.61
21 0
0.05 7 0
1.84
0 75
0 32 8 14
0 0
0.04
1 7 6.6
0.01 0 1
1.09
5. Meadow View/Ginns to Kells Rd 6. Preston St / Coach Rd
0 0 0.14
69 55 4.09 0.04
1.08
0 0
48 13
13 0
75 0
0.17
7.84
45 49
1 0
0.12
0.08 4.55
6.28
0.05
2.78
54 4
0 0
1 40
0 1
Homewood Rd
B5
29
5
Mirehouse Rd
Wilson Pit Rd
St B
ee
s R
d
Coach Rd
Pre
sto
nS
t
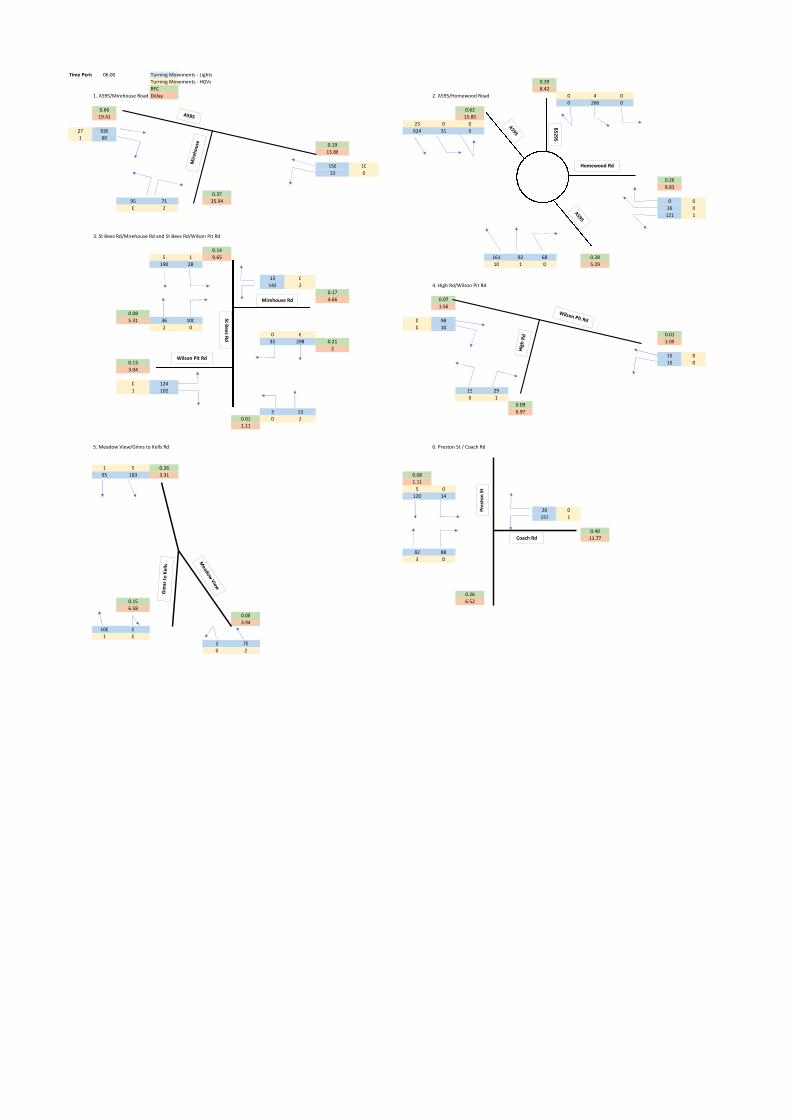
Time Period 06:00 Turning Movements - Lights
Turning Movements - HGVs 0.39
RFC 8.42
1. A595/Mirehouse Road Delay 2. A595/Homewood Road 0 4 0
0 266 0
0.66 0.62
19.41 15.85
23 0 0
27 926 624 31 0
1 60
0.19
13.88
156 10
13 0
0.26
8.83
0.37
95 71 35.94 0 0
0 2 26 0
121 1
3. St Bees Rd/Mirehouse Rd and St Bees Rd/Wilson Pit Rd
0.14
5 1 9.65 161 92 68 0.28
190 28 10 1 0 5.29
13 0
143 2 4. High Rd/Wilson Pit Rd
0.17
4.66 0.07
1.56
0.08
5.31 36 100 0 98
2 0 0 10
0 6 0.01
35 298 0.21 1.09
2
15 0
0.13 10 0
3.04
0 124
1 102 15 29
0 1
0.09
3 13 6.97
0.01 0 2
1.11
5. Meadow View/Ginns to Kells Rd 6. Preston St / Coach Rd
1 5 0.26
95 183 3.31 0.08
1.11
5 0
120 14
20 0
157 1
0.40
11.77
82 88
3 0
0.26
0.15 6.52
6.58
0.08
3.94
100 0
1 0
2 70
0 2
Homewood Rd
B5
29
5
Mirehouse Rd
Wilson Pit Rd
St B
ee
s R
d
Coach Rd
Pre
sto
nS
t

Time Period 07:00 Turning Movements - Lights
Turning Movements - HGVs 0.53
RFC 11.14
1. A595/Mirehouse Road Delay 2. A595/Homewood Road 0 4 0
0 324 1
0.65 0.77
19.83 20.76
29 1 0
30 891 631 77 0
1 99
0.40
19.81
385 14
54 1
0.43
11.10
0.52
168 140 39.5 0 0
1 1 78 1
148 0
3. St Bees Rd/Mirehouse Rd and St Bees Rd/Wilson Pit Rd
0.09
4 1 6.3 394 212 130 0.66
79 58 15 1 0 8.86
45 0
98 1 4. High Rd/Wilson Pit Rd
0.14
4.48 0.10
2.11
0.16
6.06 42 227 1 107
1 1 1 23
1 4 0.03
69 108 0.11 1.12
2.43
73 0
0.13 25 0
2.47
0 205
1 41 33 25
0 0
0.11
13 64 7.02
0.05 0 2
1.26
5. Meadow View/Ginns to Kells Rd 6. Preston St / Coach Rd
2 4 0.42
202 125 6.06 0.16
1.22
6 1
234 31
39 1
92 0
0.61
32.87
210 182
4 0
0.71
0.42 19.22
8.64
0.15
6.8
264 4
2 0
7 128
0 2
Homewood Rd
B5
29
5
Mirehouse Rd
Wilson Pit Rd
St B
ee
s R
d
Coach Rd
Pre
sto
nS
t

Time Period 08:00 Turning Movements - Lights
Turning Movements - HGVs 0.54
RFC 11.87
1. A595/Mirehouse Road Delay 2. A595/Homewood Road 0 4 0
0 313 0
0.56 0.86
17.12 25.16
31 3 0
31 663 512 185 0
1 186
0.54
27.6
555 24
81 1
0.52
10.73
0.72
236 194 45.54 0 0
1 2 145 2
170 0
3. St Bees Rd/Mirehouse Rd and St Bees Rd/Wilson Pit Rd
0.10
2 1 7.42 516 329 179 0.96
14 154 23 2 0 26.73
68 1
187 1 4. High Rd/Wilson Pit Rd
0.27
4.04 0.14
2.54
0.19
7.59 29 271 0 135
2 1 1 36
1 2 0.07
156 46 0.12 1.19
3.83
196 0
0.16 35 0
2.41
1 248
0 18 44 34
1 0
0.16
13 52 7.9
0.04 0 3
1.23
5. Meadow View/Ginns to Kells Rd 6. Preston St / Coach Rd
3 3 0.59
300 110 9.07 0.25
1.39
6 1
315 95
32 1
96 0
0.75
62.7
296 158
6 0
0.91
0.48 52.01
9.64
0.18
8.35
302 7
3 0
8 152
0 3
Homewood Rd
B5
29
5
Mirehouse Rd
Wilson Pit Rd
St B
ee
s R
d
Coach Rd
Pre
sto
nS
t
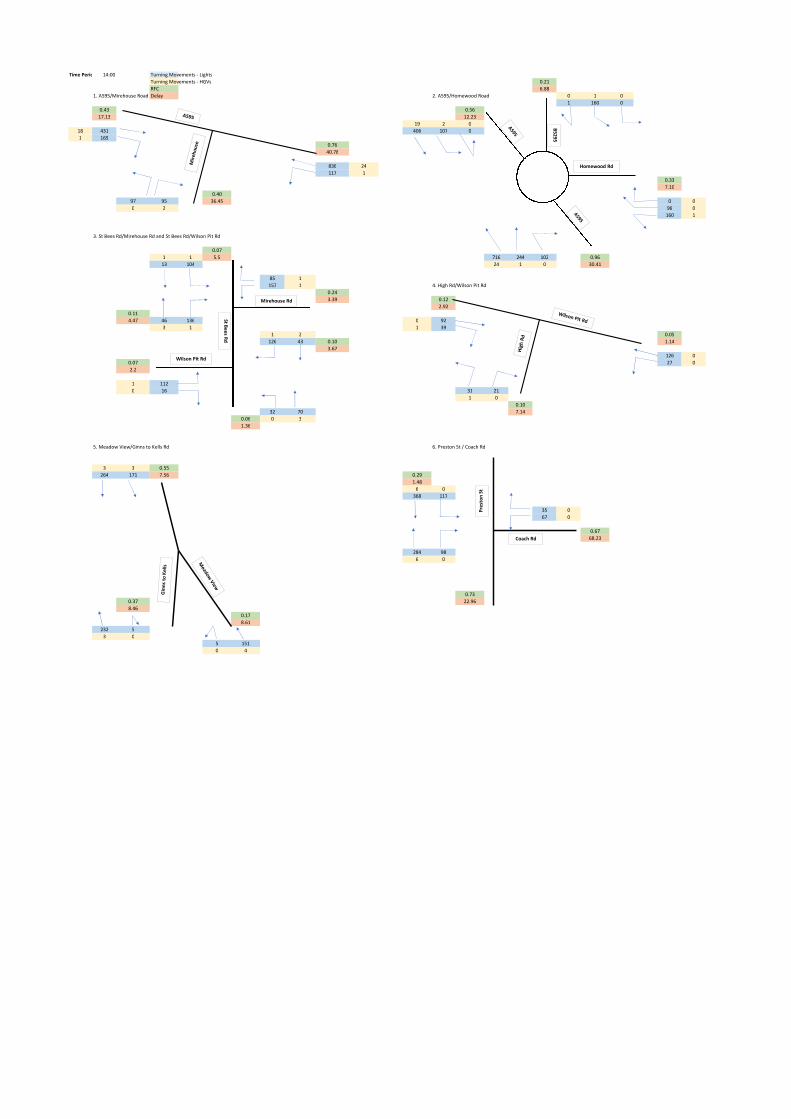
Time Period 14:00 Turning Movements - Lights
Turning Movements - HGVs 0.21
RFC 6.88
1. A595/Mirehouse Road Delay 2. A595/Homewood Road 0 1 0
1 160 0
0.43 0.56
17.13 12.23
19 2 0
18 431 406 107 0
1 169
0.76
40.78
836 24
117 1
0.33
7.10
0.40
97 95 36.45 0 0
0 2 96 0
160 1
3. St Bees Rd/Mirehouse Rd and St Bees Rd/Wilson Pit Rd
0.07
1 1 5.5 716 244 102 0.96
13 104 24 1 0 30.41
85 1
157 1 4. High Rd/Wilson Pit Rd
0.24
3.39 0.12
2.92
0.11
4.47 46 136 0 92
3 1 1 39
1 2 0.05
126 43 0.10 1.14
3.67
126 0
0.07 27 0
2.2
1 112
0 16 31 21
1 0
0.10
32 70 7.14
0.06 0 3
1.36
5. Meadow View/Ginns to Kells Rd 6. Preston St / Coach Rd
3 3 0.55
264 171 7.56 0.29
1.48
6 0
368 117
35 0
67 0
0.67
68.23
284 98
6 0
0.73
0.37 22.96
8.46
0.17
8.61
232 5
3 0
5 151
0 4
Homewood Rd
B5
29
5
Mirehouse Rd
Wilson Pit Rd
St B
ee
s R
d
Coach Rd
Pre
sto
nS
t

Time Period 15:00 Turning Movements - Lights
Turning Movements - HGVs 0.29
RFC 7.73
1. A595/Mirehouse Road Delay 2. A595/Homewood Road 0 2 0
0 204 0
0.57 0.67
21.56 15.92
12 1 0
12 531 509 114 0
1 249
0.74
39.28
835 23
92 1
0.50
9.02
0.46
95 143 37.7 0 0
0 3 143 1
210 1
3. St Bees Rd/Mirehouse Rd and St Bees Rd/Wilson Pit Rd
0.09
3 2 6.71 669 285 101 0.99
18 124 19 6 1 54.31
82 1
197 1 4. High Rd/Wilson Pit Rd
0.29
4.16 0.17
2.73
0.17
4.48 109 164 0 153
8 1 1 49
0 3 0.07
157 58 0.13 1.16
4.18
148 0
0.09 33 0
2.62
1 131
0 13 36 26
1 0
0.13
48 142 7.54
0.12 1 9
1.7
5. Meadow View/Ginns to Kells Rd 6. Preston St / Coach Rd
3 5 0.70
319 212 11.14 0.40
1.76
8 1
483 180
18 0
48 0
0.61
100.89
389 62
12 1
0.83
0.37 31.33
8.84
0.26
13.86
227 1
3 0
0 224
0 10
Homewood Rd
B5
29
5
Mirehouse Rd
Wilson Pit Rd
St B
ee
s R
d
Coach Rd
Pre
sto
nS
t

Time Period 16:00 Turning Movements - Lights
Turning Movements - HGVs 0.36
RFC 8.54
1. A595/Mirehouse Road Delay 2. A595/Homewood Road 0 1 0
2 247 0
0.69 0.76
25.32 19.03
8 1 0
8 640 611 101 0
1 294
0.85
47.13
833 15
255 3
0.77
15.16
0.47
65 174 38.17 0 0
0 2 206 0
288 0
3. St Bees Rd/Mirehouse Rd and St Bees Rd/Wilson Pit Rd
0.10
1 2 7.25 632 299 94 0.99
22 144 13 1 0 74.45
141 1
283 1 4. High Rd/Wilson Pit Rd
0.51
6.15 0.20
3.34
0.21
4.23 174 158 0 144
6 1 0 66
0 1 0.11
233 72 0.18 1.21
5.31
201 0
0.09 45 0
3.02
1 122
0 18 43 34
1 0
0.16
46 209 8.04
0.16 1 6
1.9
5. Meadow View/Ginns to Kells Rd 6. Preston St / Coach Rd
2 2 0.86
375 257 22.88 0.45
1.92
4 1
584 186
11 0
47 0
0.68
115.31
498 47
10 0
0.91
0.38 41.39
9.51
0.36
20.68
224 1
2 0
0 320
0 8
Homewood Rd
B5
29
5
Mirehouse Rd
Wilson Pit Rd
St B
ee
s R
d
Coach Rd
Pre
sto
nS
t

Time Period 17:00 Turning Movements - Lights
Turning Movements - HGVs 0.31
RFC 7.89
1. A595/Mirehouse Road Delay 2. A595/Homewood Road 0 2 0
0 214 0
0.63 0.71
28.41 16.64
5 0 0
5 585 560 107 0
1 258
0.84
48.56
887 13
195 2
0.50
9.22
0.52
101 194 39.8 0 0
0 2 104 0
244 0
3. St Bees Rd/Mirehouse Rd and St Bees Rd/Wilson Pit Rd
0.10
0 1 7.15 711 294 101 0.99
22 143 8 4 1 70.51
134 2
238 0 4. High Rd/Wilson Pit Rd
0.42
4.86 0.20
2.98
0.15
5.33 69 179 0 165
3 1 0 61
0 1 0.09
198 63 0.16 1.17
4.63
171 0
0.11 35 0
2.47
0 149
0 21 39 30
0 0
0.14
97 99 7.82
0.12 0 3
1.66
5. Meadow View/Ginns to Kells Rd 6. Preston St / Coach Rd
2 2 0.75
348 248 12.47 0.42
1.81
3 1
546 168
17 0
49 0
0.60
114
389 57
5 0
0.84
0.37 33
8.67
0.24
11.97
233 1
1 0
0 212
0 4
Homewood Rd
B5
29
5
Mirehouse Rd
Wilson Pit Rd
St B
ee
s R
d
Coach Rd
Pre
sto
nS
t

Time Period 05:00 Turning Movements - Lights
Turning Movements - HGVs 0.24
RFC 6.9
1. A595/Mirehouse Road Delay 2. A595/Homewood Road 0 1 0
0 186 0
0.56 0.52
13.87 12.00
15 0 0
16 760 549 17 0
1 45
0.18
13.71
158 4
16 0
0.14
7.10
0.41
79 123 36.69 0 0
0 1 17 0
82 0
3. St Bees Rd/Mirehouse Rd and St Bees Rd/Wilson Pit Rd
0.05
0 0 3.81 151 74 51 0.23
20 64 3 1 0 5.06
8 0
52 1 4. High Rd/Wilson Pit Rd
0.05
2.08 0.03
1.56
0.09
3.68 46 97 0 46
1 0 0 5
0 1 0.01
43 29 0.04 1.09
2.7
13 0
0.06 8 0
2.02
0 135
0 57 8 15
0 0
0.04
2 7 6.6
0.01 0 1
1.09
5. Meadow View/Ginns to Kells Rd 6. Preston St / Coach Rd
0 0 0.13
56 64 3.63 0.04
1.08
0 0
50 12
13 0
70 0
0.15
7.95
60 61
1 0
0.15
0.08 4.57
6.32
0.07
3.64
55 2
0 0
1 65
0 1
Homewood Rd
B5
29
5
Mirehouse Rd
Wilson Pit Rd
St B
ee
s R
d
Coach Rd
Pre
sto
nS
t

Time Period 06:00 Turning Movements - Lights
Turning Movements - HGVs 0.42
RFC 9.04
1. A595/Mirehouse Road Delay 2. A595/Homewood Road 0 4 0
0 253 0
0.67 0.67
20.35 17.46
22 0 0
26 936 653 31 0
1 96
0.20
14.08
164 12
15 0
0.29
9.40
0.44
144 85 37.45 0 0
0 2 28 0
129 0
3. St Bees Rd/Mirehouse Rd and St Bees Rd/Wilson Pit Rd
0.15
5 1 10.34 180 118 87 0.34
205 29 12 1 0 5.58
12 0
187 1 4. High Rd/Wilson Pit Rd
0.25
5.5 0.08
1.55
0.14
6.32 68 168 0 113
0 0 0 11
0 7 0.01
63 330 0.24 1.08
2.36
38 0
0.16 11 0
3.74
0 223
1 153 15 31
0 1
0.10
6 13 7.16
0.01 0 0
1.11
5. Meadow View/Ginns to Kells Rd 6. Preston St / Coach Rd
1 5 0.29
106 197 3.48 0.09
1.11
5 0
132 10
18 0
170 1
0.45
12.79
109 107
1 0
0.32
0.18 6.97
6.79
0.11
5.08
115 0
1 0
2 100
0 1
Homewood Rd
B5
29
5
Mirehouse Rd
Wilson Pit Rd
St B
ee
s R
d
Coach Rd
Pre
sto
nS
t

Time Period 07:00 Turning Movements - Lights
Turning Movements - HGVs 0.63
RFC 14.02
1. A595/Mirehouse Road Delay 2. A595/Homewood Road 0 4 0
0 351 0
0.69 0.87
22.37 26.34
0 1 0
30 931 737 79 0
1 143
0.42
20.41
402 15
60 1
0.51
13.24
0.70
260 160 44.66 0 0
1 1 73 1
172 0
3. St Bees Rd/Mirehouse Rd and St Bees Rd/Wilson Pit Rd
0.10
4 1 6.94 436 272 159 0.77
89 63 16 1 0 11.38
37 0
161 1 4. High Rd/Wilson Pit Rd
0.24
5.37 0.12
2.23
0.30
9.07 53 357 0 127
1 0 1 27
0 5 0.03
114 136 0.16 1.16
2.9
179 0
0.16 26 0
3.09
0 346
0 60 34 28
0 0
0.13
22 64 7.66
0.05 0 1
1.28
5. Meadow View/Ginns to Kells Rd 6. Preston St / Coach Rd
2 5 0.47
228 136 6.52 0.19
1.26
7 0
274 37
31 1
90 0
0.64
40.51
246 203
4 0
0.89
0.50 43.58
9.58
0.15
6.96
316 5
2 0
4 134
0 2
Homewood Rd
B5
29
5
Mirehouse Rd
Wilson Pit Rd
St B
ee
s R
d
Coach Rd
Pre
sto
nS
t
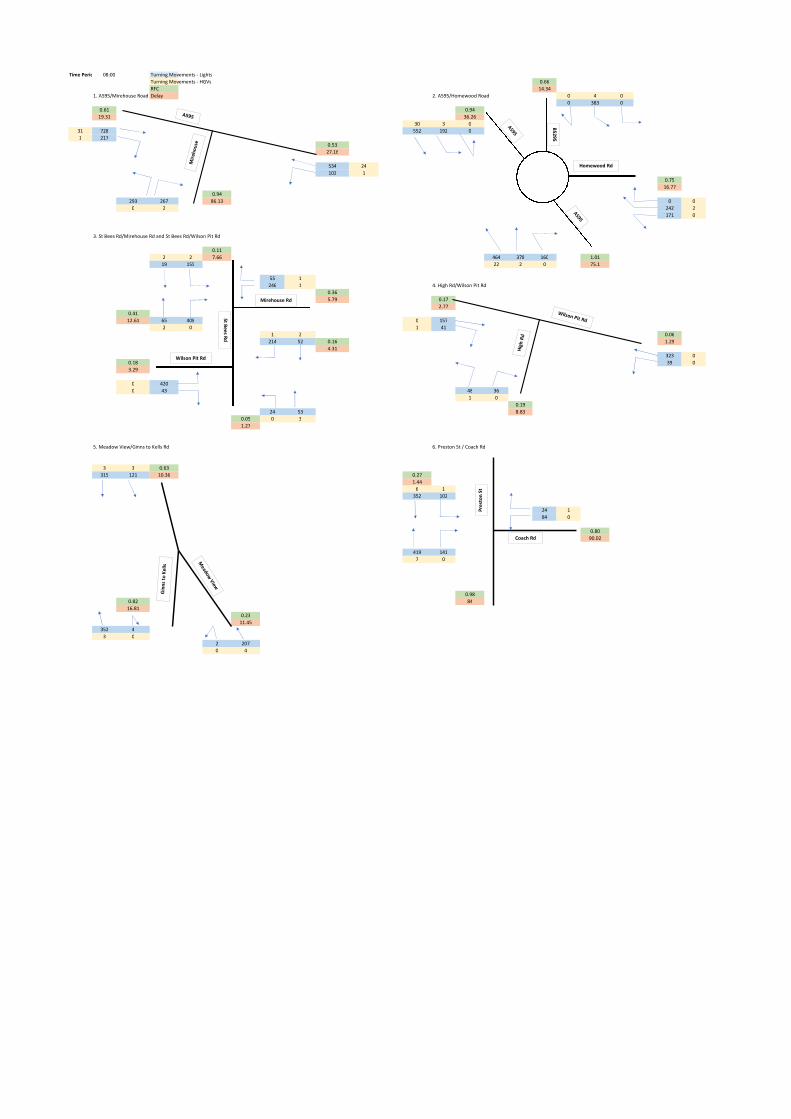
Time Period 08:00 Turning Movements - Lights
Turning Movements - HGVs 0.66
RFC 14.34
1. A595/Mirehouse Road Delay 2. A595/Homewood Road 0 4 0
0 383 0
0.61 0.94
19.31 36.26
30 3 0
31 728 552 192 0
1 217
0.53
27.16
534 24
102 1
0.75
16.77
0.94
293 267 86.13 0 0
0 2 242 2
171 0
3. St Bees Rd/Mirehouse Rd and St Bees Rd/Wilson Pit Rd
0.11
2 2 7.66 464 378 160 1.01
19 155 22 2 0 75.1
55 1
246 1 4. High Rd/Wilson Pit Rd
0.36
5.79 0.17
2.77
0.41
12.61 65 408 0 157
2 0 1 41
1 2 0.06
214 52 0.16 1.29
4.31
323 0
0.18 39 0
3.29
0 420
0 43 48 36
1 0
0.19
24 53 8.83
0.05 0 3
1.27
5. Meadow View/Ginns to Kells Rd 6. Preston St / Coach Rd
3 3 0.63
315 121 10.36 0.27
1.44
6 1
352 102
24 1
84 0
0.80
90.02
419 141
7 0
0.98
0.82 84
16.81
0.23
11.45
352 4
3 0
2 207
0 4
Homewood Rd
B5
29
5
Mirehouse Rd
Wilson Pit Rd
St B
ee
s R
d
Coach Rd
Pre
sto
nS
t
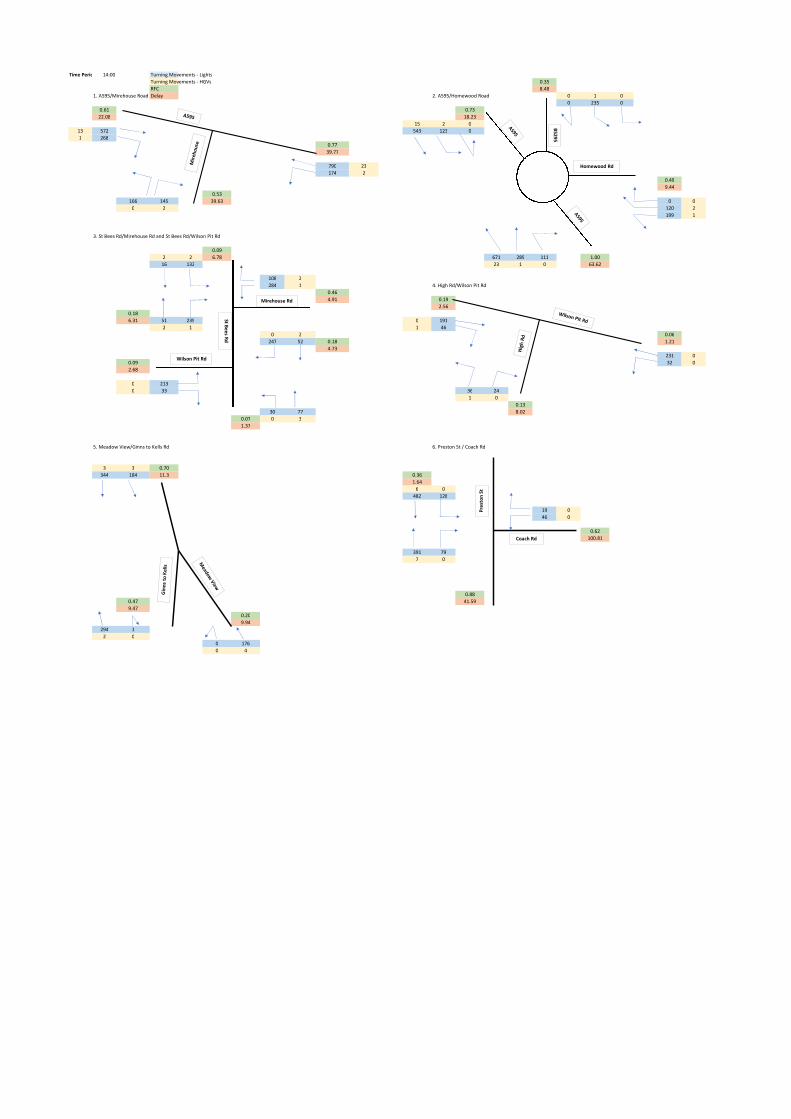
Time Period 14:00 Turning Movements - Lights
Turning Movements - HGVs 0.35
RFC 8.48
1. A595/Mirehouse Road Delay 2. A595/Homewood Road 0 1 0
0 235 0
0.61 0.73
22.08 18.23
15 2 0
13 572 543 123 0
1 268
0.77
39.77
790 23
174 2
0.49
9.44
0.53
166 145 39.63 0 0
0 2 120 2
199 1
3. St Bees Rd/Mirehouse Rd and St Bees Rd/Wilson Pit Rd
0.09
2 2 6.78 671 289 111 1.00
16 132 23 1 0 63.62
108 2
284 1 4. High Rd/Wilson Pit Rd
0.46
4.91 0.19
2.56
0.18
6.31 51 239 0 191
2 1 1 46
0 2 0.06
247 52 0.18 1.21
4.73
231 0
0.09 32 0
2.68
0 213
0 33 36 24
1 0
0.13
30 77 8.02
0.07 0 3
1.37
5. Meadow View/Ginns to Kells Rd 6. Preston St / Coach Rd
3 3 0.70
344 184 11.3 0.36
1.64
6 0
482 128
19 0
46 0
0.62
100.81
391 79
7 0
0.88
0.47 41.59
9.47
0.20
9.94
294 1
2 0
0 176
0 4
Homewood Rd
B5
29
5
Mirehouse Rd
Wilson Pit Rd
St B
ee
s R
d
Coach Rd
Pre
sto
nS
t
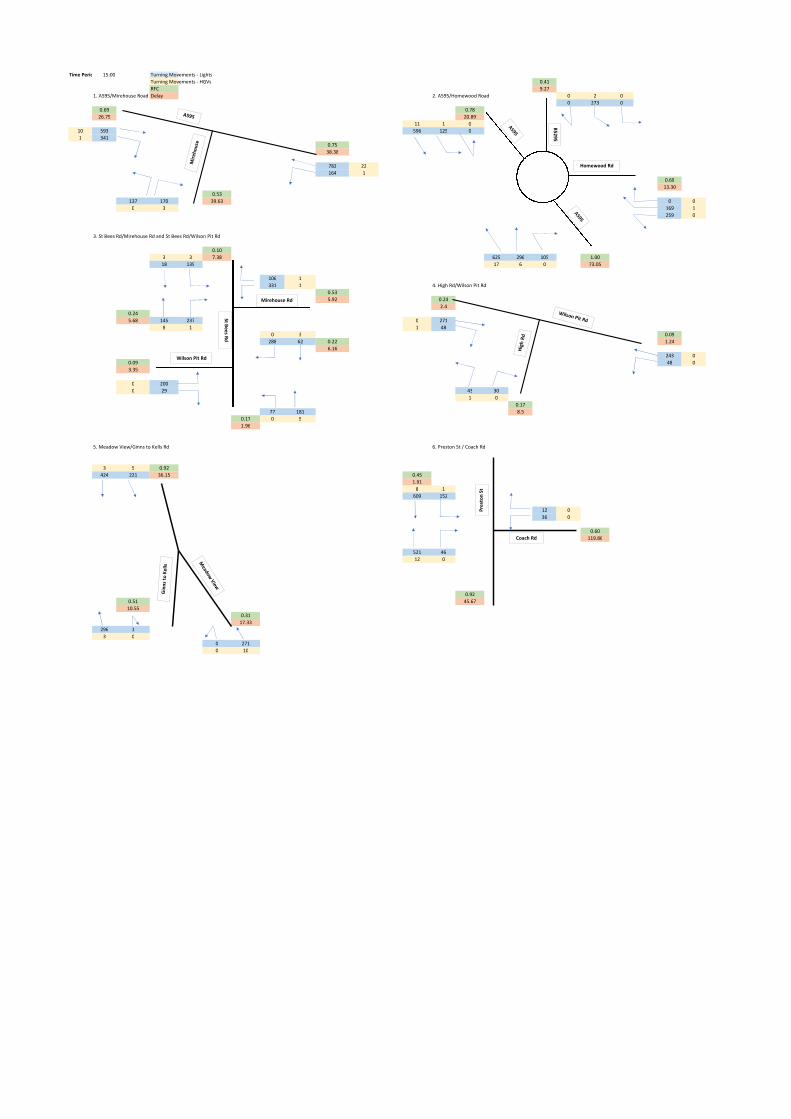
Time Period 15:00 Turning Movements - Lights
Turning Movements - HGVs 0.41
RFC 9.27
1. A595/Mirehouse Road Delay 2. A595/Homewood Road 0 2 0
0 273 0
0.69 0.78
26.79 20.89
11 1 0
10 593 596 125 0
1 341
0.75
38.38
782 22
164 1
0.69
13.30
0.53
137 170 39.63 0 0
0 3 169 1
259 0
3. St Bees Rd/Mirehouse Rd and St Bees Rd/Wilson Pit Rd
0.10
3 3 7.38 625 296 105 1.00
18 139 17 6 0 73.05
106 1
331 1 4. High Rd/Wilson Pit Rd
0.53
5.92 0.24
2.4
0.24
5.68 145 237 0 271
8 1 1 48
0 3 0.09
288 62 0.22 1.24
6.16
243 0
0.09 48 0
3.35
0 200
0 29 43 30
1 0
0.17
77 181 8.5
0.17 0 9
1.96
5. Meadow View/Ginns to Kells Rd 6. Preston St / Coach Rd
3 5 0.92
424 221 36.15 0.45
1.91
8 1
609 152
12 0
36 0
0.60
119.86
521 46
12 0
0.92
0.51 45.67
10.55
0.31
17.33
296 1
3 0
0 271
0 10
Homewood Rd
B5
29
5
Mirehouse Rd
Wilson Pit Rd
St B
ee
s R
d
Coach Rd
Pre
sto
nS
t

Time Period 16:00 Turning Movements - Lights
Turning Movements - HGVs 0.45
RFC 9.53
1. A595/Mirehouse Road Delay 2. A595/Homewood Road 0 1 0
0 300 0
0.72 0.83
31.34 23.08
8 1 0
8 653 680 101 0
1 310
0.88
49.52
800 14
333 3
0.96
41.37
0.52
87 208 39.8 0 0
0 2 289 1
279 0
3. St Bees Rd/Mirehouse Rd and St Bees Rd/Wilson Pit Rd
0.10
1 2 7.37 582 313 90 1.00
24 145 12 1 0 76.91
131 1
402 1 4. High Rd/Wilson Pit Rd
0.74
8.69 0.27
2.72
0.28
5.88 196 255 0 272
6 1 0 61
0 1 0.12
356 73 0.31 1.27
7.83
257 0
0.11 58 0
3.88
0 207
0 32 48 37
1 0
0.19
63 242 8.88
0.19 0 6
2.1
5. Meadow View/Ginns to Kells Rd 6. Preston St / Coach Rd
1 2 0.95
420 258 51.12 0.49
2.05
4 1
636 194
12 0
41 0
0.64
133.34
564 40
10 0
0.96
0.47 55.23
10.5
0.37
22.01
267 1
2 0
0 337
0 8
Homewood Rd
B5
29
5
Mirehouse Rd
Wilson Pit Rd
St B
ee
s R
d
Coach Rd
Pre
sto
nS
t
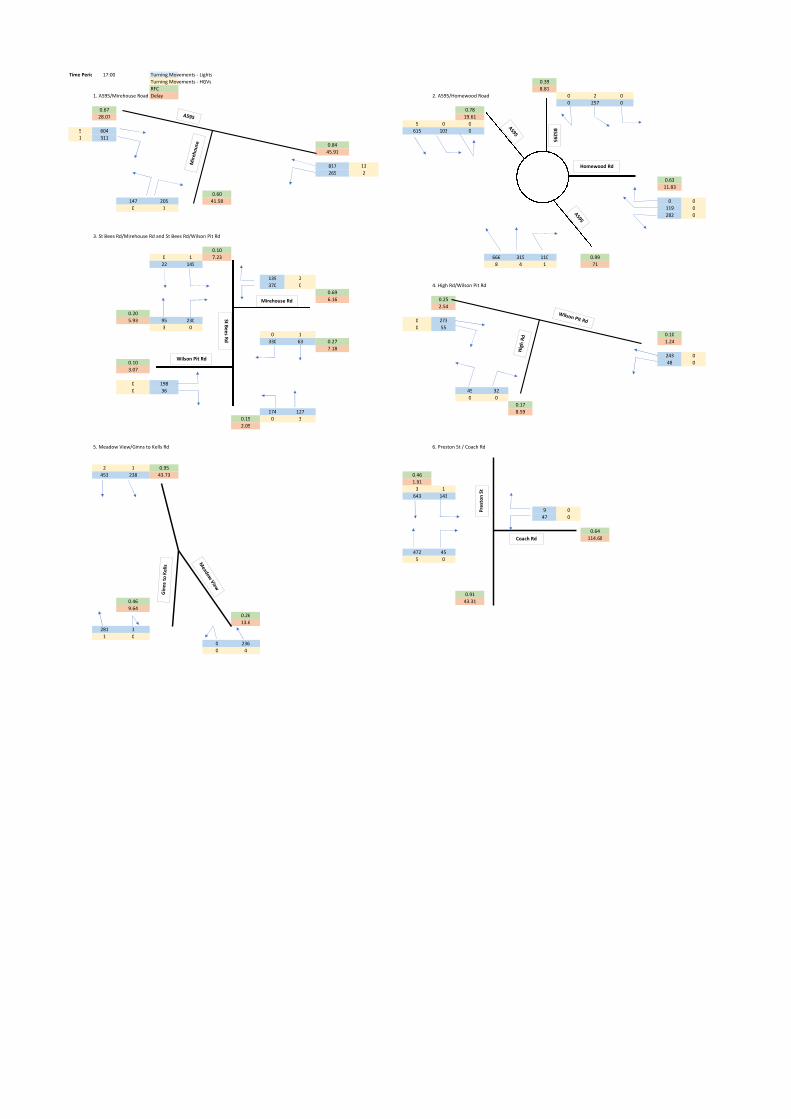
Time Period 17:00 Turning Movements - Lights
Turning Movements - HGVs 0.39
RFC 8.81
1. A595/Mirehouse Road Delay 2. A595/Homewood Road 0 2 0
0 257 0
0.67 0.78
28.07 19.61
5 0 0
5 604 615 103 0
1 311
0.84
45.91
817 13
265 2
0.63
11.83
0.60
147 205 41.58 0 0
0 1 119 0
282 0
3. St Bees Rd/Mirehouse Rd and St Bees Rd/Wilson Pit Rd
0.10
0 1 7.23 666 315 110 0.99
22 145 8 4 1 71
139 2
370 0 4. High Rd/Wilson Pit Rd
0.69
6.16 0.25
2.54
0.20
5.93 95 230 0 273
3 0 0 55
0 1 0.10
330 63 0.27 1.24
7.18
243 0
0.10 48 0
3.07
0 198
0 36 45 32
0 0
0.17
174 127 8.59
0.19 0 3
2.09
5. Meadow View/Ginns to Kells Rd 6. Preston St / Coach Rd
2 1 0.95
453 238 43.73 0.46
1.91
3 1
643 143
9 0
47 0
0.64
114.68
472 45
5 0
0.91
0.46 43.31
9.64
0.26
13.6
281 1
1 0
0 236
0 4
Homewood Rd
B5
29
5
Mirehouse Rd
Wilson Pit Rd
St B
ee
s R
d
Coach Rd
Pre
sto
nS
t

Time Period 05:00 Turning Movements - Lights
Turning Movements - HGVs 0.24
RFC 6.9
1. A595/Mirehouse Road Delay 2. A595/Homewood Road 0 1 0
0 185 0
0.56 0.52
14.01 12.00
15 0 0
16 757 549 17 0
1 64
0.22
14.03
158 4
64 0
0.17
7.19
0.42
79 126 36.76 0 0
0 1 17 0
101 0
3. St Bees Rd/Mirehouse Rd and St Bees Rd/Wilson Pit Rd
0.05
0 0 3.61 151 74 51 0.23
15 64 3 1 0 5.06
8 0
119 1 4. High Rd/Wilson Pit Rd
0.12
2.03 0.04
1.55
0.09
3.66 46 98 0 50
1 0 0 5
0 1 0.05
106 29 0.08 1.07
3.44
80 0
0.06 8 0
2.12
0 136
0 55 8 15
0 0
0.05
2 7 6.89
0.01 0 1
1.09
5. Meadow View/Ginns to Kells Rd 6. Preston St / Coach Rd
0 0 0.25
137 59 5.37 0.04
1.08
0 0
60 12
13 0
136 0
0.29
8.6
60 61
1 0
0.15
0.08 4.71
6.34
0.07
3.63
55 2
0 0
1 65
0 1
Homewood Rd
B5
29
5
Mirehouse Rd
Wilson Pit Rd
St B
ee
s R
d
Coach Rd
Pre
sto
nS
t

Time Period 06:00 Turning Movements - Lights
Turning Movements - HGVs 0.41
RFC 9.03
1. A595/Mirehouse Road Delay 2. A595/Homewood Road 0 4 0
0 273 0
0.66 0.67
20.18 17.40
22 0 0
26 933 655 31 0
1 95
0.20
14.08
164 12
15 0
0.28
9.35
0.44
145 88 37.51 0 0
0 2 28 0
129 1
3. St Bees Rd/Mirehouse Rd and St Bees Rd/Wilson Pit Rd
0.15
5 1 10.37 179 118 88 0.34
206 29 12 1 0 5.59
12 0
185 2 4. High Rd/Wilson Pit Rd
0.25
5.51 0.08
1.53
0.14
6.38 68 170 0 118
0 0 0 11
0 7 0.01
63 328 0.24 1.08
2.37
37 0
0.17 11 0
3.78
0 225
1 156 15 31
0 1
0.10
6 13 7.18
0.01 0 0
1.11
5. Meadow View/Ginns to Kells Rd 6. Preston St / Coach Rd
1 5 0.29
105 197 3.48 0.09
1.11
6 0
133 10
18 0
170 1
0.45
12.88
115 108
1 0
0.32
0.19 6.93
6.84
0.11
5.09
122 0
1 0
2 101
0 1
Homewood Rd
B5
29
5
Mirehouse Rd
Wilson Pit Rd
St B
ee
s R
d
Coach Rd
Pre
sto
nS
t
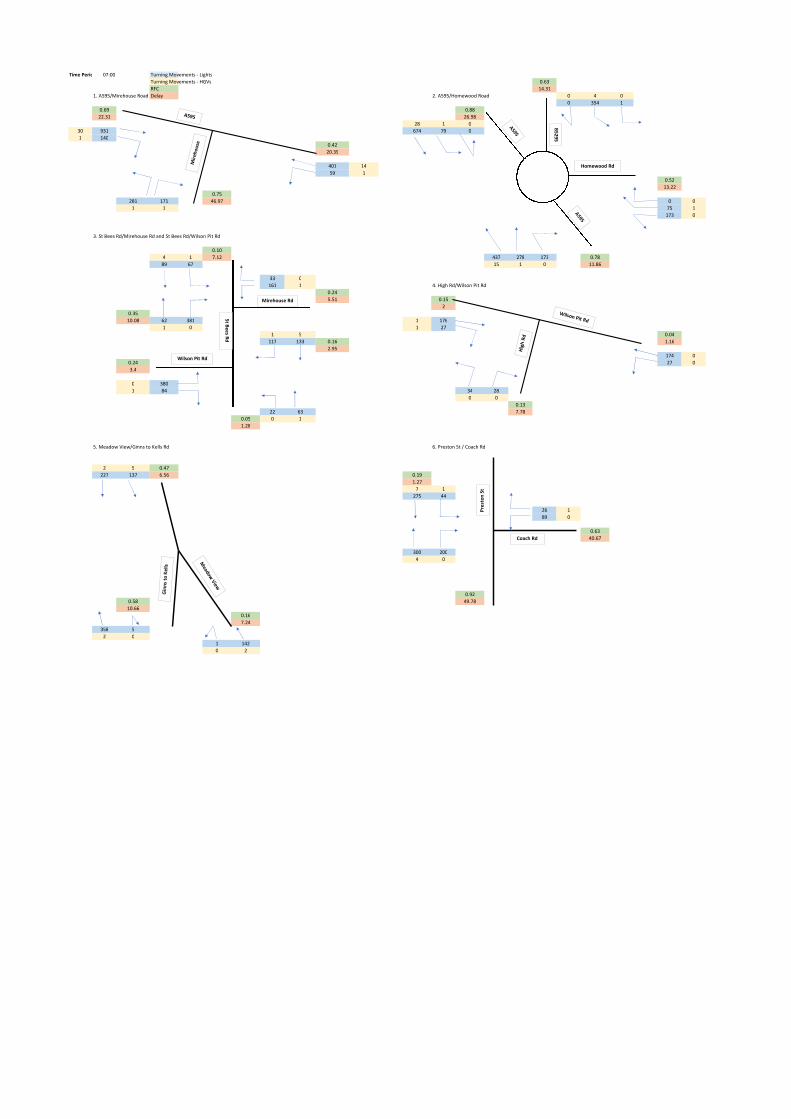
Time Period 07:00 Turning Movements - Lights
Turning Movements - HGVs 0.63
RFC 14.31
1. A595/Mirehouse Road Delay 2. A595/Homewood Road 0 4 0
0 354 1
0.69 0.88
22.31 26.98
28 1 0
30 931 674 79 0
1 140
0.42
20.39
401 14
59 1
0.52
13.22
0.75
281 171 46.97 0 0
1 1 75 1
173 0
3. St Bees Rd/Mirehouse Rd and St Bees Rd/Wilson Pit Rd
0.10
4 1 7.12 437 278 173 0.78
89 67 15 1 0 11.86
33 0
161 1 4. High Rd/Wilson Pit Rd
0.24
5.51 0.15
2
0.35
10.08 62 381 1 176
1 0 1 27
1 5 0.04
117 133 0.16 1.16
2.95
174 0
0.24 27 0
3.4
0 380
1 84 34 28
0 0
0.13
22 63 7.78
0.05 0 1
1.28
5. Meadow View/Ginns to Kells Rd 6. Preston St / Coach Rd
2 5 0.47
227 137 6.56 0.19
1.27
7 1
275 44
26 1
89 0
0.63
40.67
300 200
4 0
0.92
0.58 49.78
10.66
0.16
7.24
358 5
2 0
1 142
0 2
Homewood Rd
B5
29
5
Mirehouse Rd
Wilson Pit Rd
St B
ee
s R
d
Coach Rd
Pre
sto
nS
t

Time Period 08:00 Turning Movements - Lights
Turning Movements - HGVs 0.67
RFC 14.43
1. A595/Mirehouse Road Delay 2. A595/Homewood Road 0 4 0
0 381 0
0.62 0.94
19.58 37.97
30 3 0
31 730 559 187 0
1 226
0.54
27.85
530 24
136 1
0.76
17.44
0.94
294 263 88.38 0 0
0 2 246 2
171 0
3. St Bees Rd/Mirehouse Rd and St Bees Rd/Wilson Pit Rd
0.11
2 2 7.72 461 378 160 1.01
19 156 22 2 0 74.63
55 1
282 1 4. High Rd/Wilson Pit Rd
0.41
5.59 0.17
2.75
0.41
12.63 68 407 0 156
2 1 1 39
1 2 0.08
249 52 0.18 1.32
4.62
355 0
0.18 42 0
3.33
1 421
0 43 48 36
1 0
0.20
24 54 9.06
0.05 0 3
1.27
5. Meadow View/Ginns to Kells Rd 6. Preston St / Coach Rd
3 3 0.69
348 114 11.95 0.29
1.46
7 1
378 101
22 1
83 0
0.82
95.16
422 130
7 0
0.98
0.81 83.4
16.44
0.22
10.96
352 5
3 0
2 200
0 4
Homewood Rd
B5
29
5
Mirehouse Rd
Wilson Pit Rd
St B
ee
s R
d
Coach Rd
Pre
sto
nS
t

Time Period 14:00 Turning Movements - Lights
Turning Movements - HGVs 0.35
RFC 8.48
1. A595/Mirehouse Road Delay 2. A595/Homewood Road 0 0 0
0 237 0
0.61 0.73
22.11 18.30
15 2 0
13 571 544 123 0
1 269
0.77
39.73
788 23
176 2
0.49
9.45
0.54
168 151 39.88 0 0
0 3 120 2
199 1
3. St Bees Rd/Mirehouse Rd and St Bees Rd/Wilson Pit Rd
0.09
2 2 6.78 669 289 112 1.00
16 132 23 1 0 63.42
106 2
286 1 4. High Rd/Wilson Pit Rd
0.46
4.96 0.20
2.54
0.18
6.43 51 246 0 197
2 1 1 46
1 2 0.06
249 52 0.18 1.21
4.76
233 0
0.10 32 0
2.69
1 219
0 33 36 25
1 0
0.13
30 77 8.06
0.07 0 3
1.37
5. Meadow View/Ginns to Kells Rd 6. Preston St / Coach Rd
3 3 0.71
348 182 11.59 0.36
1.64
6 0
483 128
18 0
47 0
0.64
100.42
398 79
7 0
0.88
0.49 42.52
9.61
0.20
9.89
301 1
3 0
0 175
0 4
Homewood Rd
B5
29
5
Mirehouse Rd
Wilson Pit Rd
St B
ee
s R
d
Coach Rd
Pre
sto
nS
t
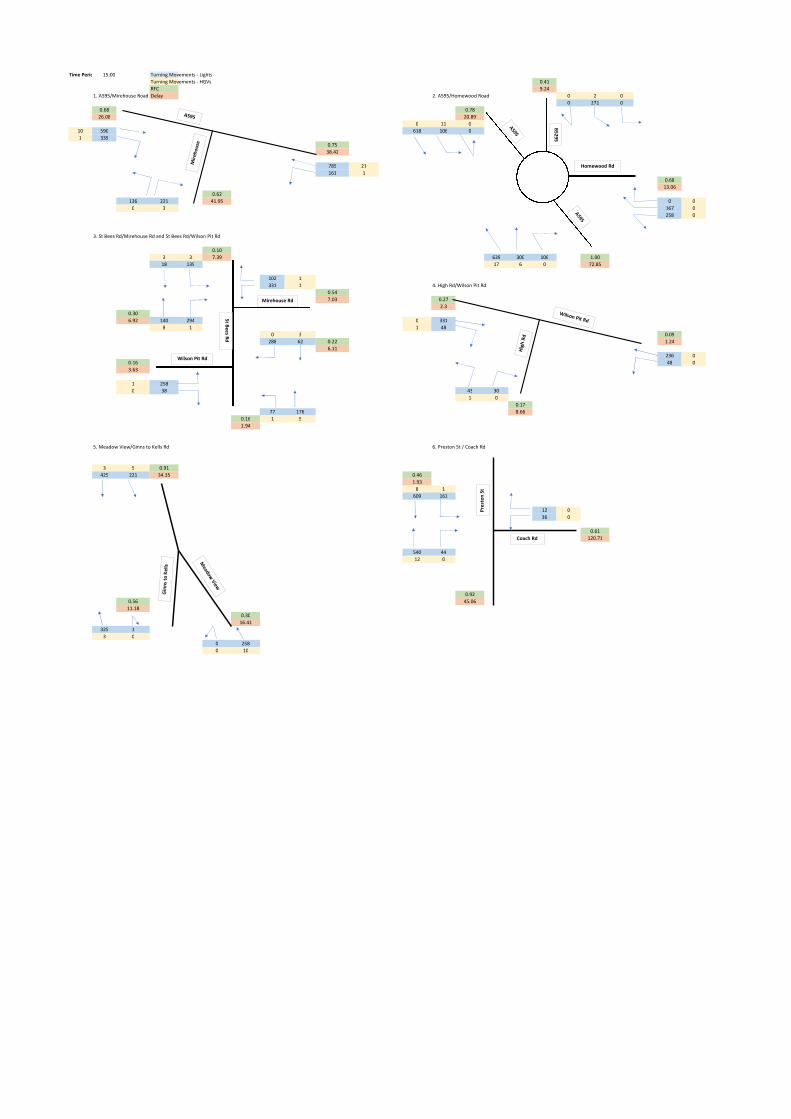
Time Period 15:00 Turning Movements - Lights
Turning Movements - HGVs 0.41
RFC 9.24
1. A595/Mirehouse Road Delay 2. A595/Homewood Road 0 2 0
0 271 0
0.68 0.78
26.08 20.89
0 11 0
10 590 618 106 0
1 339
0.75
38.42
785 21
161 1
0.68
13.06
0.62
136 221 41.95 0 0
0 3 167 0
258 0
3. St Bees Rd/Mirehouse Rd and St Bees Rd/Wilson Pit Rd
0.10
3 3 7.39 639 300 106 1.00
18 139 17 6 0 72.85
102 1
331 1 4. High Rd/Wilson Pit Rd
0.54
7.03 0.27
2.3
0.30
6.92 140 294 0 331
8 1 1 48
0 3 0.09
288 62 0.22 1.24
6.11
236 0
0.16 48 0
3.63
1 258
0 38 43 30
1 0
0.17
77 176 8.66
0.16 1 9
1.94
5. Meadow View/Ginns to Kells Rd 6. Preston St / Coach Rd
3 5 0.91
425 221 34.35 0.46
1.93
8 1
609 161
12 0
36 0
0.61
120.71
540 44
12 0
0.92
0.56 45.06
11.18
0.30
16.41
325 1
3 0
0 258
0 10
Homewood Rd
B5
29
5
Mirehouse Rd
Wilson Pit Rd
St B
ee
s R
d
Coach Rd
Pre
sto
nS
t
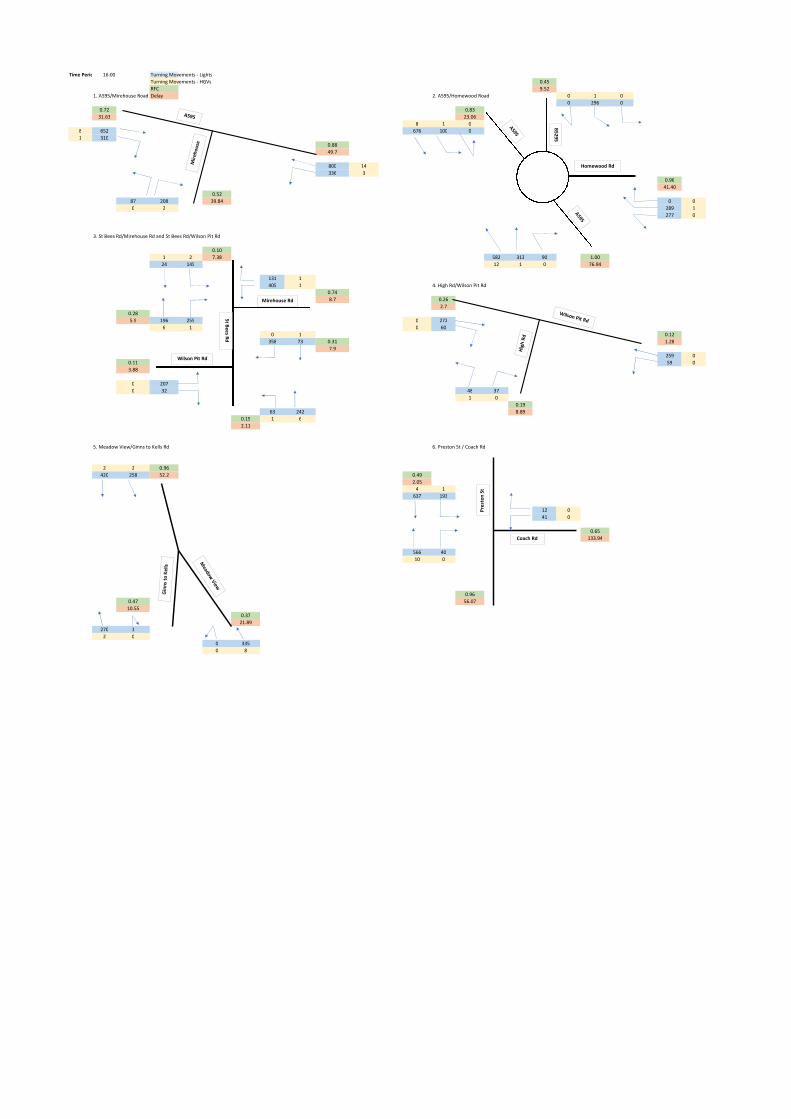
Time Period 16:00 Turning Movements - Lights
Turning Movements - HGVs 0.45
RFC 9.52
1. A595/Mirehouse Road Delay 2. A595/Homewood Road 0 1 0
0 296 0
0.72 0.83
31.63 23.06
8 1 0
8 652 676 100 0
1 310
0.88
49.7
800 14
336 3
0.96
41.40
0.52
87 208 39.84 0 0
0 2 289 1
277 0
3. St Bees Rd/Mirehouse Rd and St Bees Rd/Wilson Pit Rd
0.10
1 2 7.38 582 313 90 1.00
24 145 12 1 0 76.94
131 1
405 1 4. High Rd/Wilson Pit Rd
0.74
8.7 0.26
2.7
0.28
5.9 196 255 0 272
6 1 0 60
0 1 0.12
358 73 0.31 1.28
7.9
259 0
0.11 59 0
3.88
0 207
0 32 48 37
1 0
0.19
63 242 8.89
0.19 1 6
2.11
5. Meadow View/Ginns to Kells Rd 6. Preston St / Coach Rd
2 2 0.96
420 258 52.2 0.49
2.05
4 1
637 193
12 0
41 0
0.65
133.94
566 40
10 0
0.96
0.47 56.07
10.55
0.37
21.89
270 1
2 0
0 335
0 8
Homewood Rd
B5
29
5
Mirehouse Rd
Wilson Pit Rd
St B
ee
s R
d
Coach Rd
Pre
sto
nS
t
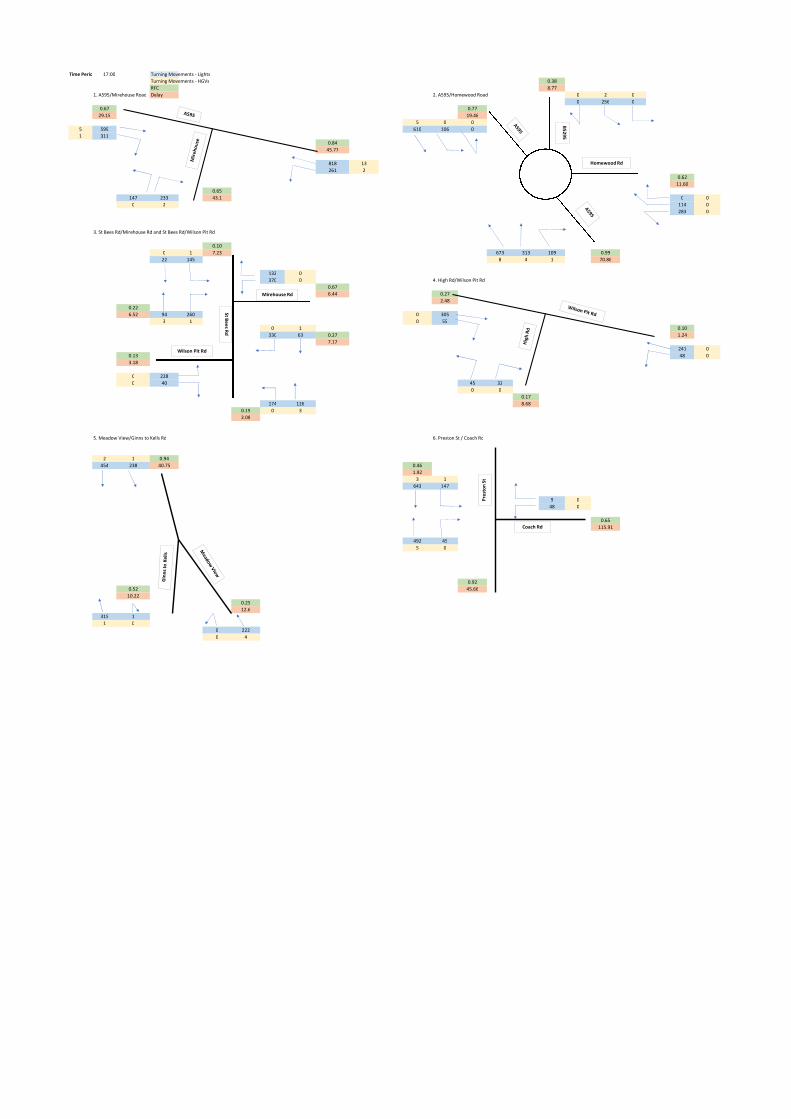
Time Period 17:00 Turning Movements - Lights
Turning Movements - HGVs 0.38
RFC 8.77
1. A595/Mirehouse Road Delay 2. A595/Homewood Road 0 2 0
0 256 0
0.67 0.77
29.15 19.46
5 0 0
5 599 610 106 0
1 311
0.84
45.77
818 13
261 2
0.62
11.60
0.65
147 233 43.1 0 0
0 2 114 0
283 0
3. St Bees Rd/Mirehouse Rd and St Bees Rd/Wilson Pit Rd
0.10
0 1 7.23 673 313 109 0.99
22 145 8 4 1 70.86
132 0
370 0 4. High Rd/Wilson Pit Rd
0.67
6.44 0.27
2.48
0.22
6.52 94 260 0 305
3 1 0 55
0 1 0.10
330 63 0.27 1.24
7.17
241 0
0.13 48 0
3.18
0 228
0 40 45 32
0 0
0.17
174 126 8.68
0.19 0 3
2.08
5. Meadow View/Ginns to Kells Rd 6. Preston St / Coach Rd
2 1 0.94
454 238 40.75 0.46
1.92
3 1
643 147
9 0
48 0
0.65
115.91
492 45
5 0
0.92
0.52 45.66
10.22
0.25
12.6
315 1
1 0
0 222
0 4
Homewood Rd
B5
29
5
Mirehouse Rd
Wilson Pit Rd
St B
ee
s R
d
Coach Rd
Pre
sto
nS
t
Appendix C: Junction Capacity Assessment Data
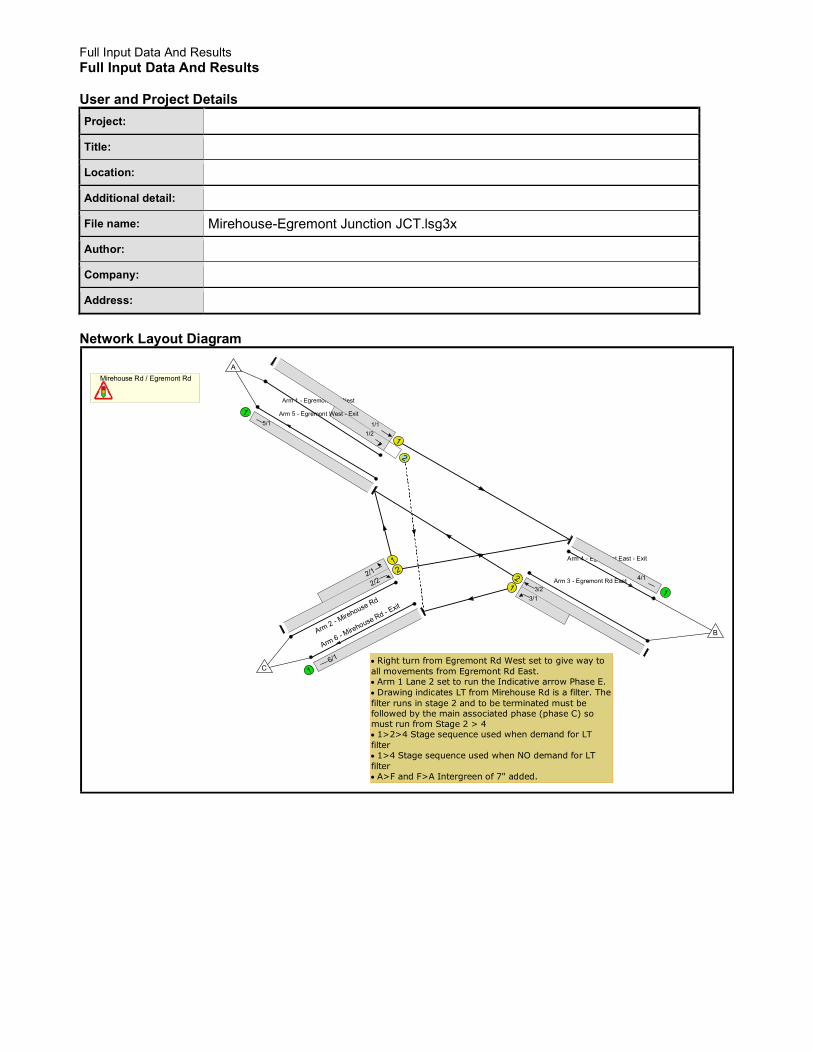
Full Input Data And Results Full Input Data And Results User and Project Details
Project:
Title:
Location:
Additional detail:
File name: Mirehouse-Egremont Junction JCT.lsg3x
Author:
Company:
Address:
Network Layout Diagram
Mirehouse Rd / Egremont Rd
Arm 1 - Egremont Rd West1
2
1/11/2
Arm 2 - Mirehouse Rd
122/1
2/2 Arm 3 - Egremont Rd East
12
3/1
3/2
Arm 4 - Egremont East - Exit1
4/1
Arm 5 - Egremont West - Exit
1
5/1
Arm 6 - Mirehouse Rd - E
xit
16/1
A
B
CRight turn from Egremont Rd West set to give way to all movements from Egremont Rd East.Arm 1 Lane 2 set to run the Indicative arrow Phase E.Drawing indicates LT from Mirehouse Rd is a filter. The filter runs in stage 2 and to be terminated must be followed by the main associated phase (phase C) so must run from Stage 2 > 41>2>4 Stage sequence used when demand for LT filter1>4 Stage sequence used when NO demand for LT filterA>F and F>A Intergreen of 7" added.
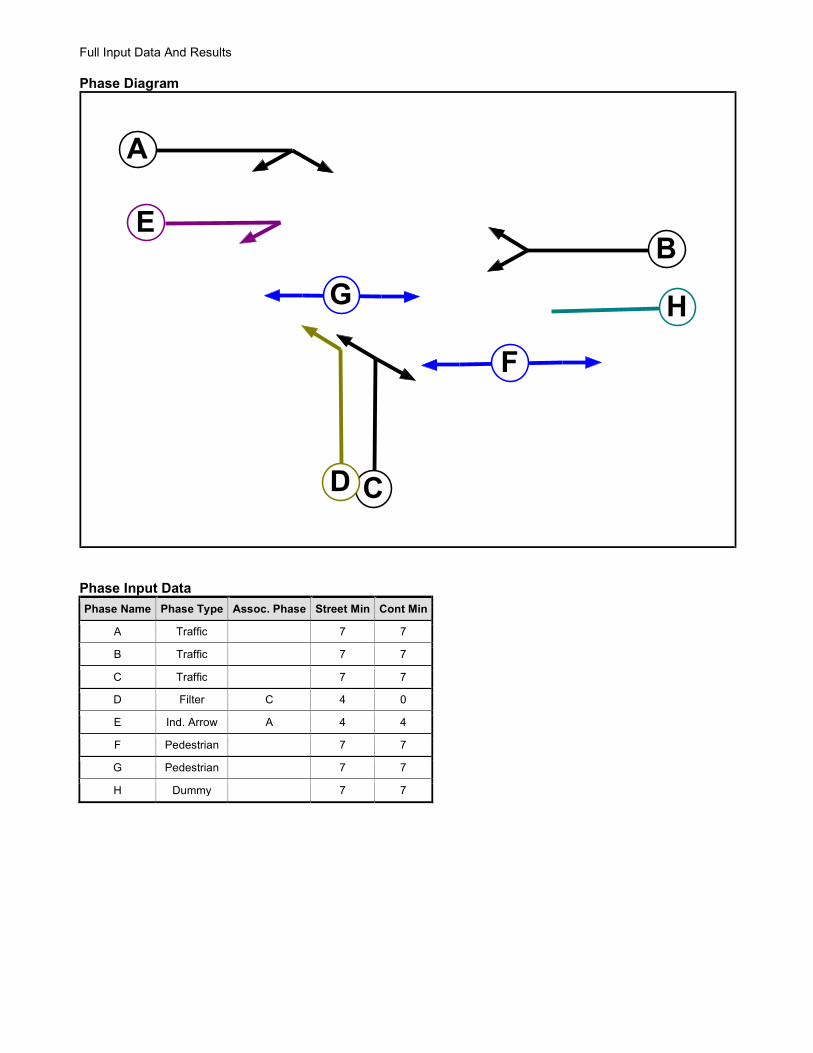
Full Input Data And Results Phase Diagram
A
B
CD
E
F
G H
Phase Input Data
Phase Name Phase Type Assoc. Phase Street Min Cont Min
A Traffic 7 7
B Traffic 7 7
C Traffic 7 7
D Filter C 4 0
E Ind. Arrow A 4 4
F Pedestrian 7 7
G Pedestrian 7 7
H Dummy 7 7
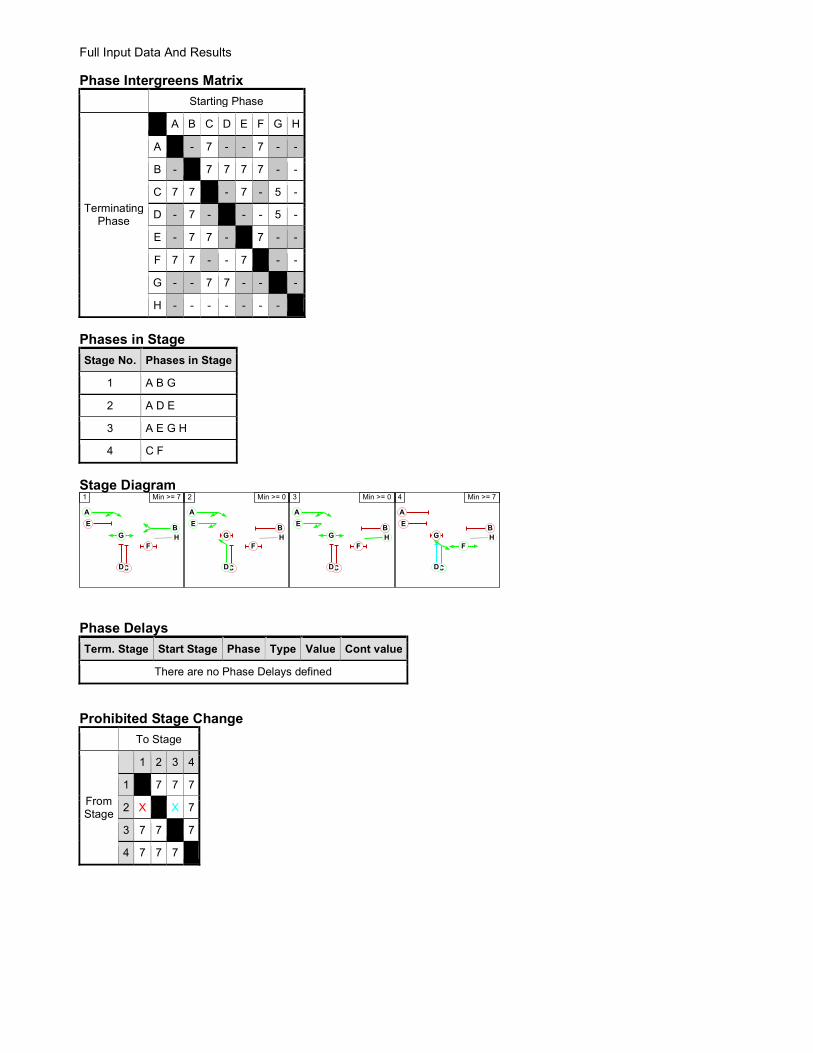
Full Input Data And Results Phase Intergreens Matrix
Starting Phase
Terminating Phase
A B C D E F G H
A - - 7 - - 7 - -
B - - 7 7 7 7 - -
C 7 7 - - 7 - 5 -
D - 7 - - - - 5 -
E - 7 7 - - 7 - -
F 7 7 - - 7 - - -
G - - 7 7 - - - -
H - - - - - - - -
Phases in Stage
Stage No. Phases in Stage
1 A B G
2 A D E
3 A E G H
4 C F
Stage Diagram
A
B
CD
E
F
G H
1 Min >= 7
A
B
CD
E
F
G H
2 Min >= 0
A
B
CD
E
F
G H
3 Min >= 0
A
B
CD
E
F
G H
4 Min >= 7
Phase Delays
Term. Stage Start Stage Phase Type Value Cont value
There are no Phase Delays defined
Prohibited Stage Change
To Stage
From Stage
1 2 3 4
1 7 7 7
2 X X 7
3 7 7 7
4 7 7 7
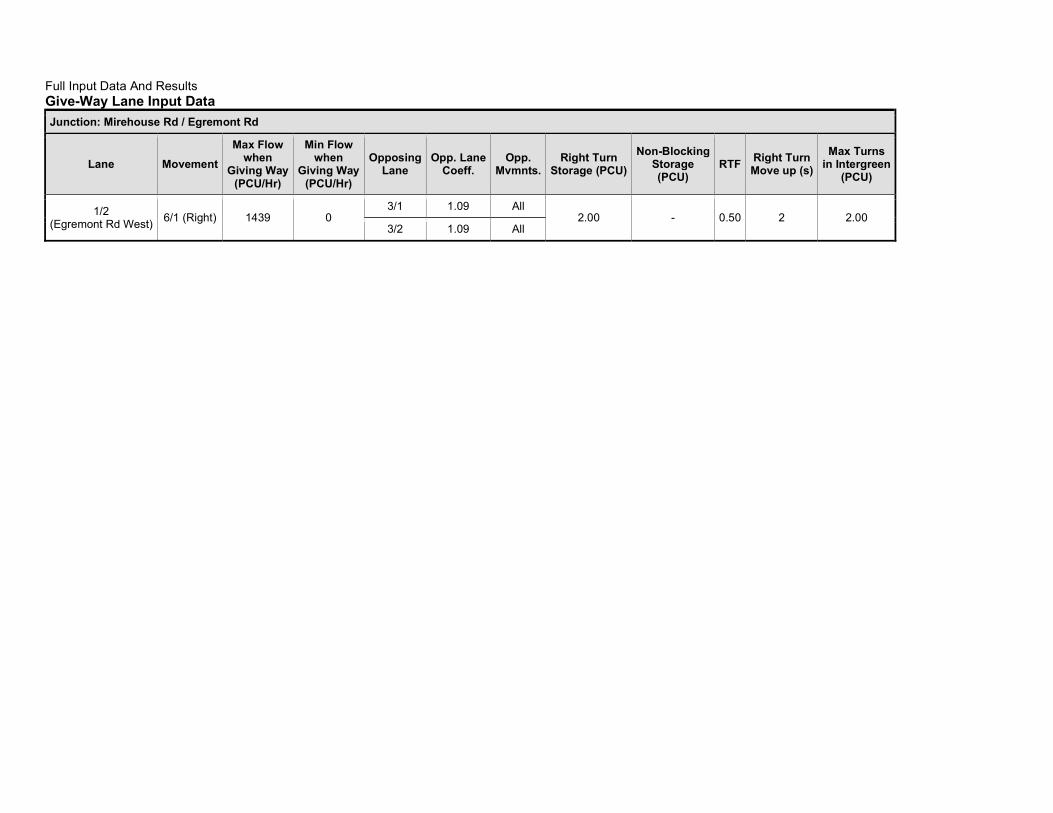
Full Input Data And Results Give-Way Lane Input Data
Junction: Mirehouse Rd / Egremont Rd
Lane Movement
Max Flow when
Giving Way (PCU/Hr)
Min Flow when
Giving Way (PCU/Hr)
Opposing Lane
Opp. Lane Coeff.
Opp. Mvmnts.
Right Turn Storage (PCU)
Non-Blocking Storage (PCU)
RTF Right Turn Move up (s)
Max Turns in Intergreen
(PCU)
1/2 (Egremont Rd West)
6/1 (Right) 1439 0 3/1 1.09 All
2.00 - 0.50 2 2.00 3/2 1.09 All
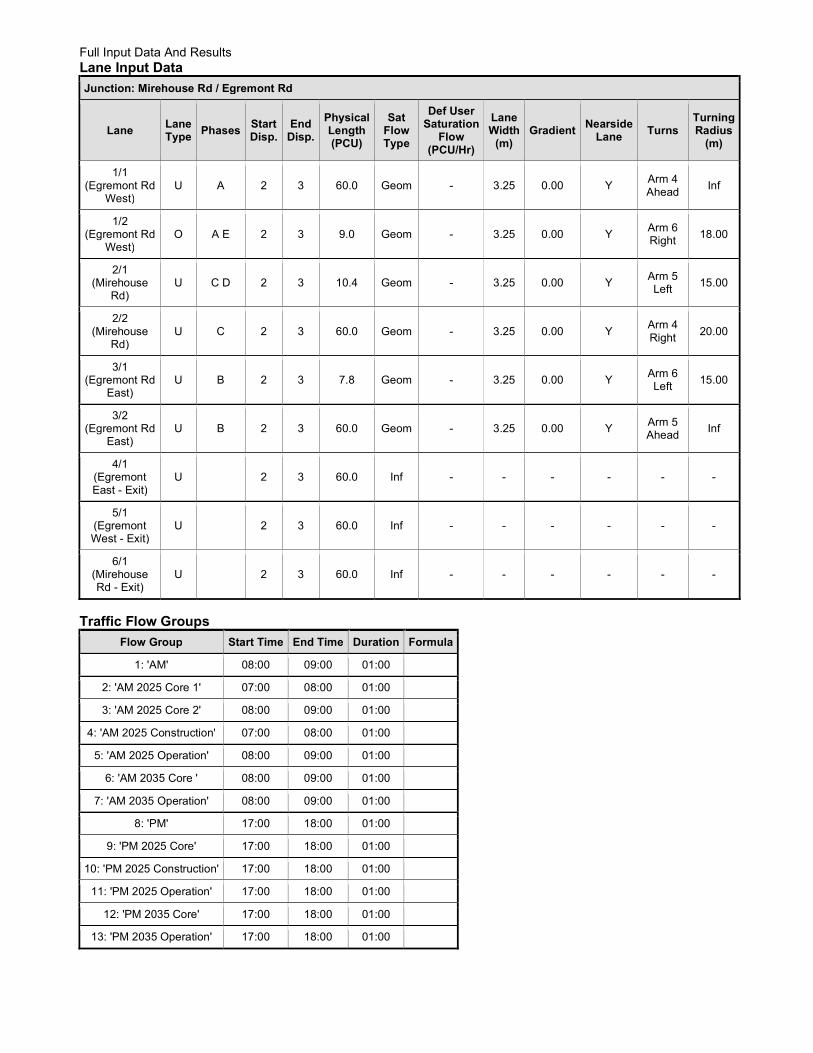
Full Input Data And Results Lane Input Data
Junction: Mirehouse Rd / Egremont Rd
Lane Lane Type
Phases Start Disp.
End Disp.
Physical Length (PCU)
Sat Flow Type
Def User Saturation
Flow (PCU/Hr)
Lane Width
(m) Gradient
Nearside Lane
Turns Turning Radius
(m)
1/1 (Egremont Rd
West) U A 2 3 60.0 Geom - 3.25 0.00 Y
Arm 4 Ahead
Inf
1/2 (Egremont Rd
West) O A E 2 3 9.0 Geom - 3.25 0.00 Y
Arm 6 Right
18.00
2/1 (Mirehouse
Rd) U C D 2 3 10.4 Geom - 3.25 0.00 Y
Arm 5 Left
15.00
2/2 (Mirehouse
Rd) U C 2 3 60.0 Geom - 3.25 0.00 Y
Arm 4 Right
20.00
3/1 (Egremont Rd
East) U B 2 3 7.8 Geom - 3.25 0.00 Y
Arm 6 Left
15.00
3/2 (Egremont Rd
East) U B 2 3 60.0 Geom - 3.25 0.00 Y
Arm 5 Ahead
Inf
4/1 (Egremont East - Exit)
U 2 3 60.0 Inf - - - - - -
5/1 (Egremont West - Exit)
U 2 3 60.0 Inf - - - - - -
6/1 (Mirehouse Rd - Exit)
U 2 3 60.0 Inf - - - - - -
Traffic Flow Groups
Flow Group Start Time End Time Duration Formula
1: 'AM' 08:00 09:00 01:00
2: 'AM 2025 Core 1' 07:00 08:00 01:00
3: 'AM 2025 Core 2' 08:00 09:00 01:00
4: 'AM 2025 Construction' 07:00 08:00 01:00
5: 'AM 2025 Operation' 08:00 09:00 01:00
6: 'AM 2035 Core ' 08:00 09:00 01:00
7: 'AM 2035 Operation' 08:00 09:00 01:00
8: 'PM' 17:00 18:00 01:00
9: 'PM 2025 Core' 17:00 18:00 01:00
10: 'PM 2025 Construction' 17:00 18:00 01:00
11: 'PM 2025 Operation' 17:00 18:00 01:00
12: 'PM 2035 Core' 17:00 18:00 01:00
13: 'PM 2035 Operation' 17:00 18:00 01:00
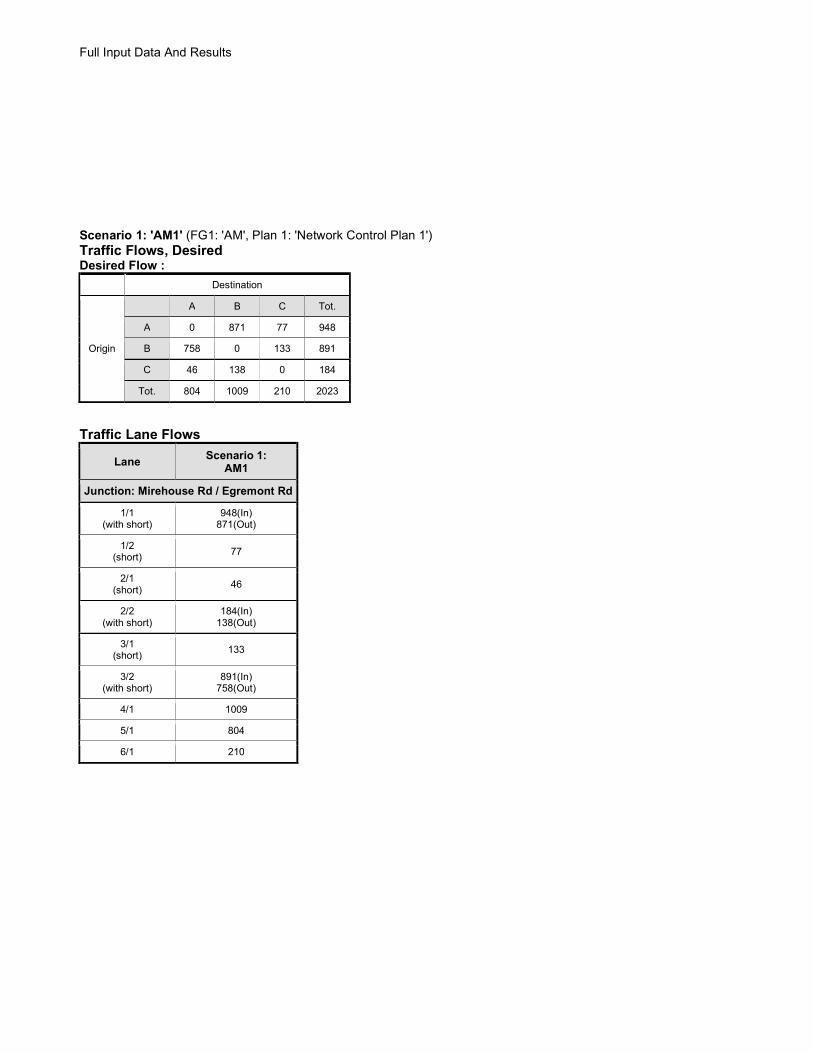
Full Input Data And Results Scenario 1: 'AM1' (FG1: 'AM', Plan 1: 'Network Control Plan 1') Traffic Flows, Desired Desired Flow :
Destination
Origin
A B C Tot.
A 0 871 77 948
B 758 0 133 891
C 46 138 0 184
Tot. 804 1009 210 2023
Traffic Lane Flows
Lane Scenario 1:
AM1
Junction: Mirehouse Rd / Egremont Rd
1/1 (with short)
948(In) 871(Out)
1/2 (short) 77
2/1 (short)
46
2/2 (with short)
184(In) 138(Out)
3/1 (short)
133
3/2 (with short)
891(In) 758(Out)
4/1 1009
5/1 804
6/1 210

Full Input Data And Results
Lane Saturation Flows
Junction: Mirehouse Rd / Egremont Rd
Lane Lane Width
(m) Gradient
Nearside Lane
Allowed Turns
Turning Radius
(m)
Turning Prop.
Sat Flow (PCU/Hr)
Flared Sat Flow (PCU/Hr)
1/1 (Egremont Rd West)
3.25 0.00 Y Arm 4 Ahead Inf 100.0 % 1940 1940
1/2 (Egremont Rd West)
3.25 0.00 Y Arm 6 Right 18.00 100.0 % 1791 1791
2/1 (Mirehouse Rd)
3.25 0.00 Y Arm 5 Left 15.00 100.0 % 1764 1764
2/2 (Mirehouse Rd)
3.25 0.00 Y Arm 4 Right 20.00 100.0 % 1805 1805
3/1 (Egremont Rd East)
3.25 0.00 Y Arm 6 Left 15.00 100.0 % 1764 1764
3/2 (Egremont Rd East)
3.25 0.00 Y Arm 5 Ahead Inf 100.0 % 1940 1940
4/1 (Egremont East - Exit Lane 1)
Infinite Saturation Flow Inf Inf
5/1 (Egremont West - Exit Lane 1)
Infinite Saturation Flow Inf Inf
6/1 (Mirehouse Rd - Exit Lane 1)
Infinite Saturation Flow Inf Inf
Scenario 2: 'AM25+C1' (FG2: 'AM 2025 Core 1', Plan 1: 'Network Control Plan 1') Traffic Flows, Desired Desired Flow :
Destination
Origin
A B C Tot.
A 0 951 102 1053
B 414 0 56 470
C 168 142 0 310
Tot. 582 1093 158 1833
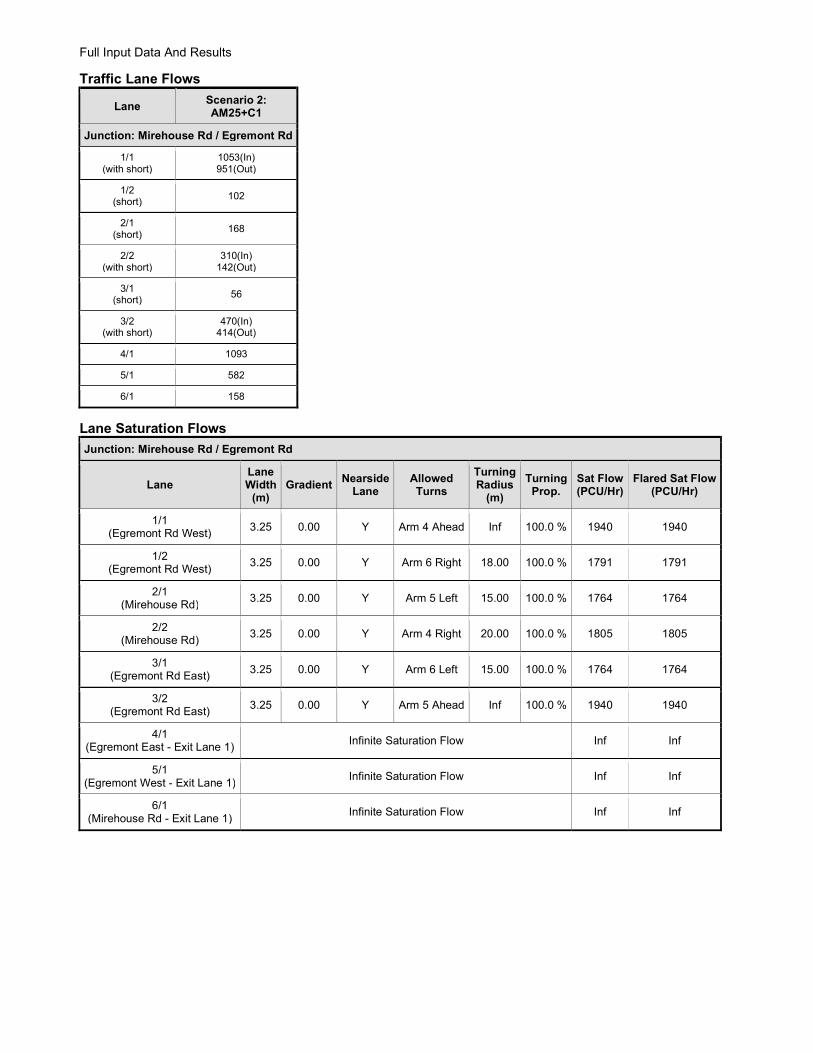
Full Input Data And Results
Traffic Lane Flows
Lane Scenario 2: AM25+C1
Junction: Mirehouse Rd / Egremont Rd
1/1 (with short)
1053(In) 951(Out)
1/2 (short)
102
2/1 (short)
168
2/2 (with short)
310(In) 142(Out)
3/1 (short)
56
3/2 (with short)
470(In) 414(Out)
4/1 1093
5/1 582
6/1 158
Lane Saturation Flows
Junction: Mirehouse Rd / Egremont Rd
Lane Lane Width
(m) Gradient
Nearside Lane
Allowed Turns
Turning Radius
(m)
Turning Prop.
Sat Flow (PCU/Hr)
Flared Sat Flow (PCU/Hr)
1/1 (Egremont Rd West)
3.25 0.00 Y Arm 4 Ahead Inf 100.0 % 1940 1940
1/2 (Egremont Rd West)
3.25 0.00 Y Arm 6 Right 18.00 100.0 % 1791 1791
2/1 (Mirehouse Rd)
3.25 0.00 Y Arm 5 Left 15.00 100.0 % 1764 1764
2/2 (Mirehouse Rd)
3.25 0.00 Y Arm 4 Right 20.00 100.0 % 1805 1805
3/1 (Egremont Rd East)
3.25 0.00 Y Arm 6 Left 15.00 100.0 % 1764 1764
3/2 (Egremont Rd East)
3.25 0.00 Y Arm 5 Ahead Inf 100.0 % 1940 1940
4/1 (Egremont East - Exit Lane 1)
Infinite Saturation Flow Inf Inf
5/1 (Egremont West - Exit Lane 1)
Infinite Saturation Flow Inf Inf
6/1 (Mirehouse Rd - Exit Lane 1)
Infinite Saturation Flow Inf Inf
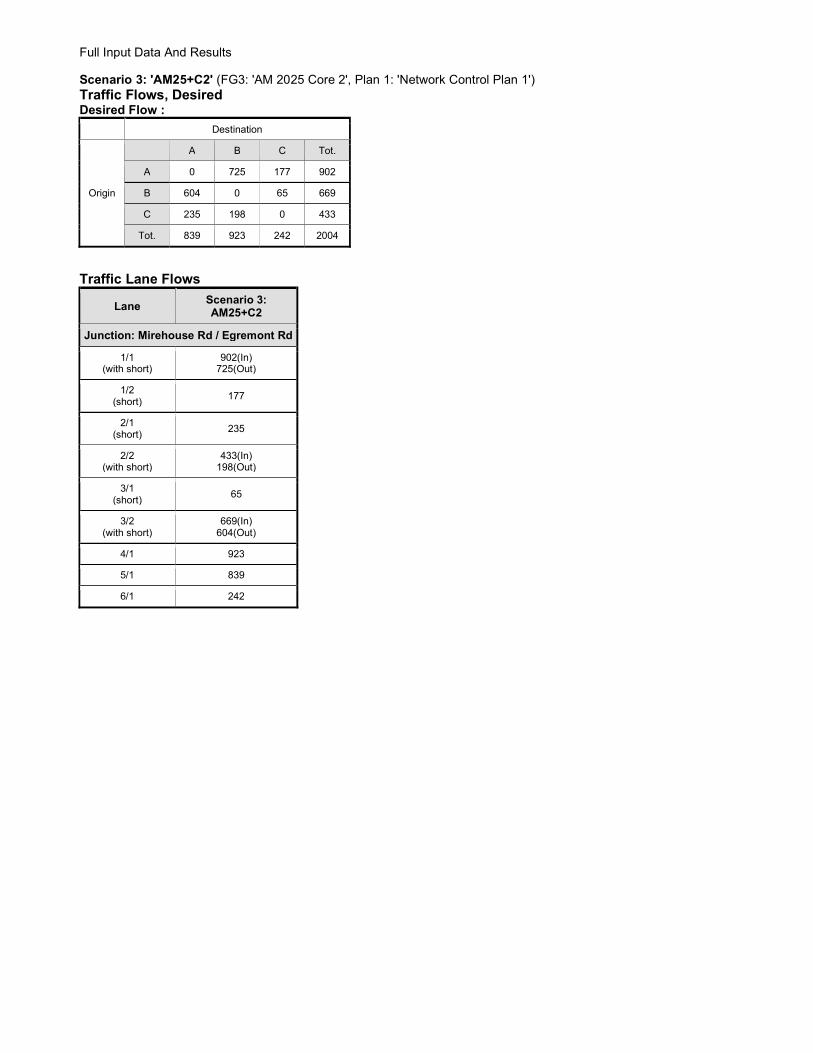
Full Input Data And Results Scenario 3: 'AM25+C2' (FG3: 'AM 2025 Core 2', Plan 1: 'Network Control Plan 1') Traffic Flows, Desired Desired Flow :
Destination
Origin
A B C Tot.
A 0 725 177 902
B 604 0 65 669
C 235 198 0 433
Tot. 839 923 242 2004
Traffic Lane Flows
Lane Scenario 3: AM25+C2
Junction: Mirehouse Rd / Egremont Rd
1/1 (with short)
902(In) 725(Out)
1/2 (short)
177
2/1 (short)
235
2/2 (with short)
433(In) 198(Out)
3/1 (short)
65
3/2 (with short)
669(In) 604(Out)
4/1 923
5/1 839
6/1 242
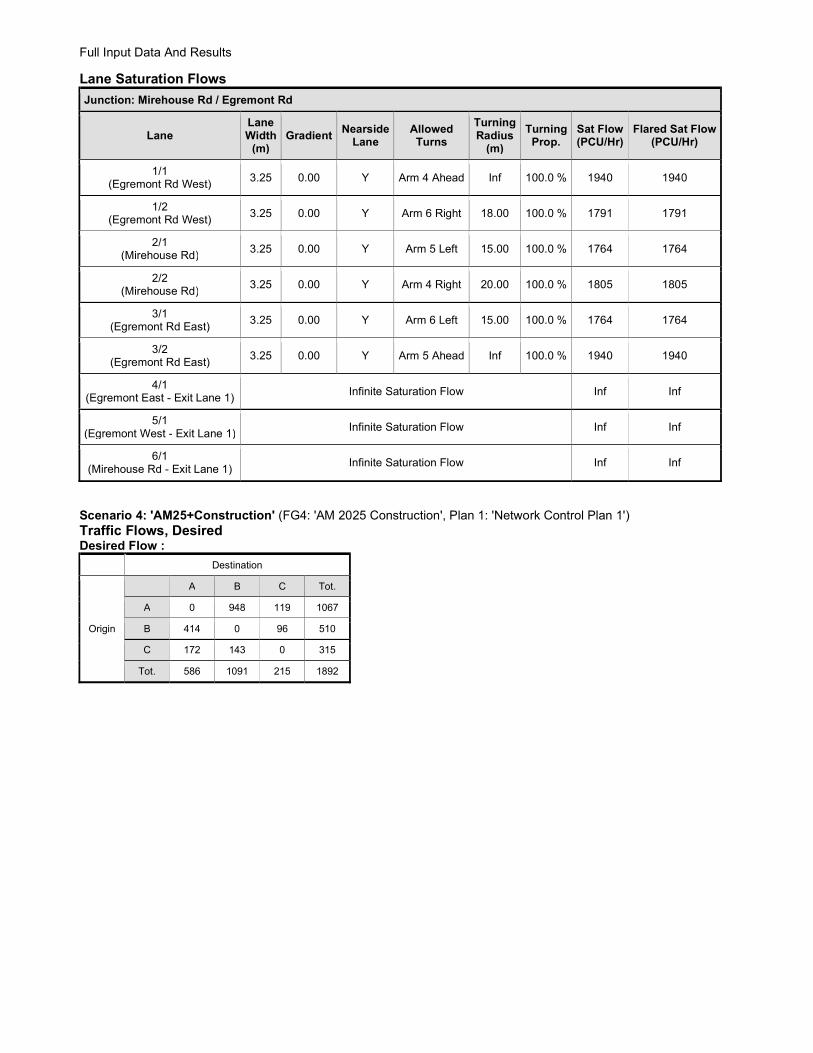
Full Input Data And Results
Lane Saturation Flows
Junction: Mirehouse Rd / Egremont Rd
Lane Lane Width
(m) Gradient
Nearside Lane
Allowed Turns
Turning Radius
(m)
Turning Prop.
Sat Flow (PCU/Hr)
Flared Sat Flow (PCU/Hr)
1/1 (Egremont Rd West)
3.25 0.00 Y Arm 4 Ahead Inf 100.0 % 1940 1940
1/2 (Egremont Rd West)
3.25 0.00 Y Arm 6 Right 18.00 100.0 % 1791 1791
2/1 (Mirehouse Rd)
3.25 0.00 Y Arm 5 Left 15.00 100.0 % 1764 1764
2/2 (Mirehouse Rd)
3.25 0.00 Y Arm 4 Right 20.00 100.0 % 1805 1805
3/1 (Egremont Rd East)
3.25 0.00 Y Arm 6 Left 15.00 100.0 % 1764 1764
3/2 (Egremont Rd East)
3.25 0.00 Y Arm 5 Ahead Inf 100.0 % 1940 1940
4/1 (Egremont East - Exit Lane 1)
Infinite Saturation Flow Inf Inf
5/1 (Egremont West - Exit Lane 1)
Infinite Saturation Flow Inf Inf
6/1 (Mirehouse Rd - Exit Lane 1)
Infinite Saturation Flow Inf Inf
Scenario 4: 'AM25+Construction' (FG4: 'AM 2025 Construction', Plan 1: 'Network Control Plan 1') Traffic Flows, Desired Desired Flow :
Destination
Origin
A B C Tot.
A 0 948 119 1067
B 414 0 96 510
C 172 143 0 315
Tot. 586 1091 215 1892
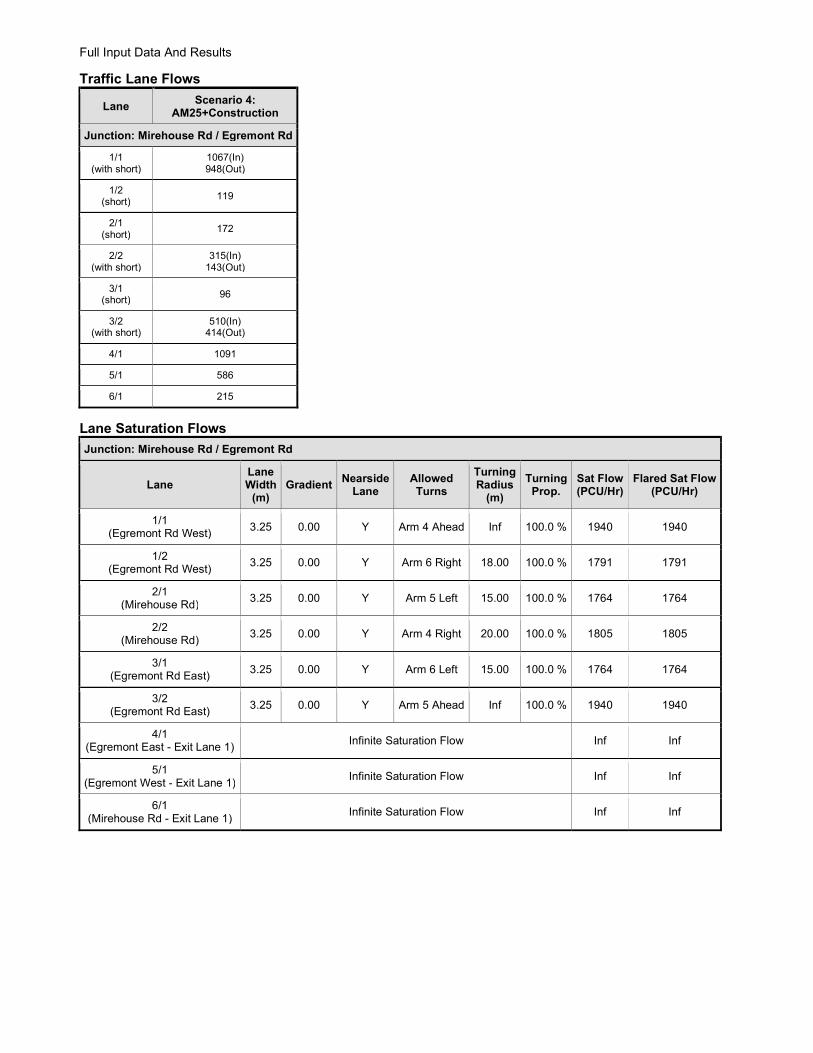
Full Input Data And Results
Traffic Lane Flows
Lane Scenario 4:
AM25+Construction
Junction: Mirehouse Rd / Egremont Rd
1/1 (with short)
1067(In) 948(Out)
1/2 (short)
119
2/1 (short)
172
2/2 (with short)
315(In) 143(Out)
3/1 (short)
96
3/2 (with short)
510(In) 414(Out)
4/1 1091
5/1 586
6/1 215
Lane Saturation Flows
Junction: Mirehouse Rd / Egremont Rd
Lane Lane Width
(m) Gradient
Nearside Lane
Allowed Turns
Turning Radius
(m)
Turning Prop.
Sat Flow (PCU/Hr)
Flared Sat Flow (PCU/Hr)
1/1 (Egremont Rd West)
3.25 0.00 Y Arm 4 Ahead Inf 100.0 % 1940 1940
1/2 (Egremont Rd West)
3.25 0.00 Y Arm 6 Right 18.00 100.0 % 1791 1791
2/1 (Mirehouse Rd)
3.25 0.00 Y Arm 5 Left 15.00 100.0 % 1764 1764
2/2 (Mirehouse Rd)
3.25 0.00 Y Arm 4 Right 20.00 100.0 % 1805 1805
3/1 (Egremont Rd East)
3.25 0.00 Y Arm 6 Left 15.00 100.0 % 1764 1764
3/2 (Egremont Rd East)
3.25 0.00 Y Arm 5 Ahead Inf 100.0 % 1940 1940
4/1 (Egremont East - Exit Lane 1)
Infinite Saturation Flow Inf Inf
5/1 (Egremont West - Exit Lane 1)
Infinite Saturation Flow Inf Inf
6/1 (Mirehouse Rd - Exit Lane 1)
Infinite Saturation Flow Inf Inf

Full Input Data And Results Scenario 5: 'AM25+Operation' (FG5: 'AM 2025 Operation', Plan 1: 'Network Control Plan 1') Traffic Flows, Desired Desired Flow :
Destination
Origin
A B C Tot.
A 0 694 188 882
B 603 0 83 686
C 238 198 0 436
Tot. 841 892 271 2004
Traffic Lane Flows
Lane Scenario 5:
AM25+Operation
Junction: Mirehouse Rd / Egremont Rd
1/1 (with short)
882(In) 694(Out)
1/2 (short)
188
2/1 (short)
238
2/2 (with short)
436(In) 198(Out)
3/1 (short)
83
3/2 (with short)
686(In) 603(Out)
4/1 892
5/1 841
6/1 271

Full Input Data And Results
Lane Saturation Flows
Junction: Mirehouse Rd / Egremont Rd
Lane Lane Width
(m) Gradient
Nearside Lane
Allowed Turns
Turning Radius
(m)
Turning Prop.
Sat Flow (PCU/Hr)
Flared Sat Flow (PCU/Hr)
1/1 (Egremont Rd West)
3.25 0.00 Y Arm 4 Ahead Inf 100.0 % 1940 1940
1/2 (Egremont Rd West)
3.25 0.00 Y Arm 6 Right 18.00 100.0 % 1791 1791
2/1 (Mirehouse Rd)
3.25 0.00 Y Arm 5 Left 15.00 100.0 % 1764 1764
2/2 (Mirehouse Rd)
3.25 0.00 Y Arm 4 Right 20.00 100.0 % 1805 1805
3/1 (Egremont Rd East)
3.25 0.00 Y Arm 6 Left 15.00 100.0 % 1764 1764
3/2 (Egremont Rd East)
3.25 0.00 Y Arm 5 Ahead Inf 100.0 % 1940 1940
4/1 (Egremont East - Exit Lane 1)
Infinite Saturation Flow Inf Inf
5/1 (Egremont West - Exit Lane 1)
Infinite Saturation Flow Inf Inf
6/1 (Mirehouse Rd - Exit Lane 1)
Infinite Saturation Flow Inf Inf
Scenario 6: 'AM35+C' (FG6: 'AM 2035 Core ', Plan 1: 'Network Control Plan 1') Traffic Flows, Desired Desired Flow :
Destination
Origin
A B C Tot.
A 0 790 219 1009
B 582 0 104 686
C 293 271 0 564
Tot. 875 1061 323 2259

Full Input Data And Results
Traffic Lane Flows
Lane Scenario 6:
AM35+C
Junction: Mirehouse Rd / Egremont Rd
1/1 (with short)
1009(In) 790(Out)
1/2 (short)
219
2/1 (short)
293
2/2 (with short)
564(In) 271(Out)
3/1 (short)
104
3/2 (with short)
686(In) 582(Out)
4/1 1061
5/1 875
6/1 323
Lane Saturation Flows
Junction: Mirehouse Rd / Egremont Rd
Lane Lane Width
(m) Gradient
Nearside Lane
Allowed Turns
Turning Radius
(m)
Turning Prop.
Sat Flow (PCU/Hr)
Flared Sat Flow (PCU/Hr)
1/1 (Egremont Rd West)
3.25 0.00 Y Arm 4 Ahead Inf 100.0 % 1940 1940
1/2 (Egremont Rd West)
3.25 0.00 Y Arm 6 Right 18.00 100.0 % 1791 1791
2/1 (Mirehouse Rd)
3.25 0.00 Y Arm 5 Left 15.00 100.0 % 1764 1764
2/2 (Mirehouse Rd)
3.25 0.00 Y Arm 4 Right 20.00 100.0 % 1805 1805
3/1 (Egremont Rd East)
3.25 0.00 Y Arm 6 Left 15.00 100.0 % 1764 1764
3/2 (Egremont Rd East)
3.25 0.00 Y Arm 5 Ahead Inf 100.0 % 1940 1940
4/1 (Egremont East - Exit Lane 1)
Infinite Saturation Flow Inf Inf
5/1 (Egremont West - Exit Lane 1)
Infinite Saturation Flow Inf Inf
6/1 (Mirehouse Rd - Exit Lane 1)
Infinite Saturation Flow Inf Inf

Full Input Data And Results Scenario 7: 'AM35+Operation' (FG7: 'AM 2035 Operation', Plan 1: 'Network Control Plan 1') Traffic Flows, Desired Desired Flow :
Destination
Origin
A B C Tot.
A 0 792 288 1080
B 578 0 138 716
C 294 267 0 561
Tot. 872 1059 426 2357
Traffic Lane Flows
Lane Scenario 7:
AM35+Operation
Junction: Mirehouse Rd / Egremont Rd
1/1 (with short)
1080(In) 792(Out)
1/2 (short)
288
2/1 (short)
294
2/2 (with short)
561(In) 267(Out)
3/1 (short)
138
3/2 (with short)
716(In) 578(Out)
4/1 1059
5/1 872
6/1 426

Full Input Data And Results
Lane Saturation Flows
Junction: Mirehouse Rd / Egremont Rd
Lane Lane Width
(m) Gradient
Nearside Lane
Allowed Turns
Turning Radius
(m)
Turning Prop.
Sat Flow (PCU/Hr)
Flared Sat Flow (PCU/Hr)
1/1 (Egremont Rd West)
3.25 0.00 Y Arm 4 Ahead Inf 100.0 % 1940 1940
1/2 (Egremont Rd West)
3.25 0.00 Y Arm 6 Right 18.00 100.0 % 1791 1791
2/1 (Mirehouse Rd)
3.25 0.00 Y Arm 5 Left 15.00 100.0 % 1764 1764
2/2 (Mirehouse Rd)
3.25 0.00 Y Arm 4 Right 20.00 100.0 % 1805 1805
3/1 (Egremont Rd East)
3.25 0.00 Y Arm 6 Left 15.00 100.0 % 1764 1764
3/2 (Egremont Rd East)
3.25 0.00 Y Arm 5 Ahead Inf 100.0 % 1940 1940
4/1 (Egremont East - Exit Lane 1)
Infinite Saturation Flow Inf Inf
5/1 (Egremont West - Exit Lane 1)
Infinite Saturation Flow Inf Inf
6/1 (Mirehouse Rd - Exit Lane 1)
Infinite Saturation Flow Inf Inf
Scenario 8: 'PM1' (FG8: 'PM', Plan 1: 'Network Control Plan 1') Traffic Flows, Desired Desired Flow :
Destination
Origin
A B C Tot.
A 0 686 165 851
B 893 0 139 1032
C 66 150 0 216
Tot. 959 836 304 2099
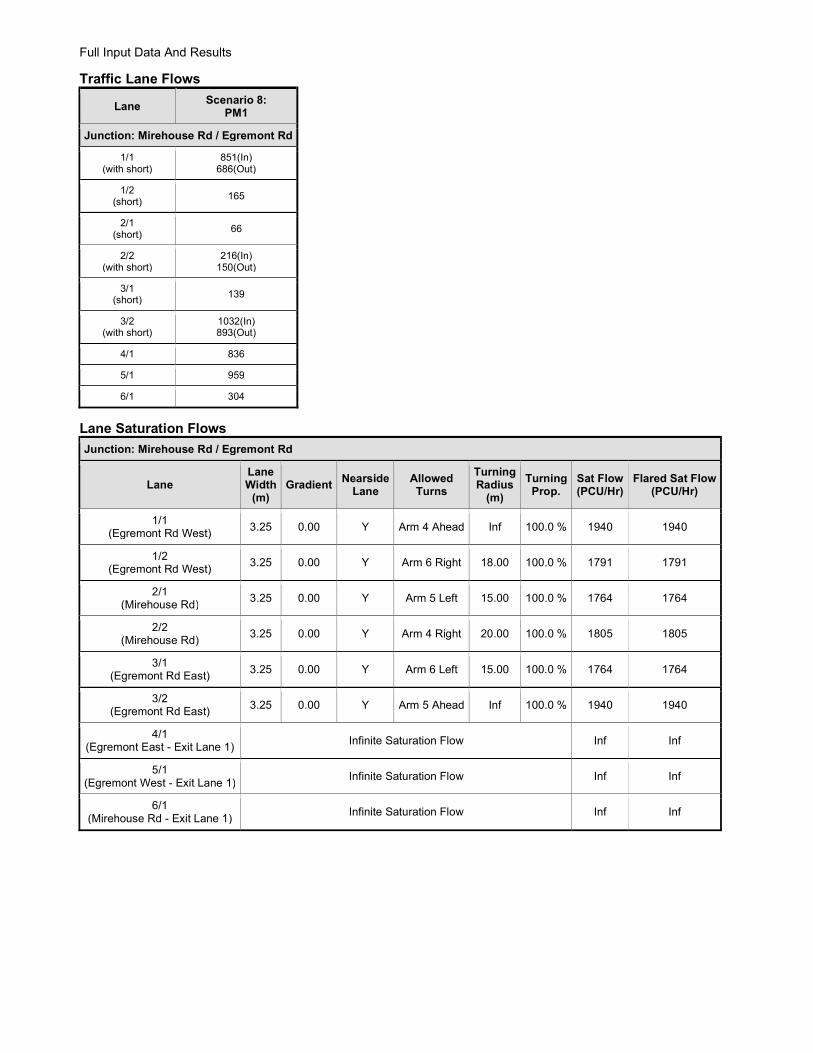
Full Input Data And Results
Traffic Lane Flows
Lane Scenario 8:
PM1
Junction: Mirehouse Rd / Egremont Rd
1/1 (with short)
851(In) 686(Out)
1/2 (short)
165
2/1 (short)
66
2/2 (with short)
216(In) 150(Out)
3/1 (short)
139
3/2 (with short)
1032(In) 893(Out)
4/1 836
5/1 959
6/1 304
Lane Saturation Flows
Junction: Mirehouse Rd / Egremont Rd
Lane Lane Width
(m) Gradient
Nearside Lane
Allowed Turns
Turning Radius
(m)
Turning Prop.
Sat Flow (PCU/Hr)
Flared Sat Flow (PCU/Hr)
1/1 (Egremont Rd West)
3.25 0.00 Y Arm 4 Ahead Inf 100.0 % 1940 1940
1/2 (Egremont Rd West)
3.25 0.00 Y Arm 6 Right 18.00 100.0 % 1791 1791
2/1 (Mirehouse Rd)
3.25 0.00 Y Arm 5 Left 15.00 100.0 % 1764 1764
2/2 (Mirehouse Rd)
3.25 0.00 Y Arm 4 Right 20.00 100.0 % 1805 1805
3/1 (Egremont Rd East)
3.25 0.00 Y Arm 6 Left 15.00 100.0 % 1764 1764
3/2 (Egremont Rd East)
3.25 0.00 Y Arm 5 Ahead Inf 100.0 % 1940 1940
4/1 (Egremont East - Exit Lane 1)
Infinite Saturation Flow Inf Inf
5/1 (Egremont West - Exit Lane 1)
Infinite Saturation Flow Inf Inf
6/1 (Mirehouse Rd - Exit Lane 1)
Infinite Saturation Flow Inf Inf
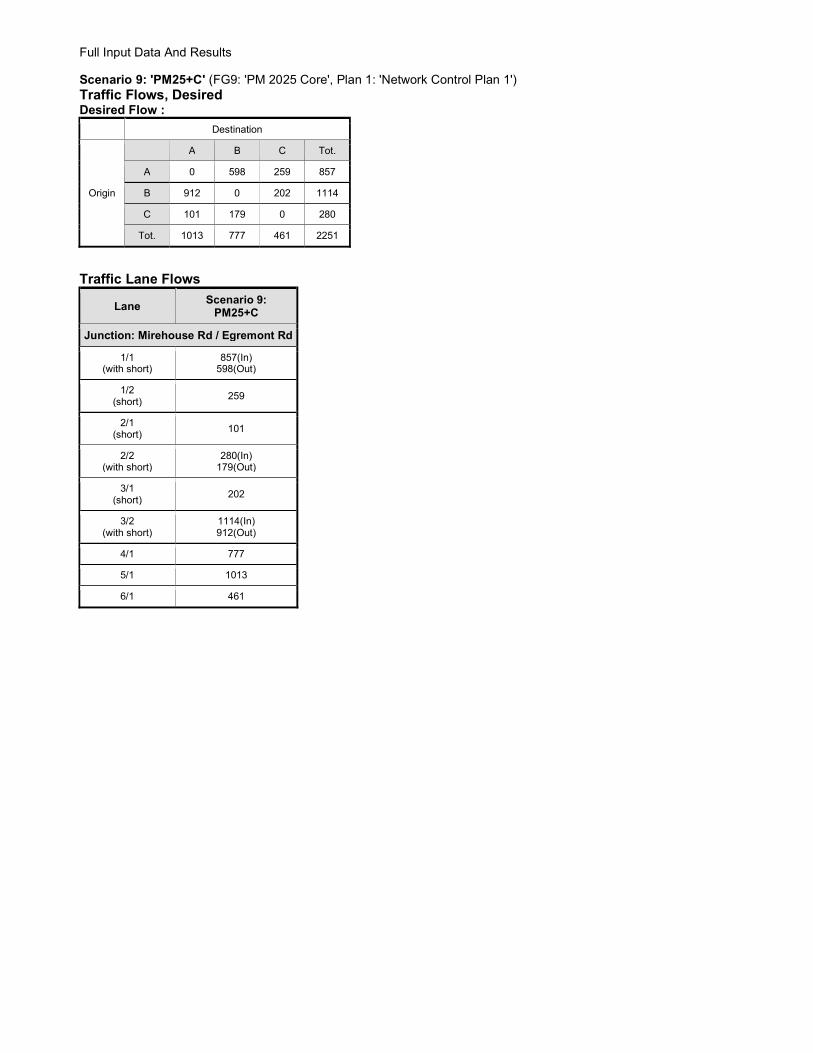
Full Input Data And Results Scenario 9: 'PM25+C' (FG9: 'PM 2025 Core', Plan 1: 'Network Control Plan 1') Traffic Flows, Desired Desired Flow :
Destination
Origin
A B C Tot.
A 0 598 259 857
B 912 0 202 1114
C 101 179 0 280
Tot. 1013 777 461 2251
Traffic Lane Flows
Lane Scenario 9:
PM25+C
Junction: Mirehouse Rd / Egremont Rd
1/1 (with short)
857(In) 598(Out)
1/2 (short)
259
2/1 (short)
101
2/2 (with short)
280(In) 179(Out)
3/1 (short)
202
3/2 (with short)
1114(In) 912(Out)
4/1 777
5/1 1013
6/1 461

Full Input Data And Results
Lane Saturation Flows
Junction: Mirehouse Rd / Egremont Rd
Lane Lane Width
(m) Gradient
Nearside Lane
Allowed Turns
Turning Radius
(m)
Turning Prop.
Sat Flow (PCU/Hr)
Flared Sat Flow (PCU/Hr)
1/1 (Egremont Rd West)
3.25 0.00 Y Arm 4 Ahead Inf 100.0 % 1940 1940
1/2 (Egremont Rd West)
3.25 0.00 Y Arm 6 Right 18.00 100.0 % 1791 1791
2/1 (Mirehouse Rd)
3.25 0.00 Y Arm 5 Left 15.00 100.0 % 1764 1764
2/2 (Mirehouse Rd)
3.25 0.00 Y Arm 4 Right 20.00 100.0 % 1805 1805
3/1 (Egremont Rd East)
3.25 0.00 Y Arm 6 Left 15.00 100.0 % 1764 1764
3/2 (Egremont Rd East)
3.25 0.00 Y Arm 5 Ahead Inf 100.0 % 1940 1940
4/1 (Egremont East - Exit Lane 1)
Infinite Saturation Flow Inf Inf
5/1 (Egremont West - Exit Lane 1)
Infinite Saturation Flow Inf Inf
6/1 (Mirehouse Rd - Exit Lane 1)
Infinite Saturation Flow Inf Inf
Scenario 10: 'PM25+Construction' (FG10: 'PM 2025 Construction', Plan 1: 'Network Control Plan 1') Traffic Flows, Desired Desired Flow :
Destination
Origin
A B C Tot.
A 0 590 262 852
B 899 0 207 1106
C 105 226 0 331
Tot. 1004 816 469 2289

Full Input Data And Results
Traffic Lane Flows
Lane Scenario 10:
PM25+Construction
Junction: Mirehouse Rd / Egremont Rd
1/1 (with short)
852(In) 590(Out)
1/2 (short)
262
2/1 (short)
105
2/2 (with short)
331(In) 226(Out)
3/1 (short)
207
3/2 (with short)
1106(In) 899(Out)
4/1 816
5/1 1004
6/1 469
Lane Saturation Flows
Junction: Mirehouse Rd / Egremont Rd
Lane Lane Width
(m) Gradient
Nearside Lane
Allowed Turns
Turning Radius
(m)
Turning Prop.
Sat Flow (PCU/Hr)
Flared Sat Flow (PCU/Hr)
1/1 (Egremont Rd West)
3.25 0.00 Y Arm 4 Ahead Inf 100.0 % 1940 1940
1/2 (Egremont Rd West)
3.25 0.00 Y Arm 6 Right 18.00 100.0 % 1791 1791
2/1 (Mirehouse Rd)
3.25 0.00 Y Arm 5 Left 15.00 100.0 % 1764 1764
2/2 (Mirehouse Rd)
3.25 0.00 Y Arm 4 Right 20.00 100.0 % 1805 1805
3/1 (Egremont Rd East)
3.25 0.00 Y Arm 6 Left 15.00 100.0 % 1764 1764
3/2 (Egremont Rd East)
3.25 0.00 Y Arm 5 Ahead Inf 100.0 % 1940 1940
4/1 (Egremont East - Exit Lane 1)
Infinite Saturation Flow Inf Inf
5/1 (Egremont West - Exit Lane 1)
Infinite Saturation Flow Inf Inf
6/1 (Mirehouse Rd - Exit Lane 1)
Infinite Saturation Flow Inf Inf

Full Input Data And Results Scenario 11: 'PM25+Operation' (FG11: 'PM 2025 Operation', Plan 1: 'Network Control Plan 1') Traffic Flows, Desired Desired Flow :
Destination
Origin
A B C Tot.
A 0 595 260 855
B 913 0 199 1112
C 101 198 0 299
Tot. 1014 793 459 2266
Traffic Lane Flows
Lane Scenario 11:
PM25+Operation
Junction: Mirehouse Rd / Egremont Rd
1/1 (with short)
855(In) 595(Out)
1/2 (short)
260
2/1 (short)
101
2/2 (with short)
299(In) 198(Out)
3/1 (short)
199
3/2 (with short)
1112(In) 913(Out)
4/1 793
5/1 1014
6/1 459

Full Input Data And Results
Lane Saturation Flows
Junction: Mirehouse Rd / Egremont Rd
Lane Lane Width
(m) Gradient
Nearside Lane
Allowed Turns
Turning Radius
(m)
Turning Prop.
Sat Flow (PCU/Hr)
Flared Sat Flow (PCU/Hr)
1/1 (Egremont Rd West)
3.25 0.00 Y Arm 4 Ahead Inf 100.0 % 1940 1940
1/2 (Egremont Rd West)
3.25 0.00 Y Arm 6 Right 18.00 100.0 % 1791 1791
2/1 (Mirehouse Rd)
3.25 0.00 Y Arm 5 Left 15.00 100.0 % 1764 1764
2/2 (Mirehouse Rd)
3.25 0.00 Y Arm 4 Right 20.00 100.0 % 1805 1805
3/1 (Egremont Rd East)
3.25 0.00 Y Arm 6 Left 15.00 100.0 % 1764 1764
3/2 (Egremont Rd East)
3.25 0.00 Y Arm 5 Ahead Inf 100.0 % 1940 1940
4/1 (Egremont East - Exit Lane 1)
Infinite Saturation Flow Inf Inf
5/1 (Egremont West - Exit Lane 1)
Infinite Saturation Flow Inf Inf
6/1 (Mirehouse Rd - Exit Lane 1)
Infinite Saturation Flow Inf Inf
Scenario 12: 'PM35+C' (FG12: 'PM 2035 Core', Plan 1: 'Network Control Plan 1') Traffic Flows, Desired Desired Flow :
Destination
Origin
A B C Tot.
A 0 614 313 927
B 843 0 269 1112
C 147 207 0 354
Tot. 990 821 582 2393

Full Input Data And Results
Traffic Lane Flows
Lane Scenario 12:
PM35+C
Junction: Mirehouse Rd / Egremont Rd
1/1 (with short)
927(In) 614(Out)
1/2 (short)
313
2/1 (short)
147
2/2 (with short)
354(In) 207(Out)
3/1 (short)
269
3/2 (with short)
1112(In) 843(Out)
4/1 821
5/1 990
6/1 582
Lane Saturation Flows
Junction: Mirehouse Rd / Egremont Rd
Lane Lane Width
(m) Gradient
Nearside Lane
Allowed Turns
Turning Radius
(m)
Turning Prop.
Sat Flow (PCU/Hr)
Flared Sat Flow (PCU/Hr)
1/1 (Egremont Rd West)
3.25 0.00 Y Arm 4 Ahead Inf 100.0 % 1940 1940
1/2 (Egremont Rd West)
3.25 0.00 Y Arm 6 Right 18.00 100.0 % 1791 1791
2/1 (Mirehouse Rd)
3.25 0.00 Y Arm 5 Left 15.00 100.0 % 1764 1764
2/2 (Mirehouse Rd)
3.25 0.00 Y Arm 4 Right 20.00 100.0 % 1805 1805
3/1 (Egremont Rd East)
3.25 0.00 Y Arm 6 Left 15.00 100.0 % 1764 1764
3/2 (Egremont Rd East)
3.25 0.00 Y Arm 5 Ahead Inf 100.0 % 1940 1940
4/1 (Egremont East - Exit Lane 1)
Infinite Saturation Flow Inf Inf
5/1 (Egremont West - Exit Lane 1)
Infinite Saturation Flow Inf Inf
6/1 (Mirehouse Rd - Exit Lane 1)
Infinite Saturation Flow Inf Inf
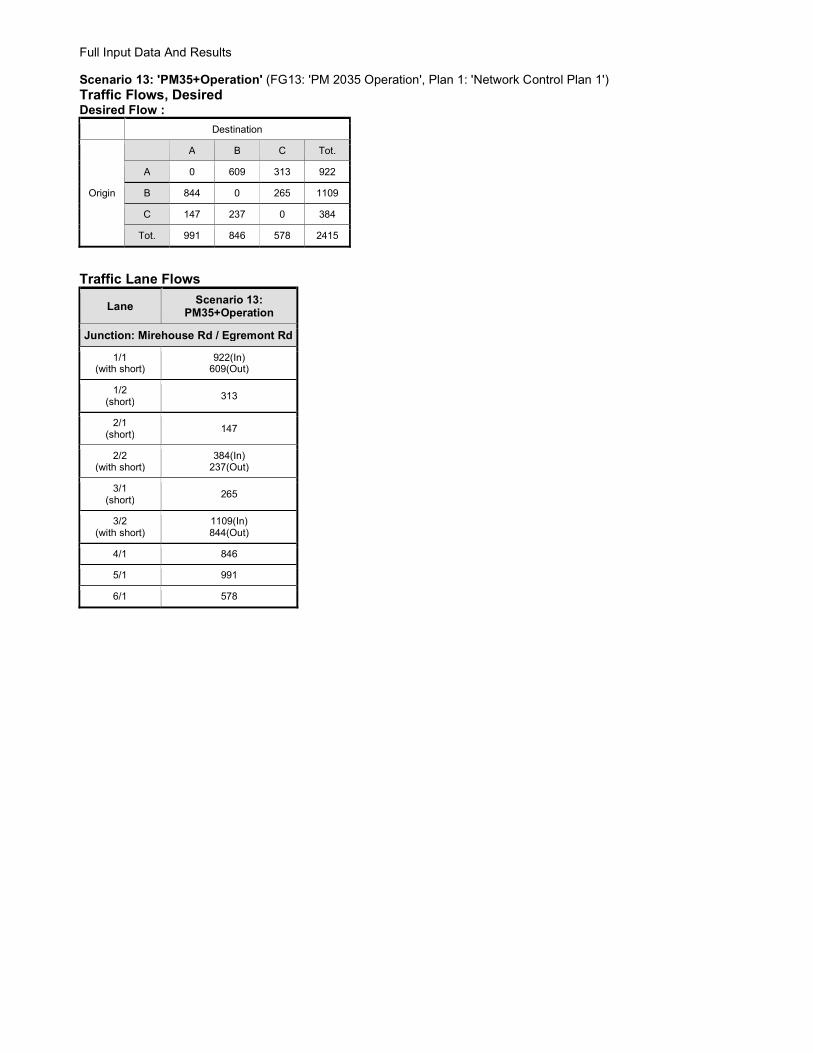
Full Input Data And Results Scenario 13: 'PM35+Operation' (FG13: 'PM 2035 Operation', Plan 1: 'Network Control Plan 1') Traffic Flows, Desired Desired Flow :
Destination
Origin
A B C Tot.
A 0 609 313 922
B 844 0 265 1109
C 147 237 0 384
Tot. 991 846 578 2415
Traffic Lane Flows
Lane Scenario 13:
PM35+Operation
Junction: Mirehouse Rd / Egremont Rd
1/1 (with short)
922(In) 609(Out)
1/2 (short)
313
2/1 (short)
147
2/2 (with short)
384(In) 237(Out)
3/1 (short)
265
3/2 (with short)
1109(In) 844(Out)
4/1 846
5/1 991
6/1 578
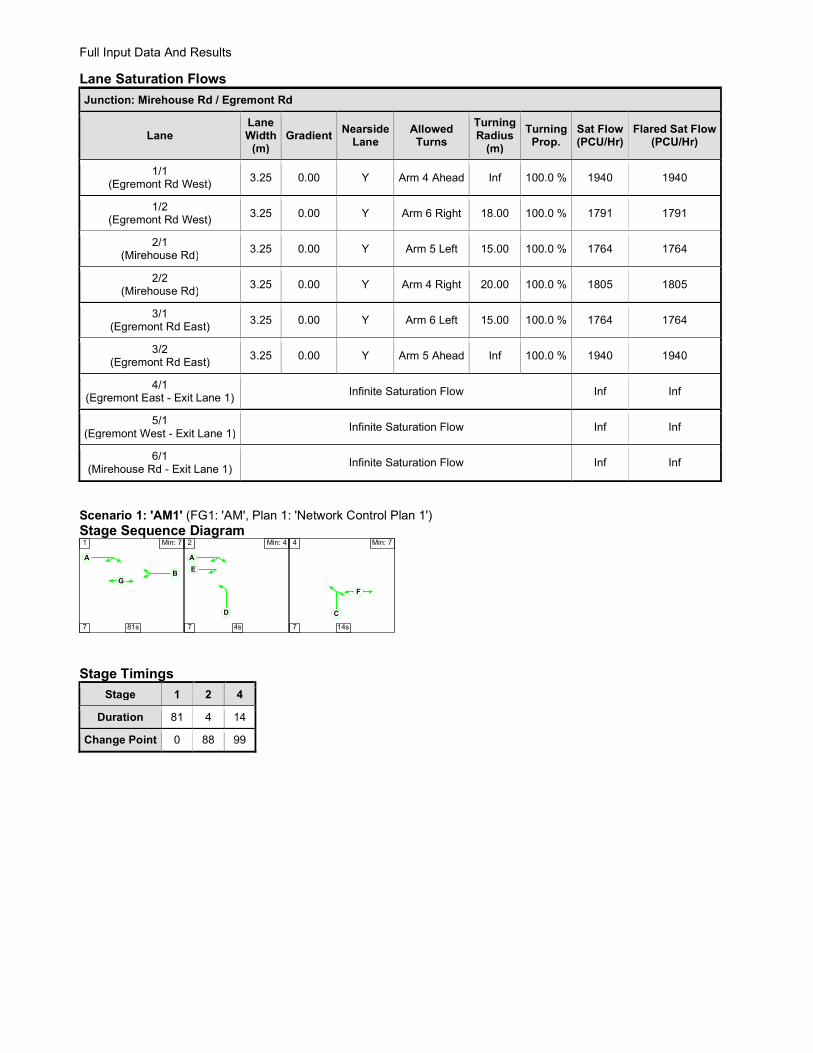
Full Input Data And Results
Lane Saturation Flows
Junction: Mirehouse Rd / Egremont Rd
Lane Lane Width
(m) Gradient
Nearside Lane
Allowed Turns
Turning Radius
(m)
Turning Prop.
Sat Flow (PCU/Hr)
Flared Sat Flow (PCU/Hr)
1/1 (Egremont Rd West)
3.25 0.00 Y Arm 4 Ahead Inf 100.0 % 1940 1940
1/2 (Egremont Rd West)
3.25 0.00 Y Arm 6 Right 18.00 100.0 % 1791 1791
2/1 (Mirehouse Rd)
3.25 0.00 Y Arm 5 Left 15.00 100.0 % 1764 1764
2/2 (Mirehouse Rd)
3.25 0.00 Y Arm 4 Right 20.00 100.0 % 1805 1805
3/1 (Egremont Rd East)
3.25 0.00 Y Arm 6 Left 15.00 100.0 % 1764 1764
3/2 (Egremont Rd East)
3.25 0.00 Y Arm 5 Ahead Inf 100.0 % 1940 1940
4/1 (Egremont East - Exit Lane 1)
Infinite Saturation Flow Inf Inf
5/1 (Egremont West - Exit Lane 1)
Infinite Saturation Flow Inf Inf
6/1 (Mirehouse Rd - Exit Lane 1)
Infinite Saturation Flow Inf Inf
Scenario 1: 'AM1' (FG1: 'AM', Plan 1: 'Network Control Plan 1') Stage Sequence Diagram
A
BG
1 Min: 7
7 81s
A
D
E
2 Min: 4
7 4s
C
F
4 Min: 7
7 14s Stage Timings
Stage 1 2 4
Duration 81 4 14
Change Point 0 88 99
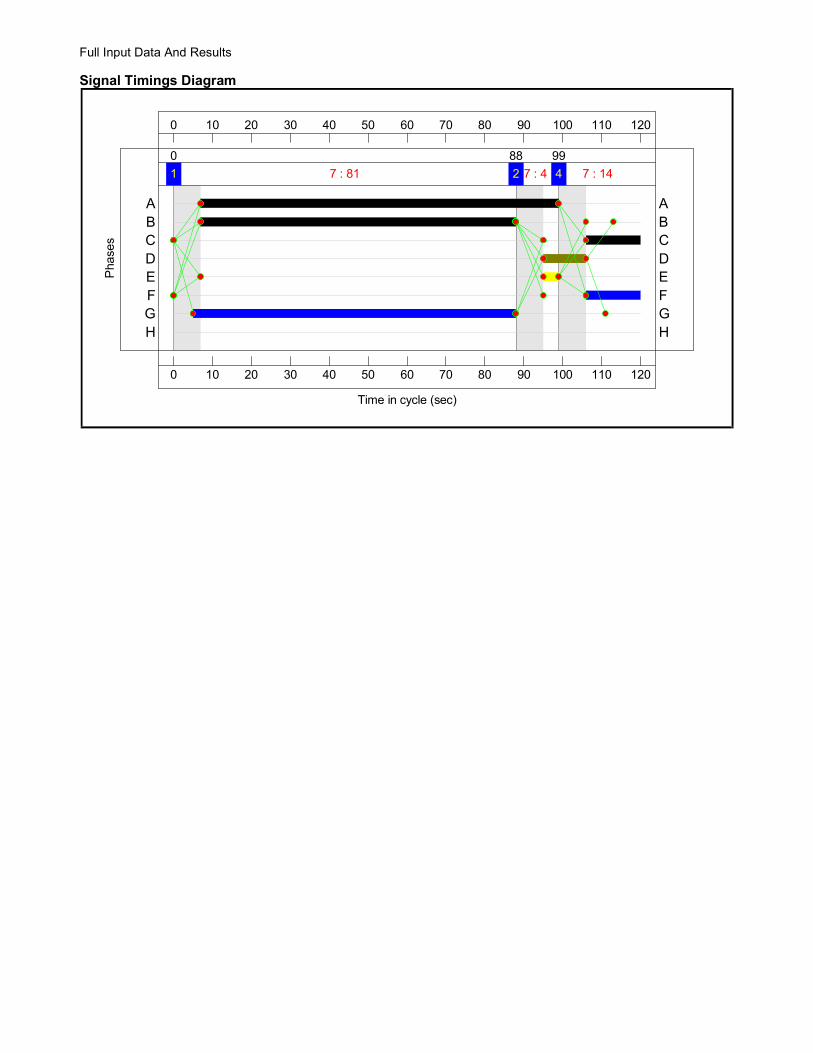
Full Input Data And Results Signal Timings Diagram
0
0
10
10
20
20
30
30
40
40
50
50
60
60
70
70
80
80
90
90
100
100
110
110
120
120
Time in cycle (sec)
Pha
ses
1 7 : 81
0
2 7 : 4
88
4 7 : 14
99
H HG GF FE ED DC CB BA A

Full Input Data And Results Network Layout Diagram

Full Input Data And Results
Mirehouse Rd / Egremont RdPRC: 37.6 %Total Traffic Delay: 9.0 pcuHr
Arm 1 - Egremont Rd West1
2
13.3
62.6%
871
62.6%
77
Arm 2 - Mirehouse Rd
12
61.2%
46
5.1
61.2%
138
Arm 3 - Egremont Rd East
12
65.4%
133
15.4
65.4%
758
Arm 4 - Egremont East - Exit1
0.0
0.0%
1009
Arm 5 - Egremont West - Exit
1
0.0
0.0%
804
Arm 6 - Mirehouse Rd - E
xit
10.0
0.0%
210
A
B
CRight turn from Egremont Rd West set to give way to all movements from Egremont Rd East.Arm 1 Lane 2 set to run the Indicative arrow Phase E.Drawing indicates LT from Mirehouse Rd is a filter. The filter runs in stage 2 and to be terminated must be followed by the main associated phase (phase C) so must run from Stage 2 > 41>2>4 Stage sequence used when demand for LT filter1>4 Stage sequence used when NO demand for LT filterA>F and F>A Intergreen of 7" added.

Full Input Data And Results Network Results
Item Lane Description
Lane Type
Controller Stream
Position In Filtered Route
Full Phase Arrow Phase
Num Greens
Total Green (s)
Arrow Green (s)
Demand Flow (pcu)
Sat Flow (pcu/Hr)
Capacity (pcu)
Deg Sat (%)
Network - - N/A - - - - - - - - 65.4%
Mirehouse Rd / Egremont Rd
- - N/A - - - - - - - - 65.4%
1/1+1/2 Egremont Rd West Ahead
Right U+O N/A N/A A E 1 92 4 948 1940:1791 1391+123
62.6 : 62.6%
2/2+2/1 Mirehouse Rd
Right Left U N/A N/A C D 1 14:25 11 184 1805:1764 226+75
61.2 : 61.2%
3/2+3/1 Egremont Rd
East Ahead Left U N/A N/A B 1 81 - 891 1940:1764 1159+203
65.4 : 65.4%
4/1 Egremont East - Exit
U N/A N/A - - - - 1009 Inf Inf 0.0%
5/1 Egremont West
- Exit U N/A N/A - - - - 804 Inf Inf 0.0%
6/1 Mirehouse Rd -
Exit U N/A N/A - - - - 210 Inf Inf 0.0%
Item Arriving (pcu) Leaving (pcu)
Turners In Gaps (pcu)
Turners When Unopposed (pcu)
Turners In Intergreen (pcu)
Uniform Delay (pcuHr)
Rand + Oversat Delay (pcuHr)
Storage Area Uniform Delay (pcuHr)
Total Delay (pcuHr)
Av. Delay Per PCU (s/pcu)
Max. Back of Uniform Queue (pcu)
Rand + Oversat Queue (pcu)
Mean Max Queue (pcu)
Network - - 70 6 1 6.2 2.6 0.2 9.0 - - - -
Mirehouse Rd / Egremont Rd
- - 70 6 1 6.2 2.6 0.2 9.0 - - - -
1/1+1/2 948 948 70 6 1 1.4 0.8 0.2 2.5 9.5 12.4 0.8 13.3
2/2+2/1 184 184 - - - 2.4 0.8 - 3.2 62.0 4.3 0.8 5.1
3/2+3/1 891 891 - - - 2.4 0.9 - 3.3 13.5 14.5 0.9 15.4
4/1 1009 1009 - - - 0.0 0.0 - 0.0 0.0 0.0 0.0 0.0
5/1 804 804 - - - 0.0 0.0 - 0.0 0.0 0.0 0.0 0.0
6/1 210 210 - - - 0.0 0.0 - 0.0 0.0 0.0 0.0 0.0
C1 PRC for Signalled Lanes (%): 37.6 Total Delay for Signalled Lanes (pcuHr): 9.01 Cycle Time (s): 120 PRC Over All Lanes (%): 37.6 Total Delay Over All Lanes(pcuHr): 9.01

Full Input Data And Results
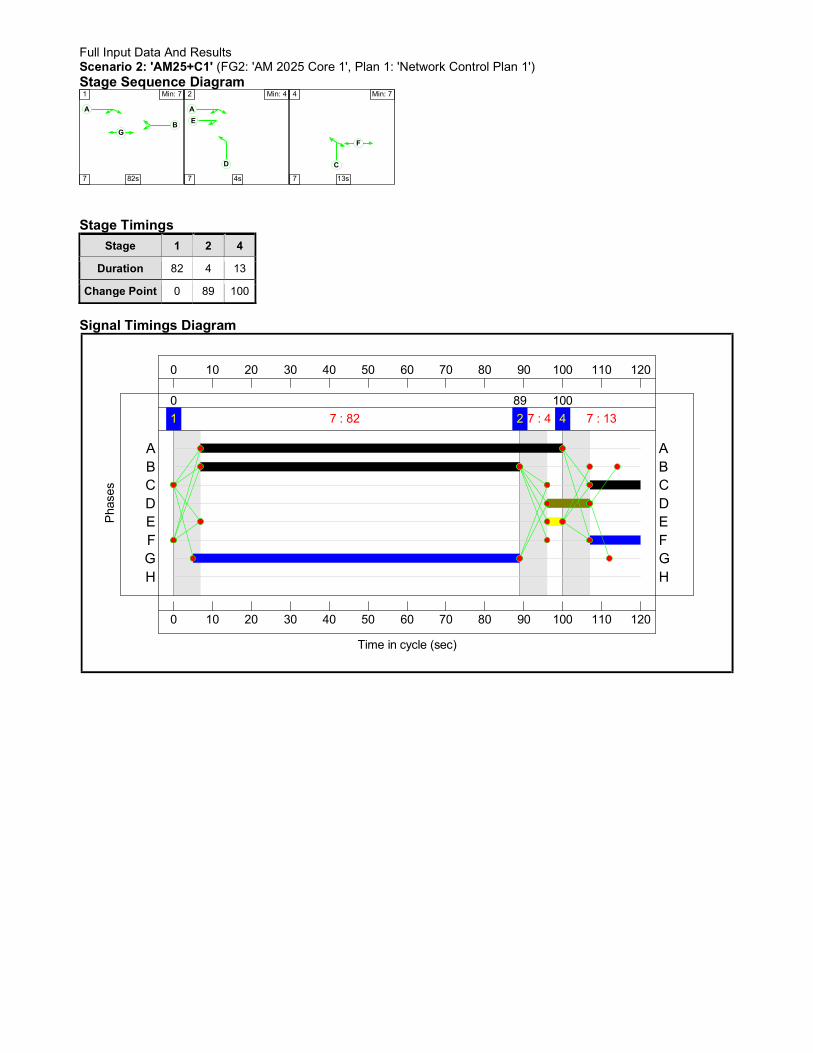
Full Input Data And Results Scenario 2: 'AM25+C1' (FG2: 'AM 2025 Core 1', Plan 1: 'Network Control Plan 1') Stage Sequence Diagram
A
BG
1 Min: 7
7 82s
A
D
E
2 Min: 4
7 4s
C
F
4 Min: 7
7 13s Stage Timings
Stage 1 2 4
Duration 82 4 13
Change Point 0 89 100
Signal Timings Diagram
0
0
10
10
20
20
30
30
40
40
50
50
60
60
70
70
80
80
90
90
100
100
110
110
120
120
Time in cycle (sec)
Pha
ses
1 7 : 82
0
2 7 : 4
89
4 7 : 13
100
H HG GF FE ED DC CB BA A

Full Input Data And Results Network Layout Diagram

Full Input Data And Results
Mirehouse Rd / Egremont RdPRC: 31.1 %Total Traffic Delay: 8.9 pcuHr
Arm 1 - Egremont Rd West1
2
15.6
68.7%
951
68.7%
102
Arm 2 - Mirehouse Rd
12
67.4%
168
5.9
67.4%
142
Arm 3 - Egremont Rd East
12
34.3%
56
5.7
34.3%
414
Arm 4 - Egremont East - Exit1
0.0
0.0%
1093
Arm 5 - Egremont West - Exit
1
0.0
0.0%
582
Arm 6 - Mirehouse Rd - E
xit
10.0
0.0%
158
A
B
CRight turn from Egremont Rd West set to give way to all movements from Egremont Rd East.Arm 1 Lane 2 set to run the Indicative arrow Phase E.Drawing indicates LT from Mirehouse Rd is a filter. The filter runs in stage 2 and to be terminated must be followed by the main associated phase (phase C) so must run from Stage 2 > 41>2>4 Stage sequence used when demand for LT filter1>4 Stage sequence used when NO demand for LT filterA>F and F>A Intergreen of 7" added.
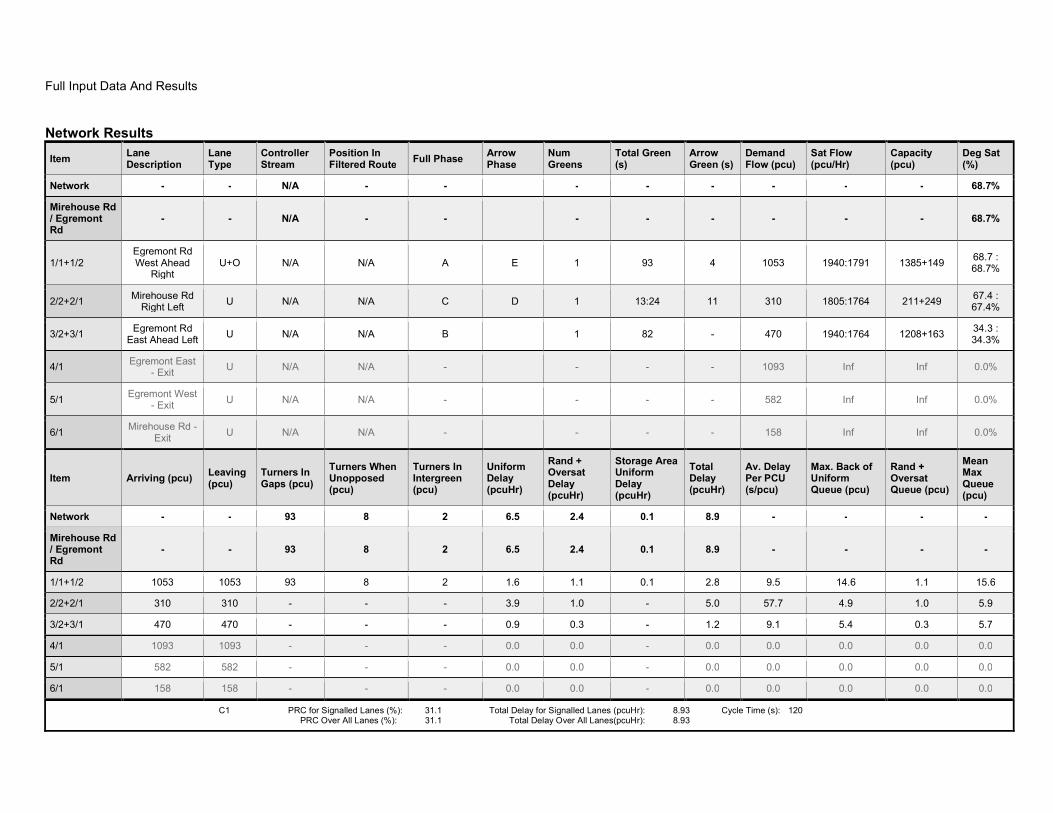
Full Input Data And Results Network Results
Item Lane Description
Lane Type
Controller Stream
Position In Filtered Route
Full Phase Arrow Phase
Num Greens
Total Green (s)
Arrow Green (s)
Demand Flow (pcu)
Sat Flow (pcu/Hr)
Capacity (pcu)
Deg Sat (%)
Network - - N/A - - - - - - - - 68.7%
Mirehouse Rd / Egremont Rd
- - N/A - - - - - - - - 68.7%
1/1+1/2 Egremont Rd West Ahead
Right U+O N/A N/A A E 1 93 4 1053 1940:1791 1385+149
68.7 : 68.7%
2/2+2/1 Mirehouse Rd
Right Left U N/A N/A C D 1 13:24 11 310 1805:1764 211+249
67.4 : 67.4%
3/2+3/1 Egremont Rd
East Ahead Left U N/A N/A B 1 82 - 470 1940:1764 1208+163
34.3 : 34.3%
4/1 Egremont East - Exit
U N/A N/A - - - - 1093 Inf Inf 0.0%
5/1 Egremont West
- Exit U N/A N/A - - - - 582 Inf Inf 0.0%
6/1 Mirehouse Rd -
Exit U N/A N/A - - - - 158 Inf Inf 0.0%
Item Arriving (pcu) Leaving (pcu)
Turners In Gaps (pcu)
Turners When Unopposed (pcu)
Turners In Intergreen (pcu)
Uniform Delay (pcuHr)
Rand + Oversat Delay (pcuHr)
Storage Area Uniform Delay (pcuHr)
Total Delay (pcuHr)
Av. Delay Per PCU (s/pcu)
Max. Back of Uniform Queue (pcu)
Rand + Oversat Queue (pcu)
Mean Max Queue (pcu)
Network - - 93 8 2 6.5 2.4 0.1 8.9 - - - -
Mirehouse Rd / Egremont Rd
- - 93 8 2 6.5 2.4 0.1 8.9 - - - -
1/1+1/2 1053 1053 93 8 2 1.6 1.1 0.1 2.8 9.5 14.6 1.1 15.6
2/2+2/1 310 310 - - - 3.9 1.0 - 5.0 57.7 4.9 1.0 5.9
3/2+3/1 470 470 - - - 0.9 0.3 - 1.2 9.1 5.4 0.3 5.7
4/1 1093 1093 - - - 0.0 0.0 - 0.0 0.0 0.0 0.0 0.0
5/1 582 582 - - - 0.0 0.0 - 0.0 0.0 0.0 0.0 0.0
6/1 158 158 - - - 0.0 0.0 - 0.0 0.0 0.0 0.0 0.0
C1 PRC for Signalled Lanes (%): 31.1 Total Delay for Signalled Lanes (pcuHr): 8.93 Cycle Time (s): 120 PRC Over All Lanes (%): 31.1 Total Delay Over All Lanes(pcuHr): 8.93

Full Input Data And Results
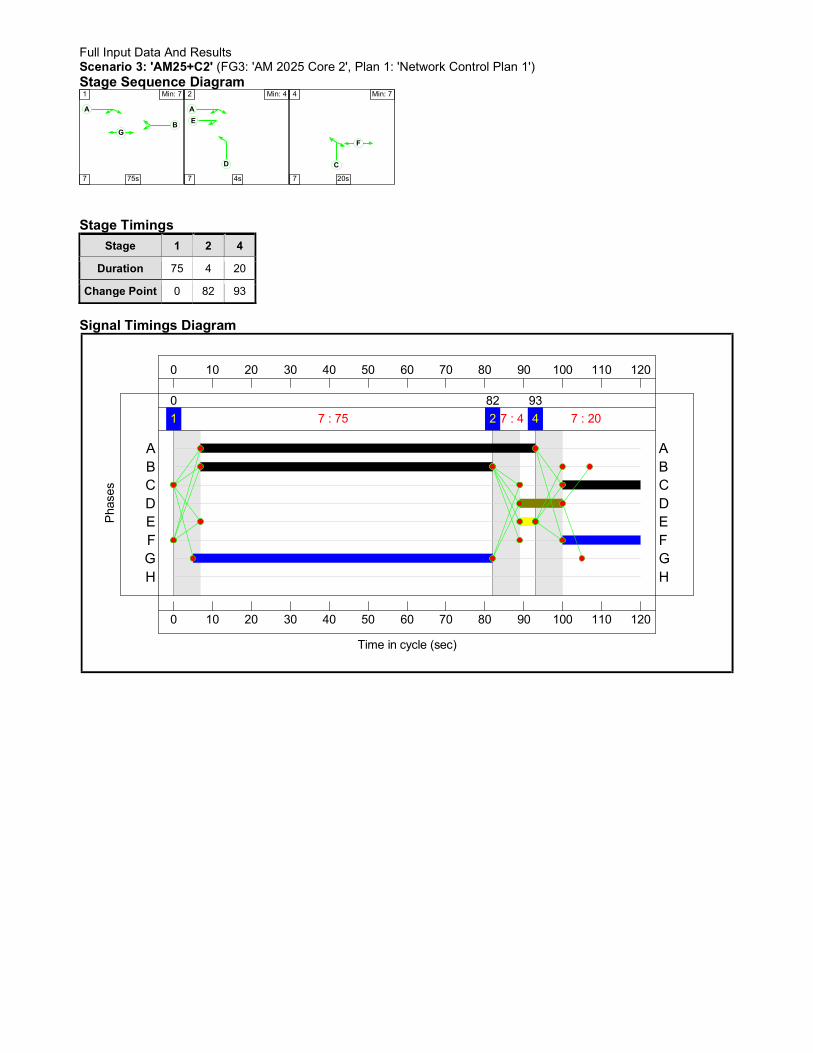
Full Input Data And Results Scenario 3: 'AM25+C2' (FG3: 'AM 2025 Core 2', Plan 1: 'Network Control Plan 1') Stage Sequence Diagram
A
BG
1 Min: 7
7 75s
A
D
E
2 Min: 4
7 4s
C
F
4 Min: 7
7 20s Stage Timings
Stage 1 2 4
Duration 75 4 20
Change Point 0 82 93
Signal Timings Diagram
0
0
10
10
20
20
30
30
40
40
50
50
60
60
70
70
80
80
90
90
100
100
110
110
120
120
Time in cycle (sec)
Pha
ses
1 7 : 75
0
2 7 : 4
82
4 7 : 20
93
H HG GF FE ED DC CB BA A

Full Input Data And Results Network Layout Diagram

Full Input Data And Results
Mirehouse Rd / Egremont RdPRC: 43.6 %Total Traffic Delay: 11.6 pcuHr
Arm 1 - Egremont Rd West1
2
12.3
62.2%
725
62.2%
177
Arm 2 - Mirehouse Rd
12
62.7%
235
7.4
62.7%
198
Arm 3 - Egremont Rd East
12
53.3%
65
11.4
53.3%
604
Arm 4 - Egremont East - Exit1
0.0
0.0%
923
Arm 5 - Egremont West - Exit
1
0.0
0.0%
839
Arm 6 - Mirehouse Rd - E
xit
10.0
0.0%
242
A
B
CRight turn from Egremont Rd West set to give way to all movements from Egremont Rd East.Arm 1 Lane 2 set to run the Indicative arrow Phase E.Drawing indicates LT from Mirehouse Rd is a filter. The filter runs in stage 2 and to be terminated must be followed by the main associated phase (phase C) so must run from Stage 2 > 41>2>4 Stage sequence used when demand for LT filter1>4 Stage sequence used when NO demand for LT filterA>F and F>A Intergreen of 7" added.

Full Input Data And Results Network Results
Item Lane Description
Lane Type
Controller Stream
Position In Filtered Route
Full Phase Arrow Phase
Num Greens
Total Green (s)
Arrow Green (s)
Demand Flow (pcu)
Sat Flow (pcu/Hr)
Capacity (pcu)
Deg Sat (%)
Network - - N/A - - - - - - - - 62.7%
Mirehouse Rd / Egremont Rd
- - N/A - - - - - - - - 62.7%
1/1+1/2 Egremont Rd West Ahead
Right U+O N/A N/A A E 1 86 4 902 1940:1791 1165+284
62.2 : 62.2%
2/2+2/1 Mirehouse Rd
Right Left U N/A N/A C D 1 20:31 11 433 1805:1764 316+375
62.7 : 62.7%
3/2+3/1 Egremont Rd
East Ahead Left U N/A N/A B 1 75 - 669 1940:1764 1133+122
53.3 : 53.3%
4/1 Egremont East - Exit
U N/A N/A - - - - 923 Inf Inf 0.0%
5/1 Egremont West
- Exit U N/A N/A - - - - 839 Inf Inf 0.0%
6/1 Mirehouse Rd -
Exit U N/A N/A - - - - 242 Inf Inf 0.0%
Item Arriving (pcu) Leaving (pcu)
Turners In Gaps (pcu)
Turners When Unopposed (pcu)
Turners In Intergreen (pcu)
Uniform Delay (pcuHr)
Rand + Oversat Delay (pcuHr)
Storage Area Uniform Delay (pcuHr)
Total Delay (pcuHr)
Av. Delay Per PCU (s/pcu)
Max. Back of Uniform Queue (pcu)
Rand + Oversat Queue (pcu)
Mean Max Queue (pcu)
Network - - 161 13 3 8.9 2.2 0.5 11.6 - - - -
Mirehouse Rd / Egremont Rd
- - 161 13 3 8.9 2.2 0.5 11.6 - - - -
1/1+1/2 902 902 161 13 3 1.8 0.8 0.5 3.1 12.2 11.5 0.8 12.3
2/2+2/1 433 433 - - - 5.0 0.8 - 5.8 48.1 6.6 0.8 7.4
3/2+3/1 669 669 - - - 2.1 0.6 - 2.7 14.5 10.9 0.6 11.4
4/1 923 923 - - - 0.0 0.0 - 0.0 0.0 0.0 0.0 0.0
5/1 839 839 - - - 0.0 0.0 - 0.0 0.0 0.0 0.0 0.0
6/1 242 242 - - - 0.0 0.0 - 0.0 0.0 0.0 0.0 0.0
C1 PRC for Signalled Lanes (%): 43.6 Total Delay for Signalled Lanes (pcuHr): 11.55 Cycle Time (s): 120 PRC Over All Lanes (%): 43.6 Total Delay Over All Lanes(pcuHr): 11.55

Full Input Data And Results
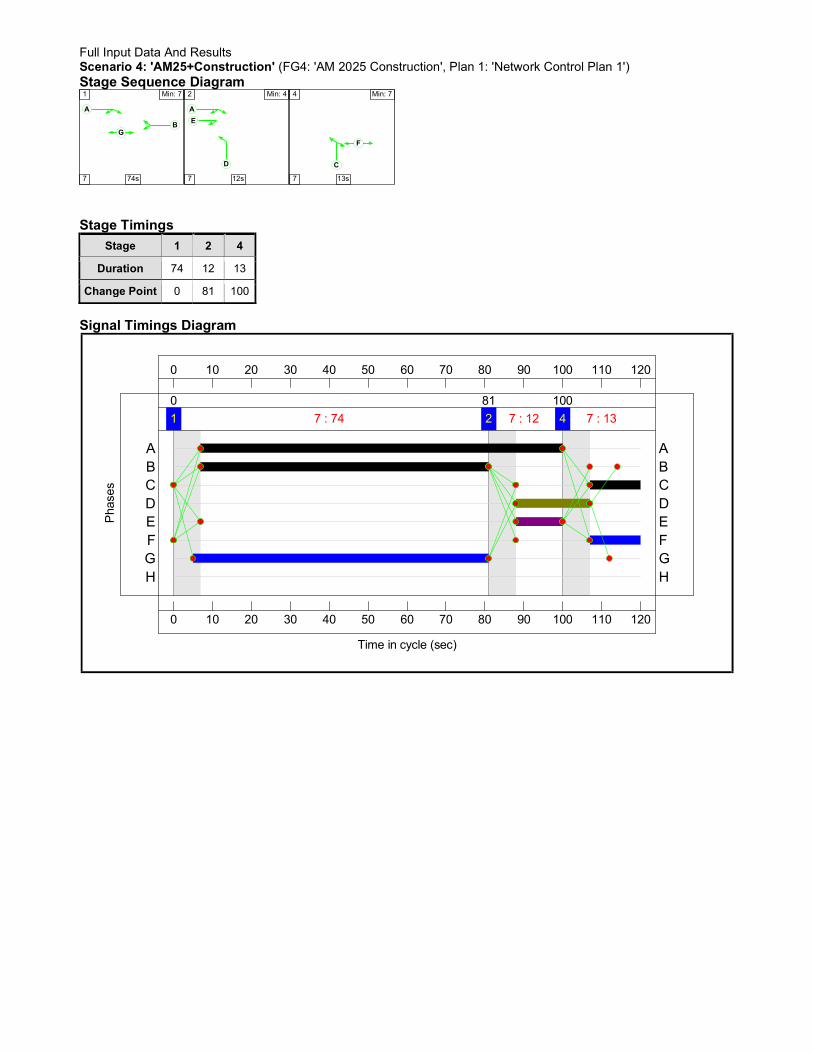
Full Input Data And Results Scenario 4: 'AM25+Construction' (FG4: 'AM 2025 Construction', Plan 1: 'Network Control Plan 1') Stage Sequence Diagram
A
BG
1 Min: 7
7 74s
A
D
E
2 Min: 4
7 12s
C
F
4 Min: 7
7 13s Stage Timings
Stage 1 2 4
Duration 74 12 13
Change Point 0 81 100
Signal Timings Diagram
0
0
10
10
20
20
30
30
40
40
50
50
60
60
70
70
80
80
90
90
100
100
110
110
120
120
Time in cycle (sec)
Pha
ses
1 7 : 74
0
2 7 : 12
81
4 7 : 13
100
H HG GF FE ED DC CB BA A

Full Input Data And Results Network Layout Diagram

Full Input Data And Results
Mirehouse Rd / Egremont RdPRC: 29.7 %Total Traffic Delay: 9.4 pcuHr
Arm 1 - Egremont Rd West1
2
16.1
69.4%
948
69.4%
119
Arm 2 - Mirehouse Rd
12
67.9%
172
5.6
67.9%
143
Arm 3 - Egremont Rd East
12
40.5%
96
6.9
40.5%
414
Arm 4 - Egremont East - Exit1
0.0
0.0%
1091
Arm 5 - Egremont West - Exit
1
0.0
0.0%
586
Arm 6 - Mirehouse Rd - E
xit
10.0
0.0%
215
A
B
CRight turn from Egremont Rd West set to give way to all movements from Egremont Rd East.Arm 1 Lane 2 set to run the Indicative arrow Phase E.Drawing indicates LT from Mirehouse Rd is a filter. The filter runs in stage 2 and to be terminated must be followed by the main associated phase (phase C) so must run from Stage 2 > 41>2>4 Stage sequence used when demand for LT filter1>4 Stage sequence used when NO demand for LT filterA>F and F>A Intergreen of 7" added.
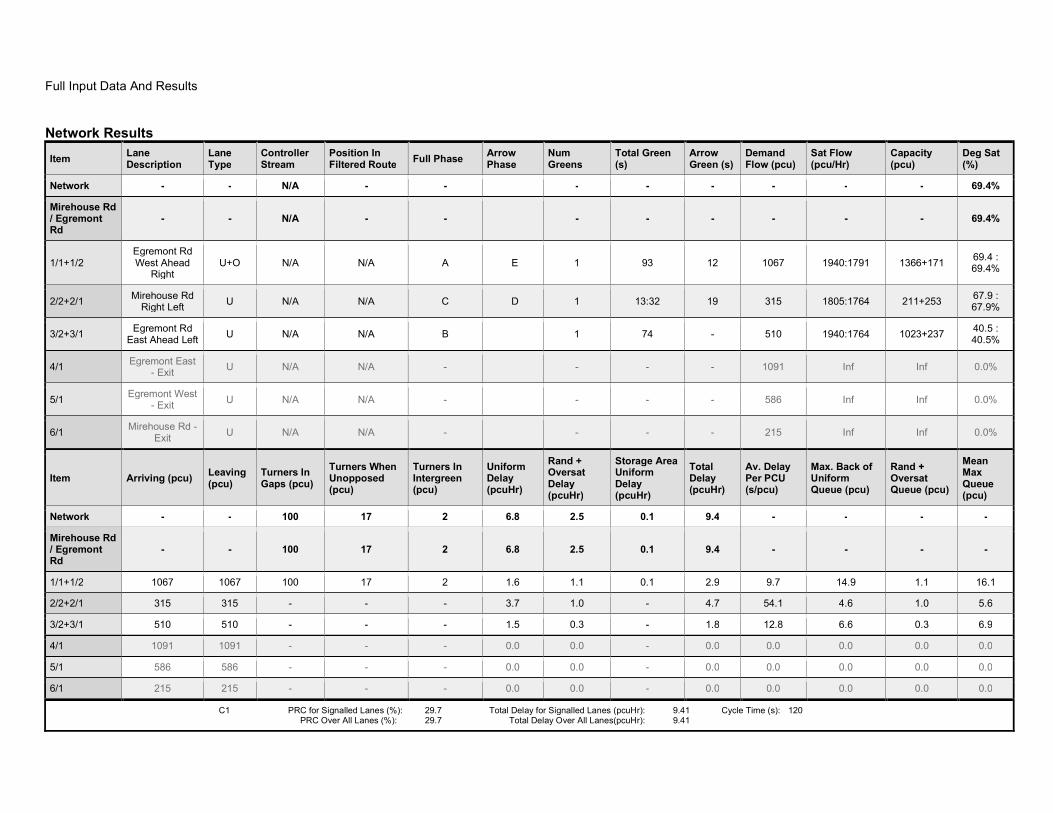
Full Input Data And Results Network Results
Item Lane Description
Lane Type
Controller Stream
Position In Filtered Route
Full Phase Arrow Phase
Num Greens
Total Green (s)
Arrow Green (s)
Demand Flow (pcu)
Sat Flow (pcu/Hr)
Capacity (pcu)
Deg Sat (%)
Network - - N/A - - - - - - - - 69.4%
Mirehouse Rd / Egremont Rd
- - N/A - - - - - - - - 69.4%
1/1+1/2 Egremont Rd West Ahead
Right U+O N/A N/A A E 1 93 12 1067 1940:1791 1366+171
69.4 : 69.4%
2/2+2/1 Mirehouse Rd
Right Left U N/A N/A C D 1 13:32 19 315 1805:1764 211+253
67.9 : 67.9%
3/2+3/1 Egremont Rd
East Ahead Left U N/A N/A B 1 74 - 510 1940:1764 1023+237
40.5 : 40.5%
4/1 Egremont East - Exit
U N/A N/A - - - - 1091 Inf Inf 0.0%
5/1 Egremont West
- Exit U N/A N/A - - - - 586 Inf Inf 0.0%
6/1 Mirehouse Rd -
Exit U N/A N/A - - - - 215 Inf Inf 0.0%
Item Arriving (pcu) Leaving (pcu)
Turners In Gaps (pcu)
Turners When Unopposed (pcu)
Turners In Intergreen (pcu)
Uniform Delay (pcuHr)
Rand + Oversat Delay (pcuHr)
Storage Area Uniform Delay (pcuHr)
Total Delay (pcuHr)
Av. Delay Per PCU (s/pcu)
Max. Back of Uniform Queue (pcu)
Rand + Oversat Queue (pcu)
Mean Max Queue (pcu)
Network - - 100 17 2 6.8 2.5 0.1 9.4 - - - -
Mirehouse Rd / Egremont Rd
- - 100 17 2 6.8 2.5 0.1 9.4 - - - -
1/1+1/2 1067 1067 100 17 2 1.6 1.1 0.1 2.9 9.7 14.9 1.1 16.1
2/2+2/1 315 315 - - - 3.7 1.0 - 4.7 54.1 4.6 1.0 5.6
3/2+3/1 510 510 - - - 1.5 0.3 - 1.8 12.8 6.6 0.3 6.9
4/1 1091 1091 - - - 0.0 0.0 - 0.0 0.0 0.0 0.0 0.0
5/1 586 586 - - - 0.0 0.0 - 0.0 0.0 0.0 0.0 0.0
6/1 215 215 - - - 0.0 0.0 - 0.0 0.0 0.0 0.0 0.0
C1 PRC for Signalled Lanes (%): 29.7 Total Delay for Signalled Lanes (pcuHr): 9.41 Cycle Time (s): 120 PRC Over All Lanes (%): 29.7 Total Delay Over All Lanes(pcuHr): 9.41

Full Input Data And Results

Full Input Data And Results Scenario 5: 'AM25+Operation' (FG5: 'AM 2025 Operation', Plan 1: 'Network Control Plan 1') Stage Sequence Diagram
A
BG
1 Min: 7
7 74s
A
D
E
2 Min: 4
7 4s
C
F
4 Min: 7
7 21s Stage Timings
Stage 1 2 4
Duration 74 4 21
Change Point 0 81 92
Signal Timings Diagram
0
0
10
10
20
20
30
30
40
40
50
50
60
60
70
70
80
80
90
90
100
100
110
110
120
120
Time in cycle (sec)
Pha
ses
1 7 : 74
0
2 7 : 4
81
4 7 : 21
92
H HG GF FE ED DC CB BA A

Full Input Data And Results Network Layout Diagram

Full Input Data And Results
Mirehouse Rd / Egremont RdPRC: 46.9 %Total Traffic Delay: 11.7 pcuHr
Arm 1 - Egremont Rd West1
2
11.7
61.3%
694
61.3%
188
Arm 2 - Mirehouse Rd
12
61.1%
238
7.4
61.1%
198
Arm 3 - Egremont Rd East
12
55.1%
83
11.9
55.1%
603
Arm 4 - Egremont East - Exit1
0.0
0.0%
892
Arm 5 - Egremont West - Exit
1
0.0
0.0%
841
Arm 6 - Mirehouse Rd - E
xit
10.0
0.0%
271
A
B
CRight turn from Egremont Rd West set to give way to all movements from Egremont Rd East.Arm 1 Lane 2 set to run the Indicative arrow Phase E.Drawing indicates LT from Mirehouse Rd is a filter. The filter runs in stage 2 and to be terminated must be followed by the main associated phase (phase C) so must run from Stage 2 > 41>2>4 Stage sequence used when demand for LT filter1>4 Stage sequence used when NO demand for LT filterA>F and F>A Intergreen of 7" added.

Full Input Data And Results Network Results
Item Lane Description
Lane Type
Controller Stream
Position In Filtered Route
Full Phase Arrow Phase
Num Greens
Total Green (s)
Arrow Green (s)
Demand Flow (pcu)
Sat Flow (pcu/Hr)
Capacity (pcu)
Deg Sat (%)
Network - - N/A - - - - - - - - 61.3%
Mirehouse Rd / Egremont Rd
- - N/A - - - - - - - - 61.3%
1/1+1/2 Egremont Rd West Ahead
Right U+O N/A N/A A E 1 85 4 882 1940:1791 1132+307
61.3 : 61.3%
2/2+2/1 Mirehouse Rd
Right Left U N/A N/A C D 1 21:32 11 436 1805:1764 324+389
61.1 : 61.1%
3/2+3/1 Egremont Rd
East Ahead Left U N/A N/A B 1 74 - 686 1940:1764 1094+151
55.1 : 55.1%
4/1 Egremont East - Exit
U N/A N/A - - - - 892 Inf Inf 0.0%
5/1 Egremont West
- Exit U N/A N/A - - - - 841 Inf Inf 0.0%
6/1 Mirehouse Rd -
Exit U N/A N/A - - - - 271 Inf Inf 0.0%
Item Arriving (pcu) Leaving (pcu)
Turners In Gaps (pcu)
Turners When Unopposed (pcu)
Turners In Intergreen (pcu)
Uniform Delay (pcuHr)
Rand + Oversat Delay (pcuHr)
Storage Area Uniform Delay (pcuHr)
Total Delay (pcuHr)
Av. Delay Per PCU (s/pcu)
Max. Back of Uniform Queue (pcu)
Rand + Oversat Queue (pcu)
Mean Max Queue (pcu)
Network - - 171 14 3 9.0 2.2 0.5 11.7 - - - -
Mirehouse Rd / Egremont Rd
- - 171 14 3 9.0 2.2 0.5 11.7 - - - -
1/1+1/2 882 882 171 14 3 1.8 0.8 0.5 3.2 12.9 11.0 0.8 11.7
2/2+2/1 436 436 - - - 4.9 0.8 - 5.7 46.8 6.6 0.8 7.4
3/2+3/1 686 686 - - - 2.3 0.6 - 2.9 15.2 11.3 0.6 11.9
4/1 892 892 - - - 0.0 0.0 - 0.0 0.0 0.0 0.0 0.0
5/1 841 841 - - - 0.0 0.0 - 0.0 0.0 0.0 0.0 0.0
6/1 271 271 - - - 0.0 0.0 - 0.0 0.0 0.0 0.0 0.0
C1 PRC for Signalled Lanes (%): 46.9 Total Delay for Signalled Lanes (pcuHr): 11.71 Cycle Time (s): 120 PRC Over All Lanes (%): 46.9 Total Delay Over All Lanes(pcuHr): 11.71

Full Input Data And Results
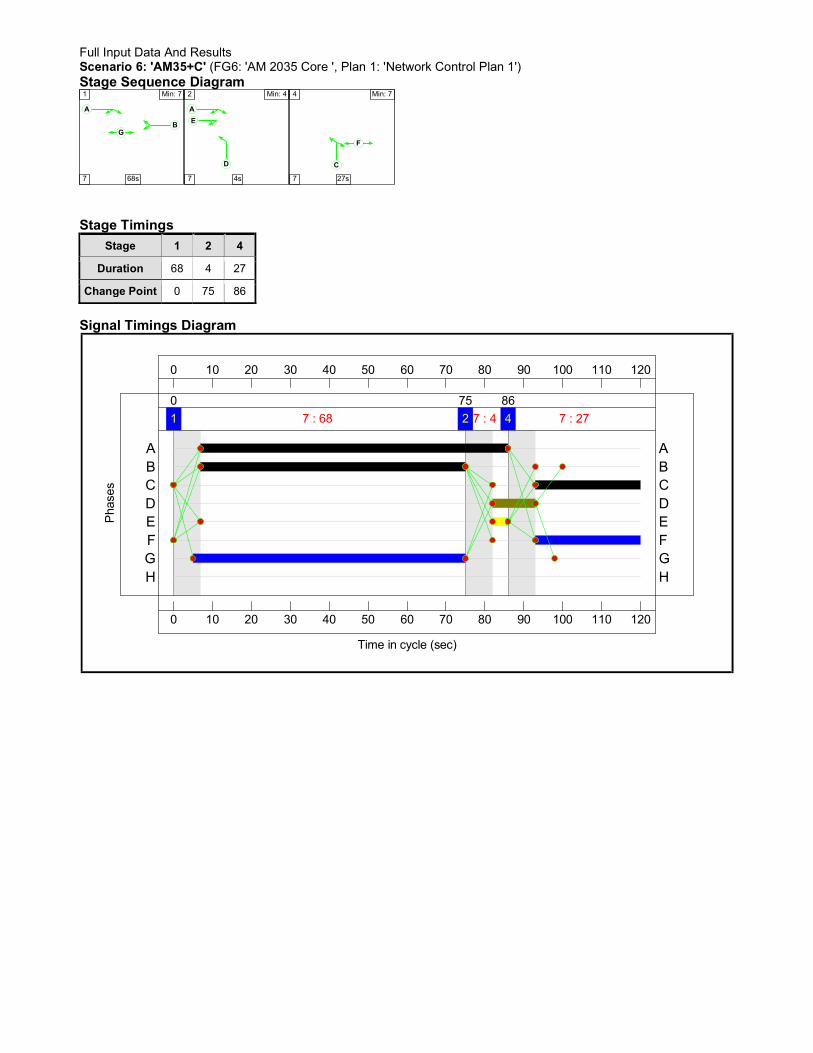
Full Input Data And Results Scenario 6: 'AM35+C' (FG6: 'AM 2035 Core ', Plan 1: 'Network Control Plan 1') Stage Sequence Diagram
A
BG
1 Min: 7
7 68s
A
D
E
2 Min: 4
7 4s
C
F
4 Min: 7
7 27s Stage Timings
Stage 1 2 4
Duration 68 4 27
Change Point 0 75 86
Signal Timings Diagram
0
0
10
10
20
20
30
30
40
40
50
50
60
60
70
70
80
80
90
90
100
100
110
110
120
120
Time in cycle (sec)
Pha
ses
1 7 : 68
0
2 7 : 4
75
4 7 : 27
86
H HG GF FE ED DC CB BA A

Full Input Data And Results Network Layout Diagram

Full Input Data And Results
Mirehouse Rd / Egremont RdPRC: 20.0 %Total Traffic Delay: 16.4 pcuHr
Arm 1 - Egremont Rd West1
2
19.7
75.0%
790
75.0%
219
Arm 2 - Mirehouse Rd
12
73.8%
293
9.5
73.8%
271
Arm 3 - Egremont Rd East
12
59.4%
104
13.4
59.4%
582
Arm 4 - Egremont East - Exit1
0.0
0.0%
1061
Arm 5 - Egremont West - Exit
1
0.0
0.0%
875
Arm 6 - Mirehouse Rd - E
xit
10.0
0.0%
323
A
B
CRight turn from Egremont Rd West set to give way to all movements from Egremont Rd East.Arm 1 Lane 2 set to run the Indicative arrow Phase E.Drawing indicates LT from Mirehouse Rd is a filter. The filter runs in stage 2 and to be terminated must be followed by the main associated phase (phase C) so must run from Stage 2 > 41>2>4 Stage sequence used when demand for LT filter1>4 Stage sequence used when NO demand for LT filterA>F and F>A Intergreen of 7" added.

Full Input Data And Results Network Results
Item Lane Description
Lane Type
Controller Stream
Position In Filtered Route
Full Phase Arrow Phase
Num Greens
Total Green (s)
Arrow Green (s)
Demand Flow (pcu)
Sat Flow (pcu/Hr)
Capacity (pcu)
Deg Sat (%)
Network - - N/A - - - - - - - - 75.0%
Mirehouse Rd / Egremont Rd
- - N/A - - - - - - - - 75.0%
1/1+1/2 Egremont Rd West Ahead
Right U+O N/A N/A A E 1 79 4 1009 1940:1791 1053+292
75.0 : 75.0%
2/2+2/1 Mirehouse Rd
Right Left U N/A N/A C D 1 27:38 11 564 1805:1764 367+397
73.8 : 73.8%
3/2+3/1 Egremont Rd
East Ahead Left U N/A N/A B 1 68 - 686 1940:1764 980+175
59.4 : 59.4%
4/1 Egremont East - Exit
U N/A N/A - - - - 1061 Inf Inf 0.0%
5/1 Egremont West
- Exit U N/A N/A - - - - 875 Inf Inf 0.0%
6/1 Mirehouse Rd -
Exit U N/A N/A - - - - 323 Inf Inf 0.0%
Item Arriving (pcu) Leaving (pcu)
Turners In Gaps (pcu)
Turners When Unopposed (pcu)
Turners In Intergreen (pcu)
Uniform Delay (pcuHr)
Rand + Oversat Delay (pcuHr)
Storage Area Uniform Delay (pcuHr)
Total Delay (pcuHr)
Av. Delay Per PCU (s/pcu)
Max. Back of Uniform Queue (pcu)
Rand + Oversat Queue (pcu)
Mean Max Queue (pcu)
Network - - 199 16 4 12.1 3.6 0.7 16.4 - - - -
Mirehouse Rd / Egremont Rd
- - 199 16 4 12.1 3.6 0.7 16.4 - - - -
1/1+1/2 1009 1009 199 16 4 3.4 1.5 0.7 5.6 19.8 18.2 1.5 19.7
2/2+2/1 564 564 - - - 5.8 1.4 - 7.2 45.8 8.1 1.4 9.5
3/2+3/1 686 686 - - - 2.9 0.7 - 3.6 19.0 12.7 0.7 13.4
4/1 1061 1061 - - - 0.0 0.0 - 0.0 0.0 0.0 0.0 0.0
5/1 875 875 - - - 0.0 0.0 - 0.0 0.0 0.0 0.0 0.0
6/1 323 323 - - - 0.0 0.0 - 0.0 0.0 0.0 0.0 0.0
C1 PRC for Signalled Lanes (%): 20.0 Total Delay for Signalled Lanes (pcuHr): 16.36 Cycle Time (s): 120 PRC Over All Lanes (%): 20.0 Total Delay Over All Lanes(pcuHr): 16.36

Full Input Data And Results

Full Input Data And Results Scenario 7: 'AM35+Operation' (FG7: 'AM 2035 Operation', Plan 1: 'Network Control Plan 1') Stage Sequence Diagram
A
BG
1 Min: 7
7 71s
A
D
E
2 Min: 4
7 4s
C
F
4 Min: 7
7 24s Stage Timings
Stage 1 2 4
Duration 71 4 24
Change Point 0 78 89
Signal Timings Diagram
0
0
10
10
20
20
30
30
40
40
50
50
60
60
70
70
80
80
90
90
100
100
110
110
120
120
Time in cycle (sec)
Pha
ses
1 7 : 71
0
2 7 : 4
78
4 7 : 24
89
H HG GF FE ED DC CB BA A

Full Input Data And Results Network Layout Diagram

Full Input Data And Results
Mirehouse Rd / Egremont RdPRC: 16.5 %Total Traffic Delay: 17.1 pcuHr
Arm 1 - Egremont Rd West1
2
19.6
76.5%
792
76.5%
288
Arm 2 - Mirehouse Rd
12
77.2%
294
9.9
77.2%
267
Arm 3 - Egremont Rd East
12
59.0%
138
12.6
59.0%
578
Arm 4 - Egremont East - Exit1
0.0
0.0%
1059
Arm 5 - Egremont West - Exit
1
0.0
0.0%
872
Arm 6 - Mirehouse Rd - E
xit
10.0
0.0%
426
A
B
CRight turn from Egremont Rd West set to give way to all movements from Egremont Rd East.Arm 1 Lane 2 set to run the Indicative arrow Phase E.Drawing indicates LT from Mirehouse Rd is a filter. The filter runs in stage 2 and to be terminated must be followed by the main associated phase (phase C) so must run from Stage 2 > 41>2>4 Stage sequence used when demand for LT filter1>4 Stage sequence used when NO demand for LT filterA>F and F>A Intergreen of 7" added.

Full Input Data And Results Network Results
Item Lane Description
Lane Type
Controller Stream
Position In Filtered Route
Full Phase Arrow Phase
Num Greens
Total Green (s)
Arrow Green (s)
Demand Flow (pcu)
Sat Flow (pcu/Hr)
Capacity (pcu)
Deg Sat (%)
Network - - N/A - - - - - - - - 77.2%
Mirehouse Rd / Egremont Rd
- - N/A - - - - - - - - 77.2%
1/1+1/2 Egremont Rd West Ahead
Right U+O N/A N/A A E 1 82 4 1080 1940:1791 1035+377
76.5 : 76.5%
2/2+2/1 Mirehouse Rd
Right Left U N/A N/A C D 1 24:35 11 561 1805:1764 346+381
77.2 : 77.2%
3/2+3/1 Egremont Rd
East Ahead Left U N/A N/A B 1 71 - 716 1940:1764 980+234
59.0 : 59.0%
4/1 Egremont East - Exit
U N/A N/A - - - - 1059 Inf Inf 0.0%
5/1 Egremont West
- Exit U N/A N/A - - - - 872 Inf Inf 0.0%
6/1 Mirehouse Rd -
Exit U N/A N/A - - - - 426 Inf Inf 0.0%
Item Arriving (pcu) Leaving (pcu)
Turners In Gaps (pcu)
Turners When Unopposed (pcu)
Turners In Intergreen (pcu)
Uniform Delay (pcuHr)
Rand + Oversat Delay (pcuHr)
Storage Area Uniform Delay (pcuHr)
Total Delay (pcuHr)
Av. Delay Per PCU (s/pcu)
Max. Back of Uniform Queue (pcu)
Rand + Oversat Queue (pcu)
Mean Max Queue (pcu)
Network - - 262 22 5 12.3 4.0 0.9 17.1 - - - -
Mirehouse Rd / Egremont Rd
- - 262 22 5 12.3 4.0 0.9 17.1 - - - -
1/1+1/2 1080 1080 262 22 5 3.5 1.6 0.9 5.9 19.7 18.0 1.6 19.6
2/2+2/1 561 561 - - - 6.2 1.7 - 7.8 50.2 8.2 1.7 9.9
3/2+3/1 716 716 - - - 2.6 0.7 - 3.4 16.9 11.9 0.7 12.6
4/1 1059 1059 - - - 0.0 0.0 - 0.0 0.0 0.0 0.0 0.0
5/1 872 872 - - - 0.0 0.0 - 0.0 0.0 0.0 0.0 0.0
6/1 426 426 - - - 0.0 0.0 - 0.0 0.0 0.0 0.0 0.0
C1 PRC for Signalled Lanes (%): 16.5 Total Delay for Signalled Lanes (pcuHr): 17.11 Cycle Time (s): 120 PRC Over All Lanes (%): 16.5 Total Delay Over All Lanes(pcuHr): 17.11

Full Input Data And Results
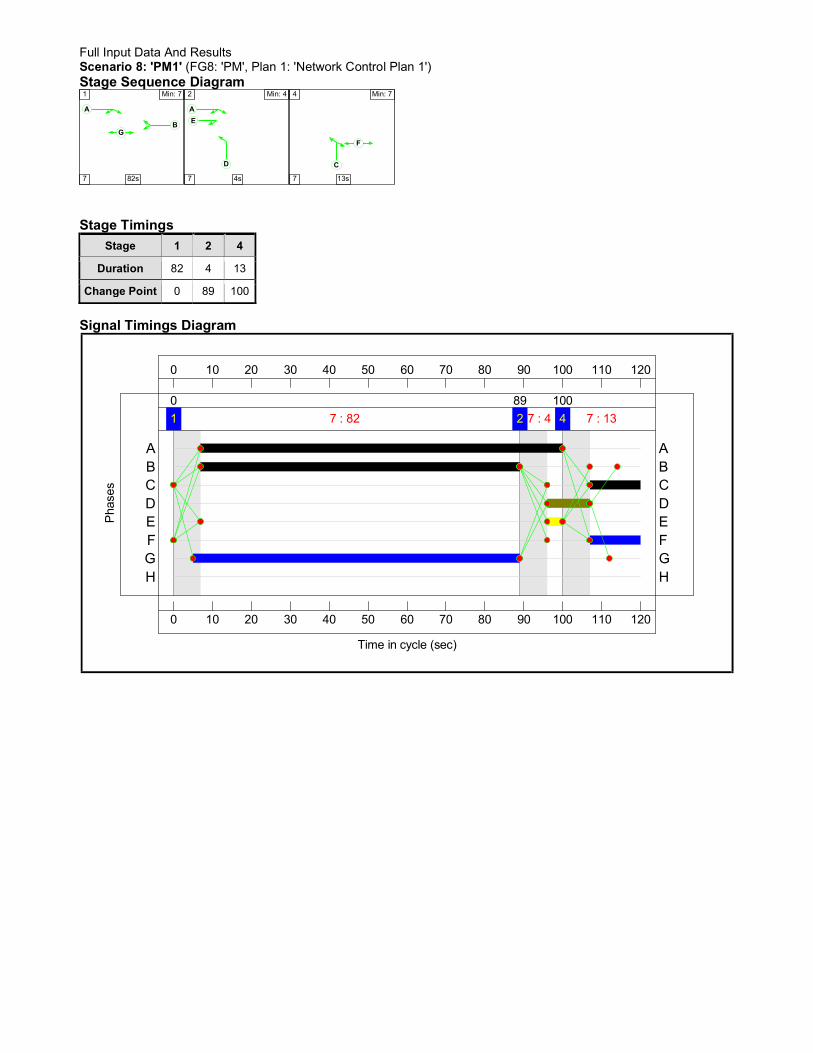
Full Input Data And Results Scenario 8: 'PM1' (FG8: 'PM', Plan 1: 'Network Control Plan 1') Stage Sequence Diagram
A
BG
1 Min: 7
7 82s
A
D
E
2 Min: 4
7 4s
C
F
4 Min: 7
7 13s Stage Timings
Stage 1 2 4
Duration 82 4 13
Change Point 0 89 100
Signal Timings Diagram
0
0
10
10
20
20
30
30
40
40
50
50
60
60
70
70
80
80
90
90
100
100
110
110
120
120
Time in cycle (sec)
Pha
ses
1 7 : 82
0
2 7 : 4
89
4 7 : 13
100
H HG GF FE ED DC CB BA A

Full Input Data And Results Network Layout Diagram

Full Input Data And Results
Mirehouse Rd / Egremont RdPRC: 19.9 %Total Traffic Delay: 11.5 pcuHr
Arm 1 - Egremont Rd West1
2
8.2
54.6%
686
54.6%
165
Arm 2 - Mirehouse Rd
12
71.2%
66
6.0
71.2%
150
Arm 3 - Egremont Rd East
12
75.1%
139
21.2
75.1%
893
Arm 4 - Egremont East - Exit1
0.0
0.0%
836
Arm 5 - Egremont West - Exit
1
0.0
0.0%
959
Arm 6 - Mirehouse Rd - E
xit
10.0
0.0%
304
A
B
CRight turn from Egremont Rd West set to give way to all movements from Egremont Rd East.Arm 1 Lane 2 set to run the Indicative arrow Phase E.Drawing indicates LT from Mirehouse Rd is a filter. The filter runs in stage 2 and to be terminated must be followed by the main associated phase (phase C) so must run from Stage 2 > 41>2>4 Stage sequence used when demand for LT filter1>4 Stage sequence used when NO demand for LT filterA>F and F>A Intergreen of 7" added.

Full Input Data And Results Network Results
Item Lane Description
Lane Type
Controller Stream
Position In Filtered Route
Full Phase Arrow Phase
Num Greens
Total Green (s)
Arrow Green (s)
Demand Flow (pcu)
Sat Flow (pcu/Hr)
Capacity (pcu)
Deg Sat (%)
Network - - N/A - - - - - - - - 75.1%
Mirehouse Rd / Egremont Rd
- - N/A - - - - - - - - 75.1%
1/1+1/2 Egremont Rd West Ahead
Right U+O N/A N/A A E 1 93 4 851 1940:1791 1258+302
54.6 : 54.6%
2/2+2/1 Mirehouse Rd
Right Left U N/A N/A C D 1 13:24 11 216 1805:1764 211+93
71.2 : 71.2%
3/2+3/1 Egremont Rd
East Ahead Left U N/A N/A B 1 82 - 1032 1940:1764 1190+185
75.1 : 75.1%
4/1 Egremont East - Exit
U N/A N/A - - - - 836 Inf Inf 0.0%
5/1 Egremont West
- Exit U N/A N/A - - - - 959 Inf Inf 0.0%
6/1 Mirehouse Rd -
Exit U N/A N/A - - - - 304 Inf Inf 0.0%
Item Arriving (pcu) Leaving (pcu)
Turners In Gaps (pcu)
Turners When Unopposed (pcu)
Turners In Intergreen (pcu)
Uniform Delay (pcuHr)
Rand + Oversat Delay (pcuHr)
Storage Area Uniform Delay (pcuHr)
Total Delay (pcuHr)
Av. Delay Per PCU (s/pcu)
Max. Back of Uniform Queue (pcu)
Rand + Oversat Queue (pcu)
Mean Max Queue (pcu)
Network - - 120 42 3 7.1 3.3 1.2 11.5 - - - -
Mirehouse Rd / Egremont Rd
- - 120 42 3 7.1 3.3 1.2 11.5 - - - -
1/1+1/2 851 851 120 42 3 1.2 0.6 1.2 2.9 12.5 7.6 0.6 8.2
2/2+2/1 216 216 - - - 2.8 1.2 - 4.0 67.5 4.8 1.2 6.0
3/2+3/1 1032 1032 - - - 3.1 1.5 - 4.6 15.9 19.7 1.5 21.2
4/1 836 836 - - - 0.0 0.0 - 0.0 0.0 0.0 0.0 0.0
5/1 959 959 - - - 0.0 0.0 - 0.0 0.0 0.0 0.0 0.0
6/1 304 304 - - - 0.0 0.0 - 0.0 0.0 0.0 0.0 0.0
C1 PRC for Signalled Lanes (%): 19.9 Total Delay for Signalled Lanes (pcuHr): 11.55 Cycle Time (s): 120 PRC Over All Lanes (%): 19.9 Total Delay Over All Lanes(pcuHr): 11.55

Full Input Data And Results
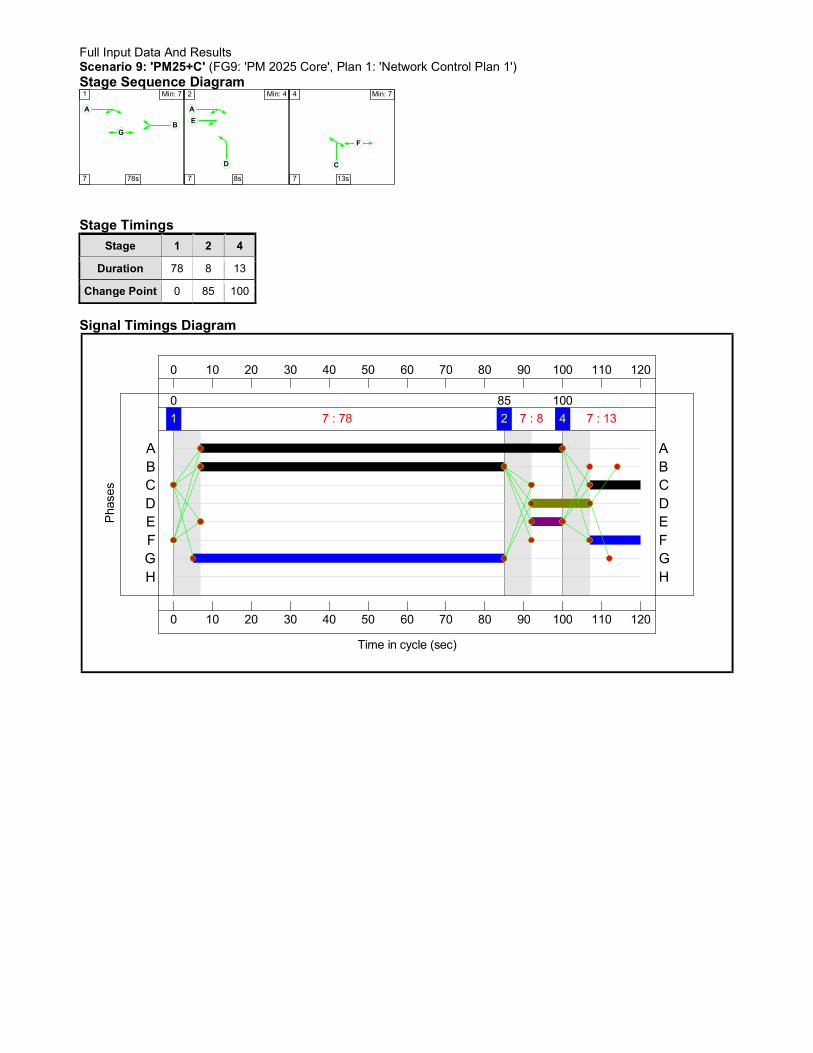
Full Input Data And Results Scenario 9: 'PM25+C' (FG9: 'PM 2025 Core', Plan 1: 'Network Control Plan 1') Stage Sequence Diagram
A
BG
1 Min: 7
7 78s
A
D
E
2 Min: 4
7 8s
C
F
4 Min: 7
7 13s Stage Timings
Stage 1 2 4
Duration 78 8 13
Change Point 0 85 100
Signal Timings Diagram
0
0
10
10
20
20
30
30
40
40
50
50
60
60
70
70
80
80
90
90
100
100
110
110
120
120
Time in cycle (sec)
Pha
ses
1 7 : 78
0
2 7 : 8
85
4 7 : 13
100
H HG GF FE ED DC CB BA A

Full Input Data And Results Network Layout Diagram

Full Input Data And Results
Mirehouse Rd / Egremont RdPRC: 5.9 %Total Traffic Delay: 19.6 pcuHr
Arm 1 - Egremont Rd West1
2
10.7
83.2%
598
83.2%
259
Arm 2 - Mirehouse Rd
12
85.0%
101
8.4
85.0%
179
Arm 3 - Egremont Rd East
12
84.3%
202
28.1
84.3%
912
Arm 4 - Egremont East - Exit1
0.0
0.0%
777
Arm 5 - Egremont West - Exit
1
0.0
0.0%
1013
Arm 6 - Mirehouse Rd - E
xit
10.0
0.0%
461
A
B
CRight turn from Egremont Rd West set to give way to all movements from Egremont Rd East.Arm 1 Lane 2 set to run the Indicative arrow Phase E.Drawing indicates LT from Mirehouse Rd is a filter. The filter runs in stage 2 and to be terminated must be followed by the main associated phase (phase C) so must run from Stage 2 > 41>2>4 Stage sequence used when demand for LT filter1>4 Stage sequence used when NO demand for LT filterA>F and F>A Intergreen of 7" added.
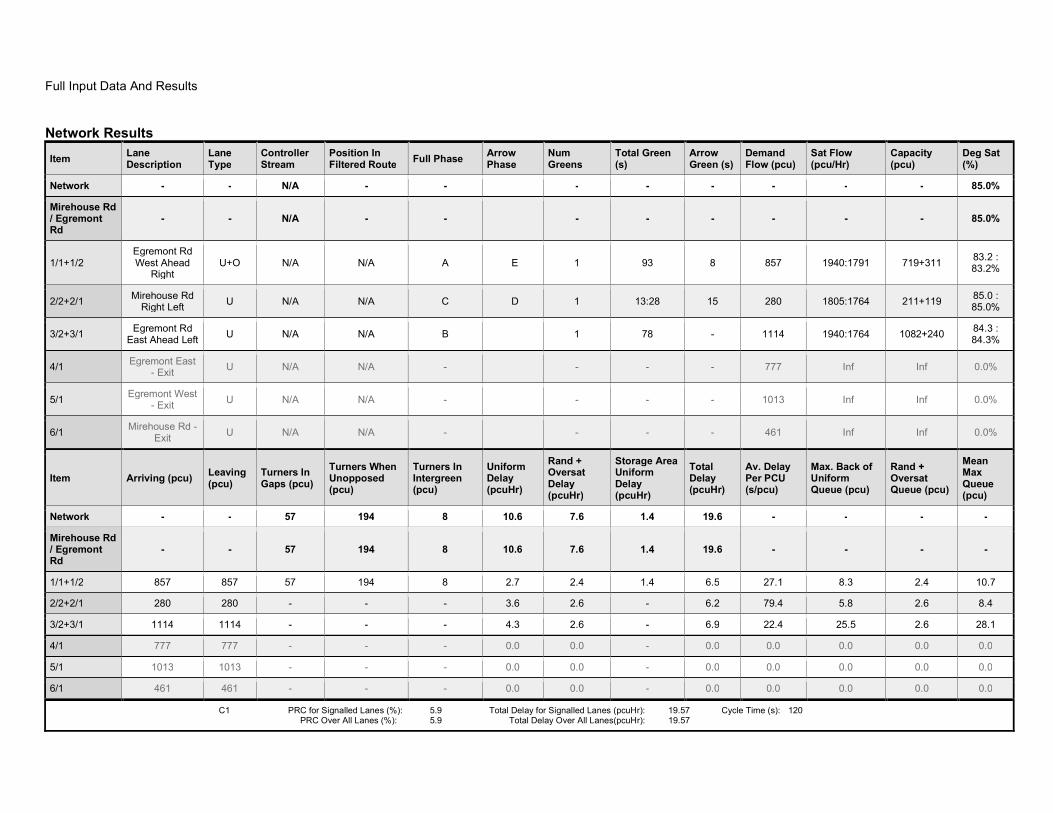
Full Input Data And Results Network Results
Item Lane Description
Lane Type
Controller Stream
Position In Filtered Route
Full Phase Arrow Phase
Num Greens
Total Green (s)
Arrow Green (s)
Demand Flow (pcu)
Sat Flow (pcu/Hr)
Capacity (pcu)
Deg Sat (%)
Network - - N/A - - - - - - - - 85.0%
Mirehouse Rd / Egremont Rd
- - N/A - - - - - - - - 85.0%
1/1+1/2 Egremont Rd West Ahead
Right U+O N/A N/A A E 1 93 8 857 1940:1791 719+311
83.2 : 83.2%
2/2+2/1 Mirehouse Rd
Right Left U N/A N/A C D 1 13:28 15 280 1805:1764 211+119
85.0 : 85.0%
3/2+3/1 Egremont Rd
East Ahead Left U N/A N/A B 1 78 - 1114 1940:1764 1082+240
84.3 : 84.3%
4/1 Egremont East - Exit
U N/A N/A - - - - 777 Inf Inf 0.0%
5/1 Egremont West
- Exit U N/A N/A - - - - 1013 Inf Inf 0.0%
6/1 Mirehouse Rd -
Exit U N/A N/A - - - - 461 Inf Inf 0.0%
Item Arriving (pcu) Leaving (pcu)
Turners In Gaps (pcu)
Turners When Unopposed (pcu)
Turners In Intergreen (pcu)
Uniform Delay (pcuHr)
Rand + Oversat Delay (pcuHr)
Storage Area Uniform Delay (pcuHr)
Total Delay (pcuHr)
Av. Delay Per PCU (s/pcu)
Max. Back of Uniform Queue (pcu)
Rand + Oversat Queue (pcu)
Mean Max Queue (pcu)
Network - - 57 194 8 10.6 7.6 1.4 19.6 - - - -
Mirehouse Rd / Egremont Rd
- - 57 194 8 10.6 7.6 1.4 19.6 - - - -
1/1+1/2 857 857 57 194 8 2.7 2.4 1.4 6.5 27.1 8.3 2.4 10.7
2/2+2/1 280 280 - - - 3.6 2.6 - 6.2 79.4 5.8 2.6 8.4
3/2+3/1 1114 1114 - - - 4.3 2.6 - 6.9 22.4 25.5 2.6 28.1
4/1 777 777 - - - 0.0 0.0 - 0.0 0.0 0.0 0.0 0.0
5/1 1013 1013 - - - 0.0 0.0 - 0.0 0.0 0.0 0.0 0.0
6/1 461 461 - - - 0.0 0.0 - 0.0 0.0 0.0 0.0 0.0
C1 PRC for Signalled Lanes (%): 5.9 Total Delay for Signalled Lanes (pcuHr): 19.57 Cycle Time (s): 120 PRC Over All Lanes (%): 5.9 Total Delay Over All Lanes(pcuHr): 19.57

Full Input Data And Results

Full Input Data And Results Scenario 10: 'PM25+Construction' (FG10: 'PM 2025 Construction', Plan 1: 'Network Control Plan 1') Stage Sequence Diagram
A
BG
1 Min: 7
7 74s
A
D
E
2 Min: 4
7 8s
C
F
4 Min: 7
7 17s Stage Timings
Stage 1 2 4
Duration 74 8 17
Change Point 0 81 96
Signal Timings Diagram
0
0
10
10
20
20
30
30
40
40
50
50
60
60
70
70
80
80
90
90
100
100
110
110
120
120
Time in cycle (sec)
Pha
ses
1 7 : 74
0
2 7 : 8
81
4 7 : 17
96
H HG GF FE ED DC CB BA A

Full Input Data And Results Network Layout Diagram
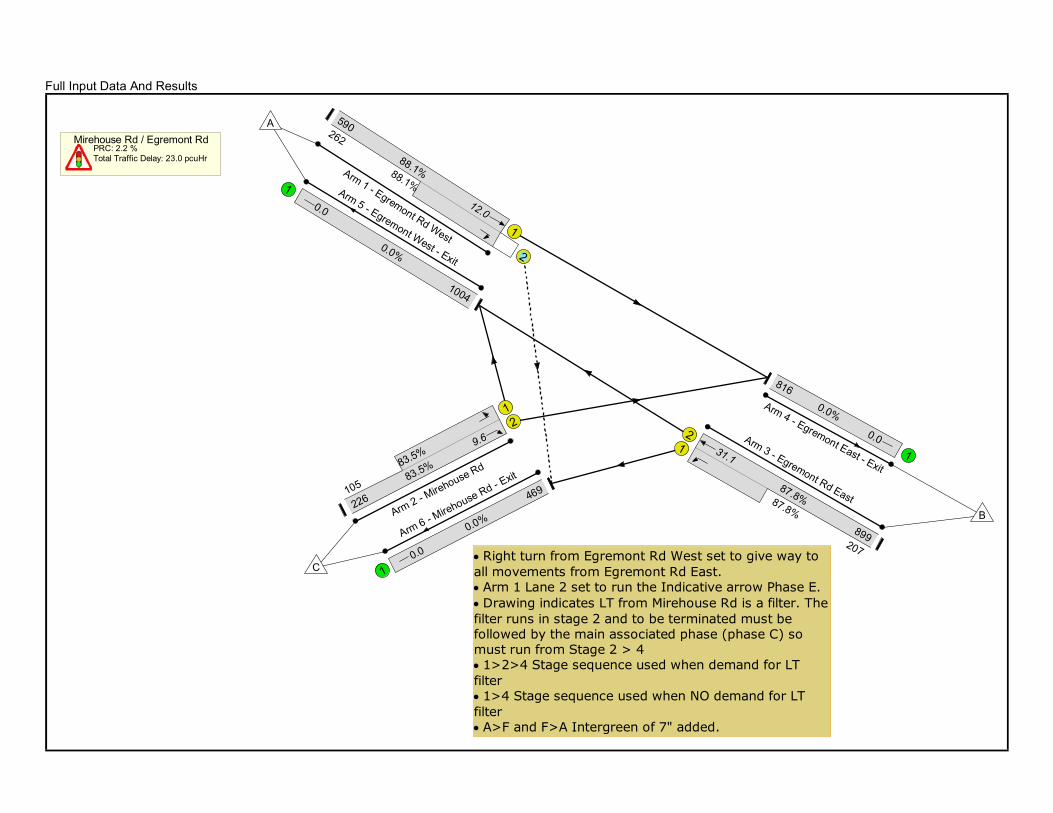
Full Input Data And Results
Mirehouse Rd / Egremont RdPRC: 2.2 %Total Traffic Delay: 23.0 pcuHr
Arm 1 - Egremont Rd West1
2
12.0
88.1%
590
88.1%
262
Arm 2 - Mirehouse Rd
12
83.5%
105
9.6
83.5%
226
Arm 3 - Egremont Rd East
12
87.8%
207
31.1
87.8%
899
Arm 4 - Egremont East - Exit1
0.0
0.0%
816
Arm 5 - Egremont West - Exit
1
0.0
0.0%
1004
Arm 6 - Mirehouse Rd - E
xit
10.0
0.0%
469
A
B
CRight turn from Egremont Rd West set to give way to all movements from Egremont Rd East.Arm 1 Lane 2 set to run the Indicative arrow Phase E.Drawing indicates LT from Mirehouse Rd is a filter. The filter runs in stage 2 and to be terminated must be followed by the main associated phase (phase C) so must run from Stage 2 > 41>2>4 Stage sequence used when demand for LT filter1>4 Stage sequence used when NO demand for LT filterA>F and F>A Intergreen of 7" added.

Full Input Data And Results Network Results
Item Lane Description
Lane Type
Controller Stream
Position In Filtered Route
Full Phase Arrow Phase
Num Greens
Total Green (s)
Arrow Green (s)
Demand Flow (pcu)
Sat Flow (pcu/Hr)
Capacity (pcu)
Deg Sat (%)
Network - - N/A - - - - - - - - 88.1%
Mirehouse Rd / Egremont Rd
- - N/A - - - - - - - - 88.1%
1/1+1/2 Egremont Rd West Ahead
Right U+O N/A N/A A E 1 89 8 852 1940:1791 670+298
88.1 : 88.1%
2/2+2/1 Mirehouse Rd
Right Left U N/A N/A C D 1 17:32 15 331 1805:1764 271+126
83.5 : 83.5%
3/2+3/1 Egremont Rd
East Ahead Left U N/A N/A B 1 74 - 1106 1940:1764 1024+236
87.8 : 87.8%
4/1 Egremont East - Exit
U N/A N/A - - - - 816 Inf Inf 0.0%
5/1 Egremont West
- Exit U N/A N/A - - - - 1004 Inf Inf 0.0%
6/1 Mirehouse Rd -
Exit U N/A N/A - - - - 469 Inf Inf 0.0%
Item Arriving (pcu) Leaving (pcu)
Turners In Gaps (pcu)
Turners When Unopposed (pcu)
Turners In Intergreen (pcu)
Uniform Delay (pcuHr)
Rand + Oversat Delay (pcuHr)
Storage Area Uniform Delay (pcuHr)
Total Delay (pcuHr)
Av. Delay Per PCU (s/pcu)
Max. Back of Uniform Queue (pcu)
Rand + Oversat Queue (pcu)
Mean Max Queue (pcu)
Network - - 44 194 24 12.4 9.3 1.3 23.0 - - - -
Mirehouse Rd / Egremont Rd
- - 44 194 24 12.4 9.3 1.3 23.0 - - - -
1/1+1/2 852 852 44 194 24 3.2 3.5 1.3 7.9 33.6 8.5 3.5 12.0
2/2+2/1 331 331 - - - 4.1 2.4 - 6.4 70.1 7.3 2.4 9.6
3/2+3/1 1106 1106 - - - 5.2 3.4 - 8.6 28.0 27.7 3.4 31.1
4/1 816 816 - - - 0.0 0.0 - 0.0 0.0 0.0 0.0 0.0
5/1 1004 1004 - - - 0.0 0.0 - 0.0 0.0 0.0 0.0 0.0
6/1 469 469 - - - 0.0 0.0 - 0.0 0.0 0.0 0.0 0.0
C1 PRC for Signalled Lanes (%): 2.2 Total Delay for Signalled Lanes (pcuHr): 23.01 Cycle Time (s): 120 PRC Over All Lanes (%): 2.2 Total Delay Over All Lanes(pcuHr): 23.01

Full Input Data And Results

Full Input Data And Results Scenario 11: 'PM25+Operation' (FG11: 'PM 2025 Operation', Plan 1: 'Network Control Plan 1') Stage Sequence Diagram
A
BG
1 Min: 7
7 76s
A
D
E
2 Min: 4
7 8s
C
F
4 Min: 7
7 15s Stage Timings
Stage 1 2 4
Duration 76 8 15
Change Point 0 83 98
Signal Timings Diagram
0
0
10
10
20
20
30
30
40
40
50
50
60
60
70
70
80
80
90
90
100
100
110
110
120
120
Time in cycle (sec)
Pha
ses
1 7 : 76
0
2 7 : 8
83
4 7 : 15
98
H HG GF FE ED DC CB BA A

Full Input Data And Results Network Layout Diagram

Full Input Data And Results
Mirehouse Rd / Egremont RdPRC: 4.4 %Total Traffic Delay: 20.9 pcuHr
Arm 1 - Egremont Rd West1
2
11.3
85.8%
595
85.8%
260
Arm 2 - Mirehouse Rd
12
82.3%
101
8.6
82.3%
198
Arm 3 - Egremont Rd East
12
86.2%
199
30.1
86.2%
913
Arm 4 - Egremont East - Exit1
0.0
0.0%
793
Arm 5 - Egremont West - Exit
1
0.0
0.0%
1014
Arm 6 - Mirehouse Rd - E
xit
10.0
0.0%
459
A
B
CRight turn from Egremont Rd West set to give way to all movements from Egremont Rd East.Arm 1 Lane 2 set to run the Indicative arrow Phase E.Drawing indicates LT from Mirehouse Rd is a filter. The filter runs in stage 2 and to be terminated must be followed by the main associated phase (phase C) so must run from Stage 2 > 41>2>4 Stage sequence used when demand for LT filter1>4 Stage sequence used when NO demand for LT filterA>F and F>A Intergreen of 7" added.

Full Input Data And Results Network Results
Item Lane Description
Lane Type
Controller Stream
Position In Filtered Route
Full Phase Arrow Phase
Num Greens
Total Green (s)
Arrow Green (s)
Demand Flow (pcu)
Sat Flow (pcu/Hr)
Capacity (pcu)
Deg Sat (%)
Network - - N/A - - - - - - - - 86.2%
Mirehouse Rd / Egremont Rd
- - N/A - - - - - - - - 86.2%
1/1+1/2 Egremont Rd West Ahead
Right U+O N/A N/A A E 1 91 8 855 1940:1791 693+303
85.8 : 85.8%
2/2+2/1 Mirehouse Rd
Right Left U N/A N/A C D 1 15:30 15 299 1805:1764 241+123
82.3 : 82.3%
3/2+3/1 Egremont Rd
East Ahead Left U N/A N/A B 1 76 - 1112 1940:1764 1059+231
86.2 : 86.2%
4/1 Egremont East - Exit
U N/A N/A - - - - 793 Inf Inf 0.0%
5/1 Egremont West
- Exit U N/A N/A - - - - 1014 Inf Inf 0.0%
6/1 Mirehouse Rd -
Exit U N/A N/A - - - - 459 Inf Inf 0.0%
Item Arriving (pcu) Leaving (pcu)
Turners In Gaps (pcu)
Turners When Unopposed (pcu)
Turners In Intergreen (pcu)
Uniform Delay (pcuHr)
Rand + Oversat Delay (pcuHr)
Storage Area Uniform Delay (pcuHr)
Total Delay (pcuHr)
Av. Delay Per PCU (s/pcu)
Max. Back of Uniform Queue (pcu)
Rand + Oversat Queue (pcu)
Mean Max Queue (pcu)
Network - - 49 194 17 11.5 8.1 1.3 20.9 - - - -
Mirehouse Rd / Egremont Rd
- - 49 194 17 11.5 8.1 1.3 20.9 - - - -
1/1+1/2 855 855 49 194 17 2.9 2.9 1.3 7.2 30.2 8.4 2.9 11.3
2/2+2/1 299 299 - - - 3.8 2.2 - 5.9 71.5 6.4 2.2 8.6
3/2+3/1 1112 1112 - - - 4.8 3.0 - 7.8 25.3 27.0 3.0 30.1
4/1 793 793 - - - 0.0 0.0 - 0.0 0.0 0.0 0.0 0.0
5/1 1014 1014 - - - 0.0 0.0 - 0.0 0.0 0.0 0.0 0.0
6/1 459 459 - - - 0.0 0.0 - 0.0 0.0 0.0 0.0 0.0
C1 PRC for Signalled Lanes (%): 4.4 Total Delay for Signalled Lanes (pcuHr): 20.93 Cycle Time (s): 120 PRC Over All Lanes (%): 4.4 Total Delay Over All Lanes(pcuHr): 20.93

Full Input Data And Results
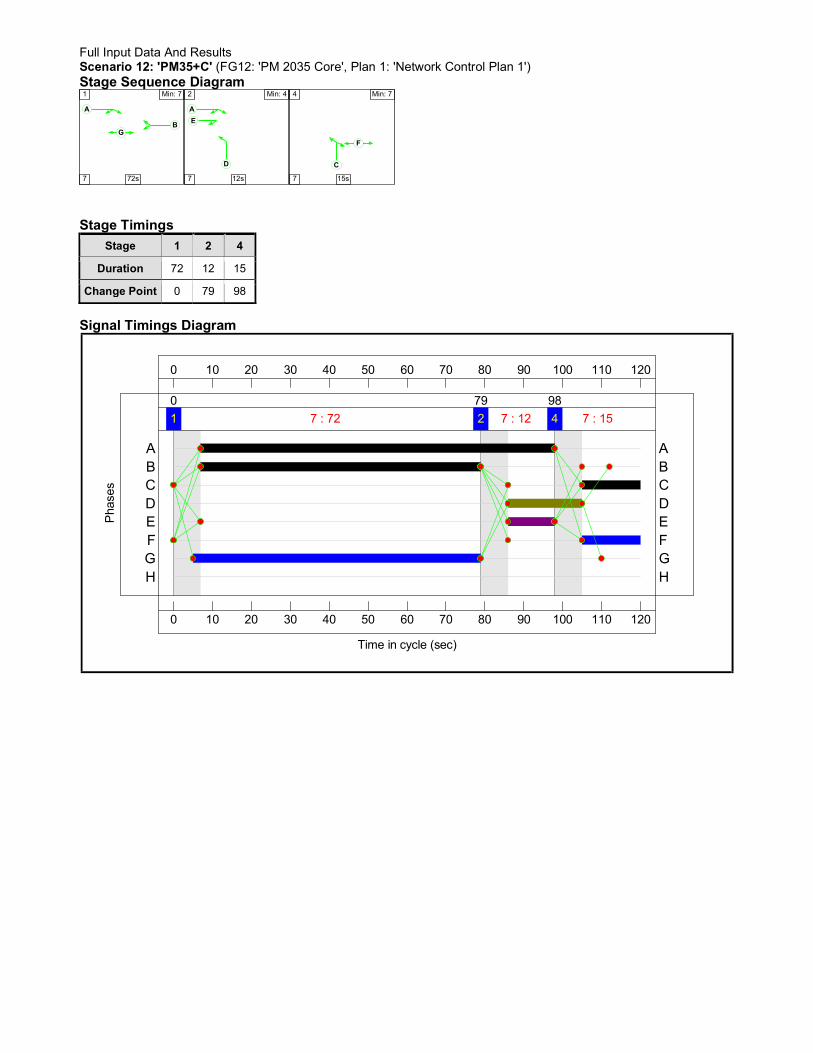
Full Input Data And Results Scenario 12: 'PM35+C' (FG12: 'PM 2035 Core', Plan 1: 'Network Control Plan 1') Stage Sequence Diagram
A
BG
1 Min: 7
7 72s
A
D
E
2 Min: 4
7 12s
C
F
4 Min: 7
7 15s Stage Timings
Stage 1 2 4
Duration 72 12 15
Change Point 0 79 98
Signal Timings Diagram
0
0
10
10
20
20
30
30
40
40
50
50
60
60
70
70
80
80
90
90
100
100
110
110
120
120
Time in cycle (sec)
Pha
ses
1 7 : 72
0
2 7 : 12
79
4 7 : 15
98
H HG GF FE ED DC CB BA A

Full Input Data And Results Network Layout Diagram

Full Input Data And Results
Mirehouse Rd / Egremont RdPRC: 0.7 %Total Traffic Delay: 25.4 pcuHr
Arm 1 - Egremont Rd West1
2
14.0
89.4%
614
89.4%
313
Arm 2 - Mirehouse Rd
12
86.0%
147
9.5
86.0%
207
Arm 3 - Egremont Rd East
12
89.4%
269
32.1
89.4%
843
Arm 4 - Egremont East - Exit1
0.0
0.0%
821
Arm 5 - Egremont West - Exit
1
0.0
0.0%
990
Arm 6 - Mirehouse Rd - E
xit
10.0
0.0%
582
A
B
CRight turn from Egremont Rd West set to give way to all movements from Egremont Rd East.Arm 1 Lane 2 set to run the Indicative arrow Phase E.Drawing indicates LT from Mirehouse Rd is a filter. The filter runs in stage 2 and to be terminated must be followed by the main associated phase (phase C) so must run from Stage 2 > 41>2>4 Stage sequence used when demand for LT filter1>4 Stage sequence used when NO demand for LT filterA>F and F>A Intergreen of 7" added.

Full Input Data And Results Network Results
Item Lane Description
Lane Type
Controller Stream
Position In Filtered Route
Full Phase Arrow Phase
Num Greens
Total Green (s)
Arrow Green (s)
Demand Flow (pcu)
Sat Flow (pcu/Hr)
Capacity (pcu)
Deg Sat (%)
Network - - N/A - - - - - - - - 89.4%
Mirehouse Rd / Egremont Rd
- - N/A - - - - - - - - 89.4%
1/1+1/2 Egremont Rd West Ahead
Right U+O N/A N/A A E 1 91 12 927 1940:1791 687+350
89.4 : 89.4%
2/2+2/1 Mirehouse Rd
Right Left U N/A N/A C D 1 15:34 19 354 1805:1764 241+171
86.0 : 86.0%
3/2+3/1 Egremont Rd
East Ahead Left U N/A N/A B 1 72 - 1112 1940:1764 943+301
89.4 : 89.4%
4/1 Egremont East - Exit
U N/A N/A - - - - 821 Inf Inf 0.0%
5/1 Egremont West
- Exit U N/A N/A - - - - 990 Inf Inf 0.0%
6/1 Mirehouse Rd -
Exit U N/A N/A - - - - 582 Inf Inf 0.0%
Item Arriving (pcu) Leaving (pcu)
Turners In Gaps (pcu)
Turners When Unopposed (pcu)
Turners In Intergreen (pcu)
Uniform Delay (pcuHr)
Rand + Oversat Delay (pcuHr)
Storage Area Uniform Delay (pcuHr)
Total Delay (pcuHr)
Av. Delay Per PCU (s/pcu)
Max. Back of Uniform Queue (pcu)
Rand + Oversat Queue (pcu)
Mean Max Queue (pcu)
Network - - 37 254 23 13.4 10.7 1.3 25.4 - - - -
Mirehouse Rd / Egremont Rd
- - 37 254 23 13.4 10.7 1.3 25.4 - - - -
1/1+1/2 927 927 37 254 23 3.7 3.9 1.3 8.9 34.6 10.1 3.9 14.0
2/2+2/1 354 354 - - - 4.3 2.8 - 7.1 71.9 6.7 2.8 9.5
3/2+3/1 1112 1112 - - - 5.5 4.0 - 9.5 30.6 28.1 4.0 32.1
4/1 821 821 - - - 0.0 0.0 - 0.0 0.0 0.0 0.0 0.0
5/1 990 990 - - - 0.0 0.0 - 0.0 0.0 0.0 0.0 0.0
6/1 582 582 - - - 0.0 0.0 - 0.0 0.0 0.0 0.0 0.0
C1 PRC for Signalled Lanes (%): 0.7 Total Delay for Signalled Lanes (pcuHr): 25.45 Cycle Time (s): 120 PRC Over All Lanes (%): 0.7 Total Delay Over All Lanes(pcuHr): 25.45

Full Input Data And Results

Full Input Data And Results Scenario 13: 'PM35+Operation' (FG13: 'PM 2035 Operation', Plan 1: 'Network Control Plan 1') Stage Sequence Diagram
A
BG
1 Min: 7
7 70s
A
D
E
2 Min: 4
7 12s
C
F
4 Min: 7
7 17s Stage Timings
Stage 1 2 4
Duration 70 12 17
Change Point 0 77 96
Signal Timings Diagram
0
0
10
10
20
20
30
30
40
40
50
50
60
60
70
70
80
80
90
90
100
100
110
110
120
120
Time in cycle (sec)
Pha
ses
1 7 : 70
0
2 7 : 12
77
4 7 : 17
96
H HG GF FE ED DC CB BA A

Full Input Data And Results Network Layout Diagram

Full Input Data And Results
Mirehouse Rd / Egremont RdPRC: -1.7 %Total Traffic Delay: 28.7 pcuHr
Arm 1 - Egremont Rd West1
2
15.0
91.5%
609
91.5%
313
Arm 2 - Mirehouse Rd
12
87.5%
147
10.9
87.5%
237
Arm 3 - Egremont Rd East
12
91.5%
265
34.5
91.5%
844
Arm 4 - Egremont East - Exit1
0.0
0.0%
846
Arm 5 - Egremont West - Exit
1
0.0
0.0%
991
Arm 6 - Mirehouse Rd - E
xit
10.0
0.0%
578
A
B
CRight turn from Egremont Rd West set to give way to all movements from Egremont Rd East.Arm 1 Lane 2 set to run the Indicative arrow Phase E.Drawing indicates LT from Mirehouse Rd is a filter. The filter runs in stage 2 and to be terminated must be followed by the main associated phase (phase C) so must run from Stage 2 > 41>2>4 Stage sequence used when demand for LT filter1>4 Stage sequence used when NO demand for LT filterA>F and F>A Intergreen of 7" added.
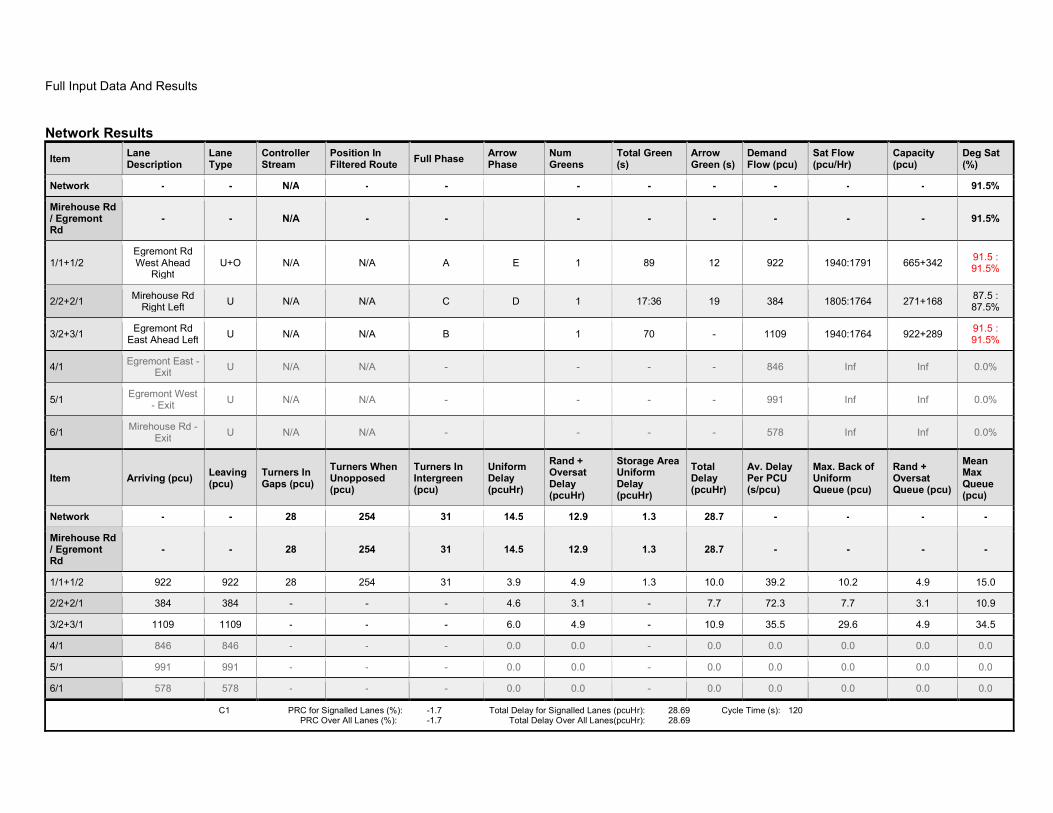
Full Input Data And Results Network Results
Item Lane Description
Lane Type
Controller Stream
Position In Filtered Route
Full Phase Arrow Phase
Num Greens
Total Green (s)
Arrow Green (s)
Demand Flow (pcu)
Sat Flow (pcu/Hr)
Capacity (pcu)
Deg Sat (%)
Network - - N/A - - - - - - - - 91.5%
Mirehouse Rd / Egremont Rd
- - N/A - - - - - - - - 91.5%
1/1+1/2 Egremont Rd West Ahead
Right U+O N/A N/A A E 1 89 12 922 1940:1791 665+342
91.5 : 91.5%
2/2+2/1 Mirehouse Rd
Right Left U N/A N/A C D 1 17:36 19 384 1805:1764 271+168
87.5 : 87.5%
3/2+3/1 Egremont Rd
East Ahead Left U N/A N/A B 1 70 - 1109 1940:1764 922+289
91.5 : 91.5%
4/1 Egremont East - Exit
U N/A N/A - - - - 846 Inf Inf 0.0%
5/1 Egremont West
- Exit U N/A N/A - - - - 991 Inf Inf 0.0%
6/1 Mirehouse Rd -
Exit U N/A N/A - - - - 578 Inf Inf 0.0%
Item Arriving (pcu) Leaving (pcu)
Turners In Gaps (pcu)
Turners When Unopposed (pcu)
Turners In Intergreen (pcu)
Uniform Delay (pcuHr)
Rand + Oversat Delay (pcuHr)
Storage Area Uniform Delay (pcuHr)
Total Delay (pcuHr)
Av. Delay Per PCU (s/pcu)
Max. Back of Uniform Queue (pcu)
Rand + Oversat Queue (pcu)
Mean Max Queue (pcu)
Network - - 28 254 31 14.5 12.9 1.3 28.7 - - - -
Mirehouse Rd / Egremont Rd
- - 28 254 31 14.5 12.9 1.3 28.7 - - - -
1/1+1/2 922 922 28 254 31 3.9 4.9 1.3 10.0 39.2 10.2 4.9 15.0
2/2+2/1 384 384 - - - 4.6 3.1 - 7.7 72.3 7.7 3.1 10.9
3/2+3/1 1109 1109 - - - 6.0 4.9 - 10.9 35.5 29.6 4.9 34.5
4/1 846 846 - - - 0.0 0.0 - 0.0 0.0 0.0 0.0 0.0
5/1 991 991 - - - 0.0 0.0 - 0.0 0.0 0.0 0.0 0.0
6/1 578 578 - - - 0.0 0.0 - 0.0 0.0 0.0 0.0 0.0
C1 PRC for Signalled Lanes (%): -1.7 Total Delay for Signalled Lanes (pcuHr): 28.69 Cycle Time (s): 120 PRC Over All Lanes (%): -1.7 Total Delay Over All Lanes(pcuHr): 28.69

Full Input Data And Results
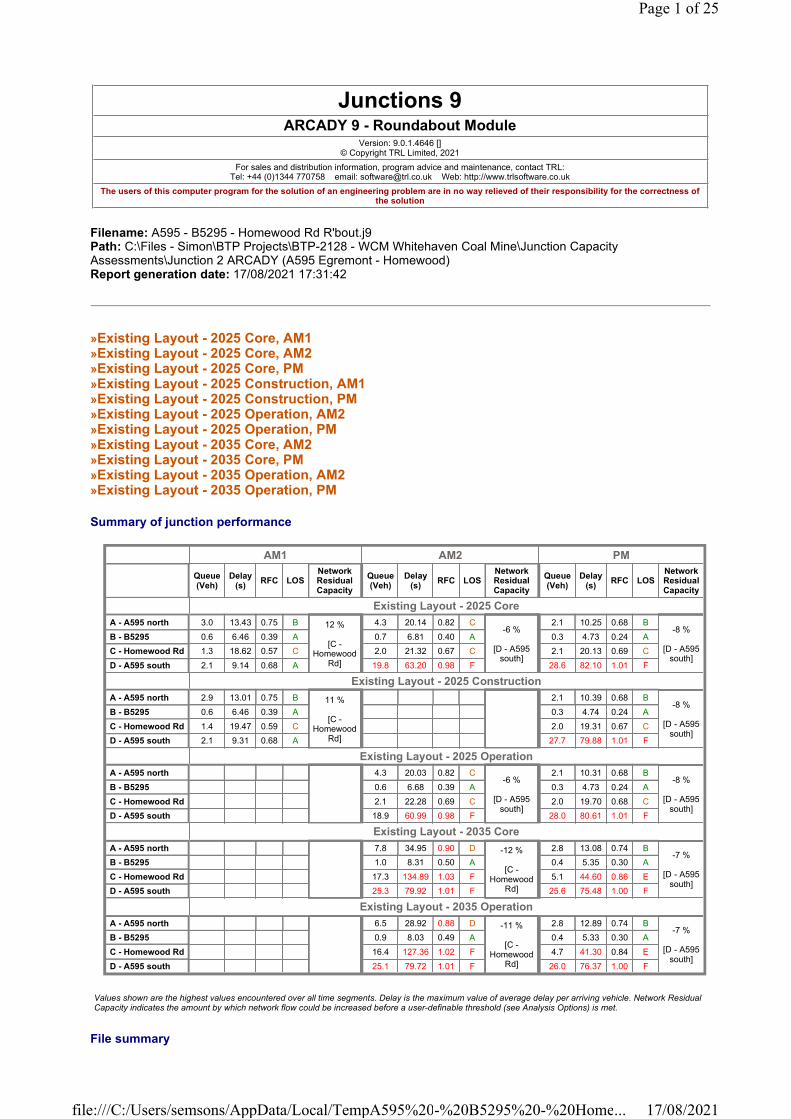
Filename: A595 - B5295 - Homewood Rd R'bout.j9Path: C:\Files - Simon\BTP Projects\BTP-2128 - WCM Whitehaven Coal Mine\Junction Capacity Assessments\Junction 2 ARCADY (A595 Egremont - Homewood)Report generation date: 17/08/2021 17:31:42
»Existing Layout - 2025 Core, AM1»Existing Layout - 2025 Core, AM2»Existing Layout - 2025 Core, PM»Existing Layout - 2025 Construction, AM1»Existing Layout - 2025 Construction, PM»Existing Layout - 2025 Operation, AM2»Existing Layout - 2025 Operation, PM»Existing Layout - 2035 Core, AM2»Existing Layout - 2035 Core, PM»Existing Layout - 2035 Operation, AM2»Existing Layout - 2035 Operation, PM
Summary of junction performance
Junctions 9ARCADY 9 - Roundabout Module
Version: 9.0.1.4646 [] © Copyright TRL Limited, 2021
For sales and distribution information, program advice and maintenance, contact TRL:Tel: +44 (0)1344 770758 email: [email protected] Web: http://www.trlsoftware.co.uk
The users of this computer program for the solution of an engineering problem are in no way relieved of their responsibility for the correctness of the solution
AM1 AM2 PM
Queue (Veh)
Delay (s)
RFC LOSNetwork Residual Capacity
Queue (Veh)
Delay (s)
RFC LOSNetwork Residual Capacity
Queue (Veh)
Delay (s)
RFC LOSNetwork Residual Capacity
Existing Layout - 2025 Core
A - A595 north 3.0 13.43 0.75 B 12 %
[C -Homewood
Rd]
4.3 20.14 0.82 C-6 %
[D - A595 south]
2.1 10.25 0.68 B-8 %
[D - A595 south]
B - B5295 0.6 6.46 0.39 A 0.7 6.81 0.40 A 0.3 4.73 0.24 A
C - Homewood Rd 1.3 18.62 0.57 C 2.0 21.32 0.67 C 2.1 20.13 0.69 C
D - A595 south 2.1 9.14 0.68 A 19.8 63.20 0.98 F 28.6 82.10 1.01 F
Existing Layout - 2025 Construction
A - A595 north 2.9 13.01 0.75 B 11 %
[C -Homewood
Rd]
2.1 10.39 0.68 B-8 %
[D - A595 south]
B - B5295 0.6 6.46 0.39 A 0.3 4.74 0.24 A
C - Homewood Rd 1.4 19.47 0.59 C 2.0 19.31 0.67 C
D - A595 south 2.1 9.31 0.68 A 27.7 79.88 1.01 F
Existing Layout - 2025 Operation
A - A595 north 4.3 20.03 0.82 C-6 %
[D - A595 south]
2.1 10.31 0.68 B-8 %
[D - A595 south]
B - B5295 0.6 6.68 0.39 A 0.3 4.73 0.24 A
C - Homewood Rd 2.1 22.28 0.69 C 2.0 19.70 0.68 C
D - A595 south 18.9 60.99 0.98 F 28.0 80.61 1.01 F
Existing Layout - 2035 Core
A - A595 north 7.8 34.95 0.90 D -12 %
[C -Homewood
Rd]
2.8 13.08 0.74 B-7 %
[D - A595 south]
B - B5295 1.0 8.31 0.50 A 0.4 5.35 0.30 A
C - Homewood Rd 17.3 134.89 1.03 F 5.1 44.60 0.86 E
D - A595 south 25.3 79.92 1.01 F 25.6 75.48 1.00 F
Existing Layout - 2035 Operation
A - A595 north 6.5 28.92 0.88 D -11 %
[C -Homewood
Rd]
2.8 12.89 0.74 B-7 %
[D - A595 south]
B - B5295 0.9 8.03 0.49 A 0.4 5.33 0.30 A
C - Homewood Rd 16.4 127.36 1.02 F 4.7 41.30 0.84 E
D - A595 south 25.1 79.72 1.01 F 26.0 76.37 1.00 F
Values shown are the highest values encountered over all time segments. Delay is the maximum value of average delay per arriving vehicle. Network Residual Capacity indicates the amount by which network flow could be increased before a user-definable threshold (see Analysis Options) is met.
File summary
Page 1 of 25
17/08/2021file:///C:/Users/semsons/AppData/Local/TempA595%20-%20B5295%20-%20Home...
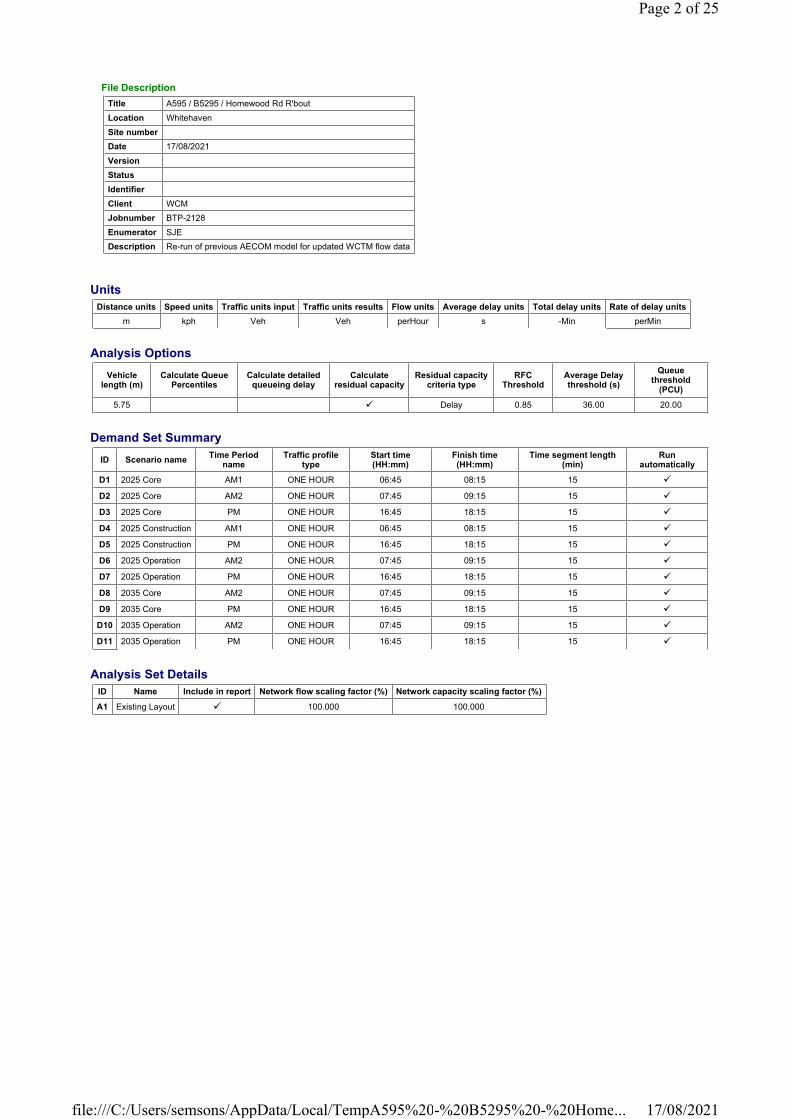
Units
Analysis Options
Demand Set Summary
Analysis Set Details
File Description
Title A595 / B5295 / Homewood Rd R'bout
Location Whitehaven
Site number
Date 17/08/2021
Version
Status
Identifier
Client WCM
Jobnumber BTP-2128
Enumerator SJE
Description Re-run of previous AECOM model for updated WCTM flow data
Distance units Speed units Traffic units input Traffic units results Flow units Average delay units Total delay units Rate of delay units
m kph Veh Veh perHour s -Min perMin
Vehicle length (m)
Calculate Queue Percentiles
Calculate detailed queueing delay
Calculate residual capacity
Residual capacity criteria type
RFC Threshold
Average Delay threshold (s)
Queue threshold
(PCU)
5.75 � Delay 0.85 36.00 20.00
ID Scenario nameTime Period
nameTraffic profile
typeStart time (HH:mm)
Finish time (HH:mm)
Time segment length (min)
Run automatically
D1 2025 Core AM1 ONE HOUR 06:45 08:15 15 �
D2 2025 Core AM2 ONE HOUR 07:45 09:15 15 �
D3 2025 Core PM ONE HOUR 16:45 18:15 15 �
D4 2025 Construction AM1 ONE HOUR 06:45 08:15 15 �
D5 2025 Construction PM ONE HOUR 16:45 18:15 15 �
D6 2025 Operation AM2 ONE HOUR 07:45 09:15 15 �
D7 2025 Operation PM ONE HOUR 16:45 18:15 15 �
D8 2035 Core AM2 ONE HOUR 07:45 09:15 15 �
D9 2035 Core PM ONE HOUR 16:45 18:15 15 �
D10 2035 Operation AM2 ONE HOUR 07:45 09:15 15 �
D11 2035 Operation PM ONE HOUR 16:45 18:15 15 �
ID Name Include in report Network flow scaling factor (%) Network capacity scaling factor (%)
A1 Existing Layout � 100.000 100.000
Page 2 of 25
17/08/2021file:///C:/Users/semsons/AppData/Local/TempA595%20-%20B5295%20-%20Home...
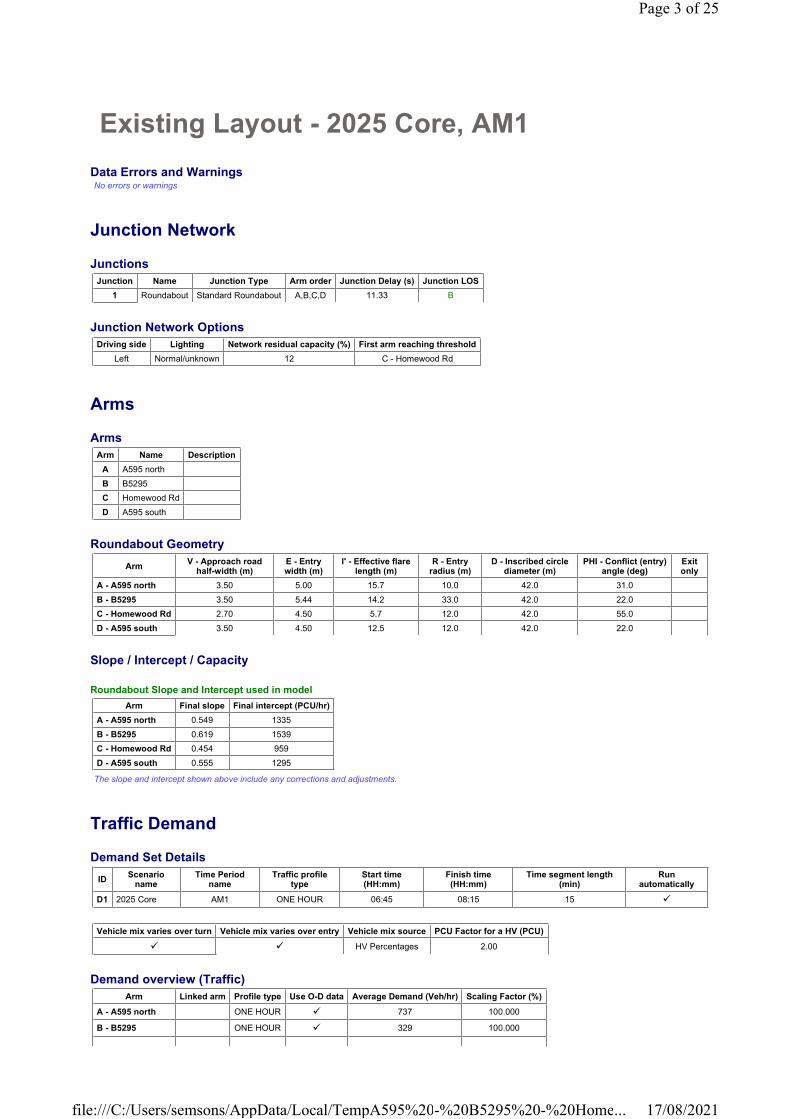
Existing Layout - 2025 Core, AM1
Data Errors and WarningsNo errors or warnings
Junction Network
Junctions
Junction Network Options
Arms
Arms
Roundabout Geometry
Slope / Intercept / Capacity
Roundabout Slope and Intercept used in model
The slope and intercept shown above include any corrections and adjustments.
Traffic Demand
Demand Set Details
Demand overview (Traffic)
Junction Name Junction Type Arm order Junction Delay (s) Junction LOS
1 Roundabout Standard Roundabout A,B,C,D 11.33 B
Driving side Lighting Network residual capacity (%) First arm reaching threshold
Left Normal/unknown 12 C - Homewood Rd
Arm Name Description
A A595 north
B B5295
C Homewood Rd
D A595 south
ArmV - Approach road
half-width (m)E - Entry width (m)
l' - Effective flare length (m)
R - Entry radius (m)
D - Inscribed circle diameter (m)
PHI - Conflict (entry) angle (deg)
Exit only
A - A595 north 3.50 5.00 15.7 10.0 42.0 31.0
B - B5295 3.50 5.44 14.2 33.0 42.0 22.0
C - Homewood Rd 2.70 4.50 5.7 12.0 42.0 55.0
D - A595 south 3.50 4.50 12.5 12.0 42.0 22.0
Arm Final slope Final intercept (PCU/hr)
A - A595 north 0.549 1335
B - B5295 0.619 1539
C - Homewood Rd 0.454 959
D - A595 south 0.555 1295
IDScenario
nameTime Period
nameTraffic profile
typeStart time (HH:mm)
Finish time (HH:mm)
Time segment length (min)
Run automatically
D1 2025 Core AM1 ONE HOUR 06:45 08:15 15 �
Vehicle mix varies over turn Vehicle mix varies over entry Vehicle mix source PCU Factor for a HV (PCU)
� � HV Percentages 2.00
Arm Linked arm Profile type Use O-D data Average Demand (Veh/hr) Scaling Factor (%)
A - A595 north ONE HOUR � 737 100.000
B - B5295 ONE HOUR � 329 100.000
Page 3 of 25
17/08/2021file:///C:/Users/semsons/AppData/Local/TempA595%20-%20B5295%20-%20Home...
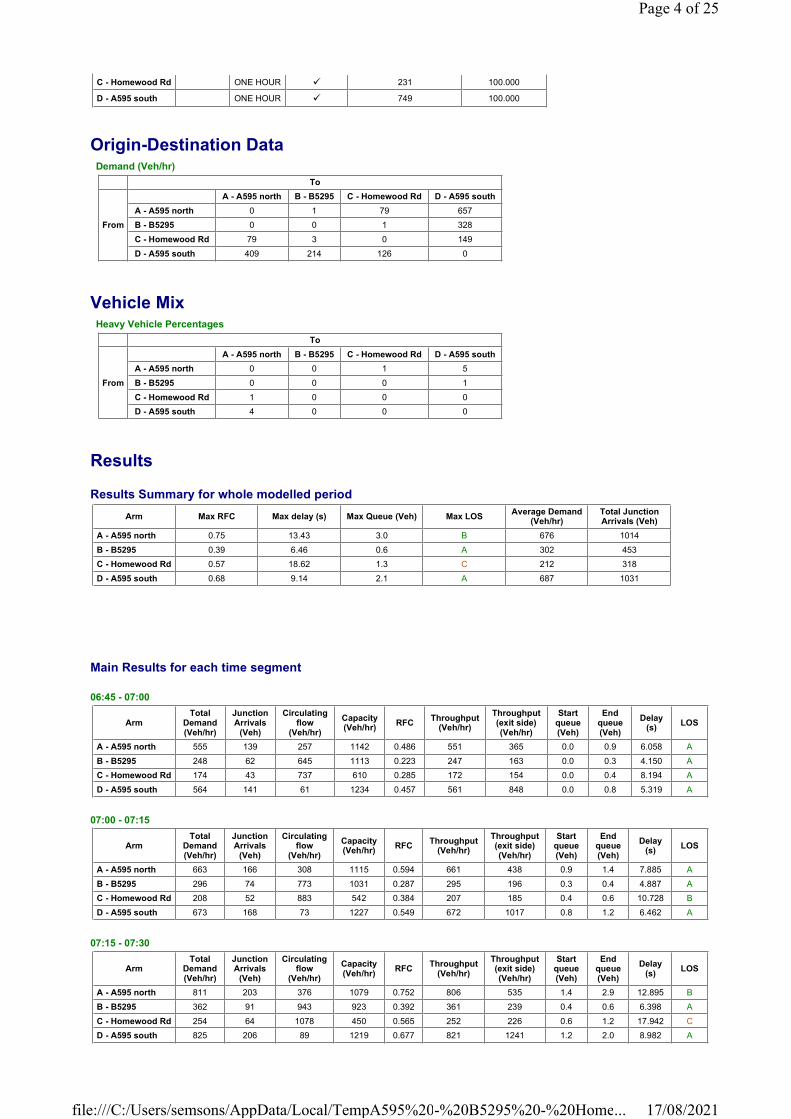
Origin-Destination Data
Vehicle Mix
Results
Results Summary for whole modelled period
Main Results for each time segment
06:45 - 07:00
07:00 - 07:15
07:15 - 07:30
C - Homewood Rd ONE HOUR � 231 100.000
D - A595 south ONE HOUR � 749 100.000
Demand (Veh/hr)
To
From
A - A595 north B - B5295 C - Homewood Rd D - A595 south
A - A595 north 0 1 79 657
B - B5295 0 0 1 328
C - Homewood Rd 79 3 0 149
D - A595 south 409 214 126 0
Heavy Vehicle Percentages
To
From
A - A595 north B - B5295 C - Homewood Rd D - A595 south
A - A595 north 0 0 1 5
B - B5295 0 0 0 1
C - Homewood Rd 1 0 0 0
D - A595 south 4 0 0 0
Arm Max RFC Max delay (s) Max Queue (Veh) Max LOSAverage Demand
(Veh/hr)Total Junction Arrivals (Veh)
A - A595 north 0.75 13.43 3.0 B 676 1014
B - B5295 0.39 6.46 0.6 A 302 453
C - Homewood Rd 0.57 18.62 1.3 C 212 318
D - A595 south 0.68 9.14 2.1 A 687 1031
ArmTotal
Demand (Veh/hr)
Junction Arrivals
(Veh)
Circulating flow
(Veh/hr)
Capacity (Veh/hr)
RFCThroughput
(Veh/hr)
Throughput (exit side) (Veh/hr)
Start queue (Veh)
End queue (Veh)
Delay (s)
LOS
A - A595 north 555 139 257 1142 0.486 551 365 0.0 0.9 6.058 A
B - B5295 248 62 645 1113 0.223 247 163 0.0 0.3 4.150 A
C - Homewood Rd 174 43 737 610 0.285 172 154 0.0 0.4 8.194 A
D - A595 south 564 141 61 1234 0.457 561 848 0.0 0.8 5.319 A
ArmTotal
Demand (Veh/hr)
Junction Arrivals
(Veh)
Circulating flow
(Veh/hr)
Capacity (Veh/hr)
RFCThroughput
(Veh/hr)
Throughput (exit side) (Veh/hr)
Start queue (Veh)
End queue (Veh)
Delay (s)
LOS
A - A595 north 663 166 308 1115 0.594 661 438 0.9 1.4 7.885 A
B - B5295 296 74 773 1031 0.287 295 196 0.3 0.4 4.887 A
C - Homewood Rd 208 52 883 542 0.384 207 185 0.4 0.6 10.728 B
D - A595 south 673 168 73 1227 0.549 672 1017 0.8 1.2 6.462 A
ArmTotal
Demand (Veh/hr)
Junction Arrivals
(Veh)
Circulating flow
(Veh/hr)
Capacity (Veh/hr)
RFCThroughput
(Veh/hr)
Throughput (exit side) (Veh/hr)
Start queue (Veh)
End queue (Veh)
Delay (s)
LOS
A - A595 north 811 203 376 1079 0.752 806 535 1.4 2.9 12.895 B
B - B5295 362 91 943 923 0.392 361 239 0.4 0.6 6.398 A
C - Homewood Rd 254 64 1078 450 0.565 252 226 0.6 1.2 17.942 C
D - A595 south 825 206 89 1219 0.677 821 1241 1.2 2.0 8.982 A
Page 4 of 25
17/08/2021file:///C:/Users/semsons/AppData/Local/TempA595%20-%20B5295%20-%20Home...
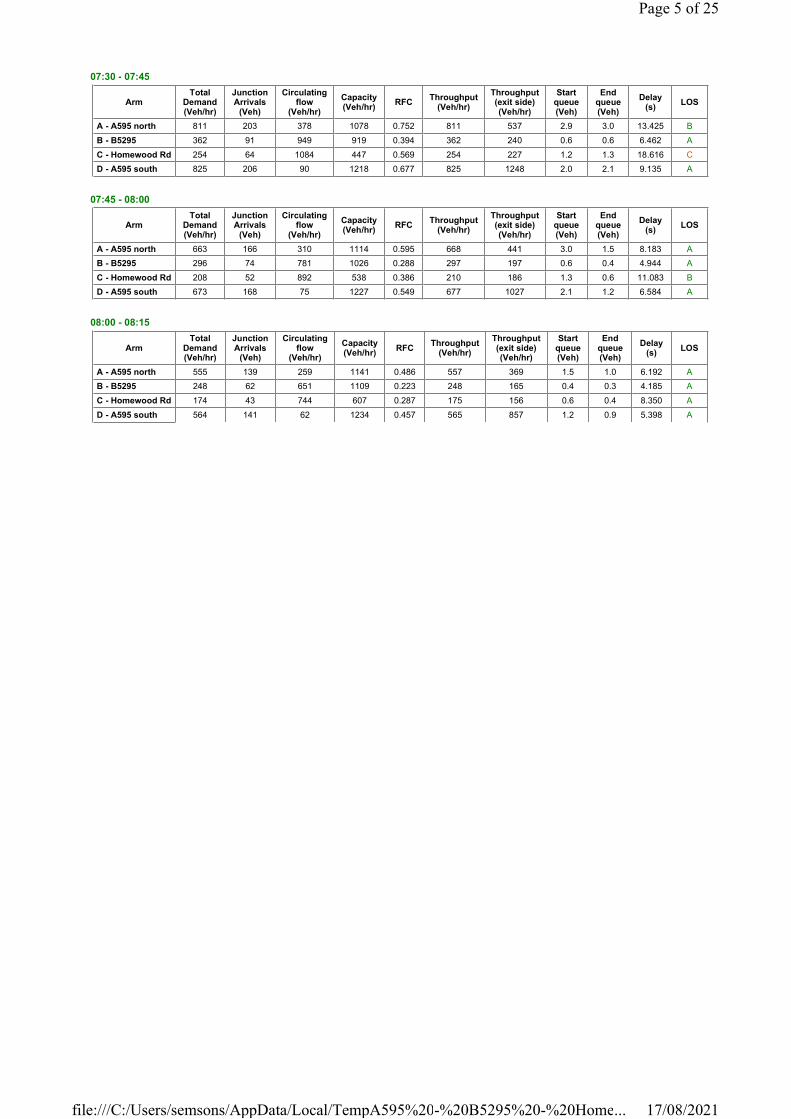
07:30 - 07:45
07:45 - 08:00
08:00 - 08:15
ArmTotal
Demand (Veh/hr)
Junction Arrivals
(Veh)
Circulating flow
(Veh/hr)
Capacity (Veh/hr)
RFCThroughput
(Veh/hr)
Throughput (exit side) (Veh/hr)
Start queue (Veh)
End queue (Veh)
Delay (s)
LOS
A - A595 north 811 203 378 1078 0.752 811 537 2.9 3.0 13.425 B
B - B5295 362 91 949 919 0.394 362 240 0.6 0.6 6.462 A
C - Homewood Rd 254 64 1084 447 0.569 254 227 1.2 1.3 18.616 C
D - A595 south 825 206 90 1218 0.677 825 1248 2.0 2.1 9.135 A
ArmTotal
Demand (Veh/hr)
Junction Arrivals
(Veh)
Circulating flow
(Veh/hr)
Capacity (Veh/hr)
RFCThroughput
(Veh/hr)
Throughput (exit side) (Veh/hr)
Start queue (Veh)
End queue (Veh)
Delay (s)
LOS
A - A595 north 663 166 310 1114 0.595 668 441 3.0 1.5 8.183 A
B - B5295 296 74 781 1026 0.288 297 197 0.6 0.4 4.944 A
C - Homewood Rd 208 52 892 538 0.386 210 186 1.3 0.6 11.083 B
D - A595 south 673 168 75 1227 0.549 677 1027 2.1 1.2 6.584 A
ArmTotal
Demand (Veh/hr)
Junction Arrivals
(Veh)
Circulating flow
(Veh/hr)
Capacity (Veh/hr)
RFCThroughput
(Veh/hr)
Throughput (exit side) (Veh/hr)
Start queue (Veh)
End queue (Veh)
Delay (s)
LOS
A - A595 north 555 139 259 1141 0.486 557 369 1.5 1.0 6.192 A
B - B5295 248 62 651 1109 0.223 248 165 0.4 0.3 4.185 A
C - Homewood Rd 174 43 744 607 0.287 175 156 0.6 0.4 8.350 A
D - A595 south 564 141 62 1234 0.457 565 857 1.2 0.9 5.398 A
Page 5 of 25
17/08/2021file:///C:/Users/semsons/AppData/Local/TempA595%20-%20B5295%20-%20Home...
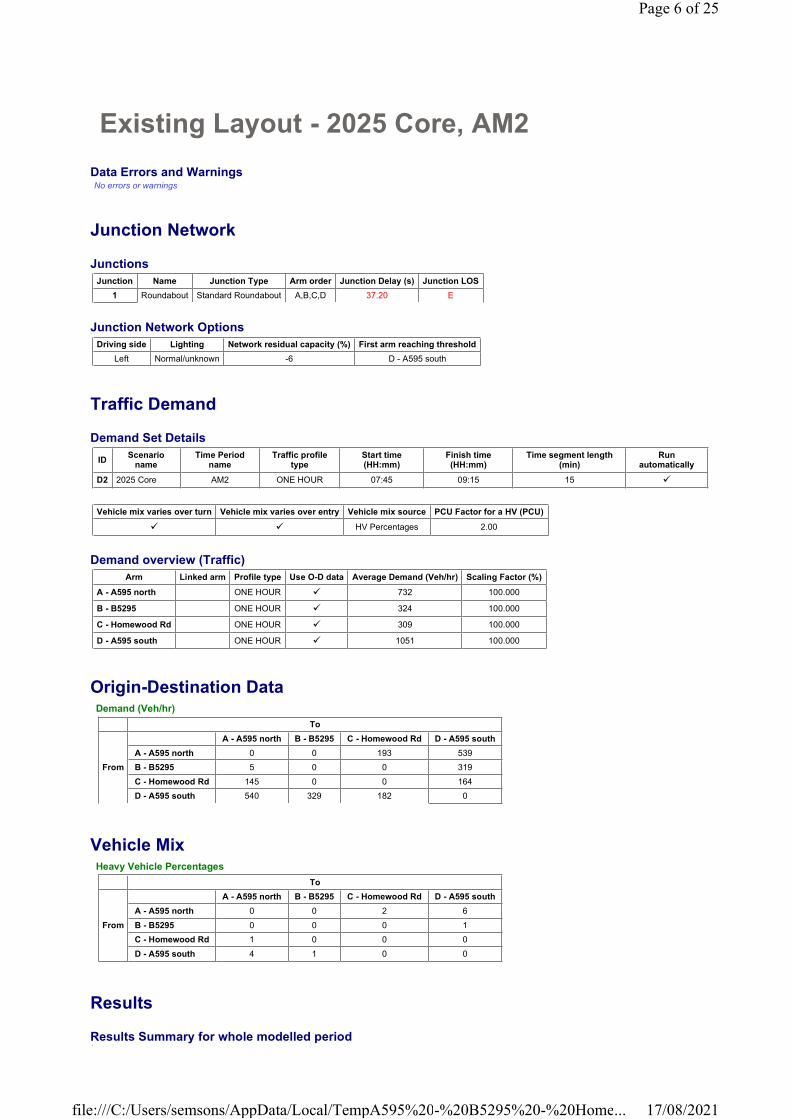
Existing Layout - 2025 Core, AM2
Data Errors and WarningsNo errors or warnings
Junction Network
Junctions
Junction Network Options
Traffic Demand
Demand Set Details
Demand overview (Traffic)
Origin-Destination Data
Vehicle Mix
Results
Results Summary for whole modelled period
Junction Name Junction Type Arm order Junction Delay (s) Junction LOS
1 Roundabout Standard Roundabout A,B,C,D 37.20 E
Driving side Lighting Network residual capacity (%) First arm reaching threshold
Left Normal/unknown -6 D - A595 south
IDScenario
nameTime Period
nameTraffic profile
typeStart time (HH:mm)
Finish time (HH:mm)
Time segment length (min)
Run automatically
D2 2025 Core AM2 ONE HOUR 07:45 09:15 15 �
Vehicle mix varies over turn Vehicle mix varies over entry Vehicle mix source PCU Factor for a HV (PCU)
� � HV Percentages 2.00
Arm Linked arm Profile type Use O-D data Average Demand (Veh/hr) Scaling Factor (%)
A - A595 north ONE HOUR � 732 100.000
B - B5295 ONE HOUR � 324 100.000
C - Homewood Rd ONE HOUR � 309 100.000
D - A595 south ONE HOUR � 1051 100.000
Demand (Veh/hr)
To
From
A - A595 north B - B5295 C - Homewood Rd D - A595 south
A - A595 north 0 0 193 539
B - B5295 5 0 0 319
C - Homewood Rd 145 0 0 164
D - A595 south 540 329 182 0
Heavy Vehicle Percentages
To
From
A - A595 north B - B5295 C - Homewood Rd D - A595 south
A - A595 north 0 0 2 6
B - B5295 0 0 0 1
C - Homewood Rd 1 0 0 0
D - A595 south 4 1 0 0
Page 6 of 25
17/08/2021file:///C:/Users/semsons/AppData/Local/TempA595%20-%20B5295%20-%20Home...
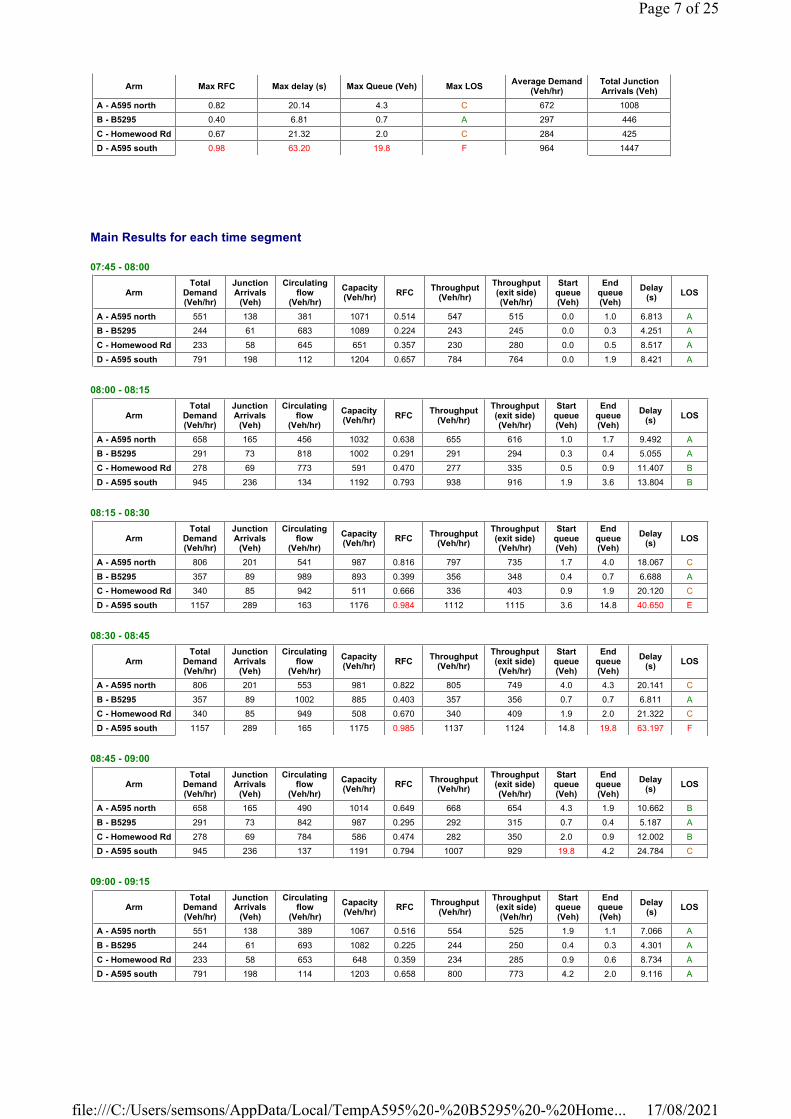
Main Results for each time segment
07:45 - 08:00
08:00 - 08:15
08:15 - 08:30
08:30 - 08:45
08:45 - 09:00
09:00 - 09:15
Arm Max RFC Max delay (s) Max Queue (Veh) Max LOSAverage Demand
(Veh/hr)Total Junction Arrivals (Veh)
A - A595 north 0.82 20.14 4.3 C 672 1008
B - B5295 0.40 6.81 0.7 A 297 446
C - Homewood Rd 0.67 21.32 2.0 C 284 425
D - A595 south 0.98 63.20 19.8 F 964 1447
ArmTotal
Demand (Veh/hr)
Junction Arrivals
(Veh)
Circulating flow
(Veh/hr)
Capacity (Veh/hr)
RFCThroughput
(Veh/hr)
Throughput (exit side) (Veh/hr)
Start queue (Veh)
End queue (Veh)
Delay (s)
LOS
A - A595 north 551 138 381 1071 0.514 547 515 0.0 1.0 6.813 A
B - B5295 244 61 683 1089 0.224 243 245 0.0 0.3 4.251 A
C - Homewood Rd 233 58 645 651 0.357 230 280 0.0 0.5 8.517 A
D - A595 south 791 198 112 1204 0.657 784 764 0.0 1.9 8.421 A
ArmTotal
Demand (Veh/hr)
Junction Arrivals
(Veh)
Circulating flow
(Veh/hr)
Capacity (Veh/hr)
RFCThroughput
(Veh/hr)
Throughput (exit side) (Veh/hr)
Start queue (Veh)
End queue (Veh)
Delay (s)
LOS
A - A595 north 658 165 456 1032 0.638 655 616 1.0 1.7 9.492 A
B - B5295 291 73 818 1002 0.291 291 294 0.3 0.4 5.055 A
C - Homewood Rd 278 69 773 591 0.470 277 335 0.5 0.9 11.407 B
D - A595 south 945 236 134 1192 0.793 938 916 1.9 3.6 13.804 B
ArmTotal
Demand (Veh/hr)
Junction Arrivals
(Veh)
Circulating flow
(Veh/hr)
Capacity (Veh/hr)
RFCThroughput
(Veh/hr)
Throughput (exit side) (Veh/hr)
Start queue (Veh)
End queue (Veh)
Delay (s)
LOS
A - A595 north 806 201 541 987 0.816 797 735 1.7 4.0 18.067 C
B - B5295 357 89 989 893 0.399 356 348 0.4 0.7 6.688 A
C - Homewood Rd 340 85 942 511 0.666 336 403 0.9 1.9 20.120 C
D - A595 south 1157 289 163 1176 0.984 1112 1115 3.6 14.8 40.650 E
ArmTotal
Demand (Veh/hr)
Junction Arrivals
(Veh)
Circulating flow
(Veh/hr)
Capacity (Veh/hr)
RFCThroughput
(Veh/hr)
Throughput (exit side) (Veh/hr)
Start queue (Veh)
End queue (Veh)
Delay (s)
LOS
A - A595 north 806 201 553 981 0.822 805 749 4.0 4.3 20.141 C
B - B5295 357 89 1002 885 0.403 357 356 0.7 0.7 6.811 A
C - Homewood Rd 340 85 949 508 0.670 340 409 1.9 2.0 21.322 C
D - A595 south 1157 289 165 1175 0.985 1137 1124 14.8 19.8 63.197 F
ArmTotal
Demand (Veh/hr)
Junction Arrivals
(Veh)
Circulating flow
(Veh/hr)
Capacity (Veh/hr)
RFCThroughput
(Veh/hr)
Throughput (exit side) (Veh/hr)
Start queue (Veh)
End queue (Veh)
Delay (s)
LOS
A - A595 north 658 165 490 1014 0.649 668 654 4.3 1.9 10.662 B
B - B5295 291 73 842 987 0.295 292 315 0.7 0.4 5.187 A
C - Homewood Rd 278 69 784 586 0.474 282 350 2.0 0.9 12.002 B
D - A595 south 945 236 137 1191 0.794 1007 929 19.8 4.2 24.784 C
ArmTotal
Demand (Veh/hr)
Junction Arrivals
(Veh)
Circulating flow
(Veh/hr)
Capacity (Veh/hr)
RFCThroughput
(Veh/hr)
Throughput (exit side) (Veh/hr)
Start queue (Veh)
End queue (Veh)
Delay (s)
LOS
A - A595 north 551 138 389 1067 0.516 554 525 1.9 1.1 7.066 A
B - B5295 244 61 693 1082 0.225 244 250 0.4 0.3 4.301 A
C - Homewood Rd 233 58 653 648 0.359 234 285 0.9 0.6 8.734 A
D - A595 south 791 198 114 1203 0.658 800 773 4.2 2.0 9.116 A
Page 7 of 25
17/08/2021file:///C:/Users/semsons/AppData/Local/TempA595%20-%20B5295%20-%20Home...
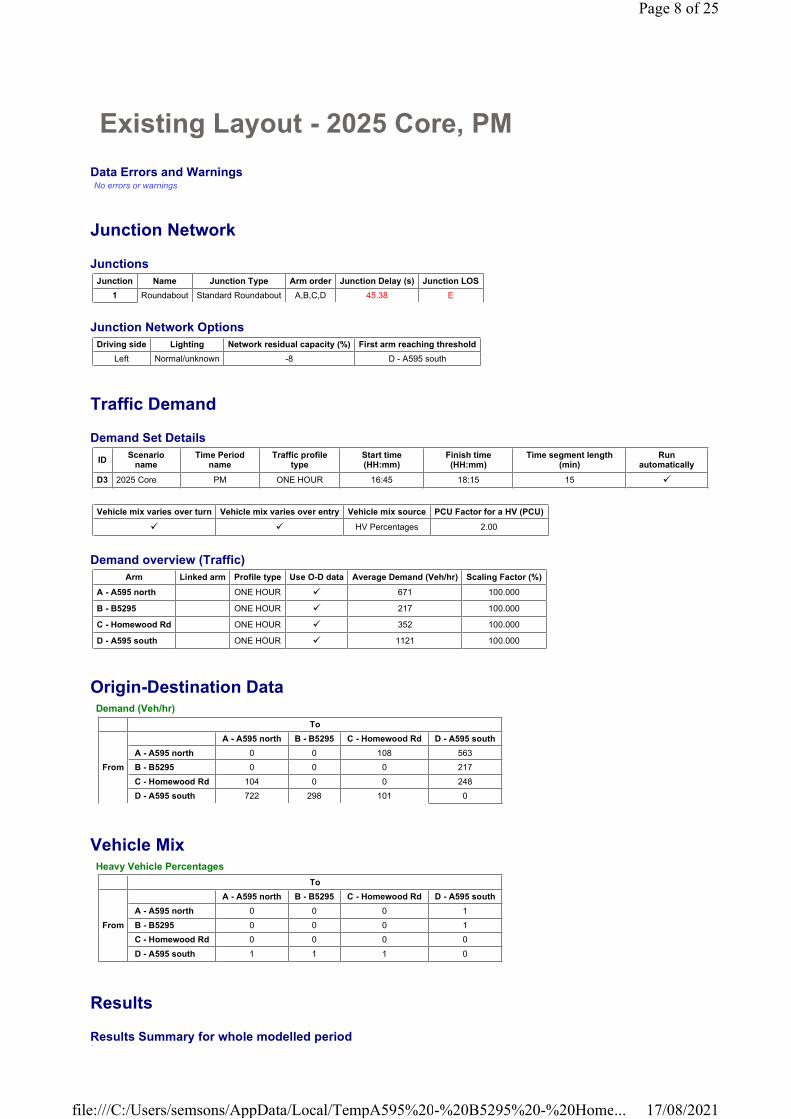
Existing Layout - 2025 Core, PM
Data Errors and WarningsNo errors or warnings
Junction Network
Junctions
Junction Network Options
Traffic Demand
Demand Set Details
Demand overview (Traffic)
Origin-Destination Data
Vehicle Mix
Results
Results Summary for whole modelled period
Junction Name Junction Type Arm order Junction Delay (s) Junction LOS
1 Roundabout Standard Roundabout A,B,C,D 45.38 E
Driving side Lighting Network residual capacity (%) First arm reaching threshold
Left Normal/unknown -8 D - A595 south
IDScenario
nameTime Period
nameTraffic profile
typeStart time (HH:mm)
Finish time (HH:mm)
Time segment length (min)
Run automatically
D3 2025 Core PM ONE HOUR 16:45 18:15 15 �
Vehicle mix varies over turn Vehicle mix varies over entry Vehicle mix source PCU Factor for a HV (PCU)
� � HV Percentages 2.00
Arm Linked arm Profile type Use O-D data Average Demand (Veh/hr) Scaling Factor (%)
A - A595 north ONE HOUR � 671 100.000
B - B5295 ONE HOUR � 217 100.000
C - Homewood Rd ONE HOUR � 352 100.000
D - A595 south ONE HOUR � 1121 100.000
Demand (Veh/hr)
To
From
A - A595 north B - B5295 C - Homewood Rd D - A595 south
A - A595 north 0 0 108 563
B - B5295 0 0 0 217
C - Homewood Rd 104 0 0 248
D - A595 south 722 298 101 0
Heavy Vehicle Percentages
To
From
A - A595 north B - B5295 C - Homewood Rd D - A595 south
A - A595 north 0 0 0 1
B - B5295 0 0 0 1
C - Homewood Rd 0 0 0 0
D - A595 south 1 1 1 0
Page 8 of 25
17/08/2021file:///C:/Users/semsons/AppData/Local/TempA595%20-%20B5295%20-%20Home...
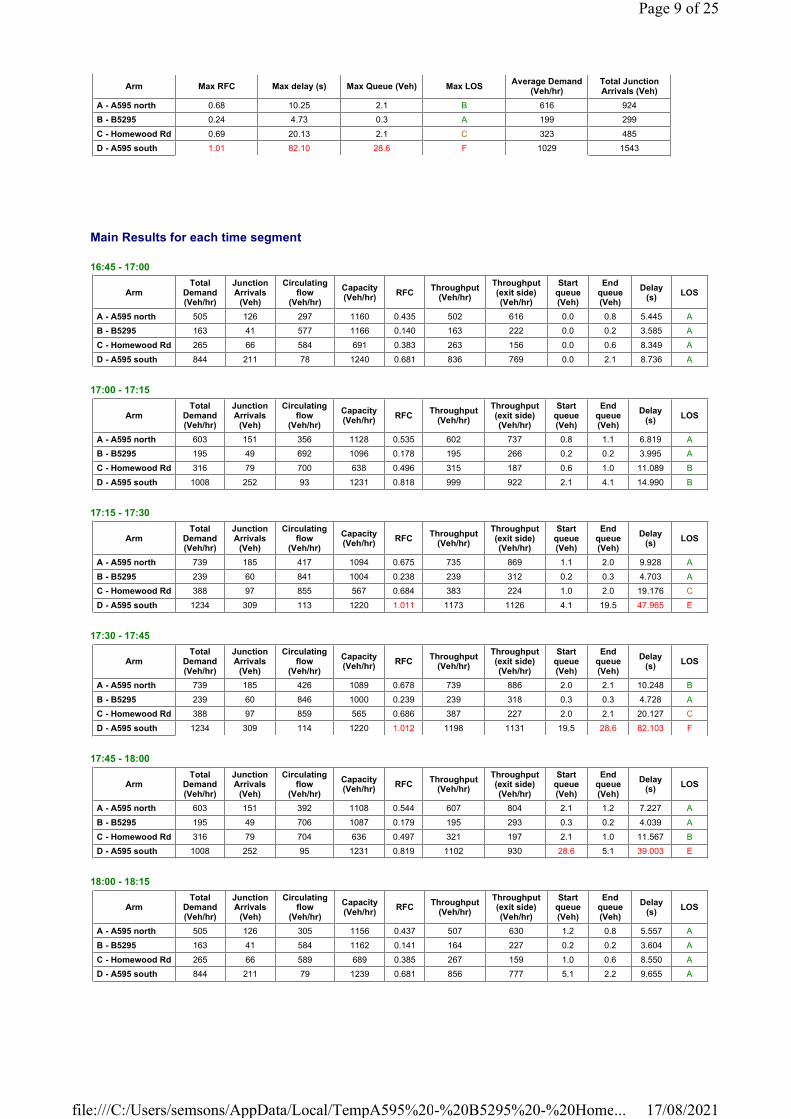
Main Results for each time segment
16:45 - 17:00
17:00 - 17:15
17:15 - 17:30
17:30 - 17:45
17:45 - 18:00
18:00 - 18:15
Arm Max RFC Max delay (s) Max Queue (Veh) Max LOSAverage Demand
(Veh/hr)Total Junction Arrivals (Veh)
A - A595 north 0.68 10.25 2.1 B 616 924
B - B5295 0.24 4.73 0.3 A 199 299
C - Homewood Rd 0.69 20.13 2.1 C 323 485
D - A595 south 1.01 82.10 28.6 F 1029 1543
ArmTotal
Demand (Veh/hr)
Junction Arrivals
(Veh)
Circulating flow
(Veh/hr)
Capacity (Veh/hr)
RFCThroughput
(Veh/hr)
Throughput (exit side) (Veh/hr)
Start queue (Veh)
End queue (Veh)
Delay (s)
LOS
A - A595 north 505 126 297 1160 0.435 502 616 0.0 0.8 5.445 A
B - B5295 163 41 577 1166 0.140 163 222 0.0 0.2 3.585 A
C - Homewood Rd 265 66 584 691 0.383 263 156 0.0 0.6 8.349 A
D - A595 south 844 211 78 1240 0.681 836 769 0.0 2.1 8.736 A
ArmTotal
Demand (Veh/hr)
Junction Arrivals
(Veh)
Circulating flow
(Veh/hr)
Capacity (Veh/hr)
RFCThroughput
(Veh/hr)
Throughput (exit side) (Veh/hr)
Start queue (Veh)
End queue (Veh)
Delay (s)
LOS
A - A595 north 603 151 356 1128 0.535 602 737 0.8 1.1 6.819 A
B - B5295 195 49 692 1096 0.178 195 266 0.2 0.2 3.995 A
C - Homewood Rd 316 79 700 638 0.496 315 187 0.6 1.0 11.089 B
D - A595 south 1008 252 93 1231 0.818 999 922 2.1 4.1 14.990 B
ArmTotal
Demand (Veh/hr)
Junction Arrivals
(Veh)
Circulating flow
(Veh/hr)
Capacity (Veh/hr)
RFCThroughput
(Veh/hr)
Throughput (exit side) (Veh/hr)
Start queue (Veh)
End queue (Veh)
Delay (s)
LOS
A - A595 north 739 185 417 1094 0.675 735 869 1.1 2.0 9.928 A
B - B5295 239 60 841 1004 0.238 239 312 0.2 0.3 4.703 A
C - Homewood Rd 388 97 855 567 0.684 383 224 1.0 2.0 19.176 C
D - A595 south 1234 309 113 1220 1.011 1173 1126 4.1 19.5 47.965 E
ArmTotal
Demand (Veh/hr)
Junction Arrivals
(Veh)
Circulating flow
(Veh/hr)
Capacity (Veh/hr)
RFCThroughput
(Veh/hr)
Throughput (exit side) (Veh/hr)
Start queue (Veh)
End queue (Veh)
Delay (s)
LOS
A - A595 north 739 185 426 1089 0.678 739 886 2.0 2.1 10.248 B
B - B5295 239 60 846 1000 0.239 239 318 0.3 0.3 4.728 A
C - Homewood Rd 388 97 859 565 0.686 387 227 2.0 2.1 20.127 C
D - A595 south 1234 309 114 1220 1.012 1198 1131 19.5 28.6 82.103 F
ArmTotal
Demand (Veh/hr)
Junction Arrivals
(Veh)
Circulating flow
(Veh/hr)
Capacity (Veh/hr)
RFCThroughput
(Veh/hr)
Throughput (exit side) (Veh/hr)
Start queue (Veh)
End queue (Veh)
Delay (s)
LOS
A - A595 north 603 151 392 1108 0.544 607 804 2.1 1.2 7.227 A
B - B5295 195 49 706 1087 0.179 195 293 0.3 0.2 4.039 A
C - Homewood Rd 316 79 704 636 0.497 321 197 2.1 1.0 11.567 B
D - A595 south 1008 252 95 1231 0.819 1102 930 28.6 5.1 39.003 E
ArmTotal
Demand (Veh/hr)
Junction Arrivals
(Veh)
Circulating flow
(Veh/hr)
Capacity (Veh/hr)
RFCThroughput
(Veh/hr)
Throughput (exit side) (Veh/hr)
Start queue (Veh)
End queue (Veh)
Delay (s)
LOS
A - A595 north 505 126 305 1156 0.437 507 630 1.2 0.8 5.557 A
B - B5295 163 41 584 1162 0.141 164 227 0.2 0.2 3.604 A
C - Homewood Rd 265 66 589 689 0.385 267 159 1.0 0.6 8.550 A
D - A595 south 844 211 79 1239 0.681 856 777 5.1 2.2 9.655 A
Page 9 of 25
17/08/2021file:///C:/Users/semsons/AppData/Local/TempA595%20-%20B5295%20-%20Home...
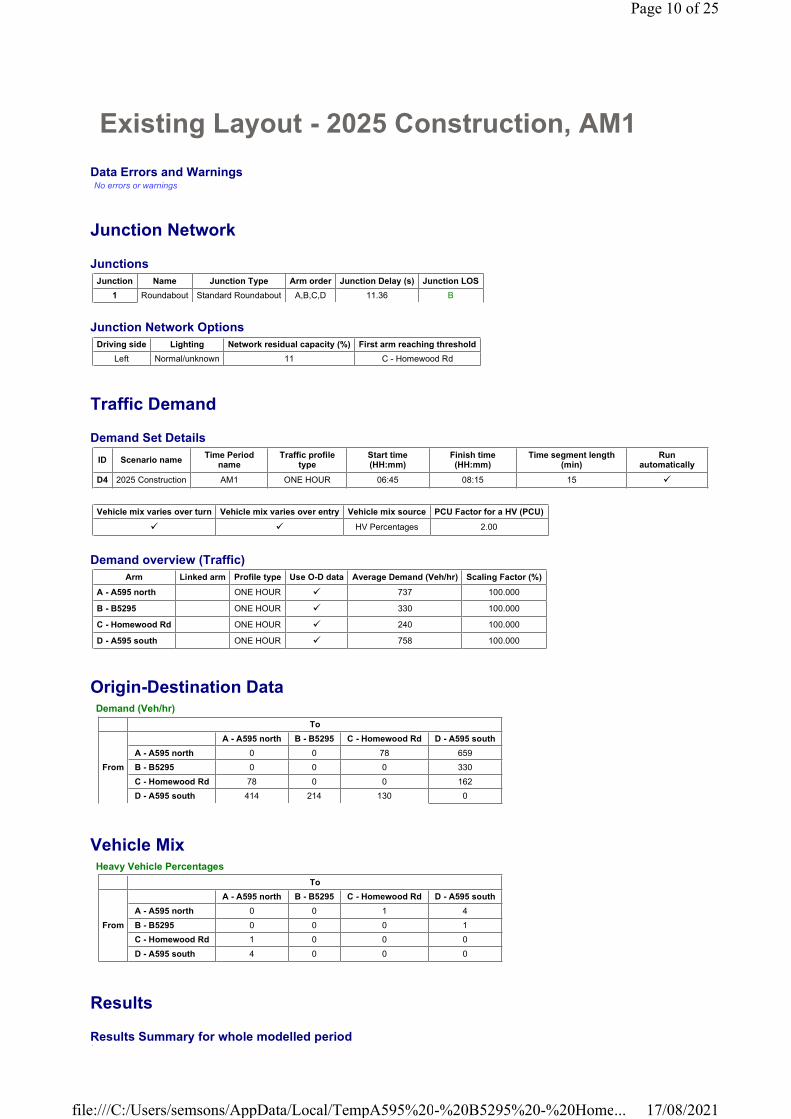
Existing Layout - 2025 Construction, AM1
Data Errors and WarningsNo errors or warnings
Junction Network
Junctions
Junction Network Options
Traffic Demand
Demand Set Details
Demand overview (Traffic)
Origin-Destination Data
Vehicle Mix
Results
Results Summary for whole modelled period
Junction Name Junction Type Arm order Junction Delay (s) Junction LOS
1 Roundabout Standard Roundabout A,B,C,D 11.36 B
Driving side Lighting Network residual capacity (%) First arm reaching threshold
Left Normal/unknown 11 C - Homewood Rd
ID Scenario nameTime Period
nameTraffic profile
typeStart time (HH:mm)
Finish time (HH:mm)
Time segment length (min)
Run automatically
D4 2025 Construction AM1 ONE HOUR 06:45 08:15 15 �
Vehicle mix varies over turn Vehicle mix varies over entry Vehicle mix source PCU Factor for a HV (PCU)
� � HV Percentages 2.00
Arm Linked arm Profile type Use O-D data Average Demand (Veh/hr) Scaling Factor (%)
A - A595 north ONE HOUR � 737 100.000
B - B5295 ONE HOUR � 330 100.000
C - Homewood Rd ONE HOUR � 240 100.000
D - A595 south ONE HOUR � 758 100.000
Demand (Veh/hr)
To
From
A - A595 north B - B5295 C - Homewood Rd D - A595 south
A - A595 north 0 0 78 659
B - B5295 0 0 0 330
C - Homewood Rd 78 0 0 162
D - A595 south 414 214 130 0
Heavy Vehicle Percentages
To
From
A - A595 north B - B5295 C - Homewood Rd D - A595 south
A - A595 north 0 0 1 4
B - B5295 0 0 0 1
C - Homewood Rd 1 0 0 0
D - A595 south 4 0 0 0
Page 10 of 25
17/08/2021file:///C:/Users/semsons/AppData/Local/TempA595%20-%20B5295%20-%20Home...
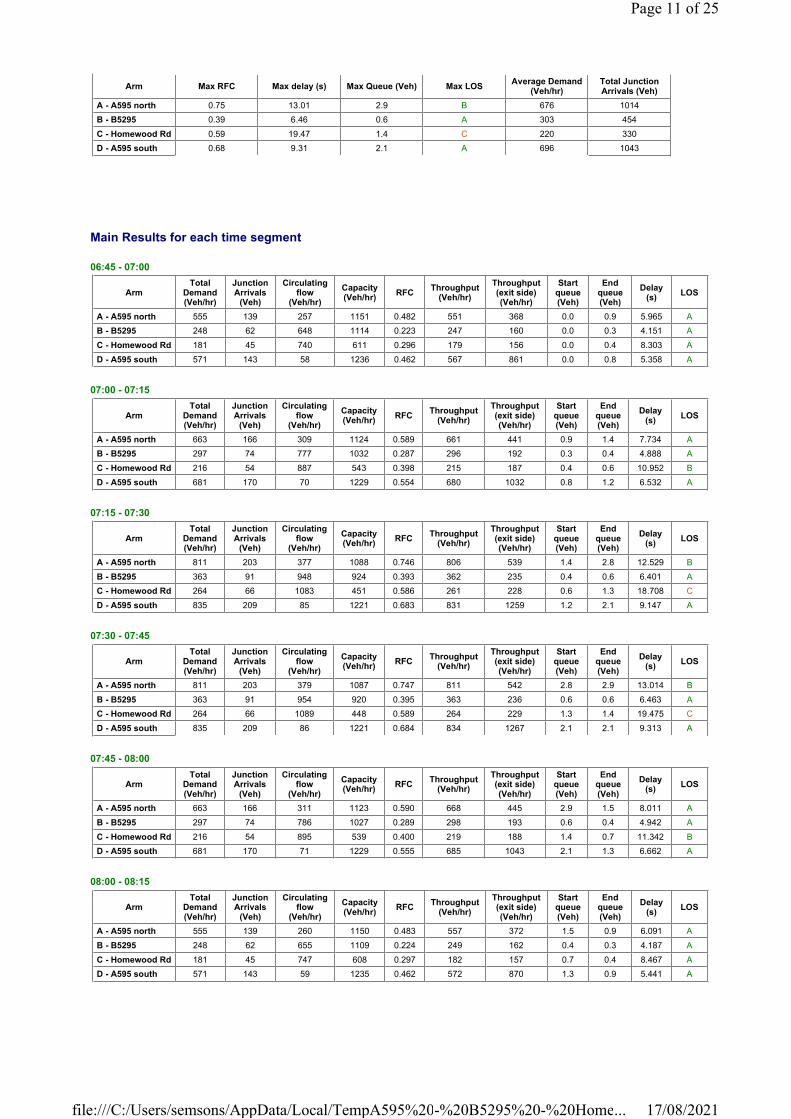
Main Results for each time segment
06:45 - 07:00
07:00 - 07:15
07:15 - 07:30
07:30 - 07:45
07:45 - 08:00
08:00 - 08:15
Arm Max RFC Max delay (s) Max Queue (Veh) Max LOSAverage Demand
(Veh/hr)Total Junction Arrivals (Veh)
A - A595 north 0.75 13.01 2.9 B 676 1014
B - B5295 0.39 6.46 0.6 A 303 454
C - Homewood Rd 0.59 19.47 1.4 C 220 330
D - A595 south 0.68 9.31 2.1 A 696 1043
ArmTotal
Demand (Veh/hr)
Junction Arrivals
(Veh)
Circulating flow
(Veh/hr)
Capacity (Veh/hr)
RFCThroughput
(Veh/hr)
Throughput (exit side) (Veh/hr)
Start queue (Veh)
End queue (Veh)
Delay (s)
LOS
A - A595 north 555 139 257 1151 0.482 551 368 0.0 0.9 5.965 A
B - B5295 248 62 648 1114 0.223 247 160 0.0 0.3 4.151 A
C - Homewood Rd 181 45 740 611 0.296 179 156 0.0 0.4 8.303 A
D - A595 south 571 143 58 1236 0.462 567 861 0.0 0.8 5.358 A
ArmTotal
Demand (Veh/hr)
Junction Arrivals
(Veh)
Circulating flow
(Veh/hr)
Capacity (Veh/hr)
RFCThroughput
(Veh/hr)
Throughput (exit side) (Veh/hr)
Start queue (Veh)
End queue (Veh)
Delay (s)
LOS
A - A595 north 663 166 309 1124 0.589 661 441 0.9 1.4 7.734 A
B - B5295 297 74 777 1032 0.287 296 192 0.3 0.4 4.888 A
C - Homewood Rd 216 54 887 543 0.398 215 187 0.4 0.6 10.952 B
D - A595 south 681 170 70 1229 0.554 680 1032 0.8 1.2 6.532 A
ArmTotal
Demand (Veh/hr)
Junction Arrivals
(Veh)
Circulating flow
(Veh/hr)
Capacity (Veh/hr)
RFCThroughput
(Veh/hr)
Throughput (exit side) (Veh/hr)
Start queue (Veh)
End queue (Veh)
Delay (s)
LOS
A - A595 north 811 203 377 1088 0.746 806 539 1.4 2.8 12.529 B
B - B5295 363 91 948 924 0.393 362 235 0.4 0.6 6.401 A
C - Homewood Rd 264 66 1083 451 0.586 261 228 0.6 1.3 18.708 C
D - A595 south 835 209 85 1221 0.683 831 1259 1.2 2.1 9.147 A
ArmTotal
Demand (Veh/hr)
Junction Arrivals
(Veh)
Circulating flow
(Veh/hr)
Capacity (Veh/hr)
RFCThroughput
(Veh/hr)
Throughput (exit side) (Veh/hr)
Start queue (Veh)
End queue (Veh)
Delay (s)
LOS
A - A595 north 811 203 379 1087 0.747 811 542 2.8 2.9 13.014 B
B - B5295 363 91 954 920 0.395 363 236 0.6 0.6 6.463 A
C - Homewood Rd 264 66 1089 448 0.589 264 229 1.3 1.4 19.475 C
D - A595 south 835 209 86 1221 0.684 834 1267 2.1 2.1 9.313 A
ArmTotal
Demand (Veh/hr)
Junction Arrivals
(Veh)
Circulating flow
(Veh/hr)
Capacity (Veh/hr)
RFCThroughput
(Veh/hr)
Throughput (exit side) (Veh/hr)
Start queue (Veh)
End queue (Veh)
Delay (s)
LOS
A - A595 north 663 166 311 1123 0.590 668 445 2.9 1.5 8.011 A
B - B5295 297 74 786 1027 0.289 298 193 0.6 0.4 4.942 A
C - Homewood Rd 216 54 895 539 0.400 219 188 1.4 0.7 11.342 B
D - A595 south 681 170 71 1229 0.555 685 1043 2.1 1.3 6.662 A
ArmTotal
Demand (Veh/hr)
Junction Arrivals
(Veh)
Circulating flow
(Veh/hr)
Capacity (Veh/hr)
RFCThroughput
(Veh/hr)
Throughput (exit side) (Veh/hr)
Start queue (Veh)
End queue (Veh)
Delay (s)
LOS
A - A595 north 555 139 260 1150 0.483 557 372 1.5 0.9 6.091 A
B - B5295 248 62 655 1109 0.224 249 162 0.4 0.3 4.187 A
C - Homewood Rd 181 45 747 608 0.297 182 157 0.7 0.4 8.467 A
D - A595 south 571 143 59 1235 0.462 572 870 1.3 0.9 5.441 A
Page 11 of 25
17/08/2021file:///C:/Users/semsons/AppData/Local/TempA595%20-%20B5295%20-%20Home...

Existing Layout - 2025 Construction, PM
Data Errors and WarningsNo errors or warnings
Junction Network
Junctions
Junction Network Options
Traffic Demand
Demand Set Details
Demand overview (Traffic)
Origin-Destination Data
Vehicle Mix
Results
Results Summary for whole modelled period
Junction Name Junction Type Arm order Junction Delay (s) Junction LOS
1 Roundabout Standard Roundabout A,B,C,D 44.30 E
Driving side Lighting Network residual capacity (%) First arm reaching threshold
Left Normal/unknown -8 D - A595 south
ID Scenario nameTime Period
nameTraffic profile
typeStart time (HH:mm)
Finish time (HH:mm)
Time segment length (min)
Run automatically
D5 2025 Construction PM ONE HOUR 16:45 18:15 15 �
Vehicle mix varies over turn Vehicle mix varies over entry Vehicle mix source PCU Factor for a HV (PCU)
� � HV Percentages 2.00
Arm Linked arm Profile type Use O-D data Average Demand (Veh/hr) Scaling Factor (%)
A - A595 north ONE HOUR � 674 100.000
B - B5295 ONE HOUR � 213 100.000
C - Homewood Rd ONE HOUR � 345 100.000
D - A595 south ONE HOUR � 1118 100.000
Demand (Veh/hr)
To
From
A - A595 north B - B5295 C - Homewood Rd D - A595 south
A - A595 north 0 0 107 567
B - B5295 0 0 0 213
C - Homewood Rd 104 0 0 241
D - A595 south 717 293 108 0
Heavy Vehicle Percentages
To
From
A - A595 north B - B5295 C - Homewood Rd D - A595 south
A - A595 north 0 0 0 1
B - B5295 0 0 0 1
C - Homewood Rd 0 0 0 0
D - A595 south 1 1 1 0
Page 12 of 25
17/08/2021file:///C:/Users/semsons/AppData/Local/TempA595%20-%20B5295%20-%20Home...
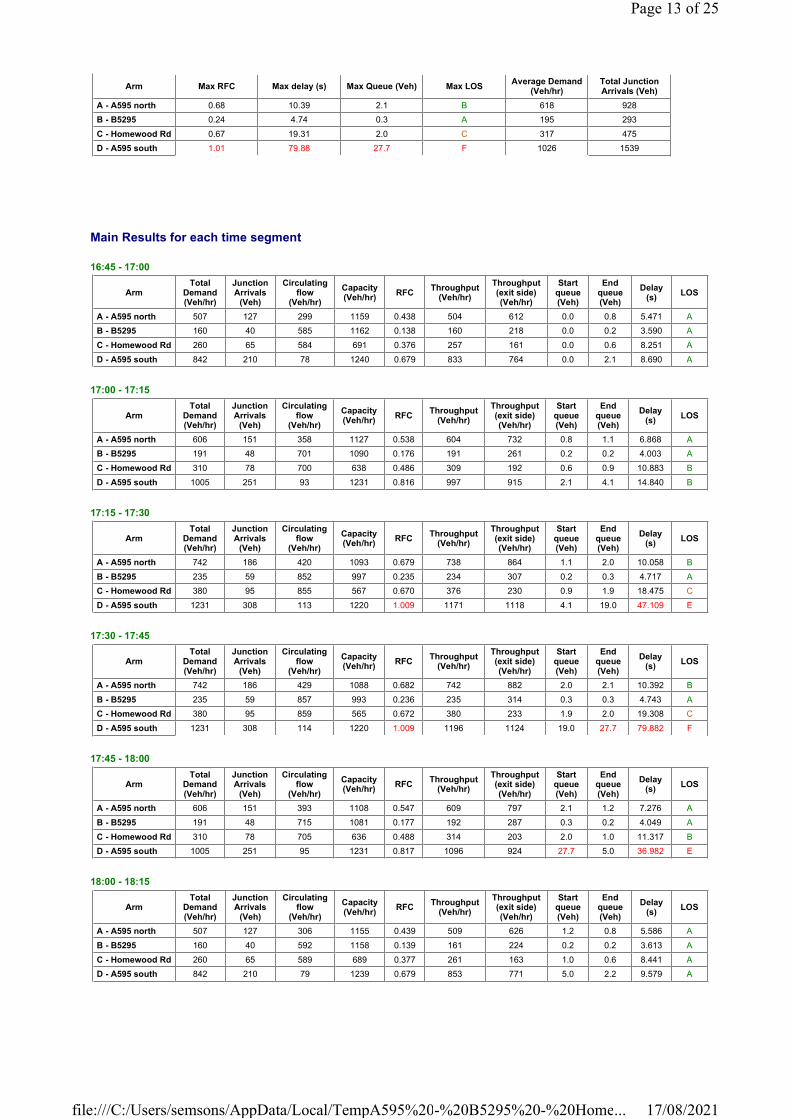
Main Results for each time segment
16:45 - 17:00
17:00 - 17:15
17:15 - 17:30
17:30 - 17:45
17:45 - 18:00
18:00 - 18:15
Arm Max RFC Max delay (s) Max Queue (Veh) Max LOSAverage Demand
(Veh/hr)Total Junction Arrivals (Veh)
A - A595 north 0.68 10.39 2.1 B 618 928
B - B5295 0.24 4.74 0.3 A 195 293
C - Homewood Rd 0.67 19.31 2.0 C 317 475
D - A595 south 1.01 79.88 27.7 F 1026 1539
ArmTotal
Demand (Veh/hr)
Junction Arrivals
(Veh)
Circulating flow
(Veh/hr)
Capacity (Veh/hr)
RFCThroughput
(Veh/hr)
Throughput (exit side) (Veh/hr)
Start queue (Veh)
End queue (Veh)
Delay (s)
LOS
A - A595 north 507 127 299 1159 0.438 504 612 0.0 0.8 5.471 A
B - B5295 160 40 585 1162 0.138 160 218 0.0 0.2 3.590 A
C - Homewood Rd 260 65 584 691 0.376 257 161 0.0 0.6 8.251 A
D - A595 south 842 210 78 1240 0.679 833 764 0.0 2.1 8.690 A
ArmTotal
Demand (Veh/hr)
Junction Arrivals
(Veh)
Circulating flow
(Veh/hr)
Capacity (Veh/hr)
RFCThroughput
(Veh/hr)
Throughput (exit side) (Veh/hr)
Start queue (Veh)
End queue (Veh)
Delay (s)
LOS
A - A595 north 606 151 358 1127 0.538 604 732 0.8 1.1 6.868 A
B - B5295 191 48 701 1090 0.176 191 261 0.2 0.2 4.003 A
C - Homewood Rd 310 78 700 638 0.486 309 192 0.6 0.9 10.883 B
D - A595 south 1005 251 93 1231 0.816 997 915 2.1 4.1 14.840 B
ArmTotal
Demand (Veh/hr)
Junction Arrivals
(Veh)
Circulating flow
(Veh/hr)
Capacity (Veh/hr)
RFCThroughput
(Veh/hr)
Throughput (exit side) (Veh/hr)
Start queue (Veh)
End queue (Veh)
Delay (s)
LOS
A - A595 north 742 186 420 1093 0.679 738 864 1.1 2.0 10.058 B
B - B5295 235 59 852 997 0.235 234 307 0.2 0.3 4.717 A
C - Homewood Rd 380 95 855 567 0.670 376 230 0.9 1.9 18.475 C
D - A595 south 1231 308 113 1220 1.009 1171 1118 4.1 19.0 47.109 E
ArmTotal
Demand (Veh/hr)
Junction Arrivals
(Veh)
Circulating flow
(Veh/hr)
Capacity (Veh/hr)
RFCThroughput
(Veh/hr)
Throughput (exit side) (Veh/hr)
Start queue (Veh)
End queue (Veh)
Delay (s)
LOS
A - A595 north 742 186 429 1088 0.682 742 882 2.0 2.1 10.392 B
B - B5295 235 59 857 993 0.236 235 314 0.3 0.3 4.743 A
C - Homewood Rd 380 95 859 565 0.672 380 233 1.9 2.0 19.308 C
D - A595 south 1231 308 114 1220 1.009 1196 1124 19.0 27.7 79.882 F
ArmTotal
Demand (Veh/hr)
Junction Arrivals
(Veh)
Circulating flow
(Veh/hr)
Capacity (Veh/hr)
RFCThroughput
(Veh/hr)
Throughput (exit side) (Veh/hr)
Start queue (Veh)
End queue (Veh)
Delay (s)
LOS
A - A595 north 606 151 393 1108 0.547 609 797 2.1 1.2 7.276 A
B - B5295 191 48 715 1081 0.177 192 287 0.3 0.2 4.049 A
C - Homewood Rd 310 78 705 636 0.488 314 203 2.0 1.0 11.317 B
D - A595 south 1005 251 95 1231 0.817 1096 924 27.7 5.0 36.982 E
ArmTotal
Demand (Veh/hr)
Junction Arrivals
(Veh)
Circulating flow
(Veh/hr)
Capacity (Veh/hr)
RFCThroughput
(Veh/hr)
Throughput (exit side) (Veh/hr)
Start queue (Veh)
End queue (Veh)
Delay (s)
LOS
A - A595 north 507 127 306 1155 0.439 509 626 1.2 0.8 5.586 A
B - B5295 160 40 592 1158 0.139 161 224 0.2 0.2 3.613 A
C - Homewood Rd 260 65 589 689 0.377 261 163 1.0 0.6 8.441 A
D - A595 south 842 210 79 1239 0.679 853 771 5.0 2.2 9.579 A
Page 13 of 25
17/08/2021file:///C:/Users/semsons/AppData/Local/TempA595%20-%20B5295%20-%20Home...

Existing Layout - 2025 Operation, AM2
Data Errors and WarningsNo errors or warnings
Junction Network
Junctions
Junction Network Options
Traffic Demand
Demand Set Details
Demand overview (Traffic)
Origin-Destination Data
Vehicle Mix
Results
Results Summary for whole modelled period
Junction Name Junction Type Arm order Junction Delay (s) Junction LOS
1 Roundabout Standard Roundabout A,B,C,D 36.33 E
Driving side Lighting Network residual capacity (%) First arm reaching threshold
Left Normal/unknown -6 D - A595 south
IDScenario
nameTime Period
nameTraffic profile
typeStart time (HH:mm)
Finish time (HH:mm)
Time segment length (min)
Run automatically
D6 2025 Operation AM2 ONE HOUR 07:45 09:15 15 �
Vehicle mix varies over turn Vehicle mix varies over entry Vehicle mix source PCU Factor for a HV (PCU)
� � HV Percentages 2.00
Arm Linked arm Profile type Use O-D data Average Demand (Veh/hr) Scaling Factor (%)
A - A595 north ONE HOUR � 731 100.000
B - B5295 ONE HOUR � 317 100.000
C - Homewood Rd ONE HOUR � 317 100.000
D - A595 south ONE HOUR � 1049 100.000
Demand (Veh/hr)
To
From
A - A595 north B - B5295 C - Homewood Rd D - A595 south
A - A595 north 0 0 188 543
B - B5295 0 0 0 317
C - Homewood Rd 147 0 0 170
D - A595 south 539 331 179 0
Heavy Vehicle Percentages
To
From
A - A595 north B - B5295 C - Homewood Rd D - A595 south
A - A595 north 0 0 2 6
B - B5295 0 0 0 1
C - Homewood Rd 1 0 0 0
D - A595 south 4 1 0 0
Page 14 of 25
17/08/2021file:///C:/Users/semsons/AppData/Local/TempA595%20-%20B5295%20-%20Home...
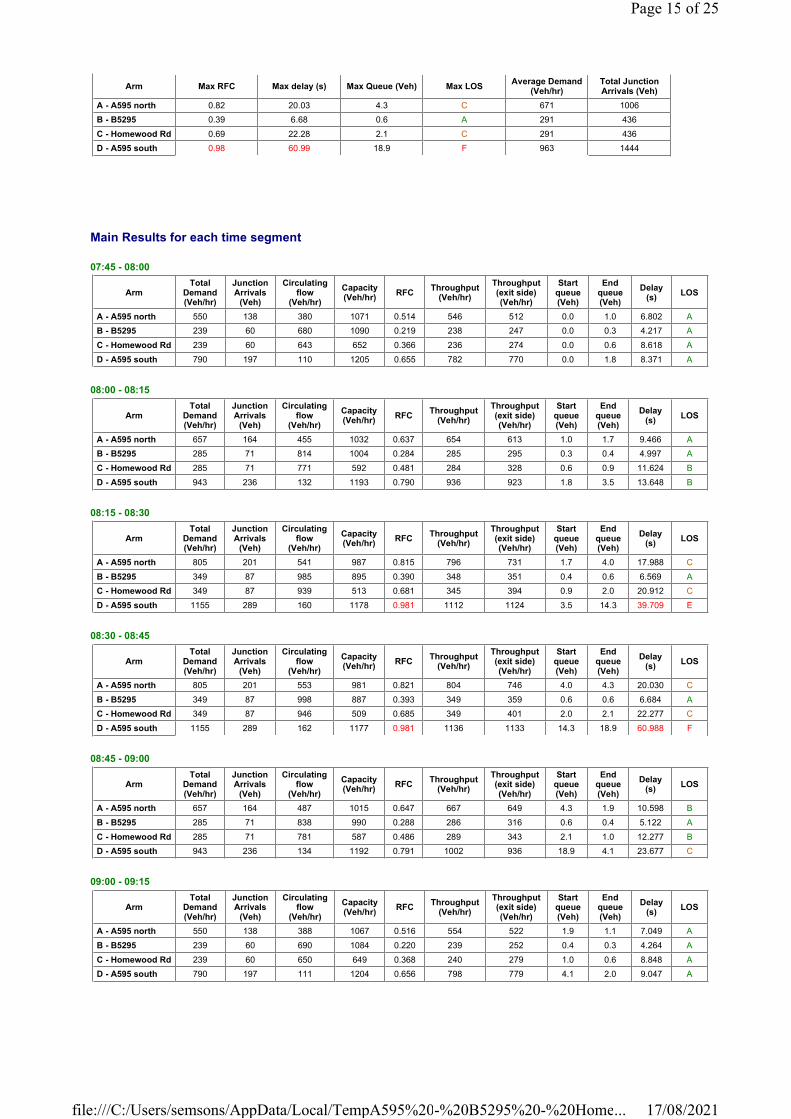
Main Results for each time segment
07:45 - 08:00
08:00 - 08:15
08:15 - 08:30
08:30 - 08:45
08:45 - 09:00
09:00 - 09:15
Arm Max RFC Max delay (s) Max Queue (Veh) Max LOSAverage Demand
(Veh/hr)Total Junction Arrivals (Veh)
A - A595 north 0.82 20.03 4.3 C 671 1006
B - B5295 0.39 6.68 0.6 A 291 436
C - Homewood Rd 0.69 22.28 2.1 C 291 436
D - A595 south 0.98 60.99 18.9 F 963 1444
ArmTotal
Demand (Veh/hr)
Junction Arrivals
(Veh)
Circulating flow
(Veh/hr)
Capacity (Veh/hr)
RFCThroughput
(Veh/hr)
Throughput (exit side) (Veh/hr)
Start queue (Veh)
End queue (Veh)
Delay (s)
LOS
A - A595 north 550 138 380 1071 0.514 546 512 0.0 1.0 6.802 A
B - B5295 239 60 680 1090 0.219 238 247 0.0 0.3 4.217 A
C - Homewood Rd 239 60 643 652 0.366 236 274 0.0 0.6 8.618 A
D - A595 south 790 197 110 1205 0.655 782 770 0.0 1.8 8.371 A
ArmTotal
Demand (Veh/hr)
Junction Arrivals
(Veh)
Circulating flow
(Veh/hr)
Capacity (Veh/hr)
RFCThroughput
(Veh/hr)
Throughput (exit side) (Veh/hr)
Start queue (Veh)
End queue (Veh)
Delay (s)
LOS
A - A595 north 657 164 455 1032 0.637 654 613 1.0 1.7 9.466 A
B - B5295 285 71 814 1004 0.284 285 295 0.3 0.4 4.997 A
C - Homewood Rd 285 71 771 592 0.481 284 328 0.6 0.9 11.624 B
D - A595 south 943 236 132 1193 0.790 936 923 1.8 3.5 13.648 B
ArmTotal
Demand (Veh/hr)
Junction Arrivals
(Veh)
Circulating flow
(Veh/hr)
Capacity (Veh/hr)
RFCThroughput
(Veh/hr)
Throughput (exit side) (Veh/hr)
Start queue (Veh)
End queue (Veh)
Delay (s)
LOS
A - A595 north 805 201 541 987 0.815 796 731 1.7 4.0 17.988 C
B - B5295 349 87 985 895 0.390 348 351 0.4 0.6 6.569 A
C - Homewood Rd 349 87 939 513 0.681 345 394 0.9 2.0 20.912 C
D - A595 south 1155 289 160 1178 0.981 1112 1124 3.5 14.3 39.709 E
ArmTotal
Demand (Veh/hr)
Junction Arrivals
(Veh)
Circulating flow
(Veh/hr)
Capacity (Veh/hr)
RFCThroughput
(Veh/hr)
Throughput (exit side) (Veh/hr)
Start queue (Veh)
End queue (Veh)
Delay (s)
LOS
A - A595 north 805 201 553 981 0.821 804 746 4.0 4.3 20.030 C
B - B5295 349 87 998 887 0.393 349 359 0.6 0.6 6.684 A
C - Homewood Rd 349 87 946 509 0.685 349 401 2.0 2.1 22.277 C
D - A595 south 1155 289 162 1177 0.981 1136 1133 14.3 18.9 60.988 F
ArmTotal
Demand (Veh/hr)
Junction Arrivals
(Veh)
Circulating flow
(Veh/hr)
Capacity (Veh/hr)
RFCThroughput
(Veh/hr)
Throughput (exit side) (Veh/hr)
Start queue (Veh)
End queue (Veh)
Delay (s)
LOS
A - A595 north 657 164 487 1015 0.647 667 649 4.3 1.9 10.598 B
B - B5295 285 71 838 990 0.288 286 316 0.6 0.4 5.122 A
C - Homewood Rd 285 71 781 587 0.486 289 343 2.1 1.0 12.277 B
D - A595 south 943 236 134 1192 0.791 1002 936 18.9 4.1 23.677 C
ArmTotal
Demand (Veh/hr)
Junction Arrivals
(Veh)
Circulating flow
(Veh/hr)
Capacity (Veh/hr)
RFCThroughput
(Veh/hr)
Throughput (exit side) (Veh/hr)
Start queue (Veh)
End queue (Veh)
Delay (s)
LOS
A - A595 north 550 138 388 1067 0.516 554 522 1.9 1.1 7.049 A
B - B5295 239 60 690 1084 0.220 239 252 0.4 0.3 4.264 A
C - Homewood Rd 239 60 650 649 0.368 240 279 1.0 0.6 8.848 A
D - A595 south 790 197 111 1204 0.656 798 779 4.1 2.0 9.047 A
Page 15 of 25
17/08/2021file:///C:/Users/semsons/AppData/Local/TempA595%20-%20B5295%20-%20Home...
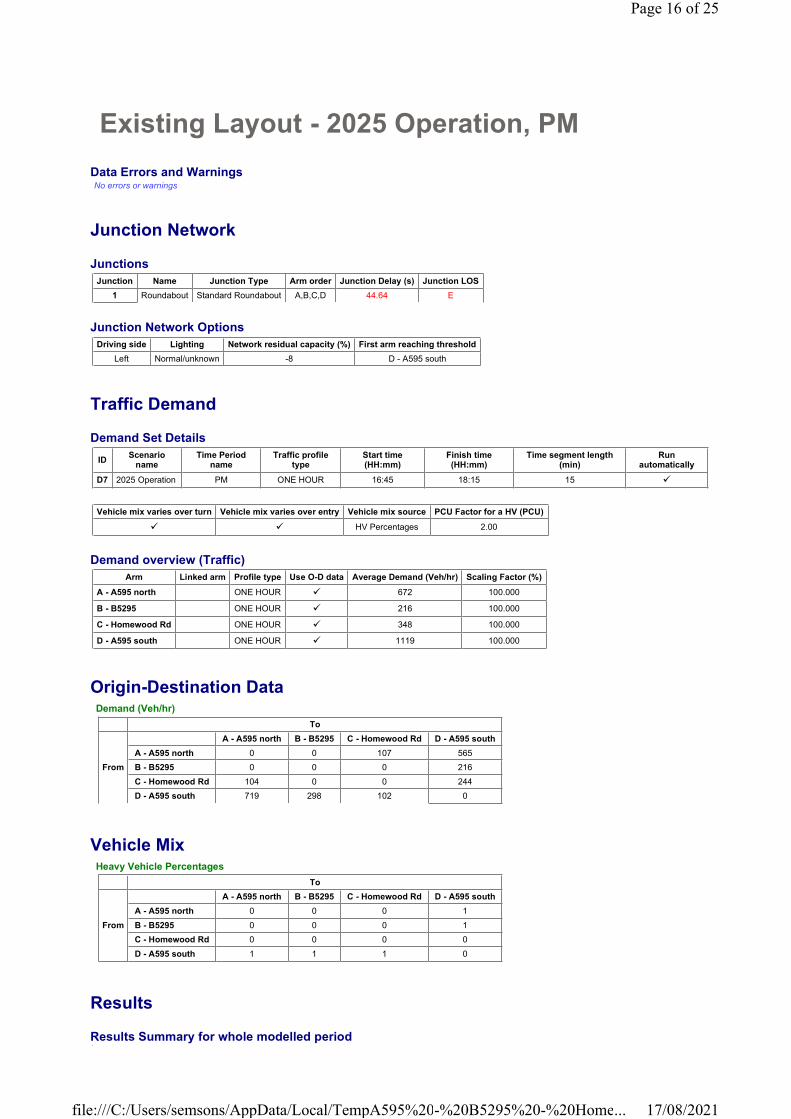
Existing Layout - 2025 Operation, PM
Data Errors and WarningsNo errors or warnings
Junction Network
Junctions
Junction Network Options
Traffic Demand
Demand Set Details
Demand overview (Traffic)
Origin-Destination Data
Vehicle Mix
Results
Results Summary for whole modelled period
Junction Name Junction Type Arm order Junction Delay (s) Junction LOS
1 Roundabout Standard Roundabout A,B,C,D 44.64 E
Driving side Lighting Network residual capacity (%) First arm reaching threshold
Left Normal/unknown -8 D - A595 south
IDScenario
nameTime Period
nameTraffic profile
typeStart time (HH:mm)
Finish time (HH:mm)
Time segment length (min)
Run automatically
D7 2025 Operation PM ONE HOUR 16:45 18:15 15 �
Vehicle mix varies over turn Vehicle mix varies over entry Vehicle mix source PCU Factor for a HV (PCU)
� � HV Percentages 2.00
Arm Linked arm Profile type Use O-D data Average Demand (Veh/hr) Scaling Factor (%)
A - A595 north ONE HOUR � 672 100.000
B - B5295 ONE HOUR � 216 100.000
C - Homewood Rd ONE HOUR � 348 100.000
D - A595 south ONE HOUR � 1119 100.000
Demand (Veh/hr)
To
From
A - A595 north B - B5295 C - Homewood Rd D - A595 south
A - A595 north 0 0 107 565
B - B5295 0 0 0 216
C - Homewood Rd 104 0 0 244
D - A595 south 719 298 102 0
Heavy Vehicle Percentages
To
From
A - A595 north B - B5295 C - Homewood Rd D - A595 south
A - A595 north 0 0 0 1
B - B5295 0 0 0 1
C - Homewood Rd 0 0 0 0
D - A595 south 1 1 1 0
Page 16 of 25
17/08/2021file:///C:/Users/semsons/AppData/Local/TempA595%20-%20B5295%20-%20Home...
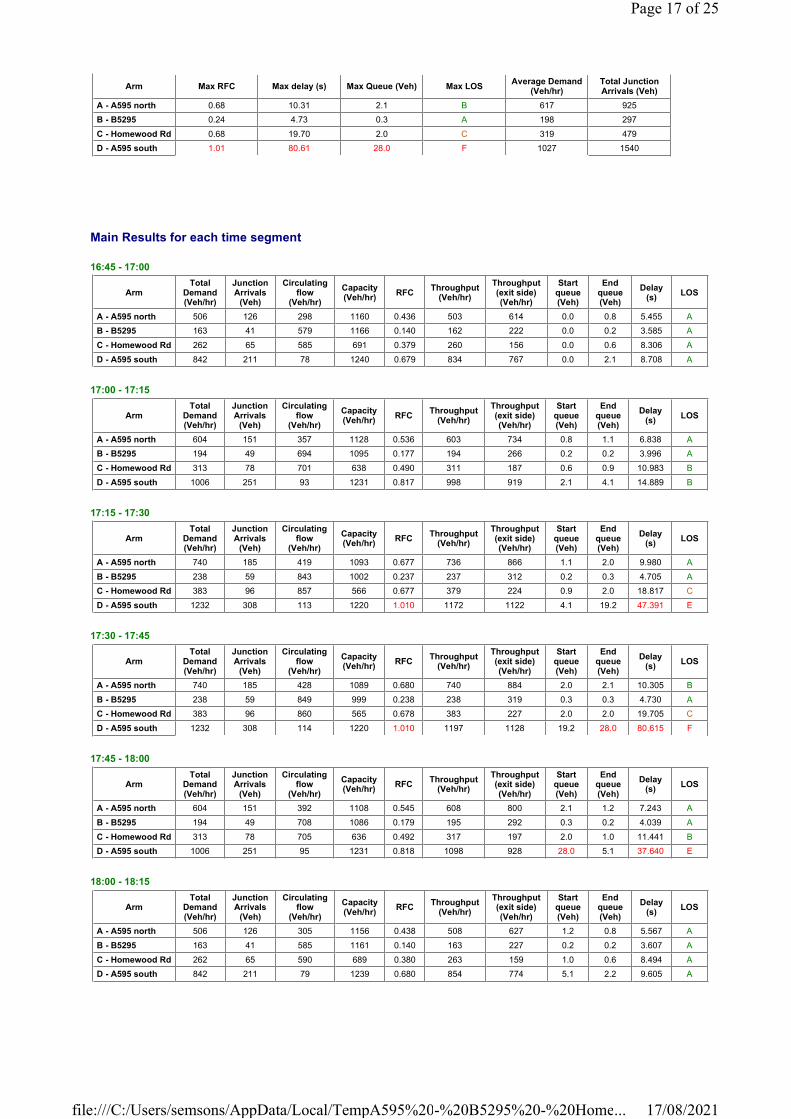
Main Results for each time segment
16:45 - 17:00
17:00 - 17:15
17:15 - 17:30
17:30 - 17:45
17:45 - 18:00
18:00 - 18:15
Arm Max RFC Max delay (s) Max Queue (Veh) Max LOSAverage Demand
(Veh/hr)Total Junction Arrivals (Veh)
A - A595 north 0.68 10.31 2.1 B 617 925
B - B5295 0.24 4.73 0.3 A 198 297
C - Homewood Rd 0.68 19.70 2.0 C 319 479
D - A595 south 1.01 80.61 28.0 F 1027 1540
ArmTotal
Demand (Veh/hr)
Junction Arrivals
(Veh)
Circulating flow
(Veh/hr)
Capacity (Veh/hr)
RFCThroughput
(Veh/hr)
Throughput (exit side) (Veh/hr)
Start queue (Veh)
End queue (Veh)
Delay (s)
LOS
A - A595 north 506 126 298 1160 0.436 503 614 0.0 0.8 5.455 A
B - B5295 163 41 579 1166 0.140 162 222 0.0 0.2 3.585 A
C - Homewood Rd 262 65 585 691 0.379 260 156 0.0 0.6 8.306 A
D - A595 south 842 211 78 1240 0.679 834 767 0.0 2.1 8.708 A
ArmTotal
Demand (Veh/hr)
Junction Arrivals
(Veh)
Circulating flow
(Veh/hr)
Capacity (Veh/hr)
RFCThroughput
(Veh/hr)
Throughput (exit side) (Veh/hr)
Start queue (Veh)
End queue (Veh)
Delay (s)
LOS
A - A595 north 604 151 357 1128 0.536 603 734 0.8 1.1 6.838 A
B - B5295 194 49 694 1095 0.177 194 266 0.2 0.2 3.996 A
C - Homewood Rd 313 78 701 638 0.490 311 187 0.6 0.9 10.983 B
D - A595 south 1006 251 93 1231 0.817 998 919 2.1 4.1 14.889 B
ArmTotal
Demand (Veh/hr)
Junction Arrivals
(Veh)
Circulating flow
(Veh/hr)
Capacity (Veh/hr)
RFCThroughput
(Veh/hr)
Throughput (exit side) (Veh/hr)
Start queue (Veh)
End queue (Veh)
Delay (s)
LOS
A - A595 north 740 185 419 1093 0.677 736 866 1.1 2.0 9.980 A
B - B5295 238 59 843 1002 0.237 237 312 0.2 0.3 4.705 A
C - Homewood Rd 383 96 857 566 0.677 379 224 0.9 2.0 18.817 C
D - A595 south 1232 308 113 1220 1.010 1172 1122 4.1 19.2 47.391 E
ArmTotal
Demand (Veh/hr)
Junction Arrivals
(Veh)
Circulating flow
(Veh/hr)
Capacity (Veh/hr)
RFCThroughput
(Veh/hr)
Throughput (exit side) (Veh/hr)
Start queue (Veh)
End queue (Veh)
Delay (s)
LOS
A - A595 north 740 185 428 1089 0.680 740 884 2.0 2.1 10.305 B
B - B5295 238 59 849 999 0.238 238 319 0.3 0.3 4.730 A
C - Homewood Rd 383 96 860 565 0.678 383 227 2.0 2.0 19.705 C
D - A595 south 1232 308 114 1220 1.010 1197 1128 19.2 28.0 80.615 F
ArmTotal
Demand (Veh/hr)
Junction Arrivals
(Veh)
Circulating flow
(Veh/hr)
Capacity (Veh/hr)
RFCThroughput
(Veh/hr)
Throughput (exit side) (Veh/hr)
Start queue (Veh)
End queue (Veh)
Delay (s)
LOS
A - A595 north 604 151 392 1108 0.545 608 800 2.1 1.2 7.243 A
B - B5295 194 49 708 1086 0.179 195 292 0.3 0.2 4.039 A
C - Homewood Rd 313 78 705 636 0.492 317 197 2.0 1.0 11.441 B
D - A595 south 1006 251 95 1231 0.818 1098 928 28.0 5.1 37.640 E
ArmTotal
Demand (Veh/hr)
Junction Arrivals
(Veh)
Circulating flow
(Veh/hr)
Capacity (Veh/hr)
RFCThroughput
(Veh/hr)
Throughput (exit side) (Veh/hr)
Start queue (Veh)
End queue (Veh)
Delay (s)
LOS
A - A595 north 506 126 305 1156 0.438 508 627 1.2 0.8 5.567 A
B - B5295 163 41 585 1161 0.140 163 227 0.2 0.2 3.607 A
C - Homewood Rd 262 65 590 689 0.380 263 159 1.0 0.6 8.494 A
D - A595 south 842 211 79 1239 0.680 854 774 5.1 2.2 9.605 A
Page 17 of 25
17/08/2021file:///C:/Users/semsons/AppData/Local/TempA595%20-%20B5295%20-%20Home...
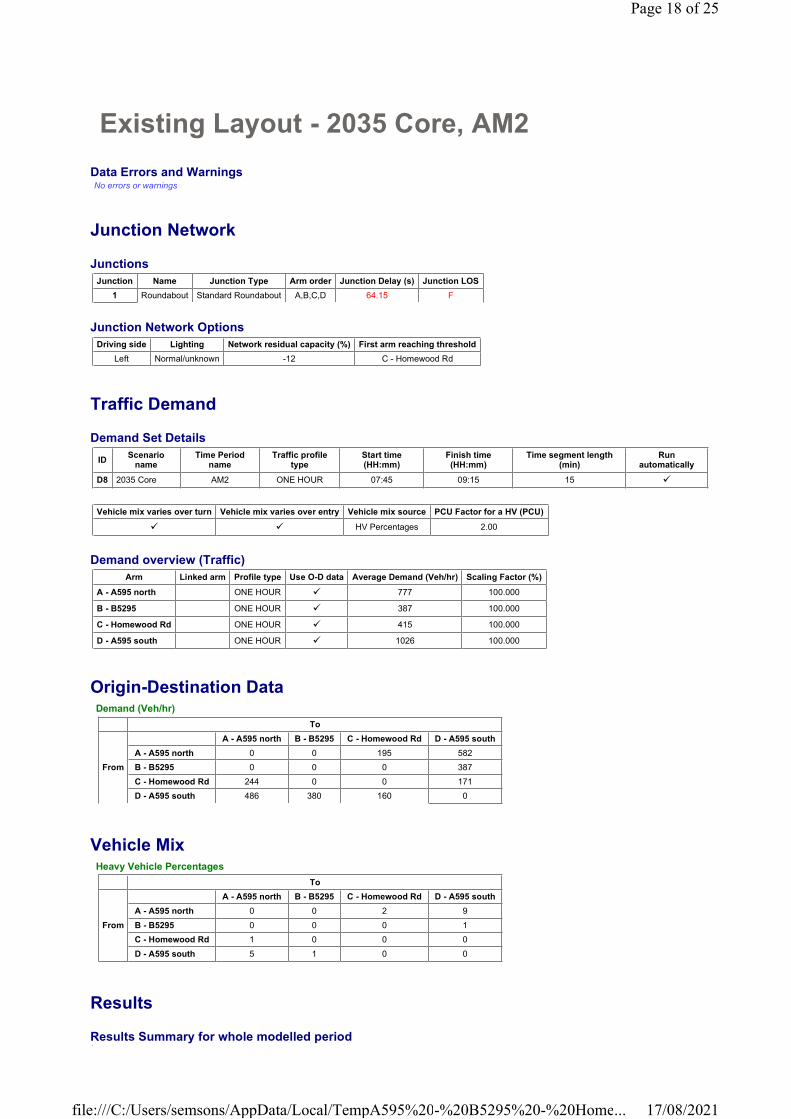
Existing Layout - 2035 Core, AM2
Data Errors and WarningsNo errors or warnings
Junction Network
Junctions
Junction Network Options
Traffic Demand
Demand Set Details
Demand overview (Traffic)
Origin-Destination Data
Vehicle Mix
Results
Results Summary for whole modelled period
Junction Name Junction Type Arm order Junction Delay (s) Junction LOS
1 Roundabout Standard Roundabout A,B,C,D 64.15 F
Driving side Lighting Network residual capacity (%) First arm reaching threshold
Left Normal/unknown -12 C - Homewood Rd
IDScenario
nameTime Period
nameTraffic profile
typeStart time (HH:mm)
Finish time (HH:mm)
Time segment length (min)
Run automatically
D8 2035 Core AM2 ONE HOUR 07:45 09:15 15 �
Vehicle mix varies over turn Vehicle mix varies over entry Vehicle mix source PCU Factor for a HV (PCU)
� � HV Percentages 2.00
Arm Linked arm Profile type Use O-D data Average Demand (Veh/hr) Scaling Factor (%)
A - A595 north ONE HOUR � 777 100.000
B - B5295 ONE HOUR � 387 100.000
C - Homewood Rd ONE HOUR � 415 100.000
D - A595 south ONE HOUR � 1026 100.000
Demand (Veh/hr)
To
From
A - A595 north B - B5295 C - Homewood Rd D - A595 south
A - A595 north 0 0 195 582
B - B5295 0 0 0 387
C - Homewood Rd 244 0 0 171
D - A595 south 486 380 160 0
Heavy Vehicle Percentages
To
From
A - A595 north B - B5295 C - Homewood Rd D - A595 south
A - A595 north 0 0 2 9
B - B5295 0 0 0 1
C - Homewood Rd 1 0 0 0
D - A595 south 5 1 0 0
Page 18 of 25
17/08/2021file:///C:/Users/semsons/AppData/Local/TempA595%20-%20B5295%20-%20Home...
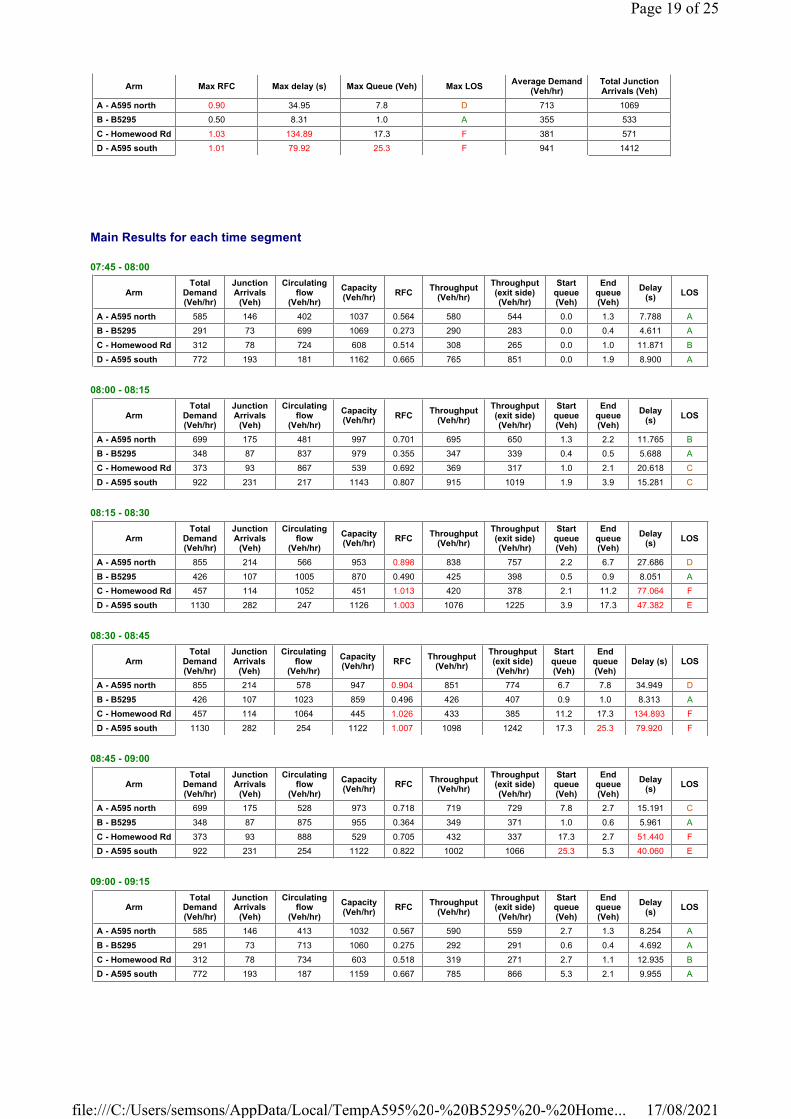
Main Results for each time segment
07:45 - 08:00
08:00 - 08:15
08:15 - 08:30
08:30 - 08:45
08:45 - 09:00
09:00 - 09:15
Arm Max RFC Max delay (s) Max Queue (Veh) Max LOSAverage Demand
(Veh/hr)Total Junction Arrivals (Veh)
A - A595 north 0.90 34.95 7.8 D 713 1069
B - B5295 0.50 8.31 1.0 A 355 533
C - Homewood Rd 1.03 134.89 17.3 F 381 571
D - A595 south 1.01 79.92 25.3 F 941 1412
ArmTotal
Demand (Veh/hr)
Junction Arrivals
(Veh)
Circulating flow
(Veh/hr)
Capacity (Veh/hr)
RFCThroughput
(Veh/hr)
Throughput (exit side) (Veh/hr)
Start queue (Veh)
End queue (Veh)
Delay (s)
LOS
A - A595 north 585 146 402 1037 0.564 580 544 0.0 1.3 7.788 A
B - B5295 291 73 699 1069 0.273 290 283 0.0 0.4 4.611 A
C - Homewood Rd 312 78 724 608 0.514 308 265 0.0 1.0 11.871 B
D - A595 south 772 193 181 1162 0.665 765 851 0.0 1.9 8.900 A
ArmTotal
Demand (Veh/hr)
Junction Arrivals
(Veh)
Circulating flow
(Veh/hr)
Capacity (Veh/hr)
RFCThroughput
(Veh/hr)
Throughput (exit side) (Veh/hr)
Start queue (Veh)
End queue (Veh)
Delay (s)
LOS
A - A595 north 699 175 481 997 0.701 695 650 1.3 2.2 11.765 B
B - B5295 348 87 837 979 0.355 347 339 0.4 0.5 5.688 A
C - Homewood Rd 373 93 867 539 0.692 369 317 1.0 2.1 20.618 C
D - A595 south 922 231 217 1143 0.807 915 1019 1.9 3.9 15.281 C
ArmTotal
Demand (Veh/hr)
Junction Arrivals
(Veh)
Circulating flow
(Veh/hr)
Capacity (Veh/hr)
RFCThroughput
(Veh/hr)
Throughput (exit side) (Veh/hr)
Start queue (Veh)
End queue (Veh)
Delay (s)
LOS
A - A595 north 855 214 566 953 0.898 838 757 2.2 6.7 27.686 D
B - B5295 426 107 1005 870 0.490 425 398 0.5 0.9 8.051 A
C - Homewood Rd 457 114 1052 451 1.013 420 378 2.1 11.2 77.064 F
D - A595 south 1130 282 247 1126 1.003 1076 1225 3.9 17.3 47.382 E
ArmTotal
Demand (Veh/hr)
Junction Arrivals
(Veh)
Circulating flow
(Veh/hr)
Capacity (Veh/hr)
RFCThroughput
(Veh/hr)
Throughput (exit side) (Veh/hr)
Start queue (Veh)
End queue (Veh)
Delay (s) LOS
A - A595 north 855 214 578 947 0.904 851 774 6.7 7.8 34.949 D
B - B5295 426 107 1023 859 0.496 426 407 0.9 1.0 8.313 A
C - Homewood Rd 457 114 1064 445 1.026 433 385 11.2 17.3 134.893 F
D - A595 south 1130 282 254 1122 1.007 1098 1242 17.3 25.3 79.920 F
ArmTotal
Demand (Veh/hr)
Junction Arrivals
(Veh)
Circulating flow
(Veh/hr)
Capacity (Veh/hr)
RFCThroughput
(Veh/hr)
Throughput (exit side) (Veh/hr)
Start queue (Veh)
End queue (Veh)
Delay (s)
LOS
A - A595 north 699 175 528 973 0.718 719 729 7.8 2.7 15.191 C
B - B5295 348 87 875 955 0.364 349 371 1.0 0.6 5.961 A
C - Homewood Rd 373 93 888 529 0.705 432 337 17.3 2.7 51.440 F
D - A595 south 922 231 254 1122 0.822 1002 1066 25.3 5.3 40.060 E
ArmTotal
Demand (Veh/hr)
Junction Arrivals
(Veh)
Circulating flow
(Veh/hr)
Capacity (Veh/hr)
RFCThroughput
(Veh/hr)
Throughput (exit side) (Veh/hr)
Start queue (Veh)
End queue (Veh)
Delay (s)
LOS
A - A595 north 585 146 413 1032 0.567 590 559 2.7 1.3 8.254 A
B - B5295 291 73 713 1060 0.275 292 291 0.6 0.4 4.692 A
C - Homewood Rd 312 78 734 603 0.518 319 271 2.7 1.1 12.935 B
D - A595 south 772 193 187 1159 0.667 785 866 5.3 2.1 9.955 A
Page 19 of 25
17/08/2021file:///C:/Users/semsons/AppData/Local/TempA595%20-%20B5295%20-%20Home...

Existing Layout - 2035 Core, PM
Data Errors and WarningsNo errors or warnings
Junction Network
Junctions
Junction Network Options
Traffic Demand
Demand Set Details
Demand overview (Traffic)
Origin-Destination Data
Vehicle Mix
Results
Results Summary for whole modelled period
Junction Name Junction Type Arm order Junction Delay (s) Junction LOS
1 Roundabout Standard Roundabout A,B,C,D 45.07 E
Driving side Lighting Network residual capacity (%) First arm reaching threshold
Left Normal/unknown -7 D - A595 south
IDScenario
nameTime Period
nameTraffic profile
typeStart time (HH:mm)
Finish time (HH:mm)
Time segment length (min)
Run automatically
D9 2035 Core PM ONE HOUR 16:45 18:15 15 �
Vehicle mix varies over turn Vehicle mix varies over entry Vehicle mix source PCU Factor for a HV (PCU)
� � HV Percentages 2.00
Arm Linked arm Profile type Use O-D data Average Demand (Veh/hr) Scaling Factor (%)
A - A595 north ONE HOUR � 723 100.000
B - B5295 ONE HOUR � 259 100.000
C - Homewood Rd ONE HOUR � 401 100.000
D - A595 south ONE HOUR � 1104 100.000
Demand (Veh/hr)
To
From
A - A595 north B - B5295 C - Homewood Rd D - A595 south
A - A595 north 0 0 103 620
B - B5295 0 0 0 259
C - Homewood Rd 119 0 0 282
D - A595 south 674 319 111 0
Heavy Vehicle Percentages
To
From
A - A595 north B - B5295 C - Homewood Rd D - A595 south
A - A595 north 0 0 0 1
B - B5295 0 0 0 1
C - Homewood Rd 0 0 0 0
D - A595 south 1 1 1 0
Page 20 of 25
17/08/2021file:///C:/Users/semsons/AppData/Local/TempA595%20-%20B5295%20-%20Home...
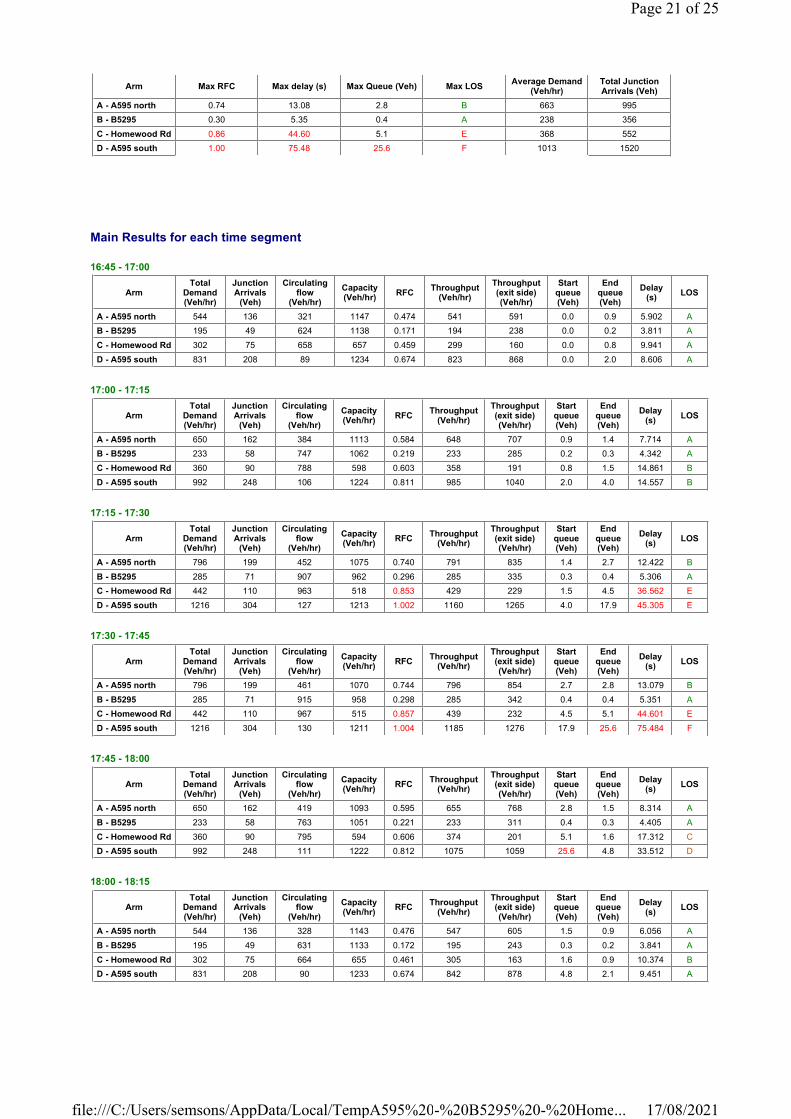
Main Results for each time segment
16:45 - 17:00
17:00 - 17:15
17:15 - 17:30
17:30 - 17:45
17:45 - 18:00
18:00 - 18:15
Arm Max RFC Max delay (s) Max Queue (Veh) Max LOSAverage Demand
(Veh/hr)Total Junction Arrivals (Veh)
A - A595 north 0.74 13.08 2.8 B 663 995
B - B5295 0.30 5.35 0.4 A 238 356
C - Homewood Rd 0.86 44.60 5.1 E 368 552
D - A595 south 1.00 75.48 25.6 F 1013 1520
ArmTotal
Demand (Veh/hr)
Junction Arrivals
(Veh)
Circulating flow
(Veh/hr)
Capacity (Veh/hr)
RFCThroughput
(Veh/hr)
Throughput (exit side) (Veh/hr)
Start queue (Veh)
End queue (Veh)
Delay (s)
LOS
A - A595 north 544 136 321 1147 0.474 541 591 0.0 0.9 5.902 A
B - B5295 195 49 624 1138 0.171 194 238 0.0 0.2 3.811 A
C - Homewood Rd 302 75 658 657 0.459 299 160 0.0 0.8 9.941 A
D - A595 south 831 208 89 1234 0.674 823 868 0.0 2.0 8.606 A
ArmTotal
Demand (Veh/hr)
Junction Arrivals
(Veh)
Circulating flow
(Veh/hr)
Capacity (Veh/hr)
RFCThroughput
(Veh/hr)
Throughput (exit side) (Veh/hr)
Start queue (Veh)
End queue (Veh)
Delay (s)
LOS
A - A595 north 650 162 384 1113 0.584 648 707 0.9 1.4 7.714 A
B - B5295 233 58 747 1062 0.219 233 285 0.2 0.3 4.342 A
C - Homewood Rd 360 90 788 598 0.603 358 191 0.8 1.5 14.861 B
D - A595 south 992 248 106 1224 0.811 985 1040 2.0 4.0 14.557 B
ArmTotal
Demand (Veh/hr)
Junction Arrivals
(Veh)
Circulating flow
(Veh/hr)
Capacity (Veh/hr)
RFCThroughput
(Veh/hr)
Throughput (exit side) (Veh/hr)
Start queue (Veh)
End queue (Veh)
Delay (s)
LOS
A - A595 north 796 199 452 1075 0.740 791 835 1.4 2.7 12.422 B
B - B5295 285 71 907 962 0.296 285 335 0.3 0.4 5.306 A
C - Homewood Rd 442 110 963 518 0.853 429 229 1.5 4.5 36.562 E
D - A595 south 1216 304 127 1213 1.002 1160 1265 4.0 17.9 45.305 E
ArmTotal
Demand (Veh/hr)
Junction Arrivals
(Veh)
Circulating flow
(Veh/hr)
Capacity (Veh/hr)
RFCThroughput
(Veh/hr)
Throughput (exit side) (Veh/hr)
Start queue (Veh)
End queue (Veh)
Delay (s)
LOS
A - A595 north 796 199 461 1070 0.744 796 854 2.7 2.8 13.079 B
B - B5295 285 71 915 958 0.298 285 342 0.4 0.4 5.351 A
C - Homewood Rd 442 110 967 515 0.857 439 232 4.5 5.1 44.601 E
D - A595 south 1216 304 130 1211 1.004 1185 1276 17.9 25.6 75.484 F
ArmTotal
Demand (Veh/hr)
Junction Arrivals
(Veh)
Circulating flow
(Veh/hr)
Capacity (Veh/hr)
RFCThroughput
(Veh/hr)
Throughput (exit side) (Veh/hr)
Start queue (Veh)
End queue (Veh)
Delay (s)
LOS
A - A595 north 650 162 419 1093 0.595 655 768 2.8 1.5 8.314 A
B - B5295 233 58 763 1051 0.221 233 311 0.4 0.3 4.405 A
C - Homewood Rd 360 90 795 594 0.606 374 201 5.1 1.6 17.312 C
D - A595 south 992 248 111 1222 0.812 1075 1059 25.6 4.8 33.512 D
ArmTotal
Demand (Veh/hr)
Junction Arrivals
(Veh)
Circulating flow
(Veh/hr)
Capacity (Veh/hr)
RFCThroughput
(Veh/hr)
Throughput (exit side) (Veh/hr)
Start queue (Veh)
End queue (Veh)
Delay (s)
LOS
A - A595 north 544 136 328 1143 0.476 547 605 1.5 0.9 6.056 A
B - B5295 195 49 631 1133 0.172 195 243 0.3 0.2 3.841 A
C - Homewood Rd 302 75 664 655 0.461 305 163 1.6 0.9 10.374 B
D - A595 south 831 208 90 1233 0.674 842 878 4.8 2.1 9.451 A
Page 21 of 25
17/08/2021file:///C:/Users/semsons/AppData/Local/TempA595%20-%20B5295%20-%20Home...

Existing Layout - 2035 Operation, AM2
Data Errors and WarningsNo errors or warnings
Junction Network
Junctions
Junction Network Options
Traffic Demand
Demand Set Details
Demand overview (Traffic)
Origin-Destination Data
Vehicle Mix
Results
Results Summary for whole modelled period
Junction Name Junction Type Arm order Junction Delay (s) Junction LOS
1 Roundabout Standard Roundabout A,B,C,D 61.37 F
Driving side Lighting Network residual capacity (%) First arm reaching threshold
Left Normal/unknown -11 C - Homewood Rd
IDScenario
nameTime Period
nameTraffic profile
typeStart time (HH:mm)
Finish time (HH:mm)
Time segment length (min)
Run automatically
D10 2035 Operation AM2 ONE HOUR 07:45 09:15 15 �
Vehicle mix varies over turn Vehicle mix varies over entry Vehicle mix source PCU Factor for a HV (PCU)
� � HV Percentages 2.00
Arm Linked arm Profile type Use O-D data Average Demand (Veh/hr) Scaling Factor (%)
A - A595 north ONE HOUR � 779 100.000
B - B5295 ONE HOUR � 385 100.000
C - Homewood Rd ONE HOUR � 419 100.000
D - A595 south ONE HOUR � 1023 100.000
Demand (Veh/hr)
To
From
A - A595 north B - B5295 C - Homewood Rd D - A595 south
A - A595 north 0 0 190 589
B - B5295 0 0 0 385
C - Homewood Rd 248 0 0 171
D - A595 south 483 380 160 0
Heavy Vehicle Percentages
To
From
A - A595 north B - B5295 C - Homewood Rd D - A595 south
A - A595 north 0 0 2 5
B - B5295 0 0 0 1
C - Homewood Rd 1 0 0 0
D - A595 south 5 1 0 0
Page 22 of 25
17/08/2021file:///C:/Users/semsons/AppData/Local/TempA595%20-%20B5295%20-%20Home...
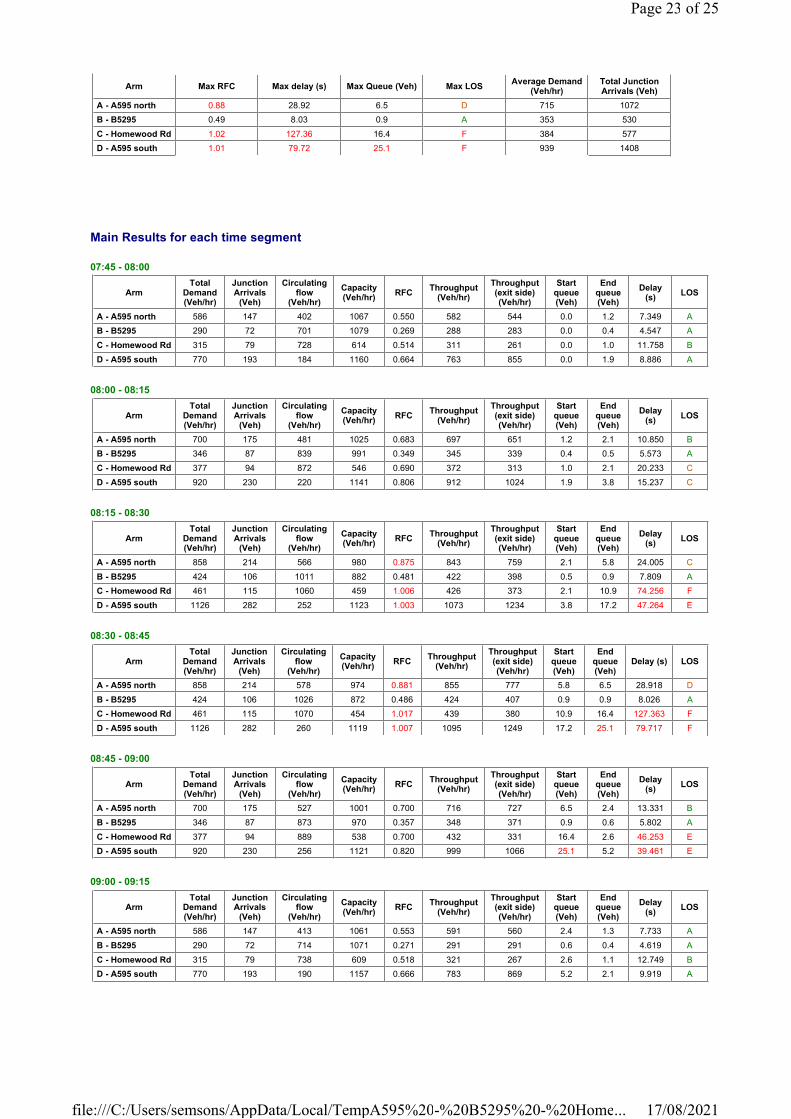
Main Results for each time segment
07:45 - 08:00
08:00 - 08:15
08:15 - 08:30
08:30 - 08:45
08:45 - 09:00
09:00 - 09:15
Arm Max RFC Max delay (s) Max Queue (Veh) Max LOSAverage Demand
(Veh/hr)Total Junction Arrivals (Veh)
A - A595 north 0.88 28.92 6.5 D 715 1072
B - B5295 0.49 8.03 0.9 A 353 530
C - Homewood Rd 1.02 127.36 16.4 F 384 577
D - A595 south 1.01 79.72 25.1 F 939 1408
ArmTotal
Demand (Veh/hr)
Junction Arrivals
(Veh)
Circulating flow
(Veh/hr)
Capacity (Veh/hr)
RFCThroughput
(Veh/hr)
Throughput (exit side) (Veh/hr)
Start queue (Veh)
End queue (Veh)
Delay (s)
LOS
A - A595 north 586 147 402 1067 0.550 582 544 0.0 1.2 7.349 A
B - B5295 290 72 701 1079 0.269 288 283 0.0 0.4 4.547 A
C - Homewood Rd 315 79 728 614 0.514 311 261 0.0 1.0 11.758 B
D - A595 south 770 193 184 1160 0.664 763 855 0.0 1.9 8.886 A
ArmTotal
Demand (Veh/hr)
Junction Arrivals
(Veh)
Circulating flow
(Veh/hr)
Capacity (Veh/hr)
RFCThroughput
(Veh/hr)
Throughput (exit side) (Veh/hr)
Start queue (Veh)
End queue (Veh)
Delay (s)
LOS
A - A595 north 700 175 481 1025 0.683 697 651 1.2 2.1 10.850 B
B - B5295 346 87 839 991 0.349 345 339 0.4 0.5 5.573 A
C - Homewood Rd 377 94 872 546 0.690 372 313 1.0 2.1 20.233 C
D - A595 south 920 230 220 1141 0.806 912 1024 1.9 3.8 15.237 C
ArmTotal
Demand (Veh/hr)
Junction Arrivals
(Veh)
Circulating flow
(Veh/hr)
Capacity (Veh/hr)
RFCThroughput
(Veh/hr)
Throughput (exit side) (Veh/hr)
Start queue (Veh)
End queue (Veh)
Delay (s)
LOS
A - A595 north 858 214 566 980 0.875 843 759 2.1 5.8 24.005 C
B - B5295 424 106 1011 882 0.481 422 398 0.5 0.9 7.809 A
C - Homewood Rd 461 115 1060 459 1.006 426 373 2.1 10.9 74.256 F
D - A595 south 1126 282 252 1123 1.003 1073 1234 3.8 17.2 47.264 E
ArmTotal
Demand (Veh/hr)
Junction Arrivals
(Veh)
Circulating flow
(Veh/hr)
Capacity (Veh/hr)
RFCThroughput
(Veh/hr)
Throughput (exit side) (Veh/hr)
Start queue (Veh)
End queue (Veh)
Delay (s) LOS
A - A595 north 858 214 578 974 0.881 855 777 5.8 6.5 28.918 D
B - B5295 424 106 1026 872 0.486 424 407 0.9 0.9 8.026 A
C - Homewood Rd 461 115 1070 454 1.017 439 380 10.9 16.4 127.363 F
D - A595 south 1126 282 260 1119 1.007 1095 1249 17.2 25.1 79.717 F
ArmTotal
Demand (Veh/hr)
Junction Arrivals
(Veh)
Circulating flow
(Veh/hr)
Capacity (Veh/hr)
RFCThroughput
(Veh/hr)
Throughput (exit side) (Veh/hr)
Start queue (Veh)
End queue (Veh)
Delay (s)
LOS
A - A595 north 700 175 527 1001 0.700 716 727 6.5 2.4 13.331 B
B - B5295 346 87 873 970 0.357 348 371 0.9 0.6 5.802 A
C - Homewood Rd 377 94 889 538 0.700 432 331 16.4 2.6 46.253 E
D - A595 south 920 230 256 1121 0.820 999 1066 25.1 5.2 39.461 E
ArmTotal
Demand (Veh/hr)
Junction Arrivals
(Veh)
Circulating flow
(Veh/hr)
Capacity (Veh/hr)
RFCThroughput
(Veh/hr)
Throughput (exit side) (Veh/hr)
Start queue (Veh)
End queue (Veh)
Delay (s)
LOS
A - A595 north 586 147 413 1061 0.553 591 560 2.4 1.3 7.733 A
B - B5295 290 72 714 1071 0.271 291 291 0.6 0.4 4.619 A
C - Homewood Rd 315 79 738 609 0.518 321 267 2.6 1.1 12.749 B
D - A595 south 770 193 190 1157 0.666 783 869 5.2 2.1 9.919 A
Page 23 of 25
17/08/2021file:///C:/Users/semsons/AppData/Local/TempA595%20-%20B5295%20-%20Home...

Existing Layout - 2035 Operation, PM
Data Errors and WarningsNo errors or warnings
Junction Network
Junctions
Junction Network Options
Traffic Demand
Demand Set Details
Demand overview (Traffic)
Origin-Destination Data
Vehicle Mix
Results
Results Summary for whole modelled period
Junction Name Junction Type Arm order Junction Delay (s) Junction LOS
1 Roundabout Standard Roundabout A,B,C,D 44.98 E
Driving side Lighting Network residual capacity (%) First arm reaching threshold
Left Normal/unknown -7 D - A595 south
IDScenario
nameTime Period
nameTraffic profile
typeStart time (HH:mm)
Finish time (HH:mm)
Time segment length (min)
Run automatically
D11 2035 Operation PM ONE HOUR 16:45 18:15 15 �
Vehicle mix varies over turn Vehicle mix varies over entry Vehicle mix source PCU Factor for a HV (PCU)
� � HV Percentages 2.00
Arm Linked arm Profile type Use O-D data Average Demand (Veh/hr) Scaling Factor (%)
A - A595 north ONE HOUR � 721 100.000
B - B5295 ONE HOUR � 258 100.000
C - Homewood Rd ONE HOUR � 397 100.000
D - A595 south ONE HOUR � 1108 100.000
Demand (Veh/hr)
To
From
A - A595 north B - B5295 C - Homewood Rd D - A595 south
A - A595 north 0 0 106 615
B - B5295 0 0 0 258
C - Homewood Rd 114 0 0 283
D - A595 south 681 317 110 0
Heavy Vehicle Percentages
To
From
A - A595 north B - B5295 C - Homewood Rd D - A595 south
A - A595 north 0 0 0 1
B - B5295 0 0 0 1
C - Homewood Rd 0 0 0 0
D - A595 south 1 1 1 0
Page 24 of 25
17/08/2021file:///C:/Users/semsons/AppData/Local/TempA595%20-%20B5295%20-%20Home...
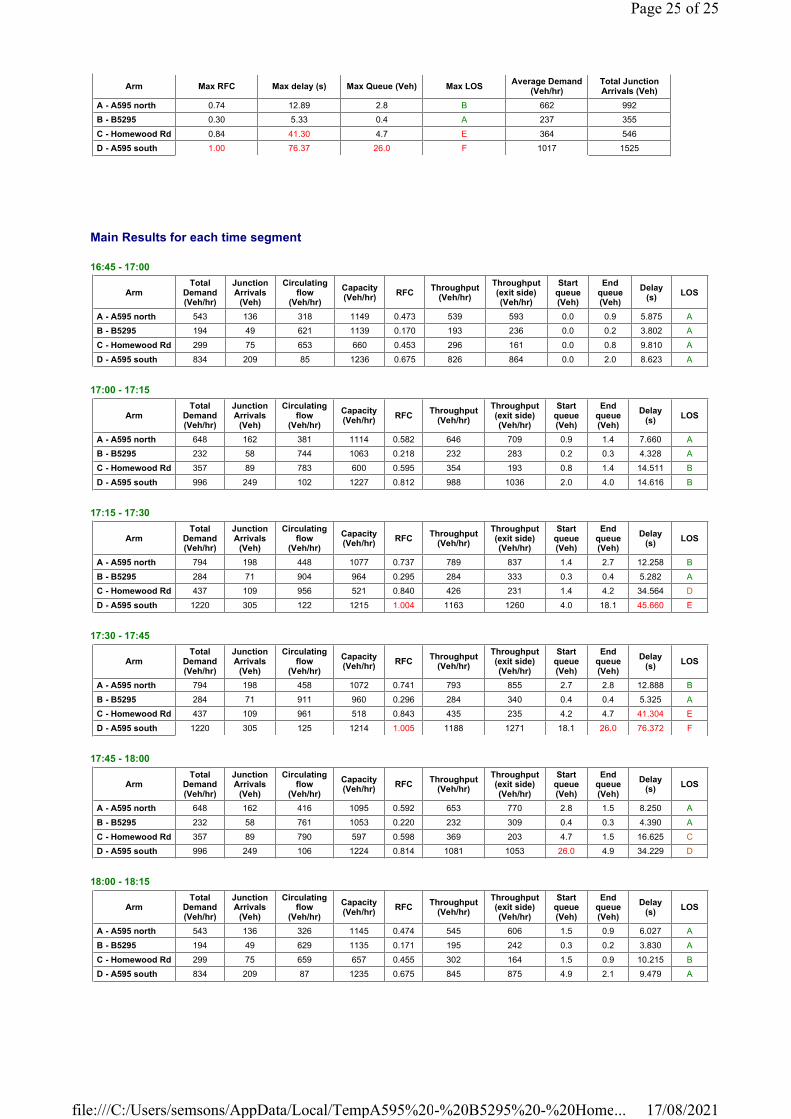
Main Results for each time segment
16:45 - 17:00
17:00 - 17:15
17:15 - 17:30
17:30 - 17:45
17:45 - 18:00
18:00 - 18:15
Arm Max RFC Max delay (s) Max Queue (Veh) Max LOSAverage Demand
(Veh/hr)Total Junction Arrivals (Veh)
A - A595 north 0.74 12.89 2.8 B 662 992
B - B5295 0.30 5.33 0.4 A 237 355
C - Homewood Rd 0.84 41.30 4.7 E 364 546
D - A595 south 1.00 76.37 26.0 F 1017 1525
ArmTotal
Demand (Veh/hr)
Junction Arrivals
(Veh)
Circulating flow
(Veh/hr)
Capacity (Veh/hr)
RFCThroughput
(Veh/hr)
Throughput (exit side) (Veh/hr)
Start queue (Veh)
End queue (Veh)
Delay (s)
LOS
A - A595 north 543 136 318 1149 0.473 539 593 0.0 0.9 5.875 A
B - B5295 194 49 621 1139 0.170 193 236 0.0 0.2 3.802 A
C - Homewood Rd 299 75 653 660 0.453 296 161 0.0 0.8 9.810 A
D - A595 south 834 209 85 1236 0.675 826 864 0.0 2.0 8.623 A
ArmTotal
Demand (Veh/hr)
Junction Arrivals
(Veh)
Circulating flow
(Veh/hr)
Capacity (Veh/hr)
RFCThroughput
(Veh/hr)
Throughput (exit side) (Veh/hr)
Start queue (Veh)
End queue (Veh)
Delay (s)
LOS
A - A595 north 648 162 381 1114 0.582 646 709 0.9 1.4 7.660 A
B - B5295 232 58 744 1063 0.218 232 283 0.2 0.3 4.328 A
C - Homewood Rd 357 89 783 600 0.595 354 193 0.8 1.4 14.511 B
D - A595 south 996 249 102 1227 0.812 988 1036 2.0 4.0 14.616 B
ArmTotal
Demand (Veh/hr)
Junction Arrivals
(Veh)
Circulating flow
(Veh/hr)
Capacity (Veh/hr)
RFCThroughput
(Veh/hr)
Throughput (exit side) (Veh/hr)
Start queue (Veh)
End queue (Veh)
Delay (s)
LOS
A - A595 north 794 198 448 1077 0.737 789 837 1.4 2.7 12.258 B
B - B5295 284 71 904 964 0.295 284 333 0.3 0.4 5.282 A
C - Homewood Rd 437 109 956 521 0.840 426 231 1.4 4.2 34.564 D
D - A595 south 1220 305 122 1215 1.004 1163 1260 4.0 18.1 45.660 E
ArmTotal
Demand (Veh/hr)
Junction Arrivals
(Veh)
Circulating flow
(Veh/hr)
Capacity (Veh/hr)
RFCThroughput
(Veh/hr)
Throughput (exit side) (Veh/hr)
Start queue (Veh)
End queue (Veh)
Delay (s)
LOS
A - A595 north 794 198 458 1072 0.741 793 855 2.7 2.8 12.888 B
B - B5295 284 71 911 960 0.296 284 340 0.4 0.4 5.325 A
C - Homewood Rd 437 109 961 518 0.843 435 235 4.2 4.7 41.304 E
D - A595 south 1220 305 125 1214 1.005 1188 1271 18.1 26.0 76.372 F
ArmTotal
Demand (Veh/hr)
Junction Arrivals
(Veh)
Circulating flow
(Veh/hr)
Capacity (Veh/hr)
RFCThroughput
(Veh/hr)
Throughput (exit side) (Veh/hr)
Start queue (Veh)
End queue (Veh)
Delay (s)
LOS
A - A595 north 648 162 416 1095 0.592 653 770 2.8 1.5 8.250 A
B - B5295 232 58 761 1053 0.220 232 309 0.4 0.3 4.390 A
C - Homewood Rd 357 89 790 597 0.598 369 203 4.7 1.5 16.625 C
D - A595 south 996 249 106 1224 0.814 1081 1053 26.0 4.9 34.229 D
ArmTotal
Demand (Veh/hr)
Junction Arrivals
(Veh)
Circulating flow
(Veh/hr)
Capacity (Veh/hr)
RFCThroughput
(Veh/hr)
Throughput (exit side) (Veh/hr)
Start queue (Veh)
End queue (Veh)
Delay (s)
LOS
A - A595 north 543 136 326 1145 0.474 545 606 1.5 0.9 6.027 A
B - B5295 194 49 629 1135 0.171 195 242 0.3 0.2 3.830 A
C - Homewood Rd 299 75 659 657 0.455 302 164 1.5 0.9 10.215 B
D - A595 south 834 209 87 1235 0.675 845 875 4.9 2.1 9.479 A
Page 25 of 25
17/08/2021file:///C:/Users/semsons/AppData/Local/TempA595%20-%20B5295%20-%20Home...

Filename: Mirehouse Rd - St Bees Rd.j9Path: C:\Files - Simon\BTP Projects\BTP-2128 - WCM Whitehaven Coal Mine\Junction Capacity Assessments\Junction 3 PICADY (Mirehouse - St Bees)Report generation date: 17/08/2021 17:57:35
»Existing Layout - 2025 Core, AM1»Existing Layout - 2025 Core, AM2»Existing Layout - 2025 Core, PM»Existing Layout - 2025 Construction, AM1»Existing Layout - 2025 Construction, PM»Existing Layout - 2025 Operation, AM2»Existing Layout - 2025 Operation, PM»Existing Layout - 2035 Core, AM2»Existing Layout - 2035 Core, PM»Existing Layout - 2035 Operation, AM2»Existing Layout - 2035 Operation, PM
Summary of junction performance
Junctions 9PICADY 9 - Priority Intersection Module
Version: 9.0.1.4646 [] © Copyright TRL Limited, 2021
For sales and distribution information, program advice and maintenance, contact TRL:Tel: +44 (0)1344 770758 email: [email protected] Web: http://www.trlsoftware.co.uk
The users of this computer program for the solution of an engineering problem are in no way relieved of their responsibility for the correctness of the solution
AM1 AM2 PM
Queue (Veh)
Delay (s)
RFC LOSNetwork Residual Capacity
Queue (Veh)
Delay (s)
RFC LOSNetwork Residual Capacity
Queue (Veh)
Delay (s)
RFC LOSNetwork Residual Capacity
Existing Layout - 2025 Core
Stream B-C 0.2 6.25 0.16 A 127 %
[Stream C-B]
0.4 7.22 0.27 A 79 %
[Stream B-A]
0.7 10.26 0.43 B 36 %
[Stream B-A]
Stream B-A 0.1 10.19 0.12 B 0.2 11.73 0.20 B 0.6 14.35 0.38 B
Stream C-B 0.5 7.67 0.34 A 0.7 8.84 0.42 A 0.3 6.76 0.25 A
Existing Layout - 2025 Construction
Stream B-C 0.3 6.68 0.24 A 116 %
[Stream B-A]
0.7 10.21 0.43 B 34 %
[Stream B-A]
Stream B-A 0.1 10.57 0.11 B 0.6 14.92 0.37 B
Stream C-B 0.5 7.73 0.35 A 0.5 7.61 0.33 A
Existing Layout - 2025 Operation
Stream B-C 0.4 7.55 0.30 A 73 %
[Stream B-A]
0.7 10.16 0.43 B 35 %
[Stream B-A]
Stream B-A 0.3 11.98 0.20 B 0.6 14.55 0.38 B
Stream C-B 0.7 8.84 0.42 A 0.4 7.14 0.28 A
Existing Layout - 2035 Core
Stream B-C 0.6 8.36 0.39 A 31 %
[Stream C-B]
2.1 19.21 0.69 C 6 %
[Stream B-A]
Stream B-A 0.3 15.15 0.21 C 1.0 24.97 0.52 C
Stream C-B 1.7 14.08 0.64 B 0.6 7.91 0.36 A
Existing Layout - 2035 Operation
Stream B-C 0.8 9.16 0.44 A 31 %
[Stream C-B]
2.0 18.11 0.67 C 8 %
[Stream B-A]
Stream B-A 0.3 15.82 0.21 C 0.9 24.01 0.49 C
Stream C-B 1.7 14.10 0.64 B 0.7 8.55 0.41 A
Values shown are the highest values encountered over all time segments. Delay is the maximum value of average delay per arriving vehicle. Network Residual Capacity indicates the amount by which network flow could be increased before a user-definable threshold (see Analysis Options) is met.
File summary
Page 1 of 35
17/08/2021file:///C:/Files%20-%20Simon/BTP%20Projects/BTP-2128%20-%20WCM%20White...
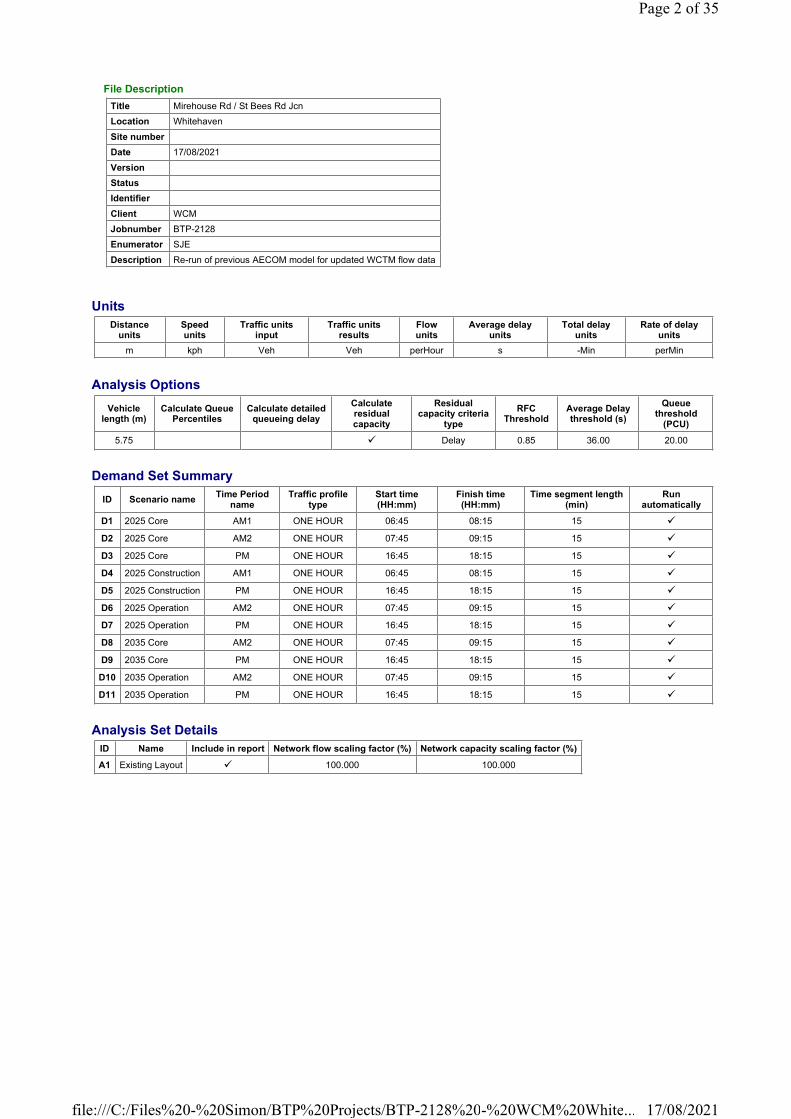
Units
Analysis Options
Demand Set Summary
Analysis Set Details
File Description
Title Mirehouse Rd / St Bees Rd Jcn
Location Whitehaven
Site number
Date 17/08/2021
Version
Status
Identifier
Client WCM
Jobnumber BTP-2128
Enumerator SJE
Description Re-run of previous AECOM model for updated WCTM flow data
Distance units
Speed units
Traffic units input
Traffic units results
Flow units
Average delay units
Total delay units
Rate of delay units
m kph Veh Veh perHour s -Min perMin
Vehicle length (m)
Calculate Queue Percentiles
Calculate detailed queueing delay
Calculate residual capacity
Residual capacity criteria
type
RFC Threshold
Average Delay threshold (s)
Queue threshold
(PCU)
5.75 � Delay 0.85 36.00 20.00
ID Scenario nameTime Period
nameTraffic profile
typeStart time (HH:mm)
Finish time (HH:mm)
Time segment length (min)
Run automatically
D1 2025 Core AM1 ONE HOUR 06:45 08:15 15 �
D2 2025 Core AM2 ONE HOUR 07:45 09:15 15 �
D3 2025 Core PM ONE HOUR 16:45 18:15 15 �
D4 2025 Construction AM1 ONE HOUR 06:45 08:15 15 �
D5 2025 Construction PM ONE HOUR 16:45 18:15 15 �
D6 2025 Operation AM2 ONE HOUR 07:45 09:15 15 �
D7 2025 Operation PM ONE HOUR 16:45 18:15 15 �
D8 2035 Core AM2 ONE HOUR 07:45 09:15 15 �
D9 2035 Core PM ONE HOUR 16:45 18:15 15 �
D10 2035 Operation AM2 ONE HOUR 07:45 09:15 15 �
D11 2035 Operation PM ONE HOUR 16:45 18:15 15 �
ID Name Include in report Network flow scaling factor (%) Network capacity scaling factor (%)
A1 Existing Layout � 100.000 100.000
Page 2 of 35
17/08/2021file:///C:/Files%20-%20Simon/BTP%20Projects/BTP-2128%20-%20WCM%20White...

Existing Layout - 2025 Core, AM1
Data Errors and WarningsNo errors or warnings
Junction Network
Junctions
Junction Network Options
Arms
Arms
Major Arm Geometry
Geometries for Arm C are measured opposite Arm B. Geometries for Arm A (if relevant) are measured opposite Arm D.
Minor Arm Geometry
Slope / Intercept / Capacity
Priority Intersection Slopes and Intercepts
The slopes and intercepts shown above do NOT include any corrections or adjustments.
Streams may be combined, in which case capacity will be adjusted.
Values are shown for the first time segment only; they may differ for subsequent time segments.
Traffic Demand
Demand Set Details
Junction Name Junction Type Major road direction Junction Delay (s) Junction LOS
1 Junction T-Junction Two-way 4.98 A
Driving side Lighting Network residual capacity (%) First arm reaching threshold
Left Normal/unknown 127 Stream C-B
Arm Name Description Arm type
A St Bees Rd north Major
B Mirehouse Rd Minor
C St Bees Rd south Major
ArmWidth of
carriageway (m)Has kerbed
central reserveHas right turn bay
Width for right turn (m)
Visibility for right turn (m)
Blocks?Blocking
queue (PCU)
C - St Bees Rd south 6.00 � 3.40 175.0 -
ArmMinor
arm type
Width at give-way
(m)
Width at 5m (m)
Width at 10m (m)
Width at 15m (m)
Width at 20m (m)
Estimate flare length
Flare length (PCU)
Visibility to left (m)
Visibility to right (m)
B - Mirehouse RdOne lane plus flare
10.00 9.00 5.75 5.10 4.80 1.00 70 80
Junction StreamIntercept(Veh/hr)
SlopeforA-B
SlopeforA-C
SlopeforC-A
SlopeforC-B
1 B-A 528 0.096 0.243 0.153 0.347
1 B-C 753 0.115 0.292 - -
1 C-B 764 0.296 0.296 - -
IDScenario
nameTime Period
nameTraffic profile
typeStart time (HH:mm)
Finish time (HH:mm)
Time segment length (min)
Run automatically
Page 3 of 35
17/08/2021file:///C:/Files%20-%20Simon/BTP%20Projects/BTP-2128%20-%20WCM%20White...
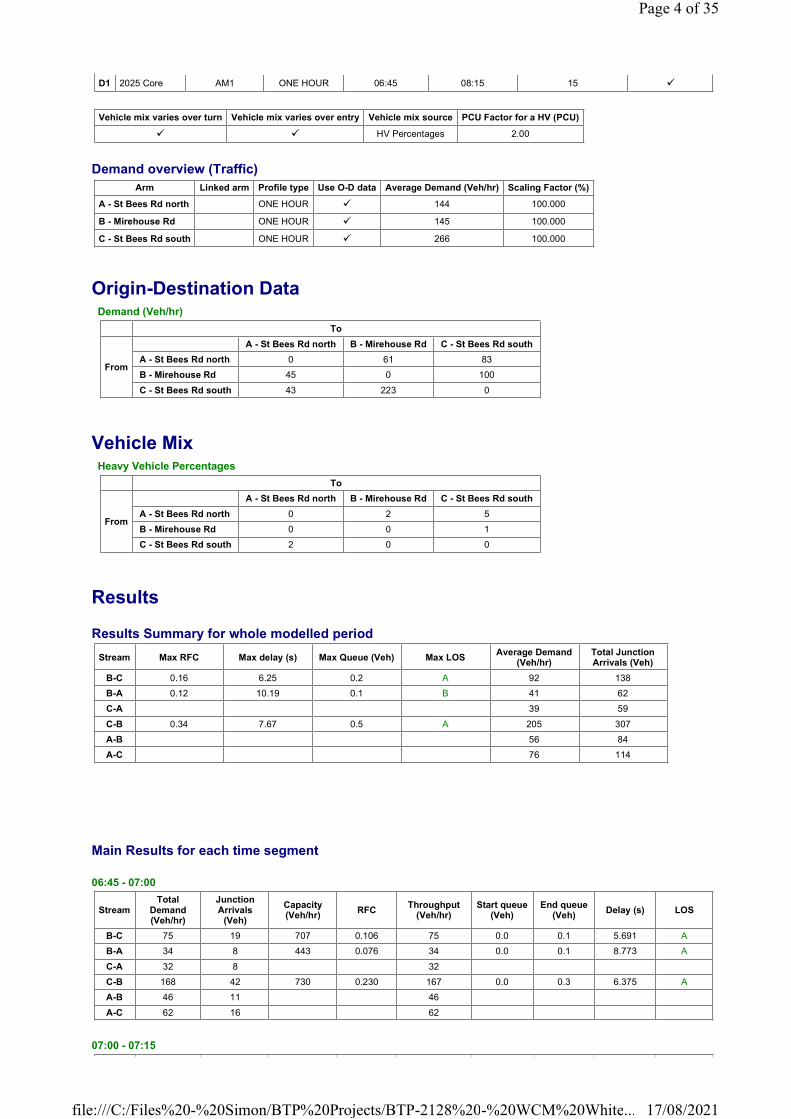
Demand overview (Traffic)
Origin-Destination Data
Vehicle Mix
Results
Results Summary for whole modelled period
Main Results for each time segment
06:45 - 07:00
07:00 - 07:15
D1 2025 Core AM1 ONE HOUR 06:45 08:15 15 �
Vehicle mix varies over turn Vehicle mix varies over entry Vehicle mix source PCU Factor for a HV (PCU)
� � HV Percentages 2.00
Arm Linked arm Profile type Use O-D data Average Demand (Veh/hr) Scaling Factor (%)
A - St Bees Rd north ONE HOUR � 144 100.000
B - Mirehouse Rd ONE HOUR � 145 100.000
C - St Bees Rd south ONE HOUR � 266 100.000
Demand (Veh/hr)
To
From
A - St Bees Rd north B - Mirehouse Rd C - St Bees Rd south
A - St Bees Rd north 0 61 83
B - Mirehouse Rd 45 0 100
C - St Bees Rd south 43 223 0
Heavy Vehicle Percentages
To
From
A - St Bees Rd north B - Mirehouse Rd C - St Bees Rd south
A - St Bees Rd north 0 2 5
B - Mirehouse Rd 0 0 1
C - St Bees Rd south 2 0 0
Stream Max RFC Max delay (s) Max Queue (Veh) Max LOSAverage Demand
(Veh/hr)Total Junction Arrivals (Veh)
B-C 0.16 6.25 0.2 A 92 138
B-A 0.12 10.19 0.1 B 41 62
C-A 39 59
C-B 0.34 7.67 0.5 A 205 307
A-B 56 84
A-C 76 114
StreamTotal
Demand (Veh/hr)
Junction Arrivals
(Veh)
Capacity (Veh/hr)
RFCThroughput
(Veh/hr)Start queue
(Veh)End queue
(Veh)Delay (s) LOS
B-C 75 19 707 0.106 75 0.0 0.1 5.691 A
B-A 34 8 443 0.076 34 0.0 0.1 8.773 A
C-A 32 8 32
C-B 168 42 730 0.230 167 0.0 0.3 6.375 A
A-B 46 11 46
A-C 62 16 62
Page 4 of 35
17/08/2021file:///C:/Files%20-%20Simon/BTP%20Projects/BTP-2128%20-%20WCM%20White...
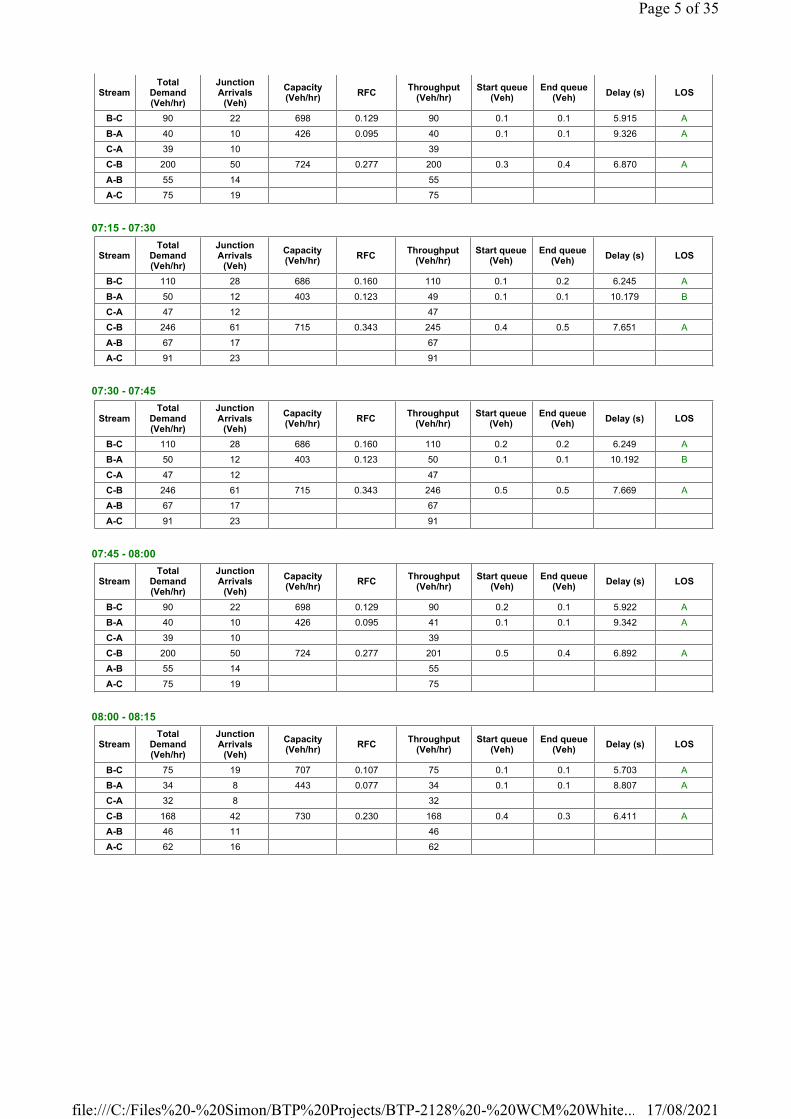
07:15 - 07:30
07:30 - 07:45
07:45 - 08:00
08:00 - 08:15
StreamTotal
Demand (Veh/hr)
Junction Arrivals
(Veh)
Capacity (Veh/hr)
RFCThroughput
(Veh/hr)Start queue
(Veh)End queue
(Veh)Delay (s) LOS
B-C 90 22 698 0.129 90 0.1 0.1 5.915 A
B-A 40 10 426 0.095 40 0.1 0.1 9.326 A
C-A 39 10 39
C-B 200 50 724 0.277 200 0.3 0.4 6.870 A
A-B 55 14 55
A-C 75 19 75
StreamTotal
Demand (Veh/hr)
Junction Arrivals
(Veh)
Capacity (Veh/hr)
RFCThroughput
(Veh/hr)Start queue
(Veh)End queue
(Veh)Delay (s) LOS
B-C 110 28 686 0.160 110 0.1 0.2 6.245 A
B-A 50 12 403 0.123 49 0.1 0.1 10.179 B
C-A 47 12 47
C-B 246 61 715 0.343 245 0.4 0.5 7.651 A
A-B 67 17 67
A-C 91 23 91
StreamTotal
Demand (Veh/hr)
Junction Arrivals
(Veh)
Capacity (Veh/hr)
RFCThroughput
(Veh/hr)Start queue
(Veh)End queue
(Veh)Delay (s) LOS
B-C 110 28 686 0.160 110 0.2 0.2 6.249 A
B-A 50 12 403 0.123 50 0.1 0.1 10.192 B
C-A 47 12 47
C-B 246 61 715 0.343 246 0.5 0.5 7.669 A
A-B 67 17 67
A-C 91 23 91
StreamTotal
Demand (Veh/hr)
Junction Arrivals
(Veh)
Capacity (Veh/hr)
RFCThroughput
(Veh/hr)Start queue
(Veh)End queue
(Veh)Delay (s) LOS
B-C 90 22 698 0.129 90 0.2 0.1 5.922 A
B-A 40 10 426 0.095 41 0.1 0.1 9.342 A
C-A 39 10 39
C-B 200 50 724 0.277 201 0.5 0.4 6.892 A
A-B 55 14 55
A-C 75 19 75
StreamTotal
Demand (Veh/hr)
Junction Arrivals
(Veh)
Capacity (Veh/hr)
RFCThroughput
(Veh/hr)Start queue
(Veh)End queue
(Veh)Delay (s) LOS
B-C 75 19 707 0.107 75 0.1 0.1 5.703 A
B-A 34 8 443 0.077 34 0.1 0.1 8.807 A
C-A 32 8 32
C-B 168 42 730 0.230 168 0.4 0.3 6.411 A
A-B 46 11 46
A-C 62 16 62
Page 5 of 35
17/08/2021file:///C:/Files%20-%20Simon/BTP%20Projects/BTP-2128%20-%20WCM%20White...

Existing Layout - 2025 Core, AM2
Data Errors and WarningsNo errors or warnings
Junction Network
Junctions
Junction Network Options
Traffic Demand
Demand Set Details
Demand overview (Traffic)
Origin-Destination Data
Vehicle Mix
Results
Junction Name Junction Type Major road direction Junction Delay (s) Junction LOS
1 Junction T-Junction Two-way 6.18 A
Driving side Lighting Network residual capacity (%) First arm reaching threshold
Left Normal/unknown 79 Stream B-A
IDScenario
nameTime Period
nameTraffic profile
typeStart time (HH:mm)
Finish time (HH:mm)
Time segment length (min)
Run automatically
D2 2025 Core AM2 ONE HOUR 07:45 09:15 15 �
Vehicle mix varies over turn Vehicle mix varies over entry Vehicle mix source PCU Factor for a HV (PCU)
� � HV Percentages 2.00
Arm Linked arm Profile type Use O-D data Average Demand (Veh/hr) Scaling Factor (%)
A - St Bees Rd north ONE HOUR � 171 100.000
B - Mirehouse Rd ONE HOUR � 233 100.000
C - St Bees Rd south ONE HOUR � 303 100.000
Demand (Veh/hr)
To
From
A - St Bees Rd north B - Mirehouse Rd C - St Bees Rd south
A - St Bees Rd north 0 154 17
B - Mirehouse Rd 69 0 164
C - St Bees Rd south 31 272 0
Heavy Vehicle Percentages
To
From
A - St Bees Rd north B - Mirehouse Rd C - St Bees Rd south
A - St Bees Rd north 0 1 12
B - Mirehouse Rd 1 0 1
C - St Bees Rd south 6 0 0
Page 6 of 35
17/08/2021file:///C:/Files%20-%20Simon/BTP%20Projects/BTP-2128%20-%20WCM%20White...
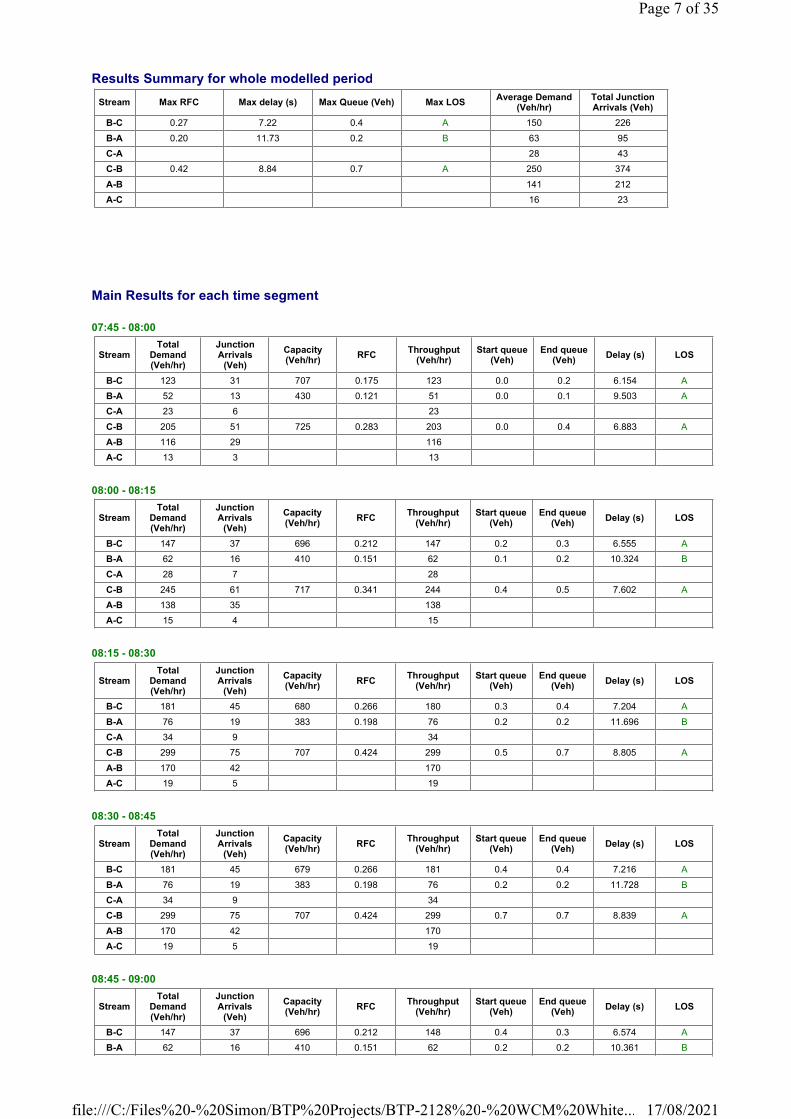
Results Summary for whole modelled period
Main Results for each time segment
07:45 - 08:00
08:00 - 08:15
08:15 - 08:30
08:30 - 08:45
08:45 - 09:00
Stream Max RFC Max delay (s) Max Queue (Veh) Max LOSAverage Demand
(Veh/hr)Total Junction Arrivals (Veh)
B-C 0.27 7.22 0.4 A 150 226
B-A 0.20 11.73 0.2 B 63 95
C-A 28 43
C-B 0.42 8.84 0.7 A 250 374
A-B 141 212
A-C 16 23
StreamTotal
Demand (Veh/hr)
Junction Arrivals
(Veh)
Capacity (Veh/hr)
RFCThroughput
(Veh/hr)Start queue
(Veh)End queue
(Veh)Delay (s) LOS
B-C 123 31 707 0.175 123 0.0 0.2 6.154 A
B-A 52 13 430 0.121 51 0.0 0.1 9.503 A
C-A 23 6 23
C-B 205 51 725 0.283 203 0.0 0.4 6.883 A
A-B 116 29 116
A-C 13 3 13
StreamTotal
Demand (Veh/hr)
Junction Arrivals
(Veh)
Capacity (Veh/hr)
RFCThroughput
(Veh/hr)Start queue
(Veh)End queue
(Veh)Delay (s) LOS
B-C 147 37 696 0.212 147 0.2 0.3 6.555 A
B-A 62 16 410 0.151 62 0.1 0.2 10.324 B
C-A 28 7 28
C-B 245 61 717 0.341 244 0.4 0.5 7.602 A
A-B 138 35 138
A-C 15 4 15
StreamTotal
Demand (Veh/hr)
Junction Arrivals
(Veh)
Capacity (Veh/hr)
RFCThroughput
(Veh/hr)Start queue
(Veh)End queue
(Veh)Delay (s) LOS
B-C 181 45 680 0.266 180 0.3 0.4 7.204 A
B-A 76 19 383 0.198 76 0.2 0.2 11.696 B
C-A 34 9 34
C-B 299 75 707 0.424 299 0.5 0.7 8.805 A
A-B 170 42 170
A-C 19 5 19
StreamTotal
Demand (Veh/hr)
Junction Arrivals
(Veh)
Capacity (Veh/hr)
RFCThroughput
(Veh/hr)Start queue
(Veh)End queue
(Veh)Delay (s) LOS
B-C 181 45 679 0.266 181 0.4 0.4 7.216 A
B-A 76 19 383 0.198 76 0.2 0.2 11.728 B
C-A 34 9 34
C-B 299 75 707 0.424 299 0.7 0.7 8.839 A
A-B 170 42 170
A-C 19 5 19
StreamTotal
Demand (Veh/hr)
Junction Arrivals
(Veh)
Capacity (Veh/hr)
RFCThroughput
(Veh/hr)Start queue
(Veh)End queue
(Veh)Delay (s) LOS
B-C 147 37 696 0.212 148 0.4 0.3 6.574 A
B-A 62 16 410 0.151 62 0.2 0.2 10.361 B
Page 7 of 35
17/08/2021file:///C:/Files%20-%20Simon/BTP%20Projects/BTP-2128%20-%20WCM%20White...
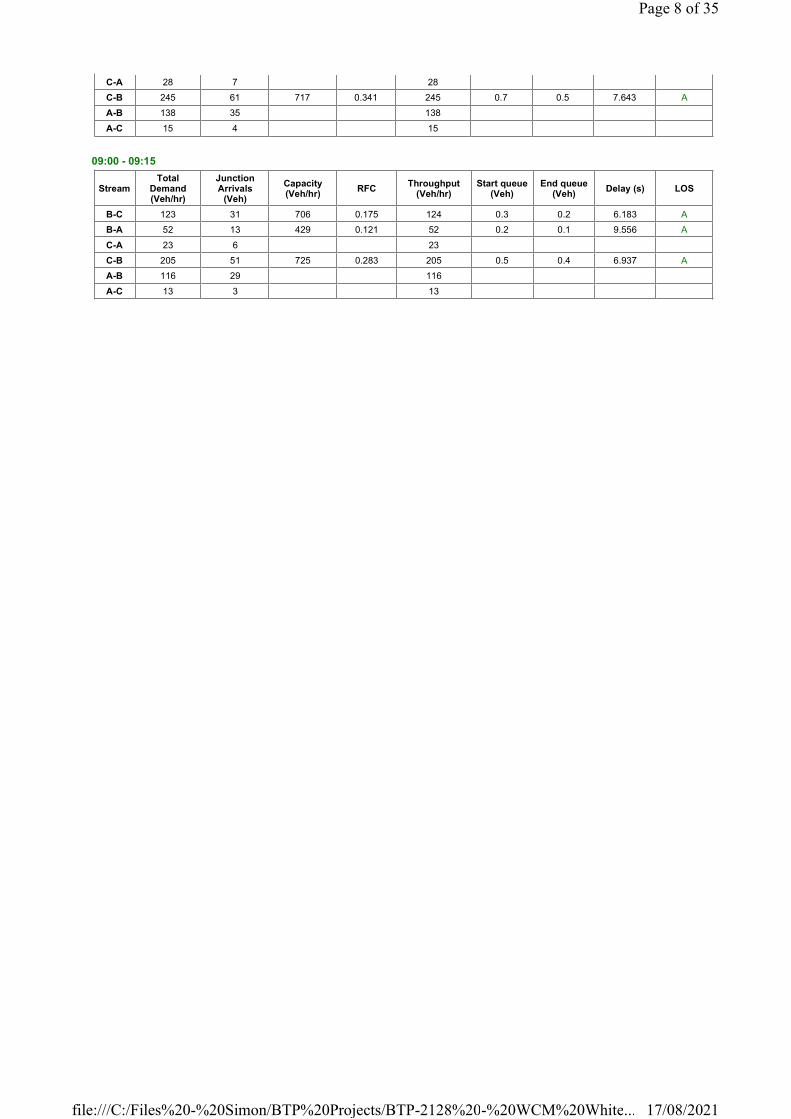
09:00 - 09:15
C-A 28 7 28
C-B 245 61 717 0.341 245 0.7 0.5 7.643 A
A-B 138 35 138
A-C 15 4 15
StreamTotal
Demand (Veh/hr)
Junction Arrivals
(Veh)
Capacity (Veh/hr)
RFCThroughput
(Veh/hr)Start queue
(Veh)End queue
(Veh)Delay (s) LOS
B-C 123 31 706 0.175 124 0.3 0.2 6.183 A
B-A 52 13 429 0.121 52 0.2 0.1 9.556 A
C-A 23 6 23
C-B 205 51 725 0.283 205 0.5 0.4 6.937 A
A-B 116 29 116
A-C 13 3 13
Page 8 of 35
17/08/2021file:///C:/Files%20-%20Simon/BTP%20Projects/BTP-2128%20-%20WCM%20White...

Existing Layout - 2025 Core, PM
Data Errors and WarningsNo errors or warnings
Junction Network
Junctions
Junction Network Options
Traffic Demand
Demand Set Details
Demand overview (Traffic)
Origin-Destination Data
Vehicle Mix
Results
Junction Name Junction Type Major road direction Junction Delay (s) Junction LOS
1 Junction T-Junction Two-way 7.10 A
Driving side Lighting Network residual capacity (%) First arm reaching threshold
Left Normal/unknown 36 Stream B-A
IDScenario
nameTime Period
nameTraffic profile
typeStart time (HH:mm)
Finish time (HH:mm)
Time segment length (min)
Run automatically
D3 2025 Core PM ONE HOUR 16:45 18:15 15 �
Vehicle mix varies over turn Vehicle mix varies over entry Vehicle mix source PCU Factor for a HV (PCU)
� � HV Percentages 2.00
Arm Linked arm Profile type Use O-D data Average Demand (Veh/hr) Scaling Factor (%)
A - St Bees Rd north ONE HOUR � 166 100.000
B - Mirehouse Rd ONE HOUR � 379 100.000
C - St Bees Rd south ONE HOUR � 233 100.000
Demand (Veh/hr)
To
From
A - St Bees Rd north B - Mirehouse Rd C - St Bees Rd south
A - St Bees Rd north 0 144 22
B - Mirehouse Rd 140 0 239
C - St Bees Rd south 73 160 0
Heavy Vehicle Percentages
To
From
A - St Bees Rd north B - Mirehouse Rd C - St Bees Rd south
A - St Bees Rd north 0 1 0
B - Mirehouse Rd 1 0 0
C - St Bees Rd south 4 0 0
Page 9 of 35
17/08/2021file:///C:/Files%20-%20Simon/BTP%20Projects/BTP-2128%20-%20WCM%20White...

Results Summary for whole modelled period
Main Results for each time segment
16:45 - 17:00
17:00 - 17:15
17:15 - 17:30
17:30 - 17:45
17:45 - 18:00
Stream Max RFC Max delay (s) Max Queue (Veh) Max LOSAverage Demand
(Veh/hr)Total Junction Arrivals (Veh)
B-C 0.43 10.26 0.7 B 219 329
B-A 0.38 14.35 0.6 B 128 193
C-A 67 100
C-B 0.25 6.76 0.3 A 147 220
A-B 132 198
A-C 20 30
StreamTotal
Demand (Veh/hr)
Junction Arrivals
(Veh)
Capacity (Veh/hr)
RFCThroughput
(Veh/hr)Start queue
(Veh)End queue
(Veh)Delay (s) LOS
B-C 180 45 672 0.268 178 0.0 0.4 7.274 A
B-A 105 26 458 0.230 104 0.0 0.3 10.137 B
C-A 55 14 55
C-B 120 30 726 0.166 120 0.0 0.2 5.928 A
A-B 108 27 108
A-C 17 4 17
StreamTotal
Demand (Veh/hr)
Junction Arrivals
(Veh)
Capacity (Veh/hr)
RFCThroughput
(Veh/hr)Start queue
(Veh)End queue
(Veh)Delay (s) LOS
B-C 215 54 651 0.330 214 0.4 0.5 8.240 A
B-A 126 31 438 0.287 125 0.3 0.4 11.500 B
C-A 66 16 66
C-B 144 36 719 0.200 144 0.2 0.2 6.256 A
A-B 129 32 129
A-C 20 5 20
StreamTotal
Demand (Veh/hr)
Junction Arrivals
(Veh)
Capacity (Veh/hr)
RFCThroughput
(Veh/hr)Start queue
(Veh)End queue
(Veh)Delay (s) LOS
B-C 263 66 615 0.428 262 0.5 0.7 10.175 B
B-A 154 39 405 0.380 153 0.4 0.6 14.239 B
C-A 80 20 80
C-B 176 44 709 0.248 176 0.2 0.3 6.747 A
A-B 159 40 159
A-C 24 6 24
StreamTotal
Demand (Veh/hr)
Junction Arrivals
(Veh)
Capacity (Veh/hr)
RFCThroughput
(Veh/hr)Start queue
(Veh)End queue
(Veh)Delay (s) LOS
B-C 263 66 614 0.429 263 0.7 0.7 10.258 B
B-A 154 39 405 0.381 154 0.6 0.6 14.353 B
C-A 80 20 80
C-B 176 44 709 0.248 176 0.3 0.3 6.755 A
A-B 159 40 159
A-C 24 6 24
StreamTotal
Demand (Veh/hr)
Junction Arrivals
(Veh)
Capacity (Veh/hr)
RFCThroughput
(Veh/hr)Start queue
(Veh)End queue
(Veh)Delay (s) LOS
B-C 215 54 650 0.331 216 0.7 0.5 8.316 A
B-A 126 31 438 0.288 127 0.6 0.4 11.606 B
Page 10 of 35
17/08/2021file:///C:/Files%20-%20Simon/BTP%20Projects/BTP-2128%20-%20WCM%20White...

18:00 - 18:15
C-A 66 16 66
C-B 144 36 719 0.200 144 0.3 0.3 6.267 A
A-B 129 32 129
A-C 20 5 20
StreamTotal
Demand (Veh/hr)
Junction Arrivals
(Veh)
Capacity (Veh/hr)
RFCThroughput
(Veh/hr)Start queue
(Veh)End queue
(Veh)Delay (s) LOS
B-C 180 45 671 0.268 180 0.5 0.4 7.349 A
B-A 105 26 458 0.230 106 0.4 0.3 10.246 B
C-A 55 14 55
C-B 120 30 726 0.166 121 0.3 0.2 5.946 A
A-B 108 27 108
A-C 17 4 17
Page 11 of 35
17/08/2021file:///C:/Files%20-%20Simon/BTP%20Projects/BTP-2128%20-%20WCM%20White...

Existing Layout - 2025 Construction, AM1
Data Errors and WarningsNo errors or warnings
Junction Network
Junctions
Junction Network Options
Traffic Demand
Demand Set Details
Demand overview (Traffic)
Origin-Destination Data
Vehicle Mix
Results
Junction Name Junction Type Major road direction Junction Delay (s) Junction LOS
1 Junction T-Junction Two-way 5.24 A
Driving side Lighting Network residual capacity (%) First arm reaching threshold
Left Normal/unknown 116 Stream B-A
ID Scenario nameTime Period
nameTraffic profile
typeStart time (HH:mm)
Finish time (HH:mm)
Time segment length (min)
Run automatically
D4 2025 Construction AM1 ONE HOUR 06:45 08:15 15 �
Vehicle mix varies over turn Vehicle mix varies over entry Vehicle mix source PCU Factor for a HV (PCU)
� � HV Percentages 2.00
Arm Linked arm Profile type Use O-D data Average Demand (Veh/hr) Scaling Factor (%)
A - St Bees Rd north ONE HOUR � 140 100.000
B - Mirehouse Rd ONE HOUR � 194 100.000
C - St Bees Rd south ONE HOUR � 274 100.000
Demand (Veh/hr)
To
From
A - St Bees Rd north B - Mirehouse Rd C - St Bees Rd south
A - St Bees Rd north 0 59 81
B - Mirehouse Rd 40 0 154
C - St Bees Rd south 46 228 0
Heavy Vehicle Percentages
To
From
A - St Bees Rd north B - Mirehouse Rd C - St Bees Rd south
A - St Bees Rd north 0 2 4
B - Mirehouse Rd 0 0 1
C - St Bees Rd south 2 0 0
Page 12 of 35
17/08/2021file:///C:/Files%20-%20Simon/BTP%20Projects/BTP-2128%20-%20WCM%20White...
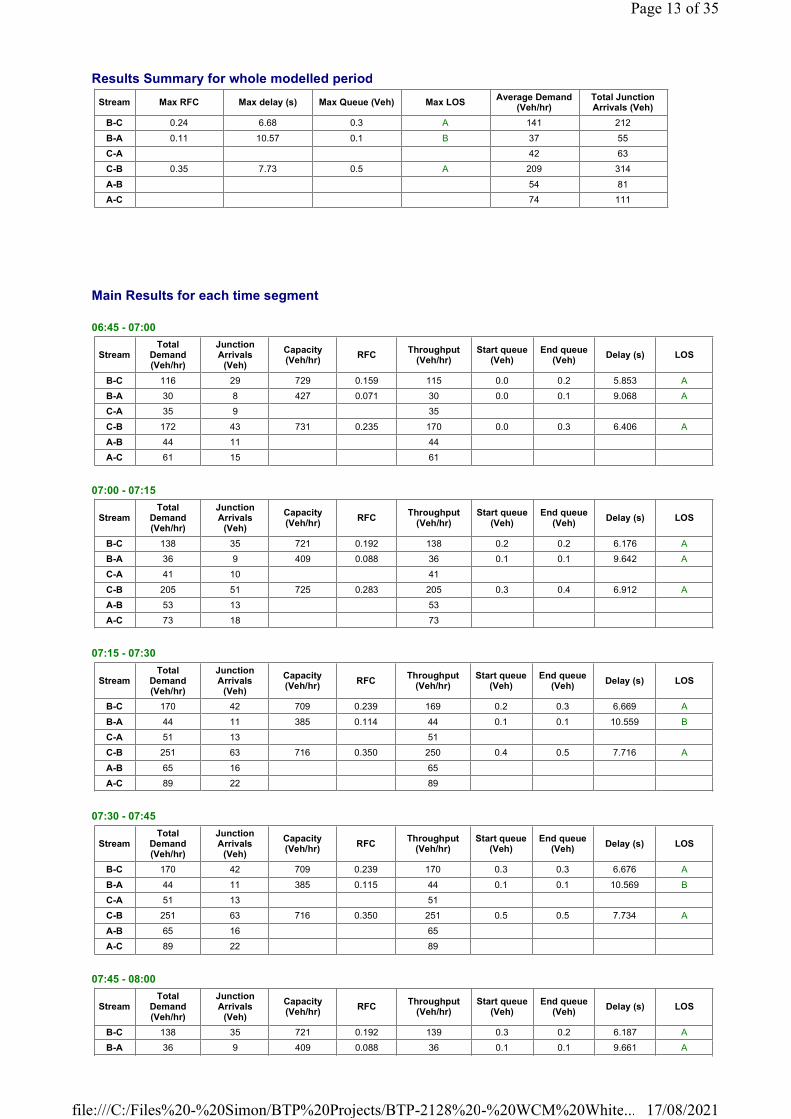
Results Summary for whole modelled period
Main Results for each time segment
06:45 - 07:00
07:00 - 07:15
07:15 - 07:30
07:30 - 07:45
07:45 - 08:00
Stream Max RFC Max delay (s) Max Queue (Veh) Max LOSAverage Demand
(Veh/hr)Total Junction Arrivals (Veh)
B-C 0.24 6.68 0.3 A 141 212
B-A 0.11 10.57 0.1 B 37 55
C-A 42 63
C-B 0.35 7.73 0.5 A 209 314
A-B 54 81
A-C 74 111
StreamTotal
Demand (Veh/hr)
Junction Arrivals
(Veh)
Capacity (Veh/hr)
RFCThroughput
(Veh/hr)Start queue
(Veh)End queue
(Veh)Delay (s) LOS
B-C 116 29 729 0.159 115 0.0 0.2 5.853 A
B-A 30 8 427 0.071 30 0.0 0.1 9.068 A
C-A 35 9 35
C-B 172 43 731 0.235 170 0.0 0.3 6.406 A
A-B 44 11 44
A-C 61 15 61
StreamTotal
Demand (Veh/hr)
Junction Arrivals
(Veh)
Capacity (Veh/hr)
RFCThroughput
(Veh/hr)Start queue
(Veh)End queue
(Veh)Delay (s) LOS
B-C 138 35 721 0.192 138 0.2 0.2 6.176 A
B-A 36 9 409 0.088 36 0.1 0.1 9.642 A
C-A 41 10 41
C-B 205 51 725 0.283 205 0.3 0.4 6.912 A
A-B 53 13 53
A-C 73 18 73
StreamTotal
Demand (Veh/hr)
Junction Arrivals
(Veh)
Capacity (Veh/hr)
RFCThroughput
(Veh/hr)Start queue
(Veh)End queue
(Veh)Delay (s) LOS
B-C 170 42 709 0.239 169 0.2 0.3 6.669 A
B-A 44 11 385 0.114 44 0.1 0.1 10.559 B
C-A 51 13 51
C-B 251 63 716 0.350 250 0.4 0.5 7.716 A
A-B 65 16 65
A-C 89 22 89
StreamTotal
Demand (Veh/hr)
Junction Arrivals
(Veh)
Capacity (Veh/hr)
RFCThroughput
(Veh/hr)Start queue
(Veh)End queue
(Veh)Delay (s) LOS
B-C 170 42 709 0.239 170 0.3 0.3 6.676 A
B-A 44 11 385 0.115 44 0.1 0.1 10.569 B
C-A 51 13 51
C-B 251 63 716 0.350 251 0.5 0.5 7.734 A
A-B 65 16 65
A-C 89 22 89
StreamTotal
Demand (Veh/hr)
Junction Arrivals
(Veh)
Capacity (Veh/hr)
RFCThroughput
(Veh/hr)Start queue
(Veh)End queue
(Veh)Delay (s) LOS
B-C 138 35 721 0.192 139 0.3 0.2 6.187 A
B-A 36 9 409 0.088 36 0.1 0.1 9.661 A
Page 13 of 35
17/08/2021file:///C:/Files%20-%20Simon/BTP%20Projects/BTP-2128%20-%20WCM%20White...

08:00 - 08:15
C-A 41 10 41
C-B 205 51 725 0.283 206 0.5 0.4 6.935 A
A-B 53 13 53
A-C 73 18 73
StreamTotal
Demand (Veh/hr)
Junction Arrivals
(Veh)
Capacity (Veh/hr)
RFCThroughput
(Veh/hr)Start queue
(Veh)End queue
(Veh)Delay (s) LOS
B-C 116 29 729 0.159 116 0.2 0.2 5.876 A
B-A 30 8 426 0.071 30 0.1 0.1 9.095 A
C-A 35 9 35
C-B 172 43 731 0.235 172 0.4 0.3 6.439 A
A-B 44 11 44
A-C 61 15 61
Page 14 of 35
17/08/2021file:///C:/Files%20-%20Simon/BTP%20Projects/BTP-2128%20-%20WCM%20White...

Existing Layout - 2025 Construction, PM
Data Errors and WarningsNo errors or warnings
Junction Network
Junctions
Junction Network Options
Traffic Demand
Demand Set Details
Demand overview (Traffic)
Origin-Destination Data
Vehicle Mix
Results
Junction Name Junction Type Major road direction Junction Delay (s) Junction LOS
1 Junction T-Junction Two-way 7.30 A
Driving side Lighting Network residual capacity (%) First arm reaching threshold
Left Normal/unknown 34 Stream B-A
ID Scenario nameTime Period
nameTraffic profile
typeStart time (HH:mm)
Finish time (HH:mm)
Time segment length (min)
Run automatically
D5 2025 Construction PM ONE HOUR 16:45 18:15 15 �
Vehicle mix varies over turn Vehicle mix varies over entry Vehicle mix source PCU Factor for a HV (PCU)
� � HV Percentages 2.00
Arm Linked arm Profile type Use O-D data Average Demand (Veh/hr) Scaling Factor (%)
A - St Bees Rd north ONE HOUR � 166 100.000
B - Mirehouse Rd ONE HOUR � 367 100.000
C - St Bees Rd south ONE HOUR � 278 100.000
Demand (Veh/hr)
To
From
A - St Bees Rd north B - Mirehouse Rd C - St Bees Rd south
A - St Bees Rd north 0 144 22
B - Mirehouse Rd 126 0 241
C - St Bees Rd south 70 208 0
Heavy Vehicle Percentages
To
From
A - St Bees Rd north B - Mirehouse Rd C - St Bees Rd south
A - St Bees Rd north 0 1 0
B - Mirehouse Rd 2 0 1
C - St Bees Rd south 4 1 0
Page 15 of 35
17/08/2021file:///C:/Files%20-%20Simon/BTP%20Projects/BTP-2128%20-%20WCM%20White...

Results Summary for whole modelled period
Main Results for each time segment
16:45 - 17:00
17:00 - 17:15
17:15 - 17:30
17:30 - 17:45
17:45 - 18:00
Stream Max RFC Max delay (s) Max Queue (Veh) Max LOSAverage Demand
(Veh/hr)Total Junction Arrivals (Veh)
B-C 0.43 10.21 0.7 B 221 332
B-A 0.37 14.92 0.6 B 116 173
C-A 64 96
C-B 0.33 7.61 0.5 A 191 286
A-B 132 198
A-C 20 30
StreamTotal
Demand (Veh/hr)
Junction Arrivals
(Veh)
Capacity (Veh/hr)
RFCThroughput
(Veh/hr)Start queue
(Veh)End queue
(Veh)Delay (s) LOS
B-C 181 45 674 0.269 180 0.0 0.4 7.271 A
B-A 95 24 437 0.217 94 0.0 0.3 10.474 B
C-A 53 13 53
C-B 157 39 719 0.218 155 0.0 0.3 6.377 A
A-B 108 27 108
A-C 17 4 17
StreamTotal
Demand (Veh/hr)
Junction Arrivals
(Veh)
Capacity (Veh/hr)
RFCThroughput
(Veh/hr)Start queue
(Veh)End queue
(Veh)Delay (s) LOS
B-C 217 54 653 0.332 216 0.4 0.5 8.225 A
B-A 113 28 415 0.273 113 0.3 0.4 11.885 B
C-A 63 16 63
C-B 187 47 712 0.263 187 0.3 0.4 6.849 A
A-B 129 32 129
A-C 20 5 20
StreamTotal
Demand (Veh/hr)
Junction Arrivals
(Veh)
Capacity (Veh/hr)
RFCThroughput
(Veh/hr)Start queue
(Veh)End queue
(Veh)Delay (s) LOS
B-C 265 66 619 0.429 264 0.5 0.7 10.130 B
B-A 139 35 380 0.365 138 0.4 0.6 14.803 B
C-A 77 19 77
C-B 229 57 702 0.326 229 0.4 0.5 7.596 A
A-B 159 40 159
A-C 24 6 24
StreamTotal
Demand (Veh/hr)
Junction Arrivals
(Veh)
Capacity (Veh/hr)
RFCThroughput
(Veh/hr)Start queue
(Veh)End queue
(Veh)Delay (s) LOS
B-C 265 66 618 0.430 265 0.7 0.7 10.211 B
B-A 139 35 380 0.365 139 0.6 0.6 14.922 B
C-A 77 19 77
C-B 229 57 702 0.326 229 0.5 0.5 7.611 A
A-B 159 40 159
A-C 24 6 24
StreamTotal
Demand (Veh/hr)
Junction Arrivals
(Veh)
Capacity (Veh/hr)
RFCThroughput
(Veh/hr)Start queue
(Veh)End queue
(Veh)Delay (s) LOS
B-C 217 54 652 0.332 218 0.7 0.5 8.298 A
B-A 113 28 415 0.273 114 0.6 0.4 11.996 B
Page 16 of 35
17/08/2021file:///C:/Files%20-%20Simon/BTP%20Projects/BTP-2128%20-%20WCM%20White...

18:00 - 18:15
C-A 63 16 63
C-B 187 47 712 0.263 187 0.5 0.4 6.873 A
A-B 129 32 129
A-C 20 5 20
StreamTotal
Demand (Veh/hr)
Junction Arrivals
(Veh)
Capacity (Veh/hr)
RFCThroughput
(Veh/hr)Start queue
(Veh)End queue
(Veh)Delay (s) LOS
B-C 181 45 672 0.270 182 0.5 0.4 7.345 A
B-A 95 24 437 0.217 95 0.4 0.3 10.554 B
C-A 53 13 53
C-B 157 39 719 0.218 157 0.4 0.3 6.409 A
A-B 108 27 108
A-C 17 4 17
Page 17 of 35
17/08/2021file:///C:/Files%20-%20Simon/BTP%20Projects/BTP-2128%20-%20WCM%20White...

Existing Layout - 2025 Operation, AM2
Data Errors and WarningsNo errors or warnings
Junction Network
Junctions
Junction Network Options
Traffic Demand
Demand Set Details
Demand overview (Traffic)
Origin-Destination Data
Vehicle Mix
Results
Junction Name Junction Type Major road direction Junction Delay (s) Junction LOS
1 Junction T-Junction Two-way 6.32 A
Driving side Lighting Network residual capacity (%) First arm reaching threshold
Left Normal/unknown 73 Stream B-A
IDScenario
nameTime Period
nameTraffic profile
typeStart time (HH:mm)
Finish time (HH:mm)
Time segment length (min)
Run automatically
D6 2025 Operation AM2 ONE HOUR 07:45 09:15 15 �
Vehicle mix varies over turn Vehicle mix varies over entry Vehicle mix source PCU Factor for a HV (PCU)
� � HV Percentages 2.00
Arm Linked arm Profile type Use O-D data Average Demand (Veh/hr) Scaling Factor (%)
A - St Bees Rd north ONE HOUR � 171 100.000
B - Mirehouse Rd ONE HOUR � 257 100.000
C - St Bees Rd south ONE HOUR � 303 100.000
Demand (Veh/hr)
To
From
A - St Bees Rd north B - Mirehouse Rd C - St Bees Rd south
A - St Bees Rd north 0 155 16
B - Mirehouse Rd 69 0 188
C - St Bees Rd south 31 272 0
Heavy Vehicle Percentages
To
From
A - St Bees Rd north B - Mirehouse Rd C - St Bees Rd south
A - St Bees Rd north 0 1 13
B - Mirehouse Rd 1 0 1
C - St Bees Rd south 6 0 0
Page 18 of 35
17/08/2021file:///C:/Files%20-%20Simon/BTP%20Projects/BTP-2128%20-%20WCM%20White...

Results Summary for whole modelled period
Main Results for each time segment
07:45 - 08:00
08:00 - 08:15
08:15 - 08:30
08:30 - 08:45
08:45 - 09:00
Stream Max RFC Max delay (s) Max Queue (Veh) Max LOSAverage Demand
(Veh/hr)Total Junction Arrivals (Veh)
B-C 0.30 7.55 0.4 A 173 259
B-A 0.20 11.98 0.3 B 63 95
C-A 28 43
C-B 0.42 8.84 0.7 A 250 374
A-B 142 213
A-C 15 22
StreamTotal
Demand (Veh/hr)
Junction Arrivals
(Veh)
Capacity (Veh/hr)
RFCThroughput
(Veh/hr)Start queue
(Veh)End queue
(Veh)Delay (s) LOS
B-C 142 35 712 0.199 141 0.0 0.2 6.291 A
B-A 52 13 425 0.122 51 0.0 0.1 9.623 A
C-A 23 6 23
C-B 205 51 725 0.283 203 0.0 0.4 6.883 A
A-B 117 29 117
A-C 12 3 12
StreamTotal
Demand (Veh/hr)
Junction Arrivals
(Veh)
Capacity (Veh/hr)
RFCThroughput
(Veh/hr)Start queue
(Veh)End queue
(Veh)Delay (s) LOS
B-C 169 42 701 0.241 169 0.2 0.3 6.761 A
B-A 62 16 405 0.153 62 0.1 0.2 10.479 B
C-A 28 7 28
C-B 245 61 717 0.341 244 0.4 0.5 7.602 A
A-B 139 35 139
A-C 14 4 14
StreamTotal
Demand (Veh/hr)
Junction Arrivals
(Veh)
Capacity (Veh/hr)
RFCThroughput
(Veh/hr)Start queue
(Veh)End queue
(Veh)Delay (s) LOS
B-C 207 52 684 0.303 207 0.3 0.4 7.535 A
B-A 76 19 377 0.202 76 0.2 0.2 11.942 B
C-A 34 9 34
C-B 299 75 707 0.424 299 0.5 0.7 8.805 A
A-B 171 43 171
A-C 18 4 18
StreamTotal
Demand (Veh/hr)
Junction Arrivals
(Veh)
Capacity (Veh/hr)
RFCThroughput
(Veh/hr)Start queue
(Veh)End queue
(Veh)Delay (s) LOS
B-C 207 52 684 0.303 207 0.4 0.4 7.552 A
B-A 76 19 377 0.202 76 0.2 0.3 11.976 B
C-A 34 9 34
C-B 299 75 707 0.424 299 0.7 0.7 8.839 A
A-B 171 43 171
A-C 18 4 18
StreamTotal
Demand (Veh/hr)
Junction Arrivals
(Veh)
Capacity (Veh/hr)
RFCThroughput
(Veh/hr)Start queue
(Veh)End queue
(Veh)Delay (s) LOS
B-C 169 42 701 0.241 169 0.4 0.3 6.783 A
B-A 62 16 405 0.153 62 0.3 0.2 10.520 B
Page 19 of 35
17/08/2021file:///C:/Files%20-%20Simon/BTP%20Projects/BTP-2128%20-%20WCM%20White...

09:00 - 09:15
C-A 28 7 28
C-B 245 61 717 0.341 245 0.7 0.5 7.644 A
A-B 139 35 139
A-C 14 4 14
StreamTotal
Demand (Veh/hr)
Junction Arrivals
(Veh)
Capacity (Veh/hr)
RFCThroughput
(Veh/hr)Start queue
(Veh)End queue
(Veh)Delay (s) LOS
B-C 142 35 711 0.199 142 0.3 0.3 6.326 A
B-A 52 13 424 0.122 52 0.2 0.1 9.675 A
C-A 23 6 23
C-B 205 51 725 0.283 205 0.5 0.4 6.938 A
A-B 117 29 117
A-C 12 3 12
Page 20 of 35
17/08/2021file:///C:/Files%20-%20Simon/BTP%20Projects/BTP-2128%20-%20WCM%20White...

Existing Layout - 2025 Operation, PM
Data Errors and WarningsNo errors or warnings
Junction Network
Junctions
Junction Network Options
Traffic Demand
Demand Set Details
Demand overview (Traffic)
Origin-Destination Data
Vehicle Mix
Results
Junction Name Junction Type Major road direction Junction Delay (s) Junction LOS
1 Junction T-Junction Two-way 7.15 A
Driving side Lighting Network residual capacity (%) First arm reaching threshold
Left Normal/unknown 35 Stream B-A
IDScenario
nameTime Period
nameTraffic profile
typeStart time (HH:mm)
Finish time (HH:mm)
Time segment length (min)
Run automatically
D7 2025 Operation PM ONE HOUR 16:45 18:15 15 �
Vehicle mix varies over turn Vehicle mix varies over entry Vehicle mix source PCU Factor for a HV (PCU)
� � HV Percentages 2.00
Arm Linked arm Profile type Use O-D data Average Demand (Veh/hr) Scaling Factor (%)
A - St Bees Rd north ONE HOUR � 166 100.000
B - Mirehouse Rd ONE HOUR � 374 100.000
C - St Bees Rd south ONE HOUR � 252 100.000
Demand (Veh/hr)
To
From
A - St Bees Rd north B - Mirehouse Rd C - St Bees Rd south
A - St Bees Rd north 0 144 22
B - Mirehouse Rd 136 0 238
C - St Bees Rd south 72 180 0
Heavy Vehicle Percentages
To
From
A - St Bees Rd north B - Mirehouse Rd C - St Bees Rd south
A - St Bees Rd north 0 1 0
B - Mirehouse Rd 1 0 0
C - St Bees Rd south 4 1 0
Page 21 of 35
17/08/2021file:///C:/Files%20-%20Simon/BTP%20Projects/BTP-2128%20-%20WCM%20White...

Results Summary for whole modelled period
Main Results for each time segment
16:45 - 17:00
17:00 - 17:15
17:15 - 17:30
17:30 - 17:45
17:45 - 18:00
Stream Max RFC Max delay (s) Max Queue (Veh) Max LOSAverage Demand
(Veh/hr)Total Junction Arrivals (Veh)
B-C 0.43 10.16 0.7 B 218 328
B-A 0.38 14.55 0.6 B 125 187
C-A 66 99
C-B 0.28 7.14 0.4 A 165 248
A-B 132 198
A-C 20 30
StreamTotal
Demand (Veh/hr)
Junction Arrivals
(Veh)
Capacity (Veh/hr)
RFCThroughput
(Veh/hr)Start queue
(Veh)End queue
(Veh)Delay (s) LOS
B-C 179 45 674 0.266 178 0.0 0.4 7.232 A
B-A 102 26 452 0.226 101 0.0 0.3 10.228 B
C-A 54 14 54
C-B 136 34 719 0.188 135 0.0 0.2 6.160 A
A-B 108 27 108
A-C 17 4 17
StreamTotal
Demand (Veh/hr)
Junction Arrivals
(Veh)
Capacity (Veh/hr)
RFCThroughput
(Veh/hr)Start queue
(Veh)End queue
(Veh)Delay (s) LOS
B-C 214 53 653 0.328 213 0.4 0.5 8.179 A
B-A 122 31 431 0.284 122 0.3 0.4 11.625 B
C-A 65 16 65
C-B 162 40 712 0.227 162 0.2 0.3 6.539 A
A-B 129 32 129
A-C 20 5 20
StreamTotal
Demand (Veh/hr)
Junction Arrivals
(Veh)
Capacity (Veh/hr)
RFCThroughput
(Veh/hr)Start queue
(Veh)End queue
(Veh)Delay (s) LOS
B-C 262 66 617 0.425 261 0.5 0.7 10.079 B
B-A 150 37 398 0.377 149 0.4 0.6 14.434 B
C-A 79 20 79
C-B 198 50 702 0.282 198 0.3 0.4 7.134 A
A-B 159 40 159
A-C 24 6 24
StreamTotal
Demand (Veh/hr)
Junction Arrivals
(Veh)
Capacity (Veh/hr)
RFCThroughput
(Veh/hr)Start queue
(Veh)End queue
(Veh)Delay (s) LOS
B-C 262 66 616 0.425 262 0.7 0.7 10.160 B
B-A 150 37 397 0.377 150 0.6 0.6 14.551 B
C-A 79 20 79
C-B 198 50 702 0.282 198 0.4 0.4 7.145 A
A-B 159 40 159
A-C 24 6 24
StreamTotal
Demand (Veh/hr)
Junction Arrivals
(Veh)
Capacity (Veh/hr)
RFCThroughput
(Veh/hr)Start queue
(Veh)End queue
(Veh)Delay (s) LOS
B-C 214 53 652 0.328 215 0.7 0.5 8.254 A
B-A 122 31 431 0.284 123 0.6 0.4 11.735 B
Page 22 of 35
17/08/2021file:///C:/Files%20-%20Simon/BTP%20Projects/BTP-2128%20-%20WCM%20White...

18:00 - 18:15
C-A 65 16 65
C-B 162 40 712 0.227 162 0.4 0.3 6.555 A
A-B 129 32 129
A-C 20 5 20
StreamTotal
Demand (Veh/hr)
Junction Arrivals
(Veh)
Capacity (Veh/hr)
RFCThroughput
(Veh/hr)Start queue
(Veh)End queue
(Veh)Delay (s) LOS
B-C 179 45 673 0.266 180 0.5 0.4 7.309 A
B-A 102 26 451 0.227 103 0.4 0.3 10.337 B
C-A 54 14 54
C-B 136 34 719 0.188 136 0.3 0.2 6.174 A
A-B 108 27 108
A-C 17 4 17
Page 23 of 35
17/08/2021file:///C:/Files%20-%20Simon/BTP%20Projects/BTP-2128%20-%20WCM%20White...

Existing Layout - 2035 Core, AM2
Data Errors and WarningsNo errors or warnings
Junction Network
Junctions
Junction Network Options
Traffic Demand
Demand Set Details
Demand overview (Traffic)
Origin-Destination Data
Vehicle Mix
Results
Junction Name Junction Type Major road direction Junction Delay (s) Junction LOS
1 Junction T-Junction Two-way 9.01 A
Driving side Lighting Network residual capacity (%) First arm reaching threshold
Left Normal/unknown 31 Stream C-B
IDScenario
nameTime Period
nameTraffic profile
typeStart time (HH:mm)
Finish time (HH:mm)
Time segment length (min)
Run automatically
D8 2035 Core AM2 ONE HOUR 07:45 09:15 15 �
Vehicle mix varies over turn Vehicle mix varies over entry Vehicle mix source PCU Factor for a HV (PCU)
� � HV Percentages 2.00
Arm Linked arm Profile type Use O-D data Average Demand (Veh/hr) Scaling Factor (%)
A - St Bees Rd north ONE HOUR � 178 100.000
B - Mirehouse Rd ONE HOUR � 303 100.000
C - St Bees Rd south ONE HOUR � 475 100.000
Demand (Veh/hr)
To
From
A - St Bees Rd north B - Mirehouse Rd C - St Bees Rd south
A - St Bees Rd north 0 157 21
B - Mirehouse Rd 56 0 247
C - St Bees Rd south 67 408 0
Heavy Vehicle Percentages
To
From
A - St Bees Rd north B - Mirehouse Rd C - St Bees Rd south
A - St Bees Rd north 0 1 10
B - Mirehouse Rd 2 0 0
C - St Bees Rd south 3 0 0
Page 24 of 35
17/08/2021file:///C:/Files%20-%20Simon/BTP%20Projects/BTP-2128%20-%20WCM%20White...
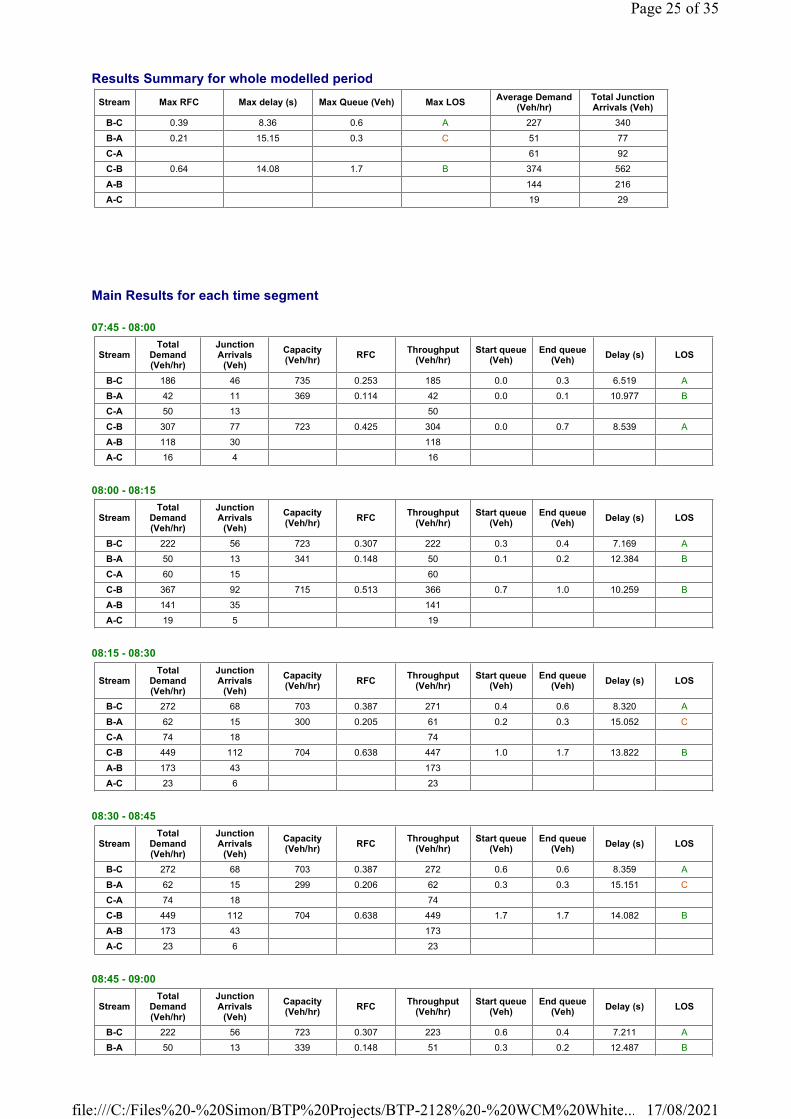
Results Summary for whole modelled period
Main Results for each time segment
07:45 - 08:00
08:00 - 08:15
08:15 - 08:30
08:30 - 08:45
08:45 - 09:00
Stream Max RFC Max delay (s) Max Queue (Veh) Max LOSAverage Demand
(Veh/hr)Total Junction Arrivals (Veh)
B-C 0.39 8.36 0.6 A 227 340
B-A 0.21 15.15 0.3 C 51 77
C-A 61 92
C-B 0.64 14.08 1.7 B 374 562
A-B 144 216
A-C 19 29
StreamTotal
Demand (Veh/hr)
Junction Arrivals
(Veh)
Capacity (Veh/hr)
RFCThroughput
(Veh/hr)Start queue
(Veh)End queue
(Veh)Delay (s) LOS
B-C 186 46 735 0.253 185 0.0 0.3 6.519 A
B-A 42 11 369 0.114 42 0.0 0.1 10.977 B
C-A 50 13 50
C-B 307 77 723 0.425 304 0.0 0.7 8.539 A
A-B 118 30 118
A-C 16 4 16
StreamTotal
Demand (Veh/hr)
Junction Arrivals
(Veh)
Capacity (Veh/hr)
RFCThroughput
(Veh/hr)Start queue
(Veh)End queue
(Veh)Delay (s) LOS
B-C 222 56 723 0.307 222 0.3 0.4 7.169 A
B-A 50 13 341 0.148 50 0.1 0.2 12.384 B
C-A 60 15 60
C-B 367 92 715 0.513 366 0.7 1.0 10.259 B
A-B 141 35 141
A-C 19 5 19
StreamTotal
Demand (Veh/hr)
Junction Arrivals
(Veh)
Capacity (Veh/hr)
RFCThroughput
(Veh/hr)Start queue
(Veh)End queue
(Veh)Delay (s) LOS
B-C 272 68 703 0.387 271 0.4 0.6 8.320 A
B-A 62 15 300 0.205 61 0.2 0.3 15.052 C
C-A 74 18 74
C-B 449 112 704 0.638 447 1.0 1.7 13.822 B
A-B 173 43 173
A-C 23 6 23
StreamTotal
Demand (Veh/hr)
Junction Arrivals
(Veh)
Capacity (Veh/hr)
RFCThroughput
(Veh/hr)Start queue
(Veh)End queue
(Veh)Delay (s) LOS
B-C 272 68 703 0.387 272 0.6 0.6 8.359 A
B-A 62 15 299 0.206 62 0.3 0.3 15.151 C
C-A 74 18 74
C-B 449 112 704 0.638 449 1.7 1.7 14.082 B
A-B 173 43 173
A-C 23 6 23
StreamTotal
Demand (Veh/hr)
Junction Arrivals
(Veh)
Capacity (Veh/hr)
RFCThroughput
(Veh/hr)Start queue
(Veh)End queue
(Veh)Delay (s) LOS
B-C 222 56 723 0.307 223 0.6 0.4 7.211 A
B-A 50 13 339 0.148 51 0.3 0.2 12.487 B
Page 25 of 35
17/08/2021file:///C:/Files%20-%20Simon/BTP%20Projects/BTP-2128%20-%20WCM%20White...

09:00 - 09:15
C-A 60 15 60
C-B 367 92 715 0.513 369 1.7 1.1 10.488 B
A-B 141 35 141
A-C 19 5 19
StreamTotal
Demand (Veh/hr)
Junction Arrivals
(Veh)
Capacity (Veh/hr)
RFCThroughput
(Veh/hr)Start queue
(Veh)End queue
(Veh)Delay (s) LOS
B-C 186 46 735 0.253 186 0.4 0.3 6.572 A
B-A 42 11 368 0.115 42 0.2 0.1 11.070 B
C-A 50 13 50
C-B 307 77 723 0.425 308 1.1 0.8 8.712 A
A-B 118 30 118
A-C 16 4 16
Page 26 of 35
17/08/2021file:///C:/Files%20-%20Simon/BTP%20Projects/BTP-2128%20-%20WCM%20White...

Existing Layout - 2035 Core, PM
Data Errors and WarningsNo errors or warnings
Junction Network
Junctions
Junction Network Options
Traffic Demand
Demand Set Details
Demand overview (Traffic)
Origin-Destination Data
Vehicle Mix
Results
Junction Name Junction Type Major road direction Junction Delay (s) Junction LOS
1 Junction T-Junction Two-way 12.32 B
Driving side Lighting Network residual capacity (%) First arm reaching threshold
Left Normal/unknown 6 Stream B-A
IDScenario
nameTime Period
nameTraffic profile
typeStart time (HH:mm)
Finish time (HH:mm)
Time segment length (min)
Run automatically
D9 2035 Core PM ONE HOUR 16:45 18:15 15 �
Vehicle mix varies over turn Vehicle mix varies over entry Vehicle mix source PCU Factor for a HV (PCU)
� � HV Percentages 2.00
Arm Linked arm Profile type Use O-D data Average Demand (Veh/hr) Scaling Factor (%)
A - St Bees Rd north ONE HOUR � 168 100.000
B - Mirehouse Rd ONE HOUR � 511 100.000
C - St Bees Rd south ONE HOUR � 328 100.000
Demand (Veh/hr)
To
From
A - St Bees Rd north B - Mirehouse Rd C - St Bees Rd south
A - St Bees Rd north 0 146 22
B - Mirehouse Rd 141 0 370
C - St Bees Rd south 98 230 0
Heavy Vehicle Percentages
To
From
A - St Bees Rd north B - Mirehouse Rd C - St Bees Rd south
A - St Bees Rd north 0 1 0
B - Mirehouse Rd 1 0 0
C - St Bees Rd south 3 0 0
Page 27 of 35
17/08/2021file:///C:/Files%20-%20Simon/BTP%20Projects/BTP-2128%20-%20WCM%20White...
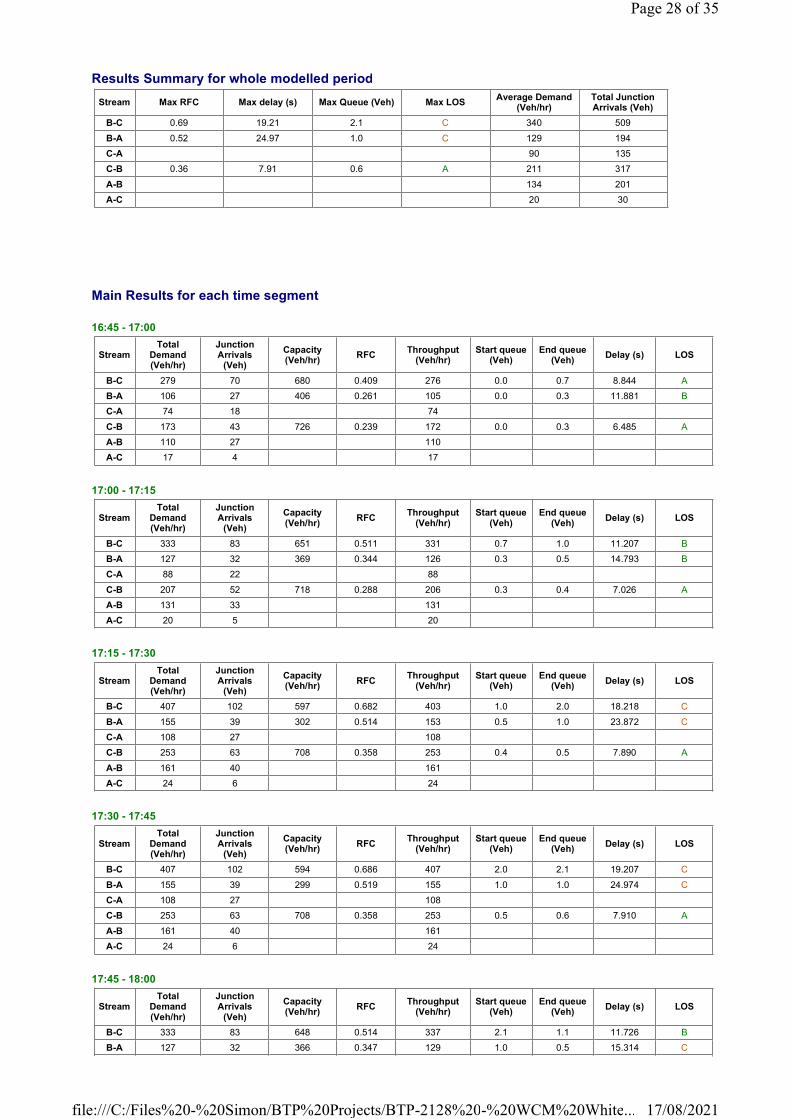
Results Summary for whole modelled period
Main Results for each time segment
16:45 - 17:00
17:00 - 17:15
17:15 - 17:30
17:30 - 17:45
17:45 - 18:00
Stream Max RFC Max delay (s) Max Queue (Veh) Max LOSAverage Demand
(Veh/hr)Total Junction Arrivals (Veh)
B-C 0.69 19.21 2.1 C 340 509
B-A 0.52 24.97 1.0 C 129 194
C-A 90 135
C-B 0.36 7.91 0.6 A 211 317
A-B 134 201
A-C 20 30
StreamTotal
Demand (Veh/hr)
Junction Arrivals
(Veh)
Capacity (Veh/hr)
RFCThroughput
(Veh/hr)Start queue
(Veh)End queue
(Veh)Delay (s) LOS
B-C 279 70 680 0.409 276 0.0 0.7 8.844 A
B-A 106 27 406 0.261 105 0.0 0.3 11.881 B
C-A 74 18 74
C-B 173 43 726 0.239 172 0.0 0.3 6.485 A
A-B 110 27 110
A-C 17 4 17
StreamTotal
Demand (Veh/hr)
Junction Arrivals
(Veh)
Capacity (Veh/hr)
RFCThroughput
(Veh/hr)Start queue
(Veh)End queue
(Veh)Delay (s) LOS
B-C 333 83 651 0.511 331 0.7 1.0 11.207 B
B-A 127 32 369 0.344 126 0.3 0.5 14.793 B
C-A 88 22 88
C-B 207 52 718 0.288 206 0.3 0.4 7.026 A
A-B 131 33 131
A-C 20 5 20
StreamTotal
Demand (Veh/hr)
Junction Arrivals
(Veh)
Capacity (Veh/hr)
RFCThroughput
(Veh/hr)Start queue
(Veh)End queue
(Veh)Delay (s) LOS
B-C 407 102 597 0.682 403 1.0 2.0 18.218 C
B-A 155 39 302 0.514 153 0.5 1.0 23.872 C
C-A 108 27 108
C-B 253 63 708 0.358 253 0.4 0.5 7.890 A
A-B 161 40 161
A-C 24 6 24
StreamTotal
Demand (Veh/hr)
Junction Arrivals
(Veh)
Capacity (Veh/hr)
RFCThroughput
(Veh/hr)Start queue
(Veh)End queue
(Veh)Delay (s) LOS
B-C 407 102 594 0.686 407 2.0 2.1 19.207 C
B-A 155 39 299 0.519 155 1.0 1.0 24.974 C
C-A 108 27 108
C-B 253 63 708 0.358 253 0.5 0.6 7.910 A
A-B 161 40 161
A-C 24 6 24
StreamTotal
Demand (Veh/hr)
Junction Arrivals
(Veh)
Capacity (Veh/hr)
RFCThroughput
(Veh/hr)Start queue
(Veh)End queue
(Veh)Delay (s) LOS
B-C 333 83 648 0.514 337 2.1 1.1 11.726 B
B-A 127 32 366 0.347 129 1.0 0.5 15.314 C
Page 28 of 35
17/08/2021file:///C:/Files%20-%20Simon/BTP%20Projects/BTP-2128%20-%20WCM%20White...

18:00 - 18:15
C-A 88 22 88
C-B 207 52 718 0.288 207 0.6 0.4 7.053 A
A-B 131 33 131
A-C 20 5 20
StreamTotal
Demand (Veh/hr)
Junction Arrivals
(Veh)
Capacity (Veh/hr)
RFCThroughput
(Veh/hr)Start queue
(Veh)End queue
(Veh)Delay (s) LOS
B-C 279 70 678 0.411 280 1.1 0.7 9.076 A
B-A 106 27 405 0.262 107 0.5 0.4 12.119 B
C-A 74 18 74
C-B 173 43 726 0.239 174 0.4 0.3 6.525 A
A-B 110 27 110
A-C 17 4 17
Page 29 of 35
17/08/2021file:///C:/Files%20-%20Simon/BTP%20Projects/BTP-2128%20-%20WCM%20White...

Existing Layout - 2035 Operation, AM2
Data Errors and WarningsNo errors or warnings
Junction Network
Junctions
Junction Network Options
Traffic Demand
Demand Set Details
Demand overview (Traffic)
Origin-Destination Data
Vehicle Mix
Results
Junction Name Junction Type Major road direction Junction Delay (s) Junction LOS
1 Junction T-Junction Two-way 9.22 A
Driving side Lighting Network residual capacity (%) First arm reaching threshold
Left Normal/unknown 31 Stream C-B
IDScenario
nameTime Period
nameTraffic profile
typeStart time (HH:mm)
Finish time (HH:mm)
Time segment length (min)
Run automatically
D10 2035 Operation AM2 ONE HOUR 07:45 09:15 15 �
Vehicle mix varies over turn Vehicle mix varies over entry Vehicle mix source PCU Factor for a HV (PCU)
� � HV Percentages 2.00
Arm Linked arm Profile type Use O-D data Average Demand (Veh/hr) Scaling Factor (%)
A - St Bees Rd north ONE HOUR � 179 100.000
B - Mirehouse Rd ONE HOUR � 339 100.000
C - St Bees Rd south ONE HOUR � 478 100.000
Demand (Veh/hr)
To
From
A - St Bees Rd north B - Mirehouse Rd C - St Bees Rd south
A - St Bees Rd north 0 158 21
B - Mirehouse Rd 56 0 283
C - St Bees Rd south 70 408 0
Heavy Vehicle Percentages
To
From
A - St Bees Rd north B - Mirehouse Rd C - St Bees Rd south
A - St Bees Rd north 0 1 10
B - Mirehouse Rd 2 0 0
C - St Bees Rd south 3 0 0
Page 30 of 35
17/08/2021file:///C:/Files%20-%20Simon/BTP%20Projects/BTP-2128%20-%20WCM%20White...

Results Summary for whole modelled period
Main Results for each time segment
07:45 - 08:00
08:00 - 08:15
08:15 - 08:30
08:30 - 08:45
08:45 - 09:00
Stream Max RFC Max delay (s) Max Queue (Veh) Max LOSAverage Demand
(Veh/hr)Total Junction Arrivals (Veh)
B-C 0.44 9.16 0.8 A 260 390
B-A 0.21 15.82 0.3 C 51 77
C-A 64 96
C-B 0.64 14.10 1.7 B 374 562
A-B 145 217
A-C 19 29
StreamTotal
Demand (Veh/hr)
Junction Arrivals
(Veh)
Capacity (Veh/hr)
RFCThroughput
(Veh/hr)Start queue
(Veh)End queue
(Veh)Delay (s) LOS
B-C 213 53 739 0.288 211 0.0 0.4 6.805 A
B-A 42 11 364 0.116 42 0.0 0.1 11.157 B
C-A 53 13 53
C-B 307 77 723 0.425 304 0.0 0.7 8.543 A
A-B 119 30 119
A-C 16 4 16
StreamTotal
Demand (Veh/hr)
Junction Arrivals
(Veh)
Capacity (Veh/hr)
RFCThroughput
(Veh/hr)Start queue
(Veh)End queue
(Veh)Delay (s) LOS
B-C 254 64 726 0.350 254 0.4 0.5 7.613 A
B-A 50 13 334 0.151 50 0.1 0.2 12.687 B
C-A 63 16 63
C-B 367 92 715 0.513 366 0.7 1.0 10.267 B
A-B 142 36 142
A-C 19 5 19
StreamTotal
Demand (Veh/hr)
Junction Arrivals
(Veh)
Capacity (Veh/hr)
RFCThroughput
(Veh/hr)Start queue
(Veh)End queue
(Veh)Delay (s) LOS
B-C 312 78 705 0.442 311 0.5 0.8 9.102 A
B-A 62 15 290 0.213 61 0.2 0.3 15.707 C
C-A 77 19 77
C-B 449 112 704 0.638 447 1.0 1.7 13.836 B
A-B 174 43 174
A-C 23 6 23
StreamTotal
Demand (Veh/hr)
Junction Arrivals
(Veh)
Capacity (Veh/hr)
RFCThroughput
(Veh/hr)Start queue
(Veh)End queue
(Veh)Delay (s) LOS
B-C 312 78 705 0.442 312 0.8 0.8 9.159 A
B-A 62 15 289 0.213 62 0.3 0.3 15.824 C
C-A 77 19 77
C-B 449 112 704 0.638 449 1.7 1.7 14.100 B
A-B 174 43 174
A-C 23 6 23
StreamTotal
Demand (Veh/hr)
Junction Arrivals
(Veh)
Capacity (Veh/hr)
RFCThroughput
(Veh/hr)Start queue
(Veh)End queue
(Veh)Delay (s) LOS
B-C 254 64 726 0.351 255 0.8 0.5 7.670 A
B-A 50 13 332 0.152 51 0.3 0.2 12.801 B
Page 31 of 35
17/08/2021file:///C:/Files%20-%20Simon/BTP%20Projects/BTP-2128%20-%20WCM%20White...
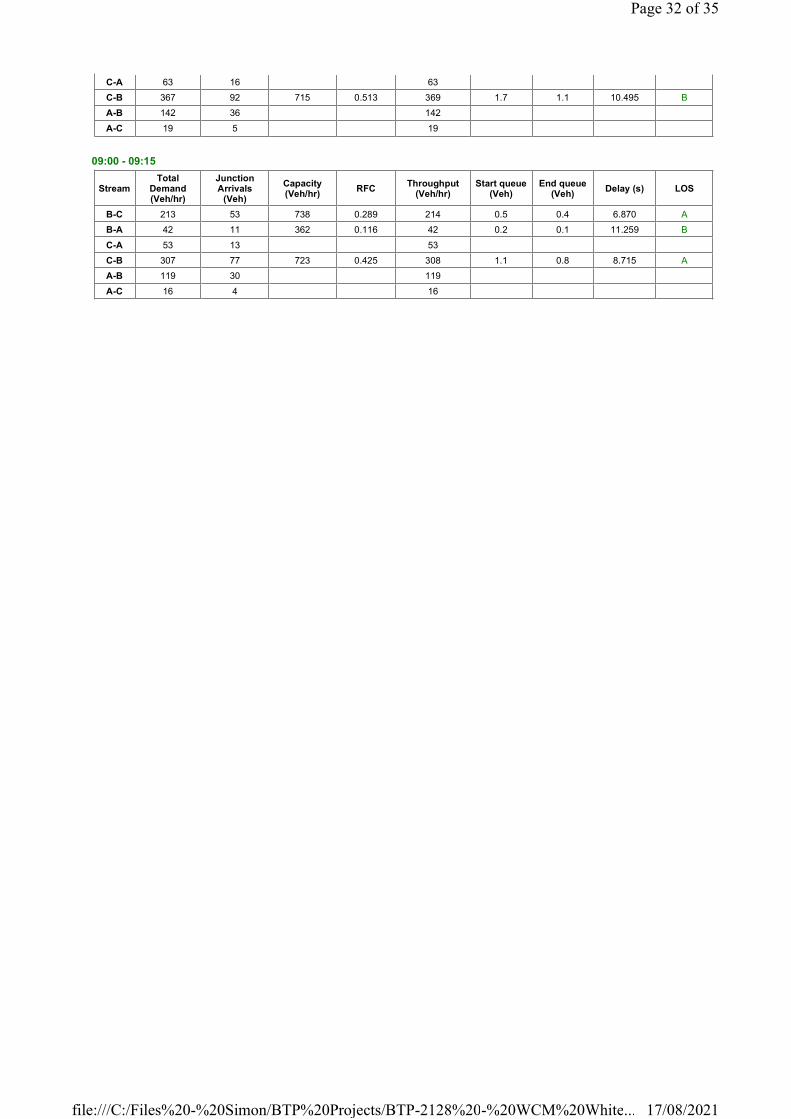
09:00 - 09:15
C-A 63 16 63
C-B 367 92 715 0.513 369 1.7 1.1 10.495 B
A-B 142 36 142
A-C 19 5 19
StreamTotal
Demand (Veh/hr)
Junction Arrivals
(Veh)
Capacity (Veh/hr)
RFCThroughput
(Veh/hr)Start queue
(Veh)End queue
(Veh)Delay (s) LOS
B-C 213 53 738 0.289 214 0.5 0.4 6.870 A
B-A 42 11 362 0.116 42 0.2 0.1 11.259 B
C-A 53 13 53
C-B 307 77 723 0.425 308 1.1 0.8 8.715 A
A-B 119 30 119
A-C 16 4 16
Page 32 of 35
17/08/2021file:///C:/Files%20-%20Simon/BTP%20Projects/BTP-2128%20-%20WCM%20White...

Existing Layout - 2035 Operation, PM
Data Errors and WarningsNo errors or warnings
Junction Network
Junctions
Junction Network Options
Traffic Demand
Demand Set Details
Demand overview (Traffic)
Origin-Destination Data
Vehicle Mix
Results
Junction Name Junction Type Major road direction Junction Delay (s) Junction LOS
1 Junction T-Junction Two-way 11.72 B
Driving side Lighting Network residual capacity (%) First arm reaching threshold
Left Normal/unknown 8 Stream B-A
IDScenario
nameTime Period
nameTraffic profile
typeStart time (HH:mm)
Finish time (HH:mm)
Time segment length (min)
Run automatically
D11 2035 Operation PM ONE HOUR 16:45 18:15 15 �
Vehicle mix varies over turn Vehicle mix varies over entry Vehicle mix source PCU Factor for a HV (PCU)
� � HV Percentages 2.00
Arm Linked arm Profile type Use O-D data Average Demand (Veh/hr) Scaling Factor (%)
A - St Bees Rd north ONE HOUR � 168 100.000
B - Mirehouse Rd ONE HOUR � 502 100.000
C - St Bees Rd south ONE HOUR � 358 100.000
Demand (Veh/hr)
To
From
A - St Bees Rd north B - Mirehouse Rd C - St Bees Rd south
A - St Bees Rd north 0 146 22
B - Mirehouse Rd 132 0 370
C - St Bees Rd south 97 261 0
Heavy Vehicle Percentages
To
From
A - St Bees Rd north B - Mirehouse Rd C - St Bees Rd south
A - St Bees Rd north 0 1 0
B - Mirehouse Rd 0 0 0
C - St Bees Rd south 3 0 0
Page 33 of 35
17/08/2021file:///C:/Files%20-%20Simon/BTP%20Projects/BTP-2128%20-%20WCM%20White...

Results Summary for whole modelled period
Main Results for each time segment
16:45 - 17:00
17:00 - 17:15
17:15 - 17:30
17:30 - 17:45
17:45 - 18:00
Stream Max RFC Max delay (s) Max Queue (Veh) Max LOSAverage Demand
(Veh/hr)Total Junction Arrivals (Veh)
B-C 0.67 18.11 2.0 C 340 509
B-A 0.49 24.01 0.9 C 121 182
C-A 89 134
C-B 0.41 8.55 0.7 A 239 359
A-B 134 201
A-C 20 30
StreamTotal
Demand (Veh/hr)
Junction Arrivals
(Veh)
Capacity (Veh/hr)
RFCThroughput
(Veh/hr)Start queue
(Veh)End queue
(Veh)Delay (s) LOS
B-C 279 70 687 0.405 276 0.0 0.7 8.696 A
B-A 99 25 402 0.247 98 0.0 0.3 11.800 B
C-A 73 18 73
C-B 196 49 726 0.271 195 0.0 0.4 6.767 A
A-B 110 27 110
A-C 17 4 17
StreamTotal
Demand (Veh/hr)
Junction Arrivals
(Veh)
Capacity (Veh/hr)
RFCThroughput
(Veh/hr)Start queue
(Veh)End queue
(Veh)Delay (s) LOS
B-C 333 83 660 0.504 331 0.7 1.0 10.923 B
B-A 119 30 364 0.326 118 0.3 0.5 14.614 B
C-A 87 22 87
C-B 235 59 718 0.327 234 0.4 0.5 7.428 A
A-B 131 33 131
A-C 20 5 20
StreamTotal
Demand (Veh/hr)
Junction Arrivals
(Veh)
Capacity (Veh/hr)
RFCThroughput
(Veh/hr)Start queue
(Veh)End queue
(Veh)Delay (s) LOS
B-C 407 102 608 0.670 404 1.0 1.9 17.289 C
B-A 145 36 298 0.488 144 0.5 0.9 23.091 C
C-A 107 27 107
C-B 287 72 708 0.406 287 0.5 0.7 8.520 A
A-B 161 40 161
A-C 24 6 24
StreamTotal
Demand (Veh/hr)
Junction Arrivals
(Veh)
Capacity (Veh/hr)
RFCThroughput
(Veh/hr)Start queue
(Veh)End queue
(Veh)Delay (s) LOS
B-C 407 102 605 0.673 407 1.9 2.0 18.106 C
B-A 145 36 295 0.493 145 0.9 0.9 24.009 C
C-A 107 27 107
C-B 287 72 708 0.406 287 0.7 0.7 8.551 A
A-B 161 40 161
A-C 24 6 24
StreamTotal
Demand (Veh/hr)
Junction Arrivals
(Veh)
Capacity (Veh/hr)
RFCThroughput
(Veh/hr)Start queue
(Veh)End queue
(Veh)Delay (s) LOS
B-C 333 83 657 0.507 336 2.0 1.1 11.374 B
B-A 119 30 361 0.329 120 0.9 0.5 15.069 C
Page 34 of 35
17/08/2021file:///C:/Files%20-%20Simon/BTP%20Projects/BTP-2128%20-%20WCM%20White...
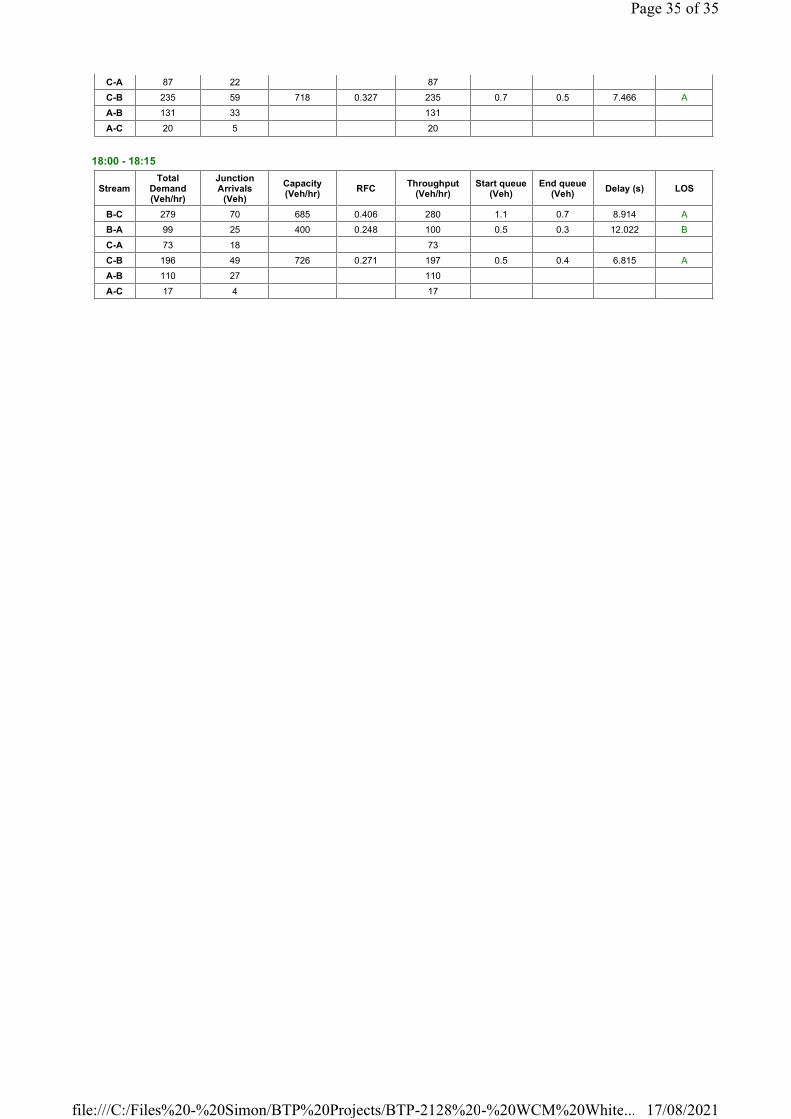
18:00 - 18:15
C-A 87 22 87
C-B 235 59 718 0.327 235 0.7 0.5 7.466 A
A-B 131 33 131
A-C 20 5 20
StreamTotal
Demand (Veh/hr)
Junction Arrivals
(Veh)
Capacity (Veh/hr)
RFCThroughput
(Veh/hr)Start queue
(Veh)End queue
(Veh)Delay (s) LOS
B-C 279 70 685 0.406 280 1.1 0.7 8.914 A
B-A 99 25 400 0.248 100 0.5 0.3 12.022 B
C-A 73 18 73
C-B 196 49 726 0.271 197 0.5 0.4 6.815 A
A-B 110 27 110
A-C 17 4 17
Page 35 of 35
17/08/2021file:///C:/Files%20-%20Simon/BTP%20Projects/BTP-2128%20-%20WCM%20White...
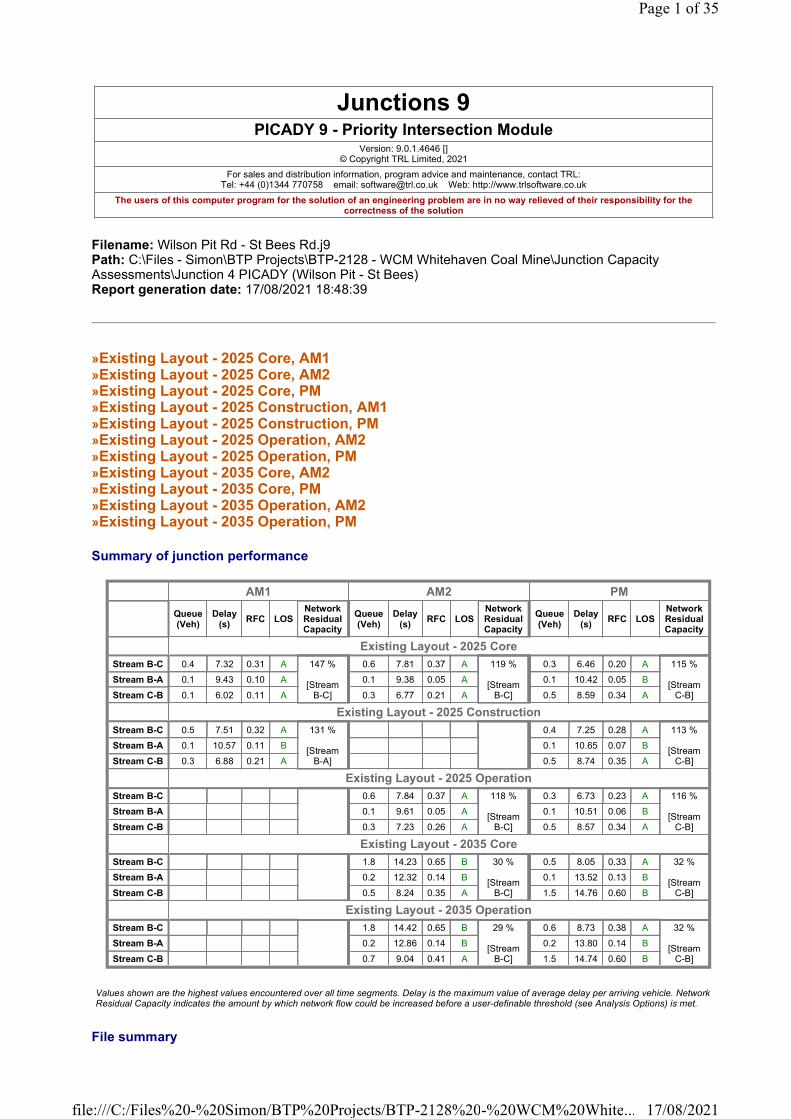
Filename: Wilson Pit Rd - St Bees Rd.j9Path: C:\Files - Simon\BTP Projects\BTP-2128 - WCM Whitehaven Coal Mine\Junction Capacity Assessments\Junction 4 PICADY (Wilson Pit - St Bees)Report generation date: 17/08/2021 18:48:39
»Existing Layout - 2025 Core, AM1»Existing Layout - 2025 Core, AM2»Existing Layout - 2025 Core, PM»Existing Layout - 2025 Construction, AM1»Existing Layout - 2025 Construction, PM»Existing Layout - 2025 Operation, AM2»Existing Layout - 2025 Operation, PM»Existing Layout - 2035 Core, AM2»Existing Layout - 2035 Core, PM»Existing Layout - 2035 Operation, AM2»Existing Layout - 2035 Operation, PM
Summary of junction performance
Junctions 9PICADY 9 - Priority Intersection Module
Version: 9.0.1.4646 [] © Copyright TRL Limited, 2021
For sales and distribution information, program advice and maintenance, contact TRL:Tel: +44 (0)1344 770758 email: [email protected] Web: http://www.trlsoftware.co.uk
The users of this computer program for the solution of an engineering problem are in no way relieved of their responsibility for the correctness of the solution
AM1 AM2 PM
Queue (Veh)
Delay (s)
RFC LOSNetwork Residual Capacity
Queue (Veh)
Delay (s)
RFC LOSNetwork Residual Capacity
Queue (Veh)
Delay (s)
RFC LOSNetwork Residual Capacity
Existing Layout - 2025 Core
Stream B-C 0.4 7.32 0.31 A 147 %
[Stream B-C]
0.6 7.81 0.37 A 119 %
[Stream B-C]
0.3 6.46 0.20 A 115 %
[Stream C-B]
Stream B-A 0.1 9.43 0.10 A 0.1 9.38 0.05 A 0.1 10.42 0.05 B
Stream C-B 0.1 6.02 0.11 A 0.3 6.77 0.21 A 0.5 8.59 0.34 A
Existing Layout - 2025 Construction
Stream B-C 0.5 7.51 0.32 A 131 %
[Stream B-A]
0.4 7.25 0.28 A 113 %
[Stream C-B]
Stream B-A 0.1 10.57 0.11 B 0.1 10.65 0.07 B
Stream C-B 0.3 6.88 0.21 A 0.5 8.74 0.35 A
Existing Layout - 2025 Operation
Stream B-C 0.6 7.84 0.37 A 118 %
[Stream B-C]
0.3 6.73 0.23 A 116 %
[Stream C-B]
Stream B-A 0.1 9.61 0.05 A 0.1 10.51 0.06 B
Stream C-B 0.3 7.23 0.26 A 0.5 8.57 0.34 A
Existing Layout - 2035 Core
Stream B-C 1.8 14.23 0.65 B 30 %
[Stream B-C]
0.5 8.05 0.33 A 32 %
[Stream C-B]
Stream B-A 0.2 12.32 0.14 B 0.1 13.52 0.13 B
Stream C-B 0.5 8.24 0.35 A 1.5 14.76 0.60 B
Existing Layout - 2035 Operation
Stream B-C 1.8 14.42 0.65 B 29 %
[Stream B-C]
0.6 8.73 0.38 A 32 %
[Stream C-B]
Stream B-A 0.2 12.86 0.14 B 0.2 13.80 0.14 B
Stream C-B 0.7 9.04 0.41 A 1.5 14.74 0.60 B
Values shown are the highest values encountered over all time segments. Delay is the maximum value of average delay per arriving vehicle. Network Residual Capacity indicates the amount by which network flow could be increased before a user-definable threshold (see Analysis Options) is met.
File summary
Page 1 of 35
17/08/2021file:///C:/Files%20-%20Simon/BTP%20Projects/BTP-2128%20-%20WCM%20White...

Units
Analysis Options
Demand Set Summary
Analysis Set Details
File Description
Title Wilson Pit Rd / St Bees Rd Jcn
Location Whitehaven
Site number
Date 17/08/2021
Version
Status
Identifier
Client WCM
Jobnumber BTP-2128
Enumerator SJE
Description Re-run of previous AECOM model for updated WCTM flow data
Distance units
Speed units
Traffic units input
Traffic units results
Flow units
Average delay units
Total delay units
Rate of delay units
m kph Veh Veh perHour s -Min perMin
Vehicle length (m)
Calculate Queue Percentiles
Calculate detailed queueing delay
Calculate residual capacity
Residual capacity criteria
type
RFC Threshold
Average Delay threshold (s)
Queue threshold
(PCU)
5.75 � Delay 0.85 36.00 20.00
ID Scenario nameTime Period
nameTraffic profile
typeStart time (HH:mm)
Finish time (HH:mm)
Time segment length (min)
Run automatically
D1 2025 Core AM1 ONE HOUR 06:45 08:15 15 �
D2 2025 Core AM2 ONE HOUR 07:45 09:15 15 �
D3 2025 Core PM ONE HOUR 16:45 18:15 15 �
D4 2025 Construction AM1 ONE HOUR 06:45 08:15 15 �
D5 2025 Construction PM ONE HOUR 16:45 18:15 15 �
D6 2025 Operation AM2 ONE HOUR 07:45 09:15 15 �
D7 2025 Operation PM ONE HOUR 16:45 18:15 15 �
D8 2035 Core AM2 ONE HOUR 07:45 09:15 15 �
D9 2035 Core PM ONE HOUR 16:45 18:15 15 �
D10 2035 Operation AM2 ONE HOUR 07:45 09:15 15 �
D11 2035 Operation PM ONE HOUR 16:45 18:15 15 �
ID Name Include in report Network flow scaling factor (%) Network capacity scaling factor (%)
A1 Existing Layout � 100.000 100.000
Page 2 of 35
17/08/2021file:///C:/Files%20-%20Simon/BTP%20Projects/BTP-2128%20-%20WCM%20White...
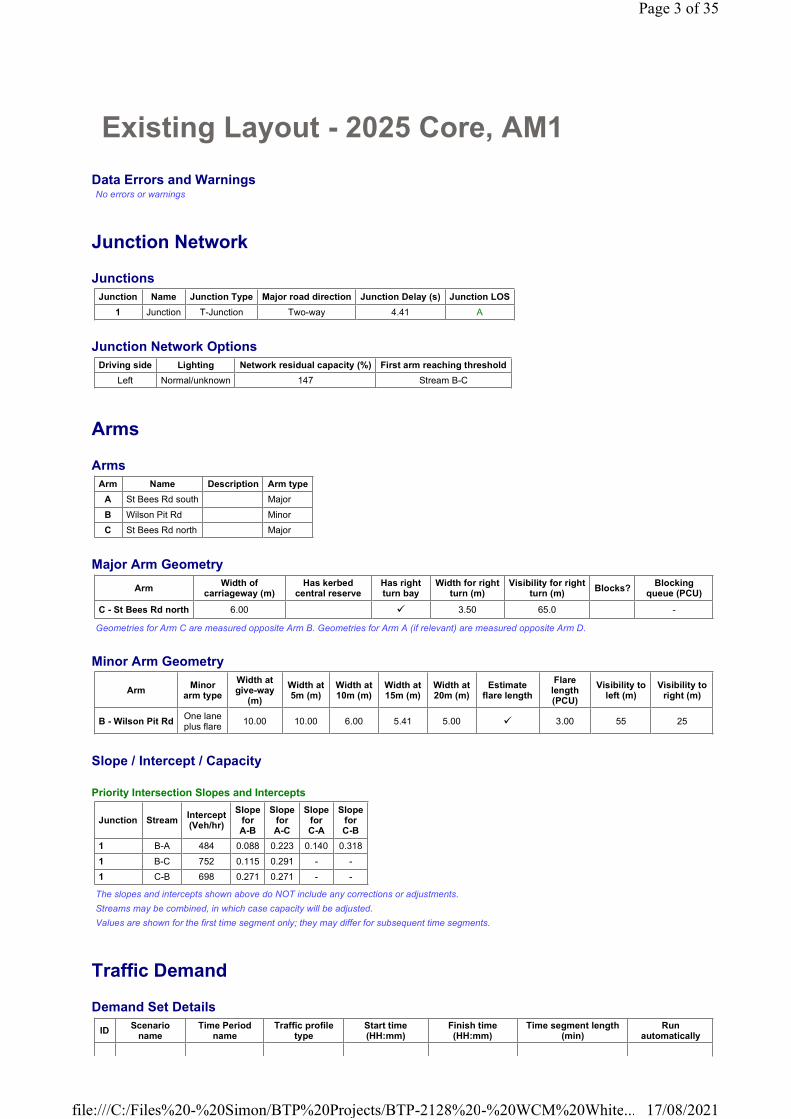
Existing Layout - 2025 Core, AM1
Data Errors and WarningsNo errors or warnings
Junction Network
Junctions
Junction Network Options
Arms
Arms
Major Arm Geometry
Geometries for Arm C are measured opposite Arm B. Geometries for Arm A (if relevant) are measured opposite Arm D.
Minor Arm Geometry
Slope / Intercept / Capacity
Priority Intersection Slopes and Intercepts
The slopes and intercepts shown above do NOT include any corrections or adjustments.
Streams may be combined, in which case capacity will be adjusted.
Values are shown for the first time segment only; they may differ for subsequent time segments.
Traffic Demand
Demand Set Details
Junction Name Junction Type Major road direction Junction Delay (s) Junction LOS
1 Junction T-Junction Two-way 4.41 A
Driving side Lighting Network residual capacity (%) First arm reaching threshold
Left Normal/unknown 147 Stream B-C
Arm Name Description Arm type
A St Bees Rd south Major
B Wilson Pit Rd Minor
C St Bees Rd north Major
ArmWidth of
carriageway (m)Has kerbed
central reserveHas right turn bay
Width for right turn (m)
Visibility for right turn (m)
Blocks?Blocking
queue (PCU)
C - St Bees Rd north 6.00 � 3.50 65.0 -
ArmMinor
arm type
Width at give-way
(m)
Width at 5m (m)
Width at 10m (m)
Width at 15m (m)
Width at 20m (m)
Estimate flare length
Flare length (PCU)
Visibility to left (m)
Visibility to right (m)
B - Wilson Pit RdOne lane plus flare
10.00 10.00 6.00 5.41 5.00 � 3.00 55 25
Junction StreamIntercept(Veh/hr)
SlopeforA-B
SlopeforA-C
SlopeforC-A
SlopeforC-B
1 B-A 484 0.088 0.223 0.140 0.318
1 B-C 752 0.115 0.291 - -
1 C-B 698 0.271 0.271 - -
IDScenario
nameTime Period
nameTraffic profile
typeStart time (HH:mm)
Finish time (HH:mm)
Time segment length (min)
Run automatically
Page 3 of 35
17/08/2021file:///C:/Files%20-%20Simon/BTP%20Projects/BTP-2128%20-%20WCM%20White...

Demand overview (Traffic)
Origin-Destination Data
Vehicle Mix
Results
Results Summary for whole modelled period
Main Results for each time segment
06:45 - 07:00
07:00 - 07:15
D1 2025 Core AM1 ONE HOUR 06:45 08:15 15 �
Vehicle mix varies over turn Vehicle mix varies over entry Vehicle mix source PCU Factor for a HV (PCU)
� � HV Percentages 2.00
Arm Linked arm Profile type Use O-D data Average Demand (Veh/hr) Scaling Factor (%)
A - St Bees Rd south ONE HOUR � 79 100.000
B - Wilson Pit Rd ONE HOUR � 236 100.000
C - St Bees Rd north ONE HOUR � 182 100.000
Demand (Veh/hr)
To
From
A - St Bees Rd south B - Wilson Pit Rd C - St Bees Rd north
A - St Bees Rd south 0 13 66
B - Wilson Pit Rd 37 0 199
C - St Bees Rd north 113 69 0
Heavy Vehicle Percentages
To
From
A - St Bees Rd south B - Wilson Pit Rd C - St Bees Rd north
A - St Bees Rd south 0 0 3
B - Wilson Pit Rd 0 0 0
C - St Bees Rd north 4 0 0
Stream Max RFC Max delay (s) Max Queue (Veh) Max LOSAverage Demand
(Veh/hr)Total Junction Arrivals (Veh)
B-C 0.31 7.32 0.4 A 183 274
B-A 0.10 9.43 0.1 A 34 51
C-A 104 156
C-B 0.11 6.02 0.1 A 63 95
A-B 12 18
A-C 61 91
StreamTotal
Demand (Veh/hr)
Junction Arrivals
(Veh)
Capacity (Veh/hr)
RFCThroughput
(Veh/hr)Start queue
(Veh)End queue
(Veh)Delay (s) LOS
B-C 150 37 724 0.207 149 0.0 0.3 6.241 A
B-A 28 7 442 0.063 28 0.0 0.1 8.675 A
C-A 85 21 85
C-B 52 13 682 0.076 52 0.0 0.1 5.711 A
A-B 10 2 10
A-C 50 12 50
Page 4 of 35
17/08/2021file:///C:/Files%20-%20Simon/BTP%20Projects/BTP-2128%20-%20WCM%20White...
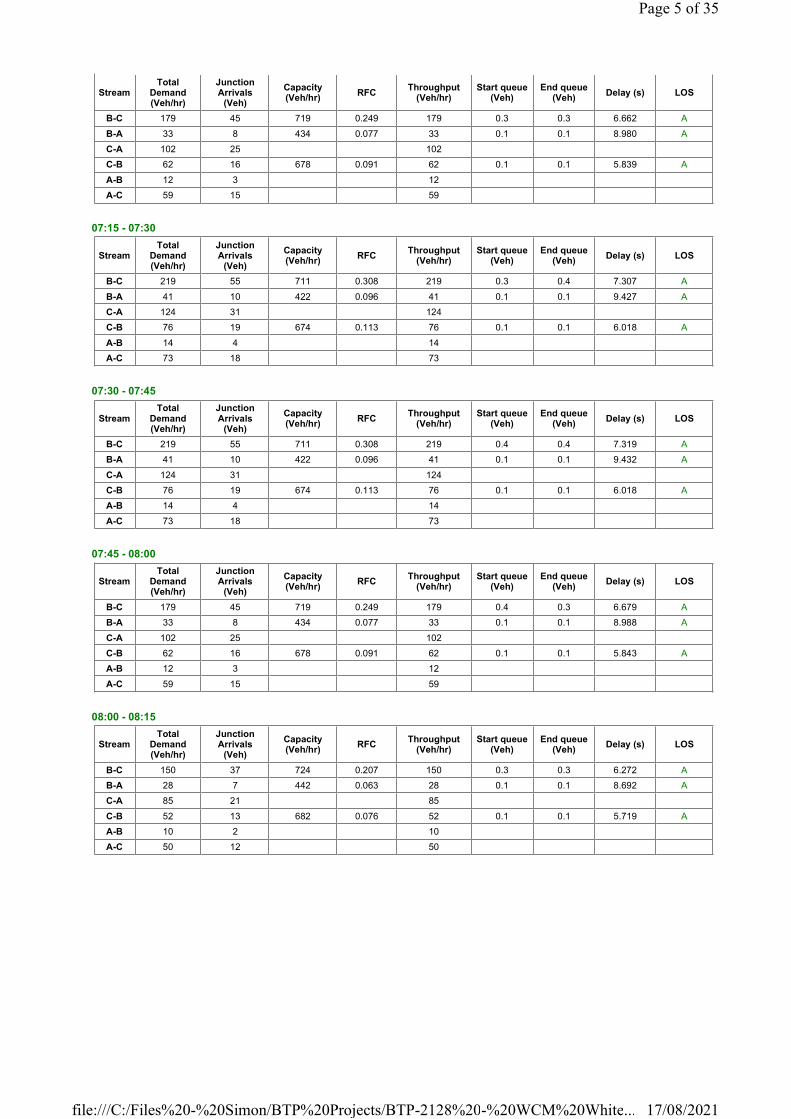
07:15 - 07:30
07:30 - 07:45
07:45 - 08:00
08:00 - 08:15
StreamTotal
Demand (Veh/hr)
Junction Arrivals
(Veh)
Capacity (Veh/hr)
RFCThroughput
(Veh/hr)Start queue
(Veh)End queue
(Veh)Delay (s) LOS
B-C 179 45 719 0.249 179 0.3 0.3 6.662 A
B-A 33 8 434 0.077 33 0.1 0.1 8.980 A
C-A 102 25 102
C-B 62 16 678 0.091 62 0.1 0.1 5.839 A
A-B 12 3 12
A-C 59 15 59
StreamTotal
Demand (Veh/hr)
Junction Arrivals
(Veh)
Capacity (Veh/hr)
RFCThroughput
(Veh/hr)Start queue
(Veh)End queue
(Veh)Delay (s) LOS
B-C 219 55 711 0.308 219 0.3 0.4 7.307 A
B-A 41 10 422 0.096 41 0.1 0.1 9.427 A
C-A 124 31 124
C-B 76 19 674 0.113 76 0.1 0.1 6.018 A
A-B 14 4 14
A-C 73 18 73
StreamTotal
Demand (Veh/hr)
Junction Arrivals
(Veh)
Capacity (Veh/hr)
RFCThroughput
(Veh/hr)Start queue
(Veh)End queue
(Veh)Delay (s) LOS
B-C 219 55 711 0.308 219 0.4 0.4 7.319 A
B-A 41 10 422 0.096 41 0.1 0.1 9.432 A
C-A 124 31 124
C-B 76 19 674 0.113 76 0.1 0.1 6.018 A
A-B 14 4 14
A-C 73 18 73
StreamTotal
Demand (Veh/hr)
Junction Arrivals
(Veh)
Capacity (Veh/hr)
RFCThroughput
(Veh/hr)Start queue
(Veh)End queue
(Veh)Delay (s) LOS
B-C 179 45 719 0.249 179 0.4 0.3 6.679 A
B-A 33 8 434 0.077 33 0.1 0.1 8.988 A
C-A 102 25 102
C-B 62 16 678 0.091 62 0.1 0.1 5.843 A
A-B 12 3 12
A-C 59 15 59
StreamTotal
Demand (Veh/hr)
Junction Arrivals
(Veh)
Capacity (Veh/hr)
RFCThroughput
(Veh/hr)Start queue
(Veh)End queue
(Veh)Delay (s) LOS
B-C 150 37 724 0.207 150 0.3 0.3 6.272 A
B-A 28 7 442 0.063 28 0.1 0.1 8.692 A
C-A 85 21 85
C-B 52 13 682 0.076 52 0.1 0.1 5.719 A
A-B 10 2 10
A-C 50 12 50
Page 5 of 35
17/08/2021file:///C:/Files%20-%20Simon/BTP%20Projects/BTP-2128%20-%20WCM%20White...
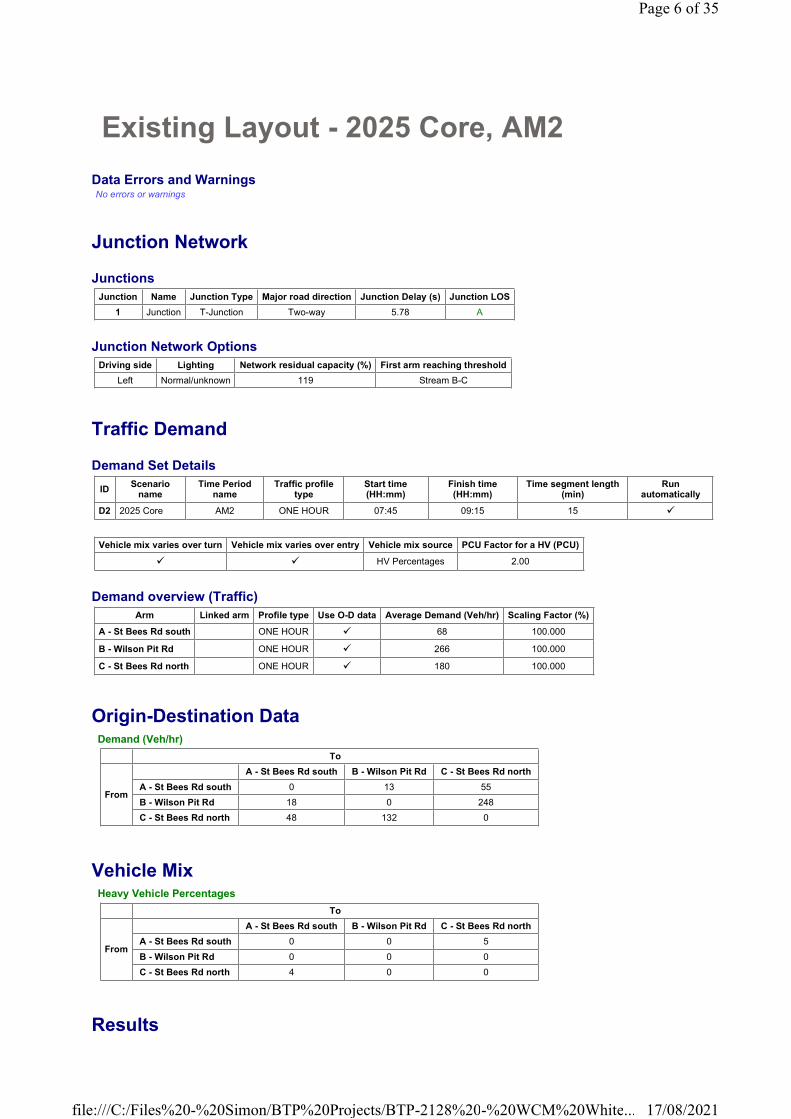
Existing Layout - 2025 Core, AM2
Data Errors and WarningsNo errors or warnings
Junction Network
Junctions
Junction Network Options
Traffic Demand
Demand Set Details
Demand overview (Traffic)
Origin-Destination Data
Vehicle Mix
Results
Junction Name Junction Type Major road direction Junction Delay (s) Junction LOS
1 Junction T-Junction Two-way 5.78 A
Driving side Lighting Network residual capacity (%) First arm reaching threshold
Left Normal/unknown 119 Stream B-C
IDScenario
nameTime Period
nameTraffic profile
typeStart time (HH:mm)
Finish time (HH:mm)
Time segment length (min)
Run automatically
D2 2025 Core AM2 ONE HOUR 07:45 09:15 15 �
Vehicle mix varies over turn Vehicle mix varies over entry Vehicle mix source PCU Factor for a HV (PCU)
� � HV Percentages 2.00
Arm Linked arm Profile type Use O-D data Average Demand (Veh/hr) Scaling Factor (%)
A - St Bees Rd south ONE HOUR � 68 100.000
B - Wilson Pit Rd ONE HOUR � 266 100.000
C - St Bees Rd north ONE HOUR � 180 100.000
Demand (Veh/hr)
To
From
A - St Bees Rd south B - Wilson Pit Rd C - St Bees Rd north
A - St Bees Rd south 0 13 55
B - Wilson Pit Rd 18 0 248
C - St Bees Rd north 48 132 0
Heavy Vehicle Percentages
To
From
A - St Bees Rd south B - Wilson Pit Rd C - St Bees Rd north
A - St Bees Rd south 0 0 5
B - Wilson Pit Rd 0 0 0
C - St Bees Rd north 4 0 0
Page 6 of 35
17/08/2021file:///C:/Files%20-%20Simon/BTP%20Projects/BTP-2128%20-%20WCM%20White...
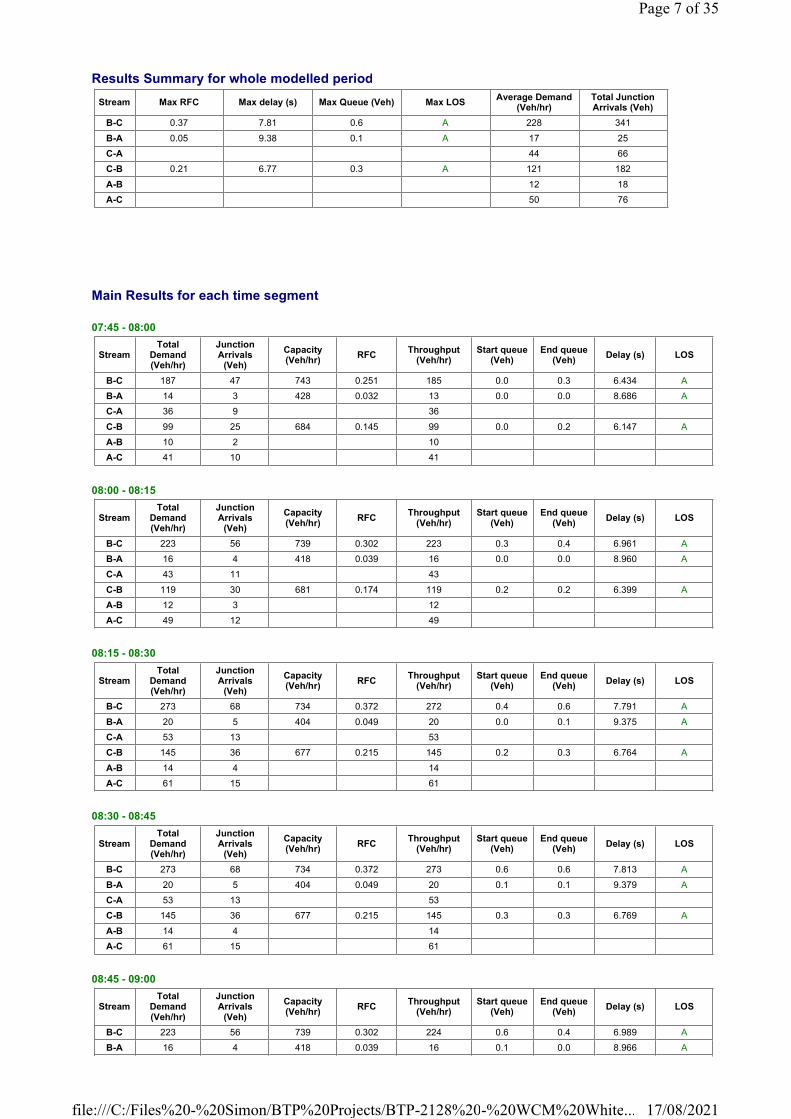
Results Summary for whole modelled period
Main Results for each time segment
07:45 - 08:00
08:00 - 08:15
08:15 - 08:30
08:30 - 08:45
08:45 - 09:00
Stream Max RFC Max delay (s) Max Queue (Veh) Max LOSAverage Demand
(Veh/hr)Total Junction Arrivals (Veh)
B-C 0.37 7.81 0.6 A 228 341
B-A 0.05 9.38 0.1 A 17 25
C-A 44 66
C-B 0.21 6.77 0.3 A 121 182
A-B 12 18
A-C 50 76
StreamTotal
Demand (Veh/hr)
Junction Arrivals
(Veh)
Capacity (Veh/hr)
RFCThroughput
(Veh/hr)Start queue
(Veh)End queue
(Veh)Delay (s) LOS
B-C 187 47 743 0.251 185 0.0 0.3 6.434 A
B-A 14 3 428 0.032 13 0.0 0.0 8.686 A
C-A 36 9 36
C-B 99 25 684 0.145 99 0.0 0.2 6.147 A
A-B 10 2 10
A-C 41 10 41
StreamTotal
Demand (Veh/hr)
Junction Arrivals
(Veh)
Capacity (Veh/hr)
RFCThroughput
(Veh/hr)Start queue
(Veh)End queue
(Veh)Delay (s) LOS
B-C 223 56 739 0.302 223 0.3 0.4 6.961 A
B-A 16 4 418 0.039 16 0.0 0.0 8.960 A
C-A 43 11 43
C-B 119 30 681 0.174 119 0.2 0.2 6.399 A
A-B 12 3 12
A-C 49 12 49
StreamTotal
Demand (Veh/hr)
Junction Arrivals
(Veh)
Capacity (Veh/hr)
RFCThroughput
(Veh/hr)Start queue
(Veh)End queue
(Veh)Delay (s) LOS
B-C 273 68 734 0.372 272 0.4 0.6 7.791 A
B-A 20 5 404 0.049 20 0.0 0.1 9.375 A
C-A 53 13 53
C-B 145 36 677 0.215 145 0.2 0.3 6.764 A
A-B 14 4 14
A-C 61 15 61
StreamTotal
Demand (Veh/hr)
Junction Arrivals
(Veh)
Capacity (Veh/hr)
RFCThroughput
(Veh/hr)Start queue
(Veh)End queue
(Veh)Delay (s) LOS
B-C 273 68 734 0.372 273 0.6 0.6 7.813 A
B-A 20 5 404 0.049 20 0.1 0.1 9.379 A
C-A 53 13 53
C-B 145 36 677 0.215 145 0.3 0.3 6.769 A
A-B 14 4 14
A-C 61 15 61
StreamTotal
Demand (Veh/hr)
Junction Arrivals
(Veh)
Capacity (Veh/hr)
RFCThroughput
(Veh/hr)Start queue
(Veh)End queue
(Veh)Delay (s) LOS
B-C 223 56 739 0.302 224 0.6 0.4 6.989 A
B-A 16 4 418 0.039 16 0.1 0.0 8.966 A
Page 7 of 35
17/08/2021file:///C:/Files%20-%20Simon/BTP%20Projects/BTP-2128%20-%20WCM%20White...

09:00 - 09:15
C-A 43 11 43
C-B 119 30 681 0.174 119 0.3 0.2 6.409 A
A-B 12 3 12
A-C 49 12 49
StreamTotal
Demand (Veh/hr)
Junction Arrivals
(Veh)
Capacity (Veh/hr)
RFCThroughput
(Veh/hr)Start queue
(Veh)End queue
(Veh)Delay (s) LOS
B-C 187 47 743 0.251 187 0.4 0.3 6.475 A
B-A 14 3 427 0.032 14 0.0 0.0 8.700 A
C-A 36 9 36
C-B 99 25 684 0.145 100 0.2 0.2 6.163 A
A-B 10 2 10
A-C 41 10 41
Page 8 of 35
17/08/2021file:///C:/Files%20-%20Simon/BTP%20Projects/BTP-2128%20-%20WCM%20White...
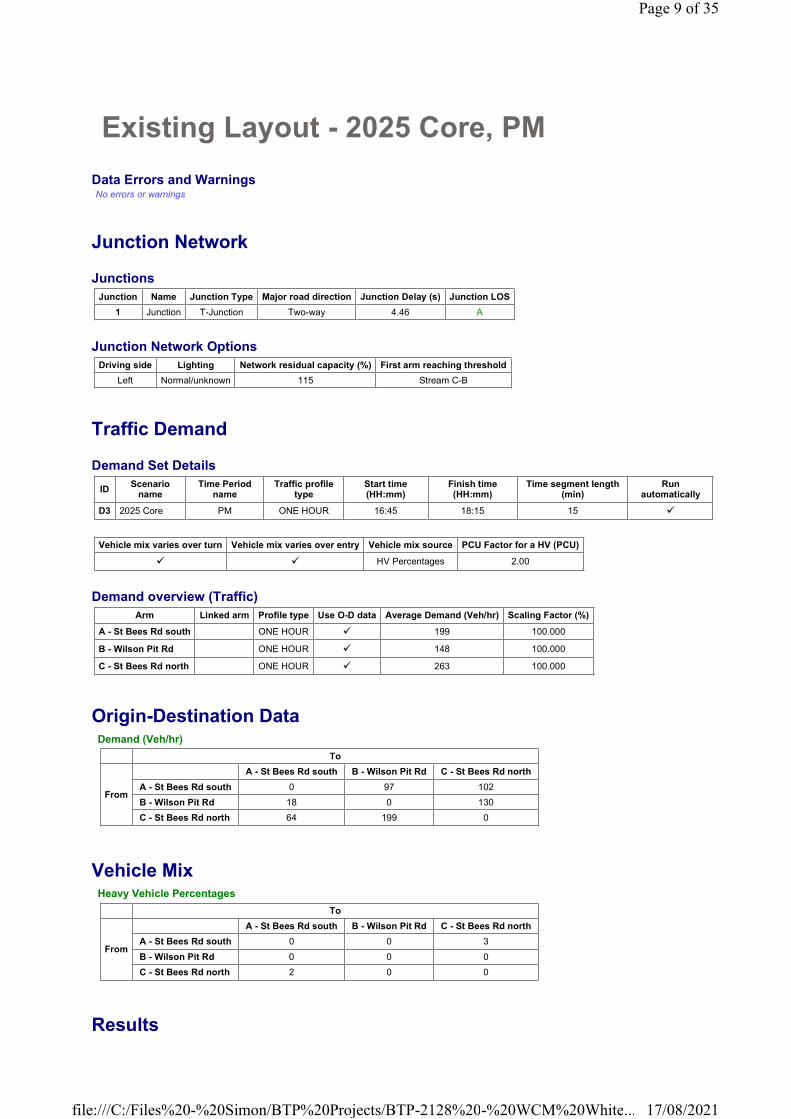
Existing Layout - 2025 Core, PM
Data Errors and WarningsNo errors or warnings
Junction Network
Junctions
Junction Network Options
Traffic Demand
Demand Set Details
Demand overview (Traffic)
Origin-Destination Data
Vehicle Mix
Results
Junction Name Junction Type Major road direction Junction Delay (s) Junction LOS
1 Junction T-Junction Two-way 4.46 A
Driving side Lighting Network residual capacity (%) First arm reaching threshold
Left Normal/unknown 115 Stream C-B
IDScenario
nameTime Period
nameTraffic profile
typeStart time (HH:mm)
Finish time (HH:mm)
Time segment length (min)
Run automatically
D3 2025 Core PM ONE HOUR 16:45 18:15 15 �
Vehicle mix varies over turn Vehicle mix varies over entry Vehicle mix source PCU Factor for a HV (PCU)
� � HV Percentages 2.00
Arm Linked arm Profile type Use O-D data Average Demand (Veh/hr) Scaling Factor (%)
A - St Bees Rd south ONE HOUR � 199 100.000
B - Wilson Pit Rd ONE HOUR � 148 100.000
C - St Bees Rd north ONE HOUR � 263 100.000
Demand (Veh/hr)
To
From
A - St Bees Rd south B - Wilson Pit Rd C - St Bees Rd north
A - St Bees Rd south 0 97 102
B - Wilson Pit Rd 18 0 130
C - St Bees Rd north 64 199 0
Heavy Vehicle Percentages
To
From
A - St Bees Rd south B - Wilson Pit Rd C - St Bees Rd north
A - St Bees Rd south 0 0 3
B - Wilson Pit Rd 0 0 0
C - St Bees Rd north 2 0 0
Page 9 of 35
17/08/2021file:///C:/Files%20-%20Simon/BTP%20Projects/BTP-2128%20-%20WCM%20White...

Results Summary for whole modelled period
Main Results for each time segment
16:45 - 17:00
17:00 - 17:15
17:15 - 17:30
17:30 - 17:45
17:45 - 18:00
Stream Max RFC Max delay (s) Max Queue (Veh) Max LOSAverage Demand
(Veh/hr)Total Junction Arrivals (Veh)
B-C 0.20 6.46 0.3 A 119 179
B-A 0.05 10.42 0.1 B 17 25
C-A 59 88
C-B 0.34 8.59 0.5 A 183 274
A-B 89 134
A-C 94 140
StreamTotal
Demand (Veh/hr)
Junction Arrivals
(Veh)
Capacity (Veh/hr)
RFCThroughput
(Veh/hr)Start queue
(Veh)End queue
(Veh)Delay (s) LOS
B-C 98 24 719 0.136 97 0.0 0.2 5.783 A
B-A 14 3 402 0.034 13 0.0 0.0 9.264 A
C-A 48 12 48
C-B 150 37 657 0.228 149 0.0 0.3 7.066 A
A-B 73 18 73
A-C 77 19 77
StreamTotal
Demand (Veh/hr)
Junction Arrivals
(Veh)
Capacity (Veh/hr)
RFCThroughput
(Veh/hr)Start queue
(Veh)End queue
(Veh)Delay (s) LOS
B-C 117 29 711 0.164 117 0.2 0.2 6.052 A
B-A 16 4 386 0.042 16 0.0 0.0 9.723 A
C-A 58 14 58
C-B 179 45 649 0.276 179 0.3 0.4 7.647 A
A-B 87 22 87
A-C 92 23 92
StreamTotal
Demand (Veh/hr)
Junction Arrivals
(Veh)
Capacity (Veh/hr)
RFCThroughput
(Veh/hr)Start queue
(Veh)End queue
(Veh)Delay (s) LOS
B-C 143 36 701 0.204 143 0.2 0.3 6.450 A
B-A 20 5 365 0.054 20 0.0 0.1 10.417 B
C-A 70 18 70
C-B 219 55 638 0.343 219 0.4 0.5 8.572 A
A-B 107 27 107
A-C 112 28 112
StreamTotal
Demand (Veh/hr)
Junction Arrivals
(Veh)
Capacity (Veh/hr)
RFCThroughput
(Veh/hr)Start queue
(Veh)End queue
(Veh)Delay (s) LOS
B-C 143 36 701 0.204 143 0.3 0.3 6.456 A
B-A 20 5 365 0.054 20 0.1 0.1 10.424 B
C-A 70 18 70
C-B 219 55 638 0.343 219 0.5 0.5 8.594 A
A-B 107 27 107
A-C 112 28 112
StreamTotal
Demand (Veh/hr)
Junction Arrivals
(Veh)
Capacity (Veh/hr)
RFCThroughput
(Veh/hr)Start queue
(Veh)End queue
(Veh)Delay (s) LOS
B-C 117 29 711 0.164 117 0.3 0.2 6.062 A
B-A 16 4 386 0.042 16 0.1 0.0 9.733 A
Page 10 of 35
17/08/2021file:///C:/Files%20-%20Simon/BTP%20Projects/BTP-2128%20-%20WCM%20White...

18:00 - 18:15
C-A 58 14 58
C-B 179 45 649 0.276 179 0.5 0.4 7.674 A
A-B 87 22 87
A-C 92 23 92
StreamTotal
Demand (Veh/hr)
Junction Arrivals
(Veh)
Capacity (Veh/hr)
RFCThroughput
(Veh/hr)Start queue
(Veh)End queue
(Veh)Delay (s) LOS
B-C 98 24 719 0.136 98 0.2 0.2 5.799 A
B-A 14 3 401 0.034 14 0.0 0.0 9.283 A
C-A 48 12 48
C-B 150 37 657 0.228 150 0.4 0.3 7.107 A
A-B 73 18 73
A-C 77 19 77
Page 11 of 35
17/08/2021file:///C:/Files%20-%20Simon/BTP%20Projects/BTP-2128%20-%20WCM%20White...

Existing Layout - 2025 Construction, AM1
Data Errors and WarningsNo errors or warnings
Junction Network
Junctions
Junction Network Options
Traffic Demand
Demand Set Details
Demand overview (Traffic)
Origin-Destination Data
Vehicle Mix
Results
Junction Name Junction Type Major road direction Junction Delay (s) Junction LOS
1 Junction T-Junction Two-way 5.02 A
Driving side Lighting Network residual capacity (%) First arm reaching threshold
Left Normal/unknown 131 Stream B-A
ID Scenario nameTime Period
nameTraffic profile
typeStart time (HH:mm)
Finish time (HH:mm)
Time segment length (min)
Run automatically
D4 2025 Construction AM1 ONE HOUR 06:45 08:15 15 �
Vehicle mix varies over turn Vehicle mix varies over entry Vehicle mix source PCU Factor for a HV (PCU)
� � HV Percentages 2.00
Arm Linked arm Profile type Use O-D data Average Demand (Veh/hr) Scaling Factor (%)
A - St Bees Rd south ONE HOUR � 79 100.000
B - Wilson Pit Rd ONE HOUR � 246 100.000
C - St Bees Rd north ONE HOUR � 235 100.000
Demand (Veh/hr)
To
From
A - St Bees Rd south B - Wilson Pit Rd C - St Bees Rd north
A - St Bees Rd south 0 13 66
B - Wilson Pit Rd 39 0 207
C - St Bees Rd north 110 125 0
Heavy Vehicle Percentages
To
From
A - St Bees Rd south B - Wilson Pit Rd C - St Bees Rd north
A - St Bees Rd south 0 0 3
B - Wilson Pit Rd 5 0 0
C - St Bees Rd north 4 2 0
Page 12 of 35
17/08/2021file:///C:/Files%20-%20Simon/BTP%20Projects/BTP-2128%20-%20WCM%20White...

Results Summary for whole modelled period
Main Results for each time segment
06:45 - 07:00
07:00 - 07:15
07:15 - 07:30
07:30 - 07:45
07:45 - 08:00
Stream Max RFC Max delay (s) Max Queue (Veh) Max LOSAverage Demand
(Veh/hr)Total Junction Arrivals (Veh)
B-C 0.32 7.51 0.5 A 190 285
B-A 0.11 10.57 0.1 B 36 54
C-A 101 151
C-B 0.21 6.88 0.3 A 115 172
A-B 12 18
A-C 61 91
StreamTotal
Demand (Veh/hr)
Junction Arrivals
(Veh)
Capacity (Veh/hr)
RFCThroughput
(Veh/hr)Start queue
(Veh)End queue
(Veh)Delay (s) LOS
B-C 156 39 722 0.216 155 0.0 0.3 6.337 A
B-A 29 7 409 0.072 29 0.0 0.1 9.468 A
C-A 83 21 83
C-B 94 24 668 0.141 93 0.0 0.2 6.256 A
A-B 10 2 10
A-C 50 12 50
StreamTotal
Demand (Veh/hr)
Junction Arrivals
(Veh)
Capacity (Veh/hr)
RFCThroughput
(Veh/hr)Start queue
(Veh)End queue
(Veh)Delay (s) LOS
B-C 186 47 716 0.260 186 0.3 0.3 6.792 A
B-A 35 9 398 0.088 35 0.1 0.1 9.903 A
C-A 99 25 99
C-B 112 28 665 0.169 112 0.2 0.2 6.509 A
A-B 12 3 12
A-C 59 15 59
StreamTotal
Demand (Veh/hr)
Junction Arrivals
(Veh)
Capacity (Veh/hr)
RFCThroughput
(Veh/hr)Start queue
(Veh)End queue
(Veh)Delay (s) LOS
B-C 228 57 707 0.322 227 0.3 0.5 7.498 A
B-A 43 11 384 0.112 43 0.1 0.1 10.557 B
C-A 121 30 121
C-B 138 34 661 0.208 137 0.2 0.3 6.874 A
A-B 14 4 14
A-C 73 18 73
StreamTotal
Demand (Veh/hr)
Junction Arrivals
(Veh)
Capacity (Veh/hr)
RFCThroughput
(Veh/hr)Start queue
(Veh)End queue
(Veh)Delay (s) LOS
B-C 228 57 707 0.322 228 0.5 0.5 7.514 A
B-A 43 11 384 0.112 43 0.1 0.1 10.566 B
C-A 121 30 121
C-B 138 34 661 0.208 138 0.3 0.3 6.880 A
A-B 14 4 14
A-C 73 18 73
StreamTotal
Demand (Veh/hr)
Junction Arrivals
(Veh)
Capacity (Veh/hr)
RFCThroughput
(Veh/hr)Start queue
(Veh)End queue
(Veh)Delay (s) LOS
B-C 186 47 715 0.260 187 0.5 0.4 6.811 A
B-A 35 9 398 0.088 35 0.1 0.1 9.916 A
Page 13 of 35
17/08/2021file:///C:/Files%20-%20Simon/BTP%20Projects/BTP-2128%20-%20WCM%20White...

08:00 - 08:15
C-A 99 25 99
C-B 112 28 665 0.169 113 0.3 0.2 6.517 A
A-B 12 3 12
A-C 59 15 59
StreamTotal
Demand (Veh/hr)
Junction Arrivals
(Veh)
Capacity (Veh/hr)
RFCThroughput
(Veh/hr)Start queue
(Veh)End queue
(Veh)Delay (s) LOS
B-C 156 39 722 0.216 156 0.4 0.3 6.372 A
B-A 29 7 409 0.072 29 0.1 0.1 9.494 A
C-A 83 21 83
C-B 94 24 668 0.141 94 0.2 0.2 6.272 A
A-B 10 2 10
A-C 50 12 50
Page 14 of 35
17/08/2021file:///C:/Files%20-%20Simon/BTP%20Projects/BTP-2128%20-%20WCM%20White...

Existing Layout - 2025 Construction, PM
Data Errors and WarningsNo errors or warnings
Junction Network
Junctions
Junction Network Options
Traffic Demand
Demand Set Details
Demand overview (Traffic)
Origin-Destination Data
Vehicle Mix
Results
Junction Name Junction Type Major road direction Junction Delay (s) Junction LOS
1 Junction T-Junction Two-way 4.94 A
Driving side Lighting Network residual capacity (%) First arm reaching threshold
Left Normal/unknown 113 Stream C-B
ID Scenario nameTime Period
nameTraffic profile
typeStart time (HH:mm)
Finish time (HH:mm)
Time segment length (min)
Run automatically
D5 2025 Construction PM ONE HOUR 16:45 18:15 15 �
Vehicle mix varies over turn Vehicle mix varies over entry Vehicle mix source PCU Factor for a HV (PCU)
� � HV Percentages 2.00
Arm Linked arm Profile type Use O-D data Average Demand (Veh/hr) Scaling Factor (%)
A - St Bees Rd south ONE HOUR � 197 100.000
B - Wilson Pit Rd ONE HOUR � 201 100.000
C - St Bees Rd north ONE HOUR � 264 100.000
Demand (Veh/hr)
To
From
A - St Bees Rd south B - Wilson Pit Rd C - St Bees Rd north
A - St Bees Rd south 0 97 100
B - Wilson Pit Rd 23 0 178
C - St Bees Rd north 64 200 0
Heavy Vehicle Percentages
To
From
A - St Bees Rd south B - Wilson Pit Rd C - St Bees Rd north
A - St Bees Rd south 0 0 3
B - Wilson Pit Rd 0 0 1
C - St Bees Rd north 2 1 0
Page 15 of 35
17/08/2021file:///C:/Files%20-%20Simon/BTP%20Projects/BTP-2128%20-%20WCM%20White...
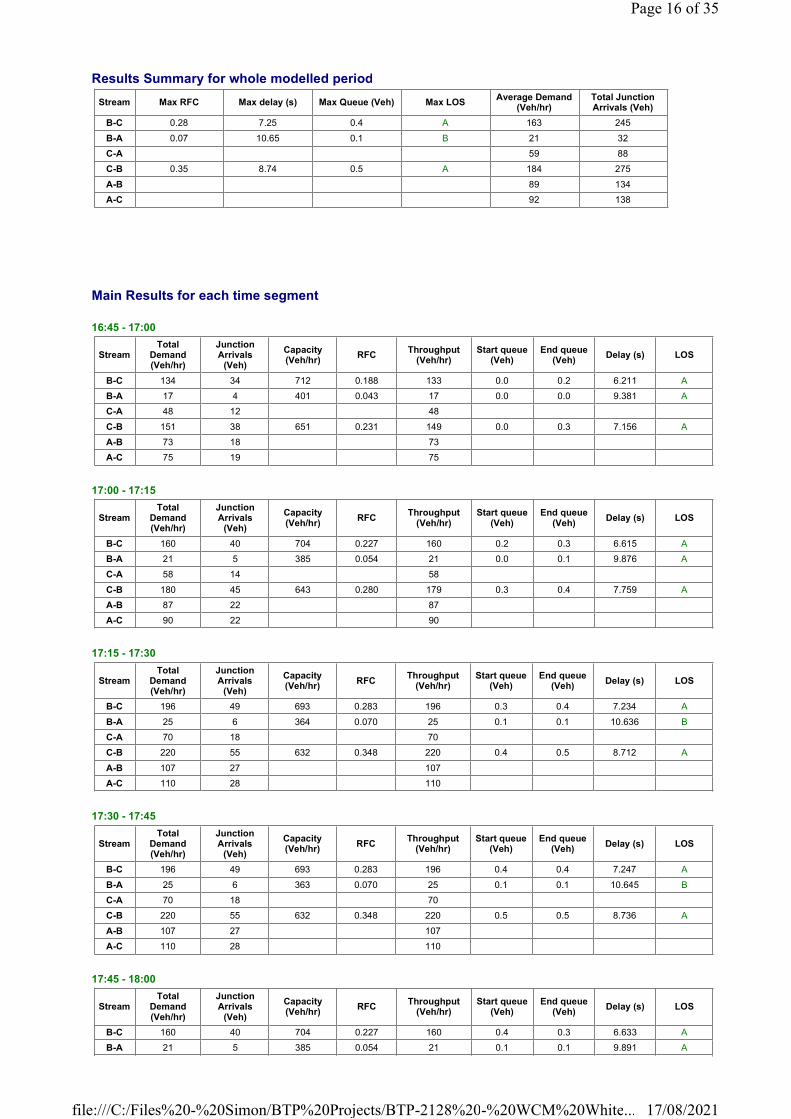
Results Summary for whole modelled period
Main Results for each time segment
16:45 - 17:00
17:00 - 17:15
17:15 - 17:30
17:30 - 17:45
17:45 - 18:00
Stream Max RFC Max delay (s) Max Queue (Veh) Max LOSAverage Demand
(Veh/hr)Total Junction Arrivals (Veh)
B-C 0.28 7.25 0.4 A 163 245
B-A 0.07 10.65 0.1 B 21 32
C-A 59 88
C-B 0.35 8.74 0.5 A 184 275
A-B 89 134
A-C 92 138
StreamTotal
Demand (Veh/hr)
Junction Arrivals
(Veh)
Capacity (Veh/hr)
RFCThroughput
(Veh/hr)Start queue
(Veh)End queue
(Veh)Delay (s) LOS
B-C 134 34 712 0.188 133 0.0 0.2 6.211 A
B-A 17 4 401 0.043 17 0.0 0.0 9.381 A
C-A 48 12 48
C-B 151 38 651 0.231 149 0.0 0.3 7.156 A
A-B 73 18 73
A-C 75 19 75
StreamTotal
Demand (Veh/hr)
Junction Arrivals
(Veh)
Capacity (Veh/hr)
RFCThroughput
(Veh/hr)Start queue
(Veh)End queue
(Veh)Delay (s) LOS
B-C 160 40 704 0.227 160 0.2 0.3 6.615 A
B-A 21 5 385 0.054 21 0.0 0.1 9.876 A
C-A 58 14 58
C-B 180 45 643 0.280 179 0.3 0.4 7.759 A
A-B 87 22 87
A-C 90 22 90
StreamTotal
Demand (Veh/hr)
Junction Arrivals
(Veh)
Capacity (Veh/hr)
RFCThroughput
(Veh/hr)Start queue
(Veh)End queue
(Veh)Delay (s) LOS
B-C 196 49 693 0.283 196 0.3 0.4 7.234 A
B-A 25 6 364 0.070 25 0.1 0.1 10.636 B
C-A 70 18 70
C-B 220 55 632 0.348 220 0.4 0.5 8.712 A
A-B 107 27 107
A-C 110 28 110
StreamTotal
Demand (Veh/hr)
Junction Arrivals
(Veh)
Capacity (Veh/hr)
RFCThroughput
(Veh/hr)Start queue
(Veh)End queue
(Veh)Delay (s) LOS
B-C 196 49 693 0.283 196 0.4 0.4 7.247 A
B-A 25 6 363 0.070 25 0.1 0.1 10.645 B
C-A 70 18 70
C-B 220 55 632 0.348 220 0.5 0.5 8.736 A
A-B 107 27 107
A-C 110 28 110
StreamTotal
Demand (Veh/hr)
Junction Arrivals
(Veh)
Capacity (Veh/hr)
RFCThroughput
(Veh/hr)Start queue
(Veh)End queue
(Veh)Delay (s) LOS
B-C 160 40 704 0.227 160 0.4 0.3 6.633 A
B-A 21 5 385 0.054 21 0.1 0.1 9.891 A
Page 16 of 35
17/08/2021file:///C:/Files%20-%20Simon/BTP%20Projects/BTP-2128%20-%20WCM%20White...
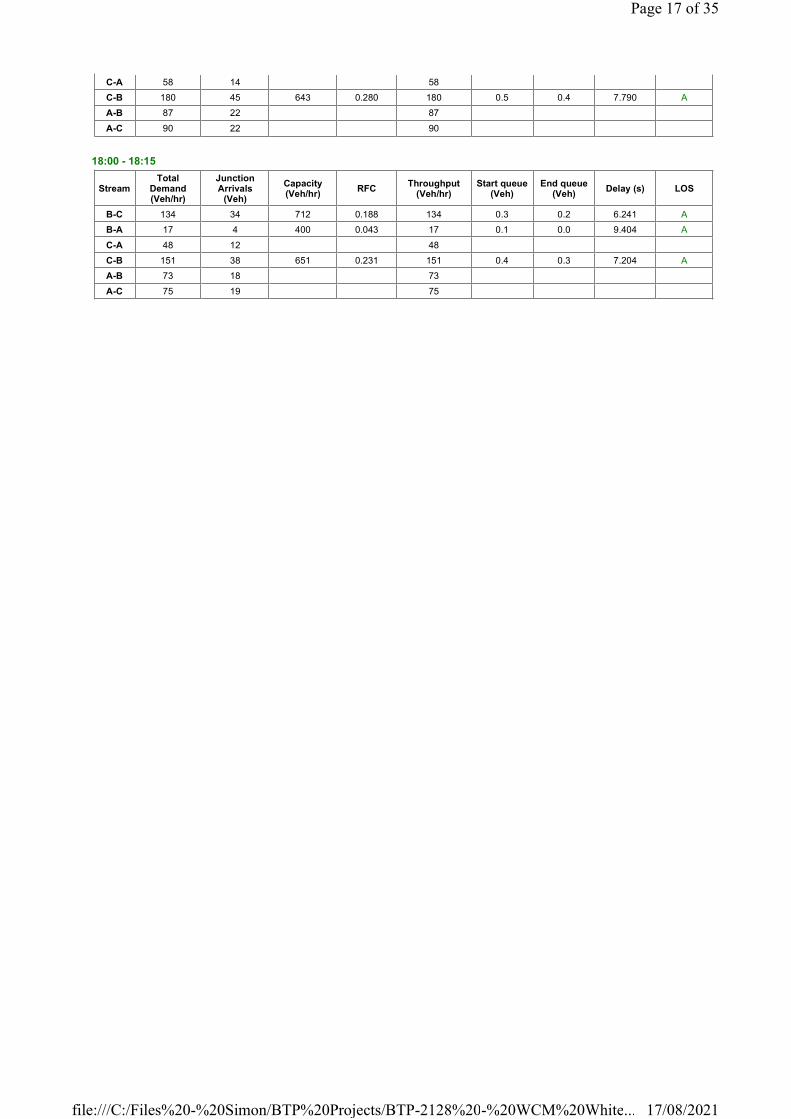
18:00 - 18:15
C-A 58 14 58
C-B 180 45 643 0.280 180 0.5 0.4 7.790 A
A-B 87 22 87
A-C 90 22 90
StreamTotal
Demand (Veh/hr)
Junction Arrivals
(Veh)
Capacity (Veh/hr)
RFCThroughput
(Veh/hr)Start queue
(Veh)End queue
(Veh)Delay (s) LOS
B-C 134 34 712 0.188 134 0.3 0.2 6.241 A
B-A 17 4 400 0.043 17 0.1 0.0 9.404 A
C-A 48 12 48
C-B 151 38 651 0.231 151 0.4 0.3 7.204 A
A-B 73 18 73
A-C 75 19 75
Page 17 of 35
17/08/2021file:///C:/Files%20-%20Simon/BTP%20Projects/BTP-2128%20-%20WCM%20White...
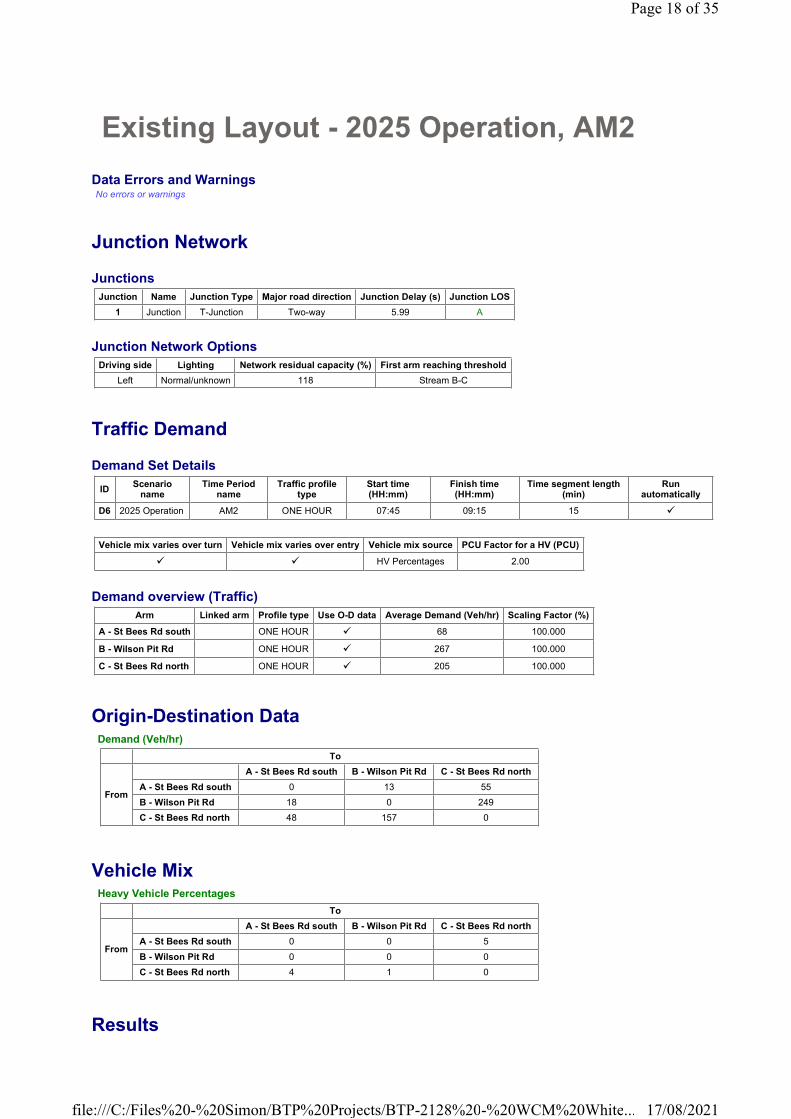
Existing Layout - 2025 Operation, AM2
Data Errors and WarningsNo errors or warnings
Junction Network
Junctions
Junction Network Options
Traffic Demand
Demand Set Details
Demand overview (Traffic)
Origin-Destination Data
Vehicle Mix
Results
Junction Name Junction Type Major road direction Junction Delay (s) Junction LOS
1 Junction T-Junction Two-way 5.99 A
Driving side Lighting Network residual capacity (%) First arm reaching threshold
Left Normal/unknown 118 Stream B-C
IDScenario
nameTime Period
nameTraffic profile
typeStart time (HH:mm)
Finish time (HH:mm)
Time segment length (min)
Run automatically
D6 2025 Operation AM2 ONE HOUR 07:45 09:15 15 �
Vehicle mix varies over turn Vehicle mix varies over entry Vehicle mix source PCU Factor for a HV (PCU)
� � HV Percentages 2.00
Arm Linked arm Profile type Use O-D data Average Demand (Veh/hr) Scaling Factor (%)
A - St Bees Rd south ONE HOUR � 68 100.000
B - Wilson Pit Rd ONE HOUR � 267 100.000
C - St Bees Rd north ONE HOUR � 205 100.000
Demand (Veh/hr)
To
From
A - St Bees Rd south B - Wilson Pit Rd C - St Bees Rd north
A - St Bees Rd south 0 13 55
B - Wilson Pit Rd 18 0 249
C - St Bees Rd north 48 157 0
Heavy Vehicle Percentages
To
From
A - St Bees Rd south B - Wilson Pit Rd C - St Bees Rd north
A - St Bees Rd south 0 0 5
B - Wilson Pit Rd 0 0 0
C - St Bees Rd north 4 1 0
Page 18 of 35
17/08/2021file:///C:/Files%20-%20Simon/BTP%20Projects/BTP-2128%20-%20WCM%20White...

Results Summary for whole modelled period
Main Results for each time segment
07:45 - 08:00
08:00 - 08:15
08:15 - 08:30
08:30 - 08:45
08:45 - 09:00
Stream Max RFC Max delay (s) Max Queue (Veh) Max LOSAverage Demand
(Veh/hr)Total Junction Arrivals (Veh)
B-C 0.37 7.84 0.6 A 228 343
B-A 0.05 9.61 0.1 A 17 25
C-A 44 66
C-B 0.26 7.23 0.3 A 144 216
A-B 12 18
A-C 50 76
StreamTotal
Demand (Veh/hr)
Junction Arrivals
(Veh)
Capacity (Veh/hr)
RFCThroughput
(Veh/hr)Start queue
(Veh)End queue
(Veh)Delay (s) LOS
B-C 187 47 743 0.252 186 0.0 0.3 6.444 A
B-A 14 3 421 0.032 13 0.0 0.0 8.820 A
C-A 36 9 36
C-B 118 30 677 0.175 117 0.0 0.2 6.424 A
A-B 10 2 10
A-C 41 10 41
StreamTotal
Demand (Veh/hr)
Junction Arrivals
(Veh)
Capacity (Veh/hr)
RFCThroughput
(Veh/hr)Start queue
(Veh)End queue
(Veh)Delay (s) LOS
B-C 224 56 739 0.303 223 0.3 0.4 6.975 A
B-A 16 4 410 0.039 16 0.0 0.0 9.131 A
C-A 43 11 43
C-B 141 35 674 0.209 141 0.2 0.3 6.747 A
A-B 12 3 12
A-C 49 12 49
StreamTotal
Demand (Veh/hr)
Junction Arrivals
(Veh)
Capacity (Veh/hr)
RFCThroughput
(Veh/hr)Start queue
(Veh)End queue
(Veh)Delay (s) LOS
B-C 274 69 734 0.374 274 0.4 0.6 7.813 A
B-A 20 5 395 0.050 20 0.0 0.1 9.605 A
C-A 53 13 53
C-B 173 43 670 0.258 173 0.3 0.3 7.226 A
A-B 14 4 14
A-C 61 15 61
StreamTotal
Demand (Veh/hr)
Junction Arrivals
(Veh)
Capacity (Veh/hr)
RFCThroughput
(Veh/hr)Start queue
(Veh)End queue
(Veh)Delay (s) LOS
B-C 274 69 734 0.374 274 0.6 0.6 7.835 A
B-A 20 5 394 0.050 20 0.1 0.1 9.610 A
C-A 53 13 53
C-B 173 43 670 0.258 173 0.3 0.3 7.235 A
A-B 14 4 14
A-C 61 15 61
StreamTotal
Demand (Veh/hr)
Junction Arrivals
(Veh)
Capacity (Veh/hr)
RFCThroughput
(Veh/hr)Start queue
(Veh)End queue
(Veh)Delay (s) LOS
B-C 224 56 739 0.303 224 0.6 0.4 7.003 A
B-A 16 4 410 0.039 16 0.1 0.0 9.138 A
Page 19 of 35
17/08/2021file:///C:/Files%20-%20Simon/BTP%20Projects/BTP-2128%20-%20WCM%20White...

09:00 - 09:15
C-A 43 11 43
C-B 141 35 674 0.209 141 0.3 0.3 6.760 A
A-B 12 3 12
A-C 49 12 49
StreamTotal
Demand (Veh/hr)
Junction Arrivals
(Veh)
Capacity (Veh/hr)
RFCThroughput
(Veh/hr)Start queue
(Veh)End queue
(Veh)Delay (s) LOS
B-C 187 47 743 0.252 188 0.4 0.3 6.484 A
B-A 14 3 421 0.032 14 0.0 0.0 8.834 A
C-A 36 9 36
C-B 118 30 677 0.175 118 0.3 0.2 6.449 A
A-B 10 2 10
A-C 41 10 41
Page 20 of 35
17/08/2021file:///C:/Files%20-%20Simon/BTP%20Projects/BTP-2128%20-%20WCM%20White...

Existing Layout - 2025 Operation, PM
Data Errors and WarningsNo errors or warnings
Junction Network
Junctions
Junction Network Options
Traffic Demand
Demand Set Details
Demand overview (Traffic)
Origin-Destination Data
Vehicle Mix
Results
Junction Name Junction Type Major road direction Junction Delay (s) Junction LOS
1 Junction T-Junction Two-way 4.60 A
Driving side Lighting Network residual capacity (%) First arm reaching threshold
Left Normal/unknown 116 Stream C-B
IDScenario
nameTime Period
nameTraffic profile
typeStart time (HH:mm)
Finish time (HH:mm)
Time segment length (min)
Run automatically
D7 2025 Operation PM ONE HOUR 16:45 18:15 15 �
Vehicle mix varies over turn Vehicle mix varies over entry Vehicle mix source PCU Factor for a HV (PCU)
� � HV Percentages 2.00
Arm Linked arm Profile type Use O-D data Average Demand (Veh/hr) Scaling Factor (%)
A - St Bees Rd south ONE HOUR � 199 100.000
B - Wilson Pit Rd ONE HOUR � 170 100.000
C - St Bees Rd north ONE HOUR � 262 100.000
Demand (Veh/hr)
To
From
A - St Bees Rd south B - Wilson Pit Rd C - St Bees Rd north
A - St Bees Rd south 0 97 102
B - Wilson Pit Rd 21 0 149
C - St Bees Rd north 64 198 0
Heavy Vehicle Percentages
To
From
A - St Bees Rd south B - Wilson Pit Rd C - St Bees Rd north
A - St Bees Rd south 0 0 3
B - Wilson Pit Rd 0 0 0
C - St Bees Rd north 2 0 0
Page 21 of 35
17/08/2021file:///C:/Files%20-%20Simon/BTP%20Projects/BTP-2128%20-%20WCM%20White...

Results Summary for whole modelled period
Main Results for each time segment
16:45 - 17:00
17:00 - 17:15
17:15 - 17:30
17:30 - 17:45
17:45 - 18:00
Stream Max RFC Max delay (s) Max Queue (Veh) Max LOSAverage Demand
(Veh/hr)Total Junction Arrivals (Veh)
B-C 0.23 6.73 0.3 A 137 205
B-A 0.06 10.51 0.1 B 19 29
C-A 59 88
C-B 0.34 8.57 0.5 A 182 273
A-B 89 134
A-C 94 140
StreamTotal
Demand (Veh/hr)
Junction Arrivals
(Veh)
Capacity (Veh/hr)
RFCThroughput
(Veh/hr)Start queue
(Veh)End queue
(Veh)Delay (s) LOS
B-C 112 28 718 0.156 111 0.0 0.2 5.930 A
B-A 16 4 402 0.039 16 0.0 0.0 9.307 A
C-A 48 12 48
C-B 149 37 657 0.227 148 0.0 0.3 7.056 A
A-B 73 18 73
A-C 77 19 77
StreamTotal
Demand (Veh/hr)
Junction Arrivals
(Veh)
Capacity (Veh/hr)
RFCThroughput
(Veh/hr)Start queue
(Veh)End queue
(Veh)Delay (s) LOS
B-C 134 33 710 0.189 134 0.2 0.2 6.247 A
B-A 19 5 387 0.049 19 0.0 0.1 9.782 A
C-A 58 14 58
C-B 178 44 649 0.274 178 0.3 0.4 7.633 A
A-B 87 22 87
A-C 92 23 92
StreamTotal
Demand (Veh/hr)
Junction Arrivals
(Veh)
Capacity (Veh/hr)
RFCThroughput
(Veh/hr)Start queue
(Veh)End queue
(Veh)Delay (s) LOS
B-C 164 41 699 0.235 164 0.2 0.3 6.724 A
B-A 23 6 366 0.063 23 0.1 0.1 10.506 B
C-A 70 18 70
C-B 218 55 638 0.342 217 0.4 0.5 8.550 A
A-B 107 27 107
A-C 112 28 112
StreamTotal
Demand (Veh/hr)
Junction Arrivals
(Veh)
Capacity (Veh/hr)
RFCThroughput
(Veh/hr)Start queue
(Veh)End queue
(Veh)Delay (s) LOS
B-C 164 41 699 0.235 164 0.3 0.3 6.730 A
B-A 23 6 366 0.063 23 0.1 0.1 10.512 B
C-A 70 18 70
C-B 218 55 638 0.342 218 0.5 0.5 8.571 A
A-B 107 27 107
A-C 112 28 112
StreamTotal
Demand (Veh/hr)
Junction Arrivals
(Veh)
Capacity (Veh/hr)
RFCThroughput
(Veh/hr)Start queue
(Veh)End queue
(Veh)Delay (s) LOS
B-C 134 33 710 0.189 134 0.3 0.2 6.259 A
B-A 19 5 387 0.049 19 0.1 0.1 9.796 A
Page 22 of 35
17/08/2021file:///C:/Files%20-%20Simon/BTP%20Projects/BTP-2128%20-%20WCM%20White...

18:00 - 18:15
C-A 58 14 58
C-B 178 44 649 0.274 179 0.5 0.4 7.662 A
A-B 87 22 87
A-C 92 23 92
StreamTotal
Demand (Veh/hr)
Junction Arrivals
(Veh)
Capacity (Veh/hr)
RFCThroughput
(Veh/hr)Start queue
(Veh)End queue
(Veh)Delay (s) LOS
B-C 112 28 718 0.156 112 0.2 0.2 5.949 A
B-A 16 4 402 0.039 16 0.1 0.0 9.328 A
C-A 48 12 48
C-B 149 37 657 0.227 149 0.4 0.3 7.096 A
A-B 73 18 73
A-C 77 19 77
Page 23 of 35
17/08/2021file:///C:/Files%20-%20Simon/BTP%20Projects/BTP-2128%20-%20WCM%20White...

Existing Layout - 2035 Core, AM2
Data Errors and WarningsNo errors or warnings
Junction Network
Junctions
Junction Network Options
Traffic Demand
Demand Set Details
Demand overview (Traffic)
Origin-Destination Data
Vehicle Mix
Results
Junction Name Junction Type Major road direction Junction Delay (s) Junction LOS
1 Junction T-Junction Two-way 10.13 B
Driving side Lighting Network residual capacity (%) First arm reaching threshold
Left Normal/unknown 30 Stream B-C
IDScenario
nameTime Period
nameTraffic profile
typeStart time (HH:mm)
Finish time (HH:mm)
Time segment length (min)
Run automatically
D8 2035 Core AM2 ONE HOUR 07:45 09:15 15 �
Vehicle mix varies over turn Vehicle mix varies over entry Vehicle mix source PCU Factor for a HV (PCU)
� � HV Percentages 2.00
Arm Linked arm Profile type Use O-D data Average Demand (Veh/hr) Scaling Factor (%)
A - St Bees Rd south ONE HOUR � 80 100.000
B - Wilson Pit Rd ONE HOUR � 463 100.000
C - St Bees Rd north ONE HOUR � 269 100.000
Demand (Veh/hr)
To
From
A - St Bees Rd south B - Wilson Pit Rd C - St Bees Rd north
A - St Bees Rd south 0 24 56
B - Wilson Pit Rd 43 0 420
C - St Bees Rd north 54 215 0
Heavy Vehicle Percentages
To
From
A - St Bees Rd south B - Wilson Pit Rd C - St Bees Rd north
A - St Bees Rd south 0 0 5
B - Wilson Pit Rd 0 0 0
C - St Bees Rd north 4 0 0
Page 24 of 35
17/08/2021file:///C:/Files%20-%20Simon/BTP%20Projects/BTP-2128%20-%20WCM%20White...
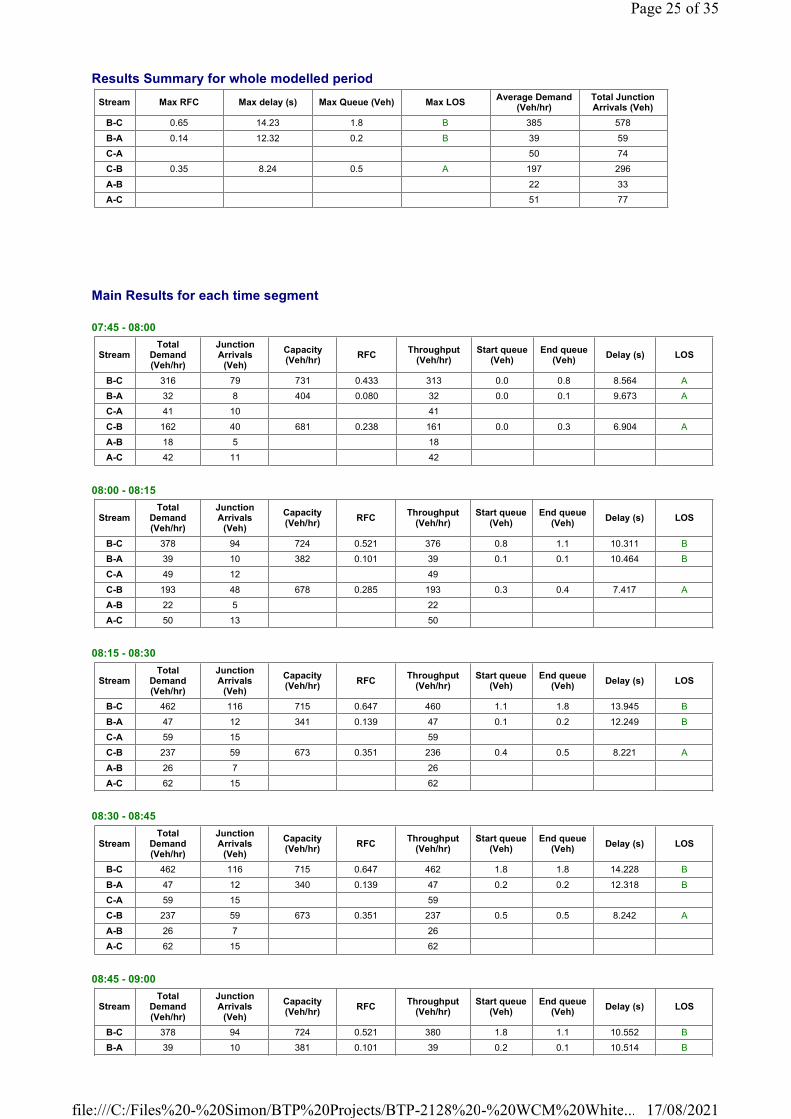
Results Summary for whole modelled period
Main Results for each time segment
07:45 - 08:00
08:00 - 08:15
08:15 - 08:30
08:30 - 08:45
08:45 - 09:00
Stream Max RFC Max delay (s) Max Queue (Veh) Max LOSAverage Demand
(Veh/hr)Total Junction Arrivals (Veh)
B-C 0.65 14.23 1.8 B 385 578
B-A 0.14 12.32 0.2 B 39 59
C-A 50 74
C-B 0.35 8.24 0.5 A 197 296
A-B 22 33
A-C 51 77
StreamTotal
Demand (Veh/hr)
Junction Arrivals
(Veh)
Capacity (Veh/hr)
RFCThroughput
(Veh/hr)Start queue
(Veh)End queue
(Veh)Delay (s) LOS
B-C 316 79 731 0.433 313 0.0 0.8 8.564 A
B-A 32 8 404 0.080 32 0.0 0.1 9.673 A
C-A 41 10 41
C-B 162 40 681 0.238 161 0.0 0.3 6.904 A
A-B 18 5 18
A-C 42 11 42
StreamTotal
Demand (Veh/hr)
Junction Arrivals
(Veh)
Capacity (Veh/hr)
RFCThroughput
(Veh/hr)Start queue
(Veh)End queue
(Veh)Delay (s) LOS
B-C 378 94 724 0.521 376 0.8 1.1 10.311 B
B-A 39 10 382 0.101 39 0.1 0.1 10.464 B
C-A 49 12 49
C-B 193 48 678 0.285 193 0.3 0.4 7.417 A
A-B 22 5 22
A-C 50 13 50
StreamTotal
Demand (Veh/hr)
Junction Arrivals
(Veh)
Capacity (Veh/hr)
RFCThroughput
(Veh/hr)Start queue
(Veh)End queue
(Veh)Delay (s) LOS
B-C 462 116 715 0.647 460 1.1 1.8 13.945 B
B-A 47 12 341 0.139 47 0.1 0.2 12.249 B
C-A 59 15 59
C-B 237 59 673 0.351 236 0.4 0.5 8.221 A
A-B 26 7 26
A-C 62 15 62
StreamTotal
Demand (Veh/hr)
Junction Arrivals
(Veh)
Capacity (Veh/hr)
RFCThroughput
(Veh/hr)Start queue
(Veh)End queue
(Veh)Delay (s) LOS
B-C 462 116 715 0.647 462 1.8 1.8 14.228 B
B-A 47 12 340 0.139 47 0.2 0.2 12.318 B
C-A 59 15 59
C-B 237 59 673 0.351 237 0.5 0.5 8.242 A
A-B 26 7 26
A-C 62 15 62
StreamTotal
Demand (Veh/hr)
Junction Arrivals
(Veh)
Capacity (Veh/hr)
RFCThroughput
(Veh/hr)Start queue
(Veh)End queue
(Veh)Delay (s) LOS
B-C 378 94 724 0.521 380 1.8 1.1 10.552 B
B-A 39 10 381 0.101 39 0.2 0.1 10.514 B
Page 25 of 35
17/08/2021file:///C:/Files%20-%20Simon/BTP%20Projects/BTP-2128%20-%20WCM%20White...

09:00 - 09:15
C-A 49 12 49
C-B 193 48 678 0.285 194 0.5 0.4 7.445 A
A-B 22 5 22
A-C 50 13 50
StreamTotal
Demand (Veh/hr)
Junction Arrivals
(Veh)
Capacity (Veh/hr)
RFCThroughput
(Veh/hr)Start queue
(Veh)End queue
(Veh)Delay (s) LOS
B-C 316 79 730 0.433 318 1.1 0.8 8.748 A
B-A 32 8 403 0.080 32 0.1 0.1 9.718 A
C-A 41 10 41
C-B 162 40 681 0.238 162 0.4 0.3 6.939 A
A-B 18 5 18
A-C 42 11 42
Page 26 of 35
17/08/2021file:///C:/Files%20-%20Simon/BTP%20Projects/BTP-2128%20-%20WCM%20White...

Existing Layout - 2035 Core, PM
Data Errors and WarningsNo errors or warnings
Junction Network
Junctions
Junction Network Options
Traffic Demand
Demand Set Details
Demand overview (Traffic)
Origin-Destination Data
Vehicle Mix
Results
Junction Name Junction Type Major road direction Junction Delay (s) Junction LOS
1 Junction T-Junction Two-way 7.43 A
Driving side Lighting Network residual capacity (%) First arm reaching threshold
Left Normal/unknown 32 Stream C-B
IDScenario
nameTime Period
nameTraffic profile
typeStart time (HH:mm)
Finish time (HH:mm)
Time segment length (min)
Run automatically
D9 2035 Core PM ONE HOUR 16:45 18:15 15 �
Vehicle mix varies over turn Vehicle mix varies over entry Vehicle mix source PCU Factor for a HV (PCU)
� � HV Percentages 2.00
Arm Linked arm Profile type Use O-D data Average Demand (Veh/hr) Scaling Factor (%)
A - St Bees Rd south ONE HOUR � 304 100.000
B - Wilson Pit Rd ONE HOUR � 234 100.000
C - St Bees Rd north ONE HOUR � 394 100.000
Demand (Veh/hr)
To
From
A - St Bees Rd south B - Wilson Pit Rd C - St Bees Rd north
A - St Bees Rd south 0 174 130
B - Wilson Pit Rd 36 0 198
C - St Bees Rd north 64 330 0
Heavy Vehicle Percentages
To
From
A - St Bees Rd south B - Wilson Pit Rd C - St Bees Rd north
A - St Bees Rd south 0 0 2
B - Wilson Pit Rd 0 0 0
C - St Bees Rd north 2 0 0
Page 27 of 35
17/08/2021file:///C:/Files%20-%20Simon/BTP%20Projects/BTP-2128%20-%20WCM%20White...

Results Summary for whole modelled period
Main Results for each time segment
16:45 - 17:00
17:00 - 17:15
17:15 - 17:30
17:30 - 17:45
17:45 - 18:00
Stream Max RFC Max delay (s) Max Queue (Veh) Max LOSAverage Demand
(Veh/hr)Total Junction Arrivals (Veh)
B-C 0.33 8.05 0.5 A 182 273
B-A 0.13 13.52 0.1 B 33 50
C-A 59 88
C-B 0.60 14.76 1.5 B 303 454
A-B 160 239
A-C 119 179
StreamTotal
Demand (Veh/hr)
Junction Arrivals
(Veh)
Capacity (Veh/hr)
RFCThroughput
(Veh/hr)Start queue
(Veh)End queue
(Veh)Delay (s) LOS
B-C 149 37 695 0.214 148 0.0 0.3 6.565 A
B-A 27 7 364 0.075 27 0.0 0.1 10.679 B
C-A 48 12 48
C-B 248 62 636 0.391 246 0.0 0.6 9.179 A
A-B 131 33 131
A-C 98 24 98
StreamTotal
Demand (Veh/hr)
Junction Arrivals
(Veh)
Capacity (Veh/hr)
RFCThroughput
(Veh/hr)Start queue
(Veh)End queue
(Veh)Delay (s) LOS
B-C 178 44 683 0.261 178 0.3 0.3 7.122 A
B-A 32 8 339 0.095 32 0.1 0.1 11.715 B
C-A 58 14 58
C-B 297 74 624 0.476 296 0.6 0.9 10.942 B
A-B 156 39 156
A-C 117 29 117
StreamTotal
Demand (Veh/hr)
Junction Arrivals
(Veh)
Capacity (Veh/hr)
RFCThroughput
(Veh/hr)Start queue
(Veh)End queue
(Veh)Delay (s) LOS
B-C 218 55 665 0.328 217 0.3 0.5 8.028 A
B-A 40 10 307 0.129 39 0.1 0.1 13.472 B
C-A 70 18 70
C-B 363 91 607 0.599 361 0.9 1.4 14.518 B
A-B 192 48 192
A-C 143 36 143
StreamTotal
Demand (Veh/hr)
Junction Arrivals
(Veh)
Capacity (Veh/hr)
RFCThroughput
(Veh/hr)Start queue
(Veh)End queue
(Veh)Delay (s) LOS
B-C 218 55 665 0.328 218 0.5 0.5 8.050 A
B-A 40 10 306 0.130 40 0.1 0.1 13.523 B
C-A 70 18 70
C-B 363 91 607 0.599 363 1.4 1.5 14.760 B
A-B 192 48 192
A-C 143 36 143
StreamTotal
Demand (Veh/hr)
Junction Arrivals
(Veh)
Capacity (Veh/hr)
RFCThroughput
(Veh/hr)Start queue
(Veh)End queue
(Veh)Delay (s) LOS
B-C 178 44 683 0.261 179 0.5 0.4 7.151 A
B-A 32 8 338 0.096 33 0.1 0.1 11.774 B
Page 28 of 35
17/08/2021file:///C:/Files%20-%20Simon/BTP%20Projects/BTP-2128%20-%20WCM%20White...

18:00 - 18:15
C-A 58 14 58
C-B 297 74 624 0.476 299 1.5 0.9 11.158 B
A-B 156 39 156
A-C 117 29 117
StreamTotal
Demand (Veh/hr)
Junction Arrivals
(Veh)
Capacity (Veh/hr)
RFCThroughput
(Veh/hr)Start queue
(Veh)End queue
(Veh)Delay (s) LOS
B-C 149 37 695 0.215 149 0.4 0.3 6.604 A
B-A 27 7 362 0.075 27 0.1 0.1 10.740 B
C-A 48 12 48
C-B 248 62 636 0.391 250 0.9 0.7 9.349 A
A-B 131 33 131
A-C 98 24 98
Page 29 of 35
17/08/2021file:///C:/Files%20-%20Simon/BTP%20Projects/BTP-2128%20-%20WCM%20White...

Existing Layout - 2035 Operation, AM2
Data Errors and WarningsNo errors or warnings
Junction Network
Junctions
Junction Network Options
Traffic Demand
Demand Set Details
Demand overview (Traffic)
Origin-Destination Data
Vehicle Mix
Results
Junction Name Junction Type Major road direction Junction Delay (s) Junction LOS
1 Junction T-Junction Two-way 10.41 B
Driving side Lighting Network residual capacity (%) First arm reaching threshold
Left Normal/unknown 29 Stream B-C
IDScenario
nameTime Period
nameTraffic profile
typeStart time (HH:mm)
Finish time (HH:mm)
Time segment length (min)
Run automatically
D10 2035 Operation AM2 ONE HOUR 07:45 09:15 15 �
Vehicle mix varies over turn Vehicle mix varies over entry Vehicle mix source PCU Factor for a HV (PCU)
� � HV Percentages 2.00
Arm Linked arm Profile type Use O-D data Average Demand (Veh/hr) Scaling Factor (%)
A - St Bees Rd south ONE HOUR � 81 100.000
B - Wilson Pit Rd ONE HOUR � 465 100.000
C - St Bees Rd north ONE HOUR � 304 100.000
Demand (Veh/hr)
To
From
A - St Bees Rd south B - Wilson Pit Rd C - St Bees Rd north
A - St Bees Rd south 0 24 57
B - Wilson Pit Rd 43 0 422
C - St Bees Rd north 54 250 0
Heavy Vehicle Percentages
To
From
A - St Bees Rd south B - Wilson Pit Rd C - St Bees Rd north
A - St Bees Rd south 0 0 5
B - Wilson Pit Rd 0 0 0
C - St Bees Rd north 4 0 0
Page 30 of 35
17/08/2021file:///C:/Files%20-%20Simon/BTP%20Projects/BTP-2128%20-%20WCM%20White...

Results Summary for whole modelled period
Main Results for each time segment
07:45 - 08:00
08:00 - 08:15
08:15 - 08:30
08:30 - 08:45
08:45 - 09:00
Stream Max RFC Max delay (s) Max Queue (Veh) Max LOSAverage Demand
(Veh/hr)Total Junction Arrivals (Veh)
B-C 0.65 14.42 1.8 B 387 581
B-A 0.14 12.86 0.2 B 39 59
C-A 50 74
C-B 0.41 9.04 0.7 A 229 344
A-B 22 33
A-C 52 78
StreamTotal
Demand (Veh/hr)
Junction Arrivals
(Veh)
Capacity (Veh/hr)
RFCThroughput
(Veh/hr)Start queue
(Veh)End queue
(Veh)Delay (s) LOS
B-C 318 79 730 0.435 315 0.0 0.8 8.603 A
B-A 32 8 395 0.082 32 0.0 0.1 9.899 A
C-A 41 10 41
C-B 188 47 681 0.276 187 0.0 0.4 7.260 A
A-B 18 5 18
A-C 43 11 43
StreamTotal
Demand (Veh/hr)
Junction Arrivals
(Veh)
Capacity (Veh/hr)
RFCThroughput
(Veh/hr)Start queue
(Veh)End queue
(Veh)Delay (s) LOS
B-C 379 95 723 0.524 378 0.8 1.1 10.383 B
B-A 39 10 372 0.104 39 0.1 0.1 10.783 B
C-A 49 12 49
C-B 225 56 678 0.332 224 0.4 0.5 7.931 A
A-B 22 5 22
A-C 51 13 51
StreamTotal
Demand (Veh/hr)
Junction Arrivals
(Veh)
Capacity (Veh/hr)
RFCThroughput
(Veh/hr)Start queue
(Veh)End queue
(Veh)Delay (s) LOS
B-C 465 116 714 0.651 462 1.1 1.8 14.118 B
B-A 47 12 329 0.144 47 0.1 0.2 12.778 B
C-A 59 15 59
C-B 275 69 673 0.409 274 0.5 0.7 9.008 A
A-B 26 7 26
A-C 63 16 63
StreamTotal
Demand (Veh/hr)
Junction Arrivals
(Veh)
Capacity (Veh/hr)
RFCThroughput
(Veh/hr)Start queue
(Veh)End queue
(Veh)Delay (s) LOS
B-C 465 116 714 0.651 464 1.8 1.8 14.418 B
B-A 47 12 327 0.145 47 0.2 0.2 12.858 B
C-A 59 15 59
C-B 275 69 673 0.409 275 0.7 0.7 9.045 A
A-B 26 7 26
A-C 63 16 63
StreamTotal
Demand (Veh/hr)
Junction Arrivals
(Veh)
Capacity (Veh/hr)
RFCThroughput
(Veh/hr)Start queue
(Veh)End queue
(Veh)Delay (s) LOS
B-C 379 95 723 0.524 382 1.8 1.1 10.637 B
B-A 39 10 371 0.104 39 0.2 0.1 10.840 B
Page 31 of 35
17/08/2021file:///C:/Files%20-%20Simon/BTP%20Projects/BTP-2128%20-%20WCM%20White...

09:00 - 09:15
C-A 49 12 49
C-B 225 56 678 0.332 225 0.7 0.5 7.972 A
A-B 22 5 22
A-C 51 13 51
StreamTotal
Demand (Veh/hr)
Junction Arrivals
(Veh)
Capacity (Veh/hr)
RFCThroughput
(Veh/hr)Start queue
(Veh)End queue
(Veh)Delay (s) LOS
B-C 318 79 730 0.435 319 1.1 0.8 8.790 A
B-A 32 8 394 0.082 32 0.1 0.1 9.952 A
C-A 41 10 41
C-B 188 47 681 0.276 189 0.5 0.4 7.320 A
A-B 18 5 18
A-C 43 11 43
Page 32 of 35
17/08/2021file:///C:/Files%20-%20Simon/BTP%20Projects/BTP-2128%20-%20WCM%20White...
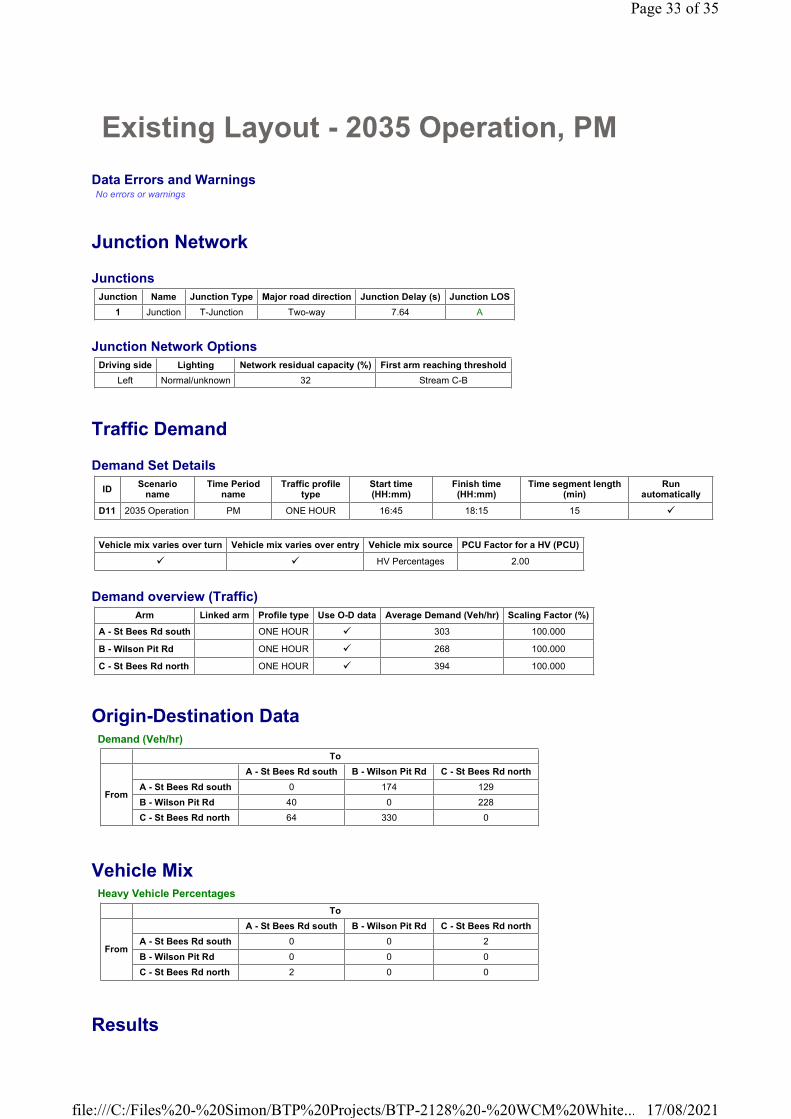
Existing Layout - 2035 Operation, PM
Data Errors and WarningsNo errors or warnings
Junction Network
Junctions
Junction Network Options
Traffic Demand
Demand Set Details
Demand overview (Traffic)
Origin-Destination Data
Vehicle Mix
Results
Junction Name Junction Type Major road direction Junction Delay (s) Junction LOS
1 Junction T-Junction Two-way 7.64 A
Driving side Lighting Network residual capacity (%) First arm reaching threshold
Left Normal/unknown 32 Stream C-B
IDScenario
nameTime Period
nameTraffic profile
typeStart time (HH:mm)
Finish time (HH:mm)
Time segment length (min)
Run automatically
D11 2035 Operation PM ONE HOUR 16:45 18:15 15 �
Vehicle mix varies over turn Vehicle mix varies over entry Vehicle mix source PCU Factor for a HV (PCU)
� � HV Percentages 2.00
Arm Linked arm Profile type Use O-D data Average Demand (Veh/hr) Scaling Factor (%)
A - St Bees Rd south ONE HOUR � 303 100.000
B - Wilson Pit Rd ONE HOUR � 268 100.000
C - St Bees Rd north ONE HOUR � 394 100.000
Demand (Veh/hr)
To
From
A - St Bees Rd south B - Wilson Pit Rd C - St Bees Rd north
A - St Bees Rd south 0 174 129
B - Wilson Pit Rd 40 0 228
C - St Bees Rd north 64 330 0
Heavy Vehicle Percentages
To
From
A - St Bees Rd south B - Wilson Pit Rd C - St Bees Rd north
A - St Bees Rd south 0 0 2
B - Wilson Pit Rd 0 0 0
C - St Bees Rd north 2 0 0
Page 33 of 35
17/08/2021file:///C:/Files%20-%20Simon/BTP%20Projects/BTP-2128%20-%20WCM%20White...

Results Summary for whole modelled period
Main Results for each time segment
16:45 - 17:00
17:00 - 17:15
17:15 - 17:30
17:30 - 17:45
17:45 - 18:00
Stream Max RFC Max delay (s) Max Queue (Veh) Max LOSAverage Demand
(Veh/hr)Total Junction Arrivals (Veh)
B-C 0.38 8.73 0.6 A 209 314
B-A 0.14 13.80 0.2 B 37 55
C-A 59 88
C-B 0.60 14.74 1.5 B 303 454
A-B 160 239
A-C 118 178
StreamTotal
Demand (Veh/hr)
Junction Arrivals
(Veh)
Capacity (Veh/hr)
RFCThroughput
(Veh/hr)Start queue
(Veh)End queue
(Veh)Delay (s) LOS
B-C 172 43 694 0.247 170 0.0 0.3 6.853 A
B-A 30 8 363 0.083 30 0.0 0.1 10.783 B
C-A 48 12 48
C-B 248 62 636 0.391 246 0.0 0.6 9.174 A
A-B 131 33 131
A-C 97 24 97
StreamTotal
Demand (Veh/hr)
Junction Arrivals
(Veh)
Capacity (Veh/hr)
RFCThroughput
(Veh/hr)Start queue
(Veh)End queue
(Veh)Delay (s) LOS
B-C 205 51 682 0.301 205 0.3 0.4 7.538 A
B-A 36 9 339 0.106 36 0.1 0.1 11.872 B
C-A 58 14 58
C-B 297 74 624 0.476 296 0.6 0.9 10.934 B
A-B 156 39 156
A-C 116 29 116
StreamTotal
Demand (Veh/hr)
Junction Arrivals
(Veh)
Capacity (Veh/hr)
RFCThroughput
(Veh/hr)Start queue
(Veh)End queue
(Veh)Delay (s) LOS
B-C 251 63 664 0.378 250 0.4 0.6 8.695 A
B-A 44 11 306 0.144 44 0.1 0.2 13.743 B
C-A 70 18 70
C-B 363 91 607 0.598 361 0.9 1.4 14.500 B
A-B 192 48 192
A-C 142 36 142
StreamTotal
Demand (Veh/hr)
Junction Arrivals
(Veh)
Capacity (Veh/hr)
RFCThroughput
(Veh/hr)Start queue
(Veh)End queue
(Veh)Delay (s) LOS
B-C 251 63 663 0.378 251 0.6 0.6 8.728 A
B-A 44 11 305 0.144 44 0.2 0.2 13.799 B
C-A 70 18 70
C-B 363 91 607 0.598 363 1.4 1.5 14.742 B
A-B 192 48 192
A-C 142 36 142
StreamTotal
Demand (Veh/hr)
Junction Arrivals
(Veh)
Capacity (Veh/hr)
RFCThroughput
(Veh/hr)Start queue
(Veh)End queue
(Veh)Delay (s) LOS
B-C 205 51 681 0.301 206 0.6 0.4 7.575 A
B-A 36 9 338 0.106 36 0.2 0.1 11.934 B
Page 34 of 35
17/08/2021file:///C:/Files%20-%20Simon/BTP%20Projects/BTP-2128%20-%20WCM%20White...

18:00 - 18:15
C-A 58 14 58
C-B 297 74 624 0.476 299 1.5 0.9 11.147 B
A-B 156 39 156
A-C 116 29 116
StreamTotal
Demand (Veh/hr)
Junction Arrivals
(Veh)
Capacity (Veh/hr)
RFCThroughput
(Veh/hr)Start queue
(Veh)End queue
(Veh)Delay (s) LOS
B-C 172 43 694 0.247 172 0.4 0.3 6.904 A
B-A 30 8 362 0.083 30 0.1 0.1 10.851 B
C-A 48 12 48
C-B 248 62 636 0.391 250 0.9 0.7 9.344 A
A-B 131 33 131
A-C 97 24 97
Page 35 of 35
17/08/2021file:///C:/Files%20-%20Simon/BTP%20Projects/BTP-2128%20-%20WCM%20White...
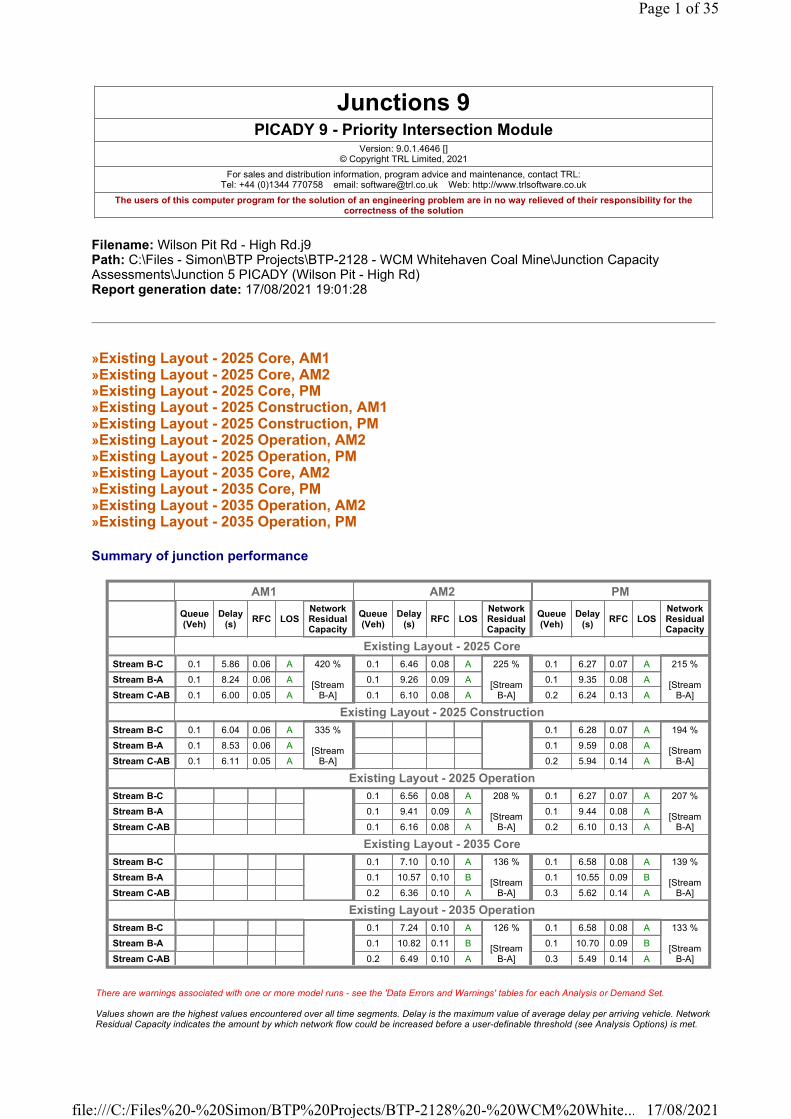
Filename: Wilson Pit Rd - High Rd.j9Path: C:\Files - Simon\BTP Projects\BTP-2128 - WCM Whitehaven Coal Mine\Junction Capacity Assessments\Junction 5 PICADY (Wilson Pit - High Rd)Report generation date: 17/08/2021 19:01:28
»Existing Layout - 2025 Core, AM1»Existing Layout - 2025 Core, AM2»Existing Layout - 2025 Core, PM»Existing Layout - 2025 Construction, AM1»Existing Layout - 2025 Construction, PM»Existing Layout - 2025 Operation, AM2»Existing Layout - 2025 Operation, PM»Existing Layout - 2035 Core, AM2»Existing Layout - 2035 Core, PM»Existing Layout - 2035 Operation, AM2»Existing Layout - 2035 Operation, PM
Summary of junction performance
Junctions 9PICADY 9 - Priority Intersection Module
Version: 9.0.1.4646 [] © Copyright TRL Limited, 2021
For sales and distribution information, program advice and maintenance, contact TRL:Tel: +44 (0)1344 770758 email: [email protected] Web: http://www.trlsoftware.co.uk
The users of this computer program for the solution of an engineering problem are in no way relieved of their responsibility for the correctness of the solution
AM1 AM2 PM
Queue (Veh)
Delay (s)
RFC LOSNetwork Residual Capacity
Queue (Veh)
Delay (s)
RFC LOSNetwork Residual Capacity
Queue (Veh)
Delay (s)
RFC LOSNetwork Residual Capacity
Existing Layout - 2025 Core
Stream B-C 0.1 5.86 0.06 A 420 %
[Stream B-A]
0.1 6.46 0.08 A 225 %
[Stream B-A]
0.1 6.27 0.07 A 215 %
[Stream B-A]
Stream B-A 0.1 8.24 0.06 A 0.1 9.26 0.09 A 0.1 9.35 0.08 A
Stream C-AB 0.1 6.00 0.05 A 0.1 6.10 0.08 A 0.2 6.24 0.13 A
Existing Layout - 2025 Construction
Stream B-C 0.1 6.04 0.06 A 335 %
[Stream B-A]
0.1 6.28 0.07 A 194 %
[Stream B-A]
Stream B-A 0.1 8.53 0.06 A 0.1 9.59 0.08 A
Stream C-AB 0.1 6.11 0.05 A 0.2 5.94 0.14 A
Existing Layout - 2025 Operation
Stream B-C 0.1 6.56 0.08 A 208 %
[Stream B-A]
0.1 6.27 0.07 A 207 %
[Stream B-A]
Stream B-A 0.1 9.41 0.09 A 0.1 9.44 0.08 A
Stream C-AB 0.1 6.16 0.08 A 0.2 6.10 0.13 A
Existing Layout - 2035 Core
Stream B-C 0.1 7.10 0.10 A 136 %
[Stream B-A]
0.1 6.58 0.08 A 139 %
[Stream B-A]
Stream B-A 0.1 10.57 0.10 B 0.1 10.55 0.09 B
Stream C-AB 0.2 6.36 0.10 A 0.3 5.62 0.14 A
Existing Layout - 2035 Operation
Stream B-C 0.1 7.24 0.10 A 126 %
[Stream B-A]
0.1 6.58 0.08 A 133 %
[Stream B-A]
Stream B-A 0.1 10.82 0.11 B 0.1 10.70 0.09 B
Stream C-AB 0.2 6.49 0.10 A 0.3 5.49 0.14 A
There are warnings associated with one or more model runs - see the 'Data Errors and Warnings' tables for each Analysis or Demand Set.
Values shown are the highest values encountered over all time segments. Delay is the maximum value of average delay per arriving vehicle. Network Residual Capacity indicates the amount by which network flow could be increased before a user-definable threshold (see Analysis Options) is met.
Page 1 of 35
17/08/2021file:///C:/Files%20-%20Simon/BTP%20Projects/BTP-2128%20-%20WCM%20White...
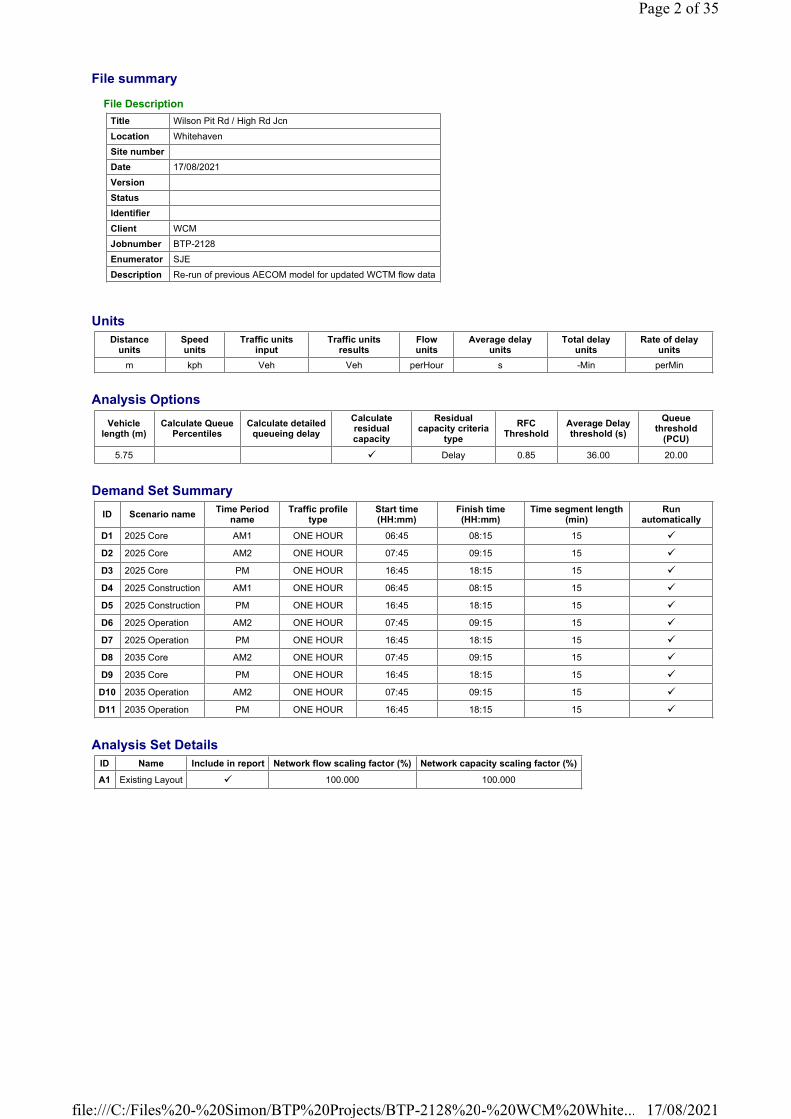
File summary
Units
Analysis Options
Demand Set Summary
Analysis Set Details
File Description
Title Wilson Pit Rd / High Rd Jcn
Location Whitehaven
Site number
Date 17/08/2021
Version
Status
Identifier
Client WCM
Jobnumber BTP-2128
Enumerator SJE
Description Re-run of previous AECOM model for updated WCTM flow data
Distance units
Speed units
Traffic units input
Traffic units results
Flow units
Average delay units
Total delay units
Rate of delay units
m kph Veh Veh perHour s -Min perMin
Vehicle length (m)
Calculate Queue Percentiles
Calculate detailed queueing delay
Calculate residual capacity
Residual capacity criteria
type
RFC Threshold
Average Delay threshold (s)
Queue threshold
(PCU)
5.75 � Delay 0.85 36.00 20.00
ID Scenario nameTime Period
nameTraffic profile
typeStart time (HH:mm)
Finish time (HH:mm)
Time segment length (min)
Run automatically
D1 2025 Core AM1 ONE HOUR 06:45 08:15 15 �
D2 2025 Core AM2 ONE HOUR 07:45 09:15 15 �
D3 2025 Core PM ONE HOUR 16:45 18:15 15 �
D4 2025 Construction AM1 ONE HOUR 06:45 08:15 15 �
D5 2025 Construction PM ONE HOUR 16:45 18:15 15 �
D6 2025 Operation AM2 ONE HOUR 07:45 09:15 15 �
D7 2025 Operation PM ONE HOUR 16:45 18:15 15 �
D8 2035 Core AM2 ONE HOUR 07:45 09:15 15 �
D9 2035 Core PM ONE HOUR 16:45 18:15 15 �
D10 2035 Operation AM2 ONE HOUR 07:45 09:15 15 �
D11 2035 Operation PM ONE HOUR 16:45 18:15 15 �
ID Name Include in report Network flow scaling factor (%) Network capacity scaling factor (%)
A1 Existing Layout � 100.000 100.000
Page 2 of 35
17/08/2021file:///C:/Files%20-%20Simon/BTP%20Projects/BTP-2128%20-%20WCM%20White...
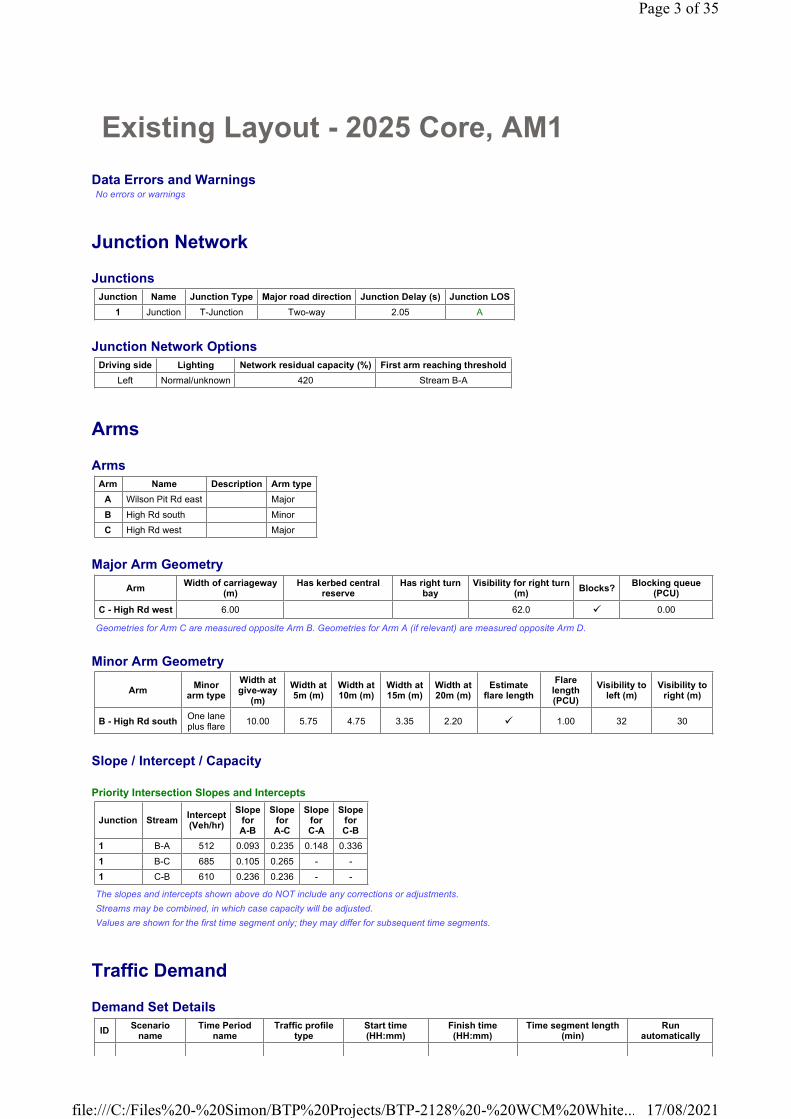
Existing Layout - 2025 Core, AM1
Data Errors and WarningsNo errors or warnings
Junction Network
Junctions
Junction Network Options
Arms
Arms
Major Arm Geometry
Geometries for Arm C are measured opposite Arm B. Geometries for Arm A (if relevant) are measured opposite Arm D.
Minor Arm Geometry
Slope / Intercept / Capacity
Priority Intersection Slopes and Intercepts
The slopes and intercepts shown above do NOT include any corrections or adjustments.
Streams may be combined, in which case capacity will be adjusted.
Values are shown for the first time segment only; they may differ for subsequent time segments.
Traffic Demand
Demand Set Details
Junction Name Junction Type Major road direction Junction Delay (s) Junction LOS
1 Junction T-Junction Two-way 2.05 A
Driving side Lighting Network residual capacity (%) First arm reaching threshold
Left Normal/unknown 420 Stream B-A
Arm Name Description Arm type
A Wilson Pit Rd east Major
B High Rd south Minor
C High Rd west Major
ArmWidth of carriageway
(m)Has kerbed central
reserveHas right turn
bayVisibility for right turn
(m)Blocks?
Blocking queue (PCU)
C - High Rd west 6.00 62.0 � 0.00
ArmMinor
arm type
Width at give-way
(m)
Width at 5m (m)
Width at 10m (m)
Width at 15m (m)
Width at 20m (m)
Estimate flare length
Flare length (PCU)
Visibility to left (m)
Visibility to right (m)
B - High Rd southOne lane plus flare
10.00 5.75 4.75 3.35 2.20 � 1.00 32 30
Junction StreamIntercept(Veh/hr)
SlopeforA-B
SlopeforA-C
SlopeforC-A
SlopeforC-B
1 B-A 512 0.093 0.235 0.148 0.336
1 B-C 685 0.105 0.265 - -
1 C-B 610 0.236 0.236 - -
IDScenario
nameTime Period
nameTraffic profile
typeStart time (HH:mm)
Finish time (HH:mm)
Time segment length (min)
Run automatically
Page 3 of 35
17/08/2021file:///C:/Files%20-%20Simon/BTP%20Projects/BTP-2128%20-%20WCM%20White...

Demand overview (Traffic)
Origin-Destination Data
Vehicle Mix
Results
Results Summary for whole modelled period
Main Results for each time segment
06:45 - 07:00
07:00 - 07:15
D1 2025 Core AM1 ONE HOUR 06:45 08:15 15 �
Vehicle mix varies over turn Vehicle mix varies over entry Vehicle mix source PCU Factor for a HV (PCU)
� � HV Percentages 2.00
Arm Linked arm Profile type Use O-D data Average Demand (Veh/hr) Scaling Factor (%)
A - Wilson Pit Rd east ONE HOUR � 99 100.000
B - High Rd south ONE HOUR � 58 100.000
C - High Rd west ONE HOUR � 122 100.000
Demand (Veh/hr)
To
From
A - Wilson Pit Rd east B - High Rd south C - High Rd west
A - Wilson Pit Rd east 0 25 74
B - High Rd south 25 0 33
C - High Rd west 98 24 0
Heavy Vehicle Percentages
To
From
A - Wilson Pit Rd east B - High Rd south C - High Rd west
A - Wilson Pit Rd east 0 0 0
B - High Rd south 0 0 0
C - High Rd west 0 4 0
Stream Max RFC Max delay (s) Max Queue (Veh) Max LOSAverage Demand
(Veh/hr)Total Junction Arrivals (Veh)
B-C 0.06 5.86 0.1 A 30 45
B-A 0.06 8.24 0.1 A 23 34
C-AB 0.05 6.00 0.1 A 26 39
C-A 86 129
A-B 23 34
A-C 68 102
StreamTotal
Demand (Veh/hr)
Junction Arrivals
(Veh)
Capacity (Veh/hr)
RFCThroughput
(Veh/hr)Start queue
(Veh)End queue
(Veh)Delay (s) LOS
B-C 25 6 662 0.038 25 0.0 0.0 5.649 A
B-A 19 5 479 0.039 19 0.0 0.0 7.811 A
C-AB 21 5 620 0.033 20 0.0 0.0 6.002 A
C-A 71 18 71
A-B 19 5 19
A-C 56 14 56
Page 4 of 35
17/08/2021file:///C:/Files%20-%20Simon/BTP%20Projects/BTP-2128%20-%20WCM%20White...
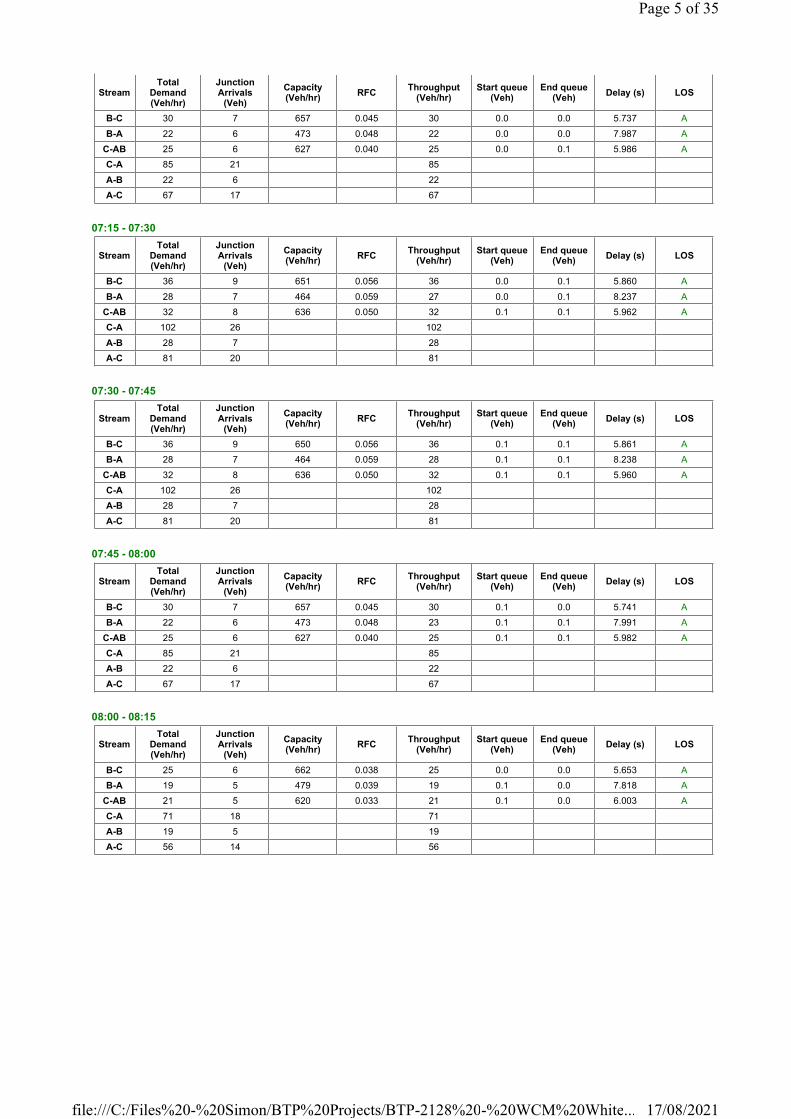
07:15 - 07:30
07:30 - 07:45
07:45 - 08:00
08:00 - 08:15
StreamTotal
Demand (Veh/hr)
Junction Arrivals
(Veh)
Capacity (Veh/hr)
RFCThroughput
(Veh/hr)Start queue
(Veh)End queue
(Veh)Delay (s) LOS
B-C 30 7 657 0.045 30 0.0 0.0 5.737 A
B-A 22 6 473 0.048 22 0.0 0.0 7.987 A
C-AB 25 6 627 0.040 25 0.0 0.1 5.986 A
C-A 85 21 85
A-B 22 6 22
A-C 67 17 67
StreamTotal
Demand (Veh/hr)
Junction Arrivals
(Veh)
Capacity (Veh/hr)
RFCThroughput
(Veh/hr)Start queue
(Veh)End queue
(Veh)Delay (s) LOS
B-C 36 9 651 0.056 36 0.0 0.1 5.860 A
B-A 28 7 464 0.059 27 0.0 0.1 8.237 A
C-AB 32 8 636 0.050 32 0.1 0.1 5.962 A
C-A 102 26 102
A-B 28 7 28
A-C 81 20 81
StreamTotal
Demand (Veh/hr)
Junction Arrivals
(Veh)
Capacity (Veh/hr)
RFCThroughput
(Veh/hr)Start queue
(Veh)End queue
(Veh)Delay (s) LOS
B-C 36 9 650 0.056 36 0.1 0.1 5.861 A
B-A 28 7 464 0.059 28 0.1 0.1 8.238 A
C-AB 32 8 636 0.050 32 0.1 0.1 5.960 A
C-A 102 26 102
A-B 28 7 28
A-C 81 20 81
StreamTotal
Demand (Veh/hr)
Junction Arrivals
(Veh)
Capacity (Veh/hr)
RFCThroughput
(Veh/hr)Start queue
(Veh)End queue
(Veh)Delay (s) LOS
B-C 30 7 657 0.045 30 0.1 0.0 5.741 A
B-A 22 6 473 0.048 23 0.1 0.1 7.991 A
C-AB 25 6 627 0.040 25 0.1 0.1 5.982 A
C-A 85 21 85
A-B 22 6 22
A-C 67 17 67
StreamTotal
Demand (Veh/hr)
Junction Arrivals
(Veh)
Capacity (Veh/hr)
RFCThroughput
(Veh/hr)Start queue
(Veh)End queue
(Veh)Delay (s) LOS
B-C 25 6 662 0.038 25 0.0 0.0 5.653 A
B-A 19 5 479 0.039 19 0.1 0.0 7.818 A
C-AB 21 5 620 0.033 21 0.1 0.0 6.003 A
C-A 71 18 71
A-B 19 5 19
A-C 56 14 56
Page 5 of 35
17/08/2021file:///C:/Files%20-%20Simon/BTP%20Projects/BTP-2128%20-%20WCM%20White...
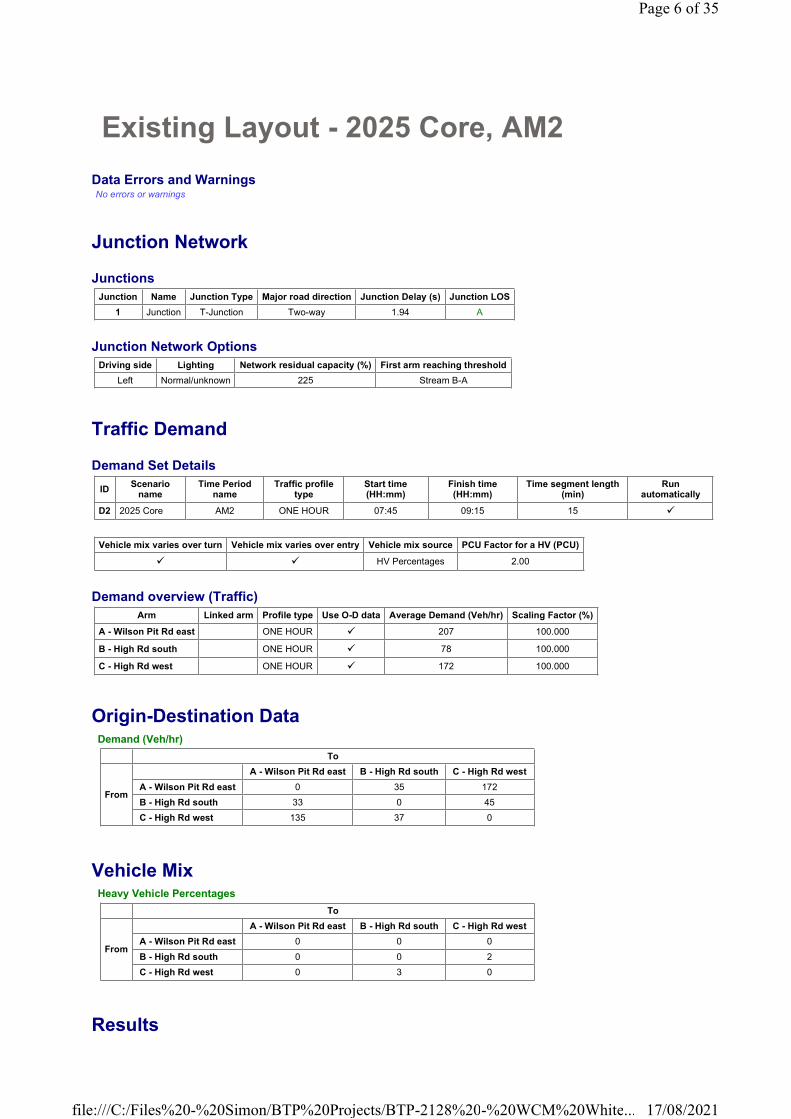
Existing Layout - 2025 Core, AM2
Data Errors and WarningsNo errors or warnings
Junction Network
Junctions
Junction Network Options
Traffic Demand
Demand Set Details
Demand overview (Traffic)
Origin-Destination Data
Vehicle Mix
Results
Junction Name Junction Type Major road direction Junction Delay (s) Junction LOS
1 Junction T-Junction Two-way 1.94 A
Driving side Lighting Network residual capacity (%) First arm reaching threshold
Left Normal/unknown 225 Stream B-A
IDScenario
nameTime Period
nameTraffic profile
typeStart time (HH:mm)
Finish time (HH:mm)
Time segment length (min)
Run automatically
D2 2025 Core AM2 ONE HOUR 07:45 09:15 15 �
Vehicle mix varies over turn Vehicle mix varies over entry Vehicle mix source PCU Factor for a HV (PCU)
� � HV Percentages 2.00
Arm Linked arm Profile type Use O-D data Average Demand (Veh/hr) Scaling Factor (%)
A - Wilson Pit Rd east ONE HOUR � 207 100.000
B - High Rd south ONE HOUR � 78 100.000
C - High Rd west ONE HOUR � 172 100.000
Demand (Veh/hr)
To
From
A - Wilson Pit Rd east B - High Rd south C - High Rd west
A - Wilson Pit Rd east 0 35 172
B - High Rd south 33 0 45
C - High Rd west 135 37 0
Heavy Vehicle Percentages
To
From
A - Wilson Pit Rd east B - High Rd south C - High Rd west
A - Wilson Pit Rd east 0 0 0
B - High Rd south 0 0 2
C - High Rd west 0 3 0
Page 6 of 35
17/08/2021file:///C:/Files%20-%20Simon/BTP%20Projects/BTP-2128%20-%20WCM%20White...

Results Summary for whole modelled period
Main Results for each time segment
07:45 - 08:00
08:00 - 08:15
08:15 - 08:30
08:30 - 08:45
08:45 - 09:00
Stream Max RFC Max delay (s) Max Queue (Veh) Max LOSAverage Demand
(Veh/hr)Total Junction Arrivals (Veh)
B-C 0.08 6.46 0.1 A 41 62
B-A 0.09 9.26 0.1 A 30 45
C-AB 0.08 6.10 0.1 A 43 64
C-A 115 173
A-B 32 48
A-C 158 237
StreamTotal
Demand (Veh/hr)
Junction Arrivals
(Veh)
Capacity (Veh/hr)
RFCThroughput
(Veh/hr)Start queue
(Veh)End queue
(Veh)Delay (s) LOS
B-C 34 8 629 0.054 34 0.0 0.1 6.045 A
B-A 25 6 452 0.055 25 0.0 0.1 8.423 A
C-AB 33 8 627 0.053 33 0.0 0.1 6.064 A
C-A 96 24 96
A-B 26 7 26
A-C 129 32 129
StreamTotal
Demand (Veh/hr)
Junction Arrivals
(Veh)
Capacity (Veh/hr)
RFCThroughput
(Veh/hr)Start queue
(Veh)End queue
(Veh)Delay (s) LOS
B-C 40 10 620 0.065 40 0.1 0.1 6.212 A
B-A 30 7 441 0.067 30 0.1 0.1 8.759 A
C-AB 41 10 634 0.065 41 0.1 0.1 6.077 A
C-A 113 28 113
A-B 31 8 31
A-C 155 39 155
StreamTotal
Demand (Veh/hr)
Junction Arrivals
(Veh)
Capacity (Veh/hr)
RFCThroughput
(Veh/hr)Start queue
(Veh)End queue
(Veh)Delay (s) LOS
B-C 50 12 607 0.082 49 0.1 0.1 6.455 A
B-A 36 9 425 0.085 36 0.1 0.1 9.258 A
C-AB 53 13 644 0.082 53 0.1 0.1 6.097 A
C-A 136 34 136
A-B 39 10 39
A-C 189 47 189
StreamTotal
Demand (Veh/hr)
Junction Arrivals
(Veh)
Capacity (Veh/hr)
RFCThroughput
(Veh/hr)Start queue
(Veh)End queue
(Veh)Delay (s) LOS
B-C 50 12 607 0.082 50 0.1 0.1 6.456 A
B-A 36 9 425 0.085 36 0.1 0.1 9.262 A
C-AB 53 13 644 0.082 53 0.1 0.1 6.096 A
C-A 136 34 136
A-B 39 10 39
A-C 189 47 189
StreamTotal
Demand (Veh/hr)
Junction Arrivals
(Veh)
Capacity (Veh/hr)
RFCThroughput
(Veh/hr)Start queue
(Veh)End queue
(Veh)Delay (s) LOS
B-C 40 10 620 0.065 41 0.1 0.1 6.217 A
B-A 30 7 441 0.067 30 0.1 0.1 8.764 A
Page 7 of 35
17/08/2021file:///C:/Files%20-%20Simon/BTP%20Projects/BTP-2128%20-%20WCM%20White...
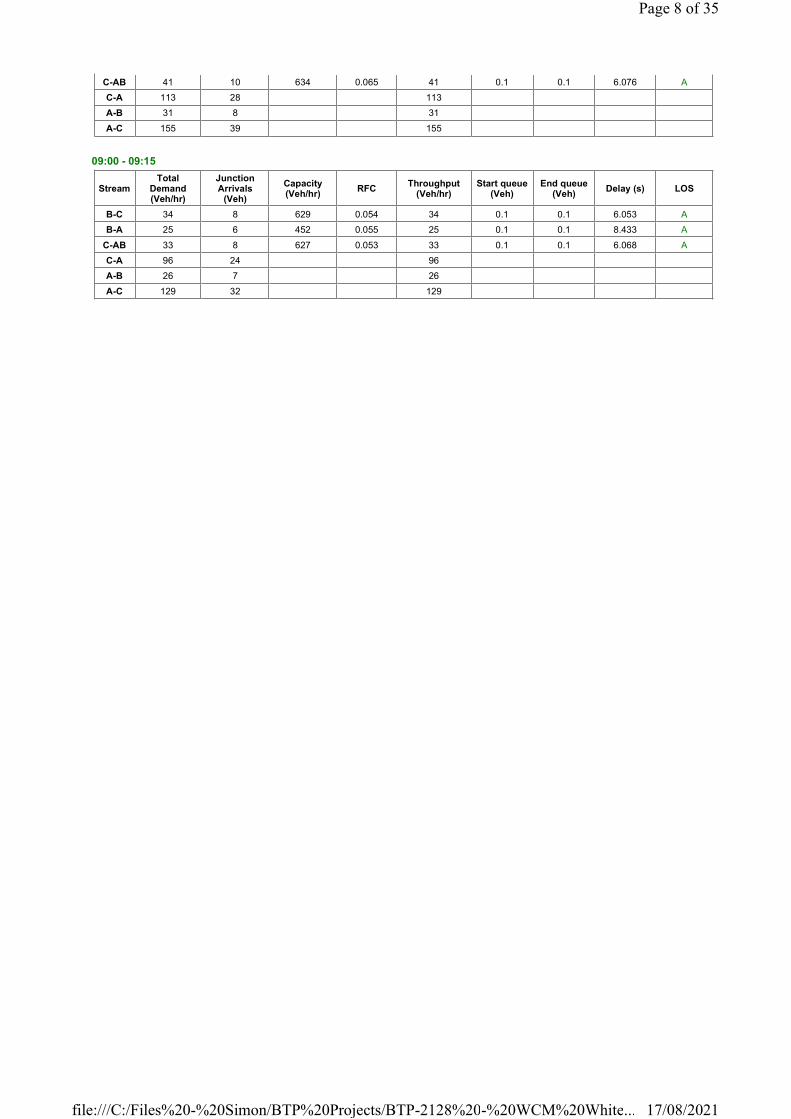
09:00 - 09:15
C-AB 41 10 634 0.065 41 0.1 0.1 6.076 A
C-A 113 28 113
A-B 31 8 31
A-C 155 39 155
StreamTotal
Demand (Veh/hr)
Junction Arrivals
(Veh)
Capacity (Veh/hr)
RFCThroughput
(Veh/hr)Start queue
(Veh)End queue
(Veh)Delay (s) LOS
B-C 34 8 629 0.054 34 0.1 0.1 6.053 A
B-A 25 6 452 0.055 25 0.1 0.1 8.433 A
C-AB 33 8 627 0.053 33 0.1 0.1 6.068 A
C-A 96 24 96
A-B 26 7 26
A-C 129 32 129
Page 8 of 35
17/08/2021file:///C:/Files%20-%20Simon/BTP%20Projects/BTP-2128%20-%20WCM%20White...
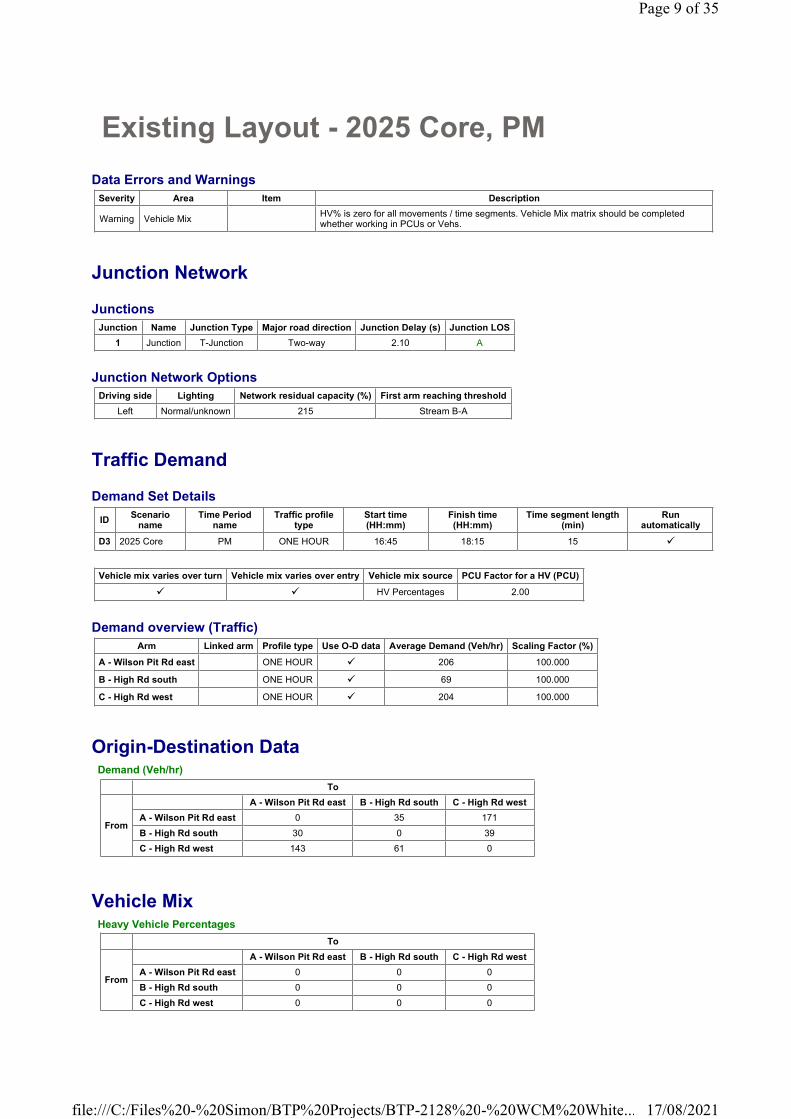
Existing Layout - 2025 Core, PM
Data Errors and Warnings
Junction Network
Junctions
Junction Network Options
Traffic Demand
Demand Set Details
Demand overview (Traffic)
Origin-Destination Data
Vehicle Mix
Severity Area Item Description
Warning Vehicle MixHV% is zero for all movements / time segments. Vehicle Mix matrix should be completed whether working in PCUs or Vehs.
Junction Name Junction Type Major road direction Junction Delay (s) Junction LOS
1 Junction T-Junction Two-way 2.10 A
Driving side Lighting Network residual capacity (%) First arm reaching threshold
Left Normal/unknown 215 Stream B-A
IDScenario
nameTime Period
nameTraffic profile
typeStart time (HH:mm)
Finish time (HH:mm)
Time segment length (min)
Run automatically
D3 2025 Core PM ONE HOUR 16:45 18:15 15 �
Vehicle mix varies over turn Vehicle mix varies over entry Vehicle mix source PCU Factor for a HV (PCU)
� � HV Percentages 2.00
Arm Linked arm Profile type Use O-D data Average Demand (Veh/hr) Scaling Factor (%)
A - Wilson Pit Rd east ONE HOUR � 206 100.000
B - High Rd south ONE HOUR � 69 100.000
C - High Rd west ONE HOUR � 204 100.000
Demand (Veh/hr)
To
From
A - Wilson Pit Rd east B - High Rd south C - High Rd west
A - Wilson Pit Rd east 0 35 171
B - High Rd south 30 0 39
C - High Rd west 143 61 0
Heavy Vehicle Percentages
To
From
A - Wilson Pit Rd east B - High Rd south C - High Rd west
A - Wilson Pit Rd east 0 0 0
B - High Rd south 0 0 0
C - High Rd west 0 0 0
Page 9 of 35
17/08/2021file:///C:/Files%20-%20Simon/BTP%20Projects/BTP-2128%20-%20WCM%20White...

Results
Results Summary for whole modelled period
Main Results for each time segment
16:45 - 17:00
17:00 - 17:15
17:15 - 17:30
17:30 - 17:45
17:45 - 18:00
Stream Max RFC Max delay (s) Max Queue (Veh) Max LOSAverage Demand
(Veh/hr)Total Junction Arrivals (Veh)
B-C 0.07 6.27 0.1 A 36 54
B-A 0.08 9.35 0.1 A 28 41
C-AB 0.13 6.24 0.2 A 71 106
C-A 117 175
A-B 32 48
A-C 157 235
StreamTotal
Demand (Veh/hr)
Junction Arrivals
(Veh)
Capacity (Veh/hr)
RFCThroughput
(Veh/hr)Start queue
(Veh)End queue
(Veh)Delay (s) LOS
B-C 29 7 639 0.046 29 0.0 0.0 5.900 A
B-A 23 6 448 0.050 22 0.0 0.1 8.456 A
C-AB 55 14 647 0.085 55 0.0 0.1 6.078 A
C-A 98 25 98
A-B 26 7 26
A-C 129 32 129
StreamTotal
Demand (Veh/hr)
Junction Arrivals
(Veh)
Capacity (Veh/hr)
RFCThroughput
(Veh/hr)Start queue
(Veh)End queue
(Veh)Delay (s) LOS
B-C 35 9 630 0.056 35 0.0 0.1 6.050 A
B-A 27 7 435 0.062 27 0.1 0.1 8.813 A
C-AB 68 17 654 0.104 68 0.1 0.1 6.143 A
C-A 115 29 115
A-B 31 8 31
A-C 154 38 154
StreamTotal
Demand (Veh/hr)
Junction Arrivals
(Veh)
Capacity (Veh/hr)
RFCThroughput
(Veh/hr)Start queue
(Veh)End queue
(Veh)Delay (s) LOS
B-C 43 11 617 0.070 43 0.1 0.1 6.266 A
B-A 33 8 418 0.079 33 0.1 0.1 9.348 A
C-AB 88 22 665 0.133 88 0.1 0.2 6.238 A
C-A 136 34 136
A-B 39 10 39
A-C 188 47 188
StreamTotal
Demand (Veh/hr)
Junction Arrivals
(Veh)
Capacity (Veh/hr)
RFCThroughput
(Veh/hr)Start queue
(Veh)End queue
(Veh)Delay (s) LOS
B-C 43 11 617 0.070 43 0.1 0.1 6.267 A
B-A 33 8 418 0.079 33 0.1 0.1 9.352 A
C-AB 88 22 665 0.133 88 0.2 0.2 6.244 A
C-A 136 34 136
A-B 39 10 39
A-C 188 47 188
Page 10 of 35
17/08/2021file:///C:/Files%20-%20Simon/BTP%20Projects/BTP-2128%20-%20WCM%20White...
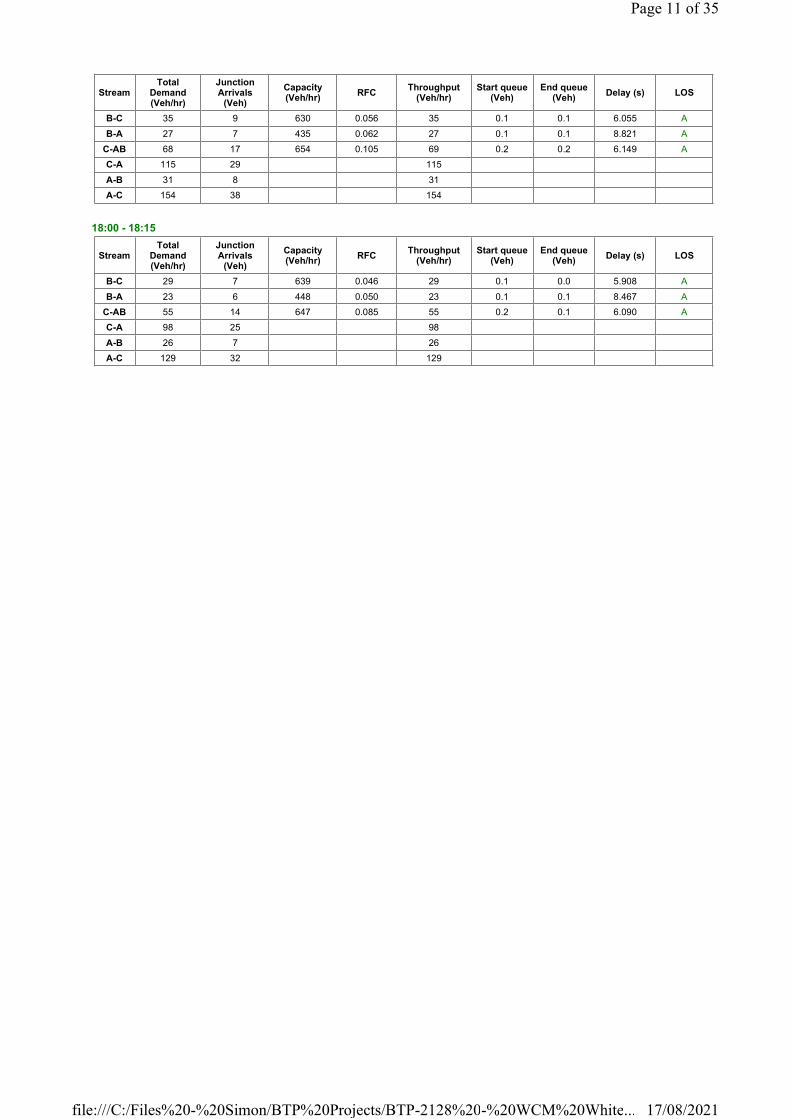
18:00 - 18:15
StreamTotal
Demand (Veh/hr)
Junction Arrivals
(Veh)
Capacity (Veh/hr)
RFCThroughput
(Veh/hr)Start queue
(Veh)End queue
(Veh)Delay (s) LOS
B-C 35 9 630 0.056 35 0.1 0.1 6.055 A
B-A 27 7 435 0.062 27 0.1 0.1 8.821 A
C-AB 68 17 654 0.105 69 0.2 0.2 6.149 A
C-A 115 29 115
A-B 31 8 31
A-C 154 38 154
StreamTotal
Demand (Veh/hr)
Junction Arrivals
(Veh)
Capacity (Veh/hr)
RFCThroughput
(Veh/hr)Start queue
(Veh)End queue
(Veh)Delay (s) LOS
B-C 29 7 639 0.046 29 0.1 0.0 5.908 A
B-A 23 6 448 0.050 23 0.1 0.1 8.467 A
C-AB 55 14 647 0.085 55 0.2 0.1 6.090 A
C-A 98 25 98
A-B 26 7 26
A-C 129 32 129
Page 11 of 35
17/08/2021file:///C:/Files%20-%20Simon/BTP%20Projects/BTP-2128%20-%20WCM%20White...
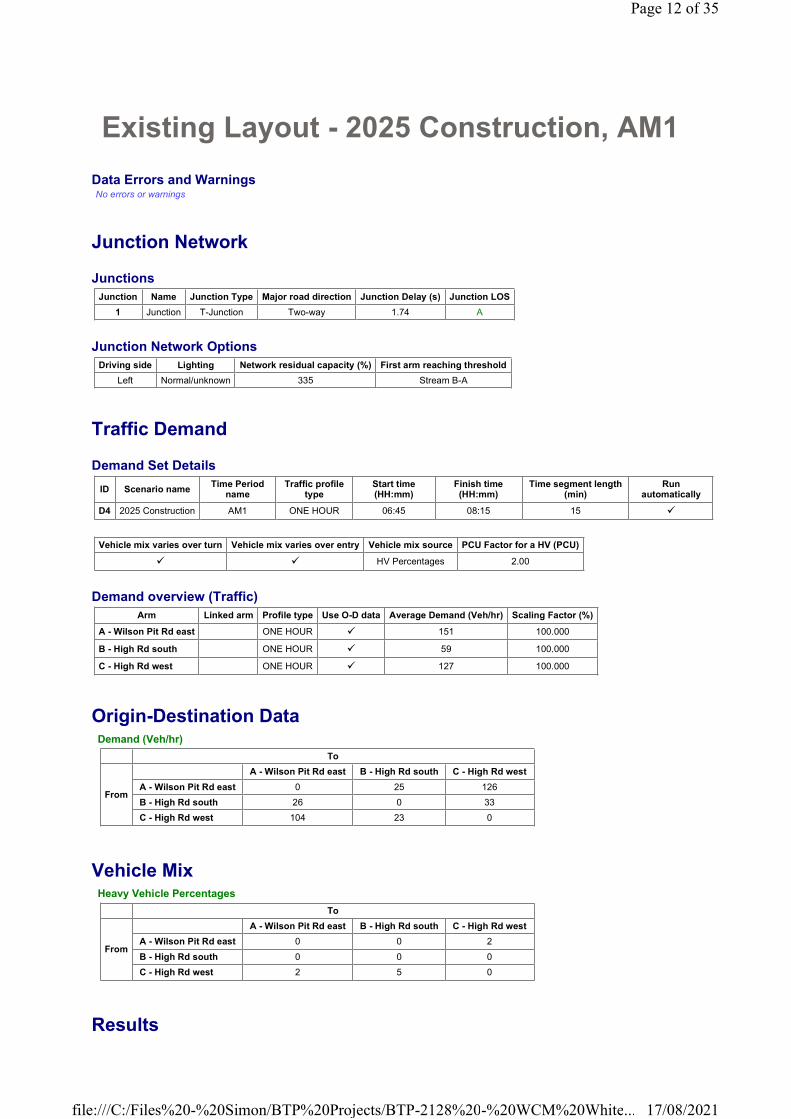
Existing Layout - 2025 Construction, AM1
Data Errors and WarningsNo errors or warnings
Junction Network
Junctions
Junction Network Options
Traffic Demand
Demand Set Details
Demand overview (Traffic)
Origin-Destination Data
Vehicle Mix
Results
Junction Name Junction Type Major road direction Junction Delay (s) Junction LOS
1 Junction T-Junction Two-way 1.74 A
Driving side Lighting Network residual capacity (%) First arm reaching threshold
Left Normal/unknown 335 Stream B-A
ID Scenario nameTime Period
nameTraffic profile
typeStart time (HH:mm)
Finish time (HH:mm)
Time segment length (min)
Run automatically
D4 2025 Construction AM1 ONE HOUR 06:45 08:15 15 �
Vehicle mix varies over turn Vehicle mix varies over entry Vehicle mix source PCU Factor for a HV (PCU)
� � HV Percentages 2.00
Arm Linked arm Profile type Use O-D data Average Demand (Veh/hr) Scaling Factor (%)
A - Wilson Pit Rd east ONE HOUR � 151 100.000
B - High Rd south ONE HOUR � 59 100.000
C - High Rd west ONE HOUR � 127 100.000
Demand (Veh/hr)
To
From
A - Wilson Pit Rd east B - High Rd south C - High Rd west
A - Wilson Pit Rd east 0 25 126
B - High Rd south 26 0 33
C - High Rd west 104 23 0
Heavy Vehicle Percentages
To
From
A - Wilson Pit Rd east B - High Rd south C - High Rd west
A - Wilson Pit Rd east 0 0 2
B - High Rd south 0 0 0
C - High Rd west 2 5 0
Page 12 of 35
17/08/2021file:///C:/Files%20-%20Simon/BTP%20Projects/BTP-2128%20-%20WCM%20White...
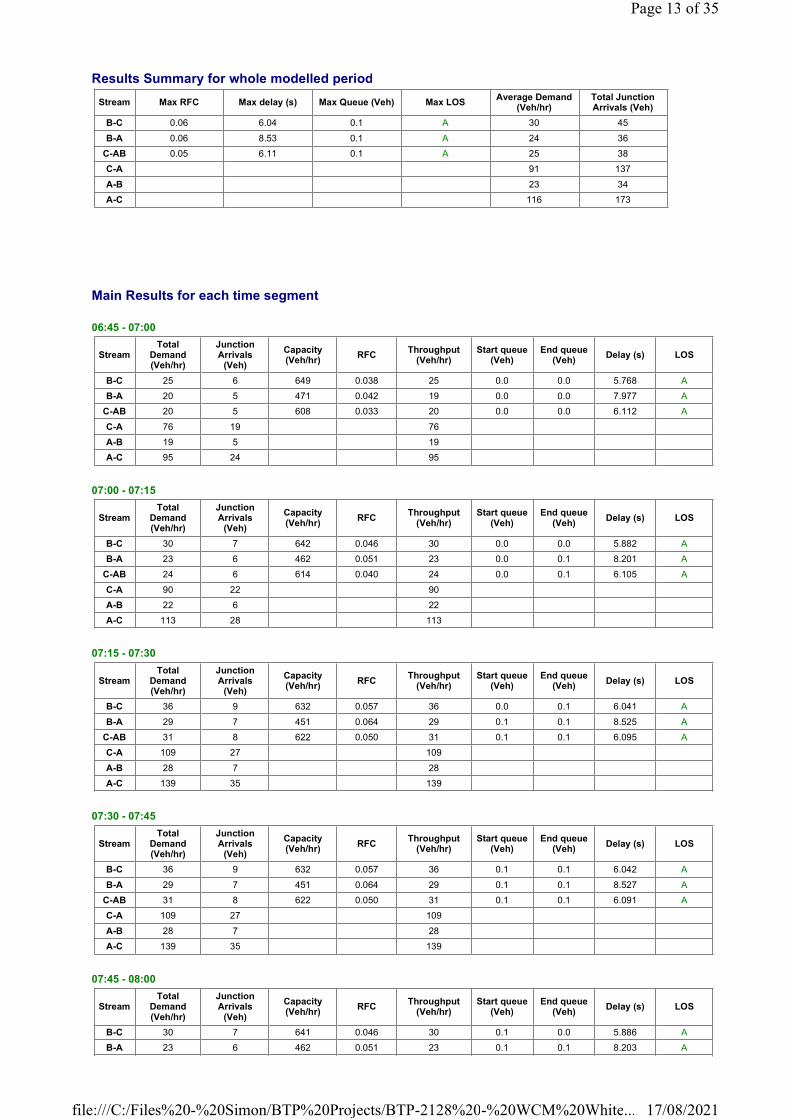
Results Summary for whole modelled period
Main Results for each time segment
06:45 - 07:00
07:00 - 07:15
07:15 - 07:30
07:30 - 07:45
07:45 - 08:00
Stream Max RFC Max delay (s) Max Queue (Veh) Max LOSAverage Demand
(Veh/hr)Total Junction Arrivals (Veh)
B-C 0.06 6.04 0.1 A 30 45
B-A 0.06 8.53 0.1 A 24 36
C-AB 0.05 6.11 0.1 A 25 38
C-A 91 137
A-B 23 34
A-C 116 173
StreamTotal
Demand (Veh/hr)
Junction Arrivals
(Veh)
Capacity (Veh/hr)
RFCThroughput
(Veh/hr)Start queue
(Veh)End queue
(Veh)Delay (s) LOS
B-C 25 6 649 0.038 25 0.0 0.0 5.768 A
B-A 20 5 471 0.042 19 0.0 0.0 7.977 A
C-AB 20 5 608 0.033 20 0.0 0.0 6.112 A
C-A 76 19 76
A-B 19 5 19
A-C 95 24 95
StreamTotal
Demand (Veh/hr)
Junction Arrivals
(Veh)
Capacity (Veh/hr)
RFCThroughput
(Veh/hr)Start queue
(Veh)End queue
(Veh)Delay (s) LOS
B-C 30 7 642 0.046 30 0.0 0.0 5.882 A
B-A 23 6 462 0.051 23 0.0 0.1 8.201 A
C-AB 24 6 614 0.040 24 0.0 0.1 6.105 A
C-A 90 22 90
A-B 22 6 22
A-C 113 28 113
StreamTotal
Demand (Veh/hr)
Junction Arrivals
(Veh)
Capacity (Veh/hr)
RFCThroughput
(Veh/hr)Start queue
(Veh)End queue
(Veh)Delay (s) LOS
B-C 36 9 632 0.057 36 0.0 0.1 6.041 A
B-A 29 7 451 0.064 29 0.1 0.1 8.525 A
C-AB 31 8 622 0.050 31 0.1 0.1 6.095 A
C-A 109 27 109
A-B 28 7 28
A-C 139 35 139
StreamTotal
Demand (Veh/hr)
Junction Arrivals
(Veh)
Capacity (Veh/hr)
RFCThroughput
(Veh/hr)Start queue
(Veh)End queue
(Veh)Delay (s) LOS
B-C 36 9 632 0.057 36 0.1 0.1 6.042 A
B-A 29 7 451 0.064 29 0.1 0.1 8.527 A
C-AB 31 8 622 0.050 31 0.1 0.1 6.091 A
C-A 109 27 109
A-B 28 7 28
A-C 139 35 139
StreamTotal
Demand (Veh/hr)
Junction Arrivals
(Veh)
Capacity (Veh/hr)
RFCThroughput
(Veh/hr)Start queue
(Veh)End queue
(Veh)Delay (s) LOS
B-C 30 7 641 0.046 30 0.1 0.0 5.886 A
B-A 23 6 462 0.051 23 0.1 0.1 8.203 A
Page 13 of 35
17/08/2021file:///C:/Files%20-%20Simon/BTP%20Projects/BTP-2128%20-%20WCM%20White...

08:00 - 08:15
C-AB 24 6 614 0.040 24 0.1 0.1 6.102 A
C-A 90 22 90
A-B 22 6 22
A-C 113 28 113
StreamTotal
Demand (Veh/hr)
Junction Arrivals
(Veh)
Capacity (Veh/hr)
RFCThroughput
(Veh/hr)Start queue
(Veh)End queue
(Veh)Delay (s) LOS
B-C 25 6 648 0.038 25 0.0 0.0 5.776 A
B-A 20 5 471 0.042 20 0.1 0.0 7.982 A
C-AB 20 5 609 0.033 20 0.1 0.0 6.114 A
C-A 76 19 76
A-B 19 5 19
A-C 95 24 95
Page 14 of 35
17/08/2021file:///C:/Files%20-%20Simon/BTP%20Projects/BTP-2128%20-%20WCM%20White...

Existing Layout - 2025 Construction, PM
Data Errors and WarningsNo errors or warnings
Junction Network
Junctions
Junction Network Options
Traffic Demand
Demand Set Details
Demand overview (Traffic)
Origin-Destination Data
Vehicle Mix
Results
Junction Name Junction Type Major road direction Junction Delay (s) Junction LOS
1 Junction T-Junction Two-way 1.92 A
Driving side Lighting Network residual capacity (%) First arm reaching threshold
Left Normal/unknown 194 Stream B-A
ID Scenario nameTime Period
nameTraffic profile
typeStart time (HH:mm)
Finish time (HH:mm)
Time segment length (min)
Run automatically
D5 2025 Construction PM ONE HOUR 16:45 18:15 15 �
Vehicle mix varies over turn Vehicle mix varies over entry Vehicle mix source PCU Factor for a HV (PCU)
� � HV Percentages 2.00
Arm Linked arm Profile type Use O-D data Average Demand (Veh/hr) Scaling Factor (%)
A - Wilson Pit Rd east ONE HOUR � 207 100.000
B - High Rd south ONE HOUR � 69 100.000
C - High Rd west ONE HOUR � 256 100.000
Demand (Veh/hr)
To
From
A - Wilson Pit Rd east B - High Rd south C - High Rd west
A - Wilson Pit Rd east 0 35 172
B - High Rd south 30 0 39
C - High Rd west 195 61 0
Heavy Vehicle Percentages
To
From
A - Wilson Pit Rd east B - High Rd south C - High Rd west
A - Wilson Pit Rd east 0 0 1
B - High Rd south 0 0 0
C - High Rd west 1 0 0
Page 15 of 35
17/08/2021file:///C:/Files%20-%20Simon/BTP%20Projects/BTP-2128%20-%20WCM%20White...

Results Summary for whole modelled period
Main Results for each time segment
16:45 - 17:00
17:00 - 17:15
17:15 - 17:30
17:30 - 17:45
17:45 - 18:00
Stream Max RFC Max delay (s) Max Queue (Veh) Max LOSAverage Demand
(Veh/hr)Total Junction Arrivals (Veh)
B-C 0.07 6.28 0.1 A 36 54
B-A 0.08 9.59 0.1 A 28 41
C-AB 0.14 5.94 0.2 A 77 115
C-A 158 238
A-B 32 48
A-C 158 237
StreamTotal
Demand (Veh/hr)
Junction Arrivals
(Veh)
Capacity (Veh/hr)
RFCThroughput
(Veh/hr)Start queue
(Veh)End queue
(Veh)Delay (s) LOS
B-C 29 7 639 0.046 29 0.0 0.0 5.906 A
B-A 23 6 441 0.051 22 0.0 0.1 8.587 A
C-AB 59 15 672 0.087 58 0.0 0.1 5.859 A
C-A 134 33 134
A-B 26 7 26
A-C 129 32 129
StreamTotal
Demand (Veh/hr)
Junction Arrivals
(Veh)
Capacity (Veh/hr)
RFCThroughput
(Veh/hr)Start queue
(Veh)End queue
(Veh)Delay (s) LOS
B-C 35 9 629 0.056 35 0.0 0.1 6.058 A
B-A 27 7 428 0.063 27 0.1 0.1 8.985 A
C-AB 74 18 685 0.108 74 0.1 0.2 5.886 A
C-A 156 39 156
A-B 31 8 31
A-C 155 39 155
StreamTotal
Demand (Veh/hr)
Junction Arrivals
(Veh)
Capacity (Veh/hr)
RFCThroughput
(Veh/hr)Start queue
(Veh)End queue
(Veh)Delay (s) LOS
B-C 43 11 616 0.070 43 0.1 0.1 6.278 A
B-A 33 8 408 0.081 33 0.1 0.1 9.585 A
C-AB 97 24 703 0.138 97 0.2 0.2 5.933 A
C-A 185 46 185
A-B 39 10 39
A-C 189 47 189
StreamTotal
Demand (Veh/hr)
Junction Arrivals
(Veh)
Capacity (Veh/hr)
RFCThroughput
(Veh/hr)Start queue
(Veh)End queue
(Veh)Delay (s) LOS
B-C 43 11 616 0.070 43 0.1 0.1 6.279 A
B-A 33 8 408 0.081 33 0.1 0.1 9.590 A
C-AB 97 24 704 0.138 97 0.2 0.2 5.939 A
C-A 185 46 185
A-B 39 10 39
A-C 189 47 189
StreamTotal
Demand (Veh/hr)
Junction Arrivals
(Veh)
Capacity (Veh/hr)
RFCThroughput
(Veh/hr)Start queue
(Veh)End queue
(Veh)Delay (s) LOS
B-C 35 9 629 0.056 35 0.1 0.1 6.064 A
B-A 27 7 428 0.063 27 0.1 0.1 8.991 A
Page 16 of 35
17/08/2021file:///C:/Files%20-%20Simon/BTP%20Projects/BTP-2128%20-%20WCM%20White...

18:00 - 18:15
C-AB 74 18 685 0.108 74 0.2 0.2 5.896 A
C-A 156 39 156
A-B 31 8 31
A-C 155 39 155
StreamTotal
Demand (Veh/hr)
Junction Arrivals
(Veh)
Capacity (Veh/hr)
RFCThroughput
(Veh/hr)Start queue
(Veh)End queue
(Veh)Delay (s) LOS
B-C 29 7 638 0.046 29 0.1 0.0 5.912 A
B-A 23 6 441 0.051 23 0.1 0.1 8.600 A
C-AB 59 15 672 0.088 59 0.2 0.1 5.875 A
C-A 134 33 134
A-B 26 7 26
A-C 129 32 129
Page 17 of 35
17/08/2021file:///C:/Files%20-%20Simon/BTP%20Projects/BTP-2128%20-%20WCM%20White...

Existing Layout - 2025 Operation, AM2
Data Errors and WarningsNo errors or warnings
Junction Network
Junctions
Junction Network Options
Traffic Demand
Demand Set Details
Demand overview (Traffic)
Origin-Destination Data
Vehicle Mix
Results
Junction Name Junction Type Major road direction Junction Delay (s) Junction LOS
1 Junction T-Junction Two-way 1.89 A
Driving side Lighting Network residual capacity (%) First arm reaching threshold
Left Normal/unknown 208 Stream B-A
IDScenario
nameTime Period
nameTraffic profile
typeStart time (HH:mm)
Finish time (HH:mm)
Time segment length (min)
Run automatically
D6 2025 Operation AM2 ONE HOUR 07:45 09:15 15 �
Vehicle mix varies over turn Vehicle mix varies over entry Vehicle mix source PCU Factor for a HV (PCU)
� � HV Percentages 2.00
Arm Linked arm Profile type Use O-D data Average Demand (Veh/hr) Scaling Factor (%)
A - Wilson Pit Rd east ONE HOUR � 231 100.000
B - High Rd south ONE HOUR � 79 100.000
C - High Rd west ONE HOUR � 172 100.000
Demand (Veh/hr)
To
From
A - Wilson Pit Rd east B - High Rd south C - High Rd west
A - Wilson Pit Rd east 0 35 196
B - High Rd south 34 0 45
C - High Rd west 135 37 0
Heavy Vehicle Percentages
To
From
A - Wilson Pit Rd east B - High Rd south C - High Rd west
A - Wilson Pit Rd east 0 0 0
B - High Rd south 0 0 2
C - High Rd west 0 3 0
Page 18 of 35
17/08/2021file:///C:/Files%20-%20Simon/BTP%20Projects/BTP-2128%20-%20WCM%20White...

Results Summary for whole modelled period
Main Results for each time segment
07:45 - 08:00
08:00 - 08:15
08:15 - 08:30
08:30 - 08:45
08:45 - 09:00
Stream Max RFC Max delay (s) Max Queue (Veh) Max LOSAverage Demand
(Veh/hr)Total Junction Arrivals (Veh)
B-C 0.08 6.56 0.1 A 41 62
B-A 0.09 9.41 0.1 A 31 47
C-AB 0.08 6.16 0.1 A 43 64
C-A 115 173
A-B 32 48
A-C 180 270
StreamTotal
Demand (Veh/hr)
Junction Arrivals
(Veh)
Capacity (Veh/hr)
RFCThroughput
(Veh/hr)Start queue
(Veh)End queue
(Veh)Delay (s) LOS
B-C 34 8 623 0.054 34 0.0 0.1 6.112 A
B-A 26 6 449 0.057 25 0.0 0.1 8.500 A
C-AB 33 8 623 0.053 33 0.0 0.1 6.105 A
C-A 96 24 96
A-B 26 7 26
A-C 148 37 148
StreamTotal
Demand (Veh/hr)
Junction Arrivals
(Veh)
Capacity (Veh/hr)
RFCThroughput
(Veh/hr)Start queue
(Veh)End queue
(Veh)Delay (s) LOS
B-C 40 10 612 0.066 40 0.1 0.1 6.293 A
B-A 31 8 437 0.070 31 0.1 0.1 8.864 A
C-AB 41 10 629 0.066 41 0.1 0.1 6.127 A
C-A 113 28 113
A-B 31 8 31
A-C 176 44 176
StreamTotal
Demand (Veh/hr)
Junction Arrivals
(Veh)
Capacity (Veh/hr)
RFCThroughput
(Veh/hr)Start queue
(Veh)End queue
(Veh)Delay (s) LOS
B-C 50 12 598 0.083 49 0.1 0.1 6.558 A
B-A 37 9 420 0.089 37 0.1 0.1 9.409 A
C-AB 53 13 638 0.083 53 0.1 0.1 6.156 A
C-A 136 34 136
A-B 39 10 39
A-C 216 54 216
StreamTotal
Demand (Veh/hr)
Junction Arrivals
(Veh)
Capacity (Veh/hr)
RFCThroughput
(Veh/hr)Start queue
(Veh)End queue
(Veh)Delay (s) LOS
B-C 50 12 598 0.083 50 0.1 0.1 6.559 A
B-A 37 9 420 0.089 37 0.1 0.1 9.413 A
C-AB 53 13 638 0.083 53 0.1 0.1 6.153 A
C-A 136 34 136
A-B 39 10 39
A-C 216 54 216
StreamTotal
Demand (Veh/hr)
Junction Arrivals
(Veh)
Capacity (Veh/hr)
RFCThroughput
(Veh/hr)Start queue
(Veh)End queue
(Veh)Delay (s) LOS
B-C 40 10 612 0.066 41 0.1 0.1 6.296 A
B-A 31 8 437 0.070 31 0.1 0.1 8.871 A
Page 19 of 35
17/08/2021file:///C:/Files%20-%20Simon/BTP%20Projects/BTP-2128%20-%20WCM%20White...

09:00 - 09:15
C-AB 41 10 629 0.066 41 0.1 0.1 6.124 A
C-A 113 28 113
A-B 31 8 31
A-C 176 44 176
StreamTotal
Demand (Veh/hr)
Junction Arrivals
(Veh)
Capacity (Veh/hr)
RFCThroughput
(Veh/hr)Start queue
(Veh)End queue
(Veh)Delay (s) LOS
B-C 34 8 622 0.054 34 0.1 0.1 6.120 A
B-A 26 6 449 0.057 26 0.1 0.1 8.512 A
C-AB 33 8 623 0.054 33 0.1 0.1 6.107 A
C-A 96 24 96
A-B 26 7 26
A-C 148 37 148
Page 20 of 35
17/08/2021file:///C:/Files%20-%20Simon/BTP%20Projects/BTP-2128%20-%20WCM%20White...

Existing Layout - 2025 Operation, PM
Data Errors and Warnings
Junction Network
Junctions
Junction Network Options
Traffic Demand
Demand Set Details
Demand overview (Traffic)
Origin-Destination Data
Vehicle Mix
Severity Area Item Description
Warning Vehicle MixHV% is zero for all movements / time segments. Vehicle Mix matrix should be completed whether working in PCUs or Vehs.
Junction Name Junction Type Major road direction Junction Delay (s) Junction LOS
1 Junction T-Junction Two-way 2.02 A
Driving side Lighting Network residual capacity (%) First arm reaching threshold
Left Normal/unknown 207 Stream B-A
IDScenario
nameTime Period
nameTraffic profile
typeStart time (HH:mm)
Finish time (HH:mm)
Time segment length (min)
Run automatically
D7 2025 Operation PM ONE HOUR 16:45 18:15 15 �
Vehicle mix varies over turn Vehicle mix varies over entry Vehicle mix source PCU Factor for a HV (PCU)
� � HV Percentages 2.00
Arm Linked arm Profile type Use O-D data Average Demand (Veh/hr) Scaling Factor (%)
A - Wilson Pit Rd east ONE HOUR � 206 100.000
B - High Rd south ONE HOUR � 69 100.000
C - High Rd west ONE HOUR � 226 100.000
Demand (Veh/hr)
To
From
A - Wilson Pit Rd east B - High Rd south C - High Rd west
A - Wilson Pit Rd east 0 35 171
B - High Rd south 30 0 39
C - High Rd west 165 61 0
Heavy Vehicle Percentages
To
From
A - Wilson Pit Rd east B - High Rd south C - High Rd west
A - Wilson Pit Rd east 0 0 0
B - High Rd south 0 0 0
C - High Rd west 0 0 0
Page 21 of 35
17/08/2021file:///C:/Files%20-%20Simon/BTP%20Projects/BTP-2128%20-%20WCM%20White...
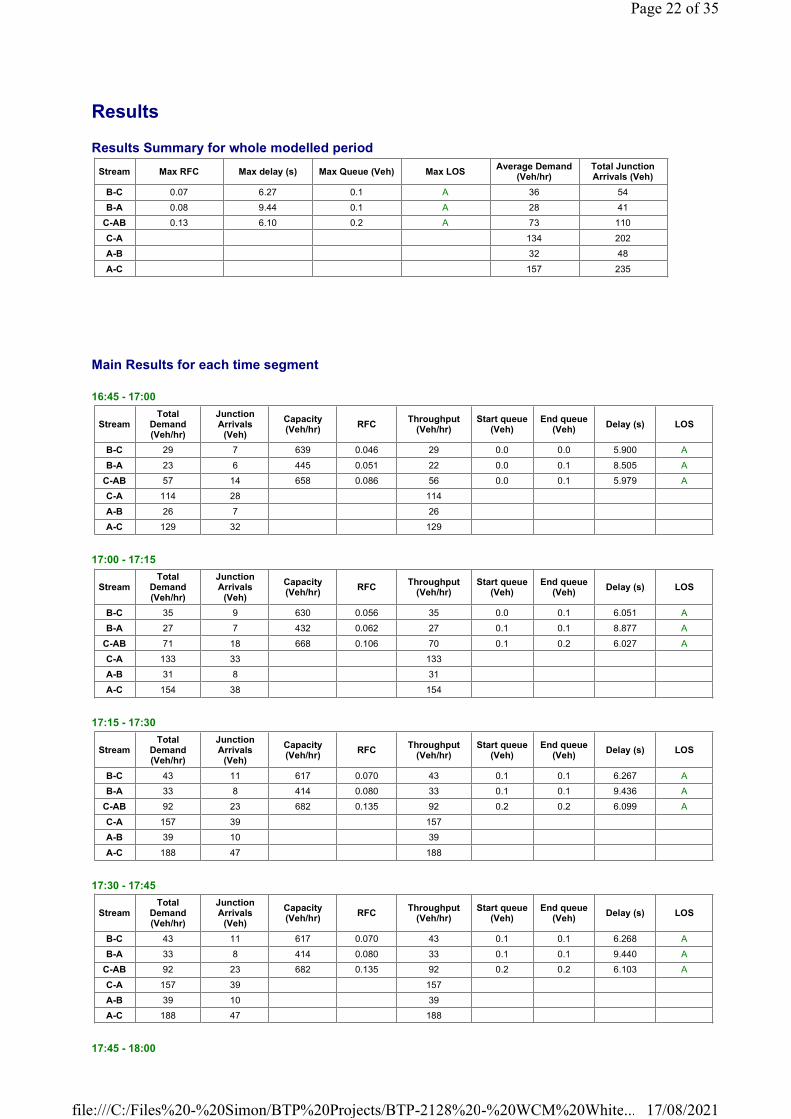
Results
Results Summary for whole modelled period
Main Results for each time segment
16:45 - 17:00
17:00 - 17:15
17:15 - 17:30
17:30 - 17:45
17:45 - 18:00
Stream Max RFC Max delay (s) Max Queue (Veh) Max LOSAverage Demand
(Veh/hr)Total Junction Arrivals (Veh)
B-C 0.07 6.27 0.1 A 36 54
B-A 0.08 9.44 0.1 A 28 41
C-AB 0.13 6.10 0.2 A 73 110
C-A 134 202
A-B 32 48
A-C 157 235
StreamTotal
Demand (Veh/hr)
Junction Arrivals
(Veh)
Capacity (Veh/hr)
RFCThroughput
(Veh/hr)Start queue
(Veh)End queue
(Veh)Delay (s) LOS
B-C 29 7 639 0.046 29 0.0 0.0 5.900 A
B-A 23 6 445 0.051 22 0.0 0.1 8.505 A
C-AB 57 14 658 0.086 56 0.0 0.1 5.979 A
C-A 114 28 114
A-B 26 7 26
A-C 129 32 129
StreamTotal
Demand (Veh/hr)
Junction Arrivals
(Veh)
Capacity (Veh/hr)
RFCThroughput
(Veh/hr)Start queue
(Veh)End queue
(Veh)Delay (s) LOS
B-C 35 9 630 0.056 35 0.0 0.1 6.051 A
B-A 27 7 432 0.062 27 0.1 0.1 8.877 A
C-AB 71 18 668 0.106 70 0.1 0.2 6.027 A
C-A 133 33 133
A-B 31 8 31
A-C 154 38 154
StreamTotal
Demand (Veh/hr)
Junction Arrivals
(Veh)
Capacity (Veh/hr)
RFCThroughput
(Veh/hr)Start queue
(Veh)End queue
(Veh)Delay (s) LOS
B-C 43 11 617 0.070 43 0.1 0.1 6.267 A
B-A 33 8 414 0.080 33 0.1 0.1 9.436 A
C-AB 92 23 682 0.135 92 0.2 0.2 6.099 A
C-A 157 39 157
A-B 39 10 39
A-C 188 47 188
StreamTotal
Demand (Veh/hr)
Junction Arrivals
(Veh)
Capacity (Veh/hr)
RFCThroughput
(Veh/hr)Start queue
(Veh)End queue
(Veh)Delay (s) LOS
B-C 43 11 617 0.070 43 0.1 0.1 6.268 A
B-A 33 8 414 0.080 33 0.1 0.1 9.440 A
C-AB 92 23 682 0.135 92 0.2 0.2 6.103 A
C-A 157 39 157
A-B 39 10 39
A-C 188 47 188
Page 22 of 35
17/08/2021file:///C:/Files%20-%20Simon/BTP%20Projects/BTP-2128%20-%20WCM%20White...

18:00 - 18:15
StreamTotal
Demand (Veh/hr)
Junction Arrivals
(Veh)
Capacity (Veh/hr)
RFCThroughput
(Veh/hr)Start queue
(Veh)End queue
(Veh)Delay (s) LOS
B-C 35 9 630 0.056 35 0.1 0.1 6.056 A
B-A 27 7 432 0.062 27 0.1 0.1 8.885 A
C-AB 71 18 668 0.106 71 0.2 0.2 6.036 A
C-A 132 33 132
A-B 31 8 31
A-C 154 38 154
StreamTotal
Demand (Veh/hr)
Junction Arrivals
(Veh)
Capacity (Veh/hr)
RFCThroughput
(Veh/hr)Start queue
(Veh)End queue
(Veh)Delay (s) LOS
B-C 29 7 639 0.046 29 0.1 0.0 5.906 A
B-A 23 6 445 0.051 23 0.1 0.1 8.516 A
C-AB 57 14 658 0.086 57 0.2 0.1 5.991 A
C-A 113 28 113
A-B 26 7 26
A-C 129 32 129
Page 23 of 35
17/08/2021file:///C:/Files%20-%20Simon/BTP%20Projects/BTP-2128%20-%20WCM%20White...

Existing Layout - 2035 Core, AM2
Data Errors and WarningsNo errors or warnings
Junction Network
Junctions
Junction Network Options
Traffic Demand
Demand Set Details
Demand overview (Traffic)
Origin-Destination Data
Vehicle Mix
Results
Junction Name Junction Type Major road direction Junction Delay (s) Junction LOS
1 Junction T-Junction Two-way 1.69 A
Driving side Lighting Network residual capacity (%) First arm reaching threshold
Left Normal/unknown 136 Stream B-A
IDScenario
nameTime Period
nameTraffic profile
typeStart time (HH:mm)
Finish time (HH:mm)
Time segment length (min)
Run automatically
D8 2035 Core AM2 ONE HOUR 07:45 09:15 15 �
Vehicle mix varies over turn Vehicle mix varies over entry Vehicle mix source PCU Factor for a HV (PCU)
� � HV Percentages 2.00
Arm Linked arm Profile type Use O-D data Average Demand (Veh/hr) Scaling Factor (%)
A - Wilson Pit Rd east ONE HOUR � 362 100.000
B - High Rd south ONE HOUR � 85 100.000
C - High Rd west ONE HOUR � 199 100.000
Demand (Veh/hr)
To
From
A - Wilson Pit Rd east B - High Rd south C - High Rd west
A - Wilson Pit Rd east 0 39 323
B - High Rd south 36 0 49
C - High Rd west 157 42 0
Heavy Vehicle Percentages
To
From
A - Wilson Pit Rd east B - High Rd south C - High Rd west
A - Wilson Pit Rd east 0 0 0
B - High Rd south 0 0 2
C - High Rd west 0 2 0
Page 24 of 35
17/08/2021file:///C:/Files%20-%20Simon/BTP%20Projects/BTP-2128%20-%20WCM%20White...

Results Summary for whole modelled period
Main Results for each time segment
07:45 - 08:00
08:00 - 08:15
08:15 - 08:30
08:30 - 08:45
08:45 - 09:00
Stream Max RFC Max delay (s) Max Queue (Veh) Max LOSAverage Demand
(Veh/hr)Total Junction Arrivals (Veh)
B-C 0.10 7.10 0.1 A 45 67
B-A 0.10 10.57 0.1 B 33 50
C-AB 0.10 6.36 0.2 A 51 76
C-A 132 198
A-B 36 54
A-C 296 445
StreamTotal
Demand (Veh/hr)
Junction Arrivals
(Veh)
Capacity (Veh/hr)
RFCThroughput
(Veh/hr)Start queue
(Veh)End queue
(Veh)Delay (s) LOS
B-C 37 9 598 0.062 37 0.0 0.1 6.411 A
B-A 27 7 421 0.064 27 0.0 0.1 9.122 A
C-AB 39 10 618 0.063 39 0.0 0.1 6.214 A
C-A 111 28 111
A-B 29 7 29
A-C 243 61 243
StreamTotal
Demand (Veh/hr)
Junction Arrivals
(Veh)
Capacity (Veh/hr)
RFCThroughput
(Veh/hr)Start queue
(Veh)End queue
(Veh)Delay (s) LOS
B-C 44 11 582 0.076 44 0.1 0.1 6.685 A
B-A 32 8 404 0.080 32 0.1 0.1 9.680 A
C-AB 49 12 623 0.079 49 0.1 0.1 6.275 A
C-A 130 32 130
A-B 35 9 35
A-C 290 73 290
StreamTotal
Demand (Veh/hr)
Junction Arrivals
(Veh)
Capacity (Veh/hr)
RFCThroughput
(Veh/hr)Start queue
(Veh)End queue
(Veh)Delay (s) LOS
B-C 54 13 561 0.096 54 0.1 0.1 7.095 A
B-A 40 10 380 0.104 40 0.1 0.1 10.564 B
C-AB 64 16 630 0.101 64 0.1 0.2 6.364 A
C-A 155 39 155
A-B 43 11 43
A-C 356 89 356
StreamTotal
Demand (Veh/hr)
Junction Arrivals
(Veh)
Capacity (Veh/hr)
RFCThroughput
(Veh/hr)Start queue
(Veh)End queue
(Veh)Delay (s) LOS
B-C 54 13 561 0.096 54 0.1 0.1 7.099 A
B-A 40 10 380 0.104 40 0.1 0.1 10.570 B
C-AB 64 16 630 0.101 64 0.2 0.2 6.362 A
C-A 155 39 155
A-B 43 11 43
A-C 356 89 356
StreamTotal
Demand (Veh/hr)
Junction Arrivals
(Veh)
Capacity (Veh/hr)
RFCThroughput
(Veh/hr)Start queue
(Veh)End queue
(Veh)Delay (s) LOS
B-C 44 11 582 0.076 44 0.1 0.1 6.692 A
B-A 32 8 404 0.080 32 0.1 0.1 9.691 A
Page 25 of 35
17/08/2021file:///C:/Files%20-%20Simon/BTP%20Projects/BTP-2128%20-%20WCM%20White...

09:00 - 09:15
C-AB 49 12 623 0.079 49 0.2 0.1 6.275 A
C-A 130 32 130
A-B 35 9 35
A-C 290 73 290
StreamTotal
Demand (Veh/hr)
Junction Arrivals
(Veh)
Capacity (Veh/hr)
RFCThroughput
(Veh/hr)Start queue
(Veh)End queue
(Veh)Delay (s) LOS
B-C 37 9 598 0.062 37 0.1 0.1 6.421 A
B-A 27 7 421 0.064 27 0.1 0.1 9.136 A
C-AB 39 10 618 0.063 39 0.1 0.1 6.223 A
C-A 111 28 111
A-B 29 7 29
A-C 243 61 243
Page 26 of 35
17/08/2021file:///C:/Files%20-%20Simon/BTP%20Projects/BTP-2128%20-%20WCM%20White...

Existing Layout - 2035 Core, PM
Data Errors and Warnings
Junction Network
Junctions
Junction Network Options
Traffic Demand
Demand Set Details
Demand overview (Traffic)
Origin-Destination Data
Vehicle Mix
Severity Area Item Description
Warning Vehicle MixHV% is zero for all movements / time segments. Vehicle Mix matrix should be completed whether working in PCUs or Vehs.
Junction Name Junction Type Major road direction Junction Delay (s) Junction LOS
1 Junction T-Junction Two-way 1.60 A
Driving side Lighting Network residual capacity (%) First arm reaching threshold
Left Normal/unknown 139 Stream B-A
IDScenario
nameTime Period
nameTraffic profile
typeStart time (HH:mm)
Finish time (HH:mm)
Time segment length (min)
Run automatically
D9 2035 Core PM ONE HOUR 16:45 18:15 15 �
Vehicle mix varies over turn Vehicle mix varies over entry Vehicle mix source PCU Factor for a HV (PCU)
� � HV Percentages 2.00
Arm Linked arm Profile type Use O-D data Average Demand (Veh/hr) Scaling Factor (%)
A - Wilson Pit Rd east ONE HOUR � 291 100.000
B - High Rd south ONE HOUR � 77 100.000
C - High Rd west ONE HOUR � 328 100.000
Demand (Veh/hr)
To
From
A - Wilson Pit Rd east B - High Rd south C - High Rd west
A - Wilson Pit Rd east 0 48 243
B - High Rd south 32 0 45
C - High Rd west 273 55 0
Heavy Vehicle Percentages
To
From
A - Wilson Pit Rd east B - High Rd south C - High Rd west
A - Wilson Pit Rd east 0 0 0
B - High Rd south 0 0 0
C - High Rd west 0 0 0
Page 27 of 35
17/08/2021file:///C:/Files%20-%20Simon/BTP%20Projects/BTP-2128%20-%20WCM%20White...
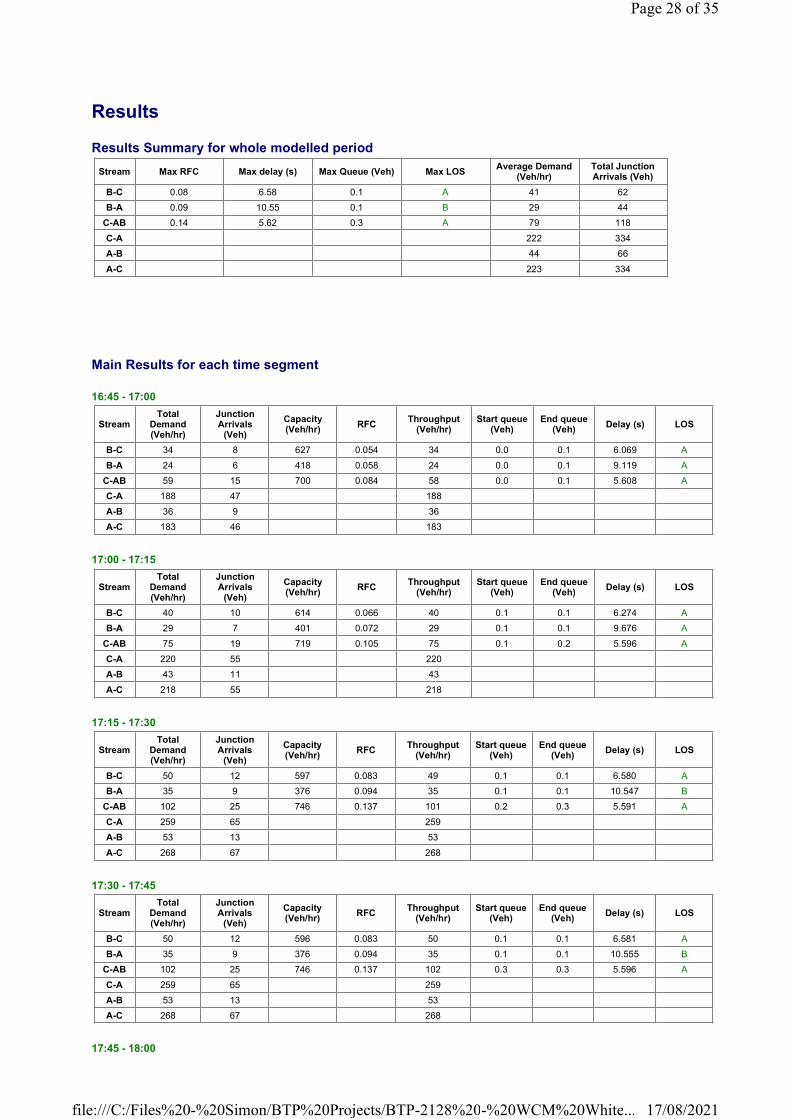
Results
Results Summary for whole modelled period
Main Results for each time segment
16:45 - 17:00
17:00 - 17:15
17:15 - 17:30
17:30 - 17:45
17:45 - 18:00
Stream Max RFC Max delay (s) Max Queue (Veh) Max LOSAverage Demand
(Veh/hr)Total Junction Arrivals (Veh)
B-C 0.08 6.58 0.1 A 41 62
B-A 0.09 10.55 0.1 B 29 44
C-AB 0.14 5.62 0.3 A 79 118
C-A 222 334
A-B 44 66
A-C 223 334
StreamTotal
Demand (Veh/hr)
Junction Arrivals
(Veh)
Capacity (Veh/hr)
RFCThroughput
(Veh/hr)Start queue
(Veh)End queue
(Veh)Delay (s) LOS
B-C 34 8 627 0.054 34 0.0 0.1 6.069 A
B-A 24 6 418 0.058 24 0.0 0.1 9.119 A
C-AB 59 15 700 0.084 58 0.0 0.1 5.608 A
C-A 188 47 188
A-B 36 9 36
A-C 183 46 183
StreamTotal
Demand (Veh/hr)
Junction Arrivals
(Veh)
Capacity (Veh/hr)
RFCThroughput
(Veh/hr)Start queue
(Veh)End queue
(Veh)Delay (s) LOS
B-C 40 10 614 0.066 40 0.1 0.1 6.274 A
B-A 29 7 401 0.072 29 0.1 0.1 9.676 A
C-AB 75 19 719 0.105 75 0.1 0.2 5.596 A
C-A 220 55 220
A-B 43 11 43
A-C 218 55 218
StreamTotal
Demand (Veh/hr)
Junction Arrivals
(Veh)
Capacity (Veh/hr)
RFCThroughput
(Veh/hr)Start queue
(Veh)End queue
(Veh)Delay (s) LOS
B-C 50 12 597 0.083 49 0.1 0.1 6.580 A
B-A 35 9 376 0.094 35 0.1 0.1 10.547 B
C-AB 102 25 746 0.137 101 0.2 0.3 5.591 A
C-A 259 65 259
A-B 53 13 53
A-C 268 67 268
StreamTotal
Demand (Veh/hr)
Junction Arrivals
(Veh)
Capacity (Veh/hr)
RFCThroughput
(Veh/hr)Start queue
(Veh)End queue
(Veh)Delay (s) LOS
B-C 50 12 596 0.083 50 0.1 0.1 6.581 A
B-A 35 9 376 0.094 35 0.1 0.1 10.555 B
C-AB 102 25 746 0.137 102 0.3 0.3 5.596 A
C-A 259 65 259
A-B 53 13 53
A-C 268 67 268
Page 28 of 35
17/08/2021file:///C:/Files%20-%20Simon/BTP%20Projects/BTP-2128%20-%20WCM%20White...

18:00 - 18:15
StreamTotal
Demand (Veh/hr)
Junction Arrivals
(Veh)
Capacity (Veh/hr)
RFCThroughput
(Veh/hr)Start queue
(Veh)End queue
(Veh)Delay (s) LOS
B-C 40 10 614 0.066 41 0.1 0.1 6.281 A
B-A 29 7 401 0.072 29 0.1 0.1 9.684 A
C-AB 75 19 719 0.105 76 0.3 0.2 5.604 A
C-A 219 55 219
A-B 43 11 43
A-C 218 55 218
StreamTotal
Demand (Veh/hr)
Junction Arrivals
(Veh)
Capacity (Veh/hr)
RFCThroughput
(Veh/hr)Start queue
(Veh)End queue
(Veh)Delay (s) LOS
B-C 34 8 626 0.054 34 0.1 0.1 6.078 A
B-A 24 6 418 0.058 24 0.1 0.1 9.135 A
C-AB 59 15 700 0.084 59 0.2 0.1 5.619 A
C-A 188 47 188
A-B 36 9 36
A-C 183 46 183
Page 29 of 35
17/08/2021file:///C:/Files%20-%20Simon/BTP%20Projects/BTP-2128%20-%20WCM%20White...

Existing Layout - 2035 Operation, AM2
Data Errors and WarningsNo errors or warnings
Junction Network
Junctions
Junction Network Options
Traffic Demand
Demand Set Details
Demand overview (Traffic)
Origin-Destination Data
Vehicle Mix
Results
Junction Name Junction Type Major road direction Junction Delay (s) Junction LOS
1 Junction T-Junction Two-way 1.62 A
Driving side Lighting Network residual capacity (%) First arm reaching threshold
Left Normal/unknown 126 Stream B-A
IDScenario
nameTime Period
nameTraffic profile
typeStart time (HH:mm)
Finish time (HH:mm)
Time segment length (min)
Run automatically
D10 2035 Operation AM2 ONE HOUR 07:45 09:15 15 �
Vehicle mix varies over turn Vehicle mix varies over entry Vehicle mix source PCU Factor for a HV (PCU)
� � HV Percentages 2.00
Arm Linked arm Profile type Use O-D data Average Demand (Veh/hr) Scaling Factor (%)
A - Wilson Pit Rd east ONE HOUR � 397 100.000
B - High Rd south ONE HOUR � 85 100.000
C - High Rd west ONE HOUR � 196 100.000
Demand (Veh/hr)
To
From
A - Wilson Pit Rd east B - High Rd south C - High Rd west
A - Wilson Pit Rd east 0 42 355
B - High Rd south 36 0 49
C - High Rd west 156 40 0
Heavy Vehicle Percentages
To
From
A - Wilson Pit Rd east B - High Rd south C - High Rd west
A - Wilson Pit Rd east 0 0 0
B - High Rd south 0 0 2
C - High Rd west 0 3 0
Page 30 of 35
17/08/2021file:///C:/Files%20-%20Simon/BTP%20Projects/BTP-2128%20-%20WCM%20White...

Results Summary for whole modelled period
Main Results for each time segment
07:45 - 08:00
08:00 - 08:15
08:15 - 08:30
08:30 - 08:45
08:45 - 09:00
Stream Max RFC Max delay (s) Max Queue (Veh) Max LOSAverage Demand
(Veh/hr)Total Junction Arrivals (Veh)
B-C 0.10 7.24 0.1 A 45 67
B-A 0.11 10.82 0.1 B 33 50
C-AB 0.10 6.49 0.2 A 48 73
C-A 131 197
A-B 39 58
A-C 326 489
StreamTotal
Demand (Veh/hr)
Junction Arrivals
(Veh)
Capacity (Veh/hr)
RFCThroughput
(Veh/hr)Start queue
(Veh)End queue
(Veh)Delay (s) LOS
B-C 37 9 591 0.062 37 0.0 0.1 6.486 A
B-A 27 7 416 0.065 27 0.0 0.1 9.246 A
C-AB 37 9 607 0.062 37 0.0 0.1 6.315 A
C-A 110 28 110
A-B 32 8 32
A-C 267 67 267
StreamTotal
Demand (Veh/hr)
Junction Arrivals
(Veh)
Capacity (Veh/hr)
RFCThroughput
(Veh/hr)Start queue
(Veh)End queue
(Veh)Delay (s) LOS
B-C 44 11 575 0.077 44 0.1 0.1 6.784 A
B-A 32 8 398 0.081 32 0.1 0.1 9.850 A
C-AB 47 12 611 0.077 47 0.1 0.1 6.385 A
C-A 129 32 129
A-B 38 9 38
A-C 319 80 319
StreamTotal
Demand (Veh/hr)
Junction Arrivals
(Veh)
Capacity (Veh/hr)
RFCThroughput
(Veh/hr)Start queue
(Veh)End queue
(Veh)Delay (s) LOS
B-C 54 13 551 0.098 54 0.1 0.1 7.232 A
B-A 40 10 372 0.106 40 0.1 0.1 10.812 B
C-AB 61 15 617 0.099 61 0.1 0.2 6.486 A
C-A 155 39 155
A-B 46 12 46
A-C 391 98 391
StreamTotal
Demand (Veh/hr)
Junction Arrivals
(Veh)
Capacity (Veh/hr)
RFCThroughput
(Veh/hr)Start queue
(Veh)End queue
(Veh)Delay (s) LOS
B-C 54 13 551 0.098 54 0.1 0.1 7.237 A
B-A 40 10 372 0.106 40 0.1 0.1 10.818 B
C-AB 61 15 617 0.099 61 0.2 0.2 6.483 A
C-A 155 39 155
A-B 46 12 46
A-C 391 98 391
StreamTotal
Demand (Veh/hr)
Junction Arrivals
(Veh)
Capacity (Veh/hr)
RFCThroughput
(Veh/hr)Start queue
(Veh)End queue
(Veh)Delay (s) LOS
B-C 44 11 574 0.077 44 0.1 0.1 6.791 A
B-A 32 8 398 0.081 32 0.1 0.1 9.862 A
Page 31 of 35
17/08/2021file:///C:/Files%20-%20Simon/BTP%20Projects/BTP-2128%20-%20WCM%20White...

09:00 - 09:15
C-AB 47 12 611 0.077 47 0.2 0.1 6.382 A
C-A 129 32 129
A-B 38 9 38
A-C 319 80 319
StreamTotal
Demand (Veh/hr)
Junction Arrivals
(Veh)
Capacity (Veh/hr)
RFCThroughput
(Veh/hr)Start queue
(Veh)End queue
(Veh)Delay (s) LOS
B-C 37 9 591 0.062 37 0.1 0.1 6.499 A
B-A 27 7 416 0.065 27 0.1 0.1 9.262 A
C-AB 37 9 607 0.062 38 0.1 0.1 6.320 A
C-A 110 28 110
A-B 32 8 32
A-C 267 67 267
Page 32 of 35
17/08/2021file:///C:/Files%20-%20Simon/BTP%20Projects/BTP-2128%20-%20WCM%20White...
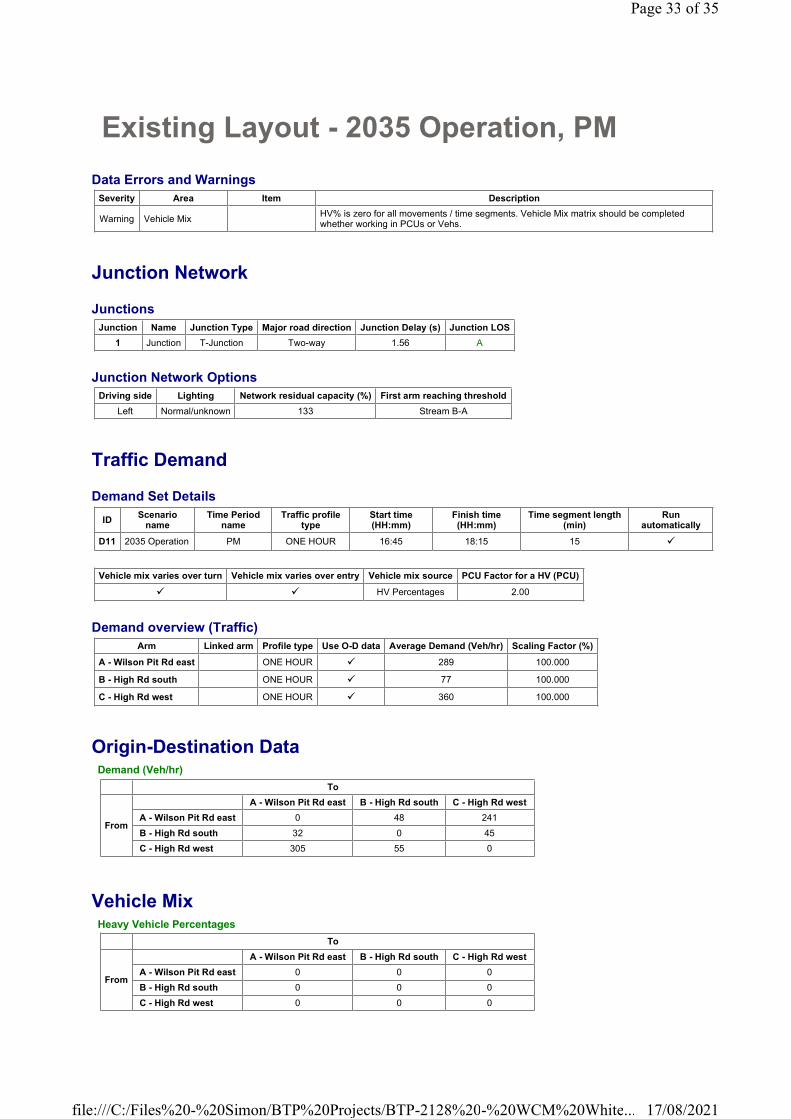
Existing Layout - 2035 Operation, PM
Data Errors and Warnings
Junction Network
Junctions
Junction Network Options
Traffic Demand
Demand Set Details
Demand overview (Traffic)
Origin-Destination Data
Vehicle Mix
Severity Area Item Description
Warning Vehicle MixHV% is zero for all movements / time segments. Vehicle Mix matrix should be completed whether working in PCUs or Vehs.
Junction Name Junction Type Major road direction Junction Delay (s) Junction LOS
1 Junction T-Junction Two-way 1.56 A
Driving side Lighting Network residual capacity (%) First arm reaching threshold
Left Normal/unknown 133 Stream B-A
IDScenario
nameTime Period
nameTraffic profile
typeStart time (HH:mm)
Finish time (HH:mm)
Time segment length (min)
Run automatically
D11 2035 Operation PM ONE HOUR 16:45 18:15 15 �
Vehicle mix varies over turn Vehicle mix varies over entry Vehicle mix source PCU Factor for a HV (PCU)
� � HV Percentages 2.00
Arm Linked arm Profile type Use O-D data Average Demand (Veh/hr) Scaling Factor (%)
A - Wilson Pit Rd east ONE HOUR � 289 100.000
B - High Rd south ONE HOUR � 77 100.000
C - High Rd west ONE HOUR � 360 100.000
Demand (Veh/hr)
To
From
A - Wilson Pit Rd east B - High Rd south C - High Rd west
A - Wilson Pit Rd east 0 48 241
B - High Rd south 32 0 45
C - High Rd west 305 55 0
Heavy Vehicle Percentages
To
From
A - Wilson Pit Rd east B - High Rd south C - High Rd west
A - Wilson Pit Rd east 0 0 0
B - High Rd south 0 0 0
C - High Rd west 0 0 0
Page 33 of 35
17/08/2021file:///C:/Files%20-%20Simon/BTP%20Projects/BTP-2128%20-%20WCM%20White...

Results
Results Summary for whole modelled period
Main Results for each time segment
16:45 - 17:00
17:00 - 17:15
17:15 - 17:30
17:30 - 17:45
17:45 - 18:00
Stream Max RFC Max delay (s) Max Queue (Veh) Max LOSAverage Demand
(Veh/hr)Total Junction Arrivals (Veh)
B-C 0.08 6.58 0.1 A 41 62
B-A 0.09 10.70 0.1 B 29 44
C-AB 0.14 5.49 0.3 A 83 124
C-A 248 372
A-B 44 66
A-C 221 332
StreamTotal
Demand (Veh/hr)
Junction Arrivals
(Veh)
Capacity (Veh/hr)
RFCThroughput
(Veh/hr)Start queue
(Veh)End queue
(Veh)Delay (s) LOS
B-C 34 8 627 0.054 34 0.0 0.1 6.065 A
B-A 24 6 415 0.058 24 0.0 0.1 9.193 A
C-AB 61 15 717 0.085 60 0.0 0.1 5.483 A
C-A 210 53 210
A-B 36 9 36
A-C 181 45 181
StreamTotal
Demand (Veh/hr)
Junction Arrivals
(Veh)
Capacity (Veh/hr)
RFCThroughput
(Veh/hr)Start queue
(Veh)End queue
(Veh)Delay (s) LOS
B-C 40 10 614 0.066 40 0.1 0.1 6.271 A
B-A 29 7 397 0.072 29 0.1 0.1 9.776 A
C-AB 79 20 739 0.107 79 0.1 0.2 5.454 A
C-A 245 61 245
A-B 43 11 43
A-C 217 54 217
StreamTotal
Demand (Veh/hr)
Junction Arrivals
(Veh)
Capacity (Veh/hr)
RFCThroughput
(Veh/hr)Start queue
(Veh)End queue
(Veh)Delay (s) LOS
B-C 50 12 597 0.083 49 0.1 0.1 6.575 A
B-A 35 9 372 0.095 35 0.1 0.1 10.694 B
C-AB 108 27 771 0.140 107 0.2 0.3 5.431 A
C-A 289 72 289
A-B 53 13 53
A-C 265 66 265
StreamTotal
Demand (Veh/hr)
Junction Arrivals
(Veh)
Capacity (Veh/hr)
RFCThroughput
(Veh/hr)Start queue
(Veh)End queue
(Veh)Delay (s) LOS
B-C 50 12 597 0.083 50 0.1 0.1 6.577 A
B-A 35 9 372 0.095 35 0.1 0.1 10.702 B
C-AB 108 27 771 0.140 108 0.3 0.3 5.436 A
C-A 289 72 289
A-B 53 13 53
A-C 265 66 265
Page 34 of 35
17/08/2021file:///C:/Files%20-%20Simon/BTP%20Projects/BTP-2128%20-%20WCM%20White...

18:00 - 18:15
StreamTotal
Demand (Veh/hr)
Junction Arrivals
(Veh)
Capacity (Veh/hr)
RFCThroughput
(Veh/hr)Start queue
(Veh)End queue
(Veh)Delay (s) LOS
B-C 40 10 614 0.066 41 0.1 0.1 6.277 A
B-A 29 7 397 0.072 29 0.1 0.1 9.786 A
C-AB 79 20 739 0.107 79 0.3 0.2 5.462 A
C-A 245 61 245
A-B 43 11 43
A-C 217 54 217
StreamTotal
Demand (Veh/hr)
Junction Arrivals
(Veh)
Capacity (Veh/hr)
RFCThroughput
(Veh/hr)Start queue
(Veh)End queue
(Veh)Delay (s) LOS
B-C 34 8 627 0.054 34 0.1 0.1 6.073 A
B-A 24 6 415 0.058 24 0.1 0.1 9.208 A
C-AB 61 15 717 0.085 61 0.2 0.1 5.495 A
C-A 210 52 210
A-B 36 9 36
A-C 181 45 181
Page 35 of 35
17/08/2021file:///C:/Files%20-%20Simon/BTP%20Projects/BTP-2128%20-%20WCM%20White...
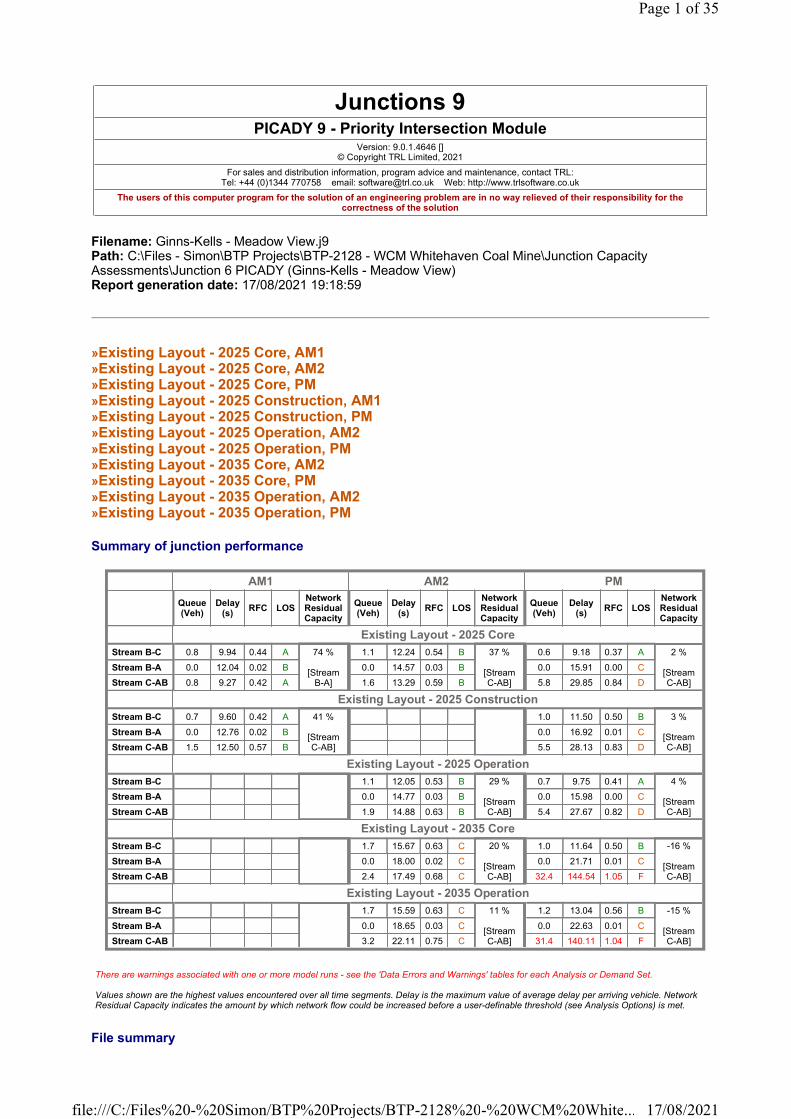
Filename: Ginns-Kells - Meadow View.j9Path: C:\Files - Simon\BTP Projects\BTP-2128 - WCM Whitehaven Coal Mine\Junction Capacity Assessments\Junction 6 PICADY (Ginns-Kells - Meadow View)Report generation date: 17/08/2021 19:18:59
»Existing Layout - 2025 Core, AM1»Existing Layout - 2025 Core, AM2»Existing Layout - 2025 Core, PM»Existing Layout - 2025 Construction, AM1»Existing Layout - 2025 Construction, PM»Existing Layout - 2025 Operation, AM2»Existing Layout - 2025 Operation, PM»Existing Layout - 2035 Core, AM2»Existing Layout - 2035 Core, PM»Existing Layout - 2035 Operation, AM2»Existing Layout - 2035 Operation, PM
Summary of junction performance
Junctions 9PICADY 9 - Priority Intersection Module
Version: 9.0.1.4646 [] © Copyright TRL Limited, 2021
For sales and distribution information, program advice and maintenance, contact TRL:Tel: +44 (0)1344 770758 email: [email protected] Web: http://www.trlsoftware.co.uk
The users of this computer program for the solution of an engineering problem are in no way relieved of their responsibility for the correctness of the solution
AM1 AM2 PM
Queue (Veh)
Delay (s)
RFC LOSNetwork Residual Capacity
Queue (Veh)
Delay (s)
RFC LOSNetwork Residual Capacity
Queue (Veh)
Delay (s)
RFC LOSNetwork Residual Capacity
Existing Layout - 2025 Core
Stream B-C 0.8 9.94 0.44 A 74 %
[Stream B-A]
1.1 12.24 0.54 B 37 %
[Stream C-AB]
0.6 9.18 0.37 A 2 %
[Stream C-AB]
Stream B-A 0.0 12.04 0.02 B 0.0 14.57 0.03 B 0.0 15.91 0.00 C
Stream C-AB 0.8 9.27 0.42 A 1.6 13.29 0.59 B 5.8 29.85 0.84 D
Existing Layout - 2025 Construction
Stream B-C 0.7 9.60 0.42 A 41 %
[Stream C-AB]
1.0 11.50 0.50 B 3 %
[Stream C-AB]
Stream B-A 0.0 12.76 0.02 B 0.0 16.92 0.01 C
Stream C-AB 1.5 12.50 0.57 B 5.5 28.13 0.83 D
Existing Layout - 2025 Operation
Stream B-C 1.1 12.05 0.53 B 29 %
[Stream C-AB]
0.7 9.75 0.41 A 4 %
[Stream C-AB]
Stream B-A 0.0 14.77 0.03 B 0.0 15.98 0.00 C
Stream C-AB 1.9 14.88 0.63 B 5.4 27.67 0.82 D
Existing Layout - 2035 Core
Stream B-C 1.7 15.67 0.63 C 20 %
[Stream C-AB]
1.0 11.64 0.50 B -16 %
[Stream C-AB]
Stream B-A 0.0 18.00 0.02 C 0.0 21.71 0.01 C
Stream C-AB 2.4 17.49 0.68 C 32.4 144.54 1.05 F
Existing Layout - 2035 Operation
Stream B-C 1.7 15.59 0.63 C 11 %
[Stream C-AB]
1.2 13.04 0.56 B -15 %
[Stream C-AB]
Stream B-A 0.0 18.65 0.03 C 0.0 22.63 0.01 C
Stream C-AB 3.2 22.11 0.75 C 31.4 140.11 1.04 F
There are warnings associated with one or more model runs - see the 'Data Errors and Warnings' tables for each Analysis or Demand Set.
Values shown are the highest values encountered over all time segments. Delay is the maximum value of average delay per arriving vehicle. Network Residual Capacity indicates the amount by which network flow could be increased before a user-definable threshold (see Analysis Options) is met.
File summary
Page 1 of 35
17/08/2021file:///C:/Files%20-%20Simon/BTP%20Projects/BTP-2128%20-%20WCM%20White...

Units
Analysis Options
Demand Set Summary
Analysis Set Details
File Description
Title Ginns-Kells / Meadow View Jcn
Location Whitehaven
Site number
Date 17/08/2021
Version
Status
Identifier
Client WCM
Jobnumber BTP-2128
Enumerator SJE
Description Re-run of previous AECOM model for updated WCTM flow data
Distance units
Speed units
Traffic units input
Traffic units results
Flow units
Average delay units
Total delay units
Rate of delay units
m kph Veh Veh perHour s -Min perMin
Vehicle length (m)
Calculate Queue Percentiles
Calculate detailed queueing delay
Calculate residual capacity
Residual capacity criteria
type
RFC Threshold
Average Delay threshold (s)
Queue threshold
(PCU)
5.75 � Delay 0.85 36.00 20.00
ID Scenario nameTime Period
nameTraffic profile
typeStart time (HH:mm)
Finish time (HH:mm)
Time segment length (min)
Run automatically
D1 2025 Core AM1 ONE HOUR 06:45 08:15 15 �
D2 2025 Core AM2 ONE HOUR 07:45 09:15 15 �
D3 2025 Core PM ONE HOUR 16:45 18:15 15 �
D4 2025 Construction AM1 ONE HOUR 06:45 08:15 15 �
D5 2025 Construction PM ONE HOUR 16:45 18:15 15 �
D6 2025 Operation AM2 ONE HOUR 07:45 09:15 15 �
D7 2025 Operation PM ONE HOUR 16:45 18:15 15 �
D8 2035 Core AM2 ONE HOUR 07:45 09:15 15 �
D9 2035 Core PM ONE HOUR 16:45 18:15 15 �
D10 2035 Operation AM2 ONE HOUR 07:45 09:15 15 �
D11 2035 Operation PM ONE HOUR 16:45 18:15 15 �
ID Name Include in report Network flow scaling factor (%) Network capacity scaling factor (%)
A1 Existing Layout � 100.000 100.000
Page 2 of 35
17/08/2021file:///C:/Files%20-%20Simon/BTP%20Projects/BTP-2128%20-%20WCM%20White...
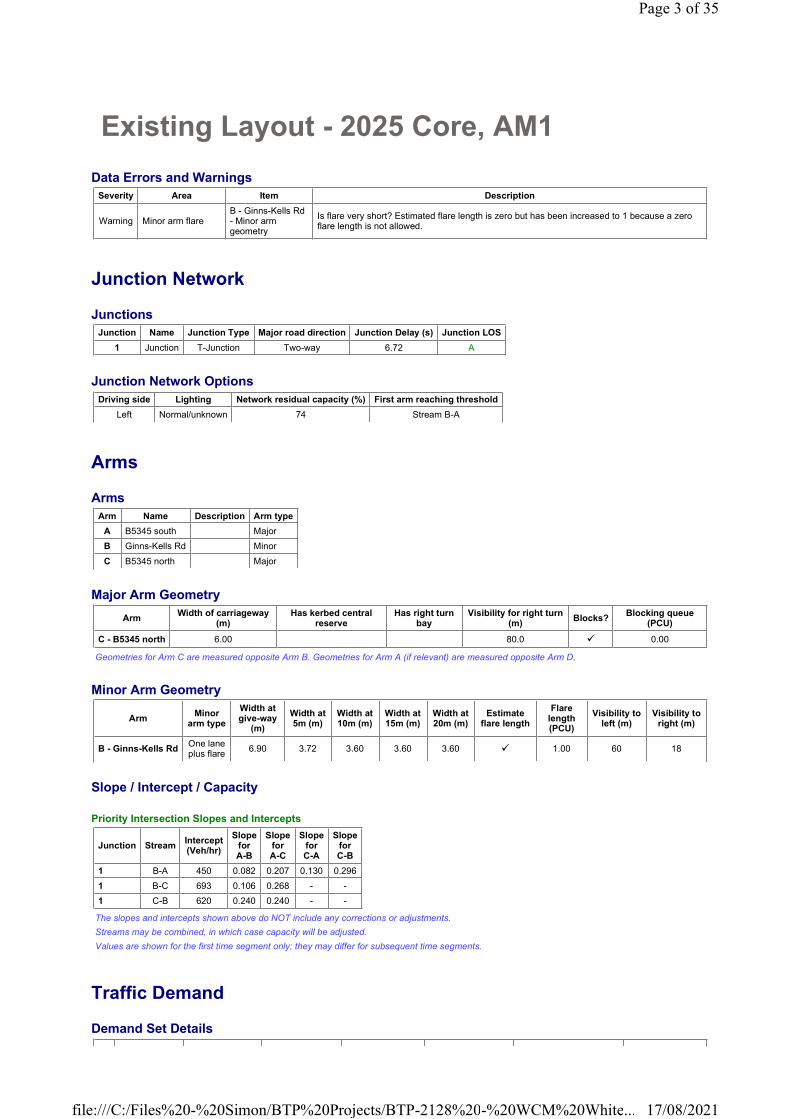
Existing Layout - 2025 Core, AM1
Data Errors and Warnings
Junction Network
Junctions
Junction Network Options
Arms
Arms
Major Arm Geometry
Geometries for Arm C are measured opposite Arm B. Geometries for Arm A (if relevant) are measured opposite Arm D.
Minor Arm Geometry
Slope / Intercept / Capacity
Priority Intersection Slopes and Intercepts
The slopes and intercepts shown above do NOT include any corrections or adjustments.
Streams may be combined, in which case capacity will be adjusted.
Values are shown for the first time segment only; they may differ for subsequent time segments.
Traffic Demand
Demand Set Details
Severity Area Item Description
Warning Minor arm flareB - Ginns-Kells Rd - Minor arm geometry
Is flare very short? Estimated flare length is zero but has been increased to 1 because a zero flare length is not allowed.
Junction Name Junction Type Major road direction Junction Delay (s) Junction LOS
1 Junction T-Junction Two-way 6.72 A
Driving side Lighting Network residual capacity (%) First arm reaching threshold
Left Normal/unknown 74 Stream B-A
Arm Name Description Arm type
A B5345 south Major
B Ginns-Kells Rd Minor
C B5345 north Major
ArmWidth of carriageway
(m)Has kerbed central
reserveHas right turn
bayVisibility for right turn
(m)Blocks?
Blocking queue (PCU)
C - B5345 north 6.00 80.0 � 0.00
ArmMinor
arm type
Width at give-way
(m)
Width at 5m (m)
Width at 10m (m)
Width at 15m (m)
Width at 20m (m)
Estimate flare length
Flare length (PCU)
Visibility to left (m)
Visibility to right (m)
B - Ginns-Kells RdOne lane plus flare
6.90 3.72 3.60 3.60 3.60 � 1.00 60 18
Junction StreamIntercept(Veh/hr)
SlopeforA-B
SlopeforA-C
SlopeforC-A
SlopeforC-B
1 B-A 450 0.082 0.207 0.130 0.296
1 B-C 693 0.106 0.268 - -
1 C-B 620 0.240 0.240 - -
Page 3 of 35
17/08/2021file:///C:/Files%20-%20Simon/BTP%20Projects/BTP-2128%20-%20WCM%20White...
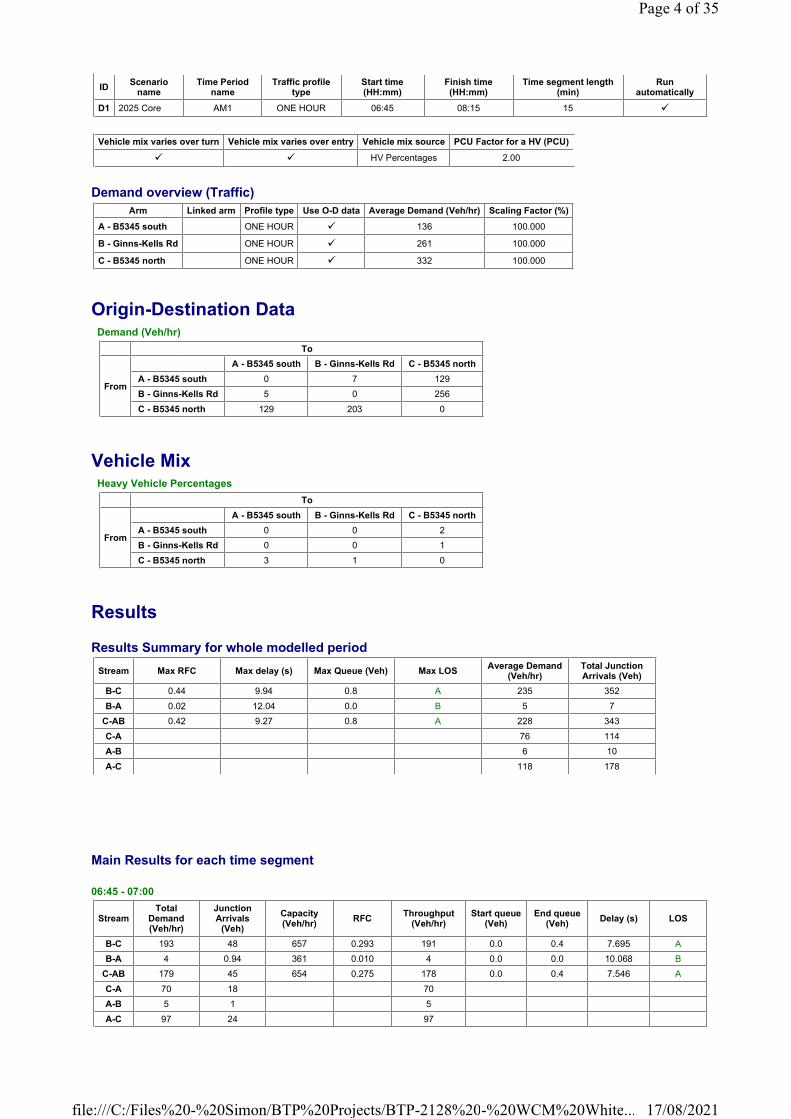
Demand overview (Traffic)
Origin-Destination Data
Vehicle Mix
Results
Results Summary for whole modelled period
Main Results for each time segment
06:45 - 07:00
IDScenario
nameTime Period
nameTraffic profile
typeStart time (HH:mm)
Finish time (HH:mm)
Time segment length (min)
Run automatically
D1 2025 Core AM1 ONE HOUR 06:45 08:15 15 �
Vehicle mix varies over turn Vehicle mix varies over entry Vehicle mix source PCU Factor for a HV (PCU)
� � HV Percentages 2.00
Arm Linked arm Profile type Use O-D data Average Demand (Veh/hr) Scaling Factor (%)
A - B5345 south ONE HOUR � 136 100.000
B - Ginns-Kells Rd ONE HOUR � 261 100.000
C - B5345 north ONE HOUR � 332 100.000
Demand (Veh/hr)
To
From
A - B5345 south B - Ginns-Kells Rd C - B5345 north
A - B5345 south 0 7 129
B - Ginns-Kells Rd 5 0 256
C - B5345 north 129 203 0
Heavy Vehicle Percentages
To
From
A - B5345 south B - Ginns-Kells Rd C - B5345 north
A - B5345 south 0 0 2
B - Ginns-Kells Rd 0 0 1
C - B5345 north 3 1 0
Stream Max RFC Max delay (s) Max Queue (Veh) Max LOSAverage Demand
(Veh/hr)Total Junction Arrivals (Veh)
B-C 0.44 9.94 0.8 A 235 352
B-A 0.02 12.04 0.0 B 5 7
C-AB 0.42 9.27 0.8 A 228 343
C-A 76 114
A-B 6 10
A-C 118 178
StreamTotal
Demand (Veh/hr)
Junction Arrivals
(Veh)
Capacity (Veh/hr)
RFCThroughput
(Veh/hr)Start queue
(Veh)End queue
(Veh)Delay (s) LOS
B-C 193 48 657 0.293 191 0.0 0.4 7.695 A
B-A 4 0.94 361 0.010 4 0.0 0.0 10.068 B
C-AB 179 45 654 0.275 178 0.0 0.4 7.546 A
C-A 70 18 70
A-B 5 1 5
A-C 97 24 97
Page 4 of 35
17/08/2021file:///C:/Files%20-%20Simon/BTP%20Projects/BTP-2128%20-%20WCM%20White...
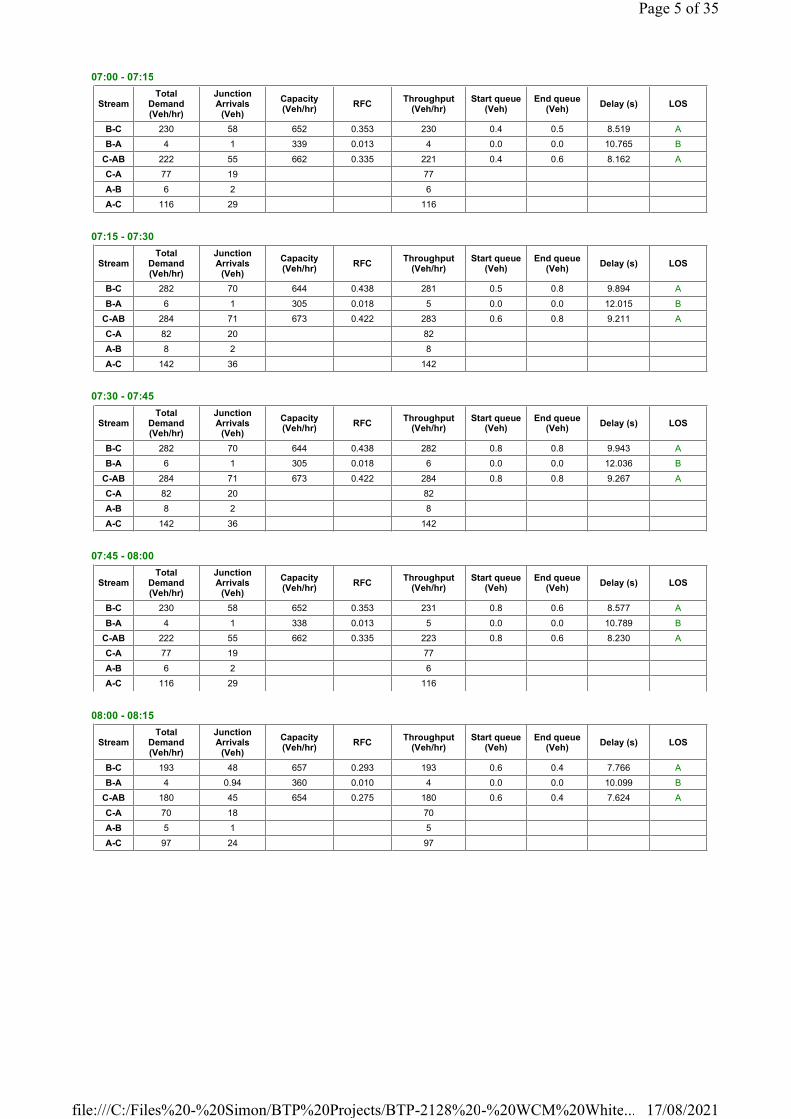
07:00 - 07:15
07:15 - 07:30
07:30 - 07:45
07:45 - 08:00
08:00 - 08:15
StreamTotal
Demand (Veh/hr)
Junction Arrivals
(Veh)
Capacity (Veh/hr)
RFCThroughput
(Veh/hr)Start queue
(Veh)End queue
(Veh)Delay (s) LOS
B-C 230 58 652 0.353 230 0.4 0.5 8.519 A
B-A 4 1 339 0.013 4 0.0 0.0 10.765 B
C-AB 222 55 662 0.335 221 0.4 0.6 8.162 A
C-A 77 19 77
A-B 6 2 6
A-C 116 29 116
StreamTotal
Demand (Veh/hr)
Junction Arrivals
(Veh)
Capacity (Veh/hr)
RFCThroughput
(Veh/hr)Start queue
(Veh)End queue
(Veh)Delay (s) LOS
B-C 282 70 644 0.438 281 0.5 0.8 9.894 A
B-A 6 1 305 0.018 5 0.0 0.0 12.015 B
C-AB 284 71 673 0.422 283 0.6 0.8 9.211 A
C-A 82 20 82
A-B 8 2 8
A-C 142 36 142
StreamTotal
Demand (Veh/hr)
Junction Arrivals
(Veh)
Capacity (Veh/hr)
RFCThroughput
(Veh/hr)Start queue
(Veh)End queue
(Veh)Delay (s) LOS
B-C 282 70 644 0.438 282 0.8 0.8 9.943 A
B-A 6 1 305 0.018 6 0.0 0.0 12.036 B
C-AB 284 71 673 0.422 284 0.8 0.8 9.267 A
C-A 82 20 82
A-B 8 2 8
A-C 142 36 142
StreamTotal
Demand (Veh/hr)
Junction Arrivals
(Veh)
Capacity (Veh/hr)
RFCThroughput
(Veh/hr)Start queue
(Veh)End queue
(Veh)Delay (s) LOS
B-C 230 58 652 0.353 231 0.8 0.6 8.577 A
B-A 4 1 338 0.013 5 0.0 0.0 10.789 B
C-AB 222 55 662 0.335 223 0.8 0.6 8.230 A
C-A 77 19 77
A-B 6 2 6
A-C 116 29 116
StreamTotal
Demand (Veh/hr)
Junction Arrivals
(Veh)
Capacity (Veh/hr)
RFCThroughput
(Veh/hr)Start queue
(Veh)End queue
(Veh)Delay (s) LOS
B-C 193 48 657 0.293 193 0.6 0.4 7.766 A
B-A 4 0.94 360 0.010 4 0.0 0.0 10.099 B
C-AB 180 45 654 0.275 180 0.6 0.4 7.624 A
C-A 70 18 70
A-B 5 1 5
A-C 97 24 97
Page 5 of 35
17/08/2021file:///C:/Files%20-%20Simon/BTP%20Projects/BTP-2128%20-%20WCM%20White...

Existing Layout - 2025 Core, AM2
Data Errors and Warnings
Junction Network
Junctions
Junction Network Options
Traffic Demand
Demand Set Details
Demand overview (Traffic)
Origin-Destination Data
Vehicle Mix
Severity Area Item Description
Warning Minor arm flareB - Ginns-Kells Rd - Minor arm geometry
Is flare very short? Estimated flare length is zero but has been increased to 1 because a zero flare length is not allowed.
Junction Name Junction Type Major road direction Junction Delay (s) Junction LOS
1 Junction T-Junction Two-way 9.53 A
Driving side Lighting Network residual capacity (%) First arm reaching threshold
Left Normal/unknown 37 Stream C-AB
IDScenario
nameTime Period
nameTraffic profile
typeStart time (HH:mm)
Finish time (HH:mm)
Time segment length (min)
Run automatically
D2 2025 Core AM2 ONE HOUR 07:45 09:15 15 �
Vehicle mix varies over turn Vehicle mix varies over entry Vehicle mix source PCU Factor for a HV (PCU)
� � HV Percentages 2.00
Arm Linked arm Profile type Use O-D data Average Demand (Veh/hr) Scaling Factor (%)
A - B5345 south ONE HOUR � 164 100.000
B - Ginns-Kells Rd ONE HOUR � 316 100.000
C - B5345 north ONE HOUR � 399 100.000
Demand (Veh/hr)
To
From
A - B5345 south B - Ginns-Kells Rd C - B5345 north
A - B5345 south 0 8 156
B - Ginns-Kells Rd 7 0 309
C - B5345 north 118 281 0
Heavy Vehicle Percentages
To
From
A - B5345 south B - Ginns-Kells Rd C - B5345 north
A - B5345 south 0 0 2
B - Ginns-Kells Rd 0 0 1
C - B5345 north 3 1 0
Page 6 of 35
17/08/2021file:///C:/Files%20-%20Simon/BTP%20Projects/BTP-2128%20-%20WCM%20White...
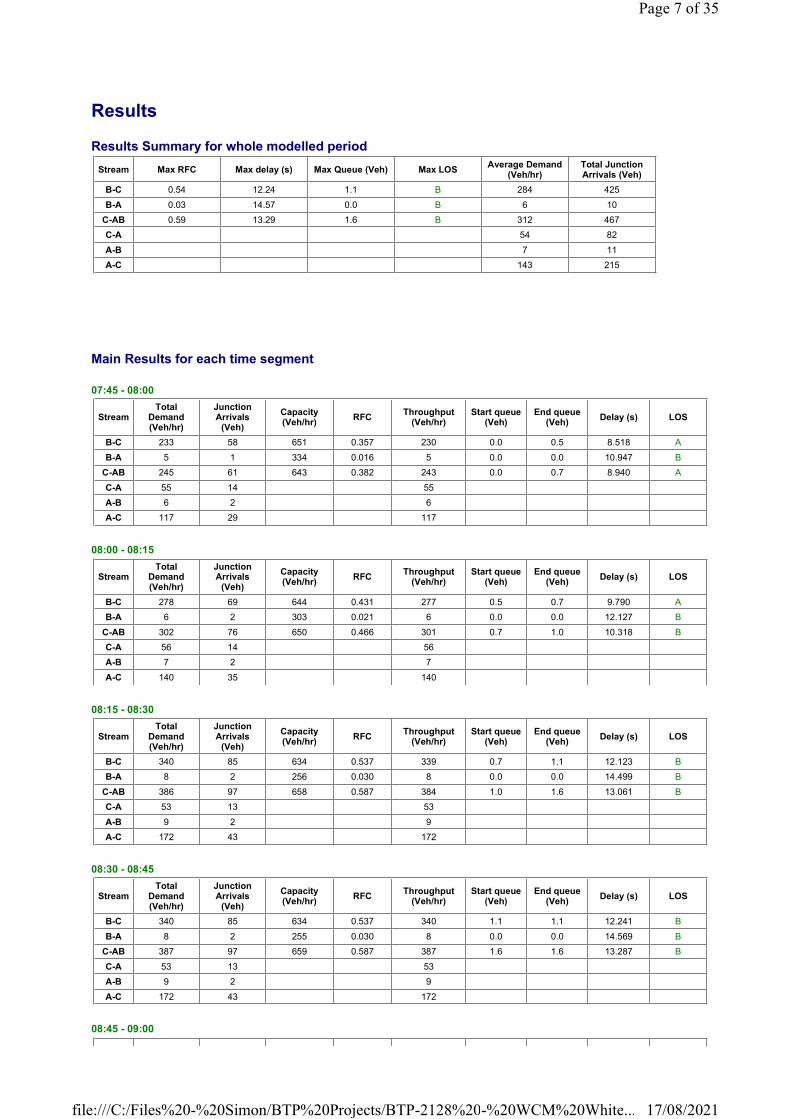
Results
Results Summary for whole modelled period
Main Results for each time segment
07:45 - 08:00
08:00 - 08:15
08:15 - 08:30
08:30 - 08:45
08:45 - 09:00
Stream Max RFC Max delay (s) Max Queue (Veh) Max LOSAverage Demand
(Veh/hr)Total Junction Arrivals (Veh)
B-C 0.54 12.24 1.1 B 284 425
B-A 0.03 14.57 0.0 B 6 10
C-AB 0.59 13.29 1.6 B 312 467
C-A 54 82
A-B 7 11
A-C 143 215
StreamTotal
Demand (Veh/hr)
Junction Arrivals
(Veh)
Capacity (Veh/hr)
RFCThroughput
(Veh/hr)Start queue
(Veh)End queue
(Veh)Delay (s) LOS
B-C 233 58 651 0.357 230 0.0 0.5 8.518 A
B-A 5 1 334 0.016 5 0.0 0.0 10.947 B
C-AB 245 61 643 0.382 243 0.0 0.7 8.940 A
C-A 55 14 55
A-B 6 2 6
A-C 117 29 117
StreamTotal
Demand (Veh/hr)
Junction Arrivals
(Veh)
Capacity (Veh/hr)
RFCThroughput
(Veh/hr)Start queue
(Veh)End queue
(Veh)Delay (s) LOS
B-C 278 69 644 0.431 277 0.5 0.7 9.790 A
B-A 6 2 303 0.021 6 0.0 0.0 12.127 B
C-AB 302 76 650 0.466 301 0.7 1.0 10.318 B
C-A 56 14 56
A-B 7 2 7
A-C 140 35 140
StreamTotal
Demand (Veh/hr)
Junction Arrivals
(Veh)
Capacity (Veh/hr)
RFCThroughput
(Veh/hr)Start queue
(Veh)End queue
(Veh)Delay (s) LOS
B-C 340 85 634 0.537 339 0.7 1.1 12.123 B
B-A 8 2 256 0.030 8 0.0 0.0 14.499 B
C-AB 386 97 658 0.587 384 1.0 1.6 13.061 B
C-A 53 13 53
A-B 9 2 9
A-C 172 43 172
StreamTotal
Demand (Veh/hr)
Junction Arrivals
(Veh)
Capacity (Veh/hr)
RFCThroughput
(Veh/hr)Start queue
(Veh)End queue
(Veh)Delay (s) LOS
B-C 340 85 634 0.537 340 1.1 1.1 12.241 B
B-A 8 2 255 0.030 8 0.0 0.0 14.569 B
C-AB 387 97 659 0.587 387 1.6 1.6 13.287 B
C-A 53 13 53
A-B 9 2 9
A-C 172 43 172
Page 7 of 35
17/08/2021file:///C:/Files%20-%20Simon/BTP%20Projects/BTP-2128%20-%20WCM%20White...

09:00 - 09:15
StreamTotal
Demand (Veh/hr)
Junction Arrivals
(Veh)
Capacity (Veh/hr)
RFCThroughput
(Veh/hr)Start queue
(Veh)End queue
(Veh)Delay (s) LOS
B-C 278 69 644 0.431 279 1.1 0.8 9.913 A
B-A 6 2 302 0.021 6 0.0 0.0 12.196 B
C-AB 303 76 650 0.466 305 1.6 1.0 10.542 B
C-A 56 14 56
A-B 7 2 7
A-C 140 35 140
StreamTotal
Demand (Veh/hr)
Junction Arrivals
(Veh)
Capacity (Veh/hr)
RFCThroughput
(Veh/hr)Start queue
(Veh)End queue
(Veh)Delay (s) LOS
B-C 233 58 651 0.357 233 0.8 0.6 8.643 A
B-A 5 1 332 0.016 5 0.0 0.0 11.005 B
C-AB 246 61 644 0.382 247 1.0 0.7 9.122 A
C-A 54 14 54
A-B 6 2 6
A-C 117 29 117
Page 8 of 35
17/08/2021file:///C:/Files%20-%20Simon/BTP%20Projects/BTP-2128%20-%20WCM%20White...
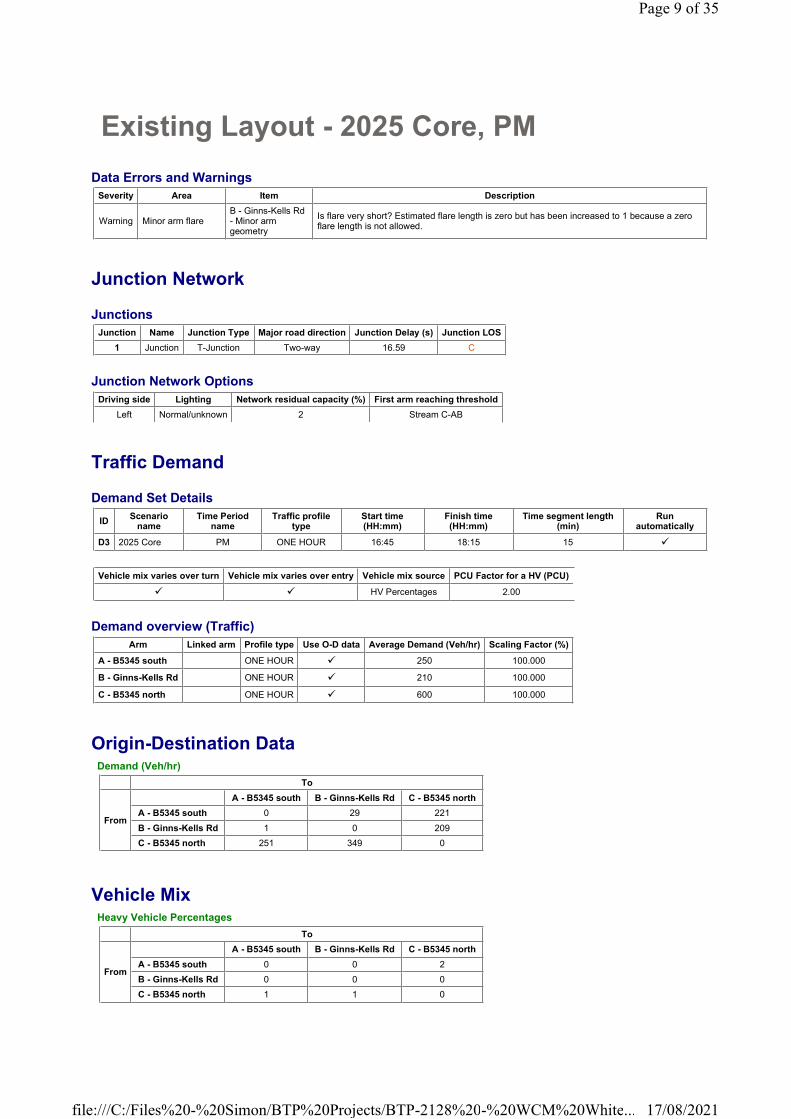
Existing Layout - 2025 Core, PM
Data Errors and Warnings
Junction Network
Junctions
Junction Network Options
Traffic Demand
Demand Set Details
Demand overview (Traffic)
Origin-Destination Data
Vehicle Mix
Severity Area Item Description
Warning Minor arm flareB - Ginns-Kells Rd - Minor arm geometry
Is flare very short? Estimated flare length is zero but has been increased to 1 because a zero flare length is not allowed.
Junction Name Junction Type Major road direction Junction Delay (s) Junction LOS
1 Junction T-Junction Two-way 16.59 C
Driving side Lighting Network residual capacity (%) First arm reaching threshold
Left Normal/unknown 2 Stream C-AB
IDScenario
nameTime Period
nameTraffic profile
typeStart time (HH:mm)
Finish time (HH:mm)
Time segment length (min)
Run automatically
D3 2025 Core PM ONE HOUR 16:45 18:15 15 �
Vehicle mix varies over turn Vehicle mix varies over entry Vehicle mix source PCU Factor for a HV (PCU)
� � HV Percentages 2.00
Arm Linked arm Profile type Use O-D data Average Demand (Veh/hr) Scaling Factor (%)
A - B5345 south ONE HOUR � 250 100.000
B - Ginns-Kells Rd ONE HOUR � 210 100.000
C - B5345 north ONE HOUR � 600 100.000
Demand (Veh/hr)
To
From
A - B5345 south B - Ginns-Kells Rd C - B5345 north
A - B5345 south 0 29 221
B - Ginns-Kells Rd 1 0 209
C - B5345 north 251 349 0
Heavy Vehicle Percentages
To
From
A - B5345 south B - Ginns-Kells Rd C - B5345 north
A - B5345 south 0 0 2
B - Ginns-Kells Rd 0 0 0
C - B5345 north 1 1 0
Page 9 of 35
17/08/2021file:///C:/Files%20-%20Simon/BTP%20Projects/BTP-2128%20-%20WCM%20White...
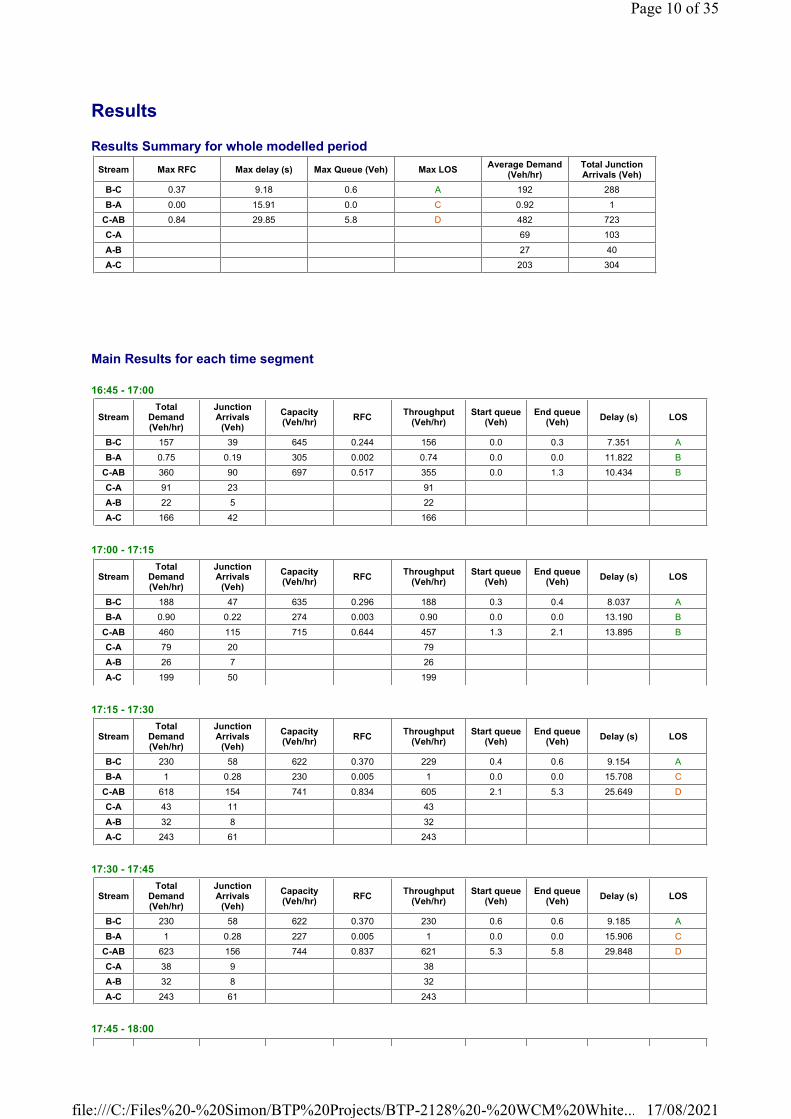
Results
Results Summary for whole modelled period
Main Results for each time segment
16:45 - 17:00
17:00 - 17:15
17:15 - 17:30
17:30 - 17:45
17:45 - 18:00
Stream Max RFC Max delay (s) Max Queue (Veh) Max LOSAverage Demand
(Veh/hr)Total Junction Arrivals (Veh)
B-C 0.37 9.18 0.6 A 192 288
B-A 0.00 15.91 0.0 C 0.92 1
C-AB 0.84 29.85 5.8 D 482 723
C-A 69 103
A-B 27 40
A-C 203 304
StreamTotal
Demand (Veh/hr)
Junction Arrivals
(Veh)
Capacity (Veh/hr)
RFCThroughput
(Veh/hr)Start queue
(Veh)End queue
(Veh)Delay (s) LOS
B-C 157 39 645 0.244 156 0.0 0.3 7.351 A
B-A 0.75 0.19 305 0.002 0.74 0.0 0.0 11.822 B
C-AB 360 90 697 0.517 355 0.0 1.3 10.434 B
C-A 91 23 91
A-B 22 5 22
A-C 166 42 166
StreamTotal
Demand (Veh/hr)
Junction Arrivals
(Veh)
Capacity (Veh/hr)
RFCThroughput
(Veh/hr)Start queue
(Veh)End queue
(Veh)Delay (s) LOS
B-C 188 47 635 0.296 188 0.3 0.4 8.037 A
B-A 0.90 0.22 274 0.003 0.90 0.0 0.0 13.190 B
C-AB 460 115 715 0.644 457 1.3 2.1 13.895 B
C-A 79 20 79
A-B 26 7 26
A-C 199 50 199
StreamTotal
Demand (Veh/hr)
Junction Arrivals
(Veh)
Capacity (Veh/hr)
RFCThroughput
(Veh/hr)Start queue
(Veh)End queue
(Veh)Delay (s) LOS
B-C 230 58 622 0.370 229 0.4 0.6 9.154 A
B-A 1 0.28 230 0.005 1 0.0 0.0 15.708 C
C-AB 618 154 741 0.834 605 2.1 5.3 25.649 D
C-A 43 11 43
A-B 32 8 32
A-C 243 61 243
StreamTotal
Demand (Veh/hr)
Junction Arrivals
(Veh)
Capacity (Veh/hr)
RFCThroughput
(Veh/hr)Start queue
(Veh)End queue
(Veh)Delay (s) LOS
B-C 230 58 622 0.370 230 0.6 0.6 9.185 A
B-A 1 0.28 227 0.005 1 0.0 0.0 15.906 C
C-AB 623 156 744 0.837 621 5.3 5.8 29.848 D
C-A 38 9 38
A-B 32 8 32
A-C 243 61 243
Page 10 of 35
17/08/2021file:///C:/Files%20-%20Simon/BTP%20Projects/BTP-2128%20-%20WCM%20White...

18:00 - 18:15
StreamTotal
Demand (Veh/hr)
Junction Arrivals
(Veh)
Capacity (Veh/hr)
RFCThroughput
(Veh/hr)Start queue
(Veh)End queue
(Veh)Delay (s) LOS
B-C 188 47 635 0.296 189 0.6 0.4 8.074 A
B-A 0.90 0.22 270 0.003 0.90 0.0 0.0 13.398 B
C-AB 466 117 721 0.647 480 5.8 2.4 15.954 C
C-A 73 18 73
A-B 26 7 26
A-C 199 50 199
StreamTotal
Demand (Veh/hr)
Junction Arrivals
(Veh)
Capacity (Veh/hr)
RFCThroughput
(Veh/hr)Start queue
(Veh)End queue
(Veh)Delay (s) LOS
B-C 157 39 644 0.244 158 0.4 0.3 7.404 A
B-A 0.75 0.19 303 0.002 0.76 0.0 0.0 11.921 B
C-AB 363 91 699 0.519 367 2.4 1.3 11.032 B
C-A 89 22 89
A-B 22 5 22
A-C 166 42 166
Page 11 of 35
17/08/2021file:///C:/Files%20-%20Simon/BTP%20Projects/BTP-2128%20-%20WCM%20White...
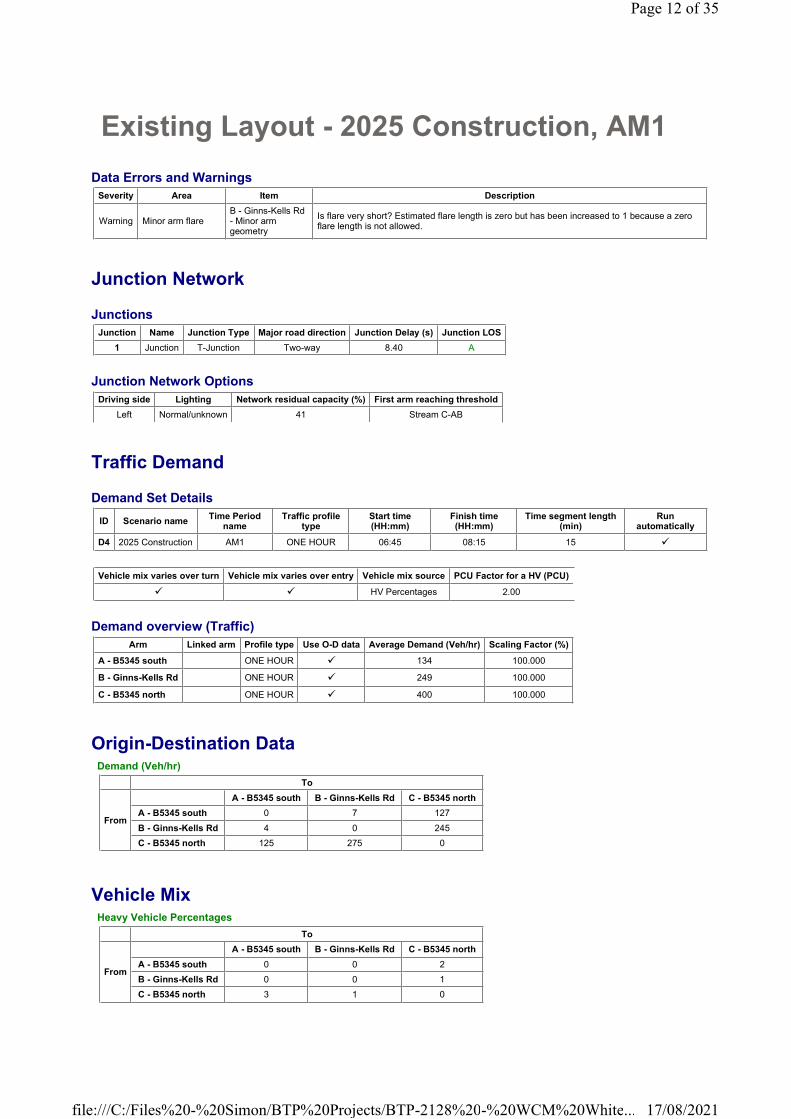
Existing Layout - 2025 Construction, AM1
Data Errors and Warnings
Junction Network
Junctions
Junction Network Options
Traffic Demand
Demand Set Details
Demand overview (Traffic)
Origin-Destination Data
Vehicle Mix
Severity Area Item Description
Warning Minor arm flareB - Ginns-Kells Rd - Minor arm geometry
Is flare very short? Estimated flare length is zero but has been increased to 1 because a zero flare length is not allowed.
Junction Name Junction Type Major road direction Junction Delay (s) Junction LOS
1 Junction T-Junction Two-way 8.40 A
Driving side Lighting Network residual capacity (%) First arm reaching threshold
Left Normal/unknown 41 Stream C-AB
ID Scenario nameTime Period
nameTraffic profile
typeStart time (HH:mm)
Finish time (HH:mm)
Time segment length (min)
Run automatically
D4 2025 Construction AM1 ONE HOUR 06:45 08:15 15 �
Vehicle mix varies over turn Vehicle mix varies over entry Vehicle mix source PCU Factor for a HV (PCU)
� � HV Percentages 2.00
Arm Linked arm Profile type Use O-D data Average Demand (Veh/hr) Scaling Factor (%)
A - B5345 south ONE HOUR � 134 100.000
B - Ginns-Kells Rd ONE HOUR � 249 100.000
C - B5345 north ONE HOUR � 400 100.000
Demand (Veh/hr)
To
From
A - B5345 south B - Ginns-Kells Rd C - B5345 north
A - B5345 south 0 7 127
B - Ginns-Kells Rd 4 0 245
C - B5345 north 125 275 0
Heavy Vehicle Percentages
To
From
A - B5345 south B - Ginns-Kells Rd C - B5345 north
A - B5345 south 0 0 2
B - Ginns-Kells Rd 0 0 1
C - B5345 north 3 1 0
Page 12 of 35
17/08/2021file:///C:/Files%20-%20Simon/BTP%20Projects/BTP-2128%20-%20WCM%20White...
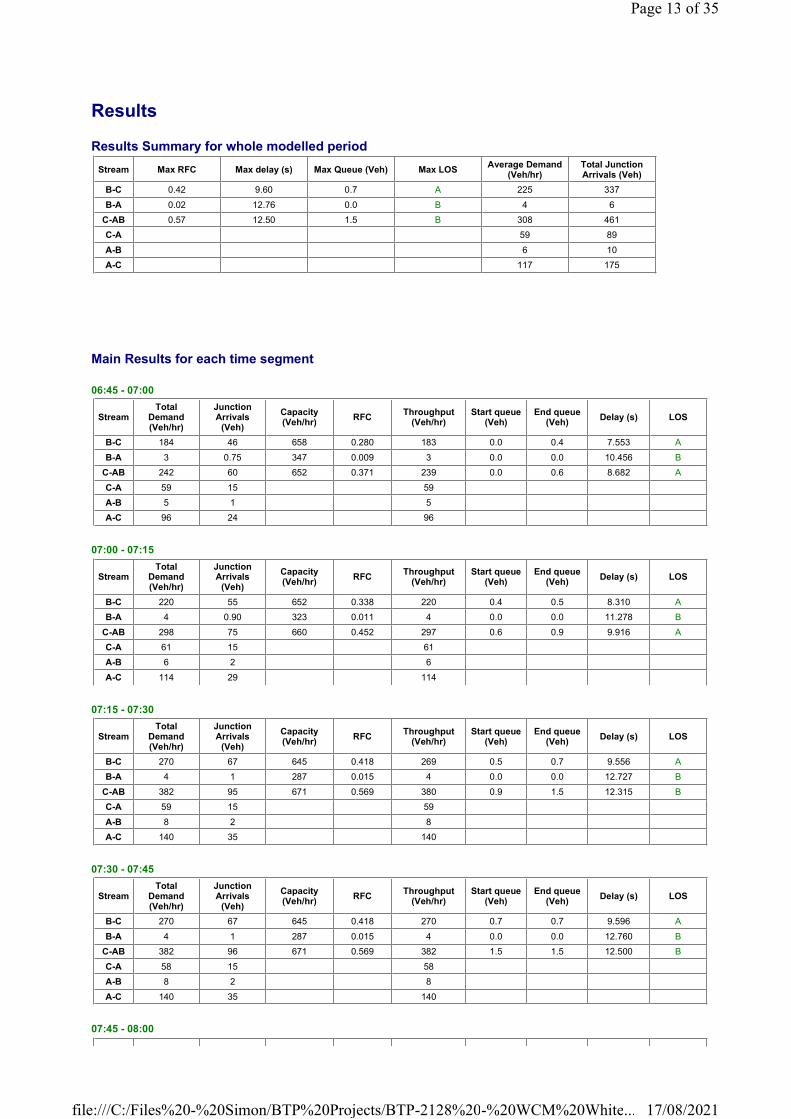
Results
Results Summary for whole modelled period
Main Results for each time segment
06:45 - 07:00
07:00 - 07:15
07:15 - 07:30
07:30 - 07:45
07:45 - 08:00
Stream Max RFC Max delay (s) Max Queue (Veh) Max LOSAverage Demand
(Veh/hr)Total Junction Arrivals (Veh)
B-C 0.42 9.60 0.7 A 225 337
B-A 0.02 12.76 0.0 B 4 6
C-AB 0.57 12.50 1.5 B 308 461
C-A 59 89
A-B 6 10
A-C 117 175
StreamTotal
Demand (Veh/hr)
Junction Arrivals
(Veh)
Capacity (Veh/hr)
RFCThroughput
(Veh/hr)Start queue
(Veh)End queue
(Veh)Delay (s) LOS
B-C 184 46 658 0.280 183 0.0 0.4 7.553 A
B-A 3 0.75 347 0.009 3 0.0 0.0 10.456 B
C-AB 242 60 652 0.371 239 0.0 0.6 8.682 A
C-A 59 15 59
A-B 5 1 5
A-C 96 24 96
StreamTotal
Demand (Veh/hr)
Junction Arrivals
(Veh)
Capacity (Veh/hr)
RFCThroughput
(Veh/hr)Start queue
(Veh)End queue
(Veh)Delay (s) LOS
B-C 220 55 652 0.338 220 0.4 0.5 8.310 A
B-A 4 0.90 323 0.011 4 0.0 0.0 11.278 B
C-AB 298 75 660 0.452 297 0.6 0.9 9.916 A
C-A 61 15 61
A-B 6 2 6
A-C 114 29 114
StreamTotal
Demand (Veh/hr)
Junction Arrivals
(Veh)
Capacity (Veh/hr)
RFCThroughput
(Veh/hr)Start queue
(Veh)End queue
(Veh)Delay (s) LOS
B-C 270 67 645 0.418 269 0.5 0.7 9.556 A
B-A 4 1 287 0.015 4 0.0 0.0 12.727 B
C-AB 382 95 671 0.569 380 0.9 1.5 12.315 B
C-A 59 15 59
A-B 8 2 8
A-C 140 35 140
StreamTotal
Demand (Veh/hr)
Junction Arrivals
(Veh)
Capacity (Veh/hr)
RFCThroughput
(Veh/hr)Start queue
(Veh)End queue
(Veh)Delay (s) LOS
B-C 270 67 645 0.418 270 0.7 0.7 9.596 A
B-A 4 1 287 0.015 4 0.0 0.0 12.760 B
C-AB 382 96 671 0.569 382 1.5 1.5 12.500 B
C-A 58 15 58
A-B 8 2 8
A-C 140 35 140
Page 13 of 35
17/08/2021file:///C:/Files%20-%20Simon/BTP%20Projects/BTP-2128%20-%20WCM%20White...

08:00 - 08:15
StreamTotal
Demand (Veh/hr)
Junction Arrivals
(Veh)
Capacity (Veh/hr)
RFCThroughput
(Veh/hr)Start queue
(Veh)End queue
(Veh)Delay (s) LOS
B-C 220 55 652 0.338 221 0.7 0.5 8.359 A
B-A 4 0.90 322 0.011 4 0.0 0.0 11.316 B
C-AB 299 75 660 0.453 301 1.5 1.0 10.108 B
C-A 61 15 61
A-B 6 2 6
A-C 114 29 114
StreamTotal
Demand (Veh/hr)
Junction Arrivals
(Veh)
Capacity (Veh/hr)
RFCThroughput
(Veh/hr)Start queue
(Veh)End queue
(Veh)Delay (s) LOS
B-C 184 46 658 0.280 185 0.5 0.4 7.617 A
B-A 3 0.75 346 0.009 3 0.0 0.0 10.500 B
C-AB 243 61 652 0.372 244 1.0 0.7 8.845 A
C-A 59 15 59
A-B 5 1 5
A-C 96 24 96
Page 14 of 35
17/08/2021file:///C:/Files%20-%20Simon/BTP%20Projects/BTP-2128%20-%20WCM%20White...
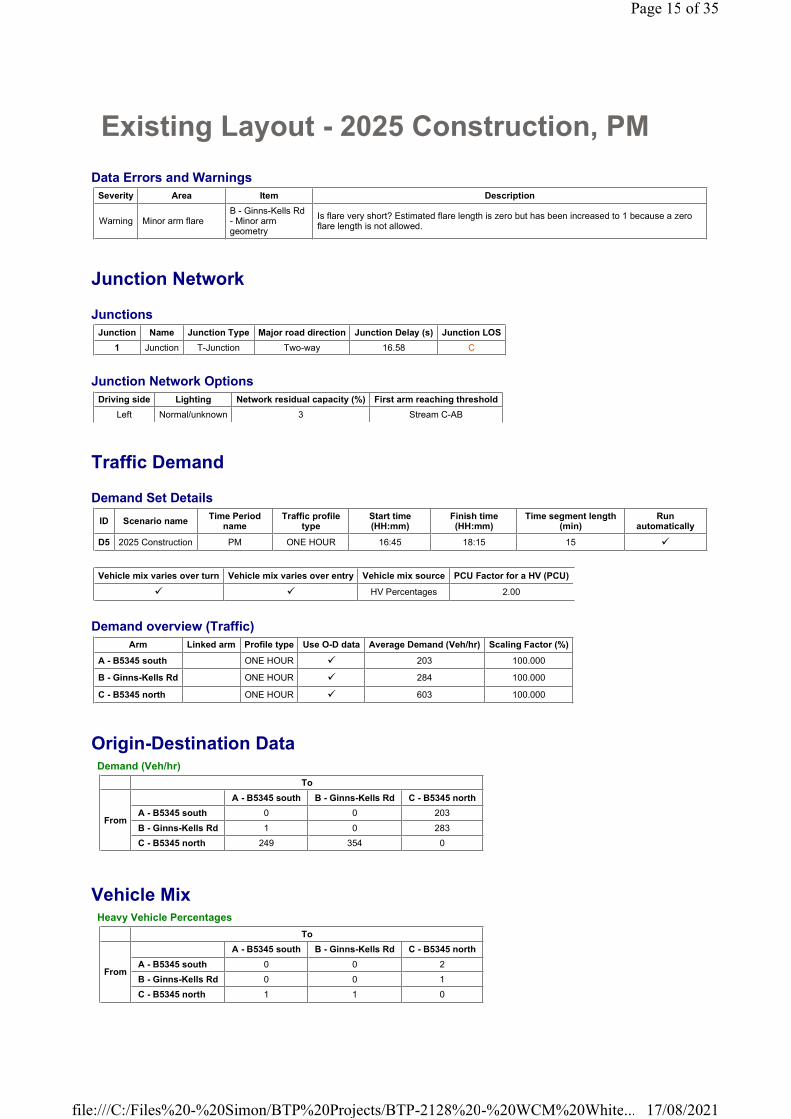
Existing Layout - 2025 Construction, PM
Data Errors and Warnings
Junction Network
Junctions
Junction Network Options
Traffic Demand
Demand Set Details
Demand overview (Traffic)
Origin-Destination Data
Vehicle Mix
Severity Area Item Description
Warning Minor arm flareB - Ginns-Kells Rd - Minor arm geometry
Is flare very short? Estimated flare length is zero but has been increased to 1 because a zero flare length is not allowed.
Junction Name Junction Type Major road direction Junction Delay (s) Junction LOS
1 Junction T-Junction Two-way 16.58 C
Driving side Lighting Network residual capacity (%) First arm reaching threshold
Left Normal/unknown 3 Stream C-AB
ID Scenario nameTime Period
nameTraffic profile
typeStart time (HH:mm)
Finish time (HH:mm)
Time segment length (min)
Run automatically
D5 2025 Construction PM ONE HOUR 16:45 18:15 15 �
Vehicle mix varies over turn Vehicle mix varies over entry Vehicle mix source PCU Factor for a HV (PCU)
� � HV Percentages 2.00
Arm Linked arm Profile type Use O-D data Average Demand (Veh/hr) Scaling Factor (%)
A - B5345 south ONE HOUR � 203 100.000
B - Ginns-Kells Rd ONE HOUR � 284 100.000
C - B5345 north ONE HOUR � 603 100.000
Demand (Veh/hr)
To
From
A - B5345 south B - Ginns-Kells Rd C - B5345 north
A - B5345 south 0 0 203
B - Ginns-Kells Rd 1 0 283
C - B5345 north 249 354 0
Heavy Vehicle Percentages
To
From
A - B5345 south B - Ginns-Kells Rd C - B5345 north
A - B5345 south 0 0 2
B - Ginns-Kells Rd 0 0 1
C - B5345 north 1 1 0
Page 15 of 35
17/08/2021file:///C:/Files%20-%20Simon/BTP%20Projects/BTP-2128%20-%20WCM%20White...
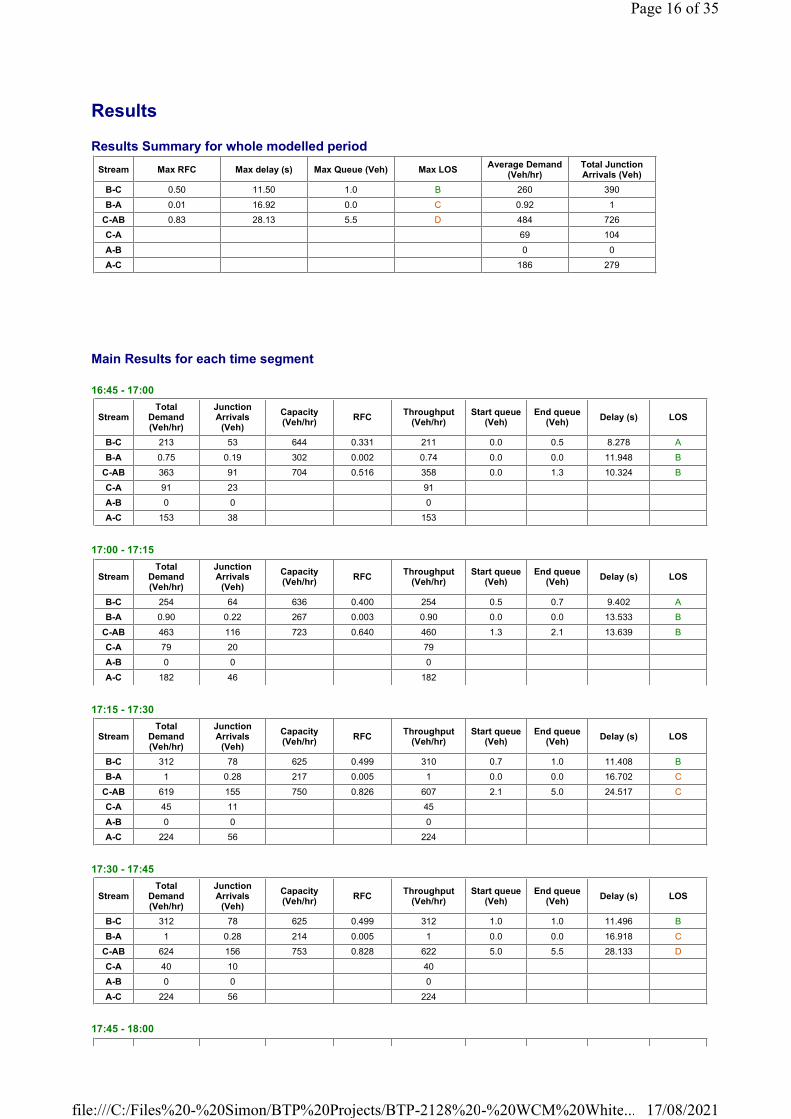
Results
Results Summary for whole modelled period
Main Results for each time segment
16:45 - 17:00
17:00 - 17:15
17:15 - 17:30
17:30 - 17:45
17:45 - 18:00
Stream Max RFC Max delay (s) Max Queue (Veh) Max LOSAverage Demand
(Veh/hr)Total Junction Arrivals (Veh)
B-C 0.50 11.50 1.0 B 260 390
B-A 0.01 16.92 0.0 C 0.92 1
C-AB 0.83 28.13 5.5 D 484 726
C-A 69 104
A-B 0 0
A-C 186 279
StreamTotal
Demand (Veh/hr)
Junction Arrivals
(Veh)
Capacity (Veh/hr)
RFCThroughput
(Veh/hr)Start queue
(Veh)End queue
(Veh)Delay (s) LOS
B-C 213 53 644 0.331 211 0.0 0.5 8.278 A
B-A 0.75 0.19 302 0.002 0.74 0.0 0.0 11.948 B
C-AB 363 91 704 0.516 358 0.0 1.3 10.324 B
C-A 91 23 91
A-B 0 0 0
A-C 153 38 153
StreamTotal
Demand (Veh/hr)
Junction Arrivals
(Veh)
Capacity (Veh/hr)
RFCThroughput
(Veh/hr)Start queue
(Veh)End queue
(Veh)Delay (s) LOS
B-C 254 64 636 0.400 254 0.5 0.7 9.402 A
B-A 0.90 0.22 267 0.003 0.90 0.0 0.0 13.533 B
C-AB 463 116 723 0.640 460 1.3 2.1 13.639 B
C-A 79 20 79
A-B 0 0 0
A-C 182 46 182
StreamTotal
Demand (Veh/hr)
Junction Arrivals
(Veh)
Capacity (Veh/hr)
RFCThroughput
(Veh/hr)Start queue
(Veh)End queue
(Veh)Delay (s) LOS
B-C 312 78 625 0.499 310 0.7 1.0 11.408 B
B-A 1 0.28 217 0.005 1 0.0 0.0 16.702 C
C-AB 619 155 750 0.826 607 2.1 5.0 24.517 C
C-A 45 11 45
A-B 0 0 0
A-C 224 56 224
StreamTotal
Demand (Veh/hr)
Junction Arrivals
(Veh)
Capacity (Veh/hr)
RFCThroughput
(Veh/hr)Start queue
(Veh)End queue
(Veh)Delay (s) LOS
B-C 312 78 625 0.499 312 1.0 1.0 11.496 B
B-A 1 0.28 214 0.005 1 0.0 0.0 16.918 C
C-AB 624 156 753 0.828 622 5.0 5.5 28.133 D
C-A 40 10 40
A-B 0 0 0
A-C 224 56 224
Page 16 of 35
17/08/2021file:///C:/Files%20-%20Simon/BTP%20Projects/BTP-2128%20-%20WCM%20White...

18:00 - 18:15
StreamTotal
Demand (Veh/hr)
Junction Arrivals
(Veh)
Capacity (Veh/hr)
RFCThroughput
(Veh/hr)Start queue
(Veh)End queue
(Veh)Delay (s) LOS
B-C 254 64 636 0.400 256 1.0 0.7 9.496 A
B-A 0.90 0.22 263 0.003 0.91 0.0 0.0 13.745 B
C-AB 468 117 728 0.643 481 5.5 2.3 15.475 C
C-A 74 18 74
A-B 0 0 0
A-C 182 46 182
StreamTotal
Demand (Veh/hr)
Junction Arrivals
(Veh)
Capacity (Veh/hr)
RFCThroughput
(Veh/hr)Start queue
(Veh)End queue
(Veh)Delay (s) LOS
B-C 213 53 644 0.331 214 0.7 0.5 8.381 A
B-A 0.75 0.19 299 0.003 0.76 0.0 0.0 12.054 B
C-AB 366 91 706 0.518 370 2.3 1.3 10.893 B
C-A 88 22 88
A-B 0 0 0
A-C 153 38 153
Page 17 of 35
17/08/2021file:///C:/Files%20-%20Simon/BTP%20Projects/BTP-2128%20-%20WCM%20White...
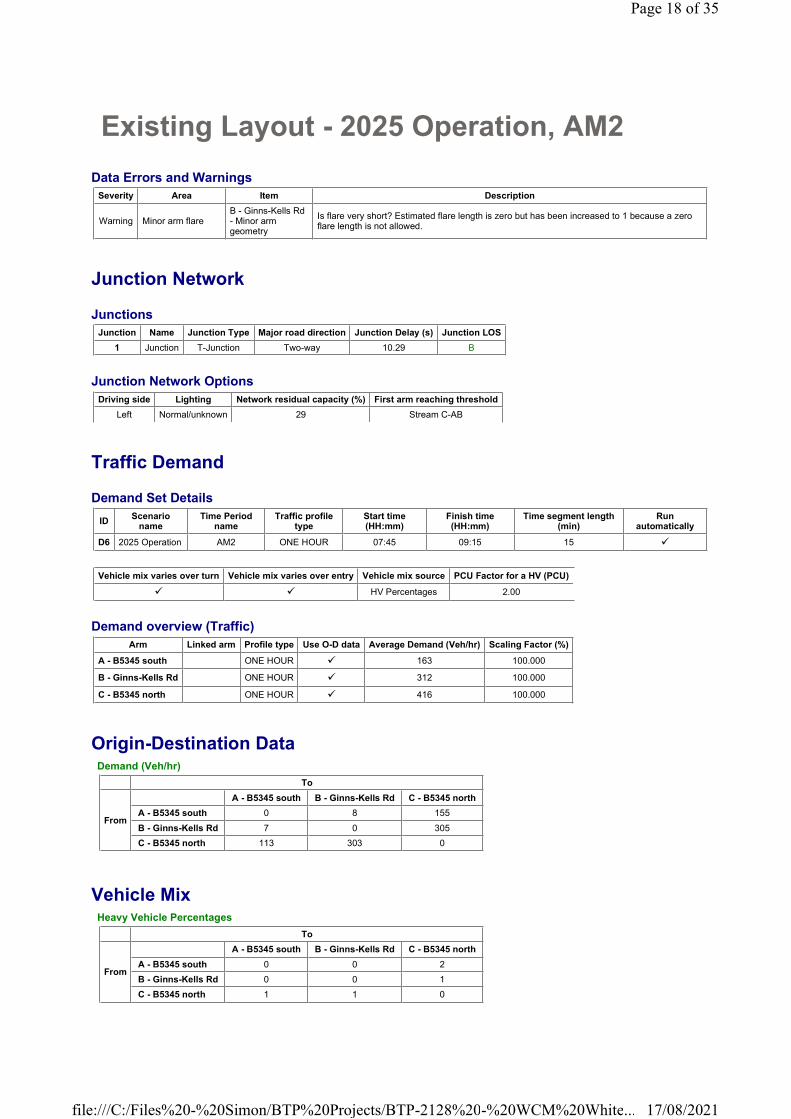
Existing Layout - 2025 Operation, AM2
Data Errors and Warnings
Junction Network
Junctions
Junction Network Options
Traffic Demand
Demand Set Details
Demand overview (Traffic)
Origin-Destination Data
Vehicle Mix
Severity Area Item Description
Warning Minor arm flareB - Ginns-Kells Rd - Minor arm geometry
Is flare very short? Estimated flare length is zero but has been increased to 1 because a zero flare length is not allowed.
Junction Name Junction Type Major road direction Junction Delay (s) Junction LOS
1 Junction T-Junction Two-way 10.29 B
Driving side Lighting Network residual capacity (%) First arm reaching threshold
Left Normal/unknown 29 Stream C-AB
IDScenario
nameTime Period
nameTraffic profile
typeStart time (HH:mm)
Finish time (HH:mm)
Time segment length (min)
Run automatically
D6 2025 Operation AM2 ONE HOUR 07:45 09:15 15 �
Vehicle mix varies over turn Vehicle mix varies over entry Vehicle mix source PCU Factor for a HV (PCU)
� � HV Percentages 2.00
Arm Linked arm Profile type Use O-D data Average Demand (Veh/hr) Scaling Factor (%)
A - B5345 south ONE HOUR � 163 100.000
B - Ginns-Kells Rd ONE HOUR � 312 100.000
C - B5345 north ONE HOUR � 416 100.000
Demand (Veh/hr)
To
From
A - B5345 south B - Ginns-Kells Rd C - B5345 north
A - B5345 south 0 8 155
B - Ginns-Kells Rd 7 0 305
C - B5345 north 113 303 0
Heavy Vehicle Percentages
To
From
A - B5345 south B - Ginns-Kells Rd C - B5345 north
A - B5345 south 0 0 2
B - Ginns-Kells Rd 0 0 1
C - B5345 north 1 1 0
Page 18 of 35
17/08/2021file:///C:/Files%20-%20Simon/BTP%20Projects/BTP-2128%20-%20WCM%20White...
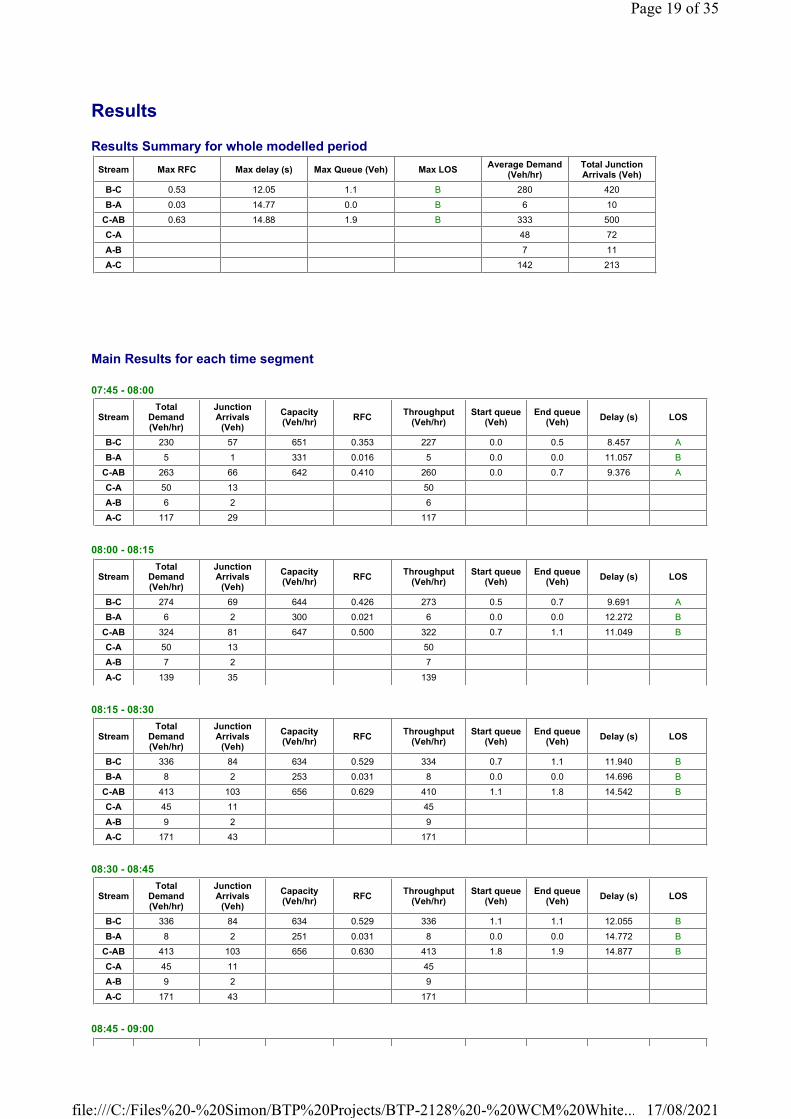
Results
Results Summary for whole modelled period
Main Results for each time segment
07:45 - 08:00
08:00 - 08:15
08:15 - 08:30
08:30 - 08:45
08:45 - 09:00
Stream Max RFC Max delay (s) Max Queue (Veh) Max LOSAverage Demand
(Veh/hr)Total Junction Arrivals (Veh)
B-C 0.53 12.05 1.1 B 280 420
B-A 0.03 14.77 0.0 B 6 10
C-AB 0.63 14.88 1.9 B 333 500
C-A 48 72
A-B 7 11
A-C 142 213
StreamTotal
Demand (Veh/hr)
Junction Arrivals
(Veh)
Capacity (Veh/hr)
RFCThroughput
(Veh/hr)Start queue
(Veh)End queue
(Veh)Delay (s) LOS
B-C 230 57 651 0.353 227 0.0 0.5 8.457 A
B-A 5 1 331 0.016 5 0.0 0.0 11.057 B
C-AB 263 66 642 0.410 260 0.0 0.7 9.376 A
C-A 50 13 50
A-B 6 2 6
A-C 117 29 117
StreamTotal
Demand (Veh/hr)
Junction Arrivals
(Veh)
Capacity (Veh/hr)
RFCThroughput
(Veh/hr)Start queue
(Veh)End queue
(Veh)Delay (s) LOS
B-C 274 69 644 0.426 273 0.5 0.7 9.691 A
B-A 6 2 300 0.021 6 0.0 0.0 12.272 B
C-AB 324 81 647 0.500 322 0.7 1.1 11.049 B
C-A 50 13 50
A-B 7 2 7
A-C 139 35 139
StreamTotal
Demand (Veh/hr)
Junction Arrivals
(Veh)
Capacity (Veh/hr)
RFCThroughput
(Veh/hr)Start queue
(Veh)End queue
(Veh)Delay (s) LOS
B-C 336 84 634 0.529 334 0.7 1.1 11.940 B
B-A 8 2 253 0.031 8 0.0 0.0 14.696 B
C-AB 413 103 656 0.629 410 1.1 1.8 14.542 B
C-A 45 11 45
A-B 9 2 9
A-C 171 43 171
StreamTotal
Demand (Veh/hr)
Junction Arrivals
(Veh)
Capacity (Veh/hr)
RFCThroughput
(Veh/hr)Start queue
(Veh)End queue
(Veh)Delay (s) LOS
B-C 336 84 634 0.529 336 1.1 1.1 12.055 B
B-A 8 2 251 0.031 8 0.0 0.0 14.772 B
C-AB 413 103 656 0.630 413 1.8 1.9 14.877 B
C-A 45 11 45
A-B 9 2 9
A-C 171 43 171
Page 19 of 35
17/08/2021file:///C:/Files%20-%20Simon/BTP%20Projects/BTP-2128%20-%20WCM%20White...
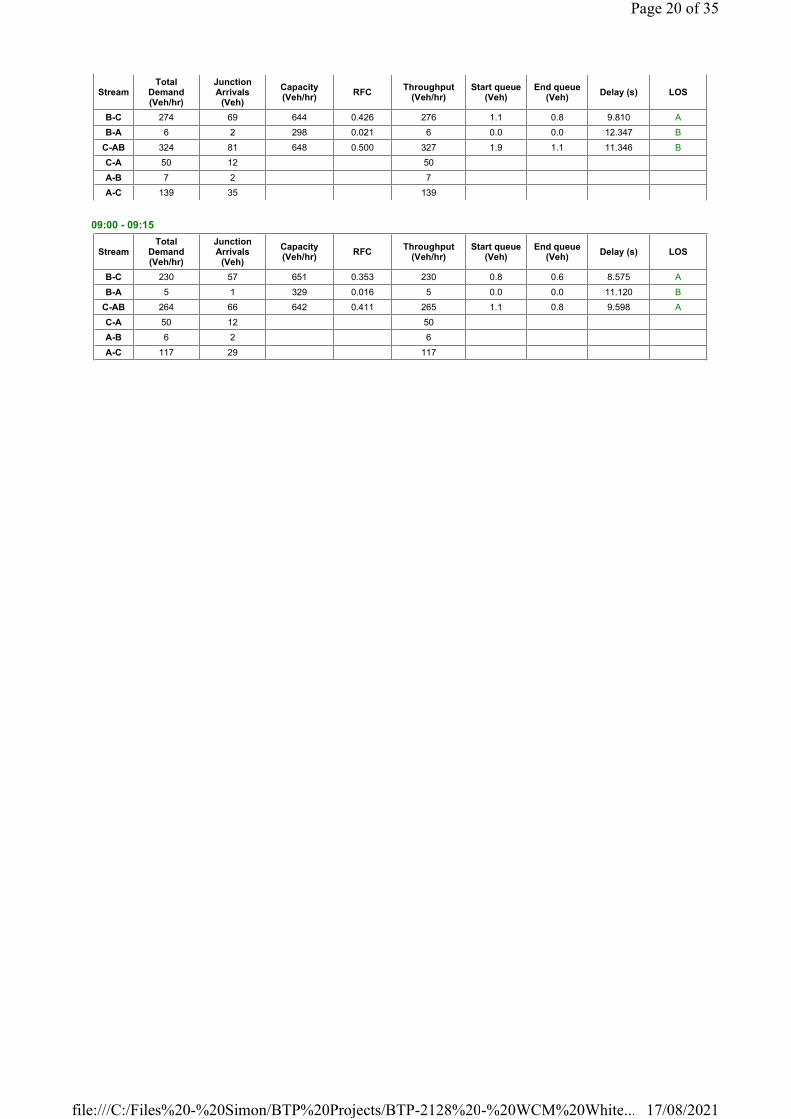
09:00 - 09:15
StreamTotal
Demand (Veh/hr)
Junction Arrivals
(Veh)
Capacity (Veh/hr)
RFCThroughput
(Veh/hr)Start queue
(Veh)End queue
(Veh)Delay (s) LOS
B-C 274 69 644 0.426 276 1.1 0.8 9.810 A
B-A 6 2 298 0.021 6 0.0 0.0 12.347 B
C-AB 324 81 648 0.500 327 1.9 1.1 11.346 B
C-A 50 12 50
A-B 7 2 7
A-C 139 35 139
StreamTotal
Demand (Veh/hr)
Junction Arrivals
(Veh)
Capacity (Veh/hr)
RFCThroughput
(Veh/hr)Start queue
(Veh)End queue
(Veh)Delay (s) LOS
B-C 230 57 651 0.353 230 0.8 0.6 8.575 A
B-A 5 1 329 0.016 5 0.0 0.0 11.120 B
C-AB 264 66 642 0.411 265 1.1 0.8 9.598 A
C-A 50 12 50
A-B 6 2 6
A-C 117 29 117
Page 20 of 35
17/08/2021file:///C:/Files%20-%20Simon/BTP%20Projects/BTP-2128%20-%20WCM%20White...
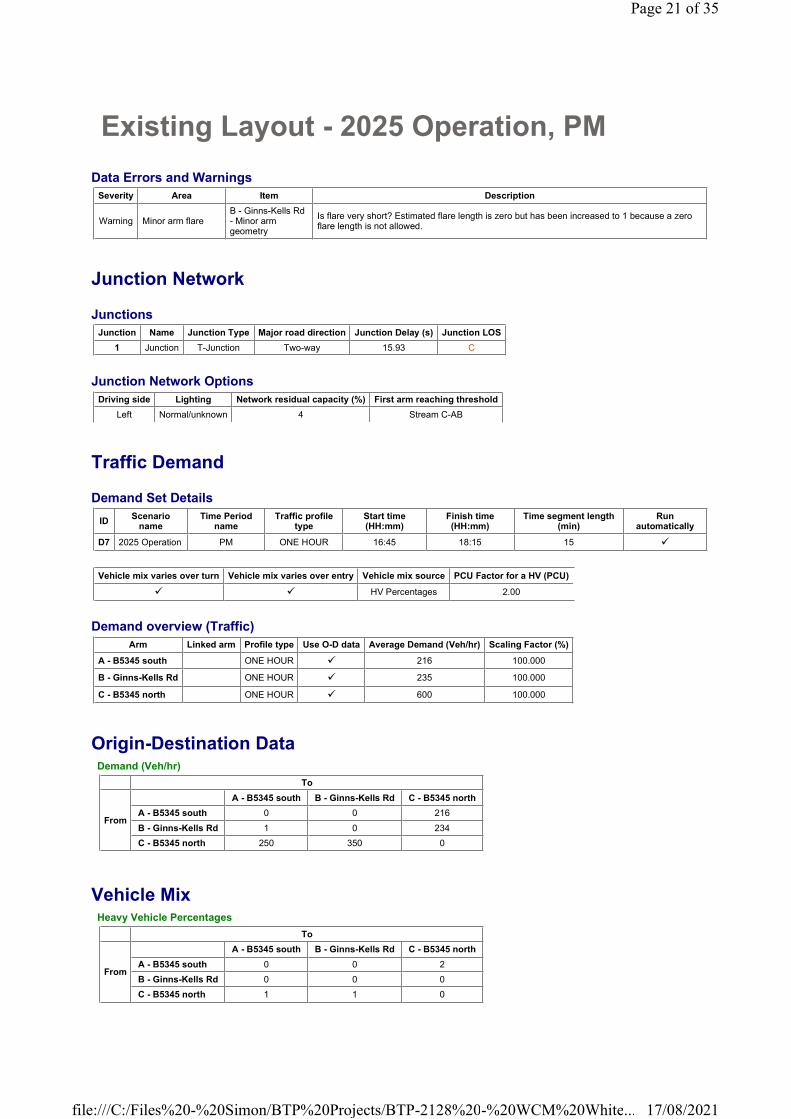
Existing Layout - 2025 Operation, PM
Data Errors and Warnings
Junction Network
Junctions
Junction Network Options
Traffic Demand
Demand Set Details
Demand overview (Traffic)
Origin-Destination Data
Vehicle Mix
Severity Area Item Description
Warning Minor arm flareB - Ginns-Kells Rd - Minor arm geometry
Is flare very short? Estimated flare length is zero but has been increased to 1 because a zero flare length is not allowed.
Junction Name Junction Type Major road direction Junction Delay (s) Junction LOS
1 Junction T-Junction Two-way 15.93 C
Driving side Lighting Network residual capacity (%) First arm reaching threshold
Left Normal/unknown 4 Stream C-AB
IDScenario
nameTime Period
nameTraffic profile
typeStart time (HH:mm)
Finish time (HH:mm)
Time segment length (min)
Run automatically
D7 2025 Operation PM ONE HOUR 16:45 18:15 15 �
Vehicle mix varies over turn Vehicle mix varies over entry Vehicle mix source PCU Factor for a HV (PCU)
� � HV Percentages 2.00
Arm Linked arm Profile type Use O-D data Average Demand (Veh/hr) Scaling Factor (%)
A - B5345 south ONE HOUR � 216 100.000
B - Ginns-Kells Rd ONE HOUR � 235 100.000
C - B5345 north ONE HOUR � 600 100.000
Demand (Veh/hr)
To
From
A - B5345 south B - Ginns-Kells Rd C - B5345 north
A - B5345 south 0 0 216
B - Ginns-Kells Rd 1 0 234
C - B5345 north 250 350 0
Heavy Vehicle Percentages
To
From
A - B5345 south B - Ginns-Kells Rd C - B5345 north
A - B5345 south 0 0 2
B - Ginns-Kells Rd 0 0 0
C - B5345 north 1 1 0
Page 21 of 35
17/08/2021file:///C:/Files%20-%20Simon/BTP%20Projects/BTP-2128%20-%20WCM%20White...

Results
Results Summary for whole modelled period
Main Results for each time segment
16:45 - 17:00
17:00 - 17:15
17:15 - 17:30
17:30 - 17:45
17:45 - 18:00
Stream Max RFC Max delay (s) Max Queue (Veh) Max LOSAverage Demand
(Veh/hr)Total Junction Arrivals (Veh)
B-C 0.41 9.75 0.7 A 215 322
B-A 0.00 15.98 0.0 C 0.92 1
C-AB 0.82 27.67 5.4 D 480 720
C-A 71 106
A-B 0 0
A-C 198 297
StreamTotal
Demand (Veh/hr)
Junction Arrivals
(Veh)
Capacity (Veh/hr)
RFCThroughput
(Veh/hr)Start queue
(Veh)End queue
(Veh)Delay (s) LOS
B-C 176 44 648 0.272 175 0.0 0.4 7.586 A
B-A 0.75 0.19 306 0.002 0.74 0.0 0.0 11.795 B
C-AB 360 90 702 0.513 355 0.0 1.2 10.278 B
C-A 92 23 92
A-B 0 0 0
A-C 163 41 163
StreamTotal
Demand (Veh/hr)
Junction Arrivals
(Veh)
Capacity (Veh/hr)
RFCThroughput
(Veh/hr)Start queue
(Veh)End queue
(Veh)Delay (s) LOS
B-C 210 53 639 0.329 210 0.4 0.5 8.378 A
B-A 0.90 0.22 274 0.003 0.90 0.0 0.0 13.187 B
C-AB 459 115 721 0.637 456 1.2 2.1 13.541 B
C-A 80 20 80
A-B 0 0 0
A-C 194 49 194
StreamTotal
Demand (Veh/hr)
Junction Arrivals
(Veh)
Capacity (Veh/hr)
RFCThroughput
(Veh/hr)Start queue
(Veh)End queue
(Veh)Delay (s) LOS
B-C 258 64 627 0.411 257 0.5 0.7 9.705 A
B-A 1 0.28 229 0.005 1 0.0 0.0 15.793 C
C-AB 615 154 748 0.822 603 2.1 5.0 24.205 C
C-A 46 12 46
A-B 0 0 0
A-C 238 59 238
StreamTotal
Demand (Veh/hr)
Junction Arrivals
(Veh)
Capacity (Veh/hr)
RFCThroughput
(Veh/hr)Start queue
(Veh)End queue
(Veh)Delay (s) LOS
B-C 258 64 627 0.411 258 0.7 0.7 9.746 A
B-A 1 0.28 226 0.005 1 0.0 0.0 15.977 C
C-AB 619 155 751 0.825 617 5.0 5.4 27.666 D
C-A 41 10 41
A-B 0 0 0
A-C 238 59 238
Page 22 of 35
17/08/2021file:///C:/Files%20-%20Simon/BTP%20Projects/BTP-2128%20-%20WCM%20White...

18:00 - 18:15
StreamTotal
Demand (Veh/hr)
Junction Arrivals
(Veh)
Capacity (Veh/hr)
RFCThroughput
(Veh/hr)Start queue
(Veh)End queue
(Veh)Delay (s) LOS
B-C 210 53 639 0.329 211 0.7 0.5 8.429 A
B-A 0.90 0.22 270 0.003 0.90 0.0 0.0 13.377 B
C-AB 464 116 726 0.640 477 5.4 2.3 15.308 C
C-A 75 19 75
A-B 0 0 0
A-C 194 49 194
StreamTotal
Demand (Veh/hr)
Junction Arrivals
(Veh)
Capacity (Veh/hr)
RFCThroughput
(Veh/hr)Start queue
(Veh)End queue
(Veh)Delay (s) LOS
B-C 176 44 648 0.272 177 0.5 0.4 7.647 A
B-A 0.75 0.19 304 0.002 0.76 0.0 0.0 11.892 B
C-AB 362 91 704 0.515 366 2.3 1.3 10.836 B
C-A 89 22 89
A-B 0 0 0
A-C 163 41 163
Page 23 of 35
17/08/2021file:///C:/Files%20-%20Simon/BTP%20Projects/BTP-2128%20-%20WCM%20White...
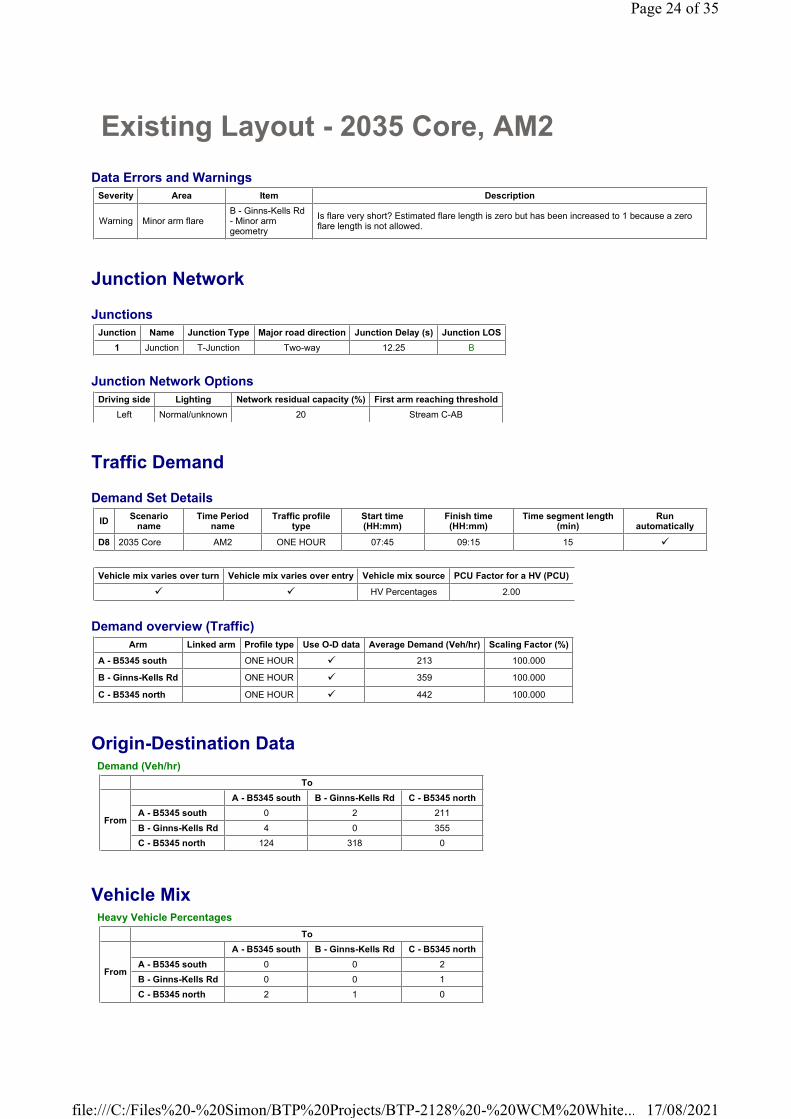
Existing Layout - 2035 Core, AM2
Data Errors and Warnings
Junction Network
Junctions
Junction Network Options
Traffic Demand
Demand Set Details
Demand overview (Traffic)
Origin-Destination Data
Vehicle Mix
Severity Area Item Description
Warning Minor arm flareB - Ginns-Kells Rd - Minor arm geometry
Is flare very short? Estimated flare length is zero but has been increased to 1 because a zero flare length is not allowed.
Junction Name Junction Type Major road direction Junction Delay (s) Junction LOS
1 Junction T-Junction Two-way 12.25 B
Driving side Lighting Network residual capacity (%) First arm reaching threshold
Left Normal/unknown 20 Stream C-AB
IDScenario
nameTime Period
nameTraffic profile
typeStart time (HH:mm)
Finish time (HH:mm)
Time segment length (min)
Run automatically
D8 2035 Core AM2 ONE HOUR 07:45 09:15 15 �
Vehicle mix varies over turn Vehicle mix varies over entry Vehicle mix source PCU Factor for a HV (PCU)
� � HV Percentages 2.00
Arm Linked arm Profile type Use O-D data Average Demand (Veh/hr) Scaling Factor (%)
A - B5345 south ONE HOUR � 213 100.000
B - Ginns-Kells Rd ONE HOUR � 359 100.000
C - B5345 north ONE HOUR � 442 100.000
Demand (Veh/hr)
To
From
A - B5345 south B - Ginns-Kells Rd C - B5345 north
A - B5345 south 0 2 211
B - Ginns-Kells Rd 4 0 355
C - B5345 north 124 318 0
Heavy Vehicle Percentages
To
From
A - B5345 south B - Ginns-Kells Rd C - B5345 north
A - B5345 south 0 0 2
B - Ginns-Kells Rd 0 0 1
C - B5345 north 2 1 0
Page 24 of 35
17/08/2021file:///C:/Files%20-%20Simon/BTP%20Projects/BTP-2128%20-%20WCM%20White...
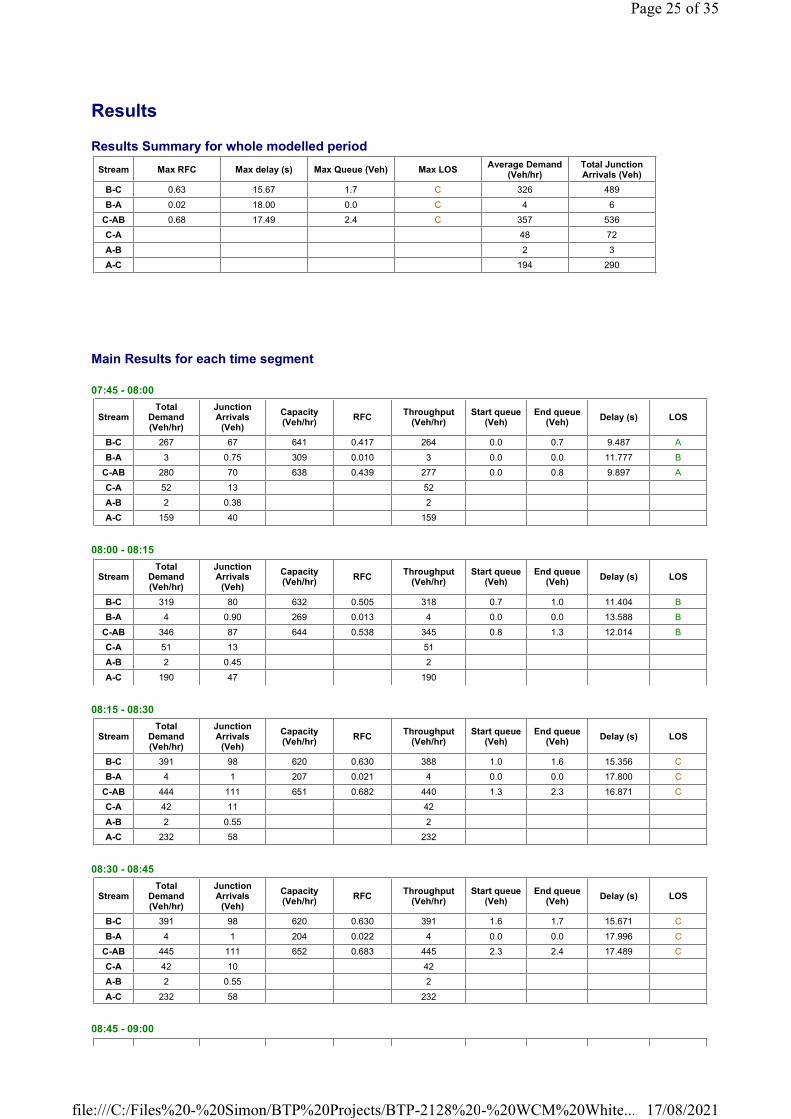
Results
Results Summary for whole modelled period
Main Results for each time segment
07:45 - 08:00
08:00 - 08:15
08:15 - 08:30
08:30 - 08:45
08:45 - 09:00
Stream Max RFC Max delay (s) Max Queue (Veh) Max LOSAverage Demand
(Veh/hr)Total Junction Arrivals (Veh)
B-C 0.63 15.67 1.7 C 326 489
B-A 0.02 18.00 0.0 C 4 6
C-AB 0.68 17.49 2.4 C 357 536
C-A 48 72
A-B 2 3
A-C 194 290
StreamTotal
Demand (Veh/hr)
Junction Arrivals
(Veh)
Capacity (Veh/hr)
RFCThroughput
(Veh/hr)Start queue
(Veh)End queue
(Veh)Delay (s) LOS
B-C 267 67 641 0.417 264 0.0 0.7 9.487 A
B-A 3 0.75 309 0.010 3 0.0 0.0 11.777 B
C-AB 280 70 638 0.439 277 0.0 0.8 9.897 A
C-A 52 13 52
A-B 2 0.38 2
A-C 159 40 159
StreamTotal
Demand (Veh/hr)
Junction Arrivals
(Veh)
Capacity (Veh/hr)
RFCThroughput
(Veh/hr)Start queue
(Veh)End queue
(Veh)Delay (s) LOS
B-C 319 80 632 0.505 318 0.7 1.0 11.404 B
B-A 4 0.90 269 0.013 4 0.0 0.0 13.588 B
C-AB 346 87 644 0.538 345 0.8 1.3 12.014 B
C-A 51 13 51
A-B 2 0.45 2
A-C 190 47 190
StreamTotal
Demand (Veh/hr)
Junction Arrivals
(Veh)
Capacity (Veh/hr)
RFCThroughput
(Veh/hr)Start queue
(Veh)End queue
(Veh)Delay (s) LOS
B-C 391 98 620 0.630 388 1.0 1.6 15.356 C
B-A 4 1 207 0.021 4 0.0 0.0 17.800 C
C-AB 444 111 651 0.682 440 1.3 2.3 16.871 C
C-A 42 11 42
A-B 2 0.55 2
A-C 232 58 232
StreamTotal
Demand (Veh/hr)
Junction Arrivals
(Veh)
Capacity (Veh/hr)
RFCThroughput
(Veh/hr)Start queue
(Veh)End queue
(Veh)Delay (s) LOS
B-C 391 98 620 0.630 391 1.6 1.7 15.671 C
B-A 4 1 204 0.022 4 0.0 0.0 17.996 C
C-AB 445 111 652 0.683 445 2.3 2.4 17.489 C
C-A 42 10 42
A-B 2 0.55 2
A-C 232 58 232
Page 25 of 35
17/08/2021file:///C:/Files%20-%20Simon/BTP%20Projects/BTP-2128%20-%20WCM%20White...
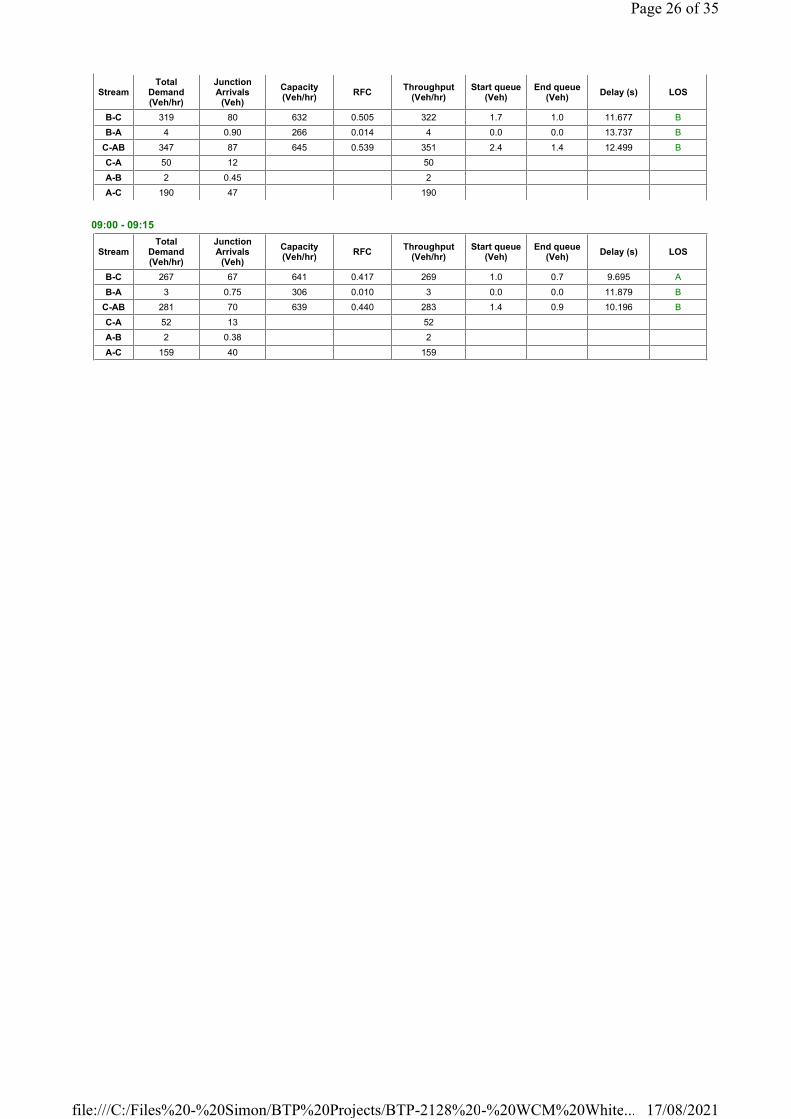
09:00 - 09:15
StreamTotal
Demand (Veh/hr)
Junction Arrivals
(Veh)
Capacity (Veh/hr)
RFCThroughput
(Veh/hr)Start queue
(Veh)End queue
(Veh)Delay (s) LOS
B-C 319 80 632 0.505 322 1.7 1.0 11.677 B
B-A 4 0.90 266 0.014 4 0.0 0.0 13.737 B
C-AB 347 87 645 0.539 351 2.4 1.4 12.499 B
C-A 50 12 50
A-B 2 0.45 2
A-C 190 47 190
StreamTotal
Demand (Veh/hr)
Junction Arrivals
(Veh)
Capacity (Veh/hr)
RFCThroughput
(Veh/hr)Start queue
(Veh)End queue
(Veh)Delay (s) LOS
B-C 267 67 641 0.417 269 1.0 0.7 9.695 A
B-A 3 0.75 306 0.010 3 0.0 0.0 11.879 B
C-AB 281 70 639 0.440 283 1.4 0.9 10.196 B
C-A 52 13 52
A-B 2 0.38 2
A-C 159 40 159
Page 26 of 35
17/08/2021file:///C:/Files%20-%20Simon/BTP%20Projects/BTP-2128%20-%20WCM%20White...
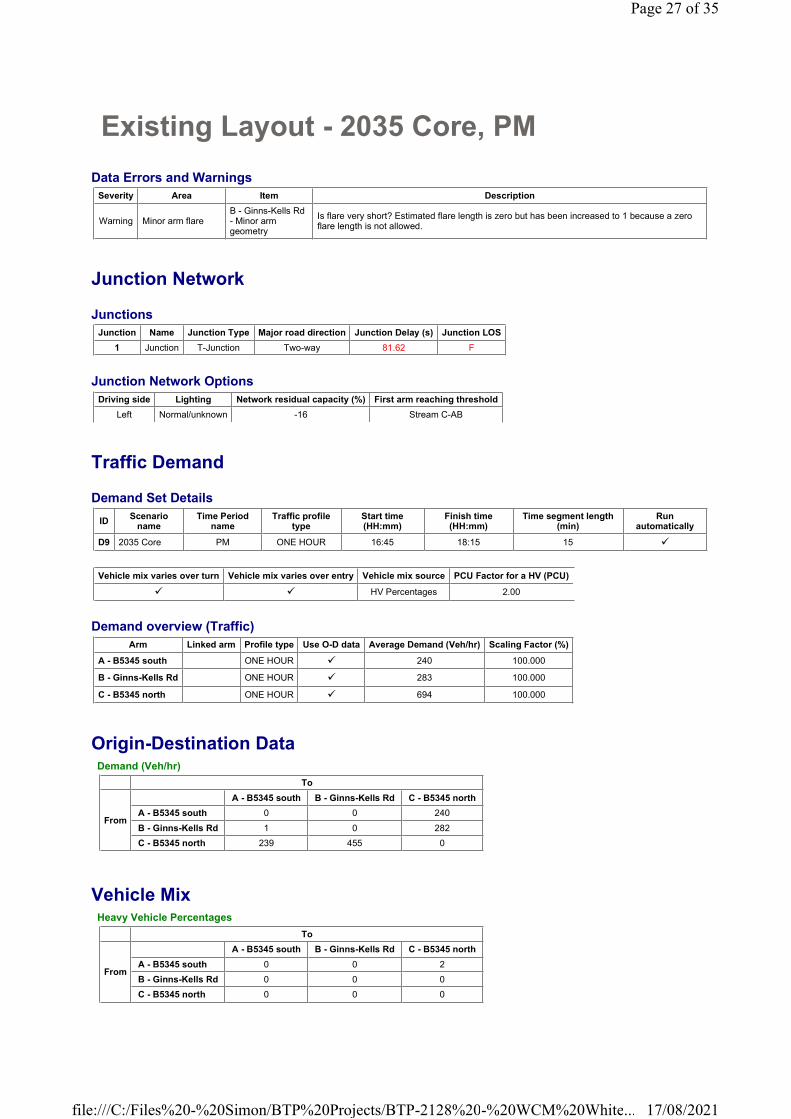
Existing Layout - 2035 Core, PM
Data Errors and Warnings
Junction Network
Junctions
Junction Network Options
Traffic Demand
Demand Set Details
Demand overview (Traffic)
Origin-Destination Data
Vehicle Mix
Severity Area Item Description
Warning Minor arm flareB - Ginns-Kells Rd - Minor arm geometry
Is flare very short? Estimated flare length is zero but has been increased to 1 because a zero flare length is not allowed.
Junction Name Junction Type Major road direction Junction Delay (s) Junction LOS
1 Junction T-Junction Two-way 81.62 F
Driving side Lighting Network residual capacity (%) First arm reaching threshold
Left Normal/unknown -16 Stream C-AB
IDScenario
nameTime Period
nameTraffic profile
typeStart time (HH:mm)
Finish time (HH:mm)
Time segment length (min)
Run automatically
D9 2035 Core PM ONE HOUR 16:45 18:15 15 �
Vehicle mix varies over turn Vehicle mix varies over entry Vehicle mix source PCU Factor for a HV (PCU)
� � HV Percentages 2.00
Arm Linked arm Profile type Use O-D data Average Demand (Veh/hr) Scaling Factor (%)
A - B5345 south ONE HOUR � 240 100.000
B - Ginns-Kells Rd ONE HOUR � 283 100.000
C - B5345 north ONE HOUR � 694 100.000
Demand (Veh/hr)
To
From
A - B5345 south B - Ginns-Kells Rd C - B5345 north
A - B5345 south 0 0 240
B - Ginns-Kells Rd 1 0 282
C - B5345 north 239 455 0
Heavy Vehicle Percentages
To
From
A - B5345 south B - Ginns-Kells Rd C - B5345 north
A - B5345 south 0 0 2
B - Ginns-Kells Rd 0 0 0
C - B5345 north 0 0 0
Page 27 of 35
17/08/2021file:///C:/Files%20-%20Simon/BTP%20Projects/BTP-2128%20-%20WCM%20White...
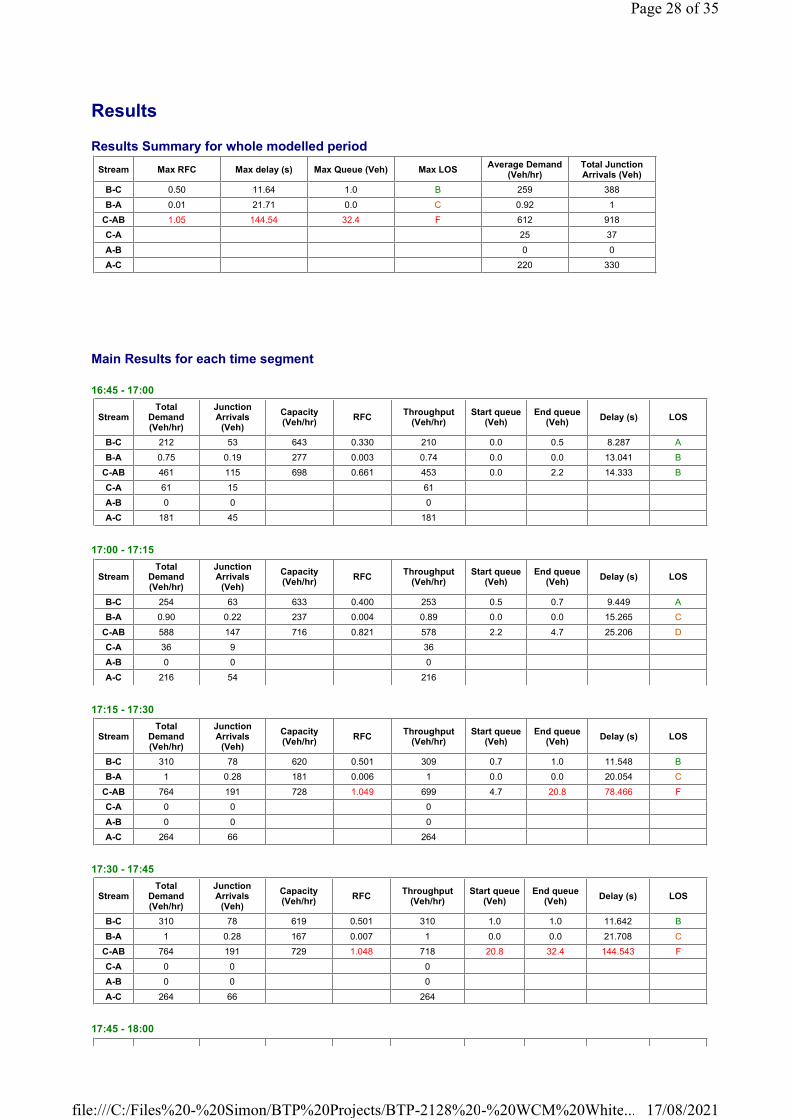
Results
Results Summary for whole modelled period
Main Results for each time segment
16:45 - 17:00
17:00 - 17:15
17:15 - 17:30
17:30 - 17:45
17:45 - 18:00
Stream Max RFC Max delay (s) Max Queue (Veh) Max LOSAverage Demand
(Veh/hr)Total Junction Arrivals (Veh)
B-C 0.50 11.64 1.0 B 259 388
B-A 0.01 21.71 0.0 C 0.92 1
C-AB 1.05 144.54 32.4 F 612 918
C-A 25 37
A-B 0 0
A-C 220 330
StreamTotal
Demand (Veh/hr)
Junction Arrivals
(Veh)
Capacity (Veh/hr)
RFCThroughput
(Veh/hr)Start queue
(Veh)End queue
(Veh)Delay (s) LOS
B-C 212 53 643 0.330 210 0.0 0.5 8.287 A
B-A 0.75 0.19 277 0.003 0.74 0.0 0.0 13.041 B
C-AB 461 115 698 0.661 453 0.0 2.2 14.333 B
C-A 61 15 61
A-B 0 0 0
A-C 181 45 181
StreamTotal
Demand (Veh/hr)
Junction Arrivals
(Veh)
Capacity (Veh/hr)
RFCThroughput
(Veh/hr)Start queue
(Veh)End queue
(Veh)Delay (s) LOS
B-C 254 63 633 0.400 253 0.5 0.7 9.449 A
B-A 0.90 0.22 237 0.004 0.89 0.0 0.0 15.265 C
C-AB 588 147 716 0.821 578 2.2 4.7 25.206 D
C-A 36 9 36
A-B 0 0 0
A-C 216 54 216
StreamTotal
Demand (Veh/hr)
Junction Arrivals
(Veh)
Capacity (Veh/hr)
RFCThroughput
(Veh/hr)Start queue
(Veh)End queue
(Veh)Delay (s) LOS
B-C 310 78 620 0.501 309 0.7 1.0 11.548 B
B-A 1 0.28 181 0.006 1 0.0 0.0 20.054 C
C-AB 764 191 728 1.049 699 4.7 20.8 78.466 F
C-A 0 0 0
A-B 0 0 0
A-C 264 66 264
StreamTotal
Demand (Veh/hr)
Junction Arrivals
(Veh)
Capacity (Veh/hr)
RFCThroughput
(Veh/hr)Start queue
(Veh)End queue
(Veh)Delay (s) LOS
B-C 310 78 619 0.501 310 1.0 1.0 11.642 B
B-A 1 0.28 167 0.007 1 0.0 0.0 21.708 C
C-AB 764 191 729 1.048 718 20.8 32.4 144.543 F
C-A 0 0 0
A-B 0 0 0
A-C 264 66 264
Page 28 of 35
17/08/2021file:///C:/Files%20-%20Simon/BTP%20Projects/BTP-2128%20-%20WCM%20White...
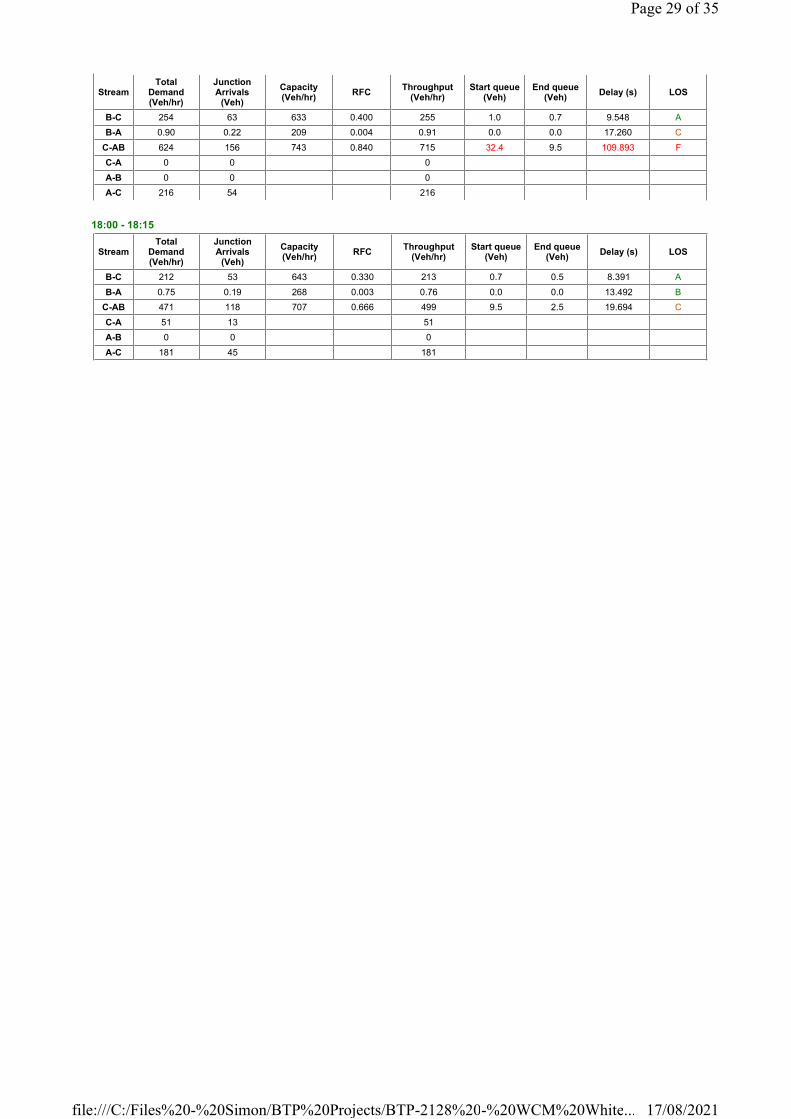
18:00 - 18:15
StreamTotal
Demand (Veh/hr)
Junction Arrivals
(Veh)
Capacity (Veh/hr)
RFCThroughput
(Veh/hr)Start queue
(Veh)End queue
(Veh)Delay (s) LOS
B-C 254 63 633 0.400 255 1.0 0.7 9.548 A
B-A 0.90 0.22 209 0.004 0.91 0.0 0.0 17.260 C
C-AB 624 156 743 0.840 715 32.4 9.5 109.893 F
C-A 0 0 0
A-B 0 0 0
A-C 216 54 216
StreamTotal
Demand (Veh/hr)
Junction Arrivals
(Veh)
Capacity (Veh/hr)
RFCThroughput
(Veh/hr)Start queue
(Veh)End queue
(Veh)Delay (s) LOS
B-C 212 53 643 0.330 213 0.7 0.5 8.391 A
B-A 0.75 0.19 268 0.003 0.76 0.0 0.0 13.492 B
C-AB 471 118 707 0.666 499 9.5 2.5 19.694 C
C-A 51 13 51
A-B 0 0 0
A-C 181 45 181
Page 29 of 35
17/08/2021file:///C:/Files%20-%20Simon/BTP%20Projects/BTP-2128%20-%20WCM%20White...
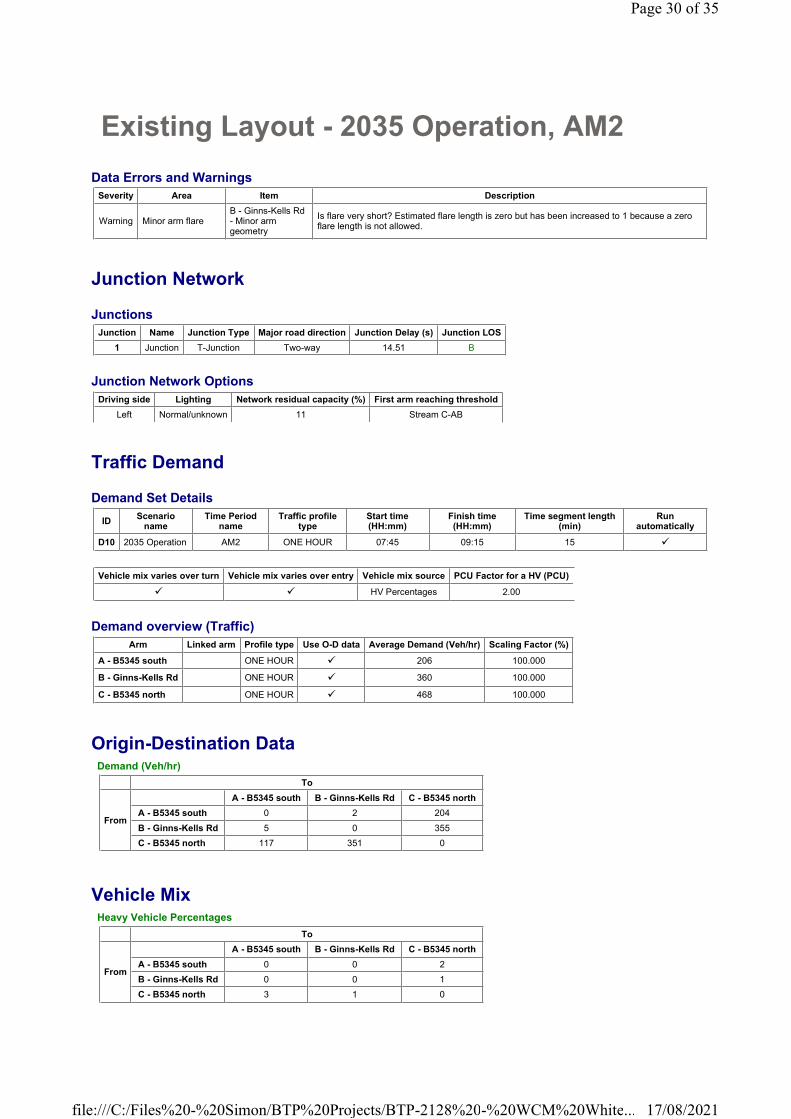
Existing Layout - 2035 Operation, AM2
Data Errors and Warnings
Junction Network
Junctions
Junction Network Options
Traffic Demand
Demand Set Details
Demand overview (Traffic)
Origin-Destination Data
Vehicle Mix
Severity Area Item Description
Warning Minor arm flareB - Ginns-Kells Rd - Minor arm geometry
Is flare very short? Estimated flare length is zero but has been increased to 1 because a zero flare length is not allowed.
Junction Name Junction Type Major road direction Junction Delay (s) Junction LOS
1 Junction T-Junction Two-way 14.51 B
Driving side Lighting Network residual capacity (%) First arm reaching threshold
Left Normal/unknown 11 Stream C-AB
IDScenario
nameTime Period
nameTraffic profile
typeStart time (HH:mm)
Finish time (HH:mm)
Time segment length (min)
Run automatically
D10 2035 Operation AM2 ONE HOUR 07:45 09:15 15 �
Vehicle mix varies over turn Vehicle mix varies over entry Vehicle mix source PCU Factor for a HV (PCU)
� � HV Percentages 2.00
Arm Linked arm Profile type Use O-D data Average Demand (Veh/hr) Scaling Factor (%)
A - B5345 south ONE HOUR � 206 100.000
B - Ginns-Kells Rd ONE HOUR � 360 100.000
C - B5345 north ONE HOUR � 468 100.000
Demand (Veh/hr)
To
From
A - B5345 south B - Ginns-Kells Rd C - B5345 north
A - B5345 south 0 2 204
B - Ginns-Kells Rd 5 0 355
C - B5345 north 117 351 0
Heavy Vehicle Percentages
To
From
A - B5345 south B - Ginns-Kells Rd C - B5345 north
A - B5345 south 0 0 2
B - Ginns-Kells Rd 0 0 1
C - B5345 north 3 1 0
Page 30 of 35
17/08/2021file:///C:/Files%20-%20Simon/BTP%20Projects/BTP-2128%20-%20WCM%20White...
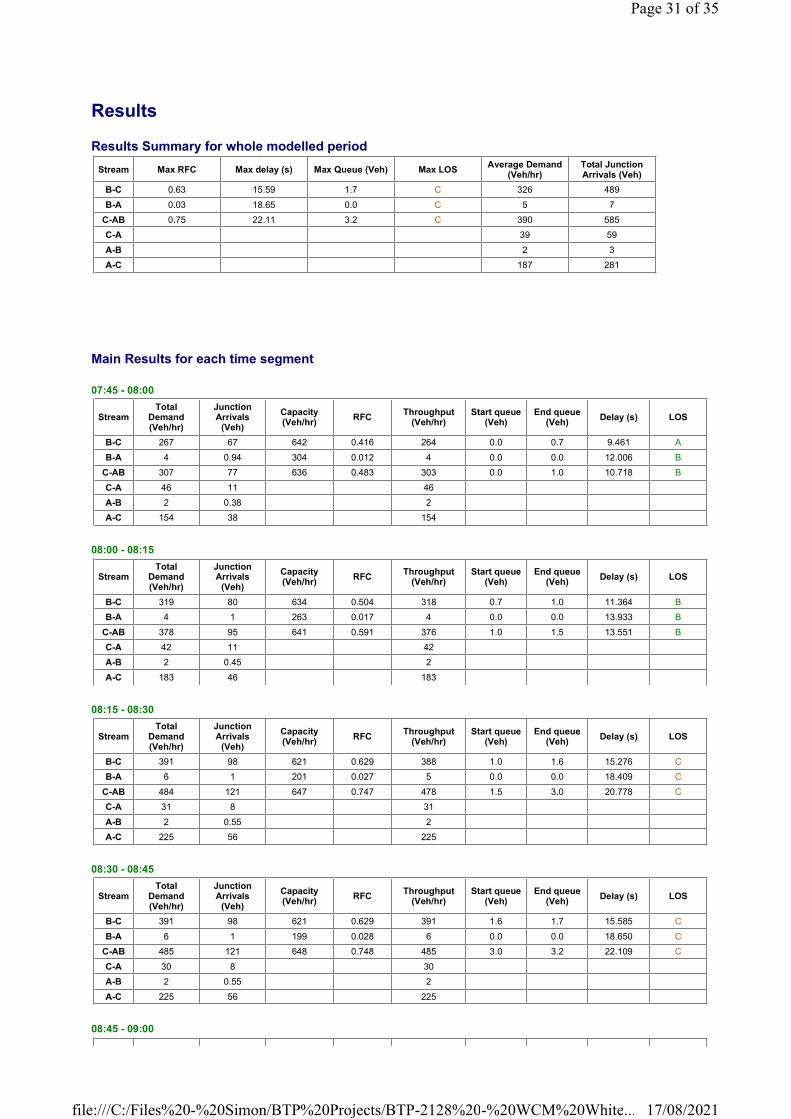
Results
Results Summary for whole modelled period
Main Results for each time segment
07:45 - 08:00
08:00 - 08:15
08:15 - 08:30
08:30 - 08:45
08:45 - 09:00
Stream Max RFC Max delay (s) Max Queue (Veh) Max LOSAverage Demand
(Veh/hr)Total Junction Arrivals (Veh)
B-C 0.63 15.59 1.7 C 326 489
B-A 0.03 18.65 0.0 C 5 7
C-AB 0.75 22.11 3.2 C 390 585
C-A 39 59
A-B 2 3
A-C 187 281
StreamTotal
Demand (Veh/hr)
Junction Arrivals
(Veh)
Capacity (Veh/hr)
RFCThroughput
(Veh/hr)Start queue
(Veh)End queue
(Veh)Delay (s) LOS
B-C 267 67 642 0.416 264 0.0 0.7 9.461 A
B-A 4 0.94 304 0.012 4 0.0 0.0 12.006 B
C-AB 307 77 636 0.483 303 0.0 1.0 10.718 B
C-A 46 11 46
A-B 2 0.38 2
A-C 154 38 154
StreamTotal
Demand (Veh/hr)
Junction Arrivals
(Veh)
Capacity (Veh/hr)
RFCThroughput
(Veh/hr)Start queue
(Veh)End queue
(Veh)Delay (s) LOS
B-C 319 80 634 0.504 318 0.7 1.0 11.364 B
B-A 4 1 263 0.017 4 0.0 0.0 13.933 B
C-AB 378 95 641 0.591 376 1.0 1.5 13.551 B
C-A 42 11 42
A-B 2 0.45 2
A-C 183 46 183
StreamTotal
Demand (Veh/hr)
Junction Arrivals
(Veh)
Capacity (Veh/hr)
RFCThroughput
(Veh/hr)Start queue
(Veh)End queue
(Veh)Delay (s) LOS
B-C 391 98 621 0.629 388 1.0 1.6 15.276 C
B-A 6 1 201 0.027 5 0.0 0.0 18.409 C
C-AB 484 121 647 0.747 478 1.5 3.0 20.778 C
C-A 31 8 31
A-B 2 0.55 2
A-C 225 56 225
StreamTotal
Demand (Veh/hr)
Junction Arrivals
(Veh)
Capacity (Veh/hr)
RFCThroughput
(Veh/hr)Start queue
(Veh)End queue
(Veh)Delay (s) LOS
B-C 391 98 621 0.629 391 1.6 1.7 15.585 C
B-A 6 1 199 0.028 6 0.0 0.0 18.650 C
C-AB 485 121 648 0.748 485 3.0 3.2 22.109 C
C-A 30 8 30
A-B 2 0.55 2
A-C 225 56 225
Page 31 of 35
17/08/2021file:///C:/Files%20-%20Simon/BTP%20Projects/BTP-2128%20-%20WCM%20White...

09:00 - 09:15
StreamTotal
Demand (Veh/hr)
Junction Arrivals
(Veh)
Capacity (Veh/hr)
RFCThroughput
(Veh/hr)Start queue
(Veh)End queue
(Veh)Delay (s) LOS
B-C 319 80 633 0.504 322 1.7 1.0 11.635 B
B-A 4 1 259 0.017 5 0.0 0.0 14.121 B
C-AB 380 95 642 0.592 386 3.2 1.7 14.449 B
C-A 41 10 41
A-B 2 0.45 2
A-C 183 46 183
StreamTotal
Demand (Veh/hr)
Junction Arrivals
(Veh)
Capacity (Veh/hr)
RFCThroughput
(Veh/hr)Start queue
(Veh)End queue
(Veh)Delay (s) LOS
B-C 267 67 642 0.416 269 1.0 0.7 9.668 A
B-A 4 0.94 301 0.013 4 0.0 0.0 12.122 B
C-AB 308 77 636 0.484 310 1.7 1.1 11.154 B
C-A 45 11 45
A-B 2 0.38 2
A-C 154 38 154
Page 32 of 35
17/08/2021file:///C:/Files%20-%20Simon/BTP%20Projects/BTP-2128%20-%20WCM%20White...
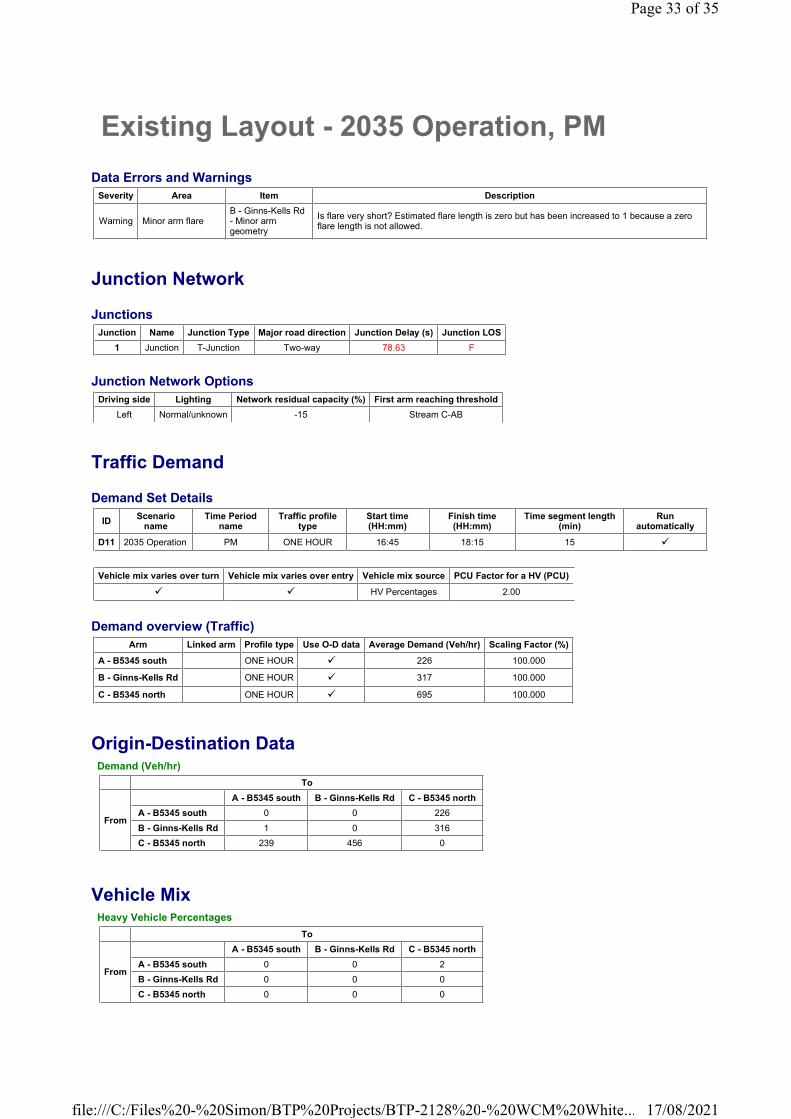
Existing Layout - 2035 Operation, PM
Data Errors and Warnings
Junction Network
Junctions
Junction Network Options
Traffic Demand
Demand Set Details
Demand overview (Traffic)
Origin-Destination Data
Vehicle Mix
Severity Area Item Description
Warning Minor arm flareB - Ginns-Kells Rd - Minor arm geometry
Is flare very short? Estimated flare length is zero but has been increased to 1 because a zero flare length is not allowed.
Junction Name Junction Type Major road direction Junction Delay (s) Junction LOS
1 Junction T-Junction Two-way 78.63 F
Driving side Lighting Network residual capacity (%) First arm reaching threshold
Left Normal/unknown -15 Stream C-AB
IDScenario
nameTime Period
nameTraffic profile
typeStart time (HH:mm)
Finish time (HH:mm)
Time segment length (min)
Run automatically
D11 2035 Operation PM ONE HOUR 16:45 18:15 15 �
Vehicle mix varies over turn Vehicle mix varies over entry Vehicle mix source PCU Factor for a HV (PCU)
� � HV Percentages 2.00
Arm Linked arm Profile type Use O-D data Average Demand (Veh/hr) Scaling Factor (%)
A - B5345 south ONE HOUR � 226 100.000
B - Ginns-Kells Rd ONE HOUR � 317 100.000
C - B5345 north ONE HOUR � 695 100.000
Demand (Veh/hr)
To
From
A - B5345 south B - Ginns-Kells Rd C - B5345 north
A - B5345 south 0 0 226
B - Ginns-Kells Rd 1 0 316
C - B5345 north 239 456 0
Heavy Vehicle Percentages
To
From
A - B5345 south B - Ginns-Kells Rd C - B5345 north
A - B5345 south 0 0 2
B - Ginns-Kells Rd 0 0 0
C - B5345 north 0 0 0
Page 33 of 35
17/08/2021file:///C:/Files%20-%20Simon/BTP%20Projects/BTP-2128%20-%20WCM%20White...
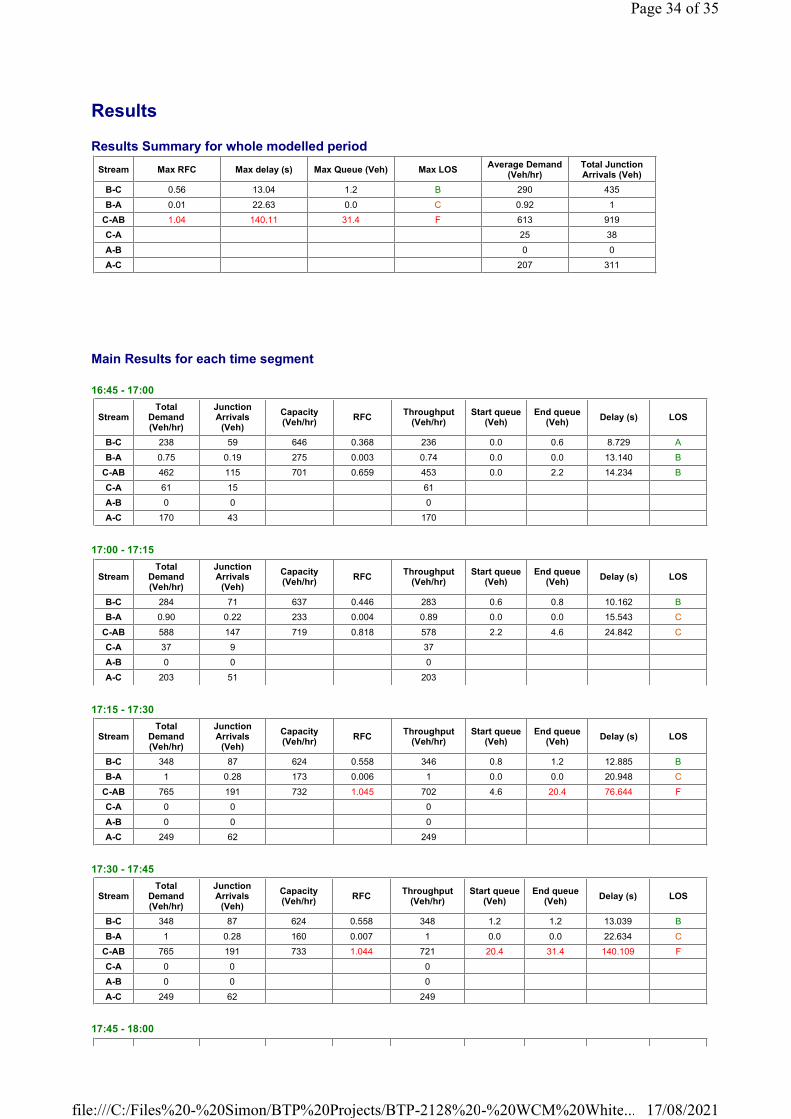
Results
Results Summary for whole modelled period
Main Results for each time segment
16:45 - 17:00
17:00 - 17:15
17:15 - 17:30
17:30 - 17:45
17:45 - 18:00
Stream Max RFC Max delay (s) Max Queue (Veh) Max LOSAverage Demand
(Veh/hr)Total Junction Arrivals (Veh)
B-C 0.56 13.04 1.2 B 290 435
B-A 0.01 22.63 0.0 C 0.92 1
C-AB 1.04 140.11 31.4 F 613 919
C-A 25 38
A-B 0 0
A-C 207 311
StreamTotal
Demand (Veh/hr)
Junction Arrivals
(Veh)
Capacity (Veh/hr)
RFCThroughput
(Veh/hr)Start queue
(Veh)End queue
(Veh)Delay (s) LOS
B-C 238 59 646 0.368 236 0.0 0.6 8.729 A
B-A 0.75 0.19 275 0.003 0.74 0.0 0.0 13.140 B
C-AB 462 115 701 0.659 453 0.0 2.2 14.234 B
C-A 61 15 61
A-B 0 0 0
A-C 170 43 170
StreamTotal
Demand (Veh/hr)
Junction Arrivals
(Veh)
Capacity (Veh/hr)
RFCThroughput
(Veh/hr)Start queue
(Veh)End queue
(Veh)Delay (s) LOS
B-C 284 71 637 0.446 283 0.6 0.8 10.162 B
B-A 0.90 0.22 233 0.004 0.89 0.0 0.0 15.543 C
C-AB 588 147 719 0.818 578 2.2 4.6 24.842 C
C-A 37 9 37
A-B 0 0 0
A-C 203 51 203
StreamTotal
Demand (Veh/hr)
Junction Arrivals
(Veh)
Capacity (Veh/hr)
RFCThroughput
(Veh/hr)Start queue
(Veh)End queue
(Veh)Delay (s) LOS
B-C 348 87 624 0.558 346 0.8 1.2 12.885 B
B-A 1 0.28 173 0.006 1 0.0 0.0 20.948 C
C-AB 765 191 732 1.045 702 4.6 20.4 76.644 F
C-A 0 0 0
A-B 0 0 0
A-C 249 62 249
StreamTotal
Demand (Veh/hr)
Junction Arrivals
(Veh)
Capacity (Veh/hr)
RFCThroughput
(Veh/hr)Start queue
(Veh)End queue
(Veh)Delay (s) LOS
B-C 348 87 624 0.558 348 1.2 1.2 13.039 B
B-A 1 0.28 160 0.007 1 0.0 0.0 22.634 C
C-AB 765 191 733 1.044 721 20.4 31.4 140.109 F
C-A 0 0 0
A-B 0 0 0
A-C 249 62 249
Page 34 of 35
17/08/2021file:///C:/Files%20-%20Simon/BTP%20Projects/BTP-2128%20-%20WCM%20White...
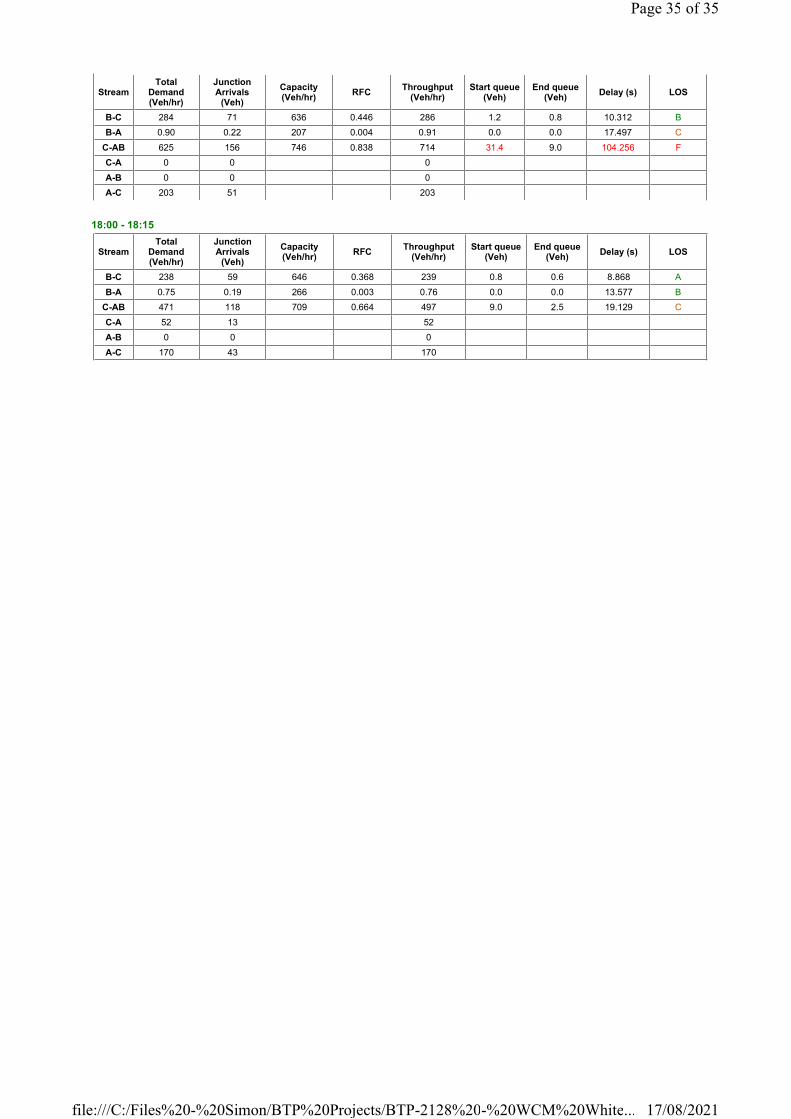
18:00 - 18:15
StreamTotal
Demand (Veh/hr)
Junction Arrivals
(Veh)
Capacity (Veh/hr)
RFCThroughput
(Veh/hr)Start queue
(Veh)End queue
(Veh)Delay (s) LOS
B-C 284 71 636 0.446 286 1.2 0.8 10.312 B
B-A 0.90 0.22 207 0.004 0.91 0.0 0.0 17.497 C
C-AB 625 156 746 0.838 714 31.4 9.0 104.256 F
C-A 0 0 0
A-B 0 0 0
A-C 203 51 203
StreamTotal
Demand (Veh/hr)
Junction Arrivals
(Veh)
Capacity (Veh/hr)
RFCThroughput
(Veh/hr)Start queue
(Veh)End queue
(Veh)Delay (s) LOS
B-C 238 59 646 0.368 239 0.8 0.6 8.868 A
B-A 0.75 0.19 266 0.003 0.76 0.0 0.0 13.577 B
C-AB 471 118 709 0.664 497 9.0 2.5 19.129 C
C-A 52 13 52
A-B 0 0 0
A-C 170 43 170
Page 35 of 35
17/08/2021file:///C:/Files%20-%20Simon/BTP%20Projects/BTP-2128%20-%20WCM%20White...
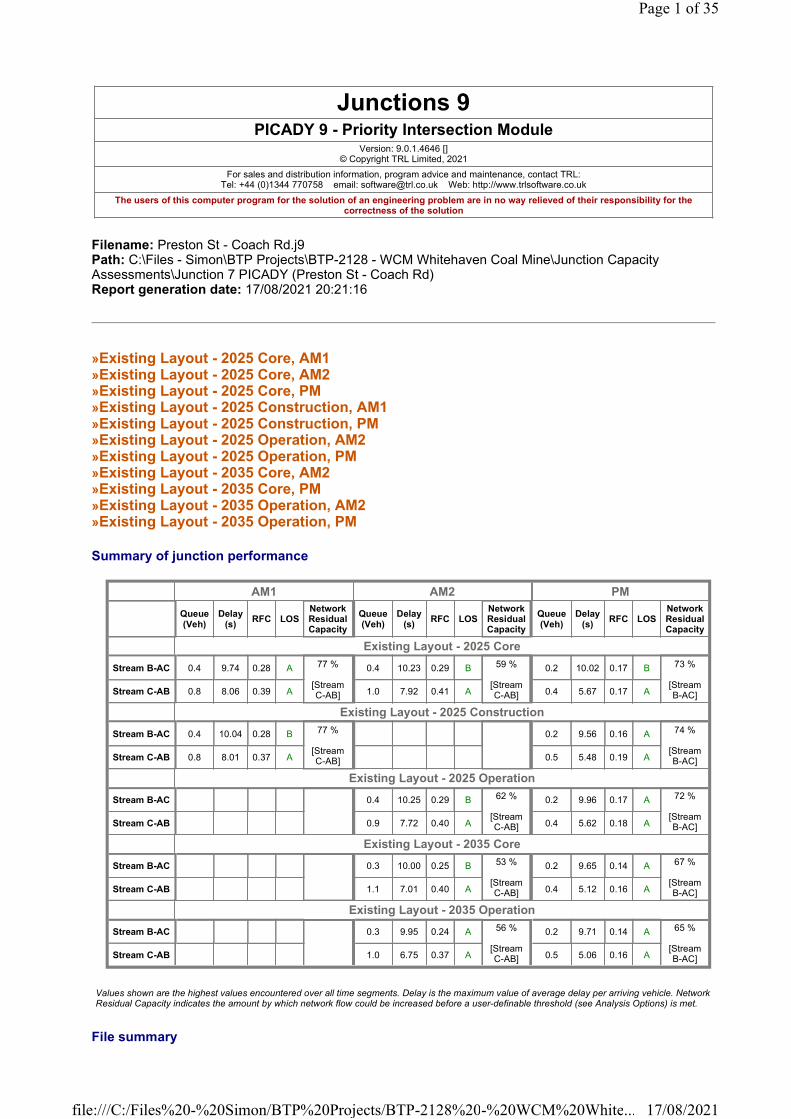
Filename: Preston St - Coach Rd.j9Path: C:\Files - Simon\BTP Projects\BTP-2128 - WCM Whitehaven Coal Mine\Junction Capacity Assessments\Junction 7 PICADY (Preston St - Coach Rd)Report generation date: 17/08/2021 20:21:16
»Existing Layout - 2025 Core, AM1»Existing Layout - 2025 Core, AM2»Existing Layout - 2025 Core, PM»Existing Layout - 2025 Construction, AM1»Existing Layout - 2025 Construction, PM»Existing Layout - 2025 Operation, AM2»Existing Layout - 2025 Operation, PM»Existing Layout - 2035 Core, AM2»Existing Layout - 2035 Core, PM»Existing Layout - 2035 Operation, AM2»Existing Layout - 2035 Operation, PM
Summary of junction performance
Junctions 9PICADY 9 - Priority Intersection Module
Version: 9.0.1.4646 [] © Copyright TRL Limited, 2021
For sales and distribution information, program advice and maintenance, contact TRL:Tel: +44 (0)1344 770758 email: [email protected] Web: http://www.trlsoftware.co.uk
The users of this computer program for the solution of an engineering problem are in no way relieved of their responsibility for the correctness of the solution
AM1 AM2 PM
Queue (Veh)
Delay (s)
RFC LOSNetwork Residual Capacity
Queue (Veh)
Delay (s)
RFC LOSNetwork Residual Capacity
Queue (Veh)
Delay (s)
RFC LOSNetwork Residual Capacity
Existing Layout - 2025 Core
Stream B-AC 0.4 9.74 0.28 A 77 %
[Stream C-AB]
0.4 10.23 0.29 B 59 %
[Stream C-AB]
0.2 10.02 0.17 B 73 %
[Stream B-AC]Stream C-AB 0.8 8.06 0.39 A 1.0 7.92 0.41 A 0.4 5.67 0.17 A
Existing Layout - 2025 Construction
Stream B-AC 0.4 10.04 0.28 B 77 %
[Stream C-AB]
0.2 9.56 0.16 A 74 %
[Stream B-AC]Stream C-AB 0.8 8.01 0.37 A 0.5 5.48 0.19 A
Existing Layout - 2025 Operation
Stream B-AC 0.4 10.25 0.29 B 62 %
[Stream C-AB]
0.2 9.96 0.17 A 72 %
[Stream B-AC]Stream C-AB 0.9 7.72 0.40 A 0.4 5.62 0.18 A
Existing Layout - 2035 Core
Stream B-AC 0.3 10.00 0.25 B 53 %
[Stream C-AB]
0.2 9.65 0.14 A 67 %
[Stream B-AC]Stream C-AB 1.1 7.01 0.40 A 0.4 5.12 0.16 A
Existing Layout - 2035 Operation
Stream B-AC 0.3 9.95 0.24 A 56 %
[Stream C-AB]
0.2 9.71 0.14 A 65 %
[Stream B-AC]Stream C-AB 1.0 6.75 0.37 A 0.5 5.06 0.16 A
Values shown are the highest values encountered over all time segments. Delay is the maximum value of average delay per arriving vehicle. Network Residual Capacity indicates the amount by which network flow could be increased before a user-definable threshold (see Analysis Options) is met.
File summary
Page 1 of 35
17/08/2021file:///C:/Files%20-%20Simon/BTP%20Projects/BTP-2128%20-%20WCM%20White...

Units
Analysis Options
Demand Set Summary
Analysis Set Details
File Description
Title Preston St / Coach Rd Jcn
Location Whitehaven
Site number
Date 17/08/2021
Version
Status
Identifier
Client WCM
Jobnumber BTP-2128
Enumerator SJE
Description Re-run of previous AECOM model for updated WCTM flow data
Distance units
Speed units
Traffic units input
Traffic units results
Flow units
Average delay units
Total delay units
Rate of delay units
m kph Veh Veh perHour s -Min perMin
Vehicle length (m)
Calculate Queue Percentiles
Calculate detailed queueing delay
Calculate residual capacity
Residual capacity criteria
type
RFC Threshold
Average Delay threshold (s)
Queue threshold
(PCU)
5.75 � Delay 0.85 36.00 20.00
ID Scenario nameTime Period
nameTraffic profile
typeStart time (HH:mm)
Finish time (HH:mm)
Time segment length (min)
Run automatically
D1 2025 Core AM1 ONE HOUR 06:45 08:15 15 �
D2 2025 Core AM2 ONE HOUR 07:45 09:15 15 �
D3 2025 Core PM ONE HOUR 16:45 18:15 15 �
D4 2025 Construction AM1 ONE HOUR 06:45 08:15 15 �
D5 2025 Construction PM ONE HOUR 16:45 18:15 15 �
D6 2025 Operation AM2 ONE HOUR 07:45 09:15 15 �
D7 2025 Operation PM ONE HOUR 16:45 18:15 15 �
D8 2035 Core AM2 ONE HOUR 07:45 09:15 15 �
D9 2035 Core PM ONE HOUR 16:45 18:15 15 �
D10 2035 Operation AM2 ONE HOUR 07:45 09:15 15 �
D11 2035 Operation PM ONE HOUR 16:45 18:15 15 �
ID Name Include in report Network flow scaling factor (%) Network capacity scaling factor (%)
A1 Existing Layout � 100.000 100.000
Page 2 of 35
17/08/2021file:///C:/Files%20-%20Simon/BTP%20Projects/BTP-2128%20-%20WCM%20White...
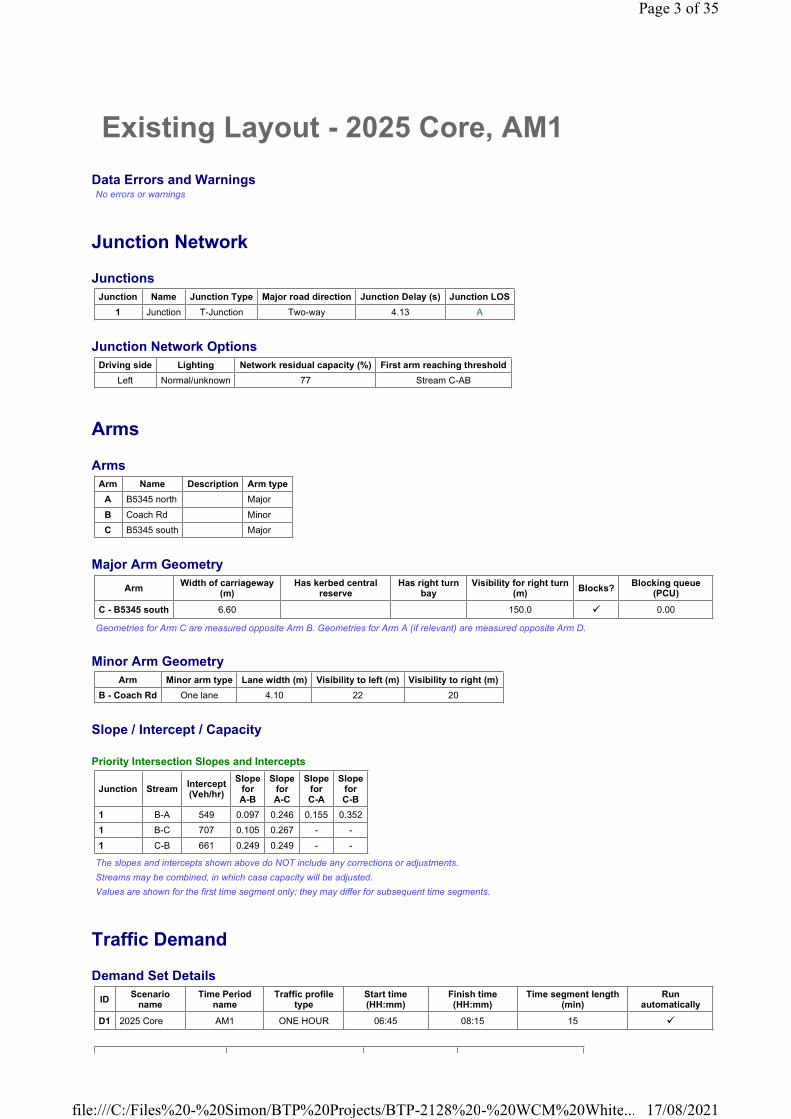
Existing Layout - 2025 Core, AM1
Data Errors and WarningsNo errors or warnings
Junction Network
Junctions
Junction Network Options
Arms
Arms
Major Arm Geometry
Geometries for Arm C are measured opposite Arm B. Geometries for Arm A (if relevant) are measured opposite Arm D.
Minor Arm Geometry
Slope / Intercept / Capacity
Priority Intersection Slopes and Intercepts
The slopes and intercepts shown above do NOT include any corrections or adjustments.
Streams may be combined, in which case capacity will be adjusted.
Values are shown for the first time segment only; they may differ for subsequent time segments.
Traffic Demand
Demand Set Details
Junction Name Junction Type Major road direction Junction Delay (s) Junction LOS
1 Junction T-Junction Two-way 4.13 A
Driving side Lighting Network residual capacity (%) First arm reaching threshold
Left Normal/unknown 77 Stream C-AB
Arm Name Description Arm type
A B5345 north Major
B Coach Rd Minor
C B5345 south Major
ArmWidth of carriageway
(m)Has kerbed central
reserveHas right turn
bayVisibility for right turn
(m)Blocks?
Blocking queue (PCU)
C - B5345 south 6.60 150.0 � 0.00
Arm Minor arm type Lane width (m) Visibility to left (m) Visibility to right (m)
B - Coach Rd One lane 4.10 22 20
Junction StreamIntercept(Veh/hr)
SlopeforA-B
SlopeforA-C
SlopeforC-A
SlopeforC-B
1 B-A 549 0.097 0.246 0.155 0.352
1 B-C 707 0.105 0.267 - -
1 C-B 661 0.249 0.249 - -
IDScenario
nameTime Period
nameTraffic profile
typeStart time (HH:mm)
Finish time (HH:mm)
Time segment length (min)
Run automatically
D1 2025 Core AM1 ONE HOUR 06:45 08:15 15 �
Page 3 of 35
17/08/2021file:///C:/Files%20-%20Simon/BTP%20Projects/BTP-2128%20-%20WCM%20White...
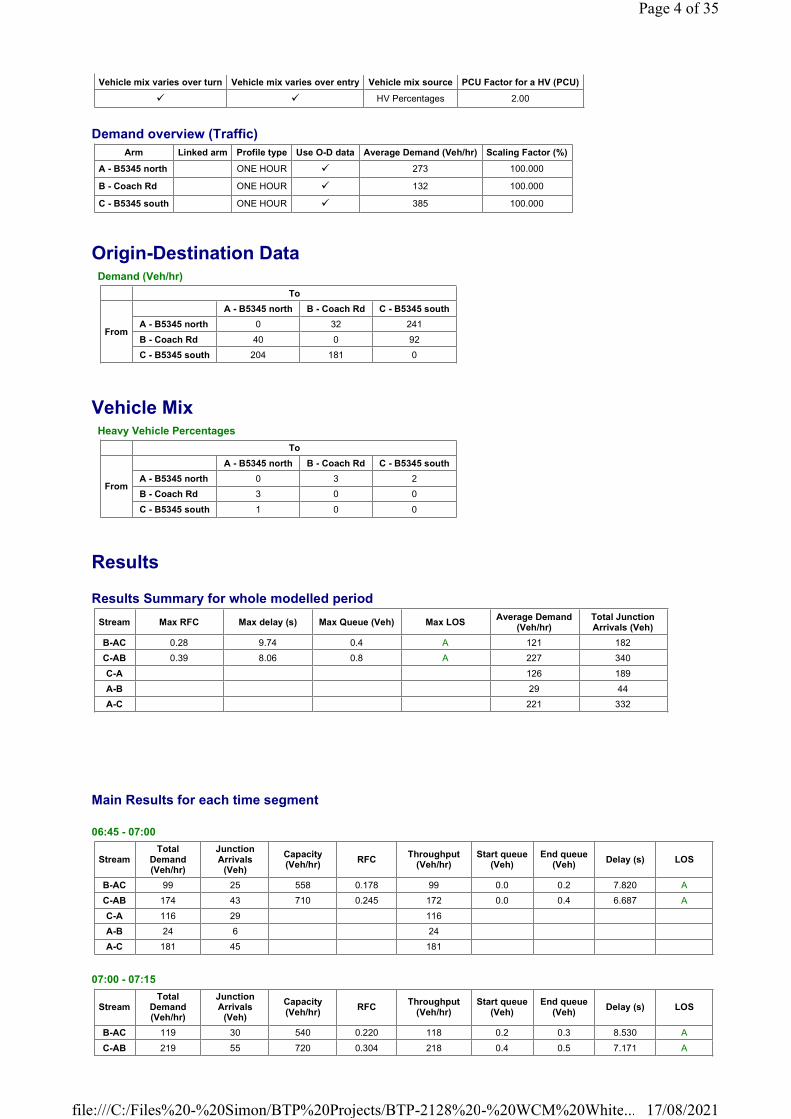
Demand overview (Traffic)
Origin-Destination Data
Vehicle Mix
Results
Results Summary for whole modelled period
Main Results for each time segment
06:45 - 07:00
07:00 - 07:15
Vehicle mix varies over turn Vehicle mix varies over entry Vehicle mix source PCU Factor for a HV (PCU)
� � HV Percentages 2.00
Arm Linked arm Profile type Use O-D data Average Demand (Veh/hr) Scaling Factor (%)
A - B5345 north ONE HOUR � 273 100.000
B - Coach Rd ONE HOUR � 132 100.000
C - B5345 south ONE HOUR � 385 100.000
Demand (Veh/hr)
To
From
A - B5345 north B - Coach Rd C - B5345 south
A - B5345 north 0 32 241
B - Coach Rd 40 0 92
C - B5345 south 204 181 0
Heavy Vehicle Percentages
To
From
A - B5345 north B - Coach Rd C - B5345 south
A - B5345 north 0 3 2
B - Coach Rd 3 0 0
C - B5345 south 1 0 0
Stream Max RFC Max delay (s) Max Queue (Veh) Max LOSAverage Demand
(Veh/hr)Total Junction Arrivals (Veh)
B-AC 0.28 9.74 0.4 A 121 182
C-AB 0.39 8.06 0.8 A 227 340
C-A 126 189
A-B 29 44
A-C 221 332
StreamTotal
Demand (Veh/hr)
Junction Arrivals
(Veh)
Capacity (Veh/hr)
RFCThroughput
(Veh/hr)Start queue
(Veh)End queue
(Veh)Delay (s) LOS
B-AC 99 25 558 0.178 99 0.0 0.2 7.820 A
C-AB 174 43 710 0.245 172 0.0 0.4 6.687 A
C-A 116 29 116
A-B 24 6 24
A-C 181 45 181
StreamTotal
Demand (Veh/hr)
Junction Arrivals
(Veh)
Capacity (Veh/hr)
RFCThroughput
(Veh/hr)Start queue
(Veh)End queue
(Veh)Delay (s) LOS
B-AC 119 30 540 0.220 118 0.2 0.3 8.530 A
C-AB 219 55 720 0.304 218 0.4 0.5 7.171 A
Page 4 of 35
17/08/2021file:///C:/Files%20-%20Simon/BTP%20Projects/BTP-2128%20-%20WCM%20White...
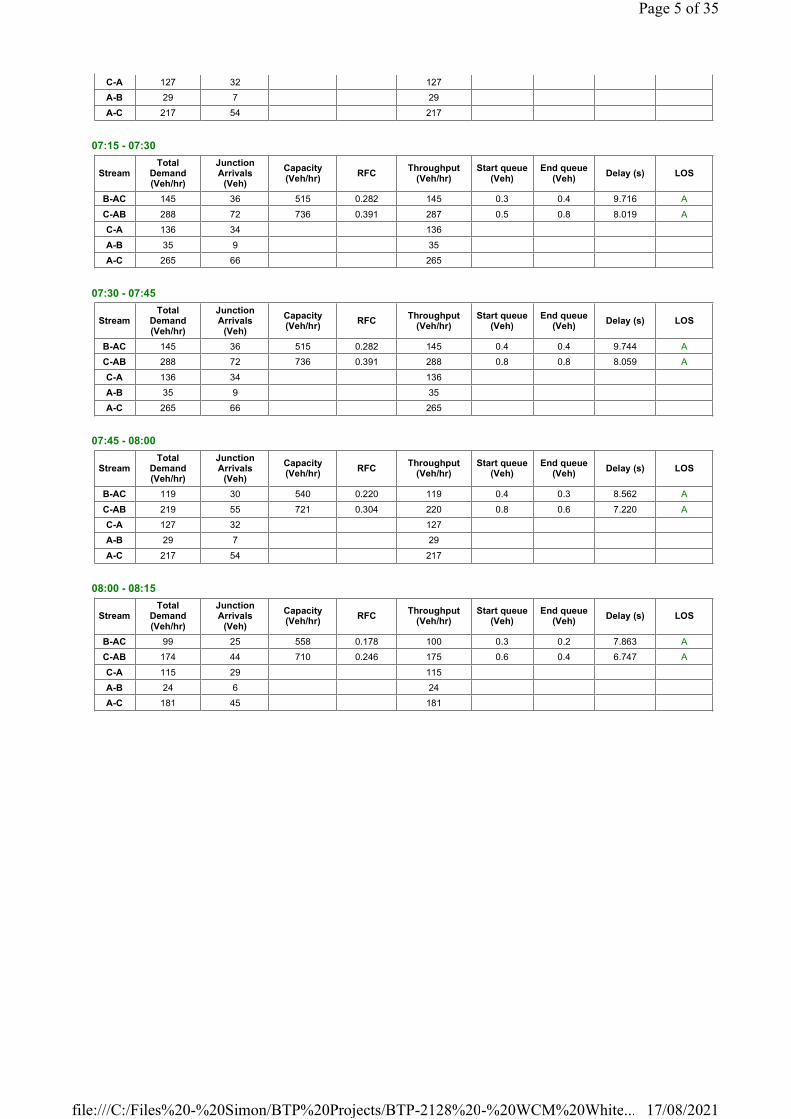
07:15 - 07:30
07:30 - 07:45
07:45 - 08:00
08:00 - 08:15
C-A 127 32 127
A-B 29 7 29
A-C 217 54 217
StreamTotal
Demand (Veh/hr)
Junction Arrivals
(Veh)
Capacity (Veh/hr)
RFCThroughput
(Veh/hr)Start queue
(Veh)End queue
(Veh)Delay (s) LOS
B-AC 145 36 515 0.282 145 0.3 0.4 9.716 A
C-AB 288 72 736 0.391 287 0.5 0.8 8.019 A
C-A 136 34 136
A-B 35 9 35
A-C 265 66 265
StreamTotal
Demand (Veh/hr)
Junction Arrivals
(Veh)
Capacity (Veh/hr)
RFCThroughput
(Veh/hr)Start queue
(Veh)End queue
(Veh)Delay (s) LOS
B-AC 145 36 515 0.282 145 0.4 0.4 9.744 A
C-AB 288 72 736 0.391 288 0.8 0.8 8.059 A
C-A 136 34 136
A-B 35 9 35
A-C 265 66 265
StreamTotal
Demand (Veh/hr)
Junction Arrivals
(Veh)
Capacity (Veh/hr)
RFCThroughput
(Veh/hr)Start queue
(Veh)End queue
(Veh)Delay (s) LOS
B-AC 119 30 540 0.220 119 0.4 0.3 8.562 A
C-AB 219 55 721 0.304 220 0.8 0.6 7.220 A
C-A 127 32 127
A-B 29 7 29
A-C 217 54 217
StreamTotal
Demand (Veh/hr)
Junction Arrivals
(Veh)
Capacity (Veh/hr)
RFCThroughput
(Veh/hr)Start queue
(Veh)End queue
(Veh)Delay (s) LOS
B-AC 99 25 558 0.178 100 0.3 0.2 7.863 A
C-AB 174 44 710 0.246 175 0.6 0.4 6.747 A
C-A 115 29 115
A-B 24 6 24
A-C 181 45 181
Page 5 of 35
17/08/2021file:///C:/Files%20-%20Simon/BTP%20Projects/BTP-2128%20-%20WCM%20White...
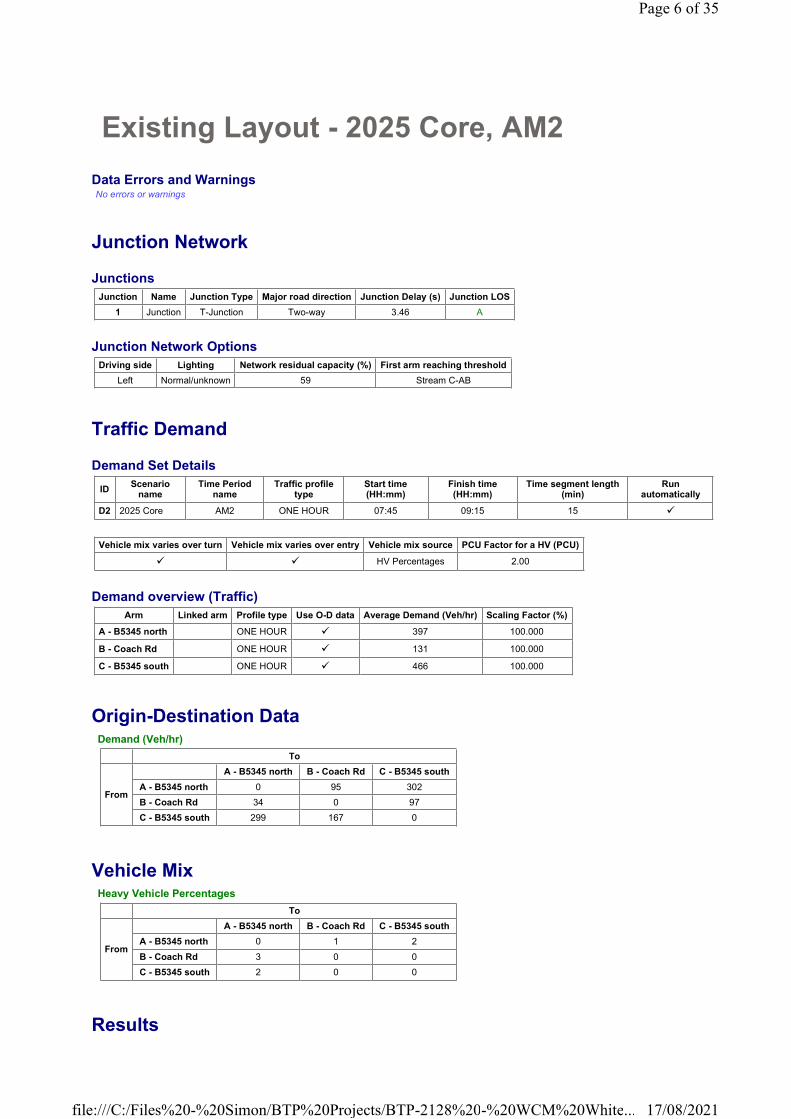
Existing Layout - 2025 Core, AM2
Data Errors and WarningsNo errors or warnings
Junction Network
Junctions
Junction Network Options
Traffic Demand
Demand Set Details
Demand overview (Traffic)
Origin-Destination Data
Vehicle Mix
Results
Junction Name Junction Type Major road direction Junction Delay (s) Junction LOS
1 Junction T-Junction Two-way 3.46 A
Driving side Lighting Network residual capacity (%) First arm reaching threshold
Left Normal/unknown 59 Stream C-AB
IDScenario
nameTime Period
nameTraffic profile
typeStart time (HH:mm)
Finish time (HH:mm)
Time segment length (min)
Run automatically
D2 2025 Core AM2 ONE HOUR 07:45 09:15 15 �
Vehicle mix varies over turn Vehicle mix varies over entry Vehicle mix source PCU Factor for a HV (PCU)
� � HV Percentages 2.00
Arm Linked arm Profile type Use O-D data Average Demand (Veh/hr) Scaling Factor (%)
A - B5345 north ONE HOUR � 397 100.000
B - Coach Rd ONE HOUR � 131 100.000
C - B5345 south ONE HOUR � 466 100.000
Demand (Veh/hr)
To
From
A - B5345 north B - Coach Rd C - B5345 south
A - B5345 north 0 95 302
B - Coach Rd 34 0 97
C - B5345 south 299 167 0
Heavy Vehicle Percentages
To
From
A - B5345 north B - Coach Rd C - B5345 south
A - B5345 north 0 1 2
B - Coach Rd 3 0 0
C - B5345 south 2 0 0
Page 6 of 35
17/08/2021file:///C:/Files%20-%20Simon/BTP%20Projects/BTP-2128%20-%20WCM%20White...
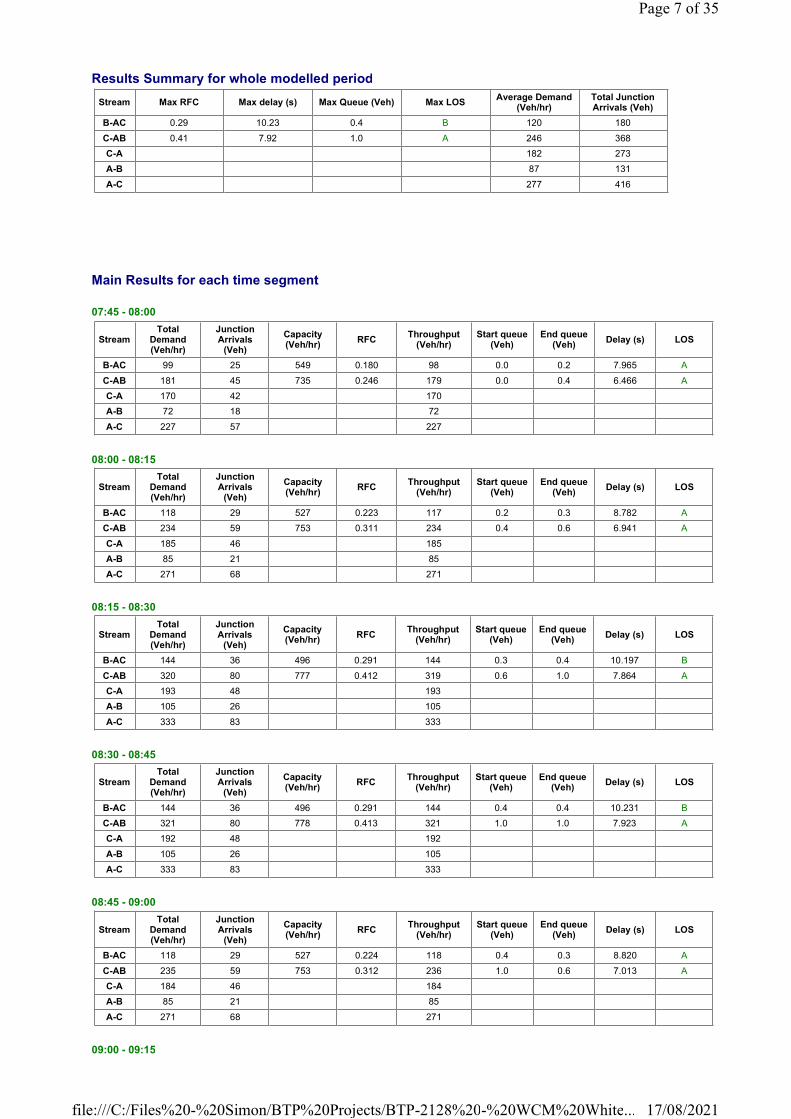
Results Summary for whole modelled period
Main Results for each time segment
07:45 - 08:00
08:00 - 08:15
08:15 - 08:30
08:30 - 08:45
08:45 - 09:00
09:00 - 09:15
Stream Max RFC Max delay (s) Max Queue (Veh) Max LOSAverage Demand
(Veh/hr)Total Junction Arrivals (Veh)
B-AC 0.29 10.23 0.4 B 120 180
C-AB 0.41 7.92 1.0 A 246 368
C-A 182 273
A-B 87 131
A-C 277 416
StreamTotal
Demand (Veh/hr)
Junction Arrivals
(Veh)
Capacity (Veh/hr)
RFCThroughput
(Veh/hr)Start queue
(Veh)End queue
(Veh)Delay (s) LOS
B-AC 99 25 549 0.180 98 0.0 0.2 7.965 A
C-AB 181 45 735 0.246 179 0.0 0.4 6.466 A
C-A 170 42 170
A-B 72 18 72
A-C 227 57 227
StreamTotal
Demand (Veh/hr)
Junction Arrivals
(Veh)
Capacity (Veh/hr)
RFCThroughput
(Veh/hr)Start queue
(Veh)End queue
(Veh)Delay (s) LOS
B-AC 118 29 527 0.223 117 0.2 0.3 8.782 A
C-AB 234 59 753 0.311 234 0.4 0.6 6.941 A
C-A 185 46 185
A-B 85 21 85
A-C 271 68 271
StreamTotal
Demand (Veh/hr)
Junction Arrivals
(Veh)
Capacity (Veh/hr)
RFCThroughput
(Veh/hr)Start queue
(Veh)End queue
(Veh)Delay (s) LOS
B-AC 144 36 496 0.291 144 0.3 0.4 10.197 B
C-AB 320 80 777 0.412 319 0.6 1.0 7.864 A
C-A 193 48 193
A-B 105 26 105
A-C 333 83 333
StreamTotal
Demand (Veh/hr)
Junction Arrivals
(Veh)
Capacity (Veh/hr)
RFCThroughput
(Veh/hr)Start queue
(Veh)End queue
(Veh)Delay (s) LOS
B-AC 144 36 496 0.291 144 0.4 0.4 10.231 B
C-AB 321 80 778 0.413 321 1.0 1.0 7.923 A
C-A 192 48 192
A-B 105 26 105
A-C 333 83 333
StreamTotal
Demand (Veh/hr)
Junction Arrivals
(Veh)
Capacity (Veh/hr)
RFCThroughput
(Veh/hr)Start queue
(Veh)End queue
(Veh)Delay (s) LOS
B-AC 118 29 527 0.224 118 0.4 0.3 8.820 A
C-AB 235 59 753 0.312 236 1.0 0.6 7.013 A
C-A 184 46 184
A-B 85 21 85
A-C 271 68 271
Page 7 of 35
17/08/2021file:///C:/Files%20-%20Simon/BTP%20Projects/BTP-2128%20-%20WCM%20White...

StreamTotal
Demand (Veh/hr)
Junction Arrivals
(Veh)
Capacity (Veh/hr)
RFCThroughput
(Veh/hr)Start queue
(Veh)End queue
(Veh)Delay (s) LOS
B-AC 99 25 549 0.180 99 0.3 0.2 8.011 A
C-AB 182 45 736 0.247 183 0.6 0.4 6.529 A
C-A 169 42 169
A-B 72 18 72
A-C 227 57 227
Page 8 of 35
17/08/2021file:///C:/Files%20-%20Simon/BTP%20Projects/BTP-2128%20-%20WCM%20White...
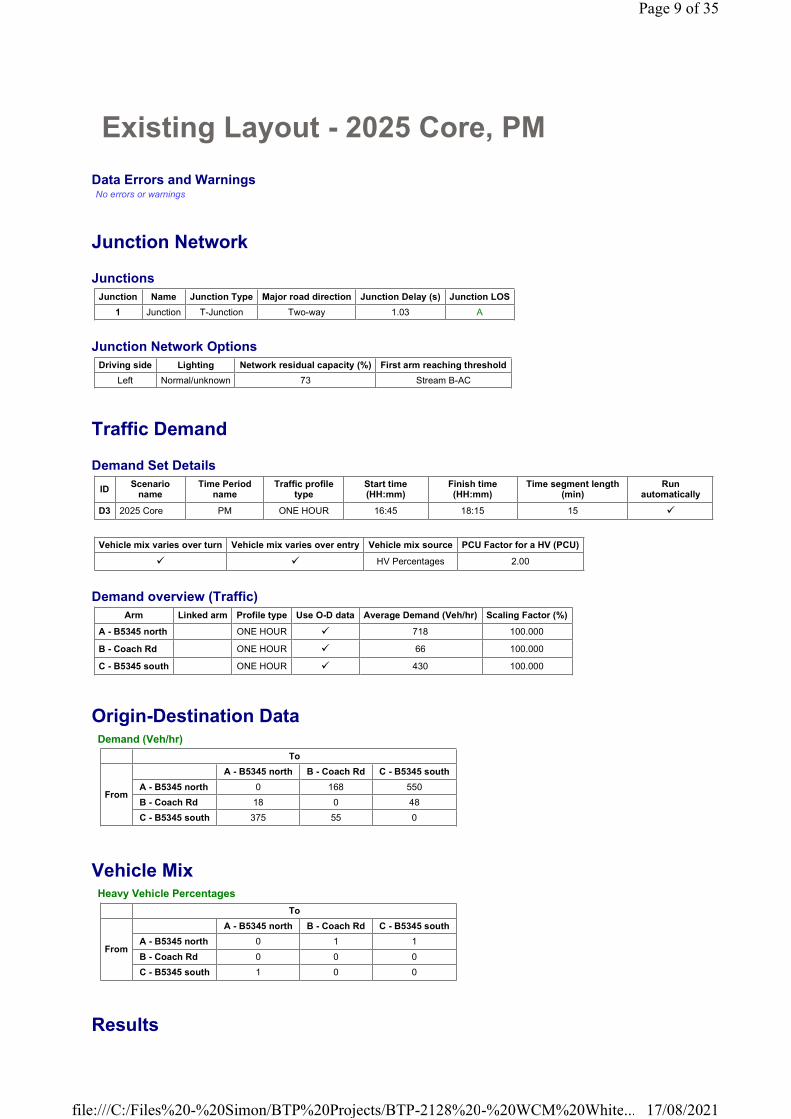
Existing Layout - 2025 Core, PM
Data Errors and WarningsNo errors or warnings
Junction Network
Junctions
Junction Network Options
Traffic Demand
Demand Set Details
Demand overview (Traffic)
Origin-Destination Data
Vehicle Mix
Results
Junction Name Junction Type Major road direction Junction Delay (s) Junction LOS
1 Junction T-Junction Two-way 1.03 A
Driving side Lighting Network residual capacity (%) First arm reaching threshold
Left Normal/unknown 73 Stream B-AC
IDScenario
nameTime Period
nameTraffic profile
typeStart time (HH:mm)
Finish time (HH:mm)
Time segment length (min)
Run automatically
D3 2025 Core PM ONE HOUR 16:45 18:15 15 �
Vehicle mix varies over turn Vehicle mix varies over entry Vehicle mix source PCU Factor for a HV (PCU)
� � HV Percentages 2.00
Arm Linked arm Profile type Use O-D data Average Demand (Veh/hr) Scaling Factor (%)
A - B5345 north ONE HOUR � 718 100.000
B - Coach Rd ONE HOUR � 66 100.000
C - B5345 south ONE HOUR � 430 100.000
Demand (Veh/hr)
To
From
A - B5345 north B - Coach Rd C - B5345 south
A - B5345 north 0 168 550
B - Coach Rd 18 0 48
C - B5345 south 375 55 0
Heavy Vehicle Percentages
To
From
A - B5345 north B - Coach Rd C - B5345 south
A - B5345 north 0 1 1
B - Coach Rd 0 0 0
C - B5345 south 1 0 0
Page 9 of 35
17/08/2021file:///C:/Files%20-%20Simon/BTP%20Projects/BTP-2128%20-%20WCM%20White...
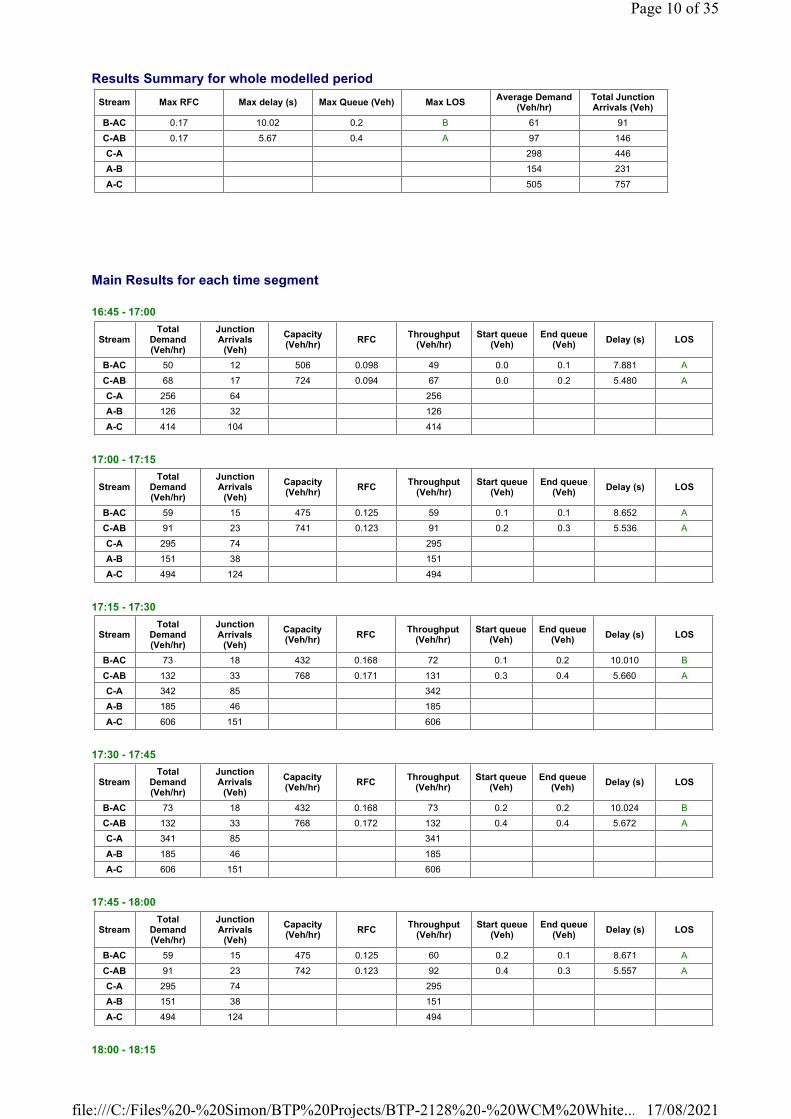
Results Summary for whole modelled period
Main Results for each time segment
16:45 - 17:00
17:00 - 17:15
17:15 - 17:30
17:30 - 17:45
17:45 - 18:00
18:00 - 18:15
Stream Max RFC Max delay (s) Max Queue (Veh) Max LOSAverage Demand
(Veh/hr)Total Junction Arrivals (Veh)
B-AC 0.17 10.02 0.2 B 61 91
C-AB 0.17 5.67 0.4 A 97 146
C-A 298 446
A-B 154 231
A-C 505 757
StreamTotal
Demand (Veh/hr)
Junction Arrivals
(Veh)
Capacity (Veh/hr)
RFCThroughput
(Veh/hr)Start queue
(Veh)End queue
(Veh)Delay (s) LOS
B-AC 50 12 506 0.098 49 0.0 0.1 7.881 A
C-AB 68 17 724 0.094 67 0.0 0.2 5.480 A
C-A 256 64 256
A-B 126 32 126
A-C 414 104 414
StreamTotal
Demand (Veh/hr)
Junction Arrivals
(Veh)
Capacity (Veh/hr)
RFCThroughput
(Veh/hr)Start queue
(Veh)End queue
(Veh)Delay (s) LOS
B-AC 59 15 475 0.125 59 0.1 0.1 8.652 A
C-AB 91 23 741 0.123 91 0.2 0.3 5.536 A
C-A 295 74 295
A-B 151 38 151
A-C 494 124 494
StreamTotal
Demand (Veh/hr)
Junction Arrivals
(Veh)
Capacity (Veh/hr)
RFCThroughput
(Veh/hr)Start queue
(Veh)End queue
(Veh)Delay (s) LOS
B-AC 73 18 432 0.168 72 0.1 0.2 10.010 B
C-AB 132 33 768 0.171 131 0.3 0.4 5.660 A
C-A 342 85 342
A-B 185 46 185
A-C 606 151 606
StreamTotal
Demand (Veh/hr)
Junction Arrivals
(Veh)
Capacity (Veh/hr)
RFCThroughput
(Veh/hr)Start queue
(Veh)End queue
(Veh)Delay (s) LOS
B-AC 73 18 432 0.168 73 0.2 0.2 10.024 B
C-AB 132 33 768 0.172 132 0.4 0.4 5.672 A
C-A 341 85 341
A-B 185 46 185
A-C 606 151 606
StreamTotal
Demand (Veh/hr)
Junction Arrivals
(Veh)
Capacity (Veh/hr)
RFCThroughput
(Veh/hr)Start queue
(Veh)End queue
(Veh)Delay (s) LOS
B-AC 59 15 475 0.125 60 0.2 0.1 8.671 A
C-AB 91 23 742 0.123 92 0.4 0.3 5.557 A
C-A 295 74 295
A-B 151 38 151
A-C 494 124 494
Page 10 of 35
17/08/2021file:///C:/Files%20-%20Simon/BTP%20Projects/BTP-2128%20-%20WCM%20White...

StreamTotal
Demand (Veh/hr)
Junction Arrivals
(Veh)
Capacity (Veh/hr)
RFCThroughput
(Veh/hr)Start queue
(Veh)End queue
(Veh)Delay (s) LOS
B-AC 50 12 505 0.098 50 0.1 0.1 7.904 A
C-AB 68 17 724 0.094 69 0.3 0.2 5.500 A
C-A 255 64 255
A-B 126 32 126
A-C 414 104 414
Page 11 of 35
17/08/2021file:///C:/Files%20-%20Simon/BTP%20Projects/BTP-2128%20-%20WCM%20White...
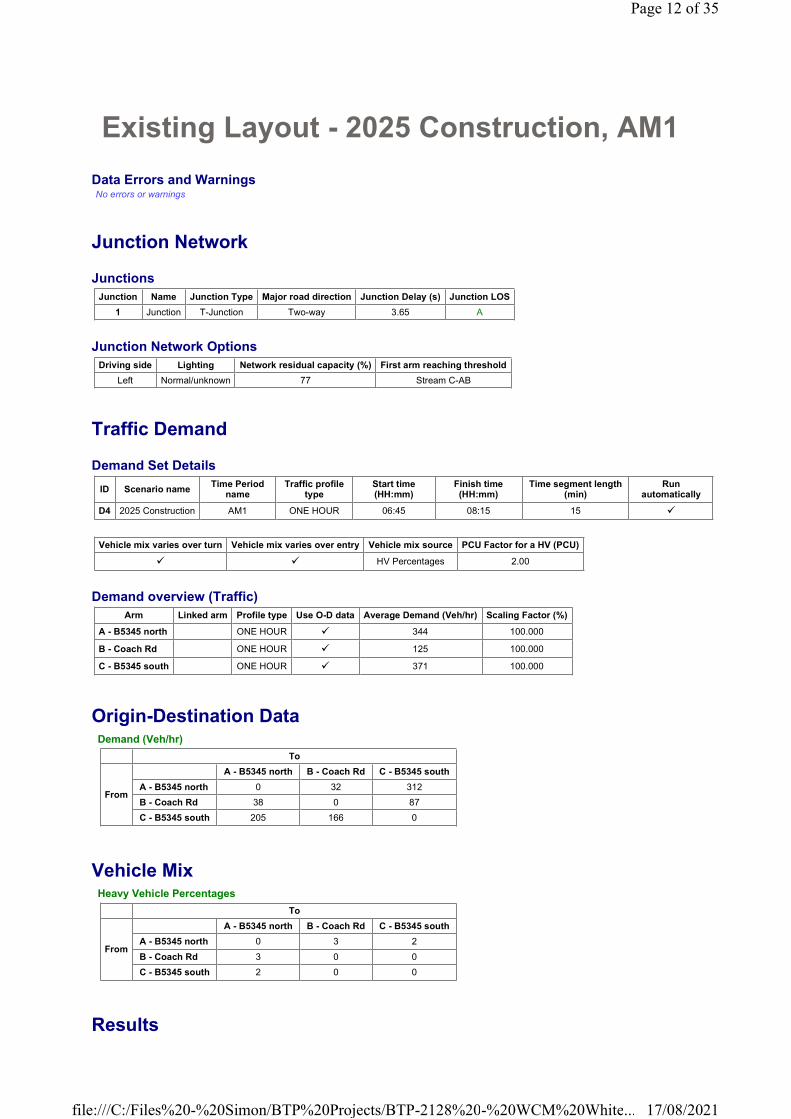
Existing Layout - 2025 Construction, AM1
Data Errors and WarningsNo errors or warnings
Junction Network
Junctions
Junction Network Options
Traffic Demand
Demand Set Details
Demand overview (Traffic)
Origin-Destination Data
Vehicle Mix
Results
Junction Name Junction Type Major road direction Junction Delay (s) Junction LOS
1 Junction T-Junction Two-way 3.65 A
Driving side Lighting Network residual capacity (%) First arm reaching threshold
Left Normal/unknown 77 Stream C-AB
ID Scenario nameTime Period
nameTraffic profile
typeStart time (HH:mm)
Finish time (HH:mm)
Time segment length (min)
Run automatically
D4 2025 Construction AM1 ONE HOUR 06:45 08:15 15 �
Vehicle mix varies over turn Vehicle mix varies over entry Vehicle mix source PCU Factor for a HV (PCU)
� � HV Percentages 2.00
Arm Linked arm Profile type Use O-D data Average Demand (Veh/hr) Scaling Factor (%)
A - B5345 north ONE HOUR � 344 100.000
B - Coach Rd ONE HOUR � 125 100.000
C - B5345 south ONE HOUR � 371 100.000
Demand (Veh/hr)
To
From
A - B5345 north B - Coach Rd C - B5345 south
A - B5345 north 0 32 312
B - Coach Rd 38 0 87
C - B5345 south 205 166 0
Heavy Vehicle Percentages
To
From
A - B5345 north B - Coach Rd C - B5345 south
A - B5345 north 0 3 2
B - Coach Rd 3 0 0
C - B5345 south 2 0 0
Page 12 of 35
17/08/2021file:///C:/Files%20-%20Simon/BTP%20Projects/BTP-2128%20-%20WCM%20White...
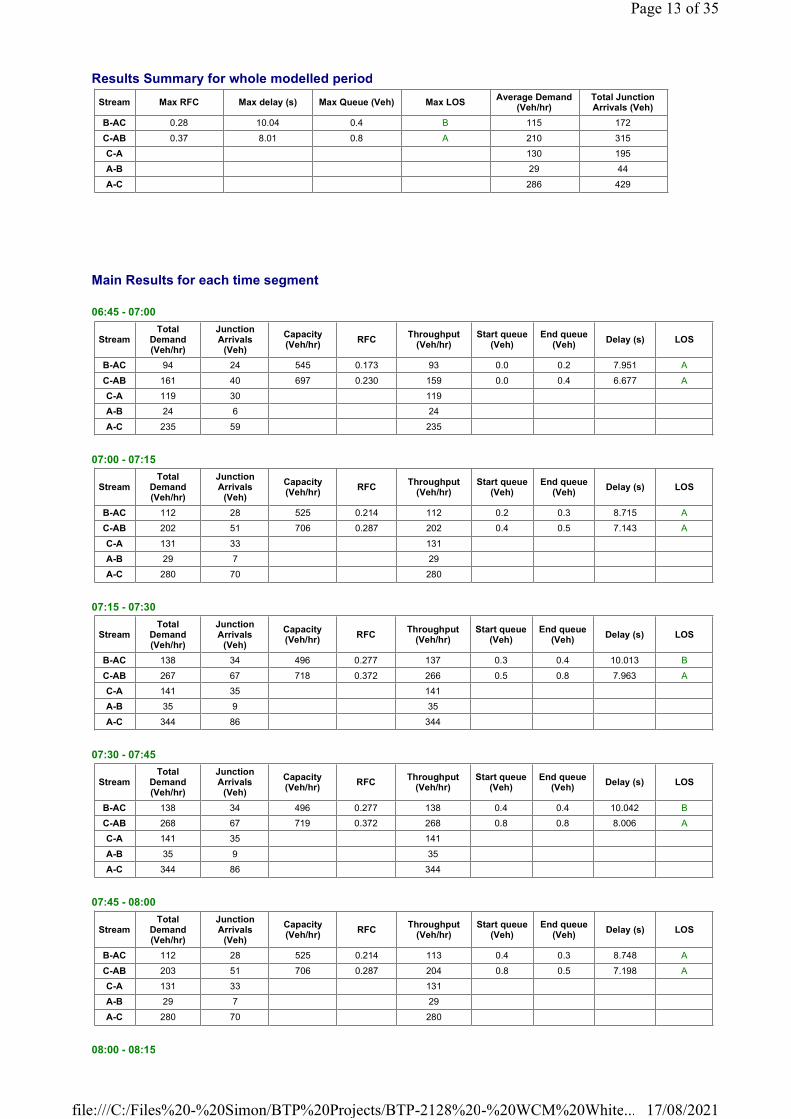
Results Summary for whole modelled period
Main Results for each time segment
06:45 - 07:00
07:00 - 07:15
07:15 - 07:30
07:30 - 07:45
07:45 - 08:00
08:00 - 08:15
Stream Max RFC Max delay (s) Max Queue (Veh) Max LOSAverage Demand
(Veh/hr)Total Junction Arrivals (Veh)
B-AC 0.28 10.04 0.4 B 115 172
C-AB 0.37 8.01 0.8 A 210 315
C-A 130 195
A-B 29 44
A-C 286 429
StreamTotal
Demand (Veh/hr)
Junction Arrivals
(Veh)
Capacity (Veh/hr)
RFCThroughput
(Veh/hr)Start queue
(Veh)End queue
(Veh)Delay (s) LOS
B-AC 94 24 545 0.173 93 0.0 0.2 7.951 A
C-AB 161 40 697 0.230 159 0.0 0.4 6.677 A
C-A 119 30 119
A-B 24 6 24
A-C 235 59 235
StreamTotal
Demand (Veh/hr)
Junction Arrivals
(Veh)
Capacity (Veh/hr)
RFCThroughput
(Veh/hr)Start queue
(Veh)End queue
(Veh)Delay (s) LOS
B-AC 112 28 525 0.214 112 0.2 0.3 8.715 A
C-AB 202 51 706 0.287 202 0.4 0.5 7.143 A
C-A 131 33 131
A-B 29 7 29
A-C 280 70 280
StreamTotal
Demand (Veh/hr)
Junction Arrivals
(Veh)
Capacity (Veh/hr)
RFCThroughput
(Veh/hr)Start queue
(Veh)End queue
(Veh)Delay (s) LOS
B-AC 138 34 496 0.277 137 0.3 0.4 10.013 B
C-AB 267 67 718 0.372 266 0.5 0.8 7.963 A
C-A 141 35 141
A-B 35 9 35
A-C 344 86 344
StreamTotal
Demand (Veh/hr)
Junction Arrivals
(Veh)
Capacity (Veh/hr)
RFCThroughput
(Veh/hr)Start queue
(Veh)End queue
(Veh)Delay (s) LOS
B-AC 138 34 496 0.277 138 0.4 0.4 10.042 B
C-AB 268 67 719 0.372 268 0.8 0.8 8.006 A
C-A 141 35 141
A-B 35 9 35
A-C 344 86 344
StreamTotal
Demand (Veh/hr)
Junction Arrivals
(Veh)
Capacity (Veh/hr)
RFCThroughput
(Veh/hr)Start queue
(Veh)End queue
(Veh)Delay (s) LOS
B-AC 112 28 525 0.214 113 0.4 0.3 8.748 A
C-AB 203 51 706 0.287 204 0.8 0.5 7.198 A
C-A 131 33 131
A-B 29 7 29
A-C 280 70 280
Page 13 of 35
17/08/2021file:///C:/Files%20-%20Simon/BTP%20Projects/BTP-2128%20-%20WCM%20White...

StreamTotal
Demand (Veh/hr)
Junction Arrivals
(Veh)
Capacity (Veh/hr)
RFCThroughput
(Veh/hr)Start queue
(Veh)End queue
(Veh)Delay (s) LOS
B-AC 94 24 545 0.173 94 0.3 0.2 7.996 A
C-AB 161 40 698 0.231 162 0.5 0.4 6.736 A
C-A 118 30 118
A-B 24 6 24
A-C 235 59 235
Page 14 of 35
17/08/2021file:///C:/Files%20-%20Simon/BTP%20Projects/BTP-2128%20-%20WCM%20White...

Existing Layout - 2025 Construction, PM
Data Errors and WarningsNo errors or warnings
Junction Network
Junctions
Junction Network Options
Traffic Demand
Demand Set Details
Demand overview (Traffic)
Origin-Destination Data
Vehicle Mix
Results
Junction Name Junction Type Major road direction Junction Delay (s) Junction LOS
1 Junction T-Junction Two-way 1.02 A
Driving side Lighting Network residual capacity (%) First arm reaching threshold
Left Normal/unknown 74 Stream B-AC
ID Scenario nameTime Period
nameTraffic profile
typeStart time (HH:mm)
Finish time (HH:mm)
Time segment length (min)
Run automatically
D5 2025 Construction PM ONE HOUR 16:45 18:15 15 �
Vehicle mix varies over turn Vehicle mix varies over entry Vehicle mix source PCU Factor for a HV (PCU)
� � HV Percentages 2.00
Arm Linked arm Profile type Use O-D data Average Demand (Veh/hr) Scaling Factor (%)
A - B5345 north ONE HOUR � 717 100.000
B - Coach Rd ONE HOUR � 67 100.000
C - B5345 south ONE HOUR � 487 100.000
Demand (Veh/hr)
To
From
A - B5345 north B - Coach Rd C - B5345 south
A - B5345 north 0 169 548
B - Coach Rd 13 0 54
C - B5345 south 429 58 0
Heavy Vehicle Percentages
To
From
A - B5345 north B - Coach Rd C - B5345 south
A - B5345 north 0 1 1
B - Coach Rd 0 0 0
C - B5345 south 1 0 0
Page 15 of 35
17/08/2021file:///C:/Files%20-%20Simon/BTP%20Projects/BTP-2128%20-%20WCM%20White...
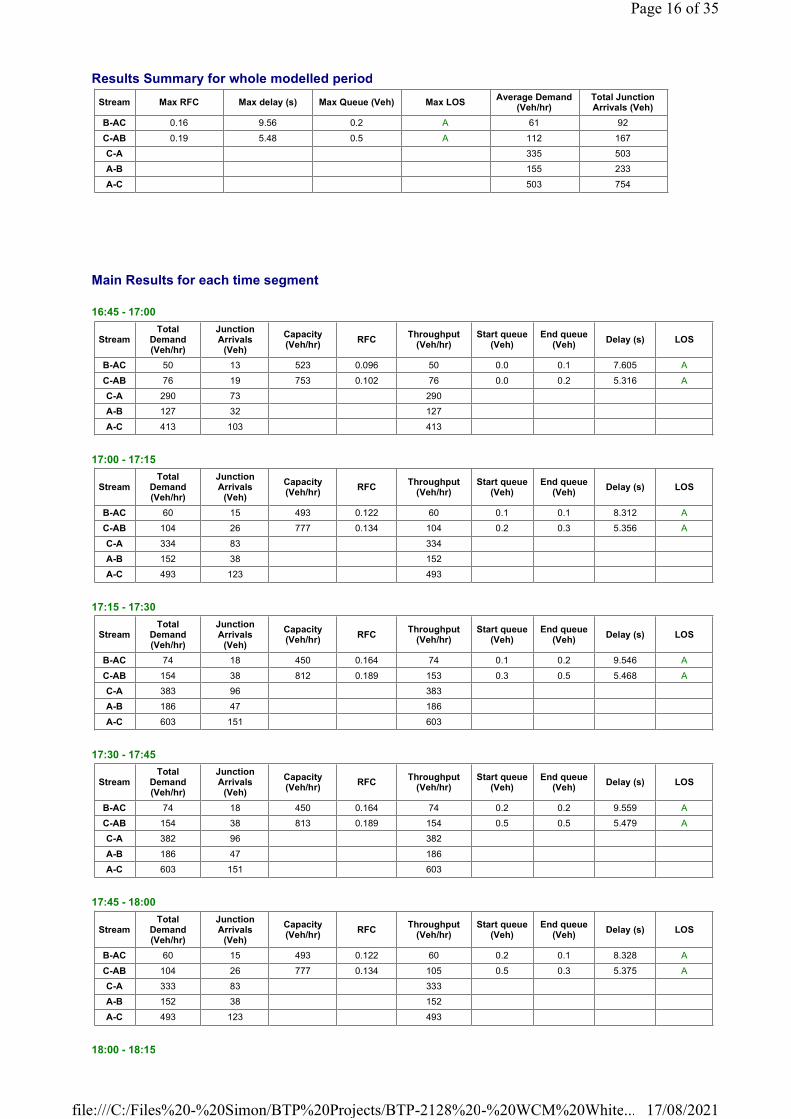
Results Summary for whole modelled period
Main Results for each time segment
16:45 - 17:00
17:00 - 17:15
17:15 - 17:30
17:30 - 17:45
17:45 - 18:00
18:00 - 18:15
Stream Max RFC Max delay (s) Max Queue (Veh) Max LOSAverage Demand
(Veh/hr)Total Junction Arrivals (Veh)
B-AC 0.16 9.56 0.2 A 61 92
C-AB 0.19 5.48 0.5 A 112 167
C-A 335 503
A-B 155 233
A-C 503 754
StreamTotal
Demand (Veh/hr)
Junction Arrivals
(Veh)
Capacity (Veh/hr)
RFCThroughput
(Veh/hr)Start queue
(Veh)End queue
(Veh)Delay (s) LOS
B-AC 50 13 523 0.096 50 0.0 0.1 7.605 A
C-AB 76 19 753 0.102 76 0.0 0.2 5.316 A
C-A 290 73 290
A-B 127 32 127
A-C 413 103 413
StreamTotal
Demand (Veh/hr)
Junction Arrivals
(Veh)
Capacity (Veh/hr)
RFCThroughput
(Veh/hr)Start queue
(Veh)End queue
(Veh)Delay (s) LOS
B-AC 60 15 493 0.122 60 0.1 0.1 8.312 A
C-AB 104 26 777 0.134 104 0.2 0.3 5.356 A
C-A 334 83 334
A-B 152 38 152
A-C 493 123 493
StreamTotal
Demand (Veh/hr)
Junction Arrivals
(Veh)
Capacity (Veh/hr)
RFCThroughput
(Veh/hr)Start queue
(Veh)End queue
(Veh)Delay (s) LOS
B-AC 74 18 450 0.164 74 0.1 0.2 9.546 A
C-AB 154 38 812 0.189 153 0.3 0.5 5.468 A
C-A 383 96 383
A-B 186 47 186
A-C 603 151 603
StreamTotal
Demand (Veh/hr)
Junction Arrivals
(Veh)
Capacity (Veh/hr)
RFCThroughput
(Veh/hr)Start queue
(Veh)End queue
(Veh)Delay (s) LOS
B-AC 74 18 450 0.164 74 0.2 0.2 9.559 A
C-AB 154 38 813 0.189 154 0.5 0.5 5.479 A
C-A 382 96 382
A-B 186 47 186
A-C 603 151 603
StreamTotal
Demand (Veh/hr)
Junction Arrivals
(Veh)
Capacity (Veh/hr)
RFCThroughput
(Veh/hr)Start queue
(Veh)End queue
(Veh)Delay (s) LOS
B-AC 60 15 493 0.122 60 0.2 0.1 8.328 A
C-AB 104 26 777 0.134 105 0.5 0.3 5.375 A
C-A 333 83 333
A-B 152 38 152
A-C 493 123 493
Page 16 of 35
17/08/2021file:///C:/Files%20-%20Simon/BTP%20Projects/BTP-2128%20-%20WCM%20White...
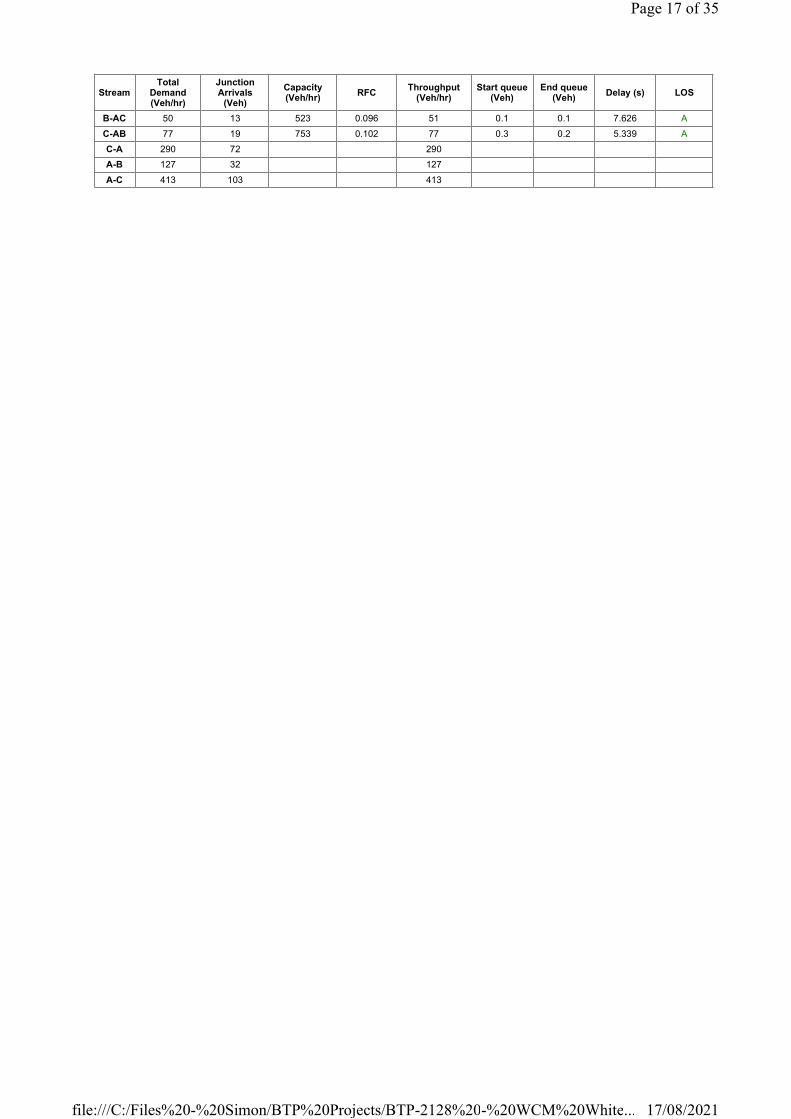
StreamTotal
Demand (Veh/hr)
Junction Arrivals
(Veh)
Capacity (Veh/hr)
RFCThroughput
(Veh/hr)Start queue
(Veh)End queue
(Veh)Delay (s) LOS
B-AC 50 13 523 0.096 51 0.1 0.1 7.626 A
C-AB 77 19 753 0.102 77 0.3 0.2 5.339 A
C-A 290 72 290
A-B 127 32 127
A-C 413 103 413
Page 17 of 35
17/08/2021file:///C:/Files%20-%20Simon/BTP%20Projects/BTP-2128%20-%20WCM%20White...

Existing Layout - 2025 Operation, AM2
Data Errors and WarningsNo errors or warnings
Junction Network
Junctions
Junction Network Options
Traffic Demand
Demand Set Details
Demand overview (Traffic)
Origin-Destination Data
Vehicle Mix
Results
Junction Name Junction Type Major road direction Junction Delay (s) Junction LOS
1 Junction T-Junction Two-way 3.25 A
Driving side Lighting Network residual capacity (%) First arm reaching threshold
Left Normal/unknown 62 Stream C-AB
IDScenario
nameTime Period
nameTraffic profile
typeStart time (HH:mm)
Finish time (HH:mm)
Time segment length (min)
Run automatically
D6 2025 Operation AM2 ONE HOUR 07:45 09:15 15 �
Vehicle mix varies over turn Vehicle mix varies over entry Vehicle mix source PCU Factor for a HV (PCU)
� � HV Percentages 2.00
Arm Linked arm Profile type Use O-D data Average Demand (Veh/hr) Scaling Factor (%)
A - B5345 north ONE HOUR � 417 100.000
B - Coach Rd ONE HOUR � 129 100.000
C - B5345 south ONE HOUR � 460 100.000
Demand (Veh/hr)
To
From
A - B5345 north B - Coach Rd C - B5345 south
A - B5345 north 0 96 321
B - Coach Rd 33 0 96
C - B5345 south 302 158 0
Heavy Vehicle Percentages
To
From
A - B5345 north B - Coach Rd C - B5345 south
A - B5345 north 0 1 2
B - Coach Rd 3 0 0
C - B5345 south 2 0 0
Page 18 of 35
17/08/2021file:///C:/Files%20-%20Simon/BTP%20Projects/BTP-2128%20-%20WCM%20White...
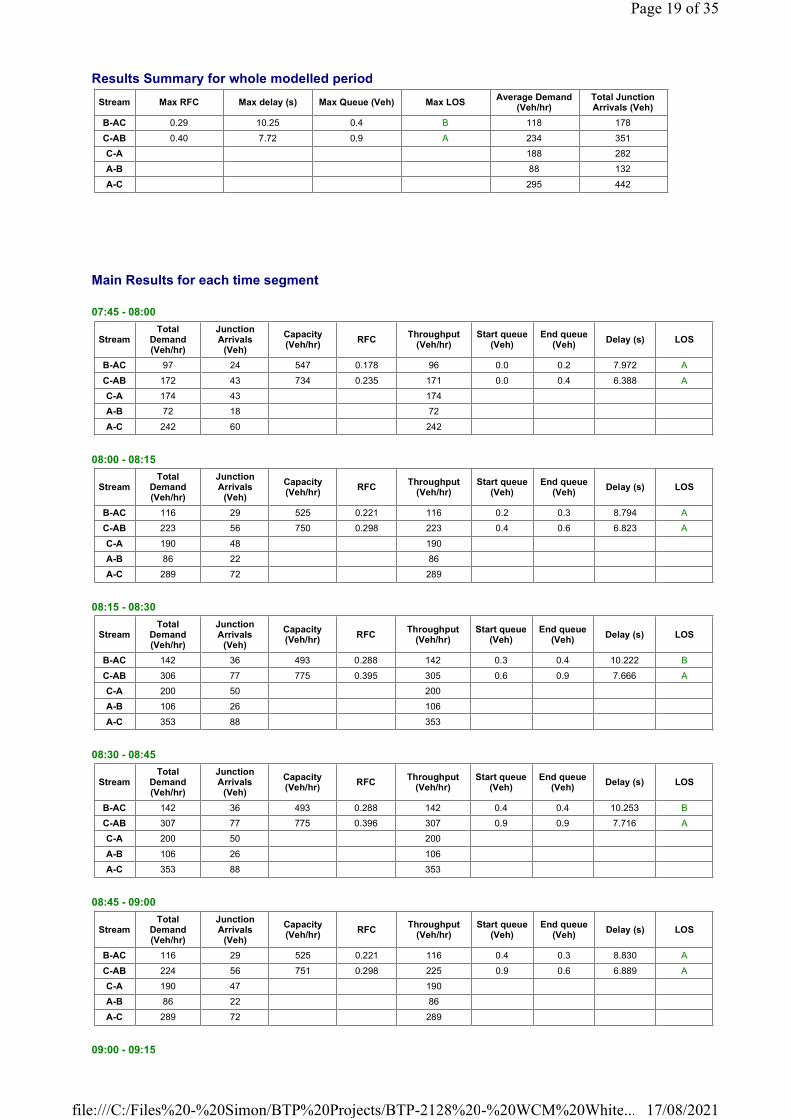
Results Summary for whole modelled period
Main Results for each time segment
07:45 - 08:00
08:00 - 08:15
08:15 - 08:30
08:30 - 08:45
08:45 - 09:00
09:00 - 09:15
Stream Max RFC Max delay (s) Max Queue (Veh) Max LOSAverage Demand
(Veh/hr)Total Junction Arrivals (Veh)
B-AC 0.29 10.25 0.4 B 118 178
C-AB 0.40 7.72 0.9 A 234 351
C-A 188 282
A-B 88 132
A-C 295 442
StreamTotal
Demand (Veh/hr)
Junction Arrivals
(Veh)
Capacity (Veh/hr)
RFCThroughput
(Veh/hr)Start queue
(Veh)End queue
(Veh)Delay (s) LOS
B-AC 97 24 547 0.178 96 0.0 0.2 7.972 A
C-AB 172 43 734 0.235 171 0.0 0.4 6.388 A
C-A 174 43 174
A-B 72 18 72
A-C 242 60 242
StreamTotal
Demand (Veh/hr)
Junction Arrivals
(Veh)
Capacity (Veh/hr)
RFCThroughput
(Veh/hr)Start queue
(Veh)End queue
(Veh)Delay (s) LOS
B-AC 116 29 525 0.221 116 0.2 0.3 8.794 A
C-AB 223 56 750 0.298 223 0.4 0.6 6.823 A
C-A 190 48 190
A-B 86 22 86
A-C 289 72 289
StreamTotal
Demand (Veh/hr)
Junction Arrivals
(Veh)
Capacity (Veh/hr)
RFCThroughput
(Veh/hr)Start queue
(Veh)End queue
(Veh)Delay (s) LOS
B-AC 142 36 493 0.288 142 0.3 0.4 10.222 B
C-AB 306 77 775 0.395 305 0.6 0.9 7.666 A
C-A 200 50 200
A-B 106 26 106
A-C 353 88 353
StreamTotal
Demand (Veh/hr)
Junction Arrivals
(Veh)
Capacity (Veh/hr)
RFCThroughput
(Veh/hr)Start queue
(Veh)End queue
(Veh)Delay (s) LOS
B-AC 142 36 493 0.288 142 0.4 0.4 10.253 B
C-AB 307 77 775 0.396 307 0.9 0.9 7.716 A
C-A 200 50 200
A-B 106 26 106
A-C 353 88 353
StreamTotal
Demand (Veh/hr)
Junction Arrivals
(Veh)
Capacity (Veh/hr)
RFCThroughput
(Veh/hr)Start queue
(Veh)End queue
(Veh)Delay (s) LOS
B-AC 116 29 525 0.221 116 0.4 0.3 8.830 A
C-AB 224 56 751 0.298 225 0.9 0.6 6.889 A
C-A 190 47 190
A-B 86 22 86
A-C 289 72 289
Page 19 of 35
17/08/2021file:///C:/Files%20-%20Simon/BTP%20Projects/BTP-2128%20-%20WCM%20White...

StreamTotal
Demand (Veh/hr)
Junction Arrivals
(Veh)
Capacity (Veh/hr)
RFCThroughput
(Veh/hr)Start queue
(Veh)End queue
(Veh)Delay (s) LOS
B-AC 97 24 547 0.178 97 0.3 0.2 8.019 A
C-AB 173 43 734 0.236 174 0.6 0.4 6.446 A
C-A 173 43 173
A-B 72 18 72
A-C 242 60 242
Page 20 of 35
17/08/2021file:///C:/Files%20-%20Simon/BTP%20Projects/BTP-2128%20-%20WCM%20White...
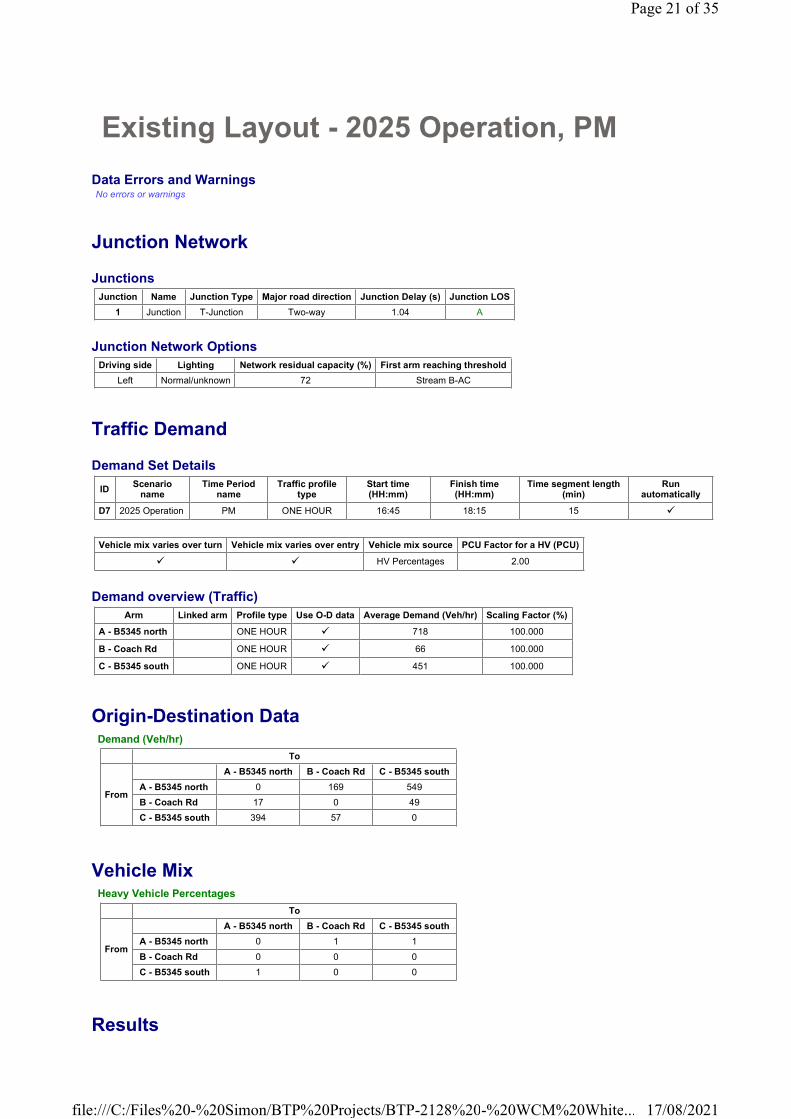
Existing Layout - 2025 Operation, PM
Data Errors and WarningsNo errors or warnings
Junction Network
Junctions
Junction Network Options
Traffic Demand
Demand Set Details
Demand overview (Traffic)
Origin-Destination Data
Vehicle Mix
Results
Junction Name Junction Type Major road direction Junction Delay (s) Junction LOS
1 Junction T-Junction Two-way 1.04 A
Driving side Lighting Network residual capacity (%) First arm reaching threshold
Left Normal/unknown 72 Stream B-AC
IDScenario
nameTime Period
nameTraffic profile
typeStart time (HH:mm)
Finish time (HH:mm)
Time segment length (min)
Run automatically
D7 2025 Operation PM ONE HOUR 16:45 18:15 15 �
Vehicle mix varies over turn Vehicle mix varies over entry Vehicle mix source PCU Factor for a HV (PCU)
� � HV Percentages 2.00
Arm Linked arm Profile type Use O-D data Average Demand (Veh/hr) Scaling Factor (%)
A - B5345 north ONE HOUR � 718 100.000
B - Coach Rd ONE HOUR � 66 100.000
C - B5345 south ONE HOUR � 451 100.000
Demand (Veh/hr)
To
From
A - B5345 north B - Coach Rd C - B5345 south
A - B5345 north 0 169 549
B - Coach Rd 17 0 49
C - B5345 south 394 57 0
Heavy Vehicle Percentages
To
From
A - B5345 north B - Coach Rd C - B5345 south
A - B5345 north 0 1 1
B - Coach Rd 0 0 0
C - B5345 south 1 0 0
Page 21 of 35
17/08/2021file:///C:/Files%20-%20Simon/BTP%20Projects/BTP-2128%20-%20WCM%20White...

Results Summary for whole modelled period
Main Results for each time segment
16:45 - 17:00
17:00 - 17:15
17:15 - 17:30
17:30 - 17:45
17:45 - 18:00
18:00 - 18:15
Stream Max RFC Max delay (s) Max Queue (Veh) Max LOSAverage Demand
(Veh/hr)Total Junction Arrivals (Veh)
B-AC 0.17 9.96 0.2 A 61 91
C-AB 0.18 5.62 0.4 A 104 156
C-A 310 465
A-B 155 233
A-C 504 756
StreamTotal
Demand (Veh/hr)
Junction Arrivals
(Veh)
Capacity (Veh/hr)
RFCThroughput
(Veh/hr)Start queue
(Veh)End queue
(Veh)Delay (s) LOS
B-AC 50 12 508 0.098 49 0.0 0.1 7.838 A
C-AB 72 18 734 0.098 71 0.0 0.2 5.431 A
C-A 268 67 268
A-B 127 32 127
A-C 413 103 413
StreamTotal
Demand (Veh/hr)
Junction Arrivals
(Veh)
Capacity (Veh/hr)
RFCThroughput
(Veh/hr)Start queue
(Veh)End queue
(Veh)Delay (s) LOS
B-AC 59 15 478 0.124 59 0.1 0.1 8.603 A
C-AB 97 24 754 0.129 97 0.2 0.3 5.485 A
C-A 308 77 308
A-B 152 38 152
A-C 494 123 494
StreamTotal
Demand (Veh/hr)
Junction Arrivals
(Veh)
Capacity (Veh/hr)
RFCThroughput
(Veh/hr)Start queue
(Veh)End queue
(Veh)Delay (s) LOS
B-AC 73 18 434 0.167 72 0.1 0.2 9.951 A
C-AB 141 35 784 0.181 141 0.3 0.4 5.609 A
C-A 355 89 355
A-B 186 47 186
A-C 604 151 604
StreamTotal
Demand (Veh/hr)
Junction Arrivals
(Veh)
Capacity (Veh/hr)
RFCThroughput
(Veh/hr)Start queue
(Veh)End queue
(Veh)Delay (s) LOS
B-AC 73 18 434 0.167 73 0.2 0.2 9.965 A
C-AB 142 35 784 0.181 142 0.4 0.4 5.620 A
C-A 355 89 355
A-B 186 47 186
A-C 604 151 604
StreamTotal
Demand (Veh/hr)
Junction Arrivals
(Veh)
Capacity (Veh/hr)
RFCThroughput
(Veh/hr)Start queue
(Veh)End queue
(Veh)Delay (s) LOS
B-AC 59 15 477 0.124 60 0.2 0.1 8.620 A
C-AB 97 24 754 0.129 98 0.4 0.3 5.503 A
C-A 308 77 308
A-B 152 38 152
A-C 494 123 494
Page 22 of 35
17/08/2021file:///C:/Files%20-%20Simon/BTP%20Projects/BTP-2128%20-%20WCM%20White...

StreamTotal
Demand (Veh/hr)
Junction Arrivals
(Veh)
Capacity (Veh/hr)
RFCThroughput
(Veh/hr)Start queue
(Veh)End queue
(Veh)Delay (s) LOS
B-AC 50 12 508 0.098 50 0.1 0.1 7.859 A
C-AB 72 18 734 0.099 73 0.3 0.2 5.451 A
C-A 267 67 267
A-B 127 32 127
A-C 413 103 413
Page 23 of 35
17/08/2021file:///C:/Files%20-%20Simon/BTP%20Projects/BTP-2128%20-%20WCM%20White...

Existing Layout - 2035 Core, AM2
Data Errors and WarningsNo errors or warnings
Junction Network
Junctions
Junction Network Options
Traffic Demand
Demand Set Details
Demand overview (Traffic)
Origin-Destination Data
Vehicle Mix
Results
Junction Name Junction Type Major road direction Junction Delay (s) Junction LOS
1 Junction T-Junction Two-way 2.65 A
Driving side Lighting Network residual capacity (%) First arm reaching threshold
Left Normal/unknown 53 Stream C-AB
IDScenario
nameTime Period
nameTraffic profile
typeStart time (HH:mm)
Finish time (HH:mm)
Time segment length (min)
Run automatically
D8 2035 Core AM2 ONE HOUR 07:45 09:15 15 �
Vehicle mix varies over turn Vehicle mix varies over entry Vehicle mix source PCU Factor for a HV (PCU)
� � HV Percentages 2.00
Arm Linked arm Profile type Use O-D data Average Demand (Veh/hr) Scaling Factor (%)
A - B5345 north ONE HOUR � 461 100.000
B - Coach Rd ONE HOUR � 109 100.000
C - B5345 south ONE HOUR � 567 100.000
Demand (Veh/hr)
To
From
A - B5345 north B - Coach Rd C - B5345 south
A - B5345 north 0 103 358
B - Coach Rd 25 0 84
C - B5345 south 426 141 0
Heavy Vehicle Percentages
To
From
A - B5345 north B - Coach Rd C - B5345 south
A - B5345 north 0 1 2
B - Coach Rd 4 0 0
C - B5345 south 2 0 0
Page 24 of 35
17/08/2021file:///C:/Files%20-%20Simon/BTP%20Projects/BTP-2128%20-%20WCM%20White...

Results Summary for whole modelled period
Main Results for each time segment
07:45 - 08:00
08:00 - 08:15
08:15 - 08:30
08:30 - 08:45
08:45 - 09:00
09:00 - 09:15
Stream Max RFC Max delay (s) Max Queue (Veh) Max LOSAverage Demand
(Veh/hr)Total Junction Arrivals (Veh)
B-AC 0.25 10.00 0.3 B 100 150
C-AB 0.40 7.01 1.1 A 254 382
C-A 266 399
A-B 95 142
A-C 329 493
StreamTotal
Demand (Veh/hr)
Junction Arrivals
(Veh)
Capacity (Veh/hr)
RFCThroughput
(Veh/hr)Start queue
(Veh)End queue
(Veh)Delay (s) LOS
B-AC 82 21 540 0.152 81 0.0 0.2 7.835 A
C-AB 179 45 789 0.227 177 0.0 0.4 5.874 A
C-A 248 62 248
A-B 78 19 78
A-C 270 67 270
StreamTotal
Demand (Veh/hr)
Junction Arrivals
(Veh)
Capacity (Veh/hr)
RFCThroughput
(Veh/hr)Start queue
(Veh)End queue
(Veh)Delay (s) LOS
B-AC 98 24 516 0.190 98 0.2 0.2 8.612 A
C-AB 239 60 819 0.292 238 0.4 0.6 6.215 A
C-A 270 68 270
A-B 93 23 93
A-C 322 80 322
StreamTotal
Demand (Veh/hr)
Junction Arrivals
(Veh)
Capacity (Veh/hr)
RFCThroughput
(Veh/hr)Start queue
(Veh)End queue
(Veh)Delay (s) LOS
B-AC 120 30 480 0.250 120 0.2 0.3 9.974 A
C-AB 343 86 860 0.399 342 0.6 1.1 6.955 A
C-A 281 70 281
A-B 113 28 113
A-C 394 99 394
StreamTotal
Demand (Veh/hr)
Junction Arrivals
(Veh)
Capacity (Veh/hr)
RFCThroughput
(Veh/hr)Start queue
(Veh)End queue
(Veh)Delay (s) LOS
B-AC 120 30 480 0.250 120 0.3 0.3 10.001 B
C-AB 344 86 861 0.400 344 1.1 1.1 7.008 A
C-A 280 70 280
A-B 113 28 113
A-C 394 99 394
StreamTotal
Demand (Veh/hr)
Junction Arrivals
(Veh)
Capacity (Veh/hr)
RFCThroughput
(Veh/hr)Start queue
(Veh)End queue
(Veh)Delay (s) LOS
B-AC 98 24 515 0.190 98 0.3 0.2 8.642 A
C-AB 240 60 820 0.293 242 1.1 0.7 6.279 A
C-A 269 67 269
A-B 93 23 93
A-C 322 80 322
Page 25 of 35
17/08/2021file:///C:/Files%20-%20Simon/BTP%20Projects/BTP-2128%20-%20WCM%20White...

StreamTotal
Demand (Veh/hr)
Junction Arrivals
(Veh)
Capacity (Veh/hr)
RFCThroughput
(Veh/hr)Start queue
(Veh)End queue
(Veh)Delay (s) LOS
B-AC 82 21 540 0.152 82 0.2 0.2 7.871 A
C-AB 180 45 790 0.228 181 0.7 0.5 5.934 A
C-A 247 62 247
A-B 78 19 78
A-C 270 67 270
Page 26 of 35
17/08/2021file:///C:/Files%20-%20Simon/BTP%20Projects/BTP-2128%20-%20WCM%20White...
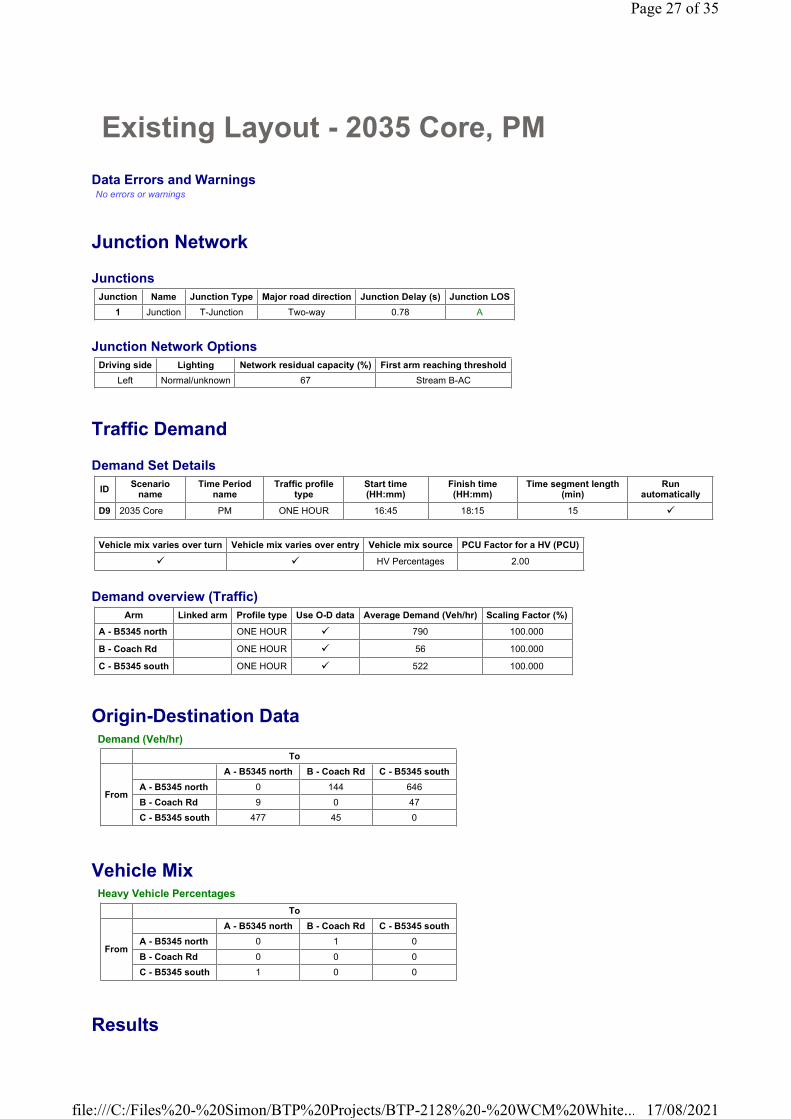
Existing Layout - 2035 Core, PM
Data Errors and WarningsNo errors or warnings
Junction Network
Junctions
Junction Network Options
Traffic Demand
Demand Set Details
Demand overview (Traffic)
Origin-Destination Data
Vehicle Mix
Results
Junction Name Junction Type Major road direction Junction Delay (s) Junction LOS
1 Junction T-Junction Two-way 0.78 A
Driving side Lighting Network residual capacity (%) First arm reaching threshold
Left Normal/unknown 67 Stream B-AC
IDScenario
nameTime Period
nameTraffic profile
typeStart time (HH:mm)
Finish time (HH:mm)
Time segment length (min)
Run automatically
D9 2035 Core PM ONE HOUR 16:45 18:15 15 �
Vehicle mix varies over turn Vehicle mix varies over entry Vehicle mix source PCU Factor for a HV (PCU)
� � HV Percentages 2.00
Arm Linked arm Profile type Use O-D data Average Demand (Veh/hr) Scaling Factor (%)
A - B5345 north ONE HOUR � 790 100.000
B - Coach Rd ONE HOUR � 56 100.000
C - B5345 south ONE HOUR � 522 100.000
Demand (Veh/hr)
To
From
A - B5345 north B - Coach Rd C - B5345 south
A - B5345 north 0 144 646
B - Coach Rd 9 0 47
C - B5345 south 477 45 0
Heavy Vehicle Percentages
To
From
A - B5345 north B - Coach Rd C - B5345 south
A - B5345 north 0 1 0
B - Coach Rd 0 0 0
C - B5345 south 1 0 0
Page 27 of 35
17/08/2021file:///C:/Files%20-%20Simon/BTP%20Projects/BTP-2128%20-%20WCM%20White...

Results Summary for whole modelled period
Main Results for each time segment
16:45 - 17:00
17:00 - 17:15
17:15 - 17:30
17:30 - 17:45
17:45 - 18:00
18:00 - 18:15
Stream Max RFC Max delay (s) Max Queue (Veh) Max LOSAverage Demand
(Veh/hr)Total Junction Arrivals (Veh)
B-AC 0.14 9.65 0.2 A 51 77
C-AB 0.16 5.12 0.4 A 95 143
C-A 384 576
A-B 132 198
A-C 593 889
StreamTotal
Demand (Veh/hr)
Junction Arrivals
(Veh)
Capacity (Veh/hr)
RFCThroughput
(Veh/hr)Start queue
(Veh)End queue
(Veh)Delay (s) LOS
B-AC 42 11 515 0.082 42 0.0 0.1 7.608 A
C-AB 64 16 768 0.083 63 0.0 0.2 5.105 A
C-A 329 82 329
A-B 108 27 108
A-C 486 122 486
StreamTotal
Demand (Veh/hr)
Junction Arrivals
(Veh)
Capacity (Veh/hr)
RFCThroughput
(Veh/hr)Start queue
(Veh)End queue
(Veh)Delay (s) LOS
B-AC 50 13 482 0.104 50 0.1 0.1 8.339 A
C-AB 88 22 796 0.111 88 0.2 0.2 5.084 A
C-A 381 95 381
A-B 129 32 129
A-C 581 145 581
StreamTotal
Demand (Veh/hr)
Junction Arrivals
(Veh)
Capacity (Veh/hr)
RFCThroughput
(Veh/hr)Start queue
(Veh)End queue
(Veh)Delay (s) LOS
B-AC 62 15 435 0.142 61 0.1 0.2 9.637 A
C-AB 134 33 838 0.159 133 0.2 0.4 5.109 A
C-A 441 110 441
A-B 159 40 159
A-C 711 178 711
StreamTotal
Demand (Veh/hr)
Junction Arrivals
(Veh)
Capacity (Veh/hr)
RFCThroughput
(Veh/hr)Start queue
(Veh)End queue
(Veh)Delay (s) LOS
B-AC 62 15 435 0.142 62 0.2 0.2 9.649 A
C-AB 134 33 839 0.160 134 0.4 0.4 5.120 A
C-A 441 110 441
A-B 159 40 159
A-C 711 178 711
StreamTotal
Demand (Veh/hr)
Junction Arrivals
(Veh)
Capacity (Veh/hr)
RFCThroughput
(Veh/hr)Start queue
(Veh)End queue
(Veh)Delay (s) LOS
B-AC 50 13 482 0.105 51 0.2 0.1 8.351 A
C-AB 89 22 797 0.111 89 0.4 0.3 5.106 A
C-A 381 95 381
A-B 129 32 129
A-C 581 145 581
Page 28 of 35
17/08/2021file:///C:/Files%20-%20Simon/BTP%20Projects/BTP-2128%20-%20WCM%20White...

StreamTotal
Demand (Veh/hr)
Junction Arrivals
(Veh)
Capacity (Veh/hr)
RFCThroughput
(Veh/hr)Start queue
(Veh)End queue
(Veh)Delay (s) LOS
B-AC 42 11 515 0.082 42 0.1 0.1 7.625 A
C-AB 64 16 769 0.083 64 0.3 0.2 5.121 A
C-A 329 82 329
A-B 108 27 108
A-C 486 122 486
Page 29 of 35
17/08/2021file:///C:/Files%20-%20Simon/BTP%20Projects/BTP-2128%20-%20WCM%20White...
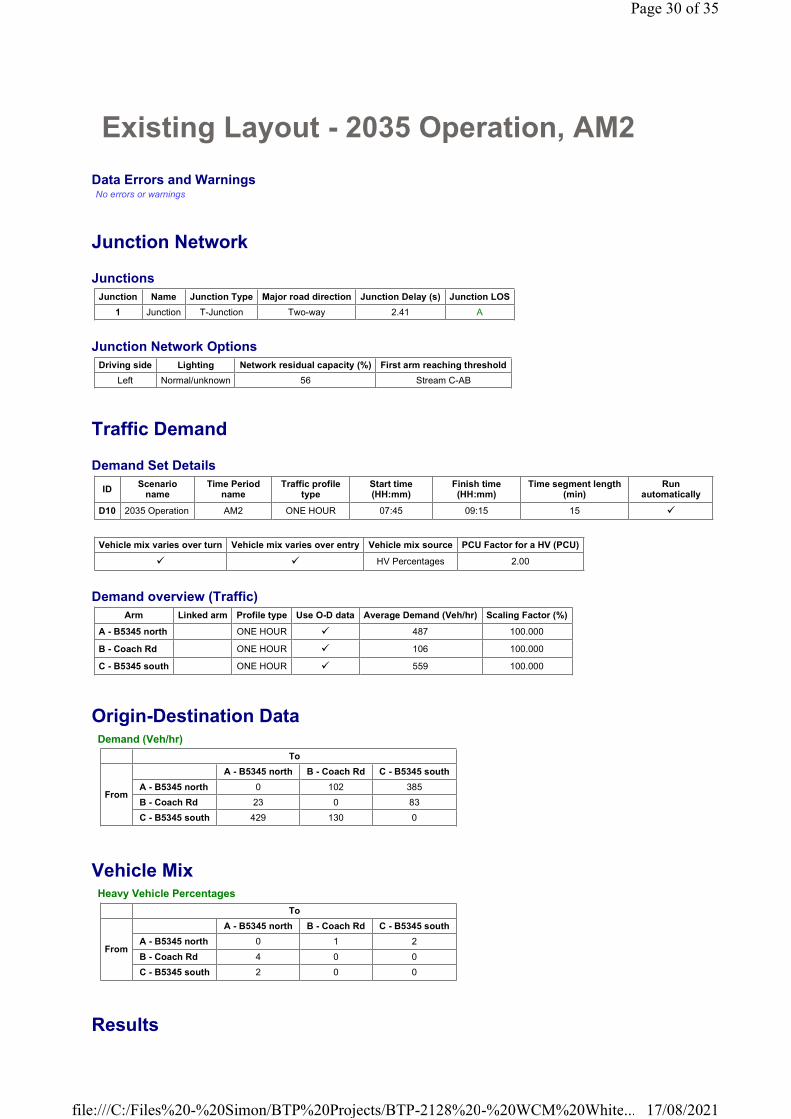
Existing Layout - 2035 Operation, AM2
Data Errors and WarningsNo errors or warnings
Junction Network
Junctions
Junction Network Options
Traffic Demand
Demand Set Details
Demand overview (Traffic)
Origin-Destination Data
Vehicle Mix
Results
Junction Name Junction Type Major road direction Junction Delay (s) Junction LOS
1 Junction T-Junction Two-way 2.41 A
Driving side Lighting Network residual capacity (%) First arm reaching threshold
Left Normal/unknown 56 Stream C-AB
IDScenario
nameTime Period
nameTraffic profile
typeStart time (HH:mm)
Finish time (HH:mm)
Time segment length (min)
Run automatically
D10 2035 Operation AM2 ONE HOUR 07:45 09:15 15 �
Vehicle mix varies over turn Vehicle mix varies over entry Vehicle mix source PCU Factor for a HV (PCU)
� � HV Percentages 2.00
Arm Linked arm Profile type Use O-D data Average Demand (Veh/hr) Scaling Factor (%)
A - B5345 north ONE HOUR � 487 100.000
B - Coach Rd ONE HOUR � 106 100.000
C - B5345 south ONE HOUR � 559 100.000
Demand (Veh/hr)
To
From
A - B5345 north B - Coach Rd C - B5345 south
A - B5345 north 0 102 385
B - Coach Rd 23 0 83
C - B5345 south 429 130 0
Heavy Vehicle Percentages
To
From
A - B5345 north B - Coach Rd C - B5345 south
A - B5345 north 0 1 2
B - Coach Rd 4 0 0
C - B5345 south 2 0 0
Page 30 of 35
17/08/2021file:///C:/Files%20-%20Simon/BTP%20Projects/BTP-2128%20-%20WCM%20White...

Results Summary for whole modelled period
Main Results for each time segment
07:45 - 08:00
08:00 - 08:15
08:15 - 08:30
08:30 - 08:45
08:45 - 09:00
09:00 - 09:15
Stream Max RFC Max delay (s) Max Queue (Veh) Max LOSAverage Demand
(Veh/hr)Total Junction Arrivals (Veh)
B-AC 0.24 9.95 0.3 A 97 146
C-AB 0.37 6.75 1.0 A 237 355
C-A 276 414
A-B 94 140
A-C 353 530
StreamTotal
Demand (Veh/hr)
Junction Arrivals
(Veh)
Capacity (Veh/hr)
RFCThroughput
(Veh/hr)Start queue
(Veh)End queue
(Veh)Delay (s) LOS
B-AC 80 20 540 0.148 79 0.0 0.2 7.802 A
C-AB 166 42 787 0.211 164 0.0 0.4 5.780 A
C-A 255 64 255
A-B 77 19 77
A-C 290 72 290
StreamTotal
Demand (Veh/hr)
Junction Arrivals
(Veh)
Capacity (Veh/hr)
RFCThroughput
(Veh/hr)Start queue
(Veh)End queue
(Veh)Delay (s) LOS
B-AC 95 24 515 0.185 95 0.2 0.2 8.573 A
C-AB 223 56 816 0.273 222 0.4 0.6 6.071 A
C-A 280 70 280
A-B 92 23 92
A-C 346 87 346
StreamTotal
Demand (Veh/hr)
Junction Arrivals
(Veh)
Capacity (Veh/hr)
RFCThroughput
(Veh/hr)Start queue
(Veh)End queue
(Veh)Delay (s) LOS
B-AC 117 29 479 0.244 116 0.2 0.3 9.924 A
C-AB 321 80 857 0.374 319 0.6 1.0 6.703 A
C-A 295 74 295
A-B 112 28 112
A-C 424 106 424
StreamTotal
Demand (Veh/hr)
Junction Arrivals
(Veh)
Capacity (Veh/hr)
RFCThroughput
(Veh/hr)Start queue
(Veh)End queue
(Veh)Delay (s) LOS
B-AC 117 29 479 0.244 117 0.3 0.3 9.949 A
C-AB 322 80 858 0.375 322 1.0 1.0 6.750 A
C-A 294 73 294
A-B 112 28 112
A-C 424 106 424
StreamTotal
Demand (Veh/hr)
Junction Arrivals
(Veh)
Capacity (Veh/hr)
RFCThroughput
(Veh/hr)Start queue
(Veh)End queue
(Veh)Delay (s) LOS
B-AC 95 24 514 0.185 96 0.3 0.2 8.604 A
C-AB 224 56 817 0.274 225 1.0 0.6 6.130 A
C-A 279 70 279
A-B 92 23 92
A-C 346 87 346
Page 31 of 35
17/08/2021file:///C:/Files%20-%20Simon/BTP%20Projects/BTP-2128%20-%20WCM%20White...

StreamTotal
Demand (Veh/hr)
Junction Arrivals
(Veh)
Capacity (Veh/hr)
RFCThroughput
(Veh/hr)Start queue
(Veh)End queue
(Veh)Delay (s) LOS
B-AC 80 20 540 0.148 80 0.2 0.2 7.838 A
C-AB 167 42 788 0.212 168 0.6 0.4 5.834 A
C-A 254 63 254
A-B 77 19 77
A-C 290 72 290
Page 32 of 35
17/08/2021file:///C:/Files%20-%20Simon/BTP%20Projects/BTP-2128%20-%20WCM%20White...
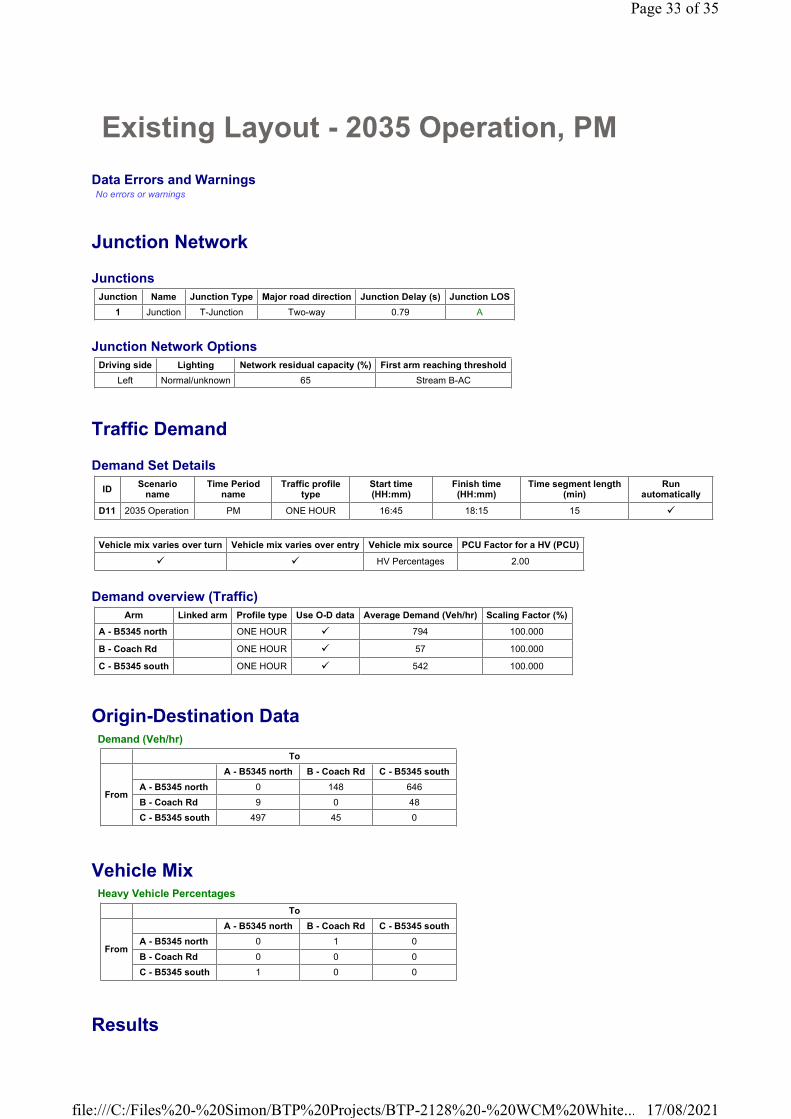
Existing Layout - 2035 Operation, PM
Data Errors and WarningsNo errors or warnings
Junction Network
Junctions
Junction Network Options
Traffic Demand
Demand Set Details
Demand overview (Traffic)
Origin-Destination Data
Vehicle Mix
Results
Junction Name Junction Type Major road direction Junction Delay (s) Junction LOS
1 Junction T-Junction Two-way 0.79 A
Driving side Lighting Network residual capacity (%) First arm reaching threshold
Left Normal/unknown 65 Stream B-AC
IDScenario
nameTime Period
nameTraffic profile
typeStart time (HH:mm)
Finish time (HH:mm)
Time segment length (min)
Run automatically
D11 2035 Operation PM ONE HOUR 16:45 18:15 15 �
Vehicle mix varies over turn Vehicle mix varies over entry Vehicle mix source PCU Factor for a HV (PCU)
� � HV Percentages 2.00
Arm Linked arm Profile type Use O-D data Average Demand (Veh/hr) Scaling Factor (%)
A - B5345 north ONE HOUR � 794 100.000
B - Coach Rd ONE HOUR � 57 100.000
C - B5345 south ONE HOUR � 542 100.000
Demand (Veh/hr)
To
From
A - B5345 north B - Coach Rd C - B5345 south
A - B5345 north 0 148 646
B - Coach Rd 9 0 48
C - B5345 south 497 45 0
Heavy Vehicle Percentages
To
From
A - B5345 north B - Coach Rd C - B5345 south
A - B5345 north 0 1 0
B - Coach Rd 0 0 0
C - B5345 south 1 0 0
Page 33 of 35
17/08/2021file:///C:/Files%20-%20Simon/BTP%20Projects/BTP-2128%20-%20WCM%20White...

Results Summary for whole modelled period
Main Results for each time segment
16:45 - 17:00
17:00 - 17:15
17:15 - 17:30
17:30 - 17:45
17:45 - 18:00
18:00 - 18:15
Stream Max RFC Max delay (s) Max Queue (Veh) Max LOSAverage Demand
(Veh/hr)Total Junction Arrivals (Veh)
B-AC 0.14 9.71 0.2 A 52 78
C-AB 0.16 5.06 0.5 A 99 148
C-A 399 598
A-B 136 204
A-C 593 889
StreamTotal
Demand (Veh/hr)
Junction Arrivals
(Veh)
Capacity (Veh/hr)
RFCThroughput
(Veh/hr)Start queue
(Veh)End queue
(Veh)Delay (s) LOS
B-AC 43 11 514 0.083 43 0.0 0.1 7.625 A
C-AB 65 16 778 0.084 65 0.0 0.2 5.044 A
C-A 343 86 343
A-B 111 28 111
A-C 486 122 486
StreamTotal
Demand (Veh/hr)
Junction Arrivals
(Veh)
Capacity (Veh/hr)
RFCThroughput
(Veh/hr)Start queue
(Veh)End queue
(Veh)Delay (s) LOS
B-AC 51 13 481 0.106 51 0.1 0.1 8.368 A
C-AB 91 23 809 0.112 90 0.2 0.3 5.015 A
C-A 396 99 396
A-B 133 33 133
A-C 581 145 581
StreamTotal
Demand (Veh/hr)
Junction Arrivals
(Veh)
Capacity (Veh/hr)
RFCThroughput
(Veh/hr)Start queue
(Veh)End queue
(Veh)Delay (s) LOS
B-AC 63 16 434 0.145 63 0.1 0.2 9.693 A
C-AB 139 35 854 0.163 138 0.2 0.5 5.034 A
C-A 458 114 458
A-B 163 41 163
A-C 711 178 711
StreamTotal
Demand (Veh/hr)
Junction Arrivals
(Veh)
Capacity (Veh/hr)
RFCThroughput
(Veh/hr)Start queue
(Veh)End queue
(Veh)Delay (s) LOS
B-AC 63 16 434 0.145 63 0.2 0.2 9.705 A
C-AB 139 35 855 0.163 139 0.5 0.5 5.048 A
C-A 458 114 458
A-B 163 41 163
A-C 711 178 711
StreamTotal
Demand (Veh/hr)
Junction Arrivals
(Veh)
Capacity (Veh/hr)
RFCThroughput
(Veh/hr)Start queue
(Veh)End queue
(Veh)Delay (s) LOS
B-AC 51 13 481 0.107 51 0.2 0.1 8.382 A
C-AB 91 23 809 0.113 92 0.5 0.3 5.036 A
C-A 396 99 396
A-B 133 33 133
A-C 581 145 581
Page 34 of 35
17/08/2021file:///C:/Files%20-%20Simon/BTP%20Projects/BTP-2128%20-%20WCM%20White...

StreamTotal
Demand (Veh/hr)
Junction Arrivals
(Veh)
Capacity (Veh/hr)
RFCThroughput
(Veh/hr)Start queue
(Veh)End queue
(Veh)Delay (s) LOS
B-AC 43 11 514 0.083 43 0.1 0.1 7.639 A
C-AB 66 16 779 0.084 66 0.3 0.2 5.062 A
C-A 342 86 342
A-B 111 28 111
A-C 486 122 486
Page 35 of 35
17/08/2021file:///C:/Files%20-%20Simon/BTP%20Projects/BTP-2128%20-%20WCM%20White...
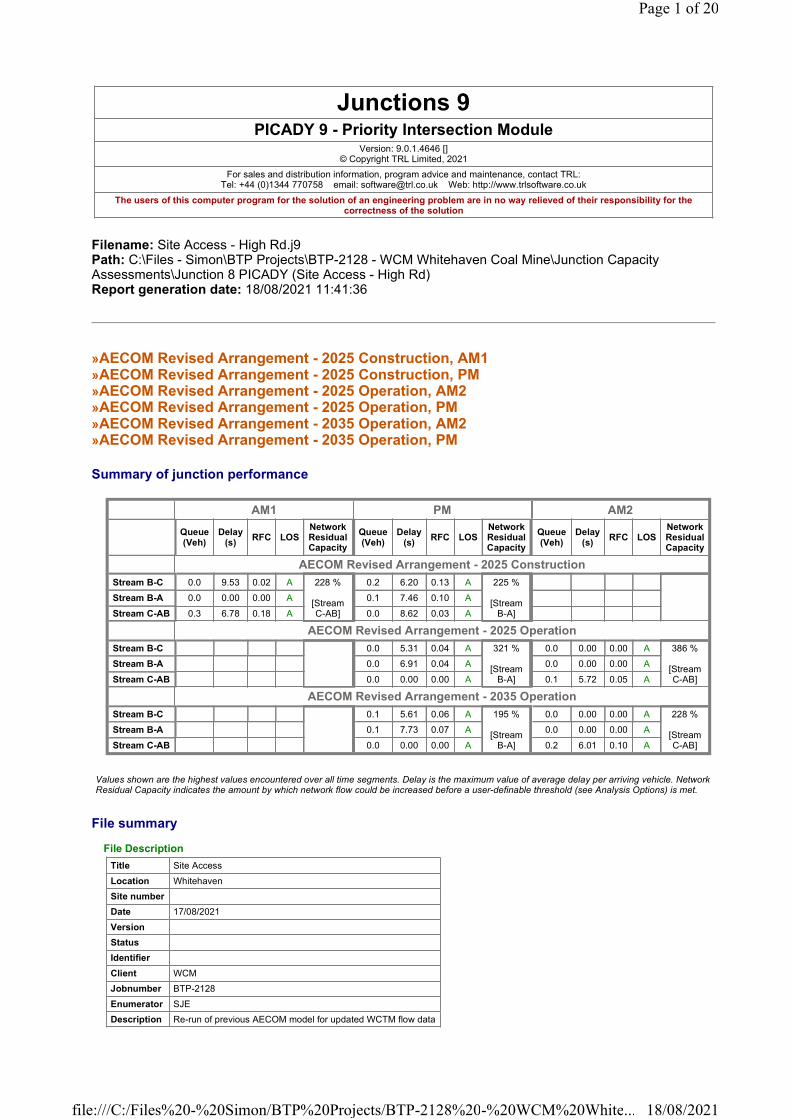
Filename: Site Access - High Rd.j9Path: C:\Files - Simon\BTP Projects\BTP-2128 - WCM Whitehaven Coal Mine\Junction Capacity Assessments\Junction 8 PICADY (Site Access - High Rd)Report generation date: 18/08/2021 11:41:36
»AECOM Revised Arrangement - 2025 Construction, AM1»AECOM Revised Arrangement - 2025 Construction, PM»AECOM Revised Arrangement - 2025 Operation, AM2»AECOM Revised Arrangement - 2025 Operation, PM»AECOM Revised Arrangement - 2035 Operation, AM2»AECOM Revised Arrangement - 2035 Operation, PM
Summary of junction performance
Junctions 9PICADY 9 - Priority Intersection Module
Version: 9.0.1.4646 [] © Copyright TRL Limited, 2021
For sales and distribution information, program advice and maintenance, contact TRL:Tel: +44 (0)1344 770758 email: [email protected] Web: http://www.trlsoftware.co.uk
The users of this computer program for the solution of an engineering problem are in no way relieved of their responsibility for the correctness of the solution
AM1 PM AM2
Queue (Veh)
Delay (s)
RFC LOSNetwork Residual Capacity
Queue (Veh)
Delay (s)
RFC LOSNetwork Residual Capacity
Queue (Veh)
Delay (s)
RFC LOSNetwork Residual Capacity
AECOM Revised Arrangement - 2025 Construction
Stream B-C 0.0 9.53 0.02 A 228 %
[Stream C-AB]
0.2 6.20 0.13 A 225 %
[Stream B-A]
Stream B-A 0.0 0.00 0.00 A 0.1 7.46 0.10 A
Stream C-AB 0.3 6.78 0.18 A 0.0 8.62 0.03 A
AECOM Revised Arrangement - 2025 Operation
Stream B-C 0.0 5.31 0.04 A 321 %
[Stream B-A]
0.0 0.00 0.00 A 386 %
[Stream C-AB]
Stream B-A 0.0 6.91 0.04 A 0.0 0.00 0.00 A
Stream C-AB 0.0 0.00 0.00 A 0.1 5.72 0.05 A
AECOM Revised Arrangement - 2035 Operation
Stream B-C 0.1 5.61 0.06 A 195 %
[Stream B-A]
0.0 0.00 0.00 A 228 %
[Stream C-AB]
Stream B-A 0.1 7.73 0.07 A 0.0 0.00 0.00 A
Stream C-AB 0.0 0.00 0.00 A 0.2 6.01 0.10 A
Values shown are the highest values encountered over all time segments. Delay is the maximum value of average delay per arriving vehicle. Network Residual Capacity indicates the amount by which network flow could be increased before a user-definable threshold (see Analysis Options) is met.
File summary
File Description
Title Site Access
Location Whitehaven
Site number
Date 17/08/2021
Version
Status
Identifier
Client WCM
Jobnumber BTP-2128
Enumerator SJE
Description Re-run of previous AECOM model for updated WCTM flow data
Page 1 of 20
18/08/2021file:///C:/Files%20-%20Simon/BTP%20Projects/BTP-2128%20-%20WCM%20White...
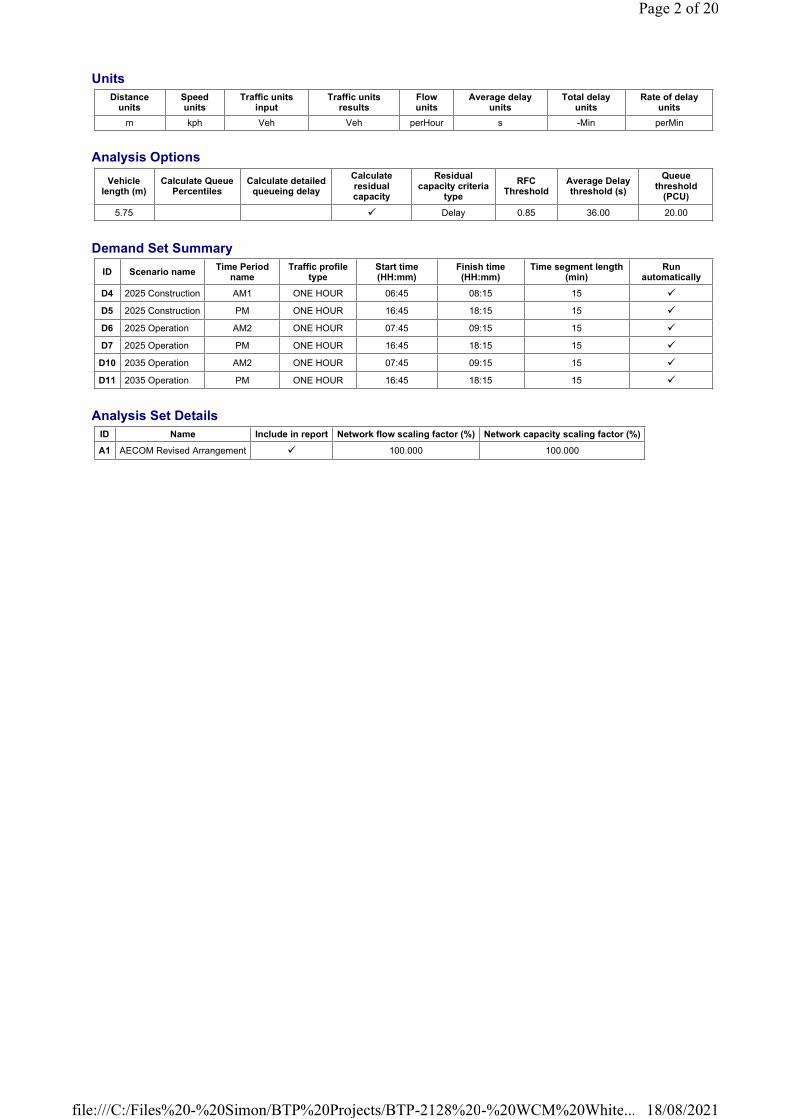
Units
Analysis Options
Demand Set Summary
Analysis Set Details
Distance units
Speed units
Traffic units input
Traffic units results
Flow units
Average delay units
Total delay units
Rate of delay units
m kph Veh Veh perHour s -Min perMin
Vehicle length (m)
Calculate Queue Percentiles
Calculate detailed queueing delay
Calculate residual capacity
Residual capacity criteria
type
RFC Threshold
Average Delay threshold (s)
Queue threshold
(PCU)
5.75 � Delay 0.85 36.00 20.00
ID Scenario nameTime Period
nameTraffic profile
typeStart time (HH:mm)
Finish time (HH:mm)
Time segment length (min)
Run automatically
D4 2025 Construction AM1 ONE HOUR 06:45 08:15 15 �
D5 2025 Construction PM ONE HOUR 16:45 18:15 15 �
D6 2025 Operation AM2 ONE HOUR 07:45 09:15 15 �
D7 2025 Operation PM ONE HOUR 16:45 18:15 15 �
D10 2035 Operation AM2 ONE HOUR 07:45 09:15 15 �
D11 2035 Operation PM ONE HOUR 16:45 18:15 15 �
ID Name Include in report Network flow scaling factor (%) Network capacity scaling factor (%)
A1 AECOM Revised Arrangement � 100.000 100.000
Page 2 of 20
18/08/2021file:///C:/Files%20-%20Simon/BTP%20Projects/BTP-2128%20-%20WCM%20White...
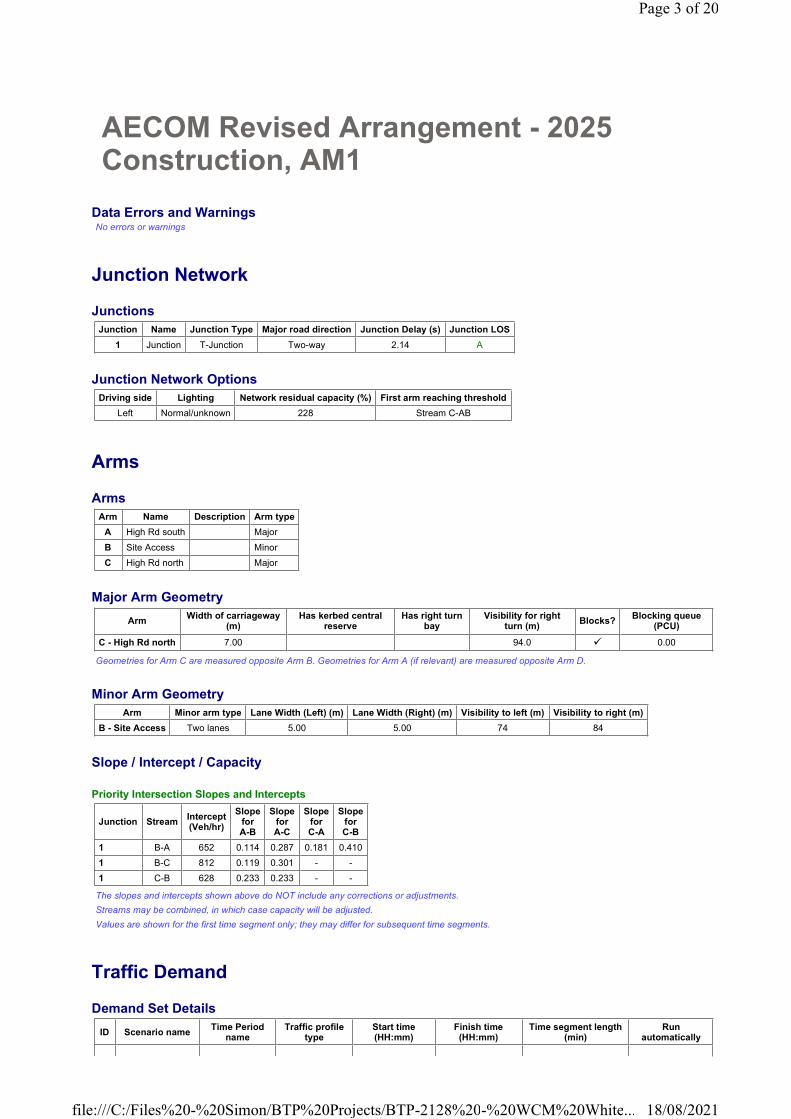
AECOM Revised Arrangement - 2025 Construction, AM1
Data Errors and WarningsNo errors or warnings
Junction Network
Junctions
Junction Network Options
Arms
Arms
Major Arm Geometry
Geometries for Arm C are measured opposite Arm B. Geometries for Arm A (if relevant) are measured opposite Arm D.
Minor Arm Geometry
Slope / Intercept / Capacity
Priority Intersection Slopes and Intercepts
The slopes and intercepts shown above do NOT include any corrections or adjustments.
Streams may be combined, in which case capacity will be adjusted.
Values are shown for the first time segment only; they may differ for subsequent time segments.
Traffic Demand
Demand Set Details
Junction Name Junction Type Major road direction Junction Delay (s) Junction LOS
1 Junction T-Junction Two-way 2.14 A
Driving side Lighting Network residual capacity (%) First arm reaching threshold
Left Normal/unknown 228 Stream C-AB
Arm Name Description Arm type
A High Rd south Major
B Site Access Minor
C High Rd north Major
ArmWidth of carriageway
(m)Has kerbed central
reserveHas right turn
bayVisibility for right
turn (m)Blocks?
Blocking queue (PCU)
C - High Rd north 7.00 94.0 � 0.00
Arm Minor arm type Lane Width (Left) (m) Lane Width (Right) (m) Visibility to left (m) Visibility to right (m)
B - Site Access Two lanes 5.00 5.00 74 84
Junction StreamIntercept(Veh/hr)
SlopeforA-B
SlopeforA-C
SlopeforC-A
SlopeforC-B
1 B-A 652 0.114 0.287 0.181 0.410
1 B-C 812 0.119 0.301 - -
1 C-B 628 0.233 0.233 - -
ID Scenario nameTime Period
nameTraffic profile
typeStart time (HH:mm)
Finish time (HH:mm)
Time segment length (min)
Run automatically
Page 3 of 20
18/08/2021file:///C:/Files%20-%20Simon/BTP%20Projects/BTP-2128%20-%20WCM%20White...
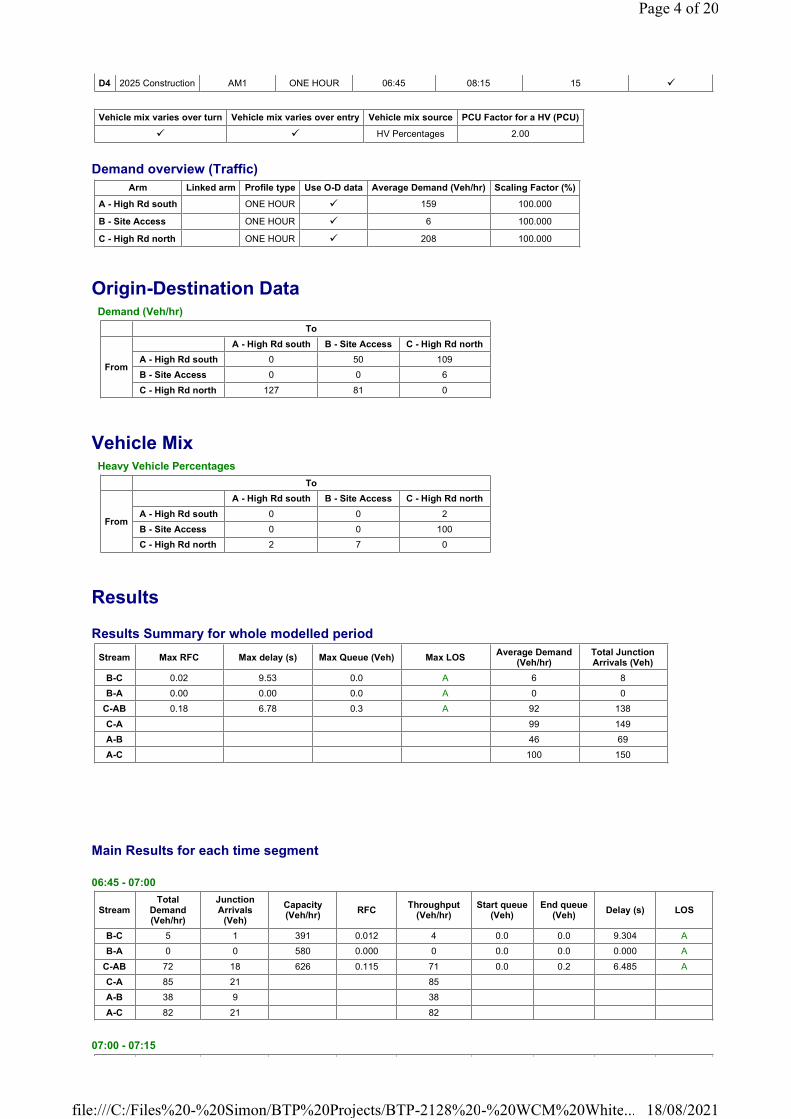
Demand overview (Traffic)
Origin-Destination Data
Vehicle Mix
Results
Results Summary for whole modelled period
Main Results for each time segment
06:45 - 07:00
07:00 - 07:15
D4 2025 Construction AM1 ONE HOUR 06:45 08:15 15 �
Vehicle mix varies over turn Vehicle mix varies over entry Vehicle mix source PCU Factor for a HV (PCU)
� � HV Percentages 2.00
Arm Linked arm Profile type Use O-D data Average Demand (Veh/hr) Scaling Factor (%)
A - High Rd south ONE HOUR � 159 100.000
B - Site Access ONE HOUR � 6 100.000
C - High Rd north ONE HOUR � 208 100.000
Demand (Veh/hr)
To
From
A - High Rd south B - Site Access C - High Rd north
A - High Rd south 0 50 109
B - Site Access 0 0 6
C - High Rd north 127 81 0
Heavy Vehicle Percentages
To
From
A - High Rd south B - Site Access C - High Rd north
A - High Rd south 0 0 2
B - Site Access 0 0 100
C - High Rd north 2 7 0
Stream Max RFC Max delay (s) Max Queue (Veh) Max LOSAverage Demand
(Veh/hr)Total Junction Arrivals (Veh)
B-C 0.02 9.53 0.0 A 6 8
B-A 0.00 0.00 0.0 A 0 0
C-AB 0.18 6.78 0.3 A 92 138
C-A 99 149
A-B 46 69
A-C 100 150
StreamTotal
Demand (Veh/hr)
Junction Arrivals
(Veh)
Capacity (Veh/hr)
RFCThroughput
(Veh/hr)Start queue
(Veh)End queue
(Veh)Delay (s) LOS
B-C 5 1 391 0.012 4 0.0 0.0 9.304 A
B-A 0 0 580 0.000 0 0.0 0.0 0.000 A
C-AB 72 18 626 0.115 71 0.0 0.2 6.485 A
C-A 85 21 85
A-B 38 9 38
A-C 82 21 82
Page 4 of 20
18/08/2021file:///C:/Files%20-%20Simon/BTP%20Projects/BTP-2128%20-%20WCM%20White...

07:15 - 07:30
07:30 - 07:45
07:45 - 08:00
08:00 - 08:15
StreamTotal
Demand (Veh/hr)
Junction Arrivals
(Veh)
Capacity (Veh/hr)
RFCThroughput
(Veh/hr)Start queue
(Veh)End queue
(Veh)Delay (s) LOS
B-C 5 1 388 0.014 5 0.0 0.0 9.397 A
B-A 0 0 565 0.000 0 0.0 0.0 0.000 A
C-AB 89 22 634 0.140 89 0.2 0.2 6.607 A
C-A 98 25 98
A-B 45 11 45
A-C 98 24 98
StreamTotal
Demand (Veh/hr)
Junction Arrivals
(Veh)
Capacity (Veh/hr)
RFCThroughput
(Veh/hr)Start queue
(Veh)End queue
(Veh)Delay (s) LOS
B-C 7 2 384 0.017 7 0.0 0.0 9.526 A
B-A 0 0 546 0.000 0 0.0 0.0 0.000 A
C-AB 114 29 645 0.177 114 0.2 0.3 6.783 A
C-A 115 29 115
A-B 55 14 55
A-C 120 30 120
StreamTotal
Demand (Veh/hr)
Junction Arrivals
(Veh)
Capacity (Veh/hr)
RFCThroughput
(Veh/hr)Start queue
(Veh)End queue
(Veh)Delay (s) LOS
B-C 7 2 384 0.017 7 0.0 0.0 9.526 A
B-A 0 0 546 0.000 0 0.0 0.0 0.000 A
C-AB 114 29 645 0.177 114 0.3 0.3 6.782 A
C-A 115 29 115
A-B 55 14 55
A-C 120 30 120
StreamTotal
Demand (Veh/hr)
Junction Arrivals
(Veh)
Capacity (Veh/hr)
RFCThroughput
(Veh/hr)Start queue
(Veh)End queue
(Veh)Delay (s) LOS
B-C 5 1 388 0.014 5 0.0 0.0 9.400 A
B-A 0 0 565 0.000 0 0.0 0.0 0.000 A
C-AB 89 22 634 0.140 89 0.3 0.2 6.607 A
C-A 98 24 98
A-B 45 11 45
A-C 98 24 98
StreamTotal
Demand (Veh/hr)
Junction Arrivals
(Veh)
Capacity (Veh/hr)
RFCThroughput
(Veh/hr)Start queue
(Veh)End queue
(Veh)Delay (s) LOS
B-C 5 1 391 0.012 5 0.0 0.0 9.306 A
B-A 0 0 579 0.000 0 0.0 0.0 0.000 A
C-AB 72 18 626 0.115 72 0.2 0.2 6.499 A
C-A 85 21 85
A-B 38 9 38
A-C 82 21 82
Page 5 of 20
18/08/2021file:///C:/Files%20-%20Simon/BTP%20Projects/BTP-2128%20-%20WCM%20White...

AECOM Revised Arrangement - 2025 Construction, PM
Data Errors and WarningsNo errors or warnings
Junction Network
Junctions
Junction Network Options
Traffic Demand
Demand Set Details
Demand overview (Traffic)
Origin-Destination Data
Vehicle Mix
Junction Name Junction Type Major road direction Junction Delay (s) Junction LOS
1 Junction T-Junction Two-way 1.86 A
Driving side Lighting Network residual capacity (%) First arm reaching threshold
Left Normal/unknown 225 Stream B-A
ID Scenario nameTime Period
nameTraffic profile
typeStart time (HH:mm)
Finish time (HH:mm)
Time segment length (min)
Run automatically
D5 2025 Construction PM ONE HOUR 16:45 18:15 15 �
Vehicle mix varies over turn Vehicle mix varies over entry Vehicle mix source PCU Factor for a HV (PCU)
� � HV Percentages 2.00
Arm Linked arm Profile type Use O-D data Average Demand (Veh/hr) Scaling Factor (%)
A - High Rd south ONE HOUR � 211 100.000
B - Site Access ONE HOUR � 131 100.000
C - High Rd north ONE HOUR � 211 100.000
Demand (Veh/hr)
To
From
A - High Rd south B - Site Access C - High Rd north
A - High Rd south 0 0 211
B - Site Access 51 0 80
C - High Rd north 205 6 0
Heavy Vehicle Percentages
To
From
A - High Rd south B - Site Access C - High Rd north
A - High Rd south 0 0 1
B - Site Access 0 0 8
C - High Rd north 0 100 0
Page 6 of 20
18/08/2021file:///C:/Files%20-%20Simon/BTP%20Projects/BTP-2128%20-%20WCM%20White...
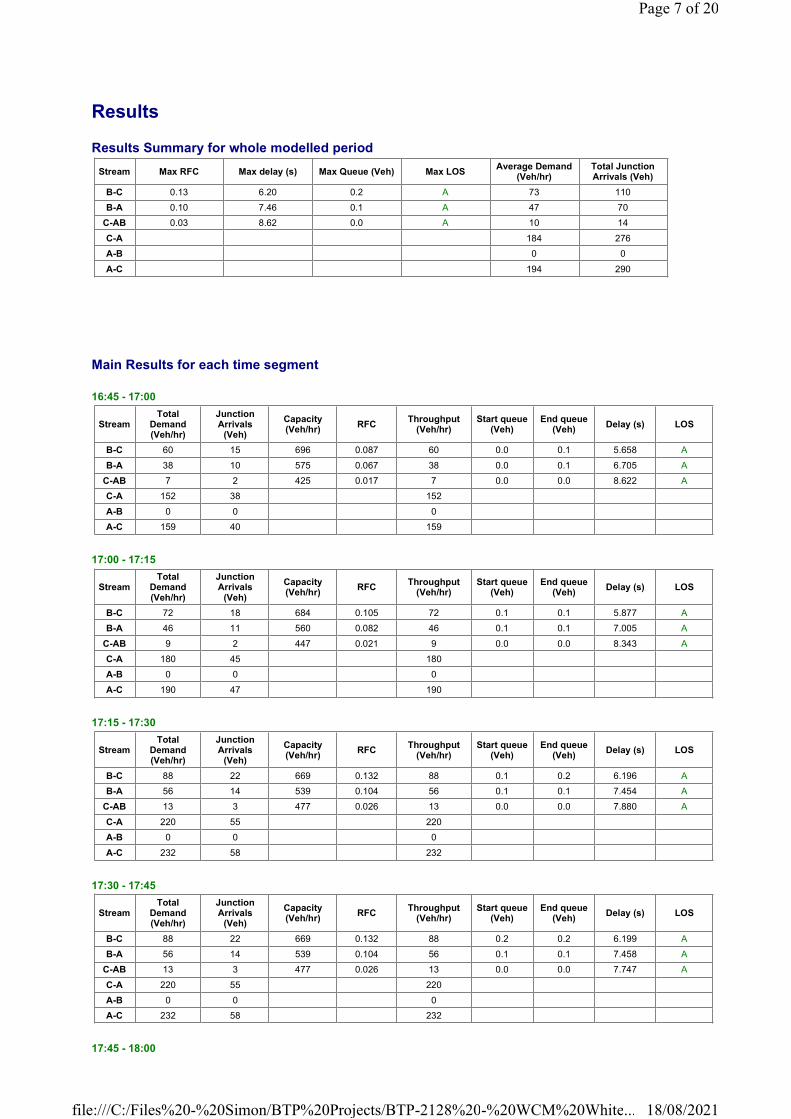
Results
Results Summary for whole modelled period
Main Results for each time segment
16:45 - 17:00
17:00 - 17:15
17:15 - 17:30
17:30 - 17:45
17:45 - 18:00
Stream Max RFC Max delay (s) Max Queue (Veh) Max LOSAverage Demand
(Veh/hr)Total Junction Arrivals (Veh)
B-C 0.13 6.20 0.2 A 73 110
B-A 0.10 7.46 0.1 A 47 70
C-AB 0.03 8.62 0.0 A 10 14
C-A 184 276
A-B 0 0
A-C 194 290
StreamTotal
Demand (Veh/hr)
Junction Arrivals
(Veh)
Capacity (Veh/hr)
RFCThroughput
(Veh/hr)Start queue
(Veh)End queue
(Veh)Delay (s) LOS
B-C 60 15 696 0.087 60 0.0 0.1 5.658 A
B-A 38 10 575 0.067 38 0.0 0.1 6.705 A
C-AB 7 2 425 0.017 7 0.0 0.0 8.622 A
C-A 152 38 152
A-B 0 0 0
A-C 159 40 159
StreamTotal
Demand (Veh/hr)
Junction Arrivals
(Veh)
Capacity (Veh/hr)
RFCThroughput
(Veh/hr)Start queue
(Veh)End queue
(Veh)Delay (s) LOS
B-C 72 18 684 0.105 72 0.1 0.1 5.877 A
B-A 46 11 560 0.082 46 0.1 0.1 7.005 A
C-AB 9 2 447 0.021 9 0.0 0.0 8.343 A
C-A 180 45 180
A-B 0 0 0
A-C 190 47 190
StreamTotal
Demand (Veh/hr)
Junction Arrivals
(Veh)
Capacity (Veh/hr)
RFCThroughput
(Veh/hr)Start queue
(Veh)End queue
(Veh)Delay (s) LOS
B-C 88 22 669 0.132 88 0.1 0.2 6.196 A
B-A 56 14 539 0.104 56 0.1 0.1 7.454 A
C-AB 13 3 477 0.026 13 0.0 0.0 7.880 A
C-A 220 55 220
A-B 0 0 0
A-C 232 58 232
StreamTotal
Demand (Veh/hr)
Junction Arrivals
(Veh)
Capacity (Veh/hr)
RFCThroughput
(Veh/hr)Start queue
(Veh)End queue
(Veh)Delay (s) LOS
B-C 88 22 669 0.132 88 0.2 0.2 6.199 A
B-A 56 14 539 0.104 56 0.1 0.1 7.458 A
C-AB 13 3 477 0.026 13 0.0 0.0 7.747 A
C-A 220 55 220
A-B 0 0 0
A-C 232 58 232
Page 7 of 20
18/08/2021file:///C:/Files%20-%20Simon/BTP%20Projects/BTP-2128%20-%20WCM%20White...

18:00 - 18:15
StreamTotal
Demand (Veh/hr)
Junction Arrivals
(Veh)
Capacity (Veh/hr)
RFCThroughput
(Veh/hr)Start queue
(Veh)End queue
(Veh)Delay (s) LOS
B-C 72 18 684 0.105 72 0.2 0.1 5.882 A
B-A 46 11 560 0.082 46 0.1 0.1 7.011 A
C-AB 9 2 447 0.021 9 0.0 0.0 8.037 A
C-A 180 45 180
A-B 0 0 0
A-C 190 47 190
StreamTotal
Demand (Veh/hr)
Junction Arrivals
(Veh)
Capacity (Veh/hr)
RFCThroughput
(Veh/hr)Start queue
(Veh)End queue
(Veh)Delay (s) LOS
B-C 60 15 696 0.087 60 0.1 0.1 5.667 A
B-A 38 10 575 0.067 38 0.1 0.1 6.713 A
C-AB 7 2 425 0.017 7 0.0 0.0 8.461 A
C-A 152 38 152
A-B 0 0 0
A-C 159 40 159
Page 8 of 20
18/08/2021file:///C:/Files%20-%20Simon/BTP%20Projects/BTP-2128%20-%20WCM%20White...
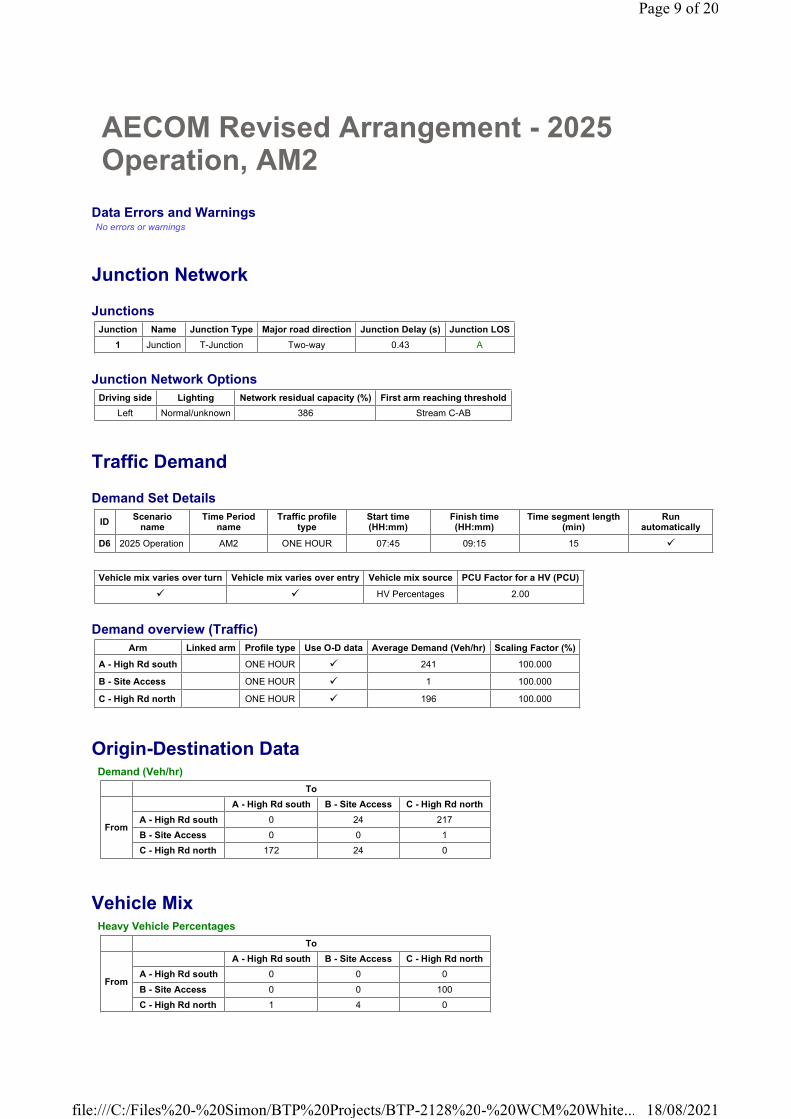
AECOM Revised Arrangement - 2025 Operation, AM2
Data Errors and WarningsNo errors or warnings
Junction Network
Junctions
Junction Network Options
Traffic Demand
Demand Set Details
Demand overview (Traffic)
Origin-Destination Data
Vehicle Mix
Junction Name Junction Type Major road direction Junction Delay (s) Junction LOS
1 Junction T-Junction Two-way 0.43 A
Driving side Lighting Network residual capacity (%) First arm reaching threshold
Left Normal/unknown 386 Stream C-AB
IDScenario
nameTime Period
nameTraffic profile
typeStart time (HH:mm)
Finish time (HH:mm)
Time segment length (min)
Run automatically
D6 2025 Operation AM2 ONE HOUR 07:45 09:15 15 �
Vehicle mix varies over turn Vehicle mix varies over entry Vehicle mix source PCU Factor for a HV (PCU)
� � HV Percentages 2.00
Arm Linked arm Profile type Use O-D data Average Demand (Veh/hr) Scaling Factor (%)
A - High Rd south ONE HOUR � 241 100.000
B - Site Access ONE HOUR � 1 100.000
C - High Rd north ONE HOUR � 196 100.000
Demand (Veh/hr)
To
From
A - High Rd south B - Site Access C - High Rd north
A - High Rd south 0 24 217
B - Site Access 0 0 1
C - High Rd north 172 24 0
Heavy Vehicle Percentages
To
From
A - High Rd south B - Site Access C - High Rd north
A - High Rd south 0 0 0
B - Site Access 0 0 100
C - High Rd north 1 4 0
Page 9 of 20
18/08/2021file:///C:/Files%20-%20Simon/BTP%20Projects/BTP-2128%20-%20WCM%20White...
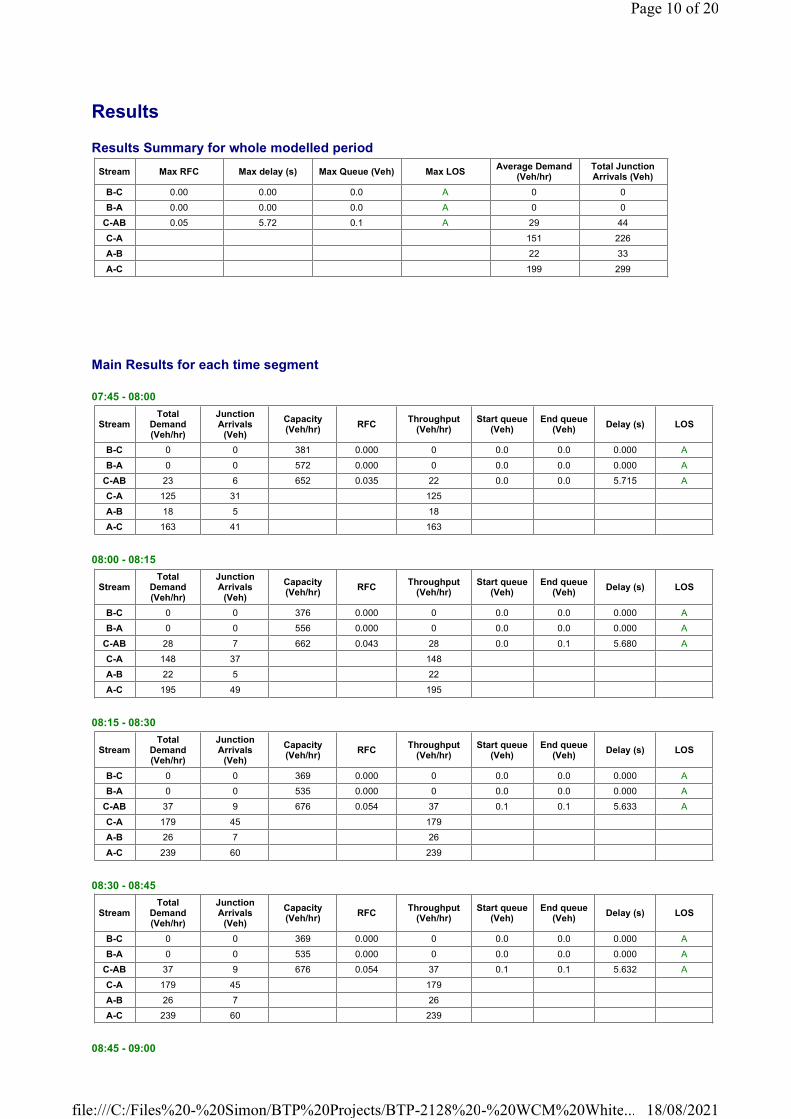
Results
Results Summary for whole modelled period
Main Results for each time segment
07:45 - 08:00
08:00 - 08:15
08:15 - 08:30
08:30 - 08:45
08:45 - 09:00
Stream Max RFC Max delay (s) Max Queue (Veh) Max LOSAverage Demand
(Veh/hr)Total Junction Arrivals (Veh)
B-C 0.00 0.00 0.0 A 0 0
B-A 0.00 0.00 0.0 A 0 0
C-AB 0.05 5.72 0.1 A 29 44
C-A 151 226
A-B 22 33
A-C 199 299
StreamTotal
Demand (Veh/hr)
Junction Arrivals
(Veh)
Capacity (Veh/hr)
RFCThroughput
(Veh/hr)Start queue
(Veh)End queue
(Veh)Delay (s) LOS
B-C 0 0 381 0.000 0 0.0 0.0 0.000 A
B-A 0 0 572 0.000 0 0.0 0.0 0.000 A
C-AB 23 6 652 0.035 22 0.0 0.0 5.715 A
C-A 125 31 125
A-B 18 5 18
A-C 163 41 163
StreamTotal
Demand (Veh/hr)
Junction Arrivals
(Veh)
Capacity (Veh/hr)
RFCThroughput
(Veh/hr)Start queue
(Veh)End queue
(Veh)Delay (s) LOS
B-C 0 0 376 0.000 0 0.0 0.0 0.000 A
B-A 0 0 556 0.000 0 0.0 0.0 0.000 A
C-AB 28 7 662 0.043 28 0.0 0.1 5.680 A
C-A 148 37 148
A-B 22 5 22
A-C 195 49 195
StreamTotal
Demand (Veh/hr)
Junction Arrivals
(Veh)
Capacity (Veh/hr)
RFCThroughput
(Veh/hr)Start queue
(Veh)End queue
(Veh)Delay (s) LOS
B-C 0 0 369 0.000 0 0.0 0.0 0.000 A
B-A 0 0 535 0.000 0 0.0 0.0 0.000 A
C-AB 37 9 676 0.054 37 0.1 0.1 5.633 A
C-A 179 45 179
A-B 26 7 26
A-C 239 60 239
StreamTotal
Demand (Veh/hr)
Junction Arrivals
(Veh)
Capacity (Veh/hr)
RFCThroughput
(Veh/hr)Start queue
(Veh)End queue
(Veh)Delay (s) LOS
B-C 0 0 369 0.000 0 0.0 0.0 0.000 A
B-A 0 0 535 0.000 0 0.0 0.0 0.000 A
C-AB 37 9 676 0.054 37 0.1 0.1 5.632 A
C-A 179 45 179
A-B 26 7 26
A-C 239 60 239
Page 10 of 20
18/08/2021file:///C:/Files%20-%20Simon/BTP%20Projects/BTP-2128%20-%20WCM%20White...

09:00 - 09:15
StreamTotal
Demand (Veh/hr)
Junction Arrivals
(Veh)
Capacity (Veh/hr)
RFCThroughput
(Veh/hr)Start queue
(Veh)End queue
(Veh)Delay (s) LOS
B-C 0 0 376 0.000 0 0.0 0.0 0.000 A
B-A 0 0 556 0.000 0 0.0 0.0 0.000 A
C-AB 28 7 662 0.043 28 0.1 0.1 5.678 A
C-A 148 37 148
A-B 22 5 22
A-C 195 49 195
StreamTotal
Demand (Veh/hr)
Junction Arrivals
(Veh)
Capacity (Veh/hr)
RFCThroughput
(Veh/hr)Start queue
(Veh)End queue
(Veh)Delay (s) LOS
B-C 0 0 381 0.000 0 0.0 0.0 0.000 A
B-A 0 0 572 0.000 0 0.0 0.0 0.000 A
C-AB 23 6 652 0.035 23 0.1 0.0 5.715 A
C-A 125 31 125
A-B 18 5 18
A-C 163 41 163
Page 11 of 20
18/08/2021file:///C:/Files%20-%20Simon/BTP%20Projects/BTP-2128%20-%20WCM%20White...
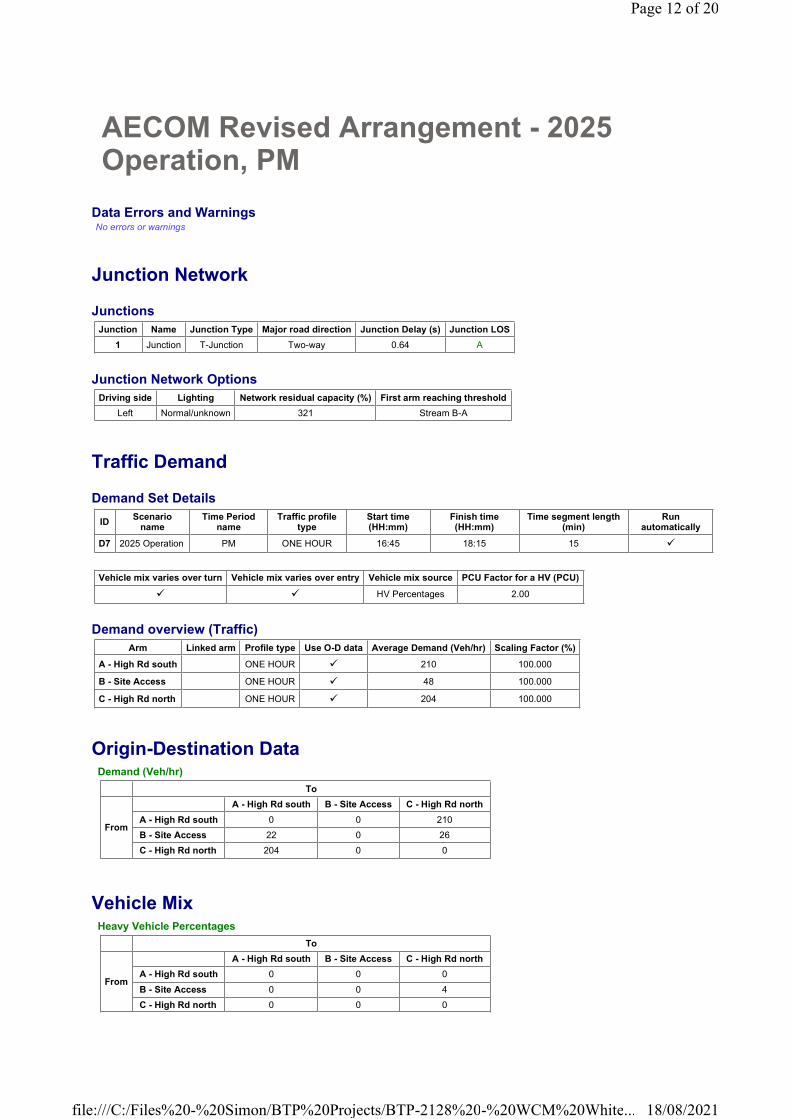
AECOM Revised Arrangement - 2025 Operation, PM
Data Errors and WarningsNo errors or warnings
Junction Network
Junctions
Junction Network Options
Traffic Demand
Demand Set Details
Demand overview (Traffic)
Origin-Destination Data
Vehicle Mix
Junction Name Junction Type Major road direction Junction Delay (s) Junction LOS
1 Junction T-Junction Two-way 0.64 A
Driving side Lighting Network residual capacity (%) First arm reaching threshold
Left Normal/unknown 321 Stream B-A
IDScenario
nameTime Period
nameTraffic profile
typeStart time (HH:mm)
Finish time (HH:mm)
Time segment length (min)
Run automatically
D7 2025 Operation PM ONE HOUR 16:45 18:15 15 �
Vehicle mix varies over turn Vehicle mix varies over entry Vehicle mix source PCU Factor for a HV (PCU)
� � HV Percentages 2.00
Arm Linked arm Profile type Use O-D data Average Demand (Veh/hr) Scaling Factor (%)
A - High Rd south ONE HOUR � 210 100.000
B - Site Access ONE HOUR � 48 100.000
C - High Rd north ONE HOUR � 204 100.000
Demand (Veh/hr)
To
From
A - High Rd south B - Site Access C - High Rd north
A - High Rd south 0 0 210
B - Site Access 22 0 26
C - High Rd north 204 0 0
Heavy Vehicle Percentages
To
From
A - High Rd south B - Site Access C - High Rd north
A - High Rd south 0 0 0
B - Site Access 0 0 4
C - High Rd north 0 0 0
Page 12 of 20
18/08/2021file:///C:/Files%20-%20Simon/BTP%20Projects/BTP-2128%20-%20WCM%20White...

Results
Results Summary for whole modelled period
Main Results for each time segment
16:45 - 17:00
17:00 - 17:15
17:15 - 17:30
17:30 - 17:45
17:45 - 18:00
Stream Max RFC Max delay (s) Max Queue (Veh) Max LOSAverage Demand
(Veh/hr)Total Junction Arrivals (Veh)
B-C 0.04 5.31 0.0 A 24 36
B-A 0.04 6.91 0.0 A 20 30
C-AB 0.00 0.00 0.0 A 0 0
C-A 187 281
A-B 0 0
A-C 193 289
StreamTotal
Demand (Veh/hr)
Junction Arrivals
(Veh)
Capacity (Veh/hr)
RFCThroughput
(Veh/hr)Start queue
(Veh)End queue
(Veh)Delay (s) LOS
B-C 20 5 730 0.027 19 0.0 0.0 5.066 A
B-A 17 4 579 0.029 16 0.0 0.0 6.393 A
C-AB 0 0 592 0.000 0 0.0 0.0 0.000 A
C-A 154 38 154
A-B 0 0 0
A-C 158 40 158
StreamTotal
Demand (Veh/hr)
Junction Arrivals
(Veh)
Capacity (Veh/hr)
RFCThroughput
(Veh/hr)Start queue
(Veh)End queue
(Veh)Delay (s) LOS
B-C 23 6 720 0.032 23 0.0 0.0 5.166 A
B-A 20 5 565 0.035 20 0.0 0.0 6.600 A
C-AB 0 0 584 0.000 0 0.0 0.0 0.000 A
C-A 183 46 183
A-B 0 0 0
A-C 189 47 189
StreamTotal
Demand (Veh/hr)
Junction Arrivals
(Veh)
Capacity (Veh/hr)
RFCThroughput
(Veh/hr)Start queue
(Veh)End queue
(Veh)Delay (s) LOS
B-C 29 7 706 0.041 29 0.0 0.0 5.312 A
B-A 24 6 545 0.044 24 0.0 0.0 6.905 A
C-AB 0 0 575 0.000 0 0.0 0.0 0.000 A
C-A 225 56 225
A-B 0 0 0
A-C 231 58 231
StreamTotal
Demand (Veh/hr)
Junction Arrivals
(Veh)
Capacity (Veh/hr)
RFCThroughput
(Veh/hr)Start queue
(Veh)End queue
(Veh)Delay (s) LOS
B-C 29 7 706 0.041 29 0.0 0.0 5.312 A
B-A 24 6 545 0.044 24 0.0 0.0 6.905 A
C-AB 0 0 575 0.000 0 0.0 0.0 0.000 A
C-A 225 56 225
A-B 0 0 0
A-C 231 58 231
Page 13 of 20
18/08/2021file:///C:/Files%20-%20Simon/BTP%20Projects/BTP-2128%20-%20WCM%20White...

18:00 - 18:15
StreamTotal
Demand (Veh/hr)
Junction Arrivals
(Veh)
Capacity (Veh/hr)
RFCThroughput
(Veh/hr)Start queue
(Veh)End queue
(Veh)Delay (s) LOS
B-C 23 6 720 0.032 23 0.0 0.0 5.167 A
B-A 20 5 565 0.035 20 0.0 0.0 6.604 A
C-AB 0 0 584 0.000 0 0.0 0.0 0.000 A
C-A 183 46 183
A-B 0 0 0
A-C 189 47 189
StreamTotal
Demand (Veh/hr)
Junction Arrivals
(Veh)
Capacity (Veh/hr)
RFCThroughput
(Veh/hr)Start queue
(Veh)End queue
(Veh)Delay (s) LOS
B-C 20 5 730 0.027 20 0.0 0.0 5.067 A
B-A 17 4 579 0.029 17 0.0 0.0 6.399 A
C-AB 0 0 592 0.000 0 0.0 0.0 0.000 A
C-A 154 38 154
A-B 0 0 0
A-C 158 40 158
Page 14 of 20
18/08/2021file:///C:/Files%20-%20Simon/BTP%20Projects/BTP-2128%20-%20WCM%20White...

AECOM Revised Arrangement - 2035 Operation, AM2
Data Errors and WarningsNo errors or warnings
Junction Network
Junctions
Junction Network Options
Traffic Demand
Demand Set Details
Demand overview (Traffic)
Origin-Destination Data
Vehicle Mix
Junction Name Junction Type Major road direction Junction Delay (s) Junction LOS
1 Junction T-Junction Two-way 0.52 A
Driving side Lighting Network residual capacity (%) First arm reaching threshold
Left Normal/unknown 228 Stream C-AB
IDScenario
nameTime Period
nameTraffic profile
typeStart time (HH:mm)
Finish time (HH:mm)
Time segment length (min)
Run automatically
D10 2035 Operation AM2 ONE HOUR 07:45 09:15 15 �
Vehicle mix varies over turn Vehicle mix varies over entry Vehicle mix source PCU Factor for a HV (PCU)
� � HV Percentages 2.00
Arm Linked arm Profile type Use O-D data Average Demand (Veh/hr) Scaling Factor (%)
A - High Rd south ONE HOUR � 404 100.000
B - Site Access ONE HOUR � 1 100.000
C - High Rd north ONE HOUR � 235 100.000
Demand (Veh/hr)
To
From
A - High Rd south B - Site Access C - High Rd north
A - High Rd south 0 32 372
B - Site Access 0 0 1
C - High Rd north 196 39 0
Heavy Vehicle Percentages
To
From
A - High Rd south B - Site Access C - High Rd north
A - High Rd south 0 0 0
B - Site Access 0 0 100
C - High Rd north 1 3 0
Page 15 of 20
18/08/2021file:///C:/Files%20-%20Simon/BTP%20Projects/BTP-2128%20-%20WCM%20White...

Results
Results Summary for whole modelled period
Main Results for each time segment
07:45 - 08:00
08:00 - 08:15
08:15 - 08:30
08:30 - 08:45
08:45 - 09:00
Stream Max RFC Max delay (s) Max Queue (Veh) Max LOSAverage Demand
(Veh/hr)Total Junction Arrivals (Veh)
B-C 0.00 0.00 0.0 A 0 0
B-A 0.00 0.00 0.0 A 0 0
C-AB 0.10 6.01 0.2 A 50 75
C-A 166 248
A-B 29 44
A-C 341 512
StreamTotal
Demand (Veh/hr)
Junction Arrivals
(Veh)
Capacity (Veh/hr)
RFCThroughput
(Veh/hr)Start queue
(Veh)End queue
(Veh)Delay (s) LOS
B-C 0 0 363 0.000 0 0.0 0.0 0.000 A
B-A 0 0 530 0.000 0 0.0 0.0 0.000 A
C-AB 38 10 644 0.059 38 0.0 0.1 5.935 A
C-A 139 35 139
A-B 24 6 24
A-C 280 70 280
StreamTotal
Demand (Veh/hr)
Junction Arrivals
(Veh)
Capacity (Veh/hr)
RFCThroughput
(Veh/hr)Start queue
(Veh)End queue
(Veh)Delay (s) LOS
B-C 0 0 354 0.000 0 0.0 0.0 0.000 A
B-A 0 0 506 0.000 0 0.0 0.0 0.000 A
C-AB 48 12 652 0.074 48 0.1 0.1 5.965 A
C-A 163 41 163
A-B 29 7 29
A-C 334 84 334
StreamTotal
Demand (Veh/hr)
Junction Arrivals
(Veh)
Capacity (Veh/hr)
RFCThroughput
(Veh/hr)Start queue
(Veh)End queue
(Veh)Delay (s) LOS
B-C 0 0 342 0.000 0 0.0 0.0 0.000 A
B-A 0 0 473 0.000 0 0.0 0.0 0.000 A
C-AB 64 16 664 0.096 64 0.1 0.2 6.006 A
C-A 195 49 195
A-B 35 9 35
A-C 410 102 410
StreamTotal
Demand (Veh/hr)
Junction Arrivals
(Veh)
Capacity (Veh/hr)
RFCThroughput
(Veh/hr)Start queue
(Veh)End queue
(Veh)Delay (s) LOS
B-C 0 0 342 0.000 0 0.0 0.0 0.000 A
B-A 0 0 473 0.000 0 0.0 0.0 0.000 A
C-AB 64 16 664 0.096 64 0.2 0.2 6.004 A
C-A 195 49 195
A-B 35 9 35
A-C 410 102 410
Page 16 of 20
18/08/2021file:///C:/Files%20-%20Simon/BTP%20Projects/BTP-2128%20-%20WCM%20White...
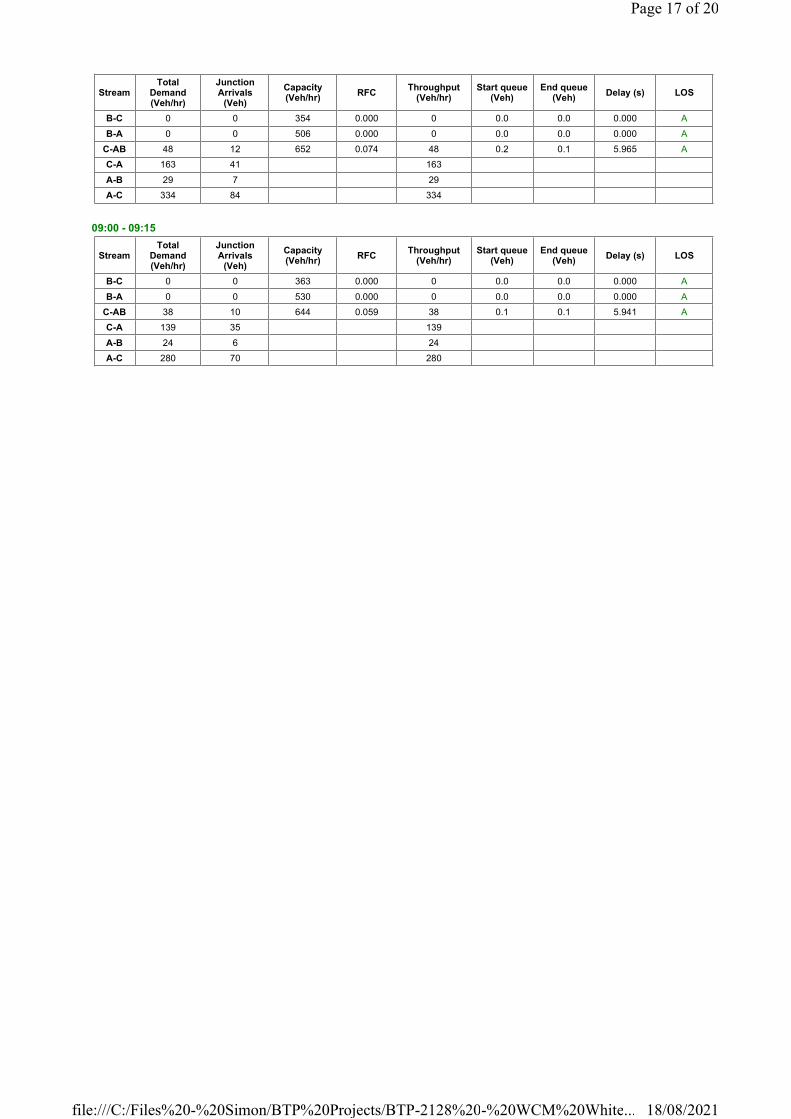
09:00 - 09:15
StreamTotal
Demand (Veh/hr)
Junction Arrivals
(Veh)
Capacity (Veh/hr)
RFCThroughput
(Veh/hr)Start queue
(Veh)End queue
(Veh)Delay (s) LOS
B-C 0 0 354 0.000 0 0.0 0.0 0.000 A
B-A 0 0 506 0.000 0 0.0 0.0 0.000 A
C-AB 48 12 652 0.074 48 0.2 0.1 5.965 A
C-A 163 41 163
A-B 29 7 29
A-C 334 84 334
StreamTotal
Demand (Veh/hr)
Junction Arrivals
(Veh)
Capacity (Veh/hr)
RFCThroughput
(Veh/hr)Start queue
(Veh)End queue
(Veh)Delay (s) LOS
B-C 0 0 363 0.000 0 0.0 0.0 0.000 A
B-A 0 0 530 0.000 0 0.0 0.0 0.000 A
C-AB 38 10 644 0.059 38 0.1 0.1 5.941 A
C-A 139 35 139
A-B 24 6 24
A-C 280 70 280
Page 17 of 20
18/08/2021file:///C:/Files%20-%20Simon/BTP%20Projects/BTP-2128%20-%20WCM%20White...

AECOM Revised Arrangement - 2035 Operation, PM
Data Errors and WarningsNo errors or warnings
Junction Network
Junctions
Junction Network Options
Traffic Demand
Demand Set Details
Demand overview (Traffic)
Origin-Destination Data
Vehicle Mix
Junction Name Junction Type Major road direction Junction Delay (s) Junction LOS
1 Junction T-Junction Two-way 0.71 A
Driving side Lighting Network residual capacity (%) First arm reaching threshold
Left Normal/unknown 195 Stream B-A
IDScenario
nameTime Period
nameTraffic profile
typeStart time (HH:mm)
Finish time (HH:mm)
Time segment length (min)
Run automatically
D11 2035 Operation PM ONE HOUR 16:45 18:15 15 �
Vehicle mix varies over turn Vehicle mix varies over entry Vehicle mix source PCU Factor for a HV (PCU)
� � HV Percentages 2.00
Arm Linked arm Profile type Use O-D data Average Demand (Veh/hr) Scaling Factor (%)
A - High Rd south ONE HOUR � 286 100.000
B - Site Access ONE HOUR � 71 100.000
C - High Rd north ONE HOUR � 308 100.000
Demand (Veh/hr)
To
From
A - High Rd south B - Site Access C - High Rd north
A - High Rd south 0 0 286
B - Site Access 32 0 39
C - High Rd north 308 0 0
Heavy Vehicle Percentages
To
From
A - High Rd south B - Site Access C - High Rd north
A - High Rd south 0 0 0
B - Site Access 0 0 3
C - High Rd north 0 0 0
Page 18 of 20
18/08/2021file:///C:/Files%20-%20Simon/BTP%20Projects/BTP-2128%20-%20WCM%20White...
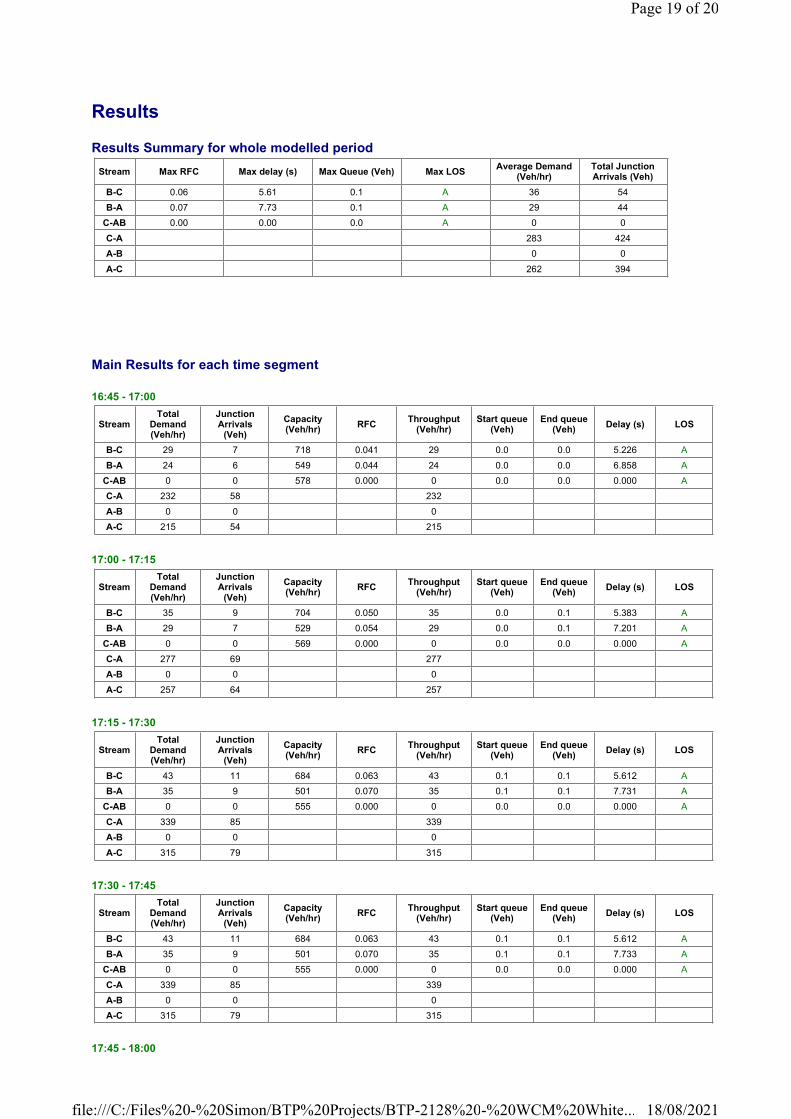
Results
Results Summary for whole modelled period
Main Results for each time segment
16:45 - 17:00
17:00 - 17:15
17:15 - 17:30
17:30 - 17:45
17:45 - 18:00
Stream Max RFC Max delay (s) Max Queue (Veh) Max LOSAverage Demand
(Veh/hr)Total Junction Arrivals (Veh)
B-C 0.06 5.61 0.1 A 36 54
B-A 0.07 7.73 0.1 A 29 44
C-AB 0.00 0.00 0.0 A 0 0
C-A 283 424
A-B 0 0
A-C 262 394
StreamTotal
Demand (Veh/hr)
Junction Arrivals
(Veh)
Capacity (Veh/hr)
RFCThroughput
(Veh/hr)Start queue
(Veh)End queue
(Veh)Delay (s) LOS
B-C 29 7 718 0.041 29 0.0 0.0 5.226 A
B-A 24 6 549 0.044 24 0.0 0.0 6.858 A
C-AB 0 0 578 0.000 0 0.0 0.0 0.000 A
C-A 232 58 232
A-B 0 0 0
A-C 215 54 215
StreamTotal
Demand (Veh/hr)
Junction Arrivals
(Veh)
Capacity (Veh/hr)
RFCThroughput
(Veh/hr)Start queue
(Veh)End queue
(Veh)Delay (s) LOS
B-C 35 9 704 0.050 35 0.0 0.1 5.383 A
B-A 29 7 529 0.054 29 0.0 0.1 7.201 A
C-AB 0 0 569 0.000 0 0.0 0.0 0.000 A
C-A 277 69 277
A-B 0 0 0
A-C 257 64 257
StreamTotal
Demand (Veh/hr)
Junction Arrivals
(Veh)
Capacity (Veh/hr)
RFCThroughput
(Veh/hr)Start queue
(Veh)End queue
(Veh)Delay (s) LOS
B-C 43 11 684 0.063 43 0.1 0.1 5.612 A
B-A 35 9 501 0.070 35 0.1 0.1 7.731 A
C-AB 0 0 555 0.000 0 0.0 0.0 0.000 A
C-A 339 85 339
A-B 0 0 0
A-C 315 79 315
StreamTotal
Demand (Veh/hr)
Junction Arrivals
(Veh)
Capacity (Veh/hr)
RFCThroughput
(Veh/hr)Start queue
(Veh)End queue
(Veh)Delay (s) LOS
B-C 43 11 684 0.063 43 0.1 0.1 5.612 A
B-A 35 9 501 0.070 35 0.1 0.1 7.733 A
C-AB 0 0 555 0.000 0 0.0 0.0 0.000 A
C-A 339 85 339
A-B 0 0 0
A-C 315 79 315
Page 19 of 20
18/08/2021file:///C:/Files%20-%20Simon/BTP%20Projects/BTP-2128%20-%20WCM%20White...
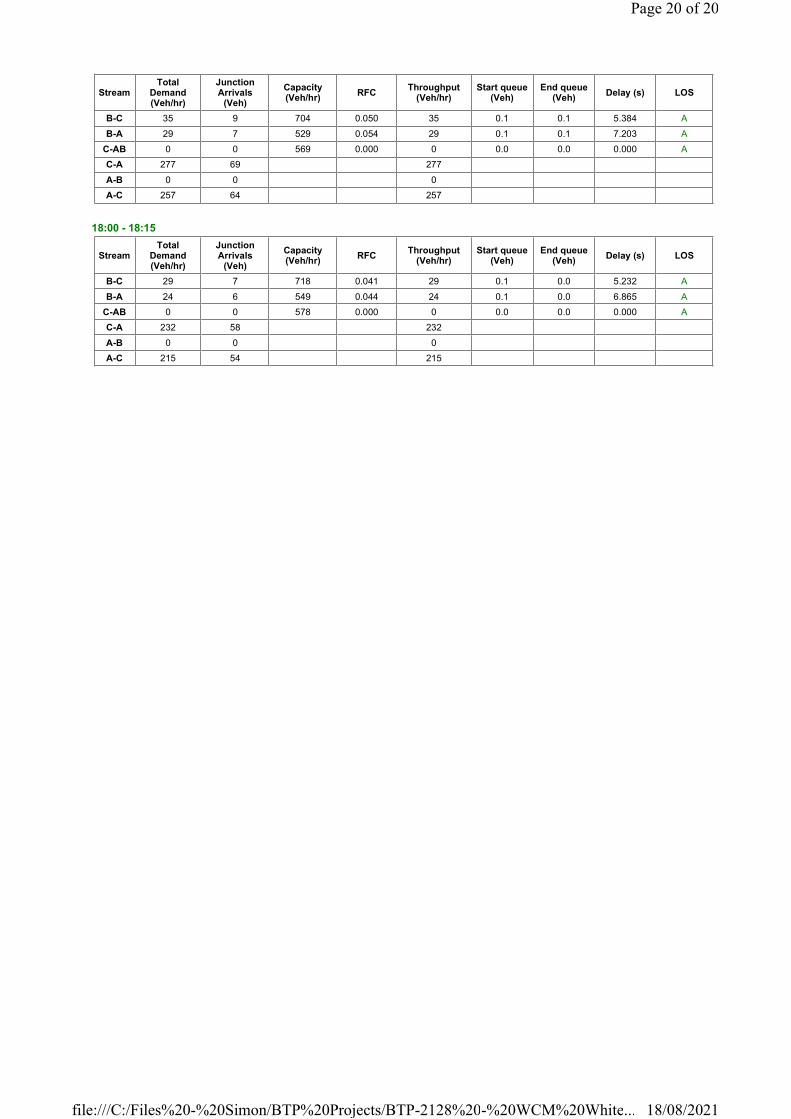
18:00 - 18:15
StreamTotal
Demand (Veh/hr)
Junction Arrivals
(Veh)
Capacity (Veh/hr)
RFCThroughput
(Veh/hr)Start queue
(Veh)End queue
(Veh)Delay (s) LOS
B-C 35 9 704 0.050 35 0.1 0.1 5.384 A
B-A 29 7 529 0.054 29 0.1 0.1 7.203 A
C-AB 0 0 569 0.000 0 0.0 0.0 0.000 A
C-A 277 69 277
A-B 0 0 0
A-C 257 64 257
StreamTotal
Demand (Veh/hr)
Junction Arrivals
(Veh)
Capacity (Veh/hr)
RFCThroughput
(Veh/hr)Start queue
(Veh)End queue
(Veh)Delay (s) LOS
B-C 29 7 718 0.041 29 0.1 0.0 5.232 A
B-A 24 6 549 0.044 24 0.1 0.0 6.865 A
C-AB 0 0 578 0.000 0 0.0 0.0 0.000 A
C-A 232 58 232
A-B 0 0 0
A-C 215 54 215
Page 20 of 20
18/08/2021file:///C:/Files%20-%20Simon/BTP%20Projects/BTP-2128%20-%20WCM%20White...