protein and oil recoveries from enzyme-assisted aqueous extraction of soybeans and sunflower seed
TRANSCRIPT

Graduate Theses and Dissertations Iowa State University Capstones, Theses andDissertations
2010
Protein and oil recoveries from enzyme-assistedaqueous extraction of soybeans and sunflower seedKerry Alan CampbellIowa State University
Follow this and additional works at: https://lib.dr.iastate.edu/etd
Part of the Biological Engineering Commons, and the Chemical Engineering Commons
This Dissertation is brought to you for free and open access by the Iowa State University Capstones, Theses and Dissertations at Iowa State UniversityDigital Repository. It has been accepted for inclusion in Graduate Theses and Dissertations by an authorized administrator of Iowa State UniversityDigital Repository. For more information, please contact [email protected].
Recommended CitationCampbell, Kerry Alan, "Protein and oil recoveries from enzyme-assisted aqueous extraction of soybeans and sunflower seed" (2010).Graduate Theses and Dissertations. 11172.https://lib.dr.iastate.edu/etd/11172

Protein and oil recoveries from enzyme-assisted aqueous extraction of soybeans
and sunflower seed
by
Kerry Alan Campbell
A dissertation submitted to the graduate faculty
in partial fulfillment of the requirements for the degree of
DOCTOR OF PHILOSOPHY
Major: Chemical Engineering
Program of Study Committee: Charles E. Glatz, Major Professor
Lawrence Johnson Patricia Murphy
Peter Reilly Brent Shanks
Iowa State University
Ames, Iowa
2010
Copyright © Kerry Alan Campbell, 2010. All rights reserved.

ii
TABLE OF CONTENTS
ABSTRACT iv
CHAPTER 1. INTRODUCTION AND THESIS ORGANIZATION 1 Objectives and Dissertation Format 2 References 3
CHAPTER 2. LITERATURE REVIEW 4 Introduction 4 Soybean Cotyledon Microstructure 4 Sunflower Kernel Cotyledon Microstructure 6 Effects of Mechanical and Chemical Treatments on Soybean Microstructure 7 Mechanisms of AEP and EAEP 11 Conclusions from Previous Work 20 References 21
CHAPTER 3. MECHANISMS OF AQUEOUS EXTRACTION OF SOYBEAN OIL 29 Abstract 29 Introduction 30 Materials and Methods 34 Results 38 Acknowledgements 57 References 57
CHAPTER 4. MECHANISMS OF AQUEOUS EXTRACTION OF EXTRUDED SUNFLOWER MEAL 62
Abstract 62 Introduction 63 Materials and Methods 64 Results 68 Conclusions 77 Acknowledgements 78 References 78
CHAPTER 5. ENZYME-ASSISTED AQUEOUS EXTRACTION OF OIL AND PROTEIN FROM SOYBEANS AND CREAM DE-EMULSIFICATION 80
Abstract 80 Introduction 81 Materials and Methods 84 Results and Discussion 92 Conclusions 103 References 104
CHAPTER 6. PROTEIN RECOVERY FROM ENZYME-ASSISTED AQUEOUS EXTRACTION OF SOYBEAN 108
Abstract 108 Introduction 109 Materials and Methods 112

iii
Results and Discussion 117 Conclusions 128 Acknowledgements 129 References 130
CHAPTER 7. GENERAL DISCUSSION AND CONCLUSIONS 135
APPENDIX 1. ON-GOING AEP WORK 137 Introduction 137 Materials and Methods 138 Results 142 Conclusions 153 Acknowledgements 153 References 153
APPENDIX 2. ECONOMIC ANALYSIS OF EAEP FROM EXTRUDED SOY 155 Introduction 155 Materials and Methods 155 Results and Discussion 157 Conclusions 161 Figures 163 Tables 165 References 170
APPENDIX 3. DERIVATION OF EQUATION 7 FROM CHAPTER 3 172

iv
ABSTRACT
Aqueous extraction processing (AEP) of soybeans has the potential to achieve oil
extraction yields comparable to hexane extraction without the environmental or safety
concerns associated with hexane. The economic viability of this novel process depends upon
maximizing the yield of free oil as well the development of a cost effective, high yielding
method of recovering protein values in the aqueous by-product.
In order to direct strategies for yield improvement, mechanisms of AEP were studied
by microscopic observation of extracted residual solids coupled with yield measurements and
mathematical modeling. The nature of the oil-confining matrix varied depending on physical
treatment of the soybean. For extruded flakes, oil is sequestered in a matrix of insoluble
protein, which is disrupted by proteolytic action. For flour, oil bodies coalesced into large
droplets that have a reduced mobility within a matrix of disrupted cells. Proteolysis increased
yield through a mechanism that likely involves the disruption of a viscoelastic protein film at
the oil-water interface to increase the emulsification of oil. This hypothesis is supported by
experiments with low molecular weight surfactants. A model developed on these concepts
was able to fit experimental extraction data well. The extraction times of the pool of small
oil droplets (i.e. oil bodies) were consistent with diffusion rates.
The oil release mechanism for AEP of extruded sunflower was similar to soy flour for
which unextracted oil was contained within disrupted cells; however, unlike the soybean
case, proteases did not increase oil extraction yield. Differences between sunflower and
soybean oil extraction may result from differences in the nature of the oil-protein
interactions, as well as in differing geometries of the disrupted cellular matrix.

v
Most proteins in an aqueous fraction from a high oil-yield extraction process from
extruded soy had molecular weights between 3000 and 10000 Da. Hydrolysis was effective
in reducing the trypsin inhibitor activity of the soy protein, while neither the extrusion nor the
hydrolysis affected amino acid profile, indicating that the AEP protein nutritional properties
would be as good as if not superior to existing soy protein products. Antinutritional
oligosaccharides were effectively eliminated through the use of either galactosidases or by
ultrafiltration. Ultrafiltration had the added benefit of being the most effective single step
purification strategy, but was ineffective in purifying the smallest polypeptides. Isoelectric
precipitation also achieved acceptable purity, but with reduced yields because of the presence
of emulsified oil in the skim as well as from increased solubility of the hydrolyzed protein.
Ion-exchange chromatography using expanded bed adsorption allowed effective separation
of proteins from the emulsified oil and oligosaccharides, but was also incapable of capturing
the smallest polypeptides.
1
CHAPTER 1. INTRODUCTION AND THESIS ORGANIZATION
Ongoing use of petroleum in industry is unsustainable. Therefore, many new
technologies must be developed if economic growth is to continue in the coming century.
One particular industry that can benefit from the elimination of petroleum use today is
vegetable oil production. High-yielding vegetable oil extraction processes use organic
solvents, the most prevalent being hexane, in order to achieve yields >95%. Besides being a
petroleum-derived chemical, hexane is highly flammable and explosive, posing an immediate
hazard to personnel and property. Furthermore, hexane in the atmosphere can contribute to
smog and other chronic health hazards. Therefore, hexane is classified as a volatile organic
compound by the U. S. Environmental Protection Agency, and, as such its release must be
tightly controlled, monitored, and reported. The combination of these factors makes hexane
extraction of vegetable oil a capital intensive and operationally complex process that is
expensive and challenging to operate safely.
Alternatives to solvent extraction processing have existed for many years; some
predate solvent extraction by centuries[1], but none can match the high yields of solvent
extraction. With rising petroleum costs and increasing awareness of environmental issues
during the last 15 years or so, there has been a renewed interest in developing high-yielding
alternatives to solvent extraction of vegetable oil. Recent advances in aqueous extraction
processing (AEP) technologies with the assistance of enzymes have shown particular
promise. [2-4] As the name suggests, the strategy behind AEP is to remove soluble cellular
materials in an aqueous medium, allowing the oil to be released and separated by differences
in density. AEP results in three distinct fractions: a solid residual fraction rich in

2
lignocellulose, insoluble proteins and other insoluble material, and entrained soluble
material; a liquid skim fraction of soluble proteins, minerals, and carbohydrates as well as
measurable amounts of oil; and an oil/water emulsion stabilized by proteins and
phospholipids. Each of these three fractions presents a challenge for the economic viability
of AEP. First, oil remaining in the residual and liquid fractions represents a significant oil
loss compared to solvent extraction processes. Second, the skim (liquid) fraction, containing
all the soluble material, represents a large fraction of the total soy mass. Economic viability,
therefore, depends upon creating value-added products from this novel material; the skim
fraction has properties unlike any other by-product of current soy processing methods, and so
recovery of skim values presents an important problem to be solved. Third, the oil/water
emulsion must be broken to recover free oil.
Objectives and Dissertation Format
The focus of this thesis is on the first two of the above challenges. First, in order to
guide extraction strategy development to maximize extraction yields, a thorough
understanding of AEP extraction mechanisms is needed. This is addressed in part by the
literature review of Chapter 2, and then in published original work providing advances in
knowledge in Chapter 3. Chapter 4 presents a parallel piece of work on sunflower extraction
mechanisms using AEP to be submitted to the Journal of the American Oil Chemists’ Society
(JAOCS). Chapter 5 is a jointly written manuscript with collaborators at the ISU Center for
Crops Utilization Research published in JAOCS, and is the first work to characterize the
skim proteins and oligosaccharides. Chapter 6 is a manuscript published in Biotechnology
Progress that is the first major investigation into the application of different technologies for

3
recovering protein from the skim fraction. General conclusions are stated in Chapter 7,
which is followed by three appendices. Appendix 1 presents completed portions of ongoing
joint work that focus on recovering values from the skim fraction. Appendix 2 is an
economic analysis of an earlier version of the EAEP process that demonstrates the crucial
importance of recovering skim values. Appendix 3 is a derivation of Equation 7 from
Chapter 3.
References
1. Hagenmaier, R.D., Aqueous Processing. Technology and solvents for extraction
oilseeds and nonpetroleum oils, ed. P.J. Wan and P.J. Wakelyn. 1997, Champaign,
IL: American Oil Chemists' Society Press. 311-322.
2. de Moura, J., et al., Enzyme-assisted aqueous extraction of oil and protein from
soybeans and cream de-emulsification. Journal of the American Oil Chemists
Society, 2008. 85(10): p. 985-995.
3. de Moura, J. and L.A. Johnson, Two-stage countercurrent enzyme-assisted aqueous
extraction processing of oil and protein from soybeans. Journal of the American Oil
Chemists' Society, 2009. 86(3): p. 283-289.
4. Lamsal, B.P., P.A. Murphy, and L.A. Johnson, Flaking and extrusion as mechanical
treatments for enzyme-assisted aqueous extraction of oil from soybeans. Journal of
the American Oil Chemists' Society, 2006. 83(11): p. 973-979.

4
CHAPTER 2. LITERATURE REVIEW
Introduction
The focus of this section is to summarize the current state of knowledge relevant to
the understanding of the mechanisms of AEP of soybean. Where conclusions have been
drawn by the authors on the mechanisms of extraction, they are discussed. In other studies
where the discussion did not address mechanisms, the data will be analyzed in the broad
context of what the result may imply about mechanism. First, a basic overview of the
soybean seed structure and cotyledon ultrastructure will be presented to establish where and
how oil is contained within a soybean and to state the physical nature of the barriers to oil
release. Then, the effects of a range of physical treatments on the microstructure of soybean
will be discussed.
Soybean Cotyledon Microstructure
Typical soybean composition is 20% oil, 40% protein, 35% carbohydrate, and 5% ash
on a dry basis.[1] Most of the soy protein and oil are stored in the palisade-like cells of the
cotyledon tissue in round organelles called protein bodies and lipid bodies, respectively.
Typical cotyledon cells are cylindrical in shape, about 30 µm in diameter and 70-80 µm
long.[2] To achieve a high degree of disruption of cells by size reduction, particle sizes must
be of this length scale. A high degree of cellular disruption with large particle sizes can be
accomplished with shear, as occurs with flaking.
Cellular disruption is important because the cell wall is the primary barrier to
extraction, and it must be ruptured for oil release.[3] Like most plant cells, the soybean

5
primary cell wall is constructed of pectins, hemicelluloses, and microfibrils of cellulose
cross-linked with protein. Within the primary cell wall is a secondary cell wall of cellulose
and hemicelluloses.[4] The cells are held together by a middle lamella composed mostly of
pectins.[5] Most mass transfer across the cell wall barrier occurs through plasmodesmata.
These are small openings in the cell wall ranging from 20 to 80 nm in diameter. These will
allow transfer of molecules with molecular weights up to 900 Da.[6] This again
demonstrates the importance of disrupting the cell wall for extraction of oil and protein to
take place.
About 80% of the total protein in soy is stored in protein bodies, which occupy most
of the cotyledon cell volume.[2] Therefore their removal is important to allow release of oil.
Protein bodies range in size from 10 to 50 µm in diameter. In aqueous media, large protein
bodies are less stable than smaller protein bodies.[7] Above neutral pH, protein bodies
dissolve quite readily in water.[8] So, to remove the protein bodies, it appears that anything
above pH 7 would be adequate, provided there was adequate volume of solvent for protein
dissolution and adequate cellular disruption for effective mass transfer of solutes and
solvents.
Oil bodies are much smaller than protein bodies, ranging from less than one micron to
several microns in diameter.[2] Generally, they fill the space between protein bodies and are
enmeshed in a matrix of cytoplasmic proteins.[9] Oil bodies are contained by a delimiting
membrane composed of a layer of the amphipathic protein oleosin interspersed with
phospholipid.[10] These proteins make up about 15% of the mass of oil bodies and play an
important role in stabilizing the oil bodies, which can be destabilized by proteolytic
treatment.[11] Microscopic studies showed that oil bodies have an apparent affinity for cell

6
walls, protein bodies, plasmalemma, and endoplasmic reticulum, but not for other organelles
[2, 11], which may be an important consideration when trying to liberate oil from the
confines of a disrupted cell.
Sunflower Kernel Cotyledon Microstructure
Sunflower cotyledon cells are similar to soybean cotyledons in many ways. The
cellular dimensions and cell wall compositions are similar. Protein bodies and oil bodies
both have similar structure. The most notable difference, however, is that the oil to protein
composition is reversed in sunflower, which is typically 20% protein and 40% oil. Protein
bodies are much smaller than soybean protein bodies, ranging from <1 to 3 µm in diameter
(Figure 1). While sunflower oil bodies are about the same size as soybean oil bodies, they
are packed more closely together inside the cotyledon cells and occupy a larger fraction of
the cytoplasm.[12-13]
Figure 1- LM (C) and TEM (E) of sunflower kernel cotyledon cells. P = protein body, g = globoid (crystalline structures in protein bodies), o = oil body. Scale bar is 10 µµµµm for C and 2 µµµµm for E. Taken from Mantese et al. [12] Image reproduced by permission from Oxford University Press.

7
Effects of Mechanical and Chemical Treatments on Soybean
Microstructure
It has been established that the cell wall must be disrupted for aqueous extraction to
occur.[3] There is a broad range of mechanical methods that affect cell wall and
microstructural morphology of soybean cells. The following section will present current
methods of cellular disruption, and, when provided, the results of disruption on oil release.
In cases where AEP for a particular method of comminution was not studied, possible effects
on oil release will be discussed within the context of known AEP extraction mechanisms.
Flaking
Flaking is the most common method of comminution used for commercial hexane
extraction today. Typically, soybeans are conditioned at 60 °C, cracked into approximately
3-4 fragments per bean, and then passed through flaking mills, resulting in flakes
approximately 1 cm across by 250 µm thick. Flaking of conditioned, cracked soy results in
nearly complete disruption of cell walls with little change in morphology of the protein and
oil bodies.[14] Flaking produces very similar effects in other oil seeds, as well.[15] This
disruption allows solutes and solvents to pass easily through cell walls, which explains why
flaking enhances hexane extraction. For AEP, this suggests that proteins may be extracted
from flake in a similar manner while leaving oil within the confines of the flake. Indeed, soy
protein isolates are made by extracting proteins from defatted flakes. Images of flakes after
solvent extraction of the oil indicated some oil coalescence, but the cytoplasmic matrix
around the oil bodies and protein bodies remained intact, and protein body morphology was
unchanged, even after removal of the oil.[14] However, in AEP oil is removed by an

8
immiscible solvent (i.e. water). Because of this, the removal of oil from the cells will depend
on the length and tortuosity of the pathway the oil droplet must travel to be liberated.
Therefore, the nature of cellular disruption may also be important in AEP of oil. Even
though flaking is effective in disrupting cells, it may not succeed in providing oil that can be
easily separated from the cells.
Extrusion
A detailed study on the effects of extrusion on the morphology of untoasted defatted
soybean flake ground into grits was conducted by Aguilera et al.[16] In the screw
arrangement they studied, each extruder element increased cellular disruption, with complete
destruction resulting from the effects of the rapid expansion as the material passed through
the die. Extrusion results in the substantial denaturation of soy proteins as well as destruction
of the cytoplasmic network.[17] Upon cooling, the proteins form a new network by disulfide
cross-linking and covalent bonding between lysine and glutamine or asparagines
residues.[18] These studies did not discuss the effects of the extrusion on the specific
morphology of protein bodies or oil bodies. However, it would seem likely that protein
bodies would be completely destroyed by the high heat and shear, a fate that would probably
be shared by the oil bodies, considering the destruction of the cytoplasmic network.
While complete cellular disruption would be advantageous for aqueous extraction, the
formation of a new protein network may result in sequestration of oil within this network,
adversely affecting oil extraction yields. Furthermore, autocatalytic lipid oxidation can result
in a polymerization reaction with proteins, where the free radical of a lipid peroxide reacts

9
with susceptible amino acid residues and incorporates the protein in a lipid peroxide-protein
polymer as shown below.[19]
L· + O2 � LOO·
LOO· + P � ·LOOP
·LOOP + O2 � ·OOLOOP
·OOLOOP + P � ·POOLOOP
etc.
Extrusion is known to cause the formation of complexes between lipids and proteins
as well as with starch.[20] Some observations of AEP of extruded soy have been consistent
with the formation of such covalent oil-protein bonds, as will be discussed further in the next
section.
Unicellular Extraction
An interesting physical treatment developed by Kasai et al. results in soy cotyledon
breakdown into single cells.[5] Cracked, conditioned soybeans were autoclaved in water,
degrading the middle lamella, and then individual cells were sheared apart by grinding in a
food mill. Microscopy of the resulting material revealed much oil coalescence and
substantial degradation of the cell wall. Still, aqueous extraction of oil from the unicellular
paste gave low yields, even when treated with carbohydrases.[21] Further treatment by
homogenization appeared to completely disrupt cellular structures, but resulted in a stable
emulsion mixed with material of disrupted cells, with no residue product after

10
centrifugation.[21] This mixture could not be separated by centrifugation, nor could the
emulsion be broken. So, while the unicellular process creates a substrate that is easy to
disrupt, the products of this disruption were difficult to separate physically.
Thermal and chemical treatments
Using scanning electron microscopy (SEM), Choi et al. observed that microwave
irradiation caused disruption of microfibrils and other alterations of cell wall texture, and
possible modifications of intercellular pectins.[22] This is in good agreement with
observations made by Mondal et al., who saw that microwave treatments of polygalacturonic
acid, xylan, and carboxymethylcellulose, increased substrate surface area, which conductive
heating did not.[23] More importantly, activities of enzymes acting on each substrate
increased significantly, adding another indication of morphological change. An earlier study
on microwave heating, however, did not observe ultrastructural changes of protein and oil
bodies of microwave-treated soybeans.[24] Based on these observations, microwave
pretreatment may be used to increase EAEP yields by enhancing the effects of cellulases on
cell walls.
Enzymatic treatments
Sineiro et al. have studied microstructural changes caused by cellulase and
hemicellulase.[25] They observed degradation of the middle lamellae, leading to cellular
separation and easier access of the cell wall to enzymes.[25] Under static conditions, cellular
separation did not occur, but there was a noticeable degradation of the cell wall with release
of intracellular material. A mixture of cellulases and hemicellulases tends to be more
effective than individual enzymes in disrupting cells.[26] Within a cell, proteases may have

11
several effects. Bair and Snyder destabilized isolated oil bodies using trypsin.[11]
Proteolysis has been shown to increase protein solubility with the added benefit of reducing
antinutritional factors (ANF’s).[27-28] Given the physical barriers to release, it makes sense
that the uses of cellulases and proteases would have a positive effect on the extraction of
protein and oil during both aqueous and solvent extraction. This has been shown by many
authors.[4, 27, 29-33]
Flour
Flour is the most studied substrate for AEP; effects of flour milling on cellular
disruption will be presented in the context of extraction mechanisms in the next section.
Mechanisms of AEP and EAEP
General approach
For soy flours the important extraction parameters for AEP/EAEP are pH, solid-liquid
ratio, agitation rate, particle size, enzyme concentration, extraction time, and
temperature.[34-35] This is logical because these are all parameters which could affect the
solubility, stability, and extractability of protein and oil bodies, the two most prominent
cotyledon organelles. The pH and enzyme concentration affect protein solubility. Solid-
liquid ratio, particle size, temperature, and agitation rate affect mass transfer rates. Particle
size reduction increases cellular disruption. Agitation provides a motive force to free oil
from cellular confines. In AEP, there is a strong link between protein extraction and oil
extraction in soybean. Rosenthal et al. showed that at pHs near the pI of soy proteins, both
protein and oil extraction yields were at a minimum.[36] The reverse was true at high pH,

12
far from protein pI. In addition, heat treatment of soy flour prior to extraction reduced both
oil and protein extraction yields compared to non-heat treated flour, presumably because the
heat-denaturation of soy proteins drastically reduces their solubility. Protein is an important
barrier to oil release in soy, and its removal is necessary to achieve high oil extraction yields.
However, the effects of varying agitation rates showed the extraction mechanisms of oil and
protein to be different; while increasing agitation rate increased oil yield, this had no effect
on protein yield.[36] This observation indicates that, while protein dissolution is a necessary
prerequisite for oil release, some physical motive force is necessary to release at least some
of the oil.
In general, the trends in the literature show that protein and oil extraction yields are
inversely related to solid-liquid ratio (as solid-liquid ratio increases, protein extraction yield
decreases). Some inconsistencies in the literature may be explained by different degrees of
cellular disruption. In one study, Rosenthal et al. determined that solid-liquid ratio did not
have a significant effect on oil extraction yield.[36] This observation is in disagreement with
later findings by the same authors, where solid-liquid ratio was significant.[35] One
difference, however, was that the earlier study used small particle sizes (~100 µm) where the
later study covered a range of larger particle sizes, from 210 to 850 µm. Considering the size
of soy cells, it is possible that particles of 100 µm diameter would have such a high degree of
cellular disruption that the intracellular material would have been dispersed into the liquid
phase immediately. That is, the material probably consisted mostly of free cellular material,
and so extraction mechanisms important for removing oil from larger particles of a lower
degree of disruption were not important for this case. Both agitation rate and solid-liquid

13
ratio also have an effect on oil emulsion stability, which further complicates extraction
optimization, since the objective is to obtain free oil, not an oil/water emulsion.[26, 37]
The effect of particle size on both oil and protein yields can be attributed to cellular
disruption. Extraction yields from soy flour of both protein and oil followed a simple model
relating particle size to degree of cellular disruption and extraction yield.[36] As stated
before, this means that extraction of both oil and protein are strongly dependent on degree of
disruption. There is a notable absence in the literature of studies including a measure of this
property of the substrate.[26] It would be desirable to have a consistent method of measuring
cellular disruption.
Temperature affects on oil extraction yields. Lusas et al. found that maximum oil
yields in soy were obtained between 40 °C and 60 °C, while protein yields were not affected
by temperature.[34] Rosenthal et al. noted a slight decrease in oil yield for temperatures > 50
°C compared to yields below 50 °C, which they attributed to protein denaturation, as
indicated by calorimetric studies that showed signs of protein denaturation beginning at just
above 50 °C.[36] These two experiments show both a dependence of oil extraction on
protein extraction and a difference in extraction mechanism. Besides the possibility of
protein denaturation, little is known about why temperature affects oil extraction yield.
As mentioned previously, enzyme can increase extraction yields two ways.
Cellulases can increase the degree of cellular disruption, while proteases increase protein
solubility, each with a result of increased protein and oil extraction yield. This effect has
been shown on many different oil-bearing materials. The wide variety of enzymes studied,
as well as the activities at different extraction conditions makes comparisons difficult.
Rosenthal et al. showed that proteases caused the greatest increase in oil and protein yields

14
on heat-abused soy flour by increasing the solubility of proteins that had been rendered
insoluble by the heat treatment.[35] Proteases caused little or no increase in yield for small
flour particle sizes near 250 µm.[35] This lack of effect could be because of the small
particle size, as discussed above, or it could also have been caused by the very high agitation
rate (2000 rpm) used in this study, by causing the release of oil that would have required
protease at a lower agitation rate. Cellulases increase solvent-extractability of oil from seeds,
which corresponded to increases in reducing sugars, indicating enzyme activity.[4, 29, 38]
There have been fewer studies on the effects of cellulase on EAEP of soy flour. Rosenthal et
al. did not see any effects from cellulases on oil extraction from soy, although the cellulolytic
EAEP trials were carried out at low pH, which probably hindered protein extraction, since
soy proteins have very little solubility at low pH.[35]
Ultrasonication
Ultrasonication and microwave treatments are two other approaches that have been
used to enhance AEP/EAEP yields of flour. Yoon et al. compared ultrasonication to protease
treatments.[33] They showed that ultrasound could increase protein yield from 68 to 90%,
the same increase observed by protease treatment. Ultrasound increased oil yield from 65%
to 90% as well; for oil, protease treatment only increased yield to 86%. The authors
speculated that the yield increase was due to cellular disruption caused by ultrasonication.
Considering the basic AEP mechanism, where oil is pushed from an intracellular region to an
extracellular region by a motive force, it is possible that ultrasonication could provide this
physical motive force, literally shaking the oil free.

15
Microwave treatment
On another note, microwave treatments created interesting results for protein
extraction. Choi et al. showed that microwave heating at 80 °C increased protein extraction
compared to conduction heating[22], although they did not quantify oil extraction. Observed
morphological changes suggested that microwave heating caused rupture and degradation of
cell walls. However, protein concentration of the liquid fraction was determined by BCA
assay, for which lipids are an interfering substance. This could have had an adverse affect on
protein yield determination, but since oil composition data was not reported, it cannot be said
whether or not this is the case.
Extrusion
The extraction yield trends of extruded material during AEP/EAEP appear to be
similar to flour, but considering the extrusion temperatures and differences in cellular
disruption, the mechanism could be quite different. Freitas et al. showed that both proteases
and cellulases increased extraction yield of extruded whole soybean seeds.[39] A
combination of both enzymes gave the maximum extraction yield of 88%. Increasing
enzyme concentration, however, also increased the fraction of oil in the skim. At the highest
concentrations, virtually all of the extracted oil was in the skim fraction rather than in the
cream, meaning this oil would be very difficult to recover. As with flour, decreasing solid-
liquid ratio from 1:3 to 1:10 had a positive impact on extraction yield, which was speculated
to be caused by better accessibility of cells to enzymes in a higher moisture environment. In
order to increase economic viability by reducing water removal costs, de Moura and Johnson
developed a more complex multi-stage extraction protocol using extruded flake and proteases

16
that achieved yields as high as 98% using only 1:6 solid-liquid ratio.[40] This had the added
benefit of reducing the fraction of emulsified oil in the skim to 7% of total oil. For Lamsal et
al., cellulase did not have an effect on extraction yield of extruded flakes, while proteases
did.[41] The lack of effect from cellulase was attributed to total cellular disruption. This
contrast with the Freitas et al. findings illustrates the benefit of combining flaking with
extrusion. Still, the maximum yield attained by Lamsal et al. with proteases was also 88%,
even though they claimed 100% cellular disruption. In flour extraction, the oil removal is
dependent on cellular disruption, removal of barriers, and then physical motive force. For
extrusion, where cells are highly disrupted, the extraction mechanism may be based more on
the nature of protein-oil interactions. Lamsal et al. showed that solvents could not extract as
much lipid from extruded material as from flake unless the extruded material was first acid-
hydrolyzed. This was attributed to covalent bonds formed between proteins and free radicals
of lipids undergoing oxidation.[42] If complete cellular disruption is indeed achieved, it
seems likely that the sequestration of oil in the residual fraction could be caused by a
combination of covalent oil-protein bonding as well as oil enmeshed in an insoluble
extracellular protein matrix. Based on this, the sole role of proteases is to break apart these
oil-protein bonds and the insoluble protein matrix to release free oil.
Extraction of intact oil bodies
Another EAEP strategy that has met with success is to extract intact oil bodies. There
are several variants of methods in the literature.[10, 43-46] Typically, isolation methods
incorporate imbibing whole seed or soy flour 12-20 h in a buffer, with or without
homogenization, followed by extraction with more intense agitation or homogenization for a

17
short period. The residual fraction is separated by filtration, and the lipid fraction is separated
from the aqueous fraction by centrifugation. Some methods incorporate the use of 0.4 M
sucrose and 0.5 M NaCl during homogenization to increase oil-body stability.[10, 47]
Kapchie et al. achieved the best yields using a multi-staged extraction with a cocktail of
cellulase, pectinase, and hemicellulase enzymes.[47] Optimal conditions with this method
recovered 85% of the oil in the form of a cream, with 10% of the lipid remaining in the
residual, and 5% of the total lipid in the aqueous extract. The enzyme cocktail resulted in a
considerable yield increase of 35%, which can likely be attributed to disruption of a cellular
matrix inhibiting oil release. There was also a substantial reduction in oil in the aqueous
fraction when extracting with the enzyme cocktail, although it is not evident why the
enzymes had this effect. One point of contention with oil-body extraction literature is that
the effect of various extraction conditions on oil body stability is not well understood. While
many authors have characterized the surface species of the resulting emulsions to confirm the
recovery of true oil bodies [10, 48], the nature of the extensive agitation these emulsions
have undergone raises concern about the possibility that the recovered cream is an emulsion
stabilized by mixed surface species resulting from many cycles of droplet disruption and
coalescence and would therefore no longer be native oil storage organelles (i.e. oil bodies).
Nikiforidis and Kiosseoglou, for example, reported many different surface proteins in
addition to oleosin in the recovered emulsion interface, which they attributed to multilayer
protein binding to the oleosin membrane.[46] It is possible that their emulsion did not
consist of native oil bodies.

18
Sunflower
For sunflower extraction there are many similarities in extraction behavior with
soybean; however, there are also some notable differences. Hagenmaier saw that for
batchcentrifugation, better oil extraction yields were at high pH values where protein
extraction was also high.[49] At low pH, oil yield from batch centrifugation was 30%, while
semi-batch basket centrifugation with a perforated bowl equipped with a nylon net to retain
solids achieved 80% oil extraction. However, unextracted protein is not a significant a
barrier to oil release as it was with soybean. When Hagenmaier used a basket centrifuge and
rinsed the solids during centrifugation, oil extraction yield was independent of pH, and in all
cases it was higher than with batch centrifugation. Protein yield, on the other hand, was not
affected by centrifugation type, and ranged from 20% extraction yield at pH 5, near the
sunflower protein isoelectric point, to 80% at pH 10, the same extraction yield as for oil.
Other authors have also reported high oil extraction yields at pH 5.[50-52] These results are
consistent with the idea that a motive force is an important mechanism for oil release. Even
though basket centrifugation caused significant improvement in oil yield, no other study has
repeated this type of centrifugation.
Because high sunflower oil yields are attainable at conditions of poor protein
solubility, cellulases have been more successful than with soy. Cellulases tend to have high
activity at low pH. Badr and Sitohy increased yields of oil extracted from chopped seeds
from 42 to 55% using either proteases or cellulases.[50] Effects of both enzymes together
were not reported by this author, but combinations of cellulase and pectinase appear to be
very effective in disrupting cell walls. Dominguez et al. improved oil extraction yield from
50 to 80% from sunflower with a particle size of <0.75 mm using a cellulase/pectinase

19
combination.[51] The extraction kinetics of oil for this study closely resembled the kinetics
for the hydrolysis, as measured by reducing sugar formation, indicating that the cause of
release was due to cellular disruption by hydrolysis.
The dependence of sunflower oil extraction on solid-liquid ratio is not clear.
Dominguez et al. saw little dependence of extraction yield for solid-liquid ratios ranging
from 1:5 to 1:25. At lower moisture conditions, decreasing solid-liquid ratio from 1:2 to 1:3
had a significant positive effect on oil extraction yield.[50] Interestingly, Sineiro et al. saw a
reduction in oil extraction yield at solid-liquid ratios less than 1:7 for particles between 0.75
and 1.0 mm.[52] No explanation for this behavior has been suggested.
Extrusion has also been applied to sunflower extraction. In one study, Kartika et al.
extracted sunflower oil directly from the extruder by placing filter elements in the screw
profile, achieving 85% oil extraction yield.[53] So a substantial amount of oil can be
separated from sunflower seeds by only mechanical disruption of cells, with no assistance
from solvents. To enhance release of oil during extrusion, Evon et al. tried combining the
AEP and extrusion steps by injecting water directly into the extruder elements.[54] The
greatest oil extraction yield attained by this method was 71%, with the added problem of
emulsion formation and oil in the skim fraction. Microscopy showed that a substantial
number of cells survived extrusion intact, to which the reduction in yield was attributed.
Oil-protein interactions
Oil-binding capacity is a commonly studied property of food functional proteins, and
considering the nature of AEP systems, this property could be important in determining oil
extraction yields, especially when a significant fraction of oil may be retained in the liquid

20
fraction. The typical method of measuring oil-binding capacity is to mix protein, oil, and
water, mix vigorously, centrifuge to separate the insoluble protein/oil mixture, and measure
the mass of oil that is sequestered with the protein. It is believed that the nature of oil
binding is that the oil is physically entrapped by the protein.[55] Binding capacity of soy
isolates and soy concentrates are 119-156 and 74-101 mL oil/100 g, respectively.[55]
Microscopy of protein-bound oil shows oil droplets wetted on the protein surfaces.[56] As
this suggests surface hydrophobicity and protein particle size are important factors in
determining oil binding capacity.[55] It is logical to assume that oil binding by both soluble
and insoluble proteins can play an important role in determining oil extraction yield, and
could be important in recovering oil from the skim fraction.
Conclusions from Previous Work
Both soybean and sunflower have similar cotyledon structural properties, but the
greatest difference is the relative size and quantity of the protein bodies to oil bodies. Soy
protein bodies are much larger than soy oil bodies, and occupy a larger fraction of the
cotyledon volume, while sunflower protein bodies are of a similar size as the oil bodies. For
both plants, the primary barrier to oil release is the cell wall. For soybean, the protein bodies
are also significant barriers to oil release, but this is not the case for sunflower oil extraction.
Mechanical and chemical disruption of cells and internal cell barriers is important for
oil extraction. Both flaking and extrusion are capable of achieving nearly complete cellular
disruption. Extrusion appears to create oil-protein complexes that prevent 100% extraction
of oil. The use of enzymes enhances extraction yield by removing barriers to oil release by
either disrupting the cell wall or, presumably, by increasing the solubility of internal proteins

21
of the cells. Microwave treatments may be useful in enhancing the activity of cellulolytic
enzymes. Ultrasonication also enhances yield by either increasing cellular disruption or by
providing a motive force to release oil from disrupted cells.
Oil extraction yield is determined by several basic phenomena. First is disruption of
the cell wall. Second, oil extraction yield is dependent on the removal of intracellular
material, which, for soy, is facilitated by dissolution of protein bodies. Third, a motive force,
usually imparted by agitation, is needed to remove oil from intracellular spaces. While the
literature provides a good explanation for why protein solubility is important for oil
extraction, there is little understanding about why specific process parameters, such as
temperature, solid-liquid ratio, and agitation affect oil extraction yield. The effects of
enzymes on oil extraction yield have been studied as well, and their mechanisms for oil
extraction have been hypothesized. The mechanistic relationships between enzyme action
and oil extraction, however, have not been conclusively demonstrated. Oil-protein
interactions may also play an important role in extraction of oil, especially from extruded
material, as well as in sequestering oil in the aqueous phase.
References
1. Deak, N.A., New soy protein ingredients production and characterization, in Food
Science and Human Nutrition. Ph.D. Thesis. 2004, Iowa State University: Ames, IA.
p. 291.
2. Bair, C.W., Microscopy of soybean seeds: Cellular and subcellular structure during
germination, development, and processing with emphasis on lipid bodies. Ph.D.
Thesis. 1979, Iowa State University: Ames, IA.

22
3. Cater, C.M., R.D. Hagenmaier, and K.F. Mattil, Aqueous extraction- an alternative
oilseed milling process. Journal of the American Oil Chemists' Society, 1974. 54(4):
p. 137-141.
4. Dominguez, H., M.J. Nunez, and J.M. Lema, Enzymatic pretreatment to enhance oil
extraction from fruits and oilseeds - a review. Food Chemistry, 1994. 49(3): p. 271-
286.
5. Kasai, N., Y. Imashiro, and N. Morita, Extraction of soybean oil from single cells.
Journal of Agricultural and Food Chemistry, 2003. 51: p. 6217-6222.
6. Aguilera, J.M. and D.W. Stanley, Microstructural Principles of Food Processing and
Engineering. 2 ed. 1999, Gaithersburg, Maryland: Aspen Publishers, Inc.
7. Wolf, W.J., Scanning electron microscopy of soybean protein bodies. Journal of the
American Oil Chemists Society, 1970. 47(3): p. 107.
8. Lee, C.H., C.S. Kim, and H.C. Yang, Microstructure and hydrodynamic properties of
soybean protein bodies in solutions. Journal of Food Science, 1983. 48(3): p. 695-
702.
9. Wolf, W.J. and F.L. Baker, Scanning electron-microscopy of soybeans. Cereal
Science Today, 1972. 17(5): p. 124-7.
10. Tzen, J.T.C. and A.H.C. Huang, Surface-structure and properties of plant seed oil
bodies. Journal of Cell Biology, 1992. 117(2): p. 327-335.
11. Bair, C.W. and H.E. Snyder, Electron-microscopy of soybean lipid bodies. Journal of
the American Oil Chemists' Society, 1980. 57(9): p. 279-282.

23
12. Mantese, A.I., D. Medan, and A.J. Hall, Achene structure, development and lipid
accumulation in sunflower cultivars differing in oil content at maturity. Annals of
Botany, 2006. 97: p. 999-1010.
13. Saio, K., D. Gallant, and L. Petit, Electron microscope research on sunflower protein
bodies. Cereal Chemistry, 1977. 54(6): p. 1171-1181.
14. Bair, C.W. and H.E. Snyder, Ultrastructural-changes in soybeans during processing
to yield desolventized-toasted meal. Journal of Food Science, 1980. 45(3): p. 529-533.
15. Yiu, S.H., I. Altosaar, and R.G. Fulcher, The effects of commercial processing on the
structure and microchemical organization of rapeseed. Food Microstructure, 1983.
2(2): p. 165-&.
16. Aguilera, J.M. and F.V. Kosikowski, Ultrastructural changes occurring during
thermoplastic extrusion of soybean grits. Journal of Food Science, 1976. 41(5): p.
1209-1213.
17. Ko, J.Y., J.K. Ha, and H.D. Kim, Effect of extrusion on the physical property of
soybean in sacco nitrogen disappearance and in-vivo digestibility in sheep. Korean
Journal of Animal Science, 1992. 34(2): p. 101-107.
18. Kim, I.H., K.G. Friesen, and C.S. Kim, Use of soy protein for early weaned pigs.
Korean Journal of Animal Nutrition and Feedstuffs, 1995. 19(5): p. 352-370.
19. Schaich, K.M., Free radical initiation in proteins and amino acids by ionizing and
ultraviolet radiations and lipid oxidation- Part III: Free radical transfer from
oxidizing lipids. Critical Reviews in Food Science and Nutrition, 1980. 13(3): p. 188-
244.

24
20. Camire, M.E., Chemical and nutritional changes in food during extrusion, in
Extruders in Food Applications, M.N. Riaz, Editor. 2000, Technomic Publishing
Company, Inc.: Lancaster, PA. p. 127-147.
21. Subramanian, M., Post doctoral research summary report. 2005, Iowa State
University.
22. Choi, I.L., et al., Extraction yield of soluble protein and microstruction of soybean
affected by microwave heating. Journal of Food Processing and Preservation, 2006.
30(4): p. 407-419.
23. Mondal, K., I. Roy, and M.N. Gupta, Enhancement of catalytic efficiencies of
xylanase, pectinase and cellulase by microwave pretreatment of their substrates.
Biocatalysis and Biotransformations, 2004. 22: p. 9-16.
24. Kovacs, E., et al., Effect of irradiation and dielectric heating on soybean
ultrastructure, trypsin inhibitor, and lipoxygenase activities. Food Structure, 1991.
10: p. 217-227.
25. Sineiro, J., et al., Microstructural features of enzymatically treated oilseeds. Journal
of the Science of Food and Agriculture, 1998. 78(4): p. 491-497.
26. Rosenthal, A., D.L. Pyle, and K. Niranjan, Aqueous and enzymatic processes for
edible oil extraction. Enzyme and Microbial Technology, 1996. 19: p. 403-429.
27. Moure, A., et al., Functionality of oilseed protein products: A review. Food Research
International, 2006. 39(9): p. 945-963.
28. Were, L., N.S. Hettiarachchy, and U. Kalapathy, Modified soy proteins with improved
foaming and water hydration properties. Journal of Food Science, 1997. 62(4): p.
821-824.

25
29. Bergale, P.C., K. Sosulski, and F. Sosulski, Enzymatic hydrolysis of soybean for
solvent and mechanical oil extraction. Food Process Engineering, 2000. 23: p. 321-
327.
30. Fischer, M., et al., Enzymatic extractability of soybean meal proteins and
carbohydrates: heat and humidity effects. Journal of Agricultural and Food
Chemistry, 2001. 49(9): p. 4463-4469.
31. Gaur, R., et al., A novel process for extraction of edible oils Enzyme assisted three
phase partitioning (EATPP). Bioresource Technology, 2007. 98(3): p. 696-699.
32. Jung, S., et al., Functionality of soy protein produced by enzyme-assisted extraction.
Journal of the American Oil Chemists' Society, 2006. 83(1): p. 71-78.
33. Yoon, S.-H., et al., Effects of enzyme treatments and ultrasonification on extraction
yields of lipids and proteins from soybean by aqueous process. Korean Journal of
Food Science Technology, 1991. 23(6): p. 673-676.
34. Lusas, E.W., J.T. Lawhon, and K.C. Rhee, Producing edible oil and protein from
oilseeds by aqueous processing. Oil Mill Gazette, 1982. 4: p. 28-34.
35. Rosenthal, A., et al., Combined effect of operational variables and enzyme activity on
aqueous enzymatic extraction of oil and protein from soybean. Enzyme and Microbial
Technology, 2001. 28: p. 499-509.
36. Rosenthal, A., D.L. Pyle, and K. Niranjan, Simultaneous aqueous extraction of oil
and protein from soybean: Mechanisms for process and design. Trans. Food and
Bioproducts Processing, 1998. 76: p. 224-230.

26
37. Embong, M.B. and P. Jelen, Technical feasibility of aqueous extraction of rapeseed
oil- a laboratory study. Canadian Journal of Alimentary Science and Technology,
1977. 10: p. 239-243.
38. Marsman, G.J.P., et al., In vitro accessibility of untreated, toasted, and extruded
soybean meals for proteases and carbohydrases. Jourlan of Agricultural and Food
Chemistry, 1997. 45(10): p. 4088-4095.
39. Freitas, P.S., et al., The combined application of extrusion and enzymatic technology
for extraction of soybean oil. Fett/Lipid, 1997. 9: p. 333-337.
40. de Moura, J. and L.A. Johnson, Two-stage countercurrent enzyme-assisted aqueous
extraction processing of oil and protein from soybeans. Journal of the American Oil
Chemists' Society, 2009. 86(3): p. 283-289.
41. Lamsal, B.P., P.A. Murphy, and L.A. Johnson, Flaking and extrusion as mechanical
treatments for enzyme-assisted aqueous extraction of oil from soybeans. Journal of
the American Oil Chemists' Society, 2006. 83(11): p. 973-979.
42. Cheftel, Cuq, and Lorient, in Food Chemistry, O.R. Fennema, Editor. 1985, M.
Dekker: New York. p. 346.
43. Iwanaga, D., et al., Extraction and characterization of oil bodies from soy beans: A
natural source of pre-emulsified soybean oil. Journal of Agricultural and Food
Chemistry, 2007. 55(21): p. 8711-8716.
44. Kansal, S., A. Sharma, and M.N. Gupta, An integrated process for obtaining oil,
protease inhibitors and lectin from soybean flour. Food Research International, 2006.
39(4): p. 499-502.

27
45. Loer, D.S. and E.M. Herman, Cotranslational integration of soybean (Glycine-max)
oil body membrane-protein oleosin into microsomal-membranes. Plant Physiology,
1993. 101(3): p. 993-998.
46. Nikiforidis, C.V. and V. Kiosseoglou, Aqueous extraction of oil bodies from maize
germ (zea mays) and characterization of the resulting natural oil-in-water emulsion.
journal of agricultural and food chemistry, 2009. 57(12): p. 5591.
47. Kapchie, V.N., et al., Enzyme-assisted aqueous extraction of oleosomes from
Soybeans (Glycine max). Journal of Agricultural and Food Chemistry, 2008. 56(5): p.
1766-1771.
48. Wang, L., Properties of soybean oil bodies and oleosin proteins as edible films and
coatings. PhD Thesis. 2004, Purdue University: West Lafayette, IN.
49. Hagenmaier, R.D., Aqueous Processing of Full-Fat Sunflower Seeds - Yields of Oil
and Protein. Journal of the American Oil Chemists' Society, 1974. 51(10): p. 470-
471.
50. Badr, F.H. and M.Z. Sitohy, Optimizing conditions for enzymatic extraction of
sunflower oil. Grasas Y Aceites, 1992. 43(5): p. 281-283.
51. Dominguez, H., M.J. Nunez, and J.M. Lema, Aqueous processing of sunflower
kernels with enzymatic technology. Food Chemistry, 1995. 53(4): p. 427-434.
52. Sineiro, J., et al., Optimization of the enzymatic treatment during aqueous oil
extraction from sunflower seeds. Food Chemistry, 1998. 61(4): p. 467-474.
53. Kartika, I.A., P.Y. Pontalier, and L. Rigal, Extraction of sunflower oil by twin screw
extruder: Screw configuration and operating condition effects. Bioresource
Technology, 2006. 97(18): p. 2302-2310.

28
54. Evon, P., et al., Direct extraction of oil from sunflower seeds by twin-screw extruder
according to an aqueous extraction process: Feasibility study and influence of
operating conditions. Industrial Crops and Products, 2007. 26: p. 351-359.
55. Nielsen, N.C., in New Protein Foods Vol. 5: Seed Storage Proteins, A.A. Altschul
and H.L. Wilcke, Editors. 1985, Academic Press, New York, NY.
56. Seguchi, M., Lipid binding by protein films heated on glass beads and wheat starch.
Cereal Chemistry, 1986. 63(4): p. 311-315.

29
CHAPTER 3. MECHANISMS OF AQUEOUS EXTRACTION OF
SOYBEAN OIL
A paper published in the Journal of Agricultural and Food Chemistry, 2009. 57(22):
p. 10904-10912.
K. A. Campbell, C. E. Glatz
Abstract
Aqueous extraction processing (AEP) of soy is a promising green alternative to
hexane extraction processing. To improve AEP oil yields, experiments were conducted to
probe the mechanisms of oil release. Microscopy of extruded soy before and after extraction
with and without protease indicated that unextracted oil is sequestered in an insoluble matrix
of denatured protein and is released by proteolytic digestion of this matrix. In flour from
flake, unextracted oil is contained as intact oil bodies in undisrupted cells, or as coalesced oil
droplets too large to pass out of the disrupted cellular matrix. Our results suggest that
emulsification is an important extraction mechanism that reduces the size of these droplets
and increases yield. Protease and SDS were both successful in increasing extraction yields.
We propose that this is because they disrupt a viscoelastic protein film at the droplet
interface, facilitating droplet disruption. An extraction model based on oil droplet
coalescence and the formation of a viscoelastic film was able to fit kinetic extraction data
well.

30
Introduction
Aqueous extraction processing (AEP) of soy is a promising green alternative to
hexane extraction processing. While recent advances in AEP techniques have increased the
recovery of free oil to 85% (1), AEP yields are still less than typical yields from industrial
hexane extraction processes. AEP uses water as an extraction medium, dissolving soluble
cellular materials and allowing the release of oil into the bulk liquid phase, from which the
oil can be recovered by centrifugation resulting in a cream emulsion which can be broken to
recover free oil (1-3). Approximately 10-15% of the oil released from the solid fraction also
remains in the aqueous fraction as an emulsion stable toward creaming (1). Because of the
immiscible nature of the oil/water system, the poorly understood mechanisms of oil release
are intrinsically different than those from hexane extraction processes. In order to increase
yields of AEP, a thorough understanding of the extraction mechanisms is needed.
Important parameters for extraction from soy flour are pH, particle size, agitation
rate, solid-liquid ratio, extraction time, and temperature (4-7). The use of protease and
cellulase enzymes have also had significant effects on oil extraction yield from soy flours and
extrudates in processes referred to as enzyme-assisted aqueous extraction processing (EAEP)
(1, 6, 8, 9). In soy, there is an association between protein solubility and oil extraction. At
pH 4.5 (the average pI of soy protein), where soy protein solubility is very low (<10%) (10),
both protein and oil extraction yields are lower (5). Heat-abused soy flours, with likely
protein denaturation, also showed reduced protein and oil yields (5); however, these yields
increased with proteolysis (6). Soy protein bodies occupy most of the intracellular volume
of soy cotyledon cells (11) and, therefore, could pose a physical barrier to oil release.
Additionally, soy protein may bind oil by physical entrapment in insoluble protein at

31
oil/protein ratios up to 111-145 and 67-94 g oil/100 g of protein for soy protein isolates and
concentrates, respectively (12). In soybean, the oil-protein ratio is such that the quantity of
protein present is more than enough to sequester all of the oil in an isoelectric precipitate.
Rosenthal et al. showed that oil and protein extraction yield were directly
proportional to the inverse of flour particle size, which they attributed to cellular disruption
enabling oil and protein release (5). They also attributed the oil yield benefits of agitation to
increased cellular disruption. The immiscible nature of the AEP/EAEP systems suggests
that a potential role for emulsification in the extraction mechanism should not be overlooked;
agitation’s effect on emulsification could be another explanation for the effect of agitation on
oil extraction yield.
Oil release from a confining cellular matrix requires mobility of oil droplets within
this matrix; mobility will be a function of droplet size and matrix geometry. The matrix
geometry is determined by the native cellular geometry, the mode of cellular disruption used
(i.e., flaking, milling, extrusion, etc.), and the solubility of the intercellular matrix. Oil
droplet size is determined by stability of the oil storage organelles, i.e. oil bodies, in the
extraction medium, specific energy input into the extraction medium (imparted by the
agitator), and properties of the oil/water interface. While studies on oil body isolation
indicate that oil bodies are stable at the temperature and pH commonly used in AEP (50 °C
and pH 8-9) (13), interfacial surface proteins of cream from AEP of soy flour created at pH 8
are composed mostly of storage proteins with only minor quantities of oleosin, the primary
oil body membrane protein (2). This indicates that few, if any, native oil bodies survive the
extraction process, and the oil droplets may have undergone many cycles of coalescence and
disruption. Droplet disruption and coalescence during turbulent mixing may also explain why

32
Nikiforidis and Kiosseoglou observed a mixture of interfacial proteins in AEP of corn germ,
which they attributed to multilayer protein adsorption on native oil bodies (14).
Emulsion particle size distribution is determined by a balance of two opposing events,
droplet coalescence and droplet breakup, under the influence of dispersed phase viscosity,
interfacial tension (which is affected by surfactant concentration), continuous phase density,
and specific energy input. Theoretical and semi-empirical models have been developed that
predict maximum stable droplet size with success (15). For an inertial break-up mechanism,
the maximum stable drop diameter is:
( )5/35/35/23/13/1
21 1 −−
+= C
DDD
dAAd ρσε
σεη
(1)
where d is droplet diameter, η is dynamic viscosity, ε is specific energy input, σ is interfacial
tension, ρ is density, subscripts C and D denote continuous and dispersed phases,
respectively, and 0.11 ≈A , and 35.02 ≈A , are numerical constants (15).
Soy proteins, having high surface activity, will alter the tension of an oil-water
interface (16); therefore, they are important for emulsification during AEP. Emulsification
properties of soy proteins have been widely studied (8, 17, 18), but interfacial rheology of the
oil-water interface in the presence of soy proteins has not. Proteins are similar to low
molecular weight (LMW) surfactants in that they will adsorb to an oil-water interface and
reduce static surface tension. However, large proteins diffuse to and along the interface
slowly compared to LMW surfactants and change conformation upon adsorption to
maximize hydrophobic/hydrophilic interactions with the two different phases (19). Adsorbed
proteins often exhibit strong intermolecular interactions and form a viscoelastic film, which
may restrict droplet deformation (19-22) and make interfacial membranes more difficult to

33
break (20). Oil droplets thus stabilized often exhibit properties similar to deformable
capsules rather than a viscous droplet (23). Therefore, in the presence of surface active
proteins, the maximum stable droplet diameter could be much larger than predicted by eq 1
from measurement of the static interfacial tension. In mixed protein/surfactant systems,
LMW surfactants tend to dominate over high molecular weight polypeptides in determining
interfacial rheology, primarily because of diffusion and denaturation kinetic limitations of
proteins (20). However, preformed protein films can be disrupted and even displaced from
an interfacial surface by sodium dodecyl sulfate (SDS) (19, 24). The currently accepted
model of droplet destabilization in protein-surfactant systems shows that destabilization is
maximized when there is only a partial displacement of protein at the interface such that both
protein and surfactant species are immobile, while the protein network is disrupted (25).
For β-lactoglobulin, which has one free sulfhydryl (SH) group per molecule, disulfide
bridging between interfacial proteins plays an important role in interfacial surface rheology
(26) as well as in emulsion stability (27). Fractions enriched in glycinin and β-conglycinin,
the major storage proteins in soybean, have between 0.36 and 1.6 mol SH per mol protein
(28, 29); therefore, interfacial polymerization could also play an important role in droplet
stability for AEP emulsions. Cystine SH groups have a pKa of 8.3. Therefore, deprotonated
initiating SH groups would be readily available at AEP conditions (between pH 8 and 9); SH
polymerization of β-lactoglobulin occurs readily at pH 7 (27, 30). Increased interfacial film
elasticity impedes LMW surfactants from displacing interfacial proteins stabilized by
disulfide bridging (25). Still, SDS is known to weaken β-lactoglobulin films at high molar
ratios (19). In this work, we observed microstructural changes by microscopy of soy
disrupted by alternative mechanical methods and studied the effects of agitation rate, solid-

34
liquid ratio, and enzyme concentration on oil extraction from the disrupted soy. Release
kinetics, compartmental modeling, and microscopic observation were combined to establish a
mechanistic extraction model.
Materials and Methods
Materials
Soybeans were prepared at the Iowa State University Center for Crops Utilization
Research using a local common variety, 2005 and 2007 harvest. Four modes of comminution
were investigated: flour, flake, flour from flake, and extrudate. Flour was prepared by
passing cracked dehulled soybeans twice through a pin-mill. Soy flake was prepared by
passing cracked dehulled soybeans through a smooth surface roller to a thickness of
approximately 0.25 mm. Flour from flake was produced by passing flakes once through a
pin-mill. Extrudate was produced by extruding soy flake as described previously (1). All
flours were stored at -20 °C until use. Protex 7L (P7L), a neutral metalo-endoprotease from
Bacillus amyloliquefaciens, with optimum temperature and pH ranges of 40-60 °C and 6-8,
respectively, and Protex 6L (P6L), an alkaline serine-endoprotease from Bacillus
lichenformis, optimum temperature and pH ranges 30-70 oC, and 7-10, respectively, were
kindly provided by Genencor International (Rochester, NY) as a water-propylene glycol
solution containing <10% protein (w/w) as received from the manufacturer.
Flour from flake particle size distribution
Flour from flake particle size distribution was measured by laser light scattering
(Mastersizer 2000 S, Malvern Instruments, Ltd., Chicago, IL). A flour suspension was

35
prepared by adding 1 g flour to 175 mL deionized water initially at pH 2.7 for a final pH of
4.5, then agitating 3 hr to break up clumps. Aliquots were introduced to the instrument by
transfer pipet.
Microscopy
For transmission electron microscopy (TEM) and light microscopy (LM), samples
were fixed and embedded following Bair and Snyder (11) with minor modifications at the
Microscopy and NanoImaging Facility at Iowa State University. Whole seed was imbibed
overnight in deionized water; comminuted samples were placed directly into fixative
solution. Tissues were fixed in 2% glutaraldehyde (w/v) and 2% paraformaldehyde (w/v) in
0.1M cacodylate buffer, pH 7.2 for 48 h at 4 °C. Samples were rinsed 2 times in 0.1 M
cacodylate buffer (pH 7.2) and then fixed in 1% osmium tetroxide in 0.1 M cacodylate buffer
for 1 h (room temp.) The samples were then dehydrated in a graded ethanol series, cleared
with ultrapure acetone, infiltrated and embedded using a Spurr’s epoxy resin (Electron
Microscopy Sciences, Ft. Washington, PA). Resin blocks were polymerized for 48 h at 65
°C. Thick and ultrathin sections were made using a Reichert Ultracut S ultramicrotome
(Leeds Precision Instruments, Minneapolis, MN). Thick sections were contrast stained using
1% toluidine blue. Ultrathin sections were collected onto copper grids and counter-stained
with 5% aqueous uranyl acetate for 15 min followed by Sato's lead stain for 10 min. Images
were captured using a JEOL 1200EX scanning and transmission electron microscope (Japan
Electron Optic Laboratories, Peabody, MA). Light microscopy images were captured using a
Zeiss Axioplan 2 light microscope (Carl Zeiss MicroImaging, Inc., Thornwood, NY).
36
Extraction
Extractions were performed in a 2 L jacketed glass reaction vessel (model 4742,
Chemglass Inc., Vineland, NJ ) held at 50 °C by a circulating water bath, and agitated by a
stirrer (model BDC 3030, Caframo, Ltd., Wiarton, Ontario) with a 2 in. diameter, 3-bladed
screw impeller. Constant pH of 8.0 (flour from flake) and 9.0 (extrudate) was maintained
using an autotitrator (Model 718 Stat Titrino, Metrohm, Ltd., Herisau, Switzerland). For
response surface extractions flour from flake was extracted in deionized water without
enzyme with an agitation rate of 500 rpm for 120 min to extract as much oil as possible
without enzyme. After 120 min, enzyme was added and agitation rate was changed to the
test condition for an additional 120 min. All other extractions were carried out for 4 h with
any additions made at the start of the extraction. Extractions for flour from flake and
extrudate utilized P7L and P6L, respectively. At the end of the extraction, two 35-mL
samples were withdrawn by siphon from the center of the reactor. Samples were centrifuged
at 3,000 x g for 15 min. Sample fractions (solid and liquid) were massed and solid fractions
were retained for analysis. Solid fraction moisture content was determined by drying in an
oven at 130 °C for 12-15 h. Solid fraction oil content was determined on freeze-dried
samples using a Goldfisch extraction apparatus (AOCS Official Method Bc 3-49). Oil and
protein yields were determined based on the difference between content of the starting
material and the content of the solid fraction. Protein dissolution was calculated as including
the protein in the liquid fraction plus that solubilized protein entrained in the solid fraction,
which was estimated by multiplying the liquid fraction protein concentration times the mass
of water in the solid fraction.

37
Experimental design and statistical analysis
A response surface experimental design was used to test factor effects on oil
extraction yield and to develop an empirical model for process optimization. A Box-
Behnken design with three center points was selected, with three factors: solid-liquid ratio
(S), enzyme-solid ratio (E) and agitation rate (A). Real values and coded values are shown in
Table 1. Statistical analysis was completed using JMP 6.0 statistical software package by
SAS, Inc., Cary, NC.
Table 1. Factor levels chosen for response surface design experiment for flour from flake. Agitation (A) is varied logarithmically; solid-liquid ratio (S/L) and enzyme-solid ratio (E/S) are varied linearly.
Interfacial Tension
Interfacial tension of a soy oil/skim interface was measured by the Wilhelmy Plate
method using a FACE Automatic Surface Tensiometer (Kyowa Interface Science Co. Ltd.,
Niiza-City, Japan). Skim was carefully poured over oil phase (Hy-Vee brand 100% soy oil,
Hy-Vee, Inc., West Des Moines, IA) in a glass dish and allowed to stand 1 h to achieve
interfacial equilibrium before measurement.
Viscosity
Viscosity was measured using a Cannon-Fenske 50 viscometer (Cannon Instrument
Company, State College, PA) in a 50 °C water bath.
S/L E/S A (rpm) S E A
0.050 0.5% 200 -1 -1 -1
0.010 1.0% 500 0 0 0
0.015 1.5% 1500 1 1 1
Real variables Coded variables

38
Degree of Hydrolysis
Degree of hydrolysis (DH) was estimated using the pH stat technique (10) by
measuring the volume of base added to maintain constant pH according to
b
t
VNDH
Phα=
(2)
where V and Nb are the volume and normality of base added, respectively, α is the fraction of
deprotonated terminal protein residues (0.88 for soy protein at pH 8 and 50 °C (10)), P is the
mass of protein being hydrolyzed, and ht is the total number of peptide bonds per mass of
protein (7.8 mequiv/g soy protein (10)).
Results
Microscopic analysis of effects of comminution and extraction
Typical soy cotyledon cells are about 30-50 µm in diameter and 70-80 µm long (31,
32). Figure 1 shows a TEM of a native soybean cotyledon radial cross section. Most evident
in the cross-section are the protein bodies, where about 80% of the soy protein is stored. The
oil is stored in oil bodies, protein-phospholipid delimited lipid storage organelles (33) which
fill most of the cytoplasmic network.
The microstructure of soybeans comminuted by four alternative methods - milling,
flaking, flaking followed by milling (flour from flake), and extrusion - were studied by
microscopy. Images (Figure 2) were selected to show the range of cellular disruption
observed. Regions of intact cells were found in all samples but the extruded material, which
provided practically complete cellular disruption (Figure 2D). Ultrastructure of disrupted
cells, shown by TEM (Figure 3), showed a range of oil body alterations. In intact cells, oil

39
bodies were mostly unaltered from their pre-treatment appearance. In disrupted cells, some
coalescence of oil bodies was observed, but many oil bodies remained intact even in
completely disrupted cells.
Figure 1. TEM of soybean cotyledon cell cross-section. PB, protein body; CW, cell wall; N, cell nucleus; OB, oil body.
Images of material after 2 h of AEP both with and without protease for flour from
flake and extruded material are shown in Figure 4. In flour from flake without protease
(Figure 4A), very little of the residual material is extracellular. Protein bodies of disrupted
cells have been dissolved, while large droplets of coalesced oil are present in some cells.
Structural features of cells near the center of the flour from flake particles are unaffected by
the extraction. Images of extruded material (Figure 4B) show oil droplets within a solid
matrix both before and after extraction, although the amount of oil is visibly less after
extraction. The oil not extracted after 2 h of AEP of extruded soy is contained within the
matrix material.

40
Figure 2. Light microscopy images of soy after various modes of comminution: (A), milling (flour); (B), flaking; (C), flaking followed by milling (flou r from flake); (D), extrusion. Letters denote: PB, protein body; CO, coalesced oil; CW, cell wall fragment; IC, region of intact cells; DC, region of disrupted cells.
Figure 3. TEM of ultrastructure of (A) flour and (B) flour from flake befor e extraction. Letters denote: PB, protein body; OB, oil body; CO, coalesced oil; CW, cell wall. Osmium tetroxide stain likely did not penetrate the sample of image B, leaving the lipids with a transparent appearance.

41
Figure 4. LM images of residual material after 2 h of aqueous extraction. (A) Flour from flake without protease ; (B) extruded flake without protease; (C) flour from flake after two hours with 0.5 % (w/w solid) Protex 7L; (D) extruded flakes after 2 h with 0.5 % (w/w solid) Protex 6L. Letters denote: CO, coalesced oil; IC, region of intact cells.
For flour from flake, after two additional hours of extraction with 0.5% (w/w solid)
P7L, oil extraction yield increased from 75% (±1%) to 79% (±1%). There was no noticeable
change in the appearance of the residual flour from flake from that of the protease-free
extraction (Figure 4C), possibly because only a small change in yield was achieved. It is not
obvious based on these images why the addition of protease results in the increased release of
oil. In the extruded material, however, the effect of protease is more pronounced, increasing
yield from 68% to between 88% and 96% (1, 8). Likewise, the extracted residual is
drastically altered by the addition of protease (Figure 4D). Rather than a matrix enclosing oil
droplets, as seen in Figure 4B, the protease-treated residual is loose and amorphous with little

42
entrained oil, bearing little resemblance to the starting material. Because the increase in oil
extraction is accompanied by an increase in dissolved protein (1), the images suggest that the
proteolysis dissolves the matrix of insoluble denatured proteins, allowing the release of
entrained oil. The fact that cellulase enzymes had no effect on extraction yields of extruded
soy (8) confirms complete cellular disruption and a release mechanism aided by dissolution
of the denatured protein. The residual should contain cell wall remnants, but these did not
show up in the fraction of material sampled. There was a coarse material observed on the
bottom of the centrifuge tube, so it is likely that after being freed from the matrix, the cell
walls settled fastest during centrifugation. Samples taken for microscopy were taken mostly
from the upper half of the residual bed in the centrifuge tubes.
The contrast between soy extrudate and soy flour from flake in these images, the
differences in initial oil extraction yield, and the effect of protease on extraction yield
illustrate a key difference in extraction mechanisms for these two materials. For extrudate,
even though a very high cellular disruption has been achieved, the protein solubility is
reduced greatly by the heat and pressure of extrusion. Therefore, even if the cellular
disruption is complete, the oil remains entrained in an insoluble matrix of extracellular
denatured protein. In flour from flake the protein solubility is high, and so the primary
barrier to release is the cell wall.
Assessment of significant extraction parameters for flour from flake
The purpose of the response surface design experiment was to assess effects of
enzyme-solid ratio, solid-liquid ratio, and agitation rate after nonproteolytic extraction of
flour from flake had been carried out to the point of completion. Oil release before and after

43
protease addition at the center-point conditions (S/L = 0.10, E/S = 1.0%, A = 500 rpm) is
shown in Figure 5. By 120 min without protease, the extraction yield reaches a constant
value of 75.3% (±0.3%). However, when enzyme is added, oil yield increases, reaching a
new maximum value of 80.0% ±0.4% after an additional 120 min of extraction.
Figure 5. Progression of oil extraction yield for flour from flake for the response surface center-point condition: S/L = 0.10, E/S = 1.0%, and A = 500 rpm. Enzyme was added at 120 min. Data from five independent runs, two of which were up to 120 min, and three from 120 min with all five including 120 min.
Analysis of variance of the oil extraction yield data shows that all of the parameters
had significant primary effects on yield, with no significant interactions detected; values of
significant effects are shown in Table 2. The model fit test is shown in Figure 6. Based on
the R-squared value of 0.99 and randomly distributed variance, the fit appears to be very
good.

Table 2. Significant parameters for oil extraction yieldstudied were solid-liquid ratio (as shown in Table 1.
Figure 6. Fit test of response surface model for oil extraction yieldwith fitted parameters of Table 2. Points lie about a line of a slope confidence intervals shown. The horizontal line is the
Response surfaces (Figure 7) show an optimal enzyme concentration ca. 1% (E = 0),
while yield continues to increase with agitation increase and solid
the range tested. The small influence of agitation level between 200 and 500 rpm is probably
because agitation was at 500 rpm for two hours prior to extraction. Based on microscopy and
44
. Significant parameters for oil extraction yield for flour from flakeliquid ratio ( S), enzyme-solid ratio (E) and agitation rate (
Figure 6. Fit test of response surface model for oil extraction yield of flour from flakewith fitted parameters of Table 2. Points lie about a line of a slope = 1, with prediction confidence intervals shown. The horizontal line is the overall mean yield.
Response surfaces (Figure 7) show an optimal enzyme concentration ca. 1% (E = 0),
while yield continues to increase with agitation increase and solid-liquid ratio decrease over
the range tested. The small influence of agitation level between 200 and 500 rpm is probably
because agitation was at 500 rpm for two hours prior to extraction. Based on microscopy and
Term Estimate Prob>|t|
Intercept 80.01 <.0001
S -5.20 <.0001
E 0.63 0.005
A 0.49 0.017
S*S 1.30 0.001
E*E -0.68 0.023
A*A 0.84 0.008
for flour from flake . Parameters ) and agitation rate (A) coded
of flour from flake , with prediction
mean yield.
Response surfaces (Figure 7) show an optimal enzyme concentration ca. 1% (E = 0),
o decrease over
the range tested. The small influence of agitation level between 200 and 500 rpm is probably
because agitation was at 500 rpm for two hours prior to extraction. Based on microscopy and

45
the response surface data, one concludes that the factors affecting extraction yield, in order of
contribution to yield, are: (1) extent of cellular disruption; (2) solid-liquid ratio; (3) enzyme-
solid ratio; and (4) agitation rate. That these three parameters had significant effects on
yields gives insight into possible extraction mechanisms. Agitation may increase oil
extraction either by (1) disrupting the cellular matrix, thus, decreasing or widening the escape
path of the oil droplets, or by (2) disrupting the oil droplets (i.e., emulsification), easing their
release from the cellular matrix. While native oil bodies are much smaller than the cellular
dimensions (0.5 to 2 µm), microscopy of flour from flake showed that coalescence during
extraction resulted in droplet sizes comparable to cell dimensions. Therefore, in order for
emulsification to be an important mechanism, the power imparted by the agitator must be
capable of reducing droplets to sizes small enough to affect their mobility within disrupted
cells. Equation 1 provides a lower-limit estimate of this capability in the absence of
viscoelastic behavior of the interface (i.e. no protein-protein interactions). Thus for the
experimental value surface tension of 5 mN/m, eq 1 predicts maximum stable droplet
diameters of 40 µm, 7 µm, and 1 µm for 200 rpm, 500 rpm, and 1500 rpm, respectively.
Considering a typical cell diameter is about 30 µm, these results show that the agitation rates
used in this study do have the capability of affecting droplet mobility.

Figure 7. Response surfaces for oil erate and enzyme concentration at a solidand solid-liquid ratio at an agitation rate of 500 rpm. logarithmically; solid- liquid ratio andwere generated by JMP 6.0 statistical software package.
Alteration of interfacial properties for extraction from flour from flake
Treatments intended to vary the interfacial composition affect extraction y
shown in Table 3. Adding 3% (w/w solid) SDS increased yields by 13% compared to
extraction with no additions for flour from flake. This yield increase coincided with a
modest reduction in interfacial surface tension from 5.3 mN/m (
mN/m (±0.1) with SDS, which, according eq 1, would have reduced the maximum stable
droplet diameter from 7 µm to 5
0.10 in Table 3 is slightly lower than the pre
variations among batches of flour. If the formation of a viscoelastic interfacial film by
disulfide bridging or other protein
flake, the addition of 3% (w/w solid) SDS appears
46
Response surfaces for oil extraction yield for flour from flake . (A) Agitation rate and enzyme concentration at a solid-liquid ratio of 0.10; (B) enzyme concentration
liquid ratio at an agitation rate of 500 rpm. Agitation is varied liquid ratio and enzyme-liquid ratio are varied linearly.
were generated by JMP 6.0 statistical software package.
Alteration of interfacial properties for extraction from flour from flake
Treatments intended to vary the interfacial composition affect extraction y
shown in Table 3. Adding 3% (w/w solid) SDS increased yields by 13% compared to
extraction with no additions for flour from flake. This yield increase coincided with a
modest reduction in interfacial surface tension from 5.3 mN/m (±0.2) without
0.1) with SDS, which, according eq 1, would have reduced the maximum stable
m to 5 µm. It should be noted that yield without protease at
0.10 in Table 3 is slightly lower than the pre-enzyme phase of Figure 5, probably because of
variations among batches of flour. If the formation of a viscoelastic interfacial film by
disulfide bridging or other protein-protein interactions impede oil release from flour from
flake, the addition of 3% (w/w solid) SDS appears to be successful in disrupting such a film.
. (A) Agitation liquid ratio of 0.10; (B) enzyme concentration
Agitation is varied liquid ratio are varied linearly. Figures
Alteration of interfacial properties for extraction from flour from flake
Treatments intended to vary the interfacial composition affect extraction yield as
shown in Table 3. Adding 3% (w/w solid) SDS increased yields by 13% compared to
extraction with no additions for flour from flake. This yield increase coincided with a
0.2) without SDS to 2.1
0.1) with SDS, which, according eq 1, would have reduced the maximum stable
It should be noted that yield without protease at S/L =
5, probably because of
variations among batches of flour. If the formation of a viscoelastic interfacial film by
protein interactions impede oil release from flour from
to be successful in disrupting such a film.

47
While it is possible that proteolysis may increase yields by creating small
polypeptides that are better emulsifiers than native proteins, this is not supported by
interfacial surface tension data. The interfacial tension of skims extracted with or without
protease (ca. 5 mN/m) were not significantly different (Table 3), suggesting a more
complicated relationship between surface tension and extraction. If proteins adsorbed to the
oil-water interface inhibit droplet breakup by forming a viscoelastic film, then a probable
mechanism through which protease affects yield is by disrupting or preventing the formation
of such a protein film. Note that the difference in yields with protease (81.7%) and SDS
(84.8%) is more consistent with the modest predicted reduction in droplet diameter of 7 µm
to 5 µm for protease and SDS, respectively.
Table 3. Oil extraction yield, skim-oil interfacial tensions, and droplet size estimate for 4 hr extraction, 500 rpm with SDS, enzyme, and no additions using flour from flake.
*95% confidence interval for multiple experimental trials. ** Final value of kinetic
data. *** Mean ± range for two replicate trials. Letters denote significant differences (0.05
level). NA- not applicable.
ConditionOil Extraction
Yield (%)
Interfacial Tension of
Skim-oil Interface
(mN/m)
Max Stable Droplet
(µm), From Eq. 1
Oil-water NA 12.3 A 11.2
No enzyme, S/L = 0.10 71.7 (+/-1)*
5.3 B,C 7.2
No enzyme, S/L = 0.15 71**
4.2 B 6.4
No enzyme, S/L = 0.05 83.0**
5.3 B,C 7.2
E/S = 0.5%, S/L = 0.10 81.0**
5.3 B,C 7.1
E/S = 1.9%, S/L = 0.10 81.7**
5.8 C 7.5
3% (w/w) SDS, S/L = 0.10 84.8 (+/- 0.2)***
2.1 D 4.7

48
Data in Table 3 show that the solid-liquid ratio has no significant effect on interfacial
tension, although this parameter had the largest effect on yield in the response surface
experiment. If the extraction yield (and therefore droplet mobility) is an indicator of
intracellular oil droplet size, then use of the static interfacial tension with eq 1 does not give
an accurate description of droplet size in the absence of protease or SDS, as would be
expected if viscoelastic effects were inhibiting droplet breakup. The fact that solid-liquid
ratio has such a strong effect on extraction yield may support the hypothesis of protein
adsorption hindering droplet breakup, thereby reducing extraction yield. Figure 8 shows
extraction yield with and without protease for a wide range of solid-liquid ratio. As the
solids content decreases, the yield increases. At a solid-liquid ratio of 0.10, the emulsion
resulting from AEP has a multilayer protein interfacial layer of 14.5 mg/m2 (2). Having a
more dilute protein concentration in the liquid phase (i.e., at lower solid-liquid ratio) may
result in decreased interfacial coverage and easier disruption.
Figure 8. Effect of solid-liquid ratio on oil extraction yield with and without enzyme. A = 500 rpm. For enzyme extraction data, enzyme concentration ranged between 1.0% and 2.0% (w/w). Circles, yield before enzyme addition; diamonds, yield after enzyme addition; curve, response surface model for enzyme addition.

49
While surface tension data do not explain why proteases increase extraction yield, the
fact that SDS and solid-liquid ratio do have such a strong effect on yield indicates that
interfacial phenomena and emulsification mechanisms are important in determining
AEP/EAEP yields.
Mechanistic model for AEP of flour from flake
Based on the microscopy of flour from flake and these emulsification hypotheses,
several non-sequential events can be deduced to occur during aqueous extraction of flour:
(1) instantaneous release of oil already outside of the cellular matrix from completely
disrupted cells; (2) dissolution of protein bodies; (3) coalescence of oil bodies; (4) protein
adsorption to the oil-water interface; (5) formation of a viscoelastic protein film at the oil-
water interface; (6) break-up of coalesced droplets by inertial turbulent forces; (7) movement
of droplets from the cellular matrix into the bulk fluid. Figure 9 shows a model constructed
around these steps, assuming that steps (1) and (2) occur quickly. In the model, Pe,i is oil
from cells of a high degree of disruption, which is already outside of the cellular matrix and
is readily removed. P1 is small oil droplets (or intact oil bodies) from disrupted cells of the
cellular matrix that can pass into the bulk medium after the protein bodies have dissolved.
While this is occurring, oil in P1 coalesces into P2, a pool of larger droplets that have a lower
mobility and are more difficult to extract. At longer times, a protein film forms around
droplets in P2, such that the turbulent forces are no longer capable of breaking them into
droplets of an extractable size and this oil joins an unextractable pool, Pu. Oil in undisrupted
cells, Pu,i, remains unextractable throughout the extraction. All kinetic processes are
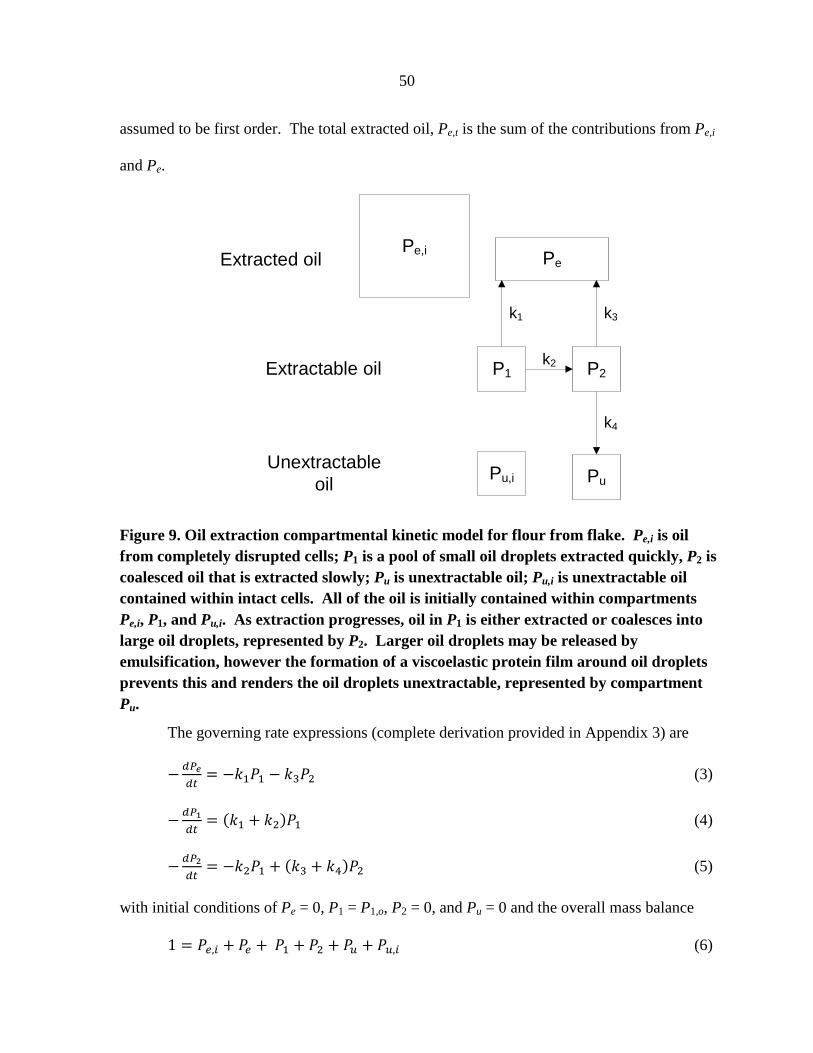
50
assumed to be first order. The total extracted oil, Pe,t is the sum of the contributions from Pe,i
and Pe.
Figure 9. Oil extraction compartmental kinetic model for flour from flake. Pe,i is oil from completely disrupted cells; P1 is a pool of small oil droplets extracted quickly, P2 is coalesced oil that is extracted slowly; Pu is unextractable oil; Pu,i is unextractable oil contained within intact cells. All of the oil is initially contained within compartments Pe,i, P1, and Pu,i. As extraction progresses, oil in P1 is either extracted or coalesces into large oil droplets, represented by P2. Larger oil droplets may be released by emulsification, however the formation of a viscoelastic protein film around oil droplets prevents this and renders the oil droplets unextractable, represented by compartment Pu.
The governing rate expressions (complete derivation provided in Appendix 3) are
� ����� � �� � ��� (3)
� �� �� � �� � ��� (4)
� ����� � ��� � ��� � ���� (5)
with initial conditions of Pe = 0, P1 = P1,o, P2 = 0, and Pu = 0 and the overall mass balance
1 � �,� � � � � � � � � �,� (6)
Pe,i Pe
P1 P2
PuPu,i
k2
k1 k3
k4
Extracted oil
Unextractable oil
Extractable oil

51
Solving these gives the expression for total oil extraction
�,� � �,� � ,� ��� � �
� ����� ����� � �!�� � � 1� � ����
������� � �!���� � 1�" (7)
where K1 = k1 + k2, and K2 = k3 + k4.
The sizes of pools Pe,i, P1,o, and Pu,i can be estimated using particle size distribution
data. Pu,i represents completely intact cells, which, according to microscopy of flour from
flake, must reside at the center of flour particles large enough to contain intact cells. The
diameter of the intact core of a flour particle will be some average length smaller than the
particle itself. The fraction of total volume occupied by intact cells will therefore be
# � ∑ %� �&',(&(
)� (8)
for all VI,i greater than the average cell volume, where I is the volume fraction occupied by
intact cells, Fi is the volume fraction of particles of size i as determined from light scattering
analysis, VI,i is the volume of the intact core of particles of size i, and Vi is the volume of
particles of size i. The average dimensional length of a soy cell is approximately 55 µm
(recall that typical cellular dimensions were 30 µm by 80 µm). Assuming spherical
geometry for flour particles, the intact cellular core of a flour particle must have a radius
about 55 µm smaller than the particle radius, and therefore
*+,� � �� ,�-� � 55 µm�� (9)
where r i is the radius of particle size i. Using the flour from flake particle size distribution
with eqs 8 and 9 gives a total intact cellular fractional volume of about 4.3% of total flour
volume. This agrees very well with protein extraction data with this material. Average
protein extraction yields ranged from 93% (±0.5%) without protease to 95% (±0.7%) with
protease, indicating that no more than 5% of the cells remained intact. Likewise, the fraction
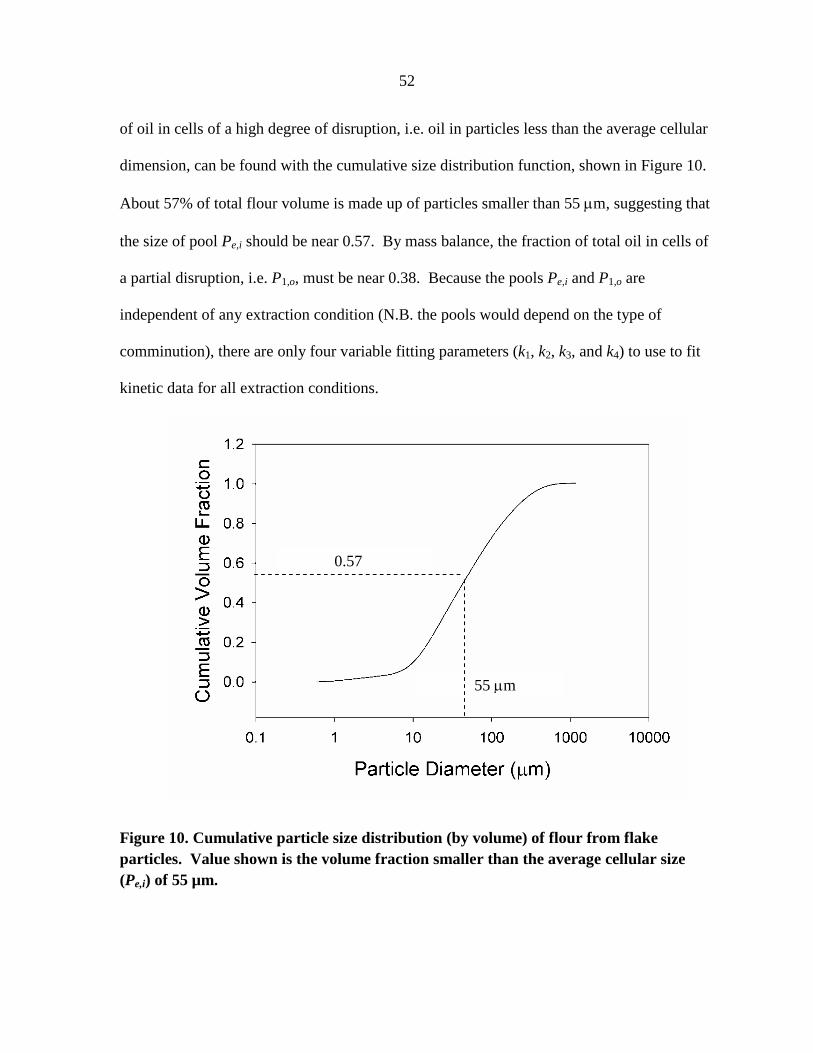
52
of oil in cells of a high degree of disruption, i.e. oil in particles less than the average cellular
dimension, can be found with the cumulative size distribution function, shown in Figure 10.
About 57% of total flour volume is made up of particles smaller than 55 µm, suggesting that
the size of pool Pe,i should be near 0.57. By mass balance, the fraction of total oil in cells of
a partial disruption, i.e. P1,o, must be near 0.38. Because the pools Pe,i and P1,o are
independent of any extraction condition (N.B. the pools would depend on the type of
comminution), there are only four variable fitting parameters (k1, k2, k3, and k4) to use to fit
kinetic data for all extraction conditions.
Figure 10. Cumulative particle size distribution (by volume) of flour from flake particles. Value shown is the volume fraction smaller than the average cellular size (Pe,i) of 55 µm.
55 µm
0.57

53
Equation 7 and initial pool sizes from the particle size distribution gave good fits to
kinetic extraction data, shown in Figures 11 and 12, with resulting parameter values shown in
Table 4. In all cases, the value of k1, the kinetic parameter for small droplet extraction, was
at least an order of magnitude greater than k3, the parameter for coalesced oil extraction,
consistent with the model concepts where coalesced oil has a lower mobility within the
cellular matrix than small droplets. For extraction without enzyme, values for k2, k3, and k4
were roughly invariant with extraction conditions. This indicates that the shapes of the
extraction curves are approximately the same after the first five minutes of extraction,
regardless of solid-liquid ratio, and that the final yield is determined mostly by the rate of oil
release in the first minutes of extraction, represented by the k1 term. Indeed, the value of k1 is
enough greater for the S/L = 0.05 condition that the conversion to P2 is less significant. A
strategy of increasing yield by reducing the flow to P2 (and subsequently Pu), would be to
prevent coalescence. Other investigators have made recent advances in preventing oil body
coalescence by extracting in sucrose, with yields similar to extraction with SDS, and very
little oil in the skim fraction (34). The use of LMW surfactants may also prevent both
coalescence and film formation and may produce an emulsion that is less stable toward
creaming.

54
Figure 11. Kinetics of oil extraction for flour from flake with model fit for three different solid-liquid ratios. All extractions were without enzyme, with an agitation rate of 500 rpm. Curves represent model (eq 7) using parameters in Table 4. Circles, S/L = 0.05; triangles, S/L = 0.10; diamonds, S/L = 0.19.
Figure 12. Kinetics of oil extraction yield and degree of hydrolysis for flour from flake with and without protease at a solid-liquid ratio of 0.10, and an agitation rate of 500 rpm. Solid curves represent model (eq 7) using parameters in Table 4. Circles, no enzyme; triangles, E/S = 0.5%; diamonds, E/S = 1.9%; dotted curve, degree of hydrolysis for E/S = 0.5%, dotted-dashed curve, degree of hydrolysis for E/S = 1.9%.

55
Table 4. Parameter estimates of non-linear regression fits of eq 7 to oil extraction kinetic data for various solid to liquid ratios (S/L) and enzyme to solid ratios (E/S) for extraction from flour from flake. Values for Pe,i and P1,o were 0.57 and 0.38, respectively.
In these experiments, conversion to P2 becomes significant after ca. 5 min. To get an
idea of the significance of this time scale we can compare the range of times that would be
required for diffusive release of an oil body (0.5 µm in diameter) from a cell interior (ca. 55
µm). Viscosity would be the primary determinant of diffusivity. The Stokes-Einstein
equation can be used to estimate diffusivity for the measured viscosity at S/L = 0.10 (1.22 cP)
compared to a lower limit as S/L decreases (i.e., water at 0.56 cP) which gives a time for 95%
removal of 13 min vs. 6 min and grows to 27 vs. 13 min if the path length is the full length of
a cell (80 µm) (35). Hence, within the range of expected viscosities, the competing
coalescence event becomes increasingly important. This also reinforces the validity of
viewing k1 in terms of mass transfer.
The alternative of protein dissolution rate determining k1 seems less consistent with
the time scales observed. Although collecting reproducible data on time scales much less
than five minutes was not possible, the fraction of protein dissolved was already at 92.4%,
within 1% of the final value (93.5%) at 5 min (S/L=0.10).
With one exception, the addition of enzyme increased the rates of all the processes in
this model. These effects can be explained in terms of the proteolytic action. Hydrolysis may
increase the rate of release of small oil droplets (k1) by either decreasing liquid viscosity or
Parameter
S/L = 0.05
(no enzyme)
S/L = 0.10
(no enzyme)
S/L = 0.10 Rep
(no enzyme)
S/L = 0.15
(no enzyme)
S/L = 0.15 Rep
(no enzyme)
S/L = 0.19
(no enzyme)
S/L = 0.10
(E/S = 0.5%)
S/L = 0.10
(E/S = 1.9%)
k1 0.331 0.059 0.101 0.018 0.022 0.064 0.170 0.500
k2 0.290 0.307 0.361 0.042 0.103 0.233 0.258 0.611
k3 0.003 0.006 0.005 0.001 0.004 0.006 0.029 0.046
k4 0.006 0.019 0.014 0.006 0.014 0.025 0.044 0.092

56
by increasing the rate of dissolution of protein bodies, as discussed above. However, Figure
12 shows that the protease has the largest effect on extraction at short extraction times (less
than 30 min) while the degree of hydrolysis is still very low (<2%). This may indicate that
the effect of hydrolysis is to create small polypeptide fragments that behave like LMW
surfactants, such as SDS, and assist extraction at short extraction times. Large polypeptides
may have a stronger influence on droplet interfacial behavior at longer extraction times after
droplets have undergone multiple cycles of breakup and coalescence, leading to similar
interfacial tension measurements seen in Table 3. Figure 12 also illustrates an advantage of
EAEP of soy flours over soy extrudates in that increases in yields can be achieved with
minimal protein alteration, leaving open the possibility of creating soy protein isolates with
similar functional properties as conventional isolates.
In terms of the other mechanisms discussed, hydrolysis may increase the rate of
droplet coalescence (k2) by disrupting the oleosin membrane of the oil bodies. The release of
larger coalesced oil droplets (k3) may also be increased if those droplets are more easily
disrupted again into smaller droplets (i.e., they have a smaller maximal stable droplet
diameter), which may occur if hydrolyzed proteins form weaker interfacial films. Finally,
the formation of these films (k4) may also occur more quickly with protein hydrolyzates
because smaller polypeptides would be able to diffuse more quickly to the interface than
native proteins, and, because of the denaturation that occurs as a result of hydrolysis, no
additional conformational changes would be necessary for intermolecular interactions to
occur between polypeptides. It was also hypothesized above that the effect of enzyme may
be to disrupt or prevent the formation of interfacial protein films, a state represented by Pu.

57
However, forcing a very small value of k4 in the model resulted in noticeably poorer fits (data
not shown).
In summary, the extraction model based on microscopic observation, inferences of
the interfacial properties, and pool sizes predicted by particle size distribution analysis fit the
experimental data well. Observed initial extraction rates are consistent with diffusion-limited
extraction rates. Hydrolysis data indicate that the role of proteolysis in flour from flake
extraction may be to create small polypeptides that behave similarly to a LMW surfactant.
Acknowledgements
This work was sponsored by the USDA CREES Grant #2005-34432-1406 and 2006-
34432-17128, with additional funding from the Iowa State University Plant Science Institute.
We would like to thank Tracey Pepper and Randall DenAdel for the microscopy, Prof. Tong
Wang for use of her surface tensiometer, and Peter Bierschbach of Genencor, Intl, Julia
Nobrega de Moura, and the Iowa State University Center for Crops Utilization Research for
providing materials used for this research.
References
1. Moura, J.; Campbell, K.; Mahfuz, A.; Jung, S.; Glatz, C. E.; Johnson, L., Enzyme-
assisted aqueous extraction of oil and protein from soybeans and cream de-
emulsification. J. Am. Oil Chem. Soc. 2008, 85, (10), 985-995.
2. Morales-Chabrand, R. M.; Kim, H. J.; Zhang, C.; Glatz, C. E.; Jung, S.,
Destabilization of the emulsion formed during aqueous extraction of soybean oil. J.
Am. Oil Chem. Soc. 2008, 85, (4), 383-390.

58
3. Morales-Chabrand, R. M.; Glatz, C. E., Destabilization of the emulsion formed
during the enzyme-assisted aqueous extraction of oil from soybean flour. Enzyme
Microb. Technol. 2009, 45, (1), 28-35.
4. Lusas, E. W.; Lawhon, J. T.; Rhee, K. C., Producing edible oil and protein from
oilseeds by aqueous processing. Oil Mill Gazette 1982, 4, 28-34.
5. Rosenthal, A.; Pyle, D. L.; Niranjan, K., Simultaneous aqueous extraction of oil and
protein from soybean: mechanisms for process and design. Trans. Food Bioprod.
Proc. 1998, 76, 224-230.
6. Rosenthal, A.; Pyle, D. L.; Niranjan, K.; Gilmore, S.; Trinca, L., Combined effect of
operational variables and enzyme activity on aqueous enzymatic extraction of oil and
protein from soybean. Enzyme Microb. Technol. 2001, 28, 499-509.
7. Rosenthal, A.; Pyle, D. L.; Niranjan, K., Aqueous and enzymatic processes for edible
oil extraction. Enzyme Microb. Technol. 1996, 19, 403-429.
8. Lamsal, B. P.; Murphy, P. A.; Johnson, L. A., Flaking and extrusion as mechanical
treatments for enzyme-assisted aqueous extraction of oil from soybeans. J. Am. Oil
Chem. Soc. 2006, 83, (11), 973-979.
9. Freitas, P. S.; Couri, L.; Janklonka, F.; Carvalho, C., The combined application of
extrusion and enzymatic technology for extraction of soybean oil. Fett/Lipid 1997, 9,
333-337.
10. Adler-Nissen, J., Enzymatic hydrolysis of food proteins. Elsevier Applied Science
Publishers: New York, NY, 1985.
11. Bair, C. W.; Snyder, H. E., Electron-microscopy of soybean lipid bodies. J. Am. Oil
Chem. Soc. 1980, 57, (9), 279-282.

59
12. Nielsen, N. C., In New Protein Foods Vol. 5: Seed Storage Proteins, Altschul, A. A.;
Wilcke, H. L., Eds. 1985; Vol. 5.
13. Iwanaga, D.; Gray, D. A.; Fisk, I. D.; Decker, E. A.; Weiss, J.; McClements, D. J.,
Extraction and characterization of oil bodies from soy beans: A natural source of pre-
emulsified soybean oil. J. Agric. Food Chem. 2007, 55, (21), 8711-8716.
14. Nikiforidis, C. V.; Kiosseoglou, V., Aqueous extraction of oil bodies from maize
germ (zea mays) and characterization of the resulting natural oil-in-water emulsion. J.
Agric. Food Chem. 2009, 57, (12), 5591.
15. Vankova, N.; Tcholakova, S.; Denkov, N. D.; Ivanov, I. B.; Vulchev, V. D.; Danner,
T., Emulsification in turbulent flow: 1. Mean and maximum drop diameters in inertial
and viscous regimes. J. Colloid Interface Sci. 2007, 312, (2), 363-380.
16. Hettiarachchy, N., In Soybeans : Chemistry, Technology, and Utilization, Liu, K., Ed.
Chapman & Hall: New York, 1997; p 397.
17. Jung, S.; Lamsal, B.; Stepian, V.; Johson, L.; Murphy, P., Functionality of soy protein
produced by enzyme-assisted extraction. J. Am. Oil Chem. Soc. 2006, 83, (1), 71-78.
18. Moure, A.; Sineiro, J.; Dominguez, H.; Parajo, J. C., Functionality of oilseed protein
products: A review. Food Res. Int. 2006, 39, (9), 945-963.
19. Mackie, A.; Wilde, P., The role of interactions in defining the structure of mixed
protein-surfactant interfaces. Adv. Colloid Interface Sci. 2005, 117, (1-3), 3-13.
20. McClements, D. J., Protein-stabilized emulsions. Cur. Opin. Colloid & Interface Sci.
2004, 9, (5), 305-313.
21. Fischer, P.; Erni, P., Emulsion drops in external flow fields - The role of liquid
interfaces. Cur. Opin. Colloid & Interface Sci. 2007, 12, (4-5), 196-205.

60
22. A. Bos, M.; van Vliet, T., Interfacial rheological properties of adsorbed protein layers
and surfactants: a review. Adv. Colloid Interface Sci. 2001, 91, (3), 437-471.
23. Jones, D. B.; Middelberg, A. P. J., Interfacial protein networks and their impact on
droplet breakup. Aiche J. 2003, 49, (6), 1533-1541.
24. Gunning, P. A.; Mackie, A. R.; Gunning, A. P.; Wilde, P. J.; Woodward, N. C.;
Morris, V. J., The effect of surfactant type on protein displacement from the air-water
interface. Food Hydrocolloids 2004, 18, (3), 509-515.
25. Wilde, P.; Mackie, A.; Husband, F.; Gunning, P.; Morris, V., Proteins and emulsifiers
at liquid interfaces. Adv. Colloid Interface Sci. 2004, 108, 63-71.
26. Bos, M. A.; van Vliet, T., Interfacial rheological properties of adsorbed protein layers
and surfactants: a review. Adv. Colloid Interface Sci. 2001, 91, (3), 437-471.
27. Damodaran, S.; Anand, K., Sulfhydryl-disulfide interchange-induced interparticle
protein polymerization in whey protein-stabilized emulsions and its relation to
emulsion stability. J. Agric. Food Chem. 1997, 45, (10), 3813-3820.
28. Wu, S. W.; Murphy, P. A.; Johnson, L. A.; Fratzke, A. R.; Reuber, M. A., Pilot-plant
fractionation of soybean glycinin and beta-conglycinin. J. Am. Oil Chem. Soc. 1999,
76, (3), 285-293.
29. Wolf, W. J., Sulfhydryl content of glycinin- effect of reducing agents. J. Agric. Food
Chem. 1993, 41, (2), 168-176.
30. Kim, H. J.; Decker, E. A.; McClements, D. J., Impact of protein surface denaturation
on droplet flocculation in hexadecane oil-in-water emulsions stabilized by beta-
lactoglobulin. J. Agric. Food Chem. 2002, 50, (24), 7131-7137.

61
31. Wolf, W. J.; Baker, F. L., Scanning electron-microscopy of soybeans. cereal science
today 1972, 17, (5), 124-7.
32. Bair, C. W. Microscopy of soybean seeds: Cellular and subcellular structure during
germination, development, and processing with emphasis on lipid bodies. Ph. D.,
Iowa State University, Ames, IA, 1979.
33. Tzen, J. T. C.; Cao, Y.-s.; Laurant, P.; Ratnayake, C.; Hagenmaier, R. D., Lipids,
proteins, and structure of seed oil bodies from diverse species. Plant phsysiol. 1993,
101, 267-276.
34. Kapchie, V. N.; Wei, D.; Hauck, C.; Murphy, P. A., Enzyme-assisted aqueous
extraction of oleosomes from Soybeans (Glycine max). J. Agric. Food Chem. 2008,
56, (5), 1766-1771.
35. Bird, B. R.; Stewart, W. E.; Lightfoot, E. N., Transport Phenomena. 1 ed.; John
Wiley and Sons: New York, 1960.

62
CHAPTER 4. MECHANISMS OF AQUEOUS EXTRACTION OF
EXTRUDED SUNFLOWER MEAL
A paper to be submitted to the Journal of the American Oil Chemists Society
Kerry A. Campbell1, Pierre-Yves Pontallier2, Charles E. Glatz1
1Department of Chemical and Biological Engineering, Iowa State University
2Laboratoire de Chimie Agro-Industrielle, Ecole Nationale Supérieure des Ingénieurs en Arts
Chimiques Et Technologiques
Authorship roles:
Campbell: Primary author. Conducted research in Toulouse, France, as a participant in the
ISU Biorenewable Technologies exchange program (Department of Education Fund
for Improvement in Post-secondary Education).
Glatz: Principal investigator
Pontallier: Research adviser at host institution
Abstract
Aqueous extraction processing (AEP) with and without enzymes was studied to
improve vegetable oil extraction yields of extruded sunflower meal without the use of
hazardous organic solvents. Microscopic observation of sunflower meal before and after
AEP indicated extensive cellular disruption was achieved by extrusion, but unextracted oil
remained sequestered as coalesced oil within the cell wall confines of disrupted cotyledon
cells, as well as within the void spaces of sclerenchyma cells of the pericarp. A full factorial

63
design experiment showed that agitation and cellulases increased oil extraction yield,
indicating emulsification and alteration of the confining cellular matrix were important
mechanisms for improving yields. Protease and solid-liquid ratio did not significantly affect
oil yield, indicating key differences with previously established mechanisms for soy oil
extraction. We hypothesized that this is because of differences in the nature of the proteins
present as well as the geometry of the confining cellular matrices.
Introduction
An important part of the Green Chemistry movement is to develop technologies that
are environmentally friendly and reduce the use of petroleum-derived materials. For oilseeds
with high oil content such as sunflower, yields of 70 to 85% can be achieved by extrusion
alone [1-2]. To maximize yields, however, residual oil in the extruded meal must be
extracted with an organic solvent, most commonly hexane, a hazardous and polluting
petroleum product. Aqueous extraction processing (AEP) and enzyme-assisted aqueous
extraction processing (EAEP) are inherently safe water-based extraction processes that, with
the use of enzymes, have succeeded in achieving free oil yields as high as 88% in soybean oil
extraction [3-4]. To increase oil yields from EAEP of sunflower meal, it is necessary to
develop a thorough understanding of the extraction mechanisms of EAEP.
Campbell and Glatz have established that emulsification is an important extraction
mechanism for EAEP of soybean flour [5]. In an aqueous environment, where the extract
(oil) is immiscible with the solvent (water), extraction is increased when coalesced oil
entrapped within ruptured cells can be emulsified into smaller, more mobile droplets by
turbulent forces in the extraction medium. Therefore, one important factor in AEP/EAEP is

64
the geometry of the confining matrix as determined by the nature of the oilseed itself, as well
as the mode of comminution used to disrupt cells. For soybeans, grinding and extruding
produced substrates with very different physical geometries from which the oil must escape
[5]. Another important factor for soybean oil extraction is the nature of the oil-water
interface. Campbell and Glatz proposed that the mechanism through which protease
increases oil yields in flour extraction is by disrupting a viscoelastic interfacial protein film at
the oil-water interface, facilitating emulsification [5]. Badr and Sitohy demonstrated that
proteases can also increase the yields of sunflower oil, although no hypothesis was developed
to explain why [6]. The objectives of this work were to study the extraction mechanisms of
AEP of extruded sunflower meal by microscopic observation of extracted meals, and by
studying parameter effects on extraction yields with the use of protease and cellulase.
Materials and Methods
Preparation of Starting Material
Common variety sunflower kernels (with hulls) obtained from Toulgrain, Inc.
(Toulouse, France) were extruded in a Presse Omega 20 bench-top single-screw press-
extruder (Eurl Laplace Co., Pau, France). The extruder was equipped with a collar heater
around the die housing. Steady-state exit temperature of the extruded cake was measured to
be around 100 °C (+/- 5 °C) with an infrared thermometer. Expressed oil was collected,
weighed, and centrifuged. The resulting precipitate was rinsed three times with cylcohexane,
dried, and weighed to determine the fraction of solids in the expressed oil. Resulting cake
was cooled and then ground in a Pulverisette 19 (Fritsch Ltd., Idar-Obersteen, Germany)
knife mill with a 2 mm outlet screen. Starting material was stored at -20 °C until use.

65
Extraction
For yield determination experiments, starting material was added to 1L of deionized
water in a 2 L jacketed reactor with an agitator held at 50 °C with a water bath and at
constant pH 6.5 by using a 716 DMS Titrino autotitrator (Metrohm Ltd., Herisau,
Switzerland) with 2N NaOH. Samples were collected by siphon into a 500 mL bottle,
weighed, and centrifuged 3000 x g for 15 min at 20 °C. Supernatant was discarded and the
remaining residual solid was weighed, freeze dried, and weighed again for moisture
determination. Freeze dried precipitate was ground in a coffee grinder for approximately 30
s and then stored in a dessicator until oil and protein content determination. Yield was
calculated as one minus the fraction of total material remaining in the residual fraction.
Protein dissolution was defined as the protein extraction yield plus the fraction of protein
entrained in the solid fraction, estimated by multiplying the liquid fraction protein
concentration times the mass of water in the solid fraction. Liquid fraction protein content
was determined by mass balance based on the protein content of the residual. For
microscopy experiments, extruded sunflower was placed in 500 mL centrifuge bottles with
DI water for a solid-liquid ratio of 1:10. Bottles were placed on a stir plate in a water bath
held at 50 °C, and agitated with a magnetic stir bar. Centrifugation (3000 x g 15 min at 20
°C) resulted in two distinct layers in the centrifuge bottles. Therefore, samples for
microscopy were from the bulk mixture before centrifugation and from each of the two layers
after centrifugation.

66
Full Factorial Design Experiment
To elucidate the effects of enzyme, solid-liquid ratio, and agitation, a full factorial
design experiment was conducted using two continuous two-level parameters: solid-liquid
ratio (0.05 and 0.10) and agitation rate (160 and 350 rpm); and two discrete parameters: with
and without protease Protex 7L (2% w/w solids) and with and without cellulase Multifect CX
13L (2% w/w solid) giving a total of 16 possible experimental conditions. The active pH
ranges of these enzymes overlap in the pH 6 to 7 region, and so pH 6.5 was selected for all of
these experiments. Measured responses were oil extraction yield, protein dissolution, and
non-lipid material dissolution. Conditions are outlined in Table 1.
Table 1- Experimental conditions used for the full-factorial experiment.
Analytical Methods
Oil was extracted from residual samples for 10 min, four times at 105 °C and 95 bar
with cyclohexane using an ASE 200 Accelerated Solvent Extractor (Dionex Corp,
Sunnyvale, CA). Extract was transferred from vials to preweighed glass beakers (dried 1 h at
103 °C, cooled to room temperature on bench top), rinsing twice with cyclohexane.
Cyclohexane was evaporated by placing beakers in a boiling water bath and then the beakers
were dried for 1 h in a 103 °C oven. Beakers were cooled to room temperature on the bench
top, and weighed again to determine mass of oil. Protein content was determined by the
Parameter Level -1 Level 1
Solid-liquid ratio (g/ml) 0.05 0.10
Agitation rate (rpm) 160 360
Protease (w/w solid) 0 2%
Cellulase (w/w solid) 0 2%

67
Kjeldahl total nitrogen method using a nitrogen to protein conversion factor of 6.25 g protein
per g nitrogen. Residual moisture content was determined by loss of mass upon freeze
drying. Moisture gained upon sample storage was analyzed simultaneously with oil content
determination by measuring the loss of mass upon drying samples at 103 °C for 24 hours.
This was used to correct the oil content determination.
Particle size distribution of starting material
Particle size distribution of starting material was determined by sieving. Ca. 250 g of
starting material was placed in a sieve-shaker equipped with four different sieve sizes: 1.25,
0.80, 0.50, and 0.25 mm. Material was fractionated for 15 min with frequency of 50 s-1, and
material of each screen was weighed.
Differential Scanning Calorimetry (DSC)
The extent of protein denaturation was determined by measuring the heat absorbed by
12 mg samples of dry material heated at a rate of 10 °C/min using a Pyris 1 differential
scanning calorimeter (Perkin Elmer, Waltham, MA).
Microscopy
Samples were fixed and embedded following Bair and Snyder [7] with minor
modifications at the Centre de Microscopie Electronique Appliquée in Toulouse, France.
Whole seed was imbibed overnight in deionized water; comminuted samples were placed
directly into fixative solution. Tissues were fixed in 2% glutaraldehyde (w/v) and 2%
paraformaldehyde (w/v) in 0.1 M cacodylate buffer, pH 7.2 for 48 hours at 4 °C. Samples
were rinsed 2 times in 0.1 M cacodylate buffer (pH 7.2) and then fixed in 1% osmium

68
tetroxide in 0.1 M cacodylate buffer for 1 hour (room temp.) The samples were then
dehydrated in a graded ethanol series, cleared with ultra-pure acetone, infiltrated and
embedded using a Spurr’s epoxy resin (Electron Microscopy Sciences, Ft. Washington, PA).
Resin blocks were polymerized for 48 hours at 65 °C. Sections were made at the Iowa State
University NanoImaging Facility using a Reichert Ultracut S ultramicrotome (Leeds
Precision Instruments, Minneapolis, MN). Thick sections were contrast stained using 1%
toluidine blue. Light microscopy images were captured using a Zeiss Axioplan 2 light
microscope (Carl Zeiss MicroImaging, Inc., Thornwood, NY).
Results
Composition of starting material
The composition of the starting material used in all experiments was determined to be
9.0% (±0.1) moisture, 20.6% (±0.1) oil (dry basis), and 30.1% (±0.4) protein (dry basis).
Based on the mass of oil expelled during extrusion, the oil content of the entire seed (kernel
plus hull) prior to extrusion was 44%. Oil extraction yield from extrusion alone was 68%.
Particle size distribution of extruded sunflower meal
The mass-weighted particle size distribution profile is shown in Figure 1. The only
fraction where hulls were not clearly visible was the smallest fraction, <0.25 mm. The
largest fraction appeared to be mostly hulls, with the other fractions containing a mix of seed
particles and hull. The high oil content of the pressed starting material caused considerable
clumping, making sieve separation ineffective for the smaller particle size ranges.

69
Figure 1- Mass-averaged particle size distribution of starting material as determined by sieving.
DSC analysis of starting material
For soybean extraction, the extent of protein denaturation and solubility have
important influences on the oil yield from aqueous extraction [8]. In extruded soybean, oil
extraction was limited by oil sequestration in an insoluble matrix of denatured protein [5].
Therefore, the conformational state of sunflower protein in the extrudate was analyzed. The
heat absorption profile of the extrudate is shown in Figure 2. An obvious peak occurs at 150
°C, which is slightly lower than the 155 °C denaturation temperature determined by Rouilly
et al. [9] for untreated sunflower of similar moisture content (10%). The peak area divided
by the protein content of the samples gives a specific heat of denaturation of 9.7 (±0.4) J/g
protein. By comparison, Rouilly et al. report denaturation enthalpies of 8.6 J/g protein.
Therefore, the extrusion conditions used here did not affect the conformational state of the
sunflower proteins.
0.12
0.19
0.24
0.34
0.12
0
0.05
0.1
0.15
0.2
0.25
0.3
0.35
0.4
<0.25 0.5<x<0.25 0.8<x<0.5 1.25<x<0.8 > 1.25
Mas
s F
ract
ion
Partilce size (mm)

70
Figure 2- Representative differential scanning calorimetry profiles of extruded and pressed sunflower.
Microscopy
Images before and after extrusion are shown in Figure 3. Cotyledon cells (Figure 3A)
range from 50 to 100 µm in length, and are 20 to 40 µm in diameter. Protein bodies range
from 1 to 10 µm in diameter, but fill a smaller proportion of the cytoplasmic volume
compared to soy protein bodies [7, 10]. The space between protein bodies is occupied by oil
bodies, a protein-phospholipid membrane-delimited oil storage organelle.
After extrusion, intact cotyledon cells were not evident (Figure 3B). Regions of
disrupted cotyledon cells with few recognizable structures are seen between regions of intact
sclerenchyma cells, the hollow structural and vascular tissue which makes up the bulk of the
sunflower pericarp [10]. Some disrupted cell wall material can be seen on the outer regions
of the disrupted cotyledon tissue (images not shown). Lipid was observed mostly as
coalesced oil in the outer regions of the extruded cellular matrix inside and outside disrupted

71
cells. No intact oil bodies can be seen. Some lipid is observed in the interior of
sclerenchyma cells of the pericarp. Sunflower pericarp is low in lipid (generally less than
5%) and it is unlikely that the lipid observed here occurs in vivo. A likely explanation for
this observation is that the heat and pressure during extrusion causes some oil to fill the void
spaces in the sclerenchyma cells.
After centrifugation, residual material settled into two distinct layers in the centrifuge
bottles: a lower coarse layer making up ca. 80% of residual volume, and an upper layer of
fine gray material making up the remainder. The lower layer consisted of a mixture of
pericarp and disrupted cotyledon tissue while the upper layer contained only cotyledon cells
with some seed coat particles (Figure 4). As before, no intact cotyledon cells were observed;
all cells have undergone at least some extraction of the cytoplasmic material but oil remains
in some cells as coalesced oil droplets. Furthermore, coalesced oil is again prominent in
sclerenchyma cells. These results are similar to those observed in soybean, where
unextracted oil is sequestered in the interior of disrupted cells as coalesced droplets too large
to pass out of the matrix [5]. A notable difference from soybean, however, is the entrapment
of oil in the void spaces of the pericarp sclerenchyma cells. Based on these observations, the
extraction yields from both extrusion as well as AEP/EAEP could be improved if the kernels
could be extruded in the absence of hulls.
While the increase in oil extraction yield after cellulase treatment was significant, the
increase was relatively small at 3%. In these images, there are no noticeable differences
between material extracted with and without cellulase. Still, the entrapment of oil droplets
inside the cell wall confines of disrupted cells suggests that the effect of the cellulase is to
disrupt this confining matrix.

72
Figure 3- (A) LM of native sunflower cotyledon cells. Protein bodies are dark blue globules <20 µm in length. Oil bodies fill the cytoplasmic space between protein bodies, 40X magnification. (B) LM of tissue after extrusion with features indicated: DC, region of disrupted cotyledon cells; S, region of intact sclerenchyma cells; SC, seed coat, 10X magnification.
Figure 4- LM of residue after extraction: (A) AEP Coarse layer sample (extracted without cellulase) showing intact sclerenchyma cells, 40X magnification; (B) EAEP coarse layer sample (extracted with cellulase) showing intact sclerenchyma cells, 10X magnfication; (C) AEP fine layer sample 40X magnification; (D) EAEP fine layer sample, 40X magnification. CO, coalesced oil; S, region of sclerenchyma cells; DC, region of disrupted cotyledon cells.

73
Full-Factorial Design Experiment
The measured responses for oil extraction yield, protein dissolution, and non-lipid
material dissolution are shown in Table 2. Parameter estimates, the resulting analysis of
variance, and statistical significance are shown in Table 3. For oil extraction yield, only
agitation and cellulase had significant primary effects. Dissolution of non-lipid material, on
the other hand, was not affected by agitation at all, with protease having the most important
significant effect. The effect of cellulase was also significant, but the increase in dissolution
caused by cellulase was much smaller than that of protease. Only protease had a significant
effect on protein dissolution with an average increase of 28%.
Table 2- Conditions and experimental results of the full-factorial design experiment to determine parameter effects.
Trial S/L
Agitation
rate
(rpm)
Protease
concentration
(w/w)
Cellulase
concentration
(w/w)
Oil
extraction
yield
Fraction of
non-lipid
solubilized
Fraction of
protein
solubilized
1 0.10 160 0.00 0.02 0.30 0.30 0.59
2 0.05 350 0.02 0.02 0.40 0.44 0.85
3 0.05 160 0.02 0.02 0.30 0.39 0.85
4 0.05 350 0.00 0.02 0.35 0.27 0.55
5 0.10 350 0.02 0.00 0.33 0.39 0.85
6 0.10 350 0.00 0.00 0.32 0.26 0.57
7 0.10 160 0.00 0.00 0.30 0.28 0.55
8 0.10 160 0.02 0.02 0.26 0.38 0.84
9 0.05 350 0.02 0.00 0.36 0.36 0.84
10 0.10 160 0.02 0.00 0.23 0.38 0.85
11 0.05 160 0.02 0.00 0.27 0.36 0.84
12 0.05 160 0.00 0.00 0.20 0.27 0.56
13 0.05 350 0.00 0.00 0.33 0.25 0.56
14 0.10 350 0.00 0.02 0.35 0.27 0.54
15 0.05 160 0.00 0.02 0.28 0.27 0.57
16 0.10 350 0.02 0.02 0.33 0.38 0.85

74
Table 3- Parameter estimates and significance for oil extraction yield, dissolution of non-lipid solids, and dissolution of protein.
Comparisons of the significant parameters for the three different responses give
insight into possible extraction mechanisms. Agitation can increase oil yield through several
physical mechanisms. At the most severe levels, agitation can increase oil release by
rupturing intact cells. Since agitation did not affect dissolution of protein or other non-lipid
material, it is unlikely agitation caused significant cell rupture, since this would have released
soluble materials into the medium. This may have been because the extrusion alone achieved
a high degree of cellular disruption as indicated by microscopic observation. The shear and
turbulence imparted by agitation can also break up the solid matrices that entrap oil within
the confines of disrupted cells. A third possibility is that the turbulence of agitation increases
the emulsification of oil within the cells, creating smaller oil droplets that pass more easily
through the cellular matrix into the bulk fluid. Increasing agitation from 160 rpm to 350 rpm
increased oil extraction yields by an average of 8%. Recently, Campbell and Glatz showed
that emulsification is an important extraction mechanism for AEP of soybean oil [5]. To
Estimate Prob>|t| Estimate Prob>|t| Estimate Prob>|t|
Intercept 0.2923 <0.001 0.327 <0.001 0.704 <0.001
S/L -0.0057 0.317 0.004 0.394 0.001 0.868
Protease 0.0003 0.959 0.058 *<0.001 0.142 *<0.001
Agitation 0.0384 *0.001 0.000 0.954 -0.003 0.341
Cellulase 0.0144 *0.038 0.011 *0.044 0.002 0.640
S/L*Protease -0.0184 *0.016 -0.006 0.200 0.000 0.930
S/L*Agitation -0.0090 0.141 -0.006 0.206 0.000 0.949
Protease*Agitation 0.0060 0.299 0.005 0.270 0.003 0.424
S/L*Cellulase -0.0063 0.273 -0.008 0.098 -0.002 0.607
Protease*Cellulase 0.0030 0.583 0.003 0.497 0.000 0.899
Agitation*Cellulase 0.0003 0.951 0.001 0.792 -0.006 0.148
* significant p = 0.05 level
Oil extraction yieldFraction of non-lipid
material solubilized
Fraction of Protein
solubilizedTerm

75
illustrate what level of droplet disruption can be achieved in the given mixing system,
turbulent inertial droplet breakup models given by Vankova et al. [11], can be used to
estimate the maximal stable drop diameter of oil in the bulk liquid. According to these
models and the agitator power number, the maximal stable droplet diameter would be in the
range of 15 to 20 µm for the 160 rpm condition and 3 to 5 µm for the 360 rpm condition,
assuming no viscoelastic protein film at the interface, and interfacial surface tension of 5
mN/m, as measured for soy protein-oil systems[5]. Considering the cells are 20-40 µm in
diameter, it is likely that an important oil extraction mechanism is the in situ emulsification
of oil into smaller droplets that pass more easily through the disrupted cellular matrix into the
bulk fluid. The addition of a surfactant to the extraction would provide further information to
determine the extent to which emulsification, rather than matrix disruption, accounts for the
yield increase from agitation.
Cellulases affected both oil extraction yield and dissolution of non-lipid material, but
not dissolution of protein, indicating that cellulose degradation did occur but was limited.
Had cellulases caused the disruption of cells that were, prior to extraction, intact, then there
would have been an increase in protein dissolution along with the increase oil extraction
yield. Therefore, the increase in oil extraction yield from cellulase could have been caused
by further disruption of the intraparticle cell wall matrix of cells that had been disrupted
during extrusion. There are also more complex explanations, such as interactions between
sugars and the oil/water interfacial protein network, decreased interfacial surface tension
from cellulolytic hydrolysis products, or even a reduction of any affinity between oil and the
cell wall.

76
Campbell and Glatz suggested that a likely mechanism of protease for oil yield
enhancement in AEP of soybean is alteration of the oil-water interface by two possible
mechanisms:1) disruption of a viscoelastic protein film, or 2) creation of protein
hydrolysates that are better emulsifiers than native proteins [5]. They also hypothesized that
higher solid-liquid ratio (S/L) reduced soybean oil extraction by increasing interfacial protein
coverage, and therefore viscoelastic effects. Unlike soybean extraction, neither proteases nor
S/L had a measurable effect on oil extraction yield from sunflower. This contrast indicates a
fundamental difference between important mechanisms of these two systems. Sunflower has
a lower protein content than soy, 30% compared to 40%, for the sunflower extrudate and soy
flour, respectively. Still, protein concentrations are similar to concentrations seen in soybean
extractions, ranging from 8 mg/mL for S/L of 0.05 and no protease, to 25 mg/mL for S/L of
0.10 with protease for sunflower. For soybean at the same conditions, protein concentrations
were 19 mg/mL and 38 mg/mL, respectively [5]. If the formation of a viscoelastic film
impedes oil release in soy, this is does not appear to be the case in sunflower, as neither
increasing the protein concentration (and, hence, interfacial coverage) nor disrupting a film
by hydrolysis affects yield. Likewise, if hydrolyzed soy proteins increase extraction yield
because of improved emulsification properties over native soy proteins, this does not appear
to be the case for this sunflower material. Others have shown that hydrolysis of up to 10% of
the peptide bonds did not have an effect on the droplet diameter in sunflower emulsions at
conditions similar to those used in these experiments [12]. Sunflower protein hydrolyzates
may not, therefore, be able to increase yield through enhanced emulsification.
Still, other investigators have observed significant increases in oil yield with the use
of proteases with chopped, rather than extruded, sunflower seeds [6]. This contrast may be a

77
result of differences in geometry of the matrices entrapping unextracted oil. In order for the
turbulent forces to cause droplet breakup, eddies in the medium must be free to impinge on
oil droplets. In sunflower extrudate, much oil was observed completely filling the void
spaces of the sclerenchyma tissue, reducing the surface area available for energy transfer
between turbulent eddies and oil droplets. In chopped sunflower seeds, as in soy flour, the
geometry of the matrix entrapping oil would be much different than in the sclerenchyma
tissue. The fact that other investigators have observed significant sunflower oil yield
increases with the use of proteases supports the assertion that oil is entrapped in a tissue that
makes emulsification difficult. The fraction of oil contained within the sclerenchyma tissue
would therefore be a theoretical limit to the amount of extraction that could take place in an
aqueous environment without cellulolytic treatment.
Conclusions
Oil remaining in extruded sunflower meal after AEP/EAEP was contained as
coalesced oil droplets inside of disrupted cotyledon cells and in void spaces of sclerenchyma
cells of the pericarp. Agitation and cellulase treatment increased oil extraction yields, but
protease and solid liquid ratio did not, contrary to what has been observed to occur in
soybean. While emulsification may be an important extraction mechanism imparted by
agitation, the geometry of the cellular matrix entrapping coalesced oil may also be an
important factor determining extraction yield and is a possible explanation of the differences
between sunflower and soybean oil extraction observations.

78
Acknowledgements
The authors would like to thank the USDA CREES Grants #2005-34432-1406 and
2006-34432-17128, the Iowa State University Plant Science Institute, and an EU-US Atlantis
grant from the Fund for Improvement of Post-Secondary Education (FIPSE) U.S.
Department of Education for funding this research. We would also like to thank the Centre de
Microscopie Electronique Appliquée in Toulouse, France, as well as Tracey Pepper and
Randall DenAdel at the ISU NanoImaging Facility for the microscopy.
References
1. Evon, P., Nouveau Procédé de Bioraffinage du Tournesol Plante Entiére par
Fractionnment Thermo-mécano-chimique en Extrudeur Bi-vis: Étude de L’Extraction
Aqueuse des Lipides et de la Mise en Forme du Raffinat en Agromatériaux par
Thermomoulage, Ph.D. Thesis. 2006, Institut National Polytechnique Ecole Nationale
Supérieure des Ingénieurs en Arts Chimiques Et Technologiques: Toulouse, France.
2. Kartika, I.A., P.Y. Pontalier, and L. Rigal, Extraction of sunflower oil by twin screw
extruder: Screw configuration and operating condition effects. Bioresource
Technology, 2006. 97(18): p. 2302-2310.
3. de Moura, J., et al., Enzyme-assisted aqueous extraction of oil and protein from
soybeans and cream de-emulsification. Journal of the American Oil Chemists'
Society, 2008. 85(10): p. 985-995.
4. de Moura, J. and L.A. Johnson, Two-stage countercurrent enzyme-assisted aqueous
extraction processing of oil and protein from soybeans. Journal of the American Oil
Chemists Society, 2009. 86(3): p. 283-289.

79
5. Campbell, K.A. and C.E. Glatz, Mechanisms of aqueous extraction of soybean oil.
Journal of Agricultural and Food Chemistry, 2009. 57(22): p. 10904-10912.
6. Badr, F.H. and M.Z. Sitohy, Optimizing conditions for enzymatic extraction of
sunflower oil. Grasas Y Aceites, 1992. 43(5): p. 281-283.
7. Bair, C.W. and H.E. Snyder, Electron-microscopy of soybean lipid bodies. Journal of
the American Oil Chemists' Society, 1980. 57(9): p. 279-282.
8. Rosenthal, A., et al., Combined effect of operational variables and enzyme activity on
aqueous enzymatic extraction of oil and protein from soybean. Enzyme and Microbial
Technology, 2001. 28: p. 499-509.
9. Rouilly, A., et al., Thermal denaturation of sunflower globulins in low moisture
conditions. Thermochimica Acta, 2003. 398(1-2): p. 195-201.
10. Mantese, A.I., D. Medan, and A.J. Hall, Achene structure, development and lipid
accumulation in sunflower cultivars differing in oil content at maturity. Annals of
Botany, 2006. 97: p. 999-1010.
11. Vankova, N., et al., Emulsification in turbulent flow: 1. Mean and maximum drop
diameters in inertial and viscous regimes. Journal of Colloid and Interface Science,
2007. 312(2): p. 363-380.
12. Karayannidou, A., et al., Limited proteolysis as a tool for the improvement of the
functionality of sunflower (Helianthus annus L.) protein isolates produced by seeds or
industrial by-products (solvent cake). Food Chemistry, 2007. 104(4): p. 1728-1733.
.

80
CHAPTER 5. ENZYME-ASSISTED AQUEOUS EXTRACTION OF OIL
AND PROTEIN FROM SOYBEANS AND CREAM DE-
EMULSIFICATION
A paper published in the Journal of the American Oil Chemists’ Society. 2008.
85(10): p. 985-995.
Juliana M. L. N. de Moura, Kerry A. Campbell, Abdullah Mahfuz, Stephanie Jung,
Charles E. Glatz, Lawrence Johnson
Authorship roles:
de Moura: Primary author, conducted research on extraction process development and
material balances
Campbell: Second primary author, conducted research on skim characterization
including protein and oligosaccharide analysis. Authored sections are denoted by ‘*’.
Mahfuz: Third primary author, conducted research on de-emulsification of cream
Jung, Glatz, and Johnson- Principal investigators
Abstract
The effects of two commercial endoproteases (Protex 6L and Protex 7L, Genencor
Division of Danisco, Rochester, NY) on the oil and protein extraction yields from extruded
soybean flakes during enzyme-assisted aqueous extraction processing (EAEP) were
evaluated. Oil and protein were distributed in three fractions generated by the EAEP; cream
+ free oil, skim and insolubles. Protex 6L was more effective for extracting free oil, protein

81
and total solids than Protex 7L. Oil and protein extraction yields of 96 and 85%, respectively,
were obtained using 0.5% Protex 6L. Enzymatic and pH treatments were evaluated to de-
emulsify the oil-rich cream. Cream de-emulsification generated three fractions: free oil, an
intermediate residual cream layer and an oil-lean second skim. Total cream de-emulsification
was obtained when using 1.25% Protex 6L and pH 4.5. The extrusion treatment was
particularly important to reduce trypsin inhibitor activity (TIA) in the protein-rich skim
fraction. TIA reductions of 69 and 45% were obtained for EAEP skim (the predominant
protein fraction) from extruded flakes and ground flakes, respectively. Protex 6L gave higher
degrees of protein hydrolysis (most of the polypeptides being between 1,000 and 10,000 Da)
than Protex 7L. Raffinose was not detected in the skim, while stachyose was eliminated by α-
galactosidase treatment.
Introduction
Currently, most soybean oil extraction is carried out by direct solvent extraction of
uncooked soybean flakes. The use of a petroleum distillate containing about two-thirds n-
hexane is typically used in commercial extraction of soybean oil. Residual oil contents of
solvent-extracted soybean meal are <1% [1]. There has been much concern regarding safety
and environmental emissions associated with hexane usage. The Environmental Protection
Agency has identified solvent emissions in oilseeds extraction to be a significant source of air
pollution and has issued restrictive regulations on hexane emissions [2]. To reduce hexane
emissions, alternative methods for edible oil extraction have been proposed [3, 4].
The aqueous extraction process (AEP) in which oil extraction is based on the
insolubility of oil in water than on the dissolution of oil is one such alternative [3, 4]. In AEP,

82
oil and protein are extracted from the high-fiber solids and the extraction mixture is
centrifuged to produce oil-rich (free oil and cream emulsion), oil- and protein-lean spent
solids, and protein- and sugar-rich aqueous phase (skim) [5]. AEP offers several advantages
over conventional solvent extraction - less capital investment, inherent safe operation,
simultaneous production of edible oil and protein-rich fractions with less protein damage.
The challenges to using this process are improving the efficiency of oil extraction, effective
de-emulsifying the difficult-to-break cream to recover free oil when emulsions are formed,
and developing high-value uses for the dilute protein-rich aqueous effluent (skim) [3, 5].
The mechanisms of oil and protein extraction into aqueous media from soybean flour
have been determined by Rosenthal et al. [6]. Protein and oil extraction yields were shown to
be closely related, both depending on the extent of cell wall disruption. The conditions that
favored protein extraction (alkaline pH, small particle size, and temperature below the level
to cause denaturation) also favored oil extraction. Protein and oil extraction yields of ~65%
have been obtained at pH 8.0, 1:10 solids-to-liquid ratio, 50 °C, 1 h extraction and 200 rpm
agitation.
Enzyme treatment has been used to increase oil extraction yield in AEP to as much as
90% [7-10]. Enzymes (cellulases, hemicellulases and pectinases) are helpful in breaking the
structures of cotyledon cell walls and lipid body membranes (proteases). Proteolytic enzymes
seem to be effective in hydrolyzing the oleosins, the lipophilic protein surrounding lipid
bodies, thereby decreasing the surface activity of oleosin and enabling removal of lipid [3].
Various forms of the enzyme-assisted aqueous extraction process (EAEP) have been
investigated for several oil-bearing materials such as soybeans [7], corn germ [8], rapeseed
[10], coconut [11], rice bran [12], and sunflower [13].

83
The low oil recovery in AEP and EAEP has been related to the inadequacies of
pretreatments in disrupting the cellular structure of oil-bearing materials [9]. Mechanical and
heat treatments have been used to improve the rupture of cell walls facilitating further
enzyme degradation of cell walls. Rosenthal et al. [6] reported that the oil extraction recovery
increased from 22 to ~65% when the particles size of full-fat soy flour was reduced from
1200 to ~100 µm. The effects of flaking and extruding have been evaluated as means of
enhancing oil extraction during EAEP [14]. Extruding soybean flakes increased the oil
extraction from 46 to 71% in AEP. In EAEP, protease action was favored by extrusion,
increasing oil recovery from 56% (unextruded flakes) to 88% (extruded flakes).
Lamsal and Johnson [15] reported that the total oil recovery from extruded soybean
flakes in EAEP (88%) was distributed in three fractions: free oil, skim and cream, containing
16.0, 13.0 and 60% of the total oil, respectively. An important challenge to be overcome in
the EAEP is the de-emulsification of the cream to obtain free oil. Enzymatic
(phospholipases) and non-enzymatic (heating at 95 °C for 5 h, freeze-thawing) treatments
have also been evaluated by Lamsal and Johnson [15]. The enzyme treatment achieved
similar amounts of recoverable free oil to freezing-thawing yielding 70-80% of total oil in the
full-fat flakes. The ability to obtain high amounts of free oil was due to combination of
extruding the flakes and the de-emulsification treatment. Heating for up to 5 h at 95 °C did
not break the emulsion.
Because of the mild processing conditions of EAEP, the resulting skim fraction of
soluble protein has the potential to be a valuable co-product [3, 7]. Soybeans contain
antinutritional factors, such as trypsin inhibitor and flatus-producing oligosaccharides
(stachyose and raffinose), which reduce the value of soy protein as food and feed ingredients

84
[16]. Proteolytic treatments have been shown to reduce trypsin inhibitor activity (TIA) in
soybean products [17], as well as increase the digestibility of soy protein by early-weaned
pigs [18]. Stachyose and raffinose levels of soy protein extracts have also been effectively
reduced using ultrafiltration [19, 20]. Proteolytic treatments, however, may reduce the size of
polypeptides such that they are close in size to the oligosaccharides, reducing the efficiency
of ultrafiltration separation.
The objectives of the present study were: (i) to verify the effectiveness of two
proteases, Protex 6L (P6L) and Protex 7L (P7L), in EAEP using extruded full-fat soybean
flakes, (ii) to evaluate enzymatic and chemical de-emulsification treatments to the cream
using both proteases, (iii) to characterize the extruded EAEP skim proteins, and (iv)
investigate reducing stachyose in the protein-rich skim by ultrafiltration and carbohydrase
treatment.
Materials and Methods
Full- fat Soybean Flakes
Full-fat soybean flakes were prepared from variety 92M91-N201 soybeans (Pioneer a
DuPont Company, Johnston, IA, USA) harvested in 2006. The soybeans were cracked
(model 10X12SGL, Ferrel-Ross, Oklahoma City, OK, USA) and aspirated (multi-aspirator,
Kice, Wichita, KS, USA) to remove hulls, and the meats were conditioned at 60 ºC (triple-
deck seed conditioner, French Oil Mill Machinery Co., Piqua, OH, USA). The conditioned
meats were flaked to approximately 0.25 mm of thickness using a smooth-surface roller mill
(Roskamp Mfg, Inc., Waterloo, IA, USA). The initial moisture content of the flakes (9.6%)
was increased to 12% by spraying water while mixing the beans in a Gilson mixer (model

85
59016A, St. Joseph, MO, USA). The conditioned flakes contained 21.0% oil (as is), 32.0%
protein (as is), and 12.0% moisture.
Extrusion and EAEP Simulation
Soybean flakes were extruded at 100 °C barrel temperature and 100 rpm screw
rotational speed with a high-shear geometry screw in a twin-screw extruder (18-mm screw
diameter, Micro 18, American Leistritz Extruders, Somerville, NJ, USA). About 80 g of
extruded flakes were collected directly into water in a 1-L beaker. Additional water was
added to achieve 1:10 solids-to-liquid ratio.
Two endoproteases obtained from Genencor International (Rochester, NY, USA)
were evaluated in the EAEP: (i) Protex 7L, a bacterial neutral protease with endopeptidase
activities derived from Bacillus amyloliquefaciens and, (ii) Protex 6L, a bacterial alkaline
protease derived from a selected strain of Bacillus licheniformis. The optimal pH and
temperature ranges for the activities of both proteases were pH 6.0 to 8.0 and 40-60 °C
(Protex 7L) and pH 7.0 to 10.0 and 30-70 °C (Protex 6L). Enzyme concentrations of 0.5 %
Protex 7L and 0.5 and 1.0 % Protex 6L were evaluated. The enzyme dosage in extraction was
based on the weight of extruded flakes. For Protex 7L the slurry pH was maintained at 7.0
while stirring for 1 h. Afterwards, the slurry pH was adjusted to 8.0 and stirred for an
additional 15 min. For Protex 6L, the slurry pH was adjusted to 9.0 and stirred for 1 h. All
extractions were carried out at 50 ºC. Following extraction, the slurry was centrifuged at
3000 x g. A process flow diagram for EAEP of extruded soybean flakes is shown in Fig. 1.

Fig. 1 Process flow diagram for enzymesoybean flakes
Oil, Protein and Solids Recoveries
Analyses of oil, protein and dry matter contents were carried out on the skim,
insolubles, and cream fractions as well as the
determined by using the acid hydrolysis Mojonnier method (AOCS method 922.06), protein
contents by using Kjeldahl method (AACC Standard Method 46
matter) by weighing after drying samples in a vacuum
Method 44-40). The extraction yields were expressed as percentages of each component in
each fraction relative to the initial amount
86
Process flow diagram for enzyme-assisted aqueous extraction of extruded
Oil, Protein and Solids Recoveries
Analyses of oil, protein and dry matter contents were carried out on the skim,
es, and cream fractions as well as the initial extruded flakes. Total oil contents were
determined by using the acid hydrolysis Mojonnier method (AOCS method 922.06), protein
contents by using Kjeldahl method (AACC Standard Method 46-08), and total solids
after drying samples in a vacuum-oven at 110 ºC for 3 h (AACC
40). The extraction yields were expressed as percentages of each component in
each fraction relative to the initial amounts in the extruded flakes. Each enzyme
assisted aqueous extraction of extruded
Analyses of oil, protein and dry matter contents were carried out on the skim,
extruded flakes. Total oil contents were
determined by using the acid hydrolysis Mojonnier method (AOCS method 922.06), protein
08), and total solids (dry
oven at 110 ºC for 3 h (AACC
40). The extraction yields were expressed as percentages of each component in
Each enzyme treatment

87
was replicated four times with each replication being a different extrusion. Statistical analysis
was evaluated by SAS system (version 8.2, SAS Institute, Inc., Cary, N.C.) at p <0.05. For
each extrusion three EAEP trials were carried out.
De-emulsification of Cream
The de-emulsification step was applied to the [cream+free oil] fraction obtained from
EAEP using 0.5% Protex 6L (P6L cream) and 0.5% Protex 7L (P7L cream). For the enzyme
treatment, 20 g of [cream+free oil] was adjusted to pH 9.0 with 2 N NaOH in a 30-mL beaker
before adding 2.5% Protex 6L (w/w). The reaction was carried out at 50 ºC with constant
stirring using a ThermoScientific Variomag multi-point inductive-drive stirrer with external
control (ThermoScientific, Daytona Beach, FL, USA) submerged in a water bath for 90 min.
For the pH treatment, the same amount of sample was adjusted to pH 4.5 using 2 N HCl.
Once the pH was adjusted, the samples were incubated at different temperatures and for
different times.
At the end of the de-emulsification treatment, the samples were transferred to a 50-
mL centrifuge tube and centrifuged at 3,000 x g for 15 min at 20 ºC. Three distinct layers
were obtained (free oil, an intermediate layer, and a water phase referred to as 2nd skim). The
intermediate layer was located between the free oil and 2nd skim fraction and consisted in the
cream layer that was still present after the de-emulsification treatment. Most of the free oil
was collected by using a Pasteur pipette and the remaining free oil was rinsed two times
using hexane following methods described by Lamsal and Johnson [15]. After evaporating
the hexane, the weight of each fraction was recorded. Hexane was used only for accurately
quantifying free oil; we do not envision using hexane in commercial practice. The free oil

yield (%) was calculated as follows: Free oil yield = [free oil (g) + hexane
(g)] / [cream (g) x oil content (%) in [cream + free oil fraction]]. A process flow diagram for
de-emulsifying the cream and a p
shown in Fig. 2.
Fig. 2 Flow diagram for cream de
*Trypsin Inhibitor Activity in Skim from EAEP of Extruded Flakes
Prior to analysis, the skim fraction was filtered through a
improve clarity and diluted with 0.9% (w/v) NaCl solution to achieve 40 to 60% inhibition
the assay. Trypsin inhibitor activity
aprotinin from Sigma [21]. The assay is based on the spectrophotometric rate determinatio
of the cleavage of a synthetic substrate, N
by trypsin with and without inhibitor present. BAPNA solution (1.00 mL of 0.1% (w/v)) was
88
yield (%) was calculated as follows: Free oil yield = [free oil (g) + hexane-washed free oil
(g)] / [cream (g) x oil content (%) in [cream + free oil fraction]]. A process flow diagram for
emulsifying the cream and a picture of the three fractions obtained after centrifugation are
Fig. 2 Flow diagram for cream de-emulsification
Trypsin Inhibitor Activity in Skim from EAEP of Extruded Flakes
Prior to analysis, the skim fraction was filtered through a 0.45-µm membrane to
improve clarity and diluted with 0.9% (w/v) NaCl solution to achieve 40 to 60% inhibition
. Trypsin inhibitor activity (TIA) was characterized by using a modified assay for
. The assay is based on the spectrophotometric rate determinatio
of the cleavage of a synthetic substrate, Nα-benzoyl-DL-arginine-p-nitroanilide (BAPNA),
by trypsin with and without inhibitor present. BAPNA solution (1.00 mL of 0.1% (w/v)) was
washed free oil
(g)] / [cream (g) x oil content (%) in [cream + free oil fraction]]. A process flow diagram for
icture of the three fractions obtained after centrifugation are
Trypsin Inhibitor Activity in Skim from EAEP of Extruded Flakes
m membrane to
improve clarity and diluted with 0.9% (w/v) NaCl solution to achieve 40 to 60% inhibition in
using a modified assay for
. The assay is based on the spectrophotometric rate determination
nitroanilide (BAPNA),
by trypsin with and without inhibitor present. BAPNA solution (1.00 mL of 0.1% (w/v)) was

89
added to 1.60 mL of buffer (200 mM triethanolamine with 20 mM CaCl2, pH 7.8) with 0.20
mL trypsin (0.16 mg/mL in 1.0 mM HCl) and 0.20 mL skim fraction in a cuvette and placed
immediately in the spectrophotometer (Ultrospec 4000, Pharmacia Biotech, Piscataway, NJ,
USA). The initial rate of change of absorbance at 405 nm was recorded. TIA was calculated
as shown in Eq. 1:
( )( )( )mixreaction ml 3 / sample ml 0.29.96
dfsample /nm 405Aed Uninhibit/nm 405A TIA
tt ∆∆−∆∆= Eq. 1
where: TIA = Trypsin inhibitor activity (unit/mL)
∆A405nm/∆t = rate of change in absorbance per minute (min-1)
df = dilution factor
9.96 = millimolar extinction coefficient for BAPNA cleavage product
Uninhibited sample was 0.20 mL NaCl solution
*Amino Acid Analysis
Amino acid analysis was conducted by the University of Missouri Agricultural
Experiment Station Chemical Laboratories (Columbia, MO) following AOAC Official
Method 982.30 E(a,b,c), chp. 45.3.05, 2006.
*SDS PAGE
High-MW profiles were determined by SDS PAGE on a 4 to 15% gradient
polyacrylamide gel (Bio-Rad Laboratories, Ltd., Hercules, CA, USA). For each sample, 20
µL were diluted to 1 mL with de-ionized water. Each well was loaded with 10 µL of diluted

90
sample for protein loadings of 6 and 8 µg for extruded skim and flaked flour skim samples,
respectively. For comparison, soy protein isolate (ProFam® 646; Archer Daniels Midland
Company, Decatur, IL, USA) was dissolved in 0.1 M phosphate buffer at pH 7.5 for a
concentration of 1 µg/mL and loaded onto the gels with a 10-µL aliquot.
*HPSEC of Polypeptides
Low-molecular-weight distributions were determined by high-performance size-
exclusion chromatography (HPSEC) using a 300 mm x 7.8 mm Biobasic SEC 120 column
(Bio-Rad Laboratories, Ltd.). Molecular weight markers were: aprotinin from bovine lung
(6511 Da), insulin chain B (3595 Da), angiotensin II human acetate (1060 Da), and leucine
enkaphalin acetate hydrate (555 Da), all from Sigma (St. Louis, MO, USA). Fifteen µL of
each sample was diluted to 1 mL with water purified to a conductivity of 6.6 µS/m. Samples
were then filtered through a 0.45-µm regenerated cellulose membrane (Millipore
Corporation, Billerica, MA, USA). Mobile phase was 0.1 M phosphate buffer at pH 7.5.
Injection size was 10 µL for a loading of about 5 µg of protein, with a mobile phase flow rate
of 1 mL/min. Absorbance was measured at 215 nm.
*HPLC of Raffinose and Stachyose
Raffinose and stachyose concentrations were determined by monitoring refractive
index of samples eluted from a 300 mm x 7.8 mm Aminex HPX-87H cation-exchange
column (BioRad Laboratories, LTD). Samples were prepared following procedures modified
from Marsili et al. [22]. To remove proteins prior to analysis, aliquots of 0.3 mL were placed
in microcentrifuge tubes with 0.6 mL acetonitrile and vortexed for about 30 s. Samples were
then centrifuged at 10,000 x g for 10 min. The liquid phase was transferred to HPLC vials

91
using disposable pipettes. Conditions for HPLC were 50 ºC, 0.6 mL/min, 0.005 M H2SO4
mobile phase, 20-µL injection volume. Peak identities were based on retention times of 1-
mg/mL concentration standards (galactose, stachyose, raffinose, fructose, glucose, and
sucrose). Sugar concentrations were based on peak height of standard injections ranging from
5 to 20 µL. Standard solution injections were done in triplicate. Sample concentrations
reported are the means of duplicate injections. Concentration confidence intervals reported
were calculated based on the uncertainty of the values of the standard curve slope and y-
intercept of the respective saccharide standard curves, as determined by linear regression
analysis with JMP 6.0 statistical software package by SAS, Inc. (Cary, NC, USA).
*α-Galactosidase Treatment
Twenty-five mL of skim fraction was adjusted to pH 6.0 with 1 N HCl in a 50 mL
HDPE centrifuge tube. α-Galactosidase (Genencor Division of Danisco) was added to
achieve 1% (w/w, dry basis) concentration. Skim was then incubated at 60 °C for 3 h at 120
rpm in an incubator shaker (Model C24, New Brunswick Scientific, Edison, NJ, USA). This
temperature and pH were optimal for the enzyme. After incubating, the pH did not change by
more than 0.1 units. The reaction was stopped by adding 20 mL of acetonitrile to 10-mL
samples of incubated skim to denature and precipitate all proteins for saccharide analysis.

92
Results and Discussion
Effect of Enzymes on Extraction of Oil, Protein and Dry Matter
Enzymatic hydrolysis improves oil, protein and solids extraction during AEP of
soybeans [7, 14, 23]. Proteases improve AEP extraction of extruded soybean flakes;
however, cellulase treatment does not improve protein and oil extraction yields [14].
The effects of Protex 6L and Protex 7L on oil extraction yield are shown in Fig. 3a.
The use of Protex 7L (0.5%) and Protex 6L (0.5 and 1.0%) gave oil extraction yields of 93
and 96-97%, respectively. Freitas et al. [24] achieved 88% of oil extraction yield by using
consecutive treatment of cellulose (3%) and protease (3 %) during 6 h (3 h for each enzyme)
in the EAEP of unflaked and extruded soybeans. Similar oil extraction yield (88%) was
reported by Lamsal et al. [14] when using Protex 7L (0.5%) in EAEP of extruded soybean
flakes. We achieved higher oil extraction yields (93-97%) than Freitas et al. [24] and Lamsal
et al. [14], which we attribute to better selection of enzymes, differences in extruder
operation, and soybean variety, age and storage conditions. Although the mean total oil
extractions were not statistically different, more free oil was obtained when using Protex 6L
than when using Protex 7L, at both concentrations tested. The yield of free oil was
statistically different (P <0.05) when using Protex 6L and Protex 7L at 0.5% dosage. The use
of 0.5% Protex 6L yielded twice the amount of free oil obtained with 0.5 % Protex 7L.
Fig. 3b shows the effects of using Protex 6L and Protex 7L on the protein extraction
yield. Protein extraction yields of 73 and 85-87% were obtained with Protex 7L (0.5%) and
Protex 6L (0.5 and 1.0%), respectively. Protein extraction yield of 77% has been reported by
Lamsal et al. [14] with Protex 7L (0.5 %) in EAEP of extruded soybean flakes. Protex 6L

93
was effective in hydrolyzing more protein than Protex 7L, causing higher protein extraction
yields at both concentrations tested. As can be seen in Fig. 4, Protex 6L (0.5%) reduced most
peptides to molecular weights <30 kDa while Protex 7L (0.5%) yielded peptides with
molecular weights >54.1 kDa. These results agree with Jung et al. (25) where Protex 6L
achieved greater extent of hydrolysis with soy flour compared with Protex 7L.
Except for the protein extracted into the cream, all means were different (P <0.05)
when using Protex 6L and Protex 7L at 0.5%. Although increasing the amount of Protex 6L
from 0.5 to 1.0% gave the highest degree of hydrolysis with peptides molecular weights <25
kDa (Fig. 4), a significant improvement in the protein extraction yield was not observed. This
might indicate hydrolysis limited by enzyme selectivity (Fig. 5).
Based on Figs. 3a and 3b, the conditions that favored protein extraction (0.5% Protex
6L) also favored oil extraction. This trend is in agreement with results reported in the
literature [6, 23]. Generally, higher oil extraction occurs with solubilization and/or hydrolysis
of protein, which we attributed to breakdown of the protein network and the oleosin
membrane, thereby releasing free oil [3, 6]. Increasing the amount of Protex 6L from 0.5 to
1.0% did not significantly improve oil extraction yield or free oil.

94
Fig. 3 (a) Oil extraction yield during enzyme-assisted aqueous extraction processing of extruded soybean flakes - (b) Protein extraction yield during enzyme-assisted aqueous extraction processing of extruded soybean flakes – (c) Solids extraction yield during enzyme-assisted aqueous extraction processing of extruded soybean flakes - (P7L - Protex 7L and P6L - Protex 6L)
Fig. 3c shows the effect of using Protex 6L (0.5 and 1.0%) and Protex 7L (0.5%) on
dry matter extraction. Protex 6L was effective in extracting more solids than Protex 7L at
P7L (0.5%) P6L (0.5%) P6L (1%)
Free Oil Cream Skim Insoluble Total Oil Extraction
Mass Balance
3
19
50
29
71
5
16
56
24
77
6
15
58
23
79
100 101 103
0
20
40
60
80
100
Sol
ids
Yie
ld (%
)
a
a
a a
a
a
a
a
b
b
b
b
bb
a
1
73
26
73
99
1
85
13
85
0
87
11
87
98 98
0
20
40
60
80
100
Pro
tein
Yie
ld (
%)
a
a
a
a
a
a
b b
b b
bb
10
70
127
93
21
61
14
4
96
23
57
17
3
10010010197
0
20
40
60
80
100
Oil
Yie
ld (
%)
a
aa
a
aa
a
a
aa
a
b
b
b
b
3a
3b
3c

95
both concentrations. Dry matter extraction yields of 71 and 77-79% were achieved when
using Protex 7L (0.5%) and Protex 6L (0.5 and 1.0%), respectively. Total dry matter
extractions were statistically different at P <0.05 when using Protex 6L and Protex 7L at
0.5% dosage. The higher amount of solids in the skim fraction was consistent with the higher
protein extraction yield when using 0.5% Protex 6L. Increasing the amount of Protex 6L
from 0.5 to 1.0% did not significantly improve dry matter extraction.
Effects of Enzyme and pH Treatments on Cream De-emulsification
We previously reported that treating Protex 7L cream with 2.5 % LysoMax
(phospholipase A2) or 2.5% Protex 51FP as well as pH adjustment to 4.5 with 15 min stirring
at 50 ºC yielded 100% free oil [26]. In the present study, enzyme de-emulsification using
Protex 6L as well as pH adjustment on Protex 6L and Protex 7L cream were compared. Total
destabilization of Protex 6L cream was obtained upon addition of 2.5% Protex 6L (Table 1).
When the same conditions were applied to Protex 7L cream, only 91% free oil yield was
obtained. Protex 6L cream was also totally destabilized by adjusting the pH to 4.5 and
stirring for 15 min at 50 ºC. Total destabilization of Protex 6L cream was obtained after
adjusting the pH to 4.5 at 25 ºC without additional stirring. These results indicated that
Protex 6L cream was more easily destabilized with enzyme treatment and pH adjustment
than Protex 7L cream. Using Protex 6L and Protex 7L during extraction affected cream
composition (Fig. 3a). When 0.5% Protex 6L was used during extraction, the cream had
lower oil content than Protex 7L cream. In addition, Protex 6L was more aggressive than
Protex 7L (see data on skim provided below), and therefore probably generated smaller
peptides than Protex 7L. While more investigation of the peptide profile located at the

96
emulsion interface is needed, we hypothesize that the difference in enzyme aggressiveness
and cream composition may contribute to the stability of the cream emulsion.
Table 1. Effect of extraction and de-emulsification conditions on free oil yield
*Polypeptide MW Distribution in Skim
SDS-PAGE profiles of the peptides in the skim fractions of the three protease
extraction treatments using extruded flakes are shown in Fig. 4. The two main fractions are
β-conglycinin, composed of α’, α, and β subunits, and glycinin, composed of A (acidic) and
B (basic) subunits. All protease treatments decreased MWs compared to the peptide profile
for commercial soy protein isolate. Protex 7L destroyed lipoxygenase and the α’ subunit of β-
conglycinin. Most other subunits were present in amounts sufficient to stain strongly after
Protex 7L treatment. Protex 6L achieved noticeably greater hydrolysis than did Protex 7L,
reducing most of the peptides to MW <25 kDa. The β subunit of β-conglycinin was more
resistant to hydrolysis than other protein subunits. β-Conglycinin has been identified as a
potential allergen [16]. The 1.0 % Protex 6L treatment completely hydrolyzed all subunits.
Extraction Conditions De-emulsification Conditions Free Oil Yield (%)
0.5% Protex 7L 2.5% Protex 6L a 91 a
0.5% Protex 6L 2.5% Protex 6L a 100 b
0.5% Protex 6L pH 4.5, 50 °C, 15 min 103 b
0.5% Protex 6L pH 4.5, 25 °C, 15 min 101 b
0.5% Protex 6L pH 4.5, 25 °C, 2 min 100 b
0.5% Protex 6L pH 4.5, 25 °C, no stirring 100 b
LSD 4.49
a Reaction was carried out at 50 ºC and 90 min. Means followed by different letters are
statistically different (P <0.05)

Fig. 4 SDS-PAGE of skim milk of different trfrom extruded soy flake, FF = skim from flaked flour, SPI = commercial soy protein isolate, Profam ® 646 (Archer Daniels Midland, Decatur, IL, USA). Letters to the right indicate specific protein subunits of soybean glycinin and
*MWs of Skim Peptides
Even though the SDS
7L 0.5 treatment, the SEC profiles (Fig.
have been hydrolyzed. The large peak on the left of Fig.
molecular mass greater than about 40 kDa. The area of this peak
the area of the profile below 10
degree of hydrolysis than Protex 7L. When increasing the concentration of Protex 6L, the
large MW polypeptides decreased while the intermediate polypeptid
small MW polypeptides remained approximately constant. This indicated that the hydrolysis
may have been approaching a limit d
97
PAGE of skim milk of different tr eatments (Std = MW standard, Ext = skim from extruded soy flake, FF = skim from flaked flour, SPI = commercial soy protein
(Archer Daniels Midland, Decatur, IL, USA). Letters to the right indicate specific protein subunits of soybean glycinin and β-conglycinin
MWs of Skim Peptides
Even though the SDS-PAGE gel showed many intact protein subunits after the Protex
ent, the SEC profiles (Fig. 5) indicated that a substantial fraction of the proteins
have been hydrolyzed. The large peak on the left of Fig. 5 represents all proteins of a
molecular mass greater than about 40 kDa. The area of this peak was very small comp
the area of the profile below 10 kDa. At the same concentration, Protex 6L achieved a greater
degree of hydrolysis than Protex 7L. When increasing the concentration of Protex 6L, the
polypeptides decreased while the intermediate polypeptides increased, and the
polypeptides remained approximately constant. This indicated that the hydrolysis
may have been approaching a limit dictated by enzyme selectivity.
standard, Ext = skim from extruded soy flake, FF = skim from flaked flour, SPI = commercial soy protein
(Archer Daniels Midland, Decatur, IL, USA). Letters to the right
PAGE gel showed many intact protein subunits after the Protex
) indicated that a substantial fraction of the proteins
represents all proteins of a
s very small compared to
Da. At the same concentration, Protex 6L achieved a greater
degree of hydrolysis than Protex 7L. When increasing the concentration of Protex 6L, the
es increased, and the
polypeptides remained approximately constant. This indicated that the hydrolysis

98
The profile areas between the indicated markers are shown in Fig. 6 for a quantitative
analysis of the profiles. Most of the polypeptides had MWs between 3 and 10 kDa, with
<30% below 3 kDa and <5% below 1 kDa. While TIA reduction and allergenic protein
destruction are beneficial, the benefit associated with just the reduction of polypeptide
molecular mass in feed applications is not well established. The results of one study indicated
that hydrolysis of soy protein resulted in improved weight gain in early-weaned pigs, but the
effects of increasing the extent of hydrolysis were not clearly established [18]. In two other
studies, Caine et al. [27, 28] concluded that proteolytic treatment does not improve protein
digestibility, although no measure of degree of hydrolysis was made in these investigations.
Different protease treatment methods as well as a lack of reporting of degree of hydrolysis
make it difficult to compare studies on the effects of protein hydrolysis on digestibility.
*TIA in Skim
The TIA of skim from extruded soy flakes was the same as that from flake (Fig. 7).
This seems to disagree with the generally accepted notion that extrusion destroys TIA [29],
even though we used relatively low extrusion temperatures (100 ºC). TIA is typically
reported per mass of the starting material. Indeed, on a per-mass of starting material basis,
the extruded material had significantly less TIA than soy flakes (data not shown). In this
case, since the product of interest is not the starting material, but rather the extract itself, we
reported the activity of the extract only.

Fig. 5 HPLC profiles of skim fraction of different treatments (a, 0.5% Protex 7L0.5% Protex 6L; c, 1.0% Protex
Fig. 6 MW distributions of skim samples of duplicate injections, duplicate determinations did not differ by more than 1.5%)
99
HPLC profiles of skim fraction of different treatments (a, 0.5% Protex 7LProtex 6L)
MW distributions of skim samples based on peak area of HPLC profiles (means of duplicate injections, duplicate determinations did not differ by more than 1.5%)
HPLC profiles of skim fraction of different treatments (a, 0.5% Protex 7L; b,
on peak area of HPLC profiles (means of duplicate injections, duplicate determinations did not differ by more than 1.5%)

100
Fig. 7 Trypsin inhibitor activity of skim milk per dry solids basis from extractions under different conditions and with different starting material (UH = unhydrolyzed skim; FF = skim from flaked flour; E = skim from extruded soy). Letters denote statistical differences (P <0.05)
Hydrolysis, on the other hand, substantially reduces TIA, and extrusion enhanced this
effect. Hydrolysis of extruded soy with Protex 6L reduced TIA by 69%, compared to 45%
reduction by the same treatment of the flaked flour. This suggested that extrusion facilitates
hydrolysis of TI. While extrusion did not cause enough denaturation to affect TIA, it may
have caused enough denaturation to render the TI more susceptible to hydrolysis. The
differences in effects of different enzyme treatments on extruded flake were less pronounced.
The effects of Protex 6L and Protex 7L at 0.5% concentrations were not statistically different
with a 69% reduction in TIA, while Protex 6L at 1.0% achieved 83% reduction. This trend
may be a result of the nature of TI in soybean. The two major TIs in soy are the Kunitz-type,
0.000
0.010
0.020
0.030
0.040
0.050
0.060
UH FF UH E Protex 6L0.5% FF
Protex 7L,0.5% E
Protex 6L,0.5% E
Protex 6L,1.0% E
Try
psi
n I
nh
ibit
or
Act
ivit
y (T
IU/m
g s
oli
d)
0.049 0.049
0.027
0.014 0.015
0.0084
a a
b
c d
e
101
which has a MW of about 20 kDa, and the Bowman-Birk-type, which has a MW of 6 to 10
kDa [16]. As seen in the MW distributions above, most of the polypeptides after hydrolysis
were <10 kDa, indicating that the Kunitz-type inhibitor was eliminated, and that the
Bowman-Birk inhibitor was responsible for the remaining TIA.
*Amino Acid Composition of Skim Protein
The amino acid compositions of the skim fractions are shown in Table 2. The
essential amino acid profile of each treatment was not substantially different from the soy
protein amino acid profiles reported in literature. Soy protein is deficient in methionine, but
has more lysine than cereal proteins [30]. High temperatures during extrusion can reduce
lysine by maillard reactions, but this did not appear to happen, probably because of the
relatively low temperatures used during our extrusion compared to other extrusion studies
[31]. Therefore, the amino acid profile of the proteins was not altered by either extruding or
enzyme hydrolysis.
*Raffinose and Stachyose Concentrations and Reductions
The HPLC profile for oligosaccharide determination (chromatogram not shown)
showed a peak at 6.9 min, matching the elution time for the stachyose standard, with no
observable peak at the raffinose elution time. Stachyose is typically present in greater
concentrations than raffinose in soybeans [32]. As would be expected, the protease
treatments did not affect the stachyose levels of the extracts. Typical sucrose, stachyose, and
raffinose levels in whole soybean are 4.1, 3.7, and 1.1%, respectively [32]. Assuming 100%
extraction of saccharides, a 1:10 solids-to-liquid ratio would give a stachyose concentration
of 3.7 mg/mL, which was in good agreement with the concentrations reported in Table 3.

102
Sucrose inversion occurs on passage through this ion-exchange resin, resulting in two peaks
at 9.1 and 9.6 min. While the presence of sucrose was confirmed, because of inversion, the
sucrose concentration could not be reliably quantified.
Table 2. Relative amino acid composition of skim from different treatment (essential amino acid denoted by *)
Since stachyose is a tetrasaccharide of two galactoses, one glucose, and one fructose,
hydrolysis of the glycosidic bonds of the galactose would result in free galactose and sucrose
as products. α-Galactosidase enzymes are known to also have activity for hydrolyzing the 1-2
glycosidic bonds of sucrose, which appeared to be the case in the present study. The HPLC
profile, after α-galactosidase treatment, showed that stachyose and sucrose were gone, while
two new peaks appeared, corresponding to glucose and fructose/galactose. Fructose and
galactose retention times of 9.97 min and 9.82 min, respectively, were not resolvable.
Glucose concentrations based on these results are also shown in Table 3. Glucose is present
in stachyose in a 1:1 stoichiometric ratio, so the mass of glucose detected after treatment is
Amino Acid P7L 0.5 P6L 0.5 P6L 1.0 SPIAlanine 5.85 7.10 8.05 6.84Arginine* 6.24 6.28 6.23 6.35Aspartic Acid + Asparagine 13.47 11.42 10.50 12.97Cystein ND ND ND NDGlutamic Acid + Glutamine 19.24 14.92 12.94 16.55Glycine 6.50 7.38 7.77 6.30Histidine* 2.16 2.17 2.43 2.28Isoleucine* 4.17 4.50 4.34 4.39Leucine* 7.81 9.10 9.05 8.31Lysine* 4.49 5.23 5.51 5.00Methionene* 0.96 1.17 1.11 1.22Phenylalanine* 4.86 5.29 5.13 4.85Proline 5.78 5.88 6.32 5.42Serine 7.60 7.55 7.87 7.75Threonine* 4.05 4.13 4.68 4.16Tryptophan* ND ND ND NDTyrosine 2.54 3.02 2.88 2.76Valene* 4.29 4.87 5.18 4.85
Total 100.0 100.0 100.0 100.0
Enzyme used in extraction

103
about four times greater than would be expected on a mass ratio basis. The extra glucose was
probably a result of hydrolysis of initial sucrose.
Table 3. Saccharide concentrations of skim fraction before and after hydrolase treatment.
Conclusions
Protex 6L was more effective than Protex 7L in extracting more free oil, protein and
solids from the extruded soy flakes during EAEP. Oil and protein extraction yields of 96 and
85%, respectively, were obtained using 0.5% Protex 6L. Increasing the amount of Protex 6L
from 0.5 to 1.0% did not significantly improve the oil, protein and dry matter extraction
yields. Extracted oil was distributed as 21-23% in the free oil, 57-61% in the cream and 14-
17% in the skim. Although the oil present in the skim fraction was considered extracted from
the insolubles, it remained unrecovered as free oil. The cream obtained by EAEP was de-
emulsified by enzyme or pH treatment. Using 1.25% Protex 6L totally de-emulsified the
Protex 6L cream. The pH treatment was equally efficient in de-emulsifying the cream as was
the enzyme treatment. The total de-emulsification of the Protex 6L cream was obtained
without additional stirring after pH adjustment. Enzyme treatment reduced TIA by >80 % for
extruded soybean flakes. Protein hydrolysis appeared to be limited by enzyme selectivity,
Skim treatment Stachyose (mg/mL) Glucose (mg/mL)
P7L 0.5% 3.6 +/-0.5 ND
P7L 0.5% + 1%(w/w) α-galactosidase ND 3.3 (+/-0.3)
P6L 0.5% 3.8+/-0.5 ND
P6L 0.5% + 1%(w/w) α-galactosidase ND 3.4 (+/-0.3)
P6L 1.0% 3.3+/-0.5 ND
P6L 1.0% + 1%(w/w) α-galactosidase ND 3.9(+/-0.3)
+/-95% confidence interval
ND = not detected

104
with most of the polypeptides being between 1 and 10 kDa for Protex 6L treatments.
Raffinose was not present in levels detectable by the assay used, while stachyose was
effectively eliminated by α-galactosidase treatment.
References
1. Johnson LA (2000) Recovery of Fats and Oils from Plant and Animal Sources. In: O’Brien
RD, Farr WE, Wan PJ (eds) Introduction to Fats and Oils Technology. AOCS Press,
Champaign, IL, pp 108-135
2. Environmental Protection Agency (accessed May 2007), 40 CFR Part 63, National
Emissions Standards for Hazardous Air Pollutants: Solvent Extraction for Vegetable
Oil Production, Final Rule, Federal Register 66:19005-19026 (2001)
http://www.access.gpo.gov/su_docs/fedreg/a010412c.html
3. Rosenthal A, Pyle DL, Niranjan K (1996) Aqueous and Enzymatic Process for Edible Oil
Extraction. Enz Microb Technol 19:402-420
4. Johnson LA, Lusas EW (1983) Comparison of Alternative Solvents for Oils Extraction. J
Am Oil Chem Soc 60:229-242
5. Cater CM, Rhee KC, Hagenmaier RD, Mattil KF (1973) Aqueous Extraction – An
Alternative Oilseed Milling. J Am Oil Chem Soc 51:137-141
6. Rosenthal A, Pyle DL, Niranjan K, (1998) Simultaneous Aqueous Extraction of oil and
Protein from Soybean: Mechanisms for Process Design. Trans Inst Chem Eng Part C
76:224-230

105
7. Rosenthal A, Pyle DL, Niranjan K, Gilmour S, Trinca L (2001) Combined Effect of
Operational Variables and Enzyme Activity on Aqueous Enzymatic Extraction of Oil
and Protein from Soybean. Enz Microb Technol 28:499-509
8. Moreau RA, Johnston DB, Powell MJ, Hicks KB (2004) A Comparison of Commercial
Enzymes for the Aqueous Enzymatic Extraction of Corn Oil from Corn Germ. J Am
Oil Chem Soc 81:1071-1075
9. Abdulkarim SM, Lai OM, Muhammad SKS, Long K, Ghazali HM (2005) Use of Enzymes
to Enhance Oil Recovery During Aqueous Extraction of Moringa Oleifera Seed Oil. J
Food Lipids 13:113-130
10. Zhang SB, Wang Z, Xu SY (2007) Optimization of the Aqueous Enzymatic Extraction of
Rapeseed Oil and Protein Hydrolysates. J Am Oil Chem Soc 84:97-105
11. Che Man YB, Suhardiyono AB, Asbi AB, Azudin MN, Wei LS (2006) Aqueous
enzymatic extraction of coconut oil. J Am Oil Chem Soc 73:683-686
12. Sharma A, Khare SK, Gupta MN (2001) Enzyme-Assisted Aqueous Extraction of Rice
Bran Oil. J Am Oil Chem Soc 78:949-951
13. Sineiro J, Dominguez H, Nunez MJ, Lema JM (1998) Optimization of the Enzymatic
Treatment during Aqueous Oil Extraction from Sunflower Seeds. Food Chem 61:467-
474
14. Lamsal BP, Murphy PA, Johnson LA (2006) Flaking and Extrusion as Mechanical
Treatments for Enzyme-Assisted Aqueous Extraction of Oil from Soybeans. J Am Oil
Chem Soc 83:973-979
15. Lamsal BP, Johnson LA (2007) Separating Oil from Aqueous Extraction Fractions of
Soybean. J Am Oil Chem Soc 84:785-792

106
16. Liener IE (1994) Implications of Antinutritional Components in Soybean Foods. Crit
Rev Food Sci Nutr 34:31-67
17. Caine WR, Verstegen MWA, Sauer WC, Tamminga S, Schulze H (1998) Effect of
Protease Treatment of Soybean Meal on Content of Total Soluble Matter and Crude
Protein and Level of Soybean Trypsin Inhibitors. Anim Feed Sci Technol 71:177-183
18. Rooke JA, Slessor M, Fraser H, Thomson JR (1998) Growth Performance and Gut
function of Piglets Weaned at Four Weeks of Age and Fed Protease-treated Soya-
bean Meal. Anim Feed Sci Technol 70:175-190
19. Omosaiye O, Cheryan M, Matthews ME (1978) Removal of Oligosaccharides from
Soybean Water Extracts by Ultrafiltration. J Food Sci 43:354-360
20. Kumar NSK, Yea MK, Cheryan M (2003) Soy Protein Concentrates by Ultrafiltration J
Food Sci 68:2278-2283
21. Sigma-Aldrich (accessed May 1999) Enzymatic Assay of Aprotinin.
http://www.sigmaaldrich.com/Area_of_Interest/Biochemicals/Enzyme_Explorer/Key
_R
22. Marsili RT, Ostapenko H, Simmons R E, Green DE (1981) High Performance Liquid
Chromatographic Determination of Organic Acids in Dairy Products. J Food Sci
46:52-57
23. Yoon S-H, Kim I-H, Kim S-H, Kwon TW (1991) Effects of Enzyme Treatments and
Ultrasonification on Extraction Yields of Lipids and Protein from Soybean by
Aqueous Process. J Food Sci Technol 23:673-676

107
24. Freitas SP, Hartman L, Couri S, Jablonka FH, Carvalho (1997) The Combined
Application of Extrusion and Enzymatic Technology for Extraction of Soybean Oil.
Fett/Lipid 99:333-337
25. Jung S, Roussel-Philippe C, Briggs JL, Murphy PA, Johnson LA (2004) Limited
Hydrolysis of Soy Proteins with Endo- and Exoproteases. J Am Oil Chem Soc
81:953-960
26. Wu J, Johnson LA, Jung S (2008) Demulsification of oil-rich emulsion from enzyme-
assisted aqueous extraction of extruded soybean flakes. Bioresource Technol, in press
27. Caine WR, Sauer WC, Tamminga S, Verstegen MWA, Schulze H (1997) Apparent Ileal
Digestibilities of Amino Acids in Newly Weaned Pigs Fed Diets with Protease-
treated Soybean Meal. J of Anim Sci 75:2962-2969
28. Caine WR, Tamminga S, Verstegen MWA, Sauer WC, Schulze H (1997) Endogenous
Recoveries and True Ileal Digestibilities of Amino Acids in Newly Weaned Pigs Fed
Diets with Protease-Treated Soybean Meal. J Anim Sci 75: 2970-2979
29. Singh S, Gamlath S, Wakeling L (2007) Nutritional Aspects of Food Extrusion: A
Review. Int J Food Sci Technol 42:916-929
30. Friedman M, Brandon DL (2001) Nutritional and Health Benefits of Soy Proteins. J Agr
Food Chem 29:1069-1086
31. Camire ME (2000) Chemical and Nutritional Changes in Food during Extrusion. In:
M.N. Riaz (ed) Extruders in Food Applications. Technomic Publishing Company,
Inc. Lancaster, PA, pp 127-147
32. Deak N (2004) New Soy Protein Ingredients Production and Characterization, PhD
Thesis, Iowa State University

108
CHAPTER 6. PROTEIN RECOVERY FROM ENZYME-ASSISTED
AQUEOUS EXTRACTION OF SOYBEAN
A paper published in Biotechnology Progress. Published Online: Nov 25, 2009
DOI: 10.1002/btpr.341.
Kerry A. Campbell, Charles E. Glatz
Abstract
Enzyme-assisted aqueous oil extraction from soybean is a “green” alternative to
hexane extraction that must realize potential revenues from a value-added protein co-product.
Three technologies were investigated to recover protein from the skim fraction of an aqueous
extraction process. Ultrafiltration achieved overall protein yields between 60% and 64%,
with solids protein content of 70%, and was effective in reducing stachyose content, with
fluxes between 4 and 10 L/m2-h. Protein content was limited because of high retention of
lipids and the loss of polypeptides below 13.6 kDa. Isoelectric precipitation was effective in
recovering the minimally hydrolyzed proteins of skim, with a protein content of 70%, again
limited by lipid content. However, protein recovery was only 30% because of the greater
solubility of the hydrolyzed proteins. Recovery by the alternative of protein capture on
dextran-grafted agarose quaternary-amine EBA resins decreased with decreasing polypeptide
molecular weight. Proteins with molecular mass greater than 30 kDa exhibited slow
adsorption rates. Expanded bed adsorption was most effective for recovery of proteins with
molecular weight between 30 and 12 kDa. Overall protein yields of this method were
between 14 and 17%.

109
Introduction
Enzyme–assisted aqueous extraction processing (EAEP) of soy is a “green”
alternative to hexane extraction processing. The EAEP process developed at the Center for
Crops Utilization Research (CCUR) at Iowa State University uses extrusion to disrupt cells
of soy flakes, from which oil and water soluble components are extracted with the assistance
of proteases, resulting in three fractions: residual solids, cream (emulsified oil), and skim, an
aqueous fraction containing 85 % of total soy proteins as well as soluble carbohydrates and
emulsified oil stable toward creaming.1 At 40 % total soy mass and a market price of $1 per
pound 2, protein revenue potential is four times that of the oil, which makes up only 20% of
soy mass and sells at $0.45 per pound.3 In conventional soy oil extraction processing,
revenues from both the oil and meal are necessary for economic viability. Because of the
loss of soluble material to the skim in EAEP, revenues from EAEP meal (residual) and oil
only add up to 75% of the costs of the feedstock.4 Therefore, characterization and recovery
of the skim protein is critical to implementation of this alternative extraction process.
The skim from the CCUR EAEP process has been characterized previously.1 The
skim is about 5% solids, comprised of 55% protein, 5% oil, 6% stachyose, and the remainder
soluble minerals and other carbohydrates. The hydrolyzed skim proteins may have
interesting functional properties compared to traditional soy protein isolate (SPI) and soy
protein concentrate (SPC), the most notable being increased solubility at low pH.5-7
Hydrolysis of soy protein improves water hydration capacity, foaming capacity and stability,
and gelation capacity.8 Proteolysis during extraction in EAEP reduces more than 30% of the
proteins to a molecular weight of less than 3 kDa 1, which may be suitable for a
hypoallergenic protein food ingredient.6 EAEP also reduced trypsin inhibitor activity (TIA)

110
by about 70%.1 Low molecular weight and low TIA would help make the skim fraction a
suitable high-nutrition ingredient except for the presence of indigestible stachyose and the
low protein content. On the other hand, hydrolysis of soy extrudates has been linked to
increased bitter, beany, and astringent off-flavors in soy.9
Conventional methods of soy protein recovery and purification are based on solubility
characteristics. Soy protein concentrates (SPC) are manufactured by washing defatted
soymeal with ethanol, in which soy proteins have a low solubility, resulting in a cake that is
65% protein and is low in antinutritional oligosaccharides, with overall protein yields of 60-
70%.10 Soy protein has very low solubility at its average isoelectric point, near pH 4.5,
which allows for an inexpensive means of purification. Soy protein isolate (SPI) is produced
by extracting protein from defatted meal at alkaline pH followed by isoelectric precipitation
(IEP) at pH 4.5 and results in a precipitate protein content of 90%, but with lower overall
protein yield (ca. 60%) and a whey stream requiring costly additional processing.10
Hydrolysis alters various functional properties of soy protein. Solubility of soy
protein at acidic pH increases with hydrolysis7, 11, 12, which would be desirable for
applications such as low pH beverages as well as enteral and parenteral clinical diets.6
However, increased solubility would reduce protein recovery from EAEP by IEP.
Hydrolysis increases foaming capacity of soy protein isolates8, and reduces viscosity of
protein solutions.7 Many bioactive peptides have been identified in soy hydrolyzates with
molecular weights between 500 and 3000 Da.13 Recovery and purification of this fraction
would be desired for potential therapeutic applications such as hypertension treatment 14 and
cholesterol reduction.13

111
Protein recovery and purification using UF has been studied extensively as a means to
eliminate the whey byproduct in soy protein production. Nitrogen rejections of 95% have
been reported for membranes with nominal molecular weight cut offs (NMWCO) of up to 18
kDa15, with high rejections still noted for 50 kDa NMWCO membranes.16 Nitrogen in
aqueous soybean extract is typically 5% non-protein in nature, so a 95% nitrogen rejection
would be essentially 100% protein rejection.15, 16 High permeate flux is important for
successful UF processing economics. In studies on UF soy protein recovery, permeate fluxes
range from 10 to 100 L/m2-h. Flux depended on membrane NMWCO, pH, protein
concentration, and insoluble particulate concentration.10, 17, 18 Concentration polarization is
the largest factor determining flux, causing up to 80% of global resistance in soy protein
UF.10 Yields for UF processes are better than traditional SPI and SPC processes, ranging
from 80 to 95%;15, 19, 20 however, protein content greater than 79%20 has not been achieved.
Phytate, the salt containing most of the phosphorus in soy, binds strongly to soy glycinin.21, 22
UF protein purity is, therefore, limited by such protein-mineral interactions, and, in the case
of full fat extracts, by 100% rejection of emulsified lipids.19 Because separation by UF
depends on a large difference in molecular size between product and impurity, proteolysis
would reduce separation efficiencies between small polypeptides and large impurities such as
oligosaccharides, phytate, and phytate complexes.
Chromatography is an established high-yield method for some food commodities,
such as high-fructose corn syrup, as well as for specialty protein food ingredient products,
such as dairy whey protein isolate. In pilot-scale studies, ion-exchange chromatography
(IEC) was able to recover as much as 90% of the proteins in dairy whey.23 There have been
very few studies of IEC recovery of soy protein, but because IEC relies on different

112
properties for separation than IEP or UF, it may recover skim proteins lost by the other
methods and enable better separation from lipids than IEP or UF. An obstacle for
chromatography of extracts from solids is the need to clarify the feed stream. The skim
fraction from EAEP contains very stable, finely emulsified droplets of oil and cannot be
clarified effectively by centrifugation.1 Expanded-bed adsorption (EBA) was therefore
selected for this study since it may not require clarification. EBA beads have a high density
core with a range of diameters. EBA columns are operated with upward flow, so that the
beads form a stable classified expanded bed with large void spaces to allow particulates to
pass through while maintaining plug flow and, therefore, high separation efficiency.24
We have tested the effectiveness of isoelectric precipitation (IEP), ultrafiltration (UF),
and ion-exchange chromatography (IEC) in recovery and purification of proteins from the
EAEP skim in order to realize the potential value of this process stream.
Materials and Methods
Skim was produced following a process developed by Moura et al.1 Soybean was
dehulled, conditioned, flaked, and extruded at the Center for Crops Utilization Research,
Ames, IA using variety 92M91-N201 soybeans (Pioneer a DuPont Company, Johnston, IA,)
harvested in 2006 and stored as received from the vendor at ambient conditions until use.
Two hundred grams (dry basis) of extruded pellets were added to 2 L of deionized water with
0.5% (w/w pellet) endoprotease Protex 6L (subtilisin, EC 3.4.21.62, an alkaline serine-
endopeptidase from Bacillus lichenformis, optimal pH 7.0-10.0, optimal temperature 30-70
oC, Genencor Intl., Rochester, NY) in a 2L jacketed reactor (Model 4742, Chemglass Inc.,
Vineland, NJ ) held at 50 °C by a circulating water bath and agitated at 500 rpm by a stirrer

113
(Model BDC 3030, Caframo, Ltd., Wiarton, Ontario) with a 1-inch, 3-bladed screw impeller.
Constant pH 9 was maintained by an autotitrator (Model 718 Stat Titrino, Metrohm, Ltd.,
Herisau, Switzerland) by adding 2 N sodium hydroxide for 1 h. Solids were removed by
centrifugation at 3000 x g, 15 min, 20 °C. Skim and cream fractions were separated
overnight in a separatory funnel at 4 °C. Skim was stored at 4 °C until use. For storage
times greater than 1 wk, skim was stored at -20 °C and thawed in a room temperature water
bath immediately before use. A fine protein precipitate was observed to form in the skim
after several days of storage and after freezing/thawing. This precipitate was resuspended by
agitation prior to all experiments. Subsequent characterization studies have indicated that
this precipitate may account for ca. 12% of the total skim proteins.
For UF and IEP experiments, protein content was based on total nitrogen analyzed
according to AOAC method 993.1325 using a RapidN III combustion analyzer (Elementar
Americas, Inc. Mt Laurel, NJ) and a nitrogen to protein conversion factor of 6.25. For all
other experiments, protein concentration was determined by measuring the absorbance of
samples at 215 nm with an Ultrospec 4000 UV/visible spectrophotometer (GE Healthcare,
Piscataway, NJ). Samples were diluted with 100 mM, pH 9 phosphate buffer to have an
absorbance of less than 1 AU/cm, which also reduced sample opacity to negligible levels.
Absolute protein concentration was determined using standard dilutions of skim of known
protein concentration (with same phosphate buffer as above) as determined by total nitrogen
content as above. The consistency of the correspondence between the two protein
measurements was validated by replicating one adsorption experiment using the total
nitrogen analysis.

114
UF of skim was carried out with a YM3 3 kDa or a YM1 1 kDa nominal molecular
weight cut off (NMWCO) regenerated cellulose membrane (Millipore, Inc. Billerica, MA) in
an Amicon 50 mL, 43 mm diameter stirred cell (also by Millipore) at 40 psi transmembrane
pressure (TMP). The cell was agitated with a magnetic stirrer adjusted so that the vortex
depth was ca. 25% of the total liquid depth, per manufacturer instructions. For this
experiment, skim fractions were produced under various hydrolysis conditions during
extraction: 0.5% (w/w solid) Protex 7L (P7L 0.5) for lower hydrolysis, 0.5% Protex 6L (P6L
0.5) for medium hydrolysis (the condition used for IEP and IEC), and 1.0% Protex 6L (P6L
1.0) for greater hydrolysis. Initial protein contents (dry basis) of the P6L 0.5 and 1.0 skims
were not significantly different at 56.7% (±0.7%, average ± range of replicate
measurements). Initial protein concentration for the P7L skim was 54.4% (±0.2%). Initial
solids content was 5.1% (±0.1%), 5.6% (±0.1%) and 5.4% (±0.1%) for P7L, P6L 0.5, and
P6L 1.0 treatments, respectively. Initial stachyose concentration was between 3.3 mg/ml and
3.8 mg/ml for all extraction conditions. The three treatments resulted in molecular weight
profiles having 28%, 14%, and 10% of the peptides of a molecular weight greater than 10
kDa, respectively, as determined by size exclusion chromatography.1 Full SEC profiles are
given in Moura et al.1 Fifty grams of skim were weighed into the membrane cell. Permeate
was collected, weighed, and aliquots were withdrawn for saccharide analysis. Retentate
composition was calculated as the difference between material content in the permeate and
the content of the starting material. Moisture content was determined by weight loss after
freeze drying. The average rejection coefficients during the concentration run, Ri, were
calculated according to Equation 126:

Equation 1
where Ci,o and Ci are the initial
respectively, and CF is the concentration factor:
and Vo is the initial feed volume.
Protein recovery by IEP was carried out by
to the desired pH by adding 2N hydrochloric acid and agitating for one hour with a magnetic
stirrer. Skim was then transferred to pre
4500 x g, 30 min, 20 °C. Pre
Supernatant protein content was based on the difference between protein present in the
precipitate and protein present in the untreated skim.
concentration on IEP, skim batches were produced as above using 400 g and 200 g of soy
extrudate, resulting in skims having 50 and 26 mg/ml protein, respectively.
Adsorption isotherms were determined by finite source batch adsorption experiments.
Streamline Q XL, a dextran-gr
or Streamline SP, a strong cation exchange resin (both from GE Healthcare,
), was added to skim (anion exchange) or pH 4.5 IEP supernatant (cation exchange) in a 15
mL centrifuge tube with diluent (phosphate buffer of same pH and conductivity of skim,
which ranged from pH 8.75 to 9.0, conductivity between 5
acetate buffer at pH 4.5, conductivity between
provide a range of equilibrium concentrations and a final liquid volume of 10 ml. Samples
were agitated 60 min with an end
collecting supernatant with a pipette. For kinetic uptake experiments, 1 m
115
ial feed and final retentate concentration of species
is the concentration factor: Ro
V
V, where VR is the final retentate volume,
volume.
Protein recovery by IEP was carried out by placing 50 mL skim in a beaker, adjusting
desired pH by adding 2N hydrochloric acid and agitating for one hour with a magnetic
stirrer. Skim was then transferred to pre-weighed 50 mL centrifuge tubes and centrifuged at
, 30 min, 20 °C. Precipitate was freeze-dried and analyzed for protein content.
Supernatant protein content was based on the difference between protein present in the
precipitate and protein present in the untreated skim. To test the effects of protein
skim batches were produced as above using 400 g and 200 g of soy
extrudate, resulting in skims having 50 and 26 mg/ml protein, respectively.
Adsorption isotherms were determined by finite source batch adsorption experiments.
grafted agarose high capacity strong anion-exchange EBA resin,
or Streamline SP, a strong cation exchange resin (both from GE Healthcare,
), was added to skim (anion exchange) or pH 4.5 IEP supernatant (cation exchange) in a 15
with diluent (phosphate buffer of same pH and conductivity of skim,
which ranged from pH 8.75 to 9.0, conductivity between 5 and 6 mS/cm, for anion exchange
acetate buffer at pH 4.5, conductivity between 8.8 and 9.0 mS/cm for cation exchange) to
de a range of equilibrium concentrations and a final liquid volume of 10 ml. Samples
were agitated 60 min with an end-over-end rotary mixer and allowed to settle 5 min before
collecting supernatant with a pipette. For kinetic uptake experiments, 1 mL ski
retentate concentration of species i,
retentate volume,
skim in a beaker, adjusting
desired pH by adding 2N hydrochloric acid and agitating for one hour with a magnetic
centrifuge tubes and centrifuged at
dried and analyzed for protein content.
Supernatant protein content was based on the difference between protein present in the
To test the effects of protein
skim batches were produced as above using 400 g and 200 g of soy
Adsorption isotherms were determined by finite source batch adsorption experiments.
exchange EBA resin,
Piscataway, NJ
), was added to skim (anion exchange) or pH 4.5 IEP supernatant (cation exchange) in a 15
with diluent (phosphate buffer of same pH and conductivity of skim,
6 mS/cm, for anion exchange;
for cation exchange) to
de a range of equilibrium concentrations and a final liquid volume of 10 ml. Samples
end rotary mixer and allowed to settle 5 min before
skim was added

116
to 0.12 g resin in 1.5 mL microcentrifuge tube and agitated as before. Adsorption was
stopped by a short pulse (2 s) in a microcentrifuge, and supernatant was collected
immediately. Adsorbed protein was calculated by difference from the initial and final liquid
phase protein concentrations. Concentrations were corrected for dilution from solution
entrained in the settled resin. Mass of entrained solution was determined by weight loss on
drying (3 h at 103 °C). After adsorption, resin was rinsed with 1 mL phosphate buffer two
times for 5 min with agitation as before. Protein was desorbed by rinsing three times with 1
mL of 1N NaCl in the same manner. Resin was regenerated by repeated elution with 1N
NaOH until the supernatant was clear. To avoid size segregation, resin aliquots were
obtained by pouring resin slurry into a sintered glass vacuum funnel, rinsing several times
with deionized water, draining liquid, and transferring full-depth portions of the cake into a
beaker with a spatula.
Breakthrough experiments were conducted with a Streamline 25 expanded-bed
adsorption column (GE Healthcare, Piscataway, NJ) using between 20 and 30 g Streamline Q
XL resin, for sedimented bed heights of 4 to 6 cm. The column was equilibrated by pumping
phosphate buffer (pH and conductivity as above) through the column at 15 mL/min (3
cm/min), resulting in an expanded bed height of 12-16 cm. Between 2 and 5 expanded-bed
volumes of skim were applied. Throughout this paper, bed volumes reported refer to
expanded bed volumes. The column was then rinsed with equilibration buffer, and proteins
were eluted with 1M NaCl. Resin was cleaned and regenerated by pumping three column
volumes of a solution of 1M NaCl with 1N NaOH and then recycling for several hours. The
column was then rinsed with three column volumes of a 20% ethanol solution. Effluent
fractions were collected into 15 mL centrifuge tubes.

117
Protein fractions were characterized by size exclusion chromatography (SEC) using a
300 mm x 7.8 mm Biobasic SEC 120 column (Bio-Rad Laboratories, Ltd. Hercules, CA,
USA) following methods described previously.1 Raffinose and stachyose concentrations
were determined by cation-exchange chromatography.1 High-MW profiles were determined
by SDS PAGE of suitably diluted samples (to provide between 6 and 13 µg of protein while
applying 20 µL) on a 4 to 15% gradient polyacrylamide gel (Bio-Rad Laboratories, Ltd.).
Results and Discussion
Results of all protein recovery methods investigated are summarized in Table 1.
Ultrafiltration achieved the greatest overall protein recovery while still achieving protein
content high enough to be considered a soy protein concentrate. Analysis of each method
follows.
Isoelectric precipitation
Unhydrolyzed soy proteins extracted from soy flours27, 28 and extrudates9 have very
low solubility (less than 10%) between pH 4 and 5. The solubility-pH profiles of skim
initially containing 26 and 50 mg/mL protein had minimum solubility between pH 4 and 4.5
(data not shown); however, the percentage of the protein that remained soluble was 70% at
pH 4. This is higher than other studies of hydrolyzed soy protein, where 30% of the proteins
in a 10 mg/mL extruded soy protein aqueous extract with a degree of hydrolysis of 4%
remained in solution at pH 4.5.7 The reason for the increased solubility appears attributable
to the hydrolysis. Molecular weight profiles, as determined by SEC (not shown) showed that
no polypeptide with a molecular weight greater than 30 kDa remained in solution at a pH of

118
4. SDS PAGE gel profiles in Figure 1 show that the precipitated fraction was enriched with
proteins in the 20-37 kDa size range, as well as apparently hydrolysis-resistant β-subunits of
β-conglycinin and basic subunits of glycinin. There was variability in the protein and oil
content of the pH 4.5 precipitates, ranging from 61 to 70% for protein, and 5 to 11% for oil
for the 26 and 50 mg/mL skims, respectively. Because soy protein has high oil-binding
capacity29 it would be expected that some oil would precipitate with the protein. Although
oil content in the initial skims were not determined, variances in the initial oil content in the
skim could be responsible for variances of the final protein content of the precipitate.
Nevertheless, the fraction of total protein precipitated was the same in all cases. Because
oligosaccharides remain soluble at acidic pH, IEP also should have provided complete
separation of insoluble protein from stachyose.
Table 1- Summary of protein recovery from isoelectric precipitation, ultratiltration, and ion-exchange experiments.
*Overall recovery from extrudate based on 85% extraction yield during EAEP.1 **Assumes elution is pure protein after separation from buffer salts.
Method Starting material
Recovery
from skim
(%)
overall
recovery from
extrudate
(%)
Protein purity
(%, dry basis)
Molecular
weight
recovered
(kDa)
Isoelectric precipitation Skim pH 9 30 26 61-70 >30
Ultrafiltration Skim pH 9 70-74 60-63 70 >13
Anion exchange Skim pH 9 17-19 14-16 100* 30-Dec
IEP/ cation exchangeSkim pH 9 / pH 4.5
supernatant40 34 65 / 100* >9
Conventional SPC -- -- 60-70 65 --
Conventional SPI -- -- ca. 60 90 --

Figure 1- SDS PAGE gel of skim proteins, supernatant proteins (spnt) and proteins in precipitate (ppt) at pH 4.5 for skim from AEP with and without protease. Major soybean storage proteins are design
Ultrafiltration
Optimal selectivity between protein and non
stachyose/protein ratio, is desired. Of the hydrolysis treatments, the P6L 0.5 treatment gave
the best protein-stachyose separation (Figure
the P6L 1.0 skim1 providing a larger size difference for selective filtration. The P7L skim
has still less hydrolysis but also lower initial protein concentration that was not offset by any
selectivity advantage.
Using a 3 kDa NMWCO membrane and skim from P6
protein concentration of the retentate increased from 55 to 70%, while stachyose decreased
from 6 to about 2% at a conc
total percentage solids of the retentate from 5 to 14. The major drawback of this treatment
was the loss of peptides, which for
119
SDS PAGE gel of skim proteins, supernatant proteins (spnt) and proteins in precipitate (ppt) at pH 4.5 for skim from AEP with and without protease. Major soybean storage proteins are designated at right.34
selectivity between protein and non-protein components, in particular the
stachyose/protein ratio, is desired. Of the hydrolysis treatments, the P6L 0.5 treatment gave
stachyose separation (Figure 2). This treatment gives milder hydrolysis than
providing a larger size difference for selective filtration. The P7L skim
has still less hydrolysis but also lower initial protein concentration that was not offset by any
Using a 3 kDa NMWCO membrane and skim from P6L 0.5 treatment, the dry
protein concentration of the retentate increased from 55 to 70%, while stachyose decreased
from 6 to about 2% at a concentration factor (CF) of four (Figure 3). UF also increased the
total percentage solids of the retentate from 5 to 14. The major drawback of this treatment
which for P6L 0.5 skim was between 26 and 30% of the skim
SDS PAGE gel of skim proteins, supernatant proteins (spnt) and proteins in precipitate (ppt) at pH 4.5 for skim from AEP with and without protease. Major
protein components, in particular the
stachyose/protein ratio, is desired. Of the hydrolysis treatments, the P6L 0.5 treatment gave
). This treatment gives milder hydrolysis than
providing a larger size difference for selective filtration. The P7L skim
has still less hydrolysis but also lower initial protein concentration that was not offset by any
L 0.5 treatment, the dry-basis
protein concentration of the retentate increased from 55 to 70%, while stachyose decreased
). UF also increased the
total percentage solids of the retentate from 5 to 14. The major drawback of this treatment
P6L 0.5 skim was between 26 and 30% of the skim

120
proteins. The EAEP process has overall protein extraction yields of 85%1, so these losses
would give an overall yield of 60-64% of total protein after UF, comparable to conventional
SPC and SPI processes. Rejections, as calculated by Equation 1, were 0.74 for protein, and
negligible for stachyose. Experiments with a 1,000 Da membrane (Figure 3) resulted in
decreased protein losses, but the stachyose retention increased, resulting in no reduction of
stachyose and a slightly lower protein content at CF = 4 than for the 3 kDa membrane (67%
vs. 70%). Treatment of skim by α-galactosidase enzyme completely hydrolyzes stachyose to
smaller monosacharides,1 which should improve the retentate protein content achieved by a 1
kDa membrane.
Figure 2- Stachyose-protein ratio of the retentate from skim ultrafiltration with a 3,000 Da NMWCO membrane up to a concentration factor of 4 for skims obtained with three different hydrolysis conditions. Initial protein content (dry basis) of the P6L 0.5 and 1.0 skims were not significantly different at 56.7% (±0.7%, average ± range of replicate measurements). Initial protein concentration for the P7L skim was 54.4% (±0.2%). Initial stachyose concentration was between 3.3 and 3.8 mg/ml for all extraction conditions.

121
Figure 3- Dry-basis protein and stachyose composition of skim retentate from P6L 0.5 extraction with a 3,000 and a 1,000 Da NMWCO membrane.
Size-exclusion profiles (not shown) showed that retention was 100% for proteins of a
molecular weight greater than 13 kDa for the 3 kDa membrane. UF, therefore, can recover
smaller polypeptides than IEP, but recovery of the smallest polypeptides was still low.
Furthermore, as seen in previous full-fat soy extracts20, oil retention was also high, with no
visible turbidity in the permeate. Because the skim was initially 5 % oil, oil retention
presents a limiting factor to the protein content that can be achieved by using this technique.
For the 3000 Da membrane, flux decreased steadily throughout the experiment,
initially 8-10 down to 4-6 L/m2/h at CF = 4. While there have been previous studies on
ultrafiltration of soy protein hydrolyzates6, 30, there have been few reports of flux. Fluxes
reported here are low compared to those seen by Lawhon et al. 20 for unhydrolyzed aqueous
extracts, where a 1:12 solid-liquid ratio full-fat soy flour aqueous extract had a mean flux of
more than 30 L/m2/h, although this was with a larger NMWCO membrane (10 kDa compared

122
to 3 kDa) at higher temperature (65 °C) and TMP was not reported. Fluxes were also very
low in comparison to economically feasible processes for dairy whey which typically operate
at fluxes between 40 and 50 L/m2/h. An economic analysis would need to be conducted to
determine feasibility of the present application.
Anion exchange chromatography (AEC)
Binding isotherms from batch adsorption experiments are shown in Figure 4. Since
there are a range of protein species with different binding behavior in the mixture, the
binding isotherms were strongly dependent on initial protein and resin concentrations (data
not shown). About 20% of the bound protein exhibited weak binding characteristics and was
removed by rinsing with a 50 mM phosphate buffer. Of the remaining protein, only about 50
% could be removed by rinsing with a 1M NaCl solution, with the remainder being
irreversibly bound. It is difficult to quantify protein released during cleaning with 1 N NaOH
because this solution absorbs strongly at 215 nm. However, adsorption isotherms did not
change after several experiments with the same resin, so any protein not removed by cleaning
did not affect the binding characteristics.
The rate of protein uptake onto QXL resin is shown in Figure 5. Protein adsorbs
rapidly in the first minutes of contact, and continues more slowly for hours. After six hours
of contact, specific binding was still increasing. Initial skim protein concentration for trial 3
was less than in trials 1 and 2 (30.2 ±0.3 and 31.7 ±0.7 mg/ml, respectively). Variances in
protein uptake could be attributable to changes in skim as well as resin upon long term
storage.

123
Figure 4- Adsorption isotherm for Streamline Q XL resin with skim showing protein binding after application (total), after rinsing with 50 mM phosphate buffer, and after elution with a 1M sodium chloride solution. Resin concentration was 0.06 g/mL, contact time 60 min.
Figure 5- Protein binding kinetics from replicate experiments for skim proteins onto QXL resin at pH 9. Trials 1 and 2 were conducted simultaneously. Trial 3 was conducted with the same skim and resin batch after several months of storage.

124
In Figure 6, SEC profiles of supernatant samples before and after adsorption show
that the proteins with molecular mass less than 12 kDa adsorbed quickly, with no change in
concentration observed after the 5 min of contact, while proteins larger than this continued to
adsorb until the solution had been depleted, or, in the case of largest proteins, until nearly
depleted. Since the specific protein binding of the resin was still increasing after six hours,
these larger proteins might have been completely removed from solution with sufficient time.
The slow uptake of larger proteins cannot be explained by diffusion limitations. Based on an
estimate of the diffusion coefficient of the largest protein seen in the SDS PAGE gel (50
kDa), the protein concentration at the center of a resin bead should have reached 95% of the
bulk concentration within 8 min for the largest resin bead (300 µm) and within four minutes
for the mean bead size (200 µm). A likely explanation for slower than expected uptake is an
ion-exchange binding mechanism proposed by Harinarayan et al 31 where charged proteins
bound to the surface of dextran-grafted resin beads electrostatically hinders other charged
proteins from penetrating to the bead core. Harinarayan et al. observed that increasing the
ionic strength of the solution increased the uptake kinetics of highly charged proteins, which
may also improve uptake kinetics observed here. However, in ion exchange adsorption is
strongly dependent on ionic strength for solutes of small charge.32 Since smaller
polypeptides would tend to also have smaller charge, increasing ionic strength may decrease
the binding of lower molecular weight polypeptides.

Figure 6- SEC profiles of supernatant samples from the kinetic uptake experiment showing which proteins are adsorbed and which proteins exhibit slow uptake behavior. Resin concentration was 0.12 g/ml. Sample injection sizes were treatments.
The polypeptides in the skim protein mixture exhibited binding strengths that
increased with molecular weight, ranging from irreversible (largest) to very weak (smallest)
In Figure 6, polypeptides of molecular weight greater than 12 kDa were nearly complet
depleted from the skim after
7A), indicating strong binding. The largest polypeptides did not elute with the salt buffer
(Figure 7A) and were considered irreversibly bound; however, longer c
did increase their recovery (data not shown). Below a molecular weight of 12 kDa,
polypeptide depletion in the supernatant in Figure
kDa indicating weak and very weak binding fractions. Weake
weight is also seen in the SEC profiles in Figure
remained bound during rinsing. This molecular
explained by the tendency of smaller polypeptides to contain
smaller net charge.
125
SEC profiles of supernatant samples from the kinetic uptake experiment showing which proteins are adsorbed and which proteins exhibit slow uptake behavior. Resin concentration was 0.12 g/ml. Sample injection sizes were identical
e polypeptides in the skim protein mixture exhibited binding strengths that
creased with molecular weight, ranging from irreversible (largest) to very weak (smallest)
, polypeptides of molecular weight greater than 12 kDa were nearly complet
depleted from the skim after 6 h of contact time and remained bound after rinsing (Figure
), indicating strong binding. The largest polypeptides did not elute with the salt buffer
and were considered irreversibly bound; however, longer contact times (>12
did increase their recovery (data not shown). Below a molecular weight of 12 kDa,
polypeptide depletion in the supernatant in Figure 6 is partial and drops noticeably below 4
kDa indicating weak and very weak binding fractions. Weaker binding at low molecular
weight is also seen in the SEC profiles in Figure 7A, where few proteins below 12 kDa
remained bound during rinsing. This molecular-weight dependence of binding may be
explained by the tendency of smaller polypeptides to contain fewer charged residues, thus a
SEC profiles of supernatant samples from the kinetic uptake experiment showing which proteins are adsorbed and which proteins exhibit slow uptake behavior.
identical for all
e polypeptides in the skim protein mixture exhibited binding strengths that
creased with molecular weight, ranging from irreversible (largest) to very weak (smallest).
, polypeptides of molecular weight greater than 12 kDa were nearly completely
of contact time and remained bound after rinsing (Figure
), indicating strong binding. The largest polypeptides did not elute with the salt buffer
ontact times (>12 h)
did increase their recovery (data not shown). Below a molecular weight of 12 kDa,
is partial and drops noticeably below 4
r binding at low molecular
, where few proteins below 12 kDa
weight dependence of binding may be
fewer charged residues, thus a

Figure 7- Overlay of SEC profilescollected after 60 min of resin contact, showing strong and weak adsorbing protein species for (A) anion exchange and (volumes, as well as injection sizes, were equal in all samples. the same scale, thus relative
Binding behavior under dynamic conditi
8). Performance in packed bed (reverse flow) mode
shown). However, the packed bed exhibited evidence of severe channeling during elution,
and flow reversal showed this was
Operating the column in expanded bed mode during application and elution eliminated this
problem. Although some early breakthrough is evident, the tracer profile shows that column
flow approaches plug flow. Overall protein balances had closures of around 95 %, with 19 %
and 17 % of total applied protein remaining bound after rinsing for 2 and 4.5 bed volumes
applied, respectively. Specific protein adsorption after rinsing was 25 and 46 mg/g for th
126
Overlay of SEC profiles of proteins in rinse and elution buffer samples of resin contact, showing strong and weak adsorbing protein
for (A) anion exchange and (B) cation exchange. Rinse and elution buffer volumes, as well as injection sizes, were equal in all samples. Chromatograms
relative peak sizes are not comparable between chromatograms
Binding behavior under dynamic conditions is seen in breakthrough profiles (Figure
). Performance in packed bed (reverse flow) mode was similar to expanded bed mode
. However, the packed bed exhibited evidence of severe channeling during elution,
and flow reversal showed this was the result of the formation of a cohesive plug of resin.
Operating the column in expanded bed mode during application and elution eliminated this
problem. Although some early breakthrough is evident, the tracer profile shows that column
plug flow. Overall protein balances had closures of around 95 %, with 19 %
and 17 % of total applied protein remaining bound after rinsing for 2 and 4.5 bed volumes
, respectively. Specific protein adsorption after rinsing was 25 and 46 mg/g for th
proteins in rinse and elution buffer samples of resin contact, showing strong and weak adsorbing protein
. Rinse and elution buffer Chromatograms are not to
between chromatograms.
ons is seen in breakthrough profiles (Figure
similar to expanded bed mode (not
. However, the packed bed exhibited evidence of severe channeling during elution,
the result of the formation of a cohesive plug of resin.
Operating the column in expanded bed mode during application and elution eliminated this
problem. Although some early breakthrough is evident, the tracer profile shows that column
plug flow. Overall protein balances had closures of around 95 %, with 19 %
and 17 % of total applied protein remaining bound after rinsing for 2 and 4.5 bed volumes
, respectively. Specific protein adsorption after rinsing was 25 and 46 mg/g for the

127
two respective trials, indicating that the resin was far from saturation. The breakthrough
concentration reached a constant value of about 90% of the inlet concentration after 3.4 bed
volumes. Very little of the protein between 12 and 30 kDa broke through within four bed
volumes based on the absence of peaks in this range in the SEC profiles of the column
effluent (not shown), in good agreement with previous results from batch uptake
experiments. Proteins outside of this molecular weight range achieved 100 % breakthrough,
indicating saturation of sites able to bind >30 kDa proteins, and saturation/weak binding for
proteins <12 kDa, as seen previously in batch adsorption experiments. Because the
oligosaccharides are uncharged, it is assumed that this process would achieve complete
separation from stachyose and a high protein purity after eluent desalting.
Figure 8- Breakthrough profiles for expanded-bed adsorption for anion exchange (AEX) and cation exchange (CEX) adsorption compared to tracer (0.25% v/v acetone in de-ionized water) breakthrough profile. X-axis is volume applied (V) divided by the expanded bed volume (Vo).

128
Cation-exchange chromatography (CEC)
Binding behavior of proteins from the IEP supernatant at pH 4.5 was similar to that of
the skim proteins near pH 9, with strong-binding of higher molecular weight proteins and
binding strength decreasing with molecular weight, as indicated in the SEC chromatograms
of rinse and elution fractions in Figure 7B. Therefore, CEC did not provide any selectivity
advantage over AEC for low-molecular weight peptides. CEC dynamic binding behavior in
the EBA column was poorer than AEC, with rapid breakthrough of most of the skim proteins
(Figure 8), resulting in capture of less than 10% of total soy proteins. This is less than
recovery yields of soy protein hydrolyzates by CEC at low pH achieved by others, which
range from 14 to 17% (w/w) at pH values from 2 to 4.14, 33 However, in contrast to the
findings reported here, these researchers reported recovery of proteins of molecular weights
less than 1,000 Da. It is possible that CEC at pH values farther from the average isoelectric
point of soy proteins would improve recovery of low molecular weight oligopeptides.
Conclusions
For a one-step purification process, UF provided the best results, increasing protein
content from 55 to 70% while reducing stachyose content from 6 to 2% with a 3 kDa
NMWCO membrane. The proteins lost by this method had a molecular weight less than 13
kDa, which may include valued nutraceutical peptides. Nevertheless, recovery of 70% of the
proteins from skim gives an overall protein yield of 60%, similar to conventional SPC and
SPI processes. UF with a 1 kDa membrane increased protein retention, but without reduction
in stachyose. IEP recovered 30% of the skim proteins, which consisted primarily of protein
fragments with a molecular mass > 30 kDa that included two hydrolysis-resistant subunits of

129
the storage proteins. Protein precipitate contained bound oil, and therefore the reduction of
oil content in the skim prior to precipitation may increase purity. IEC with dextran-grafted
EBA resin would be suitable for recovery of proteins between 30 and 12 kDa. Binding of
proteins larger than 30 kDa was very strong or irreversible with slow uptake rates. Binding
of proteins between 30 and 12 kDa was strong and reversible with rapid uptake. Proteins
between 12 and 4 kDa bound weakly, and proteins less than 4 kDa bound very weakly or not
at all. Dynamic binding capacity of Streamline QXL is greatest for hydrolyzed soy proteins
in the 12-30 kDa range. Dynamic binding of proteins by CEC at pH 4.5 was poorer than for
AEX, with no advantage in selectivity for capturing low-molecular weight peptides.
Hydrolysis complicates the concentration and purification of protein from the soy
EAEP skim fraction. A process optimized for protein recovery yields could incorporate
upstream strategies to minimize hydrolysis while maintaining acceptable extraction yields.
Process conditions which minimize emulsified oil in the skim will improve purities attained
by these processes. These three technologies can be combined in many different
configurations to provide a range of different protein products that cover a range of purity
and molecular weight.
Acknowledgements
This project was supported by the USDA research grant number 2005-34432-16406
with additional funding from the Plant Science Institute of Iowa State University. We would
like to thank Peter Bierschbach of Genencor, Intl., Juliana Nobrega de Moura, and the Center
for Crops Utilization Research for providing materials used for this research.

130
References
1. Moura, J.; Campbell, K.; Mahfuz, A.; Jung, S.; Glatz, C. E.; Johnson, L., Enzyme-
assisted aqueous extraction of oil and protein from soybeans and cream de-
emulsification. J Am Oil Chem Soc. 2008, 85, (10), 985-995.
2. Sanny, E. ADM Sales. Personal communication, Jan 2008.
3. Soybean oil futures. Chicago Board of Trade. 2007. Available at:
http://www.cbot.com. Accessed: December 30, 2007.
4. Campbell, K.; Glatz, C. E. In Value-added products from protease-assisted aqueous
extraction of soybean oil, A paper presented at the Annual Meeting of the American
Institute of Chemical Engineers, Salt Lake City, UT, 2007.
5. Jung, S.; Murphy, P. A.; Johnson, L. A., Physicochemical and functional properties of
soy protein substrates modified by low levels of protease hydrolysis. J Food Sci.
2005, 70, (2), C180-C187.
6. de la Barca, A. M. C.; Ruiz-Salazar, R. A.; Jara-Marini, M. E., Enzymatic hydrolysis
and synthesis of soy protein to improve its amino acid composition and functional
properties. J Food Sci. 2000, 65, (2), 246-253.
7. Lamsal, B. P.; Jung, S.; Johnson, L. A., Rheological properties of soy protein
hydrolysates obtained from limited enzymatic hydrolysis. Lwt-Food Sci Technol.
2007, 40, (7), 1215-1223.
8. Moure, A.; Sineiro, J.; Dominguez, H.; Parajo, J. C., Functionality of oilseed protein
products: A review. Food Res Int. 2006, 39, (9), 945-963.

131
9. Lamsal, B. P.; Reitmeier, C.; Murphy, P. A.; Johnson, L. A., Enzymatic hydrolysis of
extruded-expelled soy flour and resulting functional properties. J Am Oil Chem Soc.
2006, 83, (8), 731-737.
10. Alibhai, Z.; Mondor, M.; Moresoli, C.; Ippersiel, D.; Lamarche, F. Production of soy
protein concentration/isolates: Traditional and membrane technologies. Desalination
2006; 191: 351-358.
11. Adler-Nissen, J., Enzymatic hydrolysis of food proteins. Elsevier Applied Science
Publishers: New York, NY, 1985.
12. Kim SY, Park PSW, Rhee KC. Functional-properties of proteolytic-enzyme modified
soy protein isolate. J Agric Food Chem. Mar 1990;38(3):651-656.
13. Wang, W. Y.; De Mejia, E. G., A new frontier in soy bioactive peptides that may
prevent age-related chronic diseases. Compr Rev Food Sci Food Safety. 2005, 4, (4),
63-78.
14. Chen, J. R.; Okada, T.; Muramoto, K.; Suetsuna, K.; Yang, S. C., Identification of
angiotensin I-converting enzyme inhibitory peptides derived from the peptic digest of
soybean protein. J Food Biochem. 2002, 26, (6), 543-554.
15. Kumar, N. S. K.; Yea, M. K.; Cheryan, M., Soy protein concentrates by
ultrafiltration. J Food Sci. 2003, 68, (7), 2278-2283.
16. Omosaiye O, Cheryan M, Matthews ME. Removal of oligosaccharides from soybean
water extracts by ultrafiltration. J Food Sci. 1978;43(2):354-360.
17. Noordman, T. R.; Kooiker, K.; Bel, W.; Dekker, M.; Wesselingh, J. A.,
Concentration of aqueous extracts of defatted soy flour by ultrafiltration effect of
suspended particles on the filtration flux. J Food Eng. 2003, 58, (2), 135-141.
132
18. Mondor, M.; Ippersiel, D.; Lamarche, F. O.; Boye, J. I., Production of soy protein
concentrates using a combination of electroacidification and ultrafiltration. J Agric
Food Chem. 2004, 52, (23), 6991-6996.
19. Omosaiye O, Cheryan M. Ultrafiltration of soybean water extracts - processing
characteristics and yields. J Food Sci. 1979;44(4):1027-1031.
20. Lawhon, J.T.; Rhee, K.C.; Lusas, E.W. Soy protein ingredients prepared by new
process - aqueous processin and industrial membrane isolation. J Am Oil Chem Soc.
1981;58(3):377-384.
21. Brooks, J.R.; Morr, C.V.; Phytate removal from soybean proteins. J Am Oil Chem
Soc. 1984;61(6):1056-1059.
22. Saito, T.; Kohno, M.; Tsumura, K.; Kugimiya, W.; Kito, M., Novel method using
phytase for separating soybean beta-conglycinin and glycinin. Biosci Biotechnol
Biochem.2001, 65, (4), 884-887.
23. Lan, Q.; Bassi, A. Zhu, J.-X.;Margaritis, A.; Continuous protein recovery from whey
using liquid-solid circulating fluidized bed ion-exchange extraction. Biotechnol
Bioeng. 2002, 78, (2), 157-163.
24. Sonnenfeld, A.; Thommes, J., Expanded Bed Adsorption for Capture from Crude
Solution. In Process Scale Bioseparations for the Biopharmaceutical Industry,
Shukla, A. A.; Etzel, M. R.; Sishir, G., Eds. Taylor and Francis Group: New York,
2007; pp 59-74.
25. AOAC. Official Methods of Analysis of Association of Official Analytical Chemists.
16th ed. Arlington, VA; 1995. Method 993.13.

133
26. Cheryan, M., Ultrafiltration Handbook. Technomic Publishing Company: Lancaster,
PA, 1986; p 198-200.
27. hen JL. Solubility profile, intrinsic viscosity, and optical-rotation studies of acid
precipitated soy protein and of commercial soy isolate. J Agric Food Chem.
1976;24(4):784-788.
28. Rosenthal, A.; Pyle, D. L.; Niranjan, K., Simultaneous aqueous extraction of oil and
protein from soybean: Mechanisms for process and design. Trans. Food and
Bioproducts Processing 1998, 76, 224-230.
29. Nielsen, N. C., In New Protein Foods Vol. 5: Seed Storage Proteins, Altschul, A. A.;
Wilcke, H. L., Eds. 1985; Vol. 5.
30. Chiang, W. D.; Tsou, M. J.; Tsai, Z. Y.; Tsai, T. C., Angiotensin I-converting enzyme
inhibitor derived from soy protein hydrolysate and produced by using membrane
reactor. Food Chem. 2006, 98, (4), 725-732.
31. Harinarayan, C.; Mueller, J.; Ljunglof, A.; Fahrner, R.; Van Alstine, J.; van Reis, R.,
An exclusion mechanism in ion exchange chromatography. Biotechnol Bioeng. 2006,
95, (5), 775-787.
32. Hagel, L.; Jagschhies, G.; Sofer, G., Handbook of Process Chromatography. 2 ed.;
Eslevier: Amsterdam, 2008.
33. Wu, J.; Ding, X., Hypotensive and physiological effect of angiotensin converting
enzyme inhibitory peptides derived from soy protein on spontaneously hypertensive
rats. J Agric Food Chem. 2001, 49, (1), 501-506.

134
34. Wu, S.; Murphy, P.A.; Johnson, L.A.; Reuber, M.A.; Fratzke, A.R. Simplified
process for soybean glycinin and β-conglycinin fractionation. J Agric Food Chem.
2000,48, (7), 2702-2708.

135
CHAPTER 7. GENERAL DISCUSSION AND CONCLUSIONS
Aqueous extraction processing of soybeans has seen significant progress within the
last five years with extraction yields of oil and protein from the solid fraction now exceeding
95%. The greatest challenges facing this process, however, remain unchanged. Yields of
free oil are still lower at 85% than hexane extraction yields because of oil losses to either the
residual or the skim fractions. The purification of the skim protein is complicated both by
the presence of oil and by the nature of the hydrolysis needed to maximize oil extraction
yields. Still, improvements in the fundamental understanding of these problems represent
substantial progress toward the goal of a greener high-yielding extraction process.
The results presented here have shown that to maximize oil yields, it is necessary to
maintain oil droplets that are small enough to pass out of the matrix of disrupted cells, yet the
resulting emulsion needs to be unstable enough to form cream that can be broken to achieve
free oil. Understanding the nature of the species at the oil-water interface that stabilize these
emulsions is critical to our ability to control the properties of AEP emulsions and improve
free oil yields from AEP. Large droplets of coalesced oil bodies inside disrupted cells are
likely stabilized by a viscoelastic protein film that inhibits droplet mobility. Proteases and
low molecular weight surfactants can therefore improve extraction yields by disrupting such
interfacial films. The nature of the confining matrix and its geometry are also important
factors which must be considered in rational process design. Extrusion achieves complete
cellular disruption, but creates a different matrix of insoluble proteins that adsorb and entrap
oil creating different complications for oil recovery than is observed in extraction from soy
flours.

136
Purification of the proteins and recovering values from the skim fraction are also
critical to the economic viability of AEP, and oil extraction strategies must take this into
account. Isoelectric precipitation is the simplest and most economical method to purify soy
proteins, but because of the high oil binding capacity of soy protein, the presence of
emulsified oil in the skim limits the purity that can be achieved by this method. Likewise,
the extensive hydrolysis needed to free oil from extruded soy flake reduces the yields of
isoelectric precipitation dramatically. Ultrafiltration using membranes with nominal
molecular weight cut-offs of no smaller than 3,000 Da achieved the highest protein yields
while still improving protein purity from extruded soy hydrolyzate. However, losses of the
smallest hydrolyzed polypeptides represent important lost value from the skim fraction.
Size-selective methods will not be suitable for recovering these smallest polypeptides.
Achieving high yields of both oil and protein will require either an extraction process
that achieves high yields of free oil with a minimal protein hydrolysis, or an affordable
technology that can capture the smallest hydrolysed protein fragments. The identification of
a suitable food-grade surfactant may enable the former route. Further investigations into the
use of packed bed chromatographic methods may enable development of the latter route.
Either will require a better understanding of the nature of the stable emulsion that remains in
the skim fraction after centrifugal separation of the cream.

137
APPENDIX 1. ON-GOING AEP WORK
Introduction
There are several pieces of additional work that have been completed, but together do
not make a complete manuscript. The following sections are to be included as parts of future
joint publications that focus on fractionation of the EAEP skim in order to recover values of
this important EAEP fraction.
An important improvement in EAEP is to reduce the fraction of oil that is lost as an
emulsion in the skim. Therefore, one objective is to understand the nature of the oil in the
skim to guide the development of oil recovery strategies. Reducing the amount of oil in skim
will also improve skim protein purity. Creating a purified protein product is critical to EAEP
economic viability; purification which, it has been shown, can be best achieved by
ultrafiltration. Another objective, therefore, is to identify conditions that provide optimum
flux for ultrafiltration. All of the experiments presented below were conducted using the
skim fraction from a single batch of extract produced by a two-pass countercurrent extrusion
process with protease (2PCC process) developed by de Moura and Johnson.[1] After each
extraction stage, residual solids fractions had been separated from the skim fraction by
centrifuging at 3000 x g, and then cream was separated from the skim fraction overnight in a
separatory funnel.

138
Materials and Methods
Centrifugal separation of oil in skim
Ca. 200 ml 2PCC skim (2-18-09 batch) with 0.1% (w/v) sodium azide added as a
preservative was stored frozen. The skim was thawed, heated to >85 °C for 5 min to
deactivate enzyme, cooled to room temperature, and centrifuged at 5000 rpm for 90 min at
room temperature in an HS-4 rotor in 250 ml bottles. The skim separated into three phases:
an additional cream, clarified skim (aqueous fraction) and a precipitate phase that was not
present during the centrifugal separation of the cream, skim, and residual fractions from the
original 2PCC extract. This insoluble material has been noted to form upon storage of the
skim fraction over the course of several days after the initial phase separation, with or
without a freeze-thaw cycle, and was not present at the time of initial phase separation during
the extraction process. Clarified skim was recovered by creating a small pinhole with a
needle just above the top of the precipitate pellet and draining until cream was observed in
drainage (white cloudiness could be seen in droplets draining from the pinhole). Draining
was stopped by tipping the bottle onto the side opposite of the pin hole. Cream was
recovered by rinsing remaining liquid in the bottle with 10 mM phosphate buffer, pH 8.9,
several times into 50 ml centrifuge tubes.
Optimization of ultrafiltration flux
Optimal flux conditions were studied by a 2-level full-factorial design experiment
with triplicate measurements for each condition using the 2PCC skim and a 3 kDa nominal
molecular weight cut off (NMWCO) XamplerTM polysulfone hollow fiber membrane

139
cartridge (GE Healthcare, Piscataway, NJ) consisting of 13 fibers of 30 cm length with a
nominal fiber diameter of 1.0 mm and total area of 110 cm2 in full recycle mode. Flux was
measured by recording the rate of change of permeate mass for 3 min on a balance. Statistical
analysis was completed using JMP 7.0 statistical software (SAS, Inc., Cary, NC). Parameters
studied (Table 1) were cross-flow rate, transmembrane pressure, pH, and the presence of
insoluble material (either the precipitate that formed post extraction, or the isoelectric
precipitate that formed upon adjusting skim to pH 4.5, the average isoelectric point for soy
proteins). For skim without insolubles, the 2PCC skim was centrifuged as above (5000 rpm,
90 min) but without cream removal. Cross flow rate and transmembrane pressure were
controlled by a peristaltic pump and a needle valve on the retentate. The insoluble precipitate
Table 1- Parameters tested for skim ultrafiltration flux optimization.
The membrane cartridge was cleaned by flushing with 10 mM phosphate buffer at pH
9 for 10 min at 1 L/min CFR, 50 °C followed by flushing with 0.5 M NaOH at 50 °C, 0.5
L/min for 1 h, followed by flushing with 100 ppm NaOCl at 50 °C, 0.5 L/min. The cartridge
was then stored at least overnight in 0.1 M NaOH and then cleaned again as before. Because
of the extensive cleaning cycle required between experimental runs, a full randomization of
conditions was impractical. Trials were conducted in four sets of constant pH and solids,
Parameter Level 1 Level 2
Cross flow rate (L/min) 0.27 0.90
Transmembrane pressure (psi) 10 25
pH 4.58.9
(as extracted)
Presence of precipitate solids no solidswith solids
(as extracted)

140
with cross flow rate and transmembrane pressure randomized within each set. Therefore,
each set consisted of four conditions, each tested in triplicate, for a total of 12 runs for each
set. Clean water flux was measured before and after each set of 12 runs to measure initial
and fouled membrane resistances. Initial membrane resistance varied from 1.82x10¹⁰ to
2.02x10¹⁰ m-1. The sample resistances were, on average, an order of magnitude greater than
this; thus the variability in membrane resistance between trial sets were ca. 1% of the total
resistance.
Cation-exchange chromatography
Approximately 8 mL of cation-exchange resin (AG 50W-X8 100-200 mesh H+ form)
from Bio-Rad Laboratories, Ltd. (Hercules, CA, USA) was packed in a 1.0 cm ID column on
an AKTA Explorer liquid chromatography apparatus (GE Healthcare, Piscataway, NJ). The
column was equilibrated with 10 mM acetate buffer, pH 4 before application. Between 1.2
and 2.4 column volumes (CV) of permeate were applied. After application, the column was
rinsed with equilibration buffer for 5 column volumes (CV). Proteins were eluted by a step
elution for 10 CV. Relative protein concentrations were determined by measuring the
adsorption of diluted fractions at 215 nm with an Ultrospec 4000 UV/visible
spectrophotometer (GE Healthcare, Piscataway, NJ). Absolute protein concentrations were
determined as detailed below.
Analytical methods
Clarified skim and cream fractions were sampled for solids analysis (loss of mass
upon drying, 130 °C, 12 h). Precipitate fraction solids content was determined by loss of
mass upon freeze drying. Oil content was determined on dry pellet and full-moisture skim

141
and cream fractions by acid hydrolysis (Mojonnier) extraction method (AOCS method
922.06). Free oil was determined by extracting dry samples by with hexane in a Goldfisch
apparatus without acid hydrolysis (AOCS Official Method Bc 3-49). Protein content, as total
nitrogen, was determined on fractions after freeze drying by AOAC method 993.13 using a
RapidN III combustion analyzer (Elementar Americas, Inc., Mt. Laurel, NJ) and a nitrogen to
protein conversion factor of 6.25. Isoflavone profiles were determined by HPLC following
the methods of Wang and Murphy.[2] Total isoflavone mass was determined by normalizing
the mass of the glycoside forms for the equivalent molecular weight aglycon form. Mass
balances reported have been corrected for entrainment of solubles in the liquid portion of the
precipitate fraction by assuming that the same concentration of each component in the
aqueous fraction was in solution in the entrained moisture of the precipitate pellet. Turbidity
was determined by measuring the absorbance of skim at 620 nm. Skim was diluted with 10
mM phosphate buffer, pH 8.9 to have an absorbance of less than one. Reported values are
the measured absorbance readings times the dilution factor.
Size Exclusion Chromatography
Low molecular weight polypeptides were characterized by HPLC size exclusion
chromatography as described previously [3] using 2 M guanidine HCl for both the sample
diluent and mobile phase.
SDS PAGE
High molecular weight profiles were determined by SDS PAGE by diluting samples
to a protein concentration of 1.5 mg/ml with 10 mM phosphate buffer (pH 7.5), mixing 1 part
sample with 2 parts sample buffer (62.5 mM Tris-HCl, pH 6.8, 2% SDS, 25% glycerol,

142
0.01% bromophenol blue, 5% 2-mercaptoethanol), heating in boiling water 5 min, and
loading onto a 4% to 15% gradient polyacrylamide gel (Bio-Rad Laboratories, Ltd.) using 15
µL aliquots for loadings of 7.5 µg of protein.
Results
Composition of each fraction
The composition of initial 2PCC skim (before centrifugation), clarified skim, cream
and precipitate fractions are shown in Figure 1. The data reported are averages of duplicate
trials, and the error bars represent the maximum and minimum range of values for the trials.
Centrifugation reduced the oil in the skim by about 50%, resulting in slightly increased
protein purity. This additional cream fraction was enriched with oil, but the oil was not as
concentrated as the EAEP cream was (70% compared to 12% oil).[1] Cream mass (before
rinse) was about 5-10% of the total sample mass, so there was probably much entrained
clarified skim in this fraction. The precipitate had about the same protein content as the
initial skim, but was enriched with solvent extractable material. One observation noted
during Mojonnier extraction was that the extracts of both the precipitate and cream had a
strong oil odor, similar to the odor of a commercial oil extraction plant, while the extract
from the clarified skim had a strong sweet aromatic scent. This may indicate other water-
soluble non-lipid compounds are being extracted from the skim during the Mojonnier
extraction.

143
Figure 1- Composition of fractions resulting from centrifugation of skim. All data are reported on dry basis. Error bars are the range of duplicate sample values.
Distribution of components among the fractions
The distributions of protein and oil among the three fractions are shown in Figure 2.
Again, reported values are means of duplicate samples, and the error bars represent the range
of values among the duplicates. All percentages are reported as fractions of the total amount
detected in the initial skim. About 36% of the Mojonnier extractable material remained in
the skim after centrifugation, with 19% recovered as cream, and 49% recovered in the
precipitate. This may indicate that a maximum of 20% of the oil in the skim can be
recovered as free oil, assuming the emulsion can be broken. Also, a sizeable fraction, 12%,
of skim proteins was lost to the precipitate. Soy protein is known to have a high oil binding
capacity, and can bind oil at oil-protein ratios of up to 1.4 (w/w). The oil-protein ratio for the
precipitate is about 0.34 (compared to about 0.09 for the skim). It is possible that protein
hydrolysis reduced the oil-binding capacity of the skim proteins.

144
Figure 2- Distribution of solids, oil, and protein among the three fractions recovered from skim by centrifugation.
Hexane extractability of oil in fractions
It is hypothesized that extrusion results in the formation of oil-protein complexes
through a free radical initiated polymerization reaction. To determine the amount of oil that
may be chemically bound to protein (and, hence, unrecoverable as free oil) fractions
separated by centrifugation were extracted with hexane in a Goldfisch apparatus and the
amount extracted compared to the amount of oil extracted by Mojonnier with acid hydrolysis
(Figure 3). It was assumed that the cream fraction was 100% hexane extractable, although it
was not analyzed because the sample size was too small. The precipitate was rich in free
(hexane extractable) oil, while the clarified skim was lean in free oil. This, along with the
SEC and SDS PAGE analysis (presented below) indicates that insoluble proteins
coprecipitate with oil which would otherwise be recoverable as cream. It is possible that if
these remaining proteins could be hydrolyzed, more oil could be recovered as cream. Oil

145
remaining in the clarified skim, on the other hand, is almost entirely bound to soluble species,
and is unrecoverable.
Figure 3- Distribution of free oil (extractable by hexane) and bound oil (difference between hexane extractable and total oil extracted by Mojonnier-acid hydrolysis).
Size-exclusion profiles of skim fractions
Size-exclusion profiles of fractions separated by centrifugal separation indicate that
the precipitate contained the largest proteins from the initial skim , with molecular weights
ranging from 10 to more than 50 kDa (Figure 4). Figure 5 shows that, while the quantity of
these large proteins has been reduced, their depletion is not complete. These proteins are
similar to those recovered from isoelectric precipitation (IEP) at pH 4.5 (Figure 6), although
IEP precipitates smaller proteins as well. SDS PAGE analysis of the centrifuged fractions
indicate that the precipitated proteins are rich in basic subunits of glycinin (Figure 7).
Microscopy of the solids fractions before and after EAEP (not shown) indicated that much of
the soy protein and oil were encased in an insoluble matrix. Protease hydrolyzes the
insoluble proteins, breaking up this matrix and releasing oil and soluble protein hydrolysates.

This and the results presented here indicate that, while hydrolysis incre
the hydrolysis-resistant subunits are not stable in solution. Upon storage or a freeze
cycle, these proteins form aggregates that are large enough to precipitate. While the profiles
of IEP precipitates and centrifuged precip
at the isoelectric pH.
Figure 4- SEC profiles of fractions recovered from centrifugation of skim. Total protein loadings were approximately equal. Relative peak sizes are not comparable.
Figure 5- SEC profiles of skim proteins before (initial skim) and after centrifugation (clarified skim). Both skim samples were diluted identically.
146
This and the results presented here indicate that, while hydrolysis increases protein solubility,
resistant subunits are not stable in solution. Upon storage or a freeze
cycle, these proteins form aggregates that are large enough to precipitate. While the profiles
of IEP precipitates and centrifuged precipitates are similar, precipitation is much more rapid
SEC profiles of fractions recovered from centrifugation of skim. Total protein loadings were approximately equal. Relative peak sizes are not comparable.
SEC profiles of skim proteins before (initial skim) and after centrifugation (clarified skim). Both skim samples were diluted identically.
ases protein solubility,
resistant subunits are not stable in solution. Upon storage or a freeze-thaw
cycle, these proteins form aggregates that are large enough to precipitate. While the profiles
itates are similar, precipitation is much more rapid
SEC profiles of fractions recovered from centrifugation of skim. Total protein loadings were approximately equal. Relative peak sizes are not comparable.
SEC profiles of skim proteins before (initial skim) and after centrifugation

Figure 6- SEC profiles of precipitated proteins from centrifugation and from isoelectric precipitation at pH 4.5. Total protein loadings were approximately equal.
Figure 7- SDS page profile of fractions centrifuged skim.
Particle size distribution of skim
Skim particle size distributions (PSD) are shown below
PSD is composed entirely of particles between 2
147
SEC profiles of precipitated proteins from centrifugation and from isoelectric Total protein loadings were approximately equal.
SDS page profile of fractions centrifuged skim.
Particle size distribution of skim
Skim particle size distributions (PSD) are shown below in Figure 8. The initial skim
ly of particles between 2 and 50 µm, with the most abundant particle
SEC profiles of precipitated proteins from centrifugation and from isoelectric Total protein loadings were approximately equal.
. The initial skim
m, with the most abundant particle

148
of 12 µm. The PSD's of the skim after centrifugation both with cream removed and with
cream redispersed shows that these largest particles are the insoluble protein aggregates
which make up the precipitate fraction. Skim with cream redistribution has two populations,
one with a peak at 0.25 µm and another at about 4 µm. Settling time calculations using the
density of oil showed that the larger population should cream in 15 min at 4000 rpm.
Separation of the clarified skim from the cream eliminates this larger population (clarity of
the skim was very high, and so the larger particles seen on this distribution were likely an
artifact of sampling noise. There was much variability of the distribution of these larger
particles).
Figure 8- Particle size distribution of initial skim (before centrifugation), clarified skim with cream redistributed, and clarified skim after cream separation.
In summary, about 40% of the oil remaining in the skim fraction is unrecoverable as
bound oil. The remaining oil exists as small oil droplets that probably aren't unstable toward
creaming, but probably do not cream in the initial centrifugation step because the droplet size

149
is too small. In either case, most of the free oil does not cream because of the presence of
insoluble protein aggregates that the oil adsorbs to. These results suggest two strategies that
may be used to increase oil recovery from the skim. One may be to try to break up the
insoluble aggregates by an additional hydrolysis (perhaps at low pH). A second method that
may help is allowing a long storage time before centrifugation to allow droplets to coalesce
and cream more easily.
Distribution of isoflavone among the fractions
Soy contains non-lipid compounds, principally isoflavones, that could be extracted
during Mojonnier extraction and distort the oil-content values. Therefore, isoflavone
compounds in the various skim fractions were quantified. The starting material contained 5.1
mg/g isoflavone compounds (preliminary value- only one analysis has been made).
Literature values for isoflavone in soy range from 1.9 to 9.5 mg/g.[4] The initial 2PCC skim
contained 5.4 mg/g (dry basis, preliminary) isoflavones. Based on reported solids yield from
the extraction process (80%) and the isoflavone content of the extruded soy starting material,
total isoflavone extraction yields were about 85% (i.e. 85% of the total isoflavones were in
the initial 2PCC skim fraction). The distribution of isoflavone compounds in intial skim after
centrifugation is shown in Figure 9. Values are reported below are as percentages of the total
material detected in whole skim.
About 13% of the isoflavone compounds precipitated with the precipitate. Isoflavone
has been seen to precipitate with proteins during isoelectric precipitation.[5] Clarified skim
and precipitation accounted for about 90% of total isoflavones. The solids mass of the cream
was not great enough for isoflavone determination (2 g samples are required).

150
Figure 9- Distribution of isoflavone among the pellet and skim fractions.
Ultrafiltration flux optimization
The full-factorial design experiment showed that all the tested parameters (cross flow
rate (CFR), transmembrane pressure (TPM), pH, and the presence of insoluble material) had
significant effects on the flux. Maximum flux occurred at conditions of high CFR, high
TMP, high pH, and in the presence of solids. Significant interactions occurred between TMP
and CFR, TMP and pH, and insolubles and pH, which can be seen in interaction plots in
Figure 10. Increasing CFR increased flux more at higher TMP. This is likely because at low
TMP, gel polarization would not be as extreme as at high TMP (and, hence, higher flux).
Since the CFR affects flux by reducing the gel polarization layer thickness, it follows that the
effect of the CFR would be reduced when gel polarization is less. The increase of flux
attributable to increase in TMP is less at pH 4.5 than at pH 8.9. This may be because near
the pI of soy proteins (i.e. pH 4.5), the proteins would be able to come in closer contact with

151
one another, creating a more compact gel polarization layer with a consequently greater
resistance. At high TMP, it would be expected that the gel polarization resistance would be
greater at pH 4.5 than at pH 8.9. The presence of insolubles had little effect at high pH, but
was very pronounced at pH 4.5. This is likely because the quantity of insoluble material was
much greater at pH 4.5 than at 8.9.
Advances in cation-exchange chromatographic recovery of permeate
polypeptides
Application of permeate from the ultrafiltration optimization experiment at pH 4 onto
a column using an H+ ionic form resin allowed the capture of up to 90% of the skim proteins
applied to the column. Results of multiple experiments using various conditions for both
application and elution are summarized below in Table 2. Unfortunately, the elution of the
bound proteins remained incomplete for all of the tested conditions, with the maximum
protein recovery in the elute being 42% of the applied proteins. Elution protein concentration
was also low, between 0.6 and 5 mg/mL, compared to 32 mg/mL protein content in the
applied sample. One complication of using an H+ form resin is the extreme pH transients
that occur as the elution counter ion or protein displaces protons on adsorption sites. Data in
Table 2 indicate that higher pH allows greater elution of proteins than low pH; therefore, it is
desirable to maintain better control of pH during elution. Converting the resin to Na+ form
prior to application did increase pH control during application, but not during elution, and
reduced the fraction of bound protein from 72 to 34%. Elution strategies utilizing resins
initially loaded with buffering species to create pH gradients on elution, such as are used in
chromatofocusing, may improve the desorption for this application.

152
Figure 10- Interaction plots of flux for ultrafiltration with: A) no in solubles, pH 4.5 and 8.9; B) pH 8.9 with and without insolubles; C) with insolubles at pH 4.5 and 8.9; D) pH 4.5 with and without insolubles.
Table 2- Summary of cation exchange experiments to recover skim permeate proteins.
Dateapplied
(CV)**
Fraction
bound
Fraction
eluted
(from total)
Fraction
eluted
(from bound)
Column formElution
salt
Elution
pH/stength
Elution
volume
10.23.09 2.44 73.5% 6.2% 8.4% H NaCl 4/10 mM 3 CV
10.26.09 2.44 71.6% 16.7% 23.3% H NaCl 4/ 10 mM 10 CV
11.16.09* 2.44 <18% Na
11.18.09 2.44 33.8% 20.4% 60.3% Na KCl 7.5/10 mM 10 CV
12.1.09 1.22 89.6% 42.3% 47.2% H KCl 8.5/100 mM 10 CV
12.03.09 1.22 85.4% 42.6% 50.0% H CaCl 8.5/100 mM 10 CV
* Sample was applied at pH 8.5
**Colummn volume (CV) was 8.2 mL

153
Conclusions
A precipitate of hydrolysis-resistant protein forms in skim upon storage after EAEP
of extruded flake and will bind most of the emulsified oil in skim. About 40% of the oil in
skim exists as covalently bound oil complexes that tend to stay in solution even after
aggressive centrifugation. Isoflavone compounds are not associated with any precipitate.
The presence of this precipitate does enhance flux during cross-flow filtration, however, and
its removal does not appear to be necessary. Cation-exchange chromatography using H+
form resin achieve very high binding of protein and demonstrated capabilities to recover
greater than 90% of the skim permeate proteins. Column elution strategies must be
improved, however, to realize this potential.
Acknowledgements
This project was supported by the USDA research grant number 2005-34432-16406
with additional funding from the Iowa State University Plant Science Institute. We would
like to thank Peter Bierschbach of Genencor, Intl., Juliana Nobrega de Moura, and the Iowa
State University Center for Crops Utilization Research for providing materials used for this
research.
References
1. de Moura, J. and L.A. Johnson, Two-Stage Countercurrent Enzyme-Assisted Aqueous
Extraction Processing of Oil and Protein from Soybeans. Journal of the American Oil
Chemists Society, 2009. 86(3): p. 283-289.

154
2. Wang, H.-J. and P.A. Murphy, Mass Balance Study of Isoflavones during Soybean
Processing. Journal of Agricultural and Food Chemistry, 1996. 44(8): p. 2377-2383.
3. de Moura, J., et al., Enzyme-assisted aqueous extraction of oil and protein from
soybeans and cream de-emulsification. Journal of the American Oil Chemists
Society, 2008. 85(10): p. 985-995.
4. Deak, N.A., New soy protein ingredients production and characterization, in Food
Science and Human Nutrition. 2004, Iowa State University: Ames. p. 291.
5. Rickert, D.A., et al., Effect of extraction pH and temperature on isoflavone and
saponin partitioning and profile during soy protein isolate production. Journal of
Food Science, 2004. 69(8): p. C623-C631.

155
APPENDIX 2. ECONOMIC ANALYSIS OF EAEP FROM EXTRUDED
SOY
Introduction
Although few economic analyses of EAEP systems are available in the literature, the
economics of aqueous processes are presumed to be poor because oil extraction yields are
lower than yields of hexane extraction processes. However, because of the mild processing
conditions of EAEP, the resulting skim fraction of soluble protein has the potential to be a
valuable co-product produced simultaneously with oil [1-3]. The objective of this study is to
analyze the economics of EAEP of soy and identify factors critical to the economic viability
EAEP of soy.
Materials and Methods
EAEP Process
The process that was studied is an extrusion-based, enzymatic extraction and
demulsification process developed at the Center for Crops Utilization Research at Iowa State
University [4] outlined in Figures 1a and 1b. The front-end of the process is identical to
traditional hexane-extraction processes, where soybeans are cracked, conditioned, and then
flaked. The EAEP process diverges where, instead of oil being extracted from flakes by
hexane, the flakes are extruded and added to water in a 1:10 solid-liquid ratio with 0.5%
(w/w dry basis) protease Protex 6L, and agitated in a CSTR at pH 9, 50 °C, for 1 h. The pH
is controlled by adding sodium hydroxide. After extraction, the fiber-rich solid, skim, and

156
cream fractions are separated by centrifugation. The solid fraction is 36% protein (dry basis),
and the remainder is mostly fiber, with some entrained soluble material. It is dried in a rotary
drier to be sold as soybean meal (SBM). The skim fraction is, on a dry basis, 55% protein,
5% oil, 7% ash, and the remainder soluble carbohydrates. The skim fraction is spray dried to
be sold as either a feed ingredient or a soy protein concentrate (SPC). The cream fraction is
demulsified by additional proteolysis, also with Protex 6L in a CSTR followed by centrifugal
separation into free oil and a second skim fraction. The second skim contains nearly 100%
of the original enzyme activity, and so this is recycled to the extraction step as the enzyme
source. A mass of enzyme necessary for 0.5% (w/w) concentration in the extraction step is
introduced into the system in the demulsification step to maximize demulsification kinetics
without increasing enzyme use. Equipment sizes and process yields were based on bench-
scale laboratory data. Since the kinetics of the extraction has not been characterized, the
residence times are assumed to be equal to the laboratory-scale batch extractions. This is
probably not a reasonable assumption, but it will be shown that this is not a critical factor for
economic viability.
Process Simulation
The design basis was 1000 metric tons per day of soybean processed, equivalent to a
small hexane extraction plant. This was chosen so that comparisons could be made with
commercial hexane extraction processes, for which economic information is available in the
literature [5]. The operating factor was 330 days per year. Raw material costs and product
revenues are shown in Table 1. Process simulations, material and energy balances,
equipment sizing, economic analysis calculations were done using SuperPro Designer®

157
software from Intelligen, Inc., Scotch Plains, NJ. The analysis used default values for steam
and electricity costs, which were $4.20/ton and $0.10/kW-h, respectively. All prices were
corrected to 2007 dollars using the producer price index of 230, as listed for non-organic
chemical manufacturers by the U. S. Bureau of Labor Statistics [6].
Results and Discussion
The initial capital estimate was determined using default equipment sizes, costs, and
energy usage as determined by SuperPro Designer®. The direct fixed capital (DFC) estimate
was very high, totaling $741,000,000. The working capital and start-up cost estimates were
$25,000,000 and $37,000,000, respectively, making the total investment $803,000,000. The
corresponding operating costs and revenues are shown in Table 2 and Table 3, respectively.
Total operating cost was $420,000,000. With the revenues estimated to be $221,000,000, the
process as is obviously far from being profitable.
Ninety percent of the total operating costs were from raw materials, electricity, and
facility costs (i.e. depreciation, maintenance, and insurance) at 31, 26, and 33%, respectively.
Since the raw material costs were taken directly from producer budget-level quotes or recent
market data, confidence in these values is high. The greatest uncertainty in operating cost is
the facility cost, which is estimated based on the capital cost of the plant. Indeed, a capital
cost of nearly $1 billion for a small soybean processing plant is extreme, especially since
EAEP was presumed to be less capital intensive than hexane extraction. The capital cost of a
greenfield 1,000 MT/day hexane extraction plant ranges from $43,000,000 to $63,000,000
(2007 prices) [5]. Therefore, the EAEP capital estimate requires some revision.

158
The equipment costs determined by SuperPro Designer® default parameters are
shown below in Table 4. The three most expensive unit operations are the centrifuges,
extractors, and extruders. The software determined that 171 disk-stack centrifuges would be
necessary to perform the required separation, which at $450,000 each makes this by far the
most expensive unit operation of the process. Individual centrifuge throughput is 11 gpm of
slurry, a very small quantity compared to disc-stack centrifuges used in protein-starch
separation in corn wet-milling processes, which are capable of throughput as high as 2000
gpm. Large capacity centrifuges are capable of achieving 4,000 x g (the value that was used
in laboratory batch centrifugation separation). So, there probably are centrifuges of similar
throughput that would be adequate for the required three-phase separation. It would still be
advantageous to consult a centrifuge expert to confirm this, but for the purposes of this
report, it was assumed that the plant would operate with two centrifuges costing $450,000
each, the unit cost estimated by the software.
The cost for reactors is much too high as well. All of the process vessels are little
more than insulated stainless steel tanks with baffles and agitators. In 2003, a process
engineer in industry typically used $1.00 to $1.50 per gallon of capacity as a rule-of-thumb
cost factor for field-erected stainless-steel tanks with agitators. Based on software-
determined tank sizes and purchase costs, this factor would be $5 and $11 per gallon for the
extractors and demulsifiers, respectively, several times greater than what I know to be
realistic estimation factors.
Finally, the capital cost estimate for the extruders is too high, as well. There are
commercially available extruders designed specifically for extruding full fat soy for animal
feed at rates of up to 8,500 kg/h [7]. Only five extruders would be required for the desired

159
throughput, rather than 31 as determined by the software. These extruders cost
approximately $200,000 each, resulting again in a significant capital cost reduction.
These gross overestimates of cost may result from the fact that SuperPro Designer®
was developed to model processes for the production of specialty, low volume bioproducts
that require tightly controlled processing conditions, rather than for high-volume commodity
materials as is the current design case. This can be illustrated by analyzing the software
calculation of the total capital cost estimate. The total capital cost estimate is sum of the
working capital, start-up capital, and DFC of the plant. DFC is based on the total purchase
cost (TPC) of the major process equipment multiplied by factors relating DFC to costs for
buildings, piping, etc. For this case, the software used a factor of about 6.1 to determine
DFC. Fiala puts the factor relating TPC and DFC somewhere between 2.5 and 3.5 for
commodity production facilities[5].
Results and Discussion of Process Using Revised Assumptions
The process was re-evaluated using the revised assumptions outlined in Table 5.
Other changes shown in Table 5 that were not discussed above were the conditioner unit
operation and unit operation power requirements. The software did not have a unit operation
option equivalent to a soybean conditioner, so the purchase price was assumed to be equal to
a rotary dryer used in drying soybean meal, since the unit operations use very similar
designs. Power requirement estimate for the extruders was based the manufacturer literature.
For centrifuges, power requirements were based on personal experience in a corn wet-milling
plant. Several unsuccessful attempts were made to contact centrifuge vendors for more
specific information, so there is still a large degree of uncertainty with these numbers.

160
However, as will be shown, this uncertainty is minor compared to affects of uncertainty in
the value of the skim fraction.
The resulting capital cost, DFC calculation, and operating costs from these revised
assumptions are summarized in Tables 6 and 7. The revised capital estimate for the plant is
$21,000,000, less than half of the cost of a new hexane extraction plant, making the annual
operating expenses $201,000,000. As the revenues have not changed, this estimate suggests
the plant is very profitable, with an annual net profit of $17,700,000 and a return on
investment of 44%, shown in Table 8. Still, some numbers need further scrutiny before
solid conclusions on profitability can be made.
Income from the skim fraction appears to be the most critical factor for the economic
viability of EAEP. It can be seen by comparing the revenues in Table 3 to operating costs in
Table 7 that income from both oil and SBM together will only cover about 77% of the
soybean cost alone, not to mention other expenses. Even with 100% oil yield, SBM and oil
revenues will only total about $110,000,000, still less than soybean costs, and revenues from
the skim must make up at least 40% of the total revenues just to break even. This may be
expected because the yield of SBM from EAEP is significantly less than the SBM yield
obtained from hexane extraction, since in EAEP the solids in the skim are extracted from the
SBM fraction. In the current market, profit margins are generally very tight and small
differences in yield make the difference between profit and loss for most producers. For
EAEP, the loss in SBM yield must be made up by adding value to the skim fraction. On a
side note, since enzyme costs are often the determining economic factor in enzyme-based
processes, it is encouraging to note that the cost of enzyme only makes up about 8% of the
total operating cost.

161
While confidence in the value of the oil is high, the same is not true of the value of
the co-products. First, the SBM is lower in protein than current market SBM products, at
about 36%. The price was based on commercially available SBM grades, which are 44-48%
protein. Second, the estimated market price of SPC used was based on a an economic
analysis completed more than 30 years ago [3], and so more investigation into the value of
this product must be made before the profitability of this process can be conclusively
determined. Furthermore, the entire assumption that the skim fraction would produce a
valuable protein concentrate is unsubstantiated, especially since extruded, hydrolyzed
proteins may have very poor functionality compared to native soy proteins.
A more likely application for the skim fraction is as an easily digested animal feed.
The only reason this was not studied in the present case was because the cash value of such a
product was not readily available. Using this product as an animal feed would fit into the
broader concept of the integrated biorefinery very well since the skim could be used as a wet
feed on-site. If the product did not need to be shipped or stored for a long period, drying
costs could be reduced or eliminated.
Conclusions
Using the default equipment sizes and cost factors from the SuperPro Designer®
software resulted in erroneously high capital and operating cost estimates. Using equipment
sizes, costs, and factors based on actual industrial processes and vendor information resulted
in a capital estimate that was about 40% the capital cost of a hexane extraction plant. Based
on the revised capital and operating costs and estimated revenue streams, this process has the
potential of being very profitable.

162
The revenue generated from the skim fraction is the most critical factor in the EAEP
plant profitability, which must account for more than 40% of the total revenues to break
even. Since the assumptions made in determining the cash value of the skim fraction are
unsubstantiated, further evaluation of the potential products of this fraction must be done
before definitive conclusions of the profitability of this process can be made.

Figures
Cracking mi ll / GR-101
Grinding
Conditioner / HX-101
Heating
Flaking mi ll / GR-102
Grinding
Extruder / XD-101
ExtrusionCream centr. / DS-101
Oi l cent. / DS-102
Centrifugation
Cracked bean
Cond beanFlakes
Soybean
Oi l
Extractor / V-102
Equil ibrium Reaction
Demulsification / V-101
Equil ibrium Reaction
Extr. slurry
P6L
Treated cream
2nd meal
2nd skim
NaOH tank / V-103
Blending / Storage
NaOH waterNaOH
PW heater / HX-102
Heating
Process Water
Extruded soy
10% NaOH
Hot PW
To Cream
centrifuge
Solids to
rotary drier
Cream from
centrifuge
Figure 1a- Diagram of an extrusion-based enzymatic extraction and demulsification process for soy oil extraction
163

164
Figure 1b- Diagram of an extrusion-based enzymatic extraction and demulsification process for soy oil extraction continued from right hand side of Figure 1a.
Cream centr. / DS-101
Centrifugation
P-7 / MX-101
Mixing
Meal
Extr. slurry
Cream
Meal dryer / RDR-101
Rotary Drying
SPC drying / SDR-101
Spray Drying
1st skim
SPC
Wet meal
Dry meal
MD inlet air
MD outlet air
SPCD inlet air
SPCD outlet air
Slurry
from
Extractor
Cream to
demulsifier
Solids from
demlusifier

165
Tables
Table 1- Raw material and revenue values assumed for economic analysis. SPC = soy protein concentrate, SBM = soybean meal.
a Chicago Board of Trade [8]. b Genencor, Inc [9]. c ICIS Pricing Services [10]. d Rathbun Rural Water, Inc [11]. e Cater et al. [3], adjusted to 2007 values
Table 2- Annual operating costs for EAEP plant using default cost factors.
Material Unit cost Unit ref
Raw material streams
Soybean $10.50 Bu a
Protex 6L $11.00 kg b
Sodium hydroxide $300.00 ton c
Water $3.50 1000 gallons d
Revenue streams
SPC $1.47 kg protein e
$0.85 kg SPC
SBM $0.33 kg a
Oil $1.00 kg a
Cost (2007 $) %
Raw Materials
Soybean 130,000,000$ 31%
Protex 6L 17,000,000$ 4%
Water 2,800,000$ 1%
Sodium Hydroxide 870,000$ 0%
Utilities
Electricity 96,430,000$ 23%
Steam 26,430,000$ 6%
Labor 5,780,000$ 1%
QA 870,000$
Facilities 139,000,000$ 33%
Total annual operating cost 419,180,000$
Cost Item

166
Table 3- Annual revenues from EAEP product streams.
Table 4- Major equipment cost and Direct Fixed Capital cost estimate of the EAEP plant using SuperPro Designer® default cost factors and parameters.
Product
Qty
produced
(*10-6
kg)
Unit price Revenue
Oil 52.6 1.00$ 52,600,000$
SBM 151.9 0.32$ 48,608,000$
SPC 148.5 0.85$ 126,225,000$
Total revenue 227,433,000$
Equipment QtyUnit cost
(2007 $)
Total cost
(2007 $)
Cracking mill 1 197,000 197,000
Conditioner 1 1,000 1,000
Flaking Mill 1 197,000 197,000
Extruder 31 222,000 6,882,000
Extractor 13 745,000 9,685,000
Cream centrifuge 170 445,000 75,650,000
Demulsifier 1 583,000 583,000
Oil centrifuge 1 88,000 88,000
Spray dryer 2 373,000 746,000
Meal dryer 22 64,000 1,408,000
NaOH tank 1 186,000 186,000
Process water heater 1 16,000 16,000
Unlisted equipment 23,950,000
Total Purchased
Equipment Cost (TPC) 119,589,000$
Direct Fixed Capital (6.1 x TPC) 741,000,000$

Table 5- Initial and revised equipment size, cost, and power requirement assumptions used for capital cost and operating cost estimates of the EAEP plant.
Equipment Qty Size Unit cost Total costPower
ConsumptionQty Size Unit cost Total cost
Power
Consumption
Extruders 31 1500 kg/hr 222,000$ 6,882,000$ 1 kW-hr/kg 5 8500 kg/hr 200,000$ 1,000,000$ 0.05 kW-hr/kg
Extractors 13 37,600 L 754,000$ 9,802,000$ 4 133,000 L 52,500$ 210,000$
Demulsifier 1 13,300 L 583,000$ 583,000$ 1 13,300 L 5,250$ 5,250$
NaOH tank 1 3,900 L 186,000$ 186,000$ 1 3,900 L 2,000$ 2,000$
Centrifuges 170 43 L/min 440,000$ 74,800,000$ 40,000 kW ea. 2 3,700 L/min 450,000$ 900,000$ 250 kW ea.
Conditioner 1 42,000 kg/hr 1,000$ 1,000$ 1 42,000 kg/hr 64,000$ 64,000$
Default values Revised values
167

168
Table 6- Major equipment cost and Direct Fixed Capital cost estimate of the EAEP plant using revised cost factors and parameters.
Equipment QtyUnit cost
(2007 $)
Total cost
(2007 $)
Cracking mill 1 197,000 197,000
Conditioner 1 65,000 65,000
Flaking Mill 1 197,000 197,000
Extruder 5 200,000 1,000,000
Extractor 4 52,500 210,000
Cream centrifuge 2 450,000 900,000
Demulsifier 1 52,500 52,500
Oil centrifuge 1 88,000 88,000
Spray dryer 2 373,000 746,000
Meal dryer 22 64,000 1,408,000
NaOH tank 1 2,000 2,000
Process water heater 1 16,000 16,000
Unlisted equipment 1,200,000
Total Purchased
Equipment Cost (TPC) 6,081,500$
Direct Fixed Capital (3.5 x TPC) 21,250,000$

169
Table 7- Annual operation costs for the EAEP plant using revised cost factors.
Table 8- Profitability analysis of the EAEP plant using revised cost factors and assumptions.
Cost (2007 $) %
Raw Materials
Soybean 130,000,000$ 65%
Protex 6L 17,000,000$ 8%
Water 2,800,000$ 1%
Sodium Hydroxide 870,000$ <1%
Utilities
Electricity 17,800,000$ 9%
Steam 26,430,000$ 13%
Labor 2,100,000$ 1%
QA 300,000$ <1%
Facilities 4,200,000$ 2%
Total annual operating cost 201,500,000$
Cost Item
Total investiment
DFC 21,247,000 $/yr
Working capital 17,889,000 $/yr
Start-up costs 1,062,000 $/yr
Subtotal 40,198,000 $/yr
Revenues
Oil 52,561,000 $/yr
SBM 48,605,000 $/yr
SPC 126,192,000 $/yr
A Subtotal 227,358,000 $/yr
B Operating costs 201,295,000 $/yr
C Gross profit (A-B) 26,063,000 $/yr
D Taxes (40%) 10,425,000 $/yr
E Net profit (C-D + depreciation) 17,656,000 $/yr
Gross margin 11.5 %
Return on investment 44.0 %
Paypack period 2.3 years

170
References
1. Rosenthal, A., D.L. Pyle, and K. Niranjan, Aqueous and enzymatic processes for
edible oil extraction. Enzyme and Microbial Technology, 1996. 19: p. 403-429.
2. Rosenthal, A., et al., Combined effect of operational variables and enzyme activity on
aqueous enzymatic extraction of oil and protein from soybean. Enzyme and Microbial
Technology, 2001. 28: p. 499-509.
3. Cater, C.M., R.D. Hagenmaier, and K.F. Mattil, Aqueous extraction- an alternative
oilseed milling process. Journal of the American Oil Chemists' Society, 1974. 54(4):
p. 137-141.
4. de Moura, J., et al., Enzyme-assisted aqueous extraction of oil and protein from
soybeans and cream de-emulsification. Journal of the American Oil Chemists
Society, 2008. 85(10): p. 985-995.
5. Fiala, R.J., Cost Estimates for Soybean Processing and Soybean Oil Refining, in
Practical Handbook of Soybean Processing and Utilization, D.R. Erickson, Editor.
1995, AOCS Press: Champaign, IL. p. 519-535.
6. Producer Price Indexes. 2007 11/24/2007; Available from: http://data.bls.gov/cgi-
bin/surveymost?pc.
7. Annan, R., Extru-Tech, Inc. 2007. p. Personal correspondence.
8. Futures Tick Data Download - Soybeans Futures. 2007 11-20-07; Available from:
http://cbotdataexchange.if5.com/DataTick_F_Download.aspx?symbol=S/F.CBOT.
9. Bierschbach, P., Genencor, Inc., K. Campbell, Editor. 2007. p. Personal
correspondence.
171
10. INDICATIVE CHEMICAL PRICES. 2007 11-27-07; Available from:
http://www.icis.com/StaticPages/a-e.htm#C.
11. Rathbun Rural Water Association. 2007. p. Personal comminication.

172
APPENDIX 3. DERIVATION OF EQUATION 7 FROM CHAPTER 3
The value of Pe,t is the sum of the contributions from Pe,i, and Pe. For Pe, the
contribution comes from solving the rate expression
� ����� � �� � ��� (1)
where k1 and k3 are the first order kinetic parameters as shown in Figure 9. The expression
for P1 is found by solving the rate expression for P1:
� �� �� � �� � ��� (2)
which, integrating from P1,o to P1 and solving for P1, gives
� ,�!�� � (3)
with / � � � ��. P2 is found by solving the expression
� ����� � ��� � ��� � ���� (4)
for initial condition for P2 = 0 giving
� � ��� ,0����
�!�� � � !����� (5)
with /� � �� � �� .

173
Substituting (5) and (3) into (1) and integrating from time zero to t, combining like terms,
and adding the Pe,i term gives the general expression for extracted oil:
�,� � �,� � ,� ��� � �
� ����� ����� � �!�� � � 1� � ����
������� � �!���� � 1�" (6)