protein interaction networks as metric spaces - a novel perspective on distribution of hubs
DESCRIPTION
Protein Interaction Networks as Metric Spaces - A Novel Perspective on Distribution of HubsTRANSCRIPT
Fadhal et al. BMC Systems Biology 2014, 8:6http://www.biomedcentral.com/1752-0509/8/6
RESEARCH ARTICLE Open Access
Protein interaction networks as metric spaces:a novel perspective on distribution of hubsEmad Fadhal1, Junaid Gamieldien1 and Eric C Mwambene2*
Abstract
Background: In the post-genomic era, a central and overarching question in the analysis of protein-proteininteraction networks continues to be whether biological characteristics and functions of proteins such as lethality,physiological malfunctions and malignancy are intimately linked to the topological role proteins play in the networkas a mathematical structure. One of the key features that have implicitly been presumed is the existence of hubs,highly connected proteins considered to play a crucial role in biological networks. We explore the structure of proteininteraction networks of a number of organisms as metric spaces and show that hubs are non randomly positionedand, from a distance point of view, centrally located.
Results: By analysing how the human functional protein interaction network, the human signalling network,Saccharomyces cerevisiae, Arabidopsis thaliana and Escherichia coli protein-protein interaction networks from variousdatabases are distributed as metric spaces, we found that proteins interact radially through a central node, high degreeproteins coagulate in the centre of the network, and those far away from the centre have low degree. We further foundthat the distribution of proteins from the centre is in some hierarchy of importance and has biological significance.
Conclusions: We conclude that structurally, protein interaction networks are mathematical entities that shareproperties between organisms but not necessarily with other networks that follow power-law. We therefore concludethat (i) if there are hubs defined by degree, they are not distributed randomly; (ii) zones closest to the centre of thenetwork are enriched for critically important proteins and are also functionally very specialised for specific ‘housekeeping’ functions; (iii) proteins closest to the network centre are functionally less dispensable and may present goodtargets for therapy development; and (iv) network biology requires its own network theory modelled on actualbiological evidence and that simply adopting theories from the social sciences may be misleading.
Keywords: Protein interaction networks, Metric spaces, Core-periphery structure, Topological centrality, Hubs,Essential proteins, Power-law graphs
BackgroundIn the post-genomic era, an overarching question in theanalysis of protein-protein interaction (PPI) networkscontinues to be whether biological characteristics andfunctions of proteins such as lethality, physiological mal-functions and malignancy are intimately linked to thetopological role proteins play in the network [1,2]. It hasbeen established that protein interaction networks (PINs)have small-world and scale-free properties [3]. Muchof the recent efforts in the analysis of protein-protein
*Correspondence: [email protected] of Mathematics and Applied Mathematics, University of theWestern Cape, P/Bag X17, Bellville, South AfricaFull list of author information is available at the end of the article
interaction networks has focused on finding functionaldependencies between the so-called hubs and their topo-logical roles in the network [4,5]. What has made the effortthe more difficult is that various researchers have definedhubs from various points of view [6]. However, almost uni-versally, it has been assumed that these hubs are proteinshaving a high degree (number of interactions) and that arerandomly placed in the network and have important func-tional roles [4,7-10]. In a sense, it has been assumed thateach hub or a specialised set of hubs somehow controlsa sub-network that may constitute a pathway, functionalmodule or a process [11-13]. Because of this, in defin-ing many of the proposed metrics in PINs, the degree ofnodes has prominently featured. It is appealing to givesubstantial import to these metrics because some of them
© 2014 Fadhal et al.; licensee BioMed Central Ltd. This is an Open Access article distributed under the terms of the CreativeCommons Attribution License (http://creativecommons.org/licenses/by/2.0), which permits unrestricted use, distribution, andreproduction in any medium, provided the original work is properly cited.

Fadhal et al. BMC Systems Biology 2014, 8:6 Page 2 of 11http://www.biomedcentral.com/1752-0509/8/6
show levels of statistical significance that may not easilybe dismissed.
In that respect, for instance, it has been shown that inPINs, proteins of high degree are three times more likelyto be lethal than the other proteins [5]. Due to this obser-vation, network theory metrics such as degree centrality,closeness centrality [14], betweenness centrality [15], andcluster coefficients [16], to name a few, have been pro-posed as ways to identify functionally important proteinsin PINs. Whilst these metrics have their relevance, theydo not enable the evaluation and analysis of networks astopological entities. Many previous studies on the anal-ysis of complex network used closeness centrality as away to find the core central proteins and applied it inseveral areas such as to extract the metabolic core of anetwork [17], to visualise large scale complex networksin two dimensions [18], to identify drug targets [19,20],to identify essential genes in Escherichia coli [21] and todetermination of dynamics of the cell-cycle networks [22].Moreover, they used centrality measures which ultimatelygive weighting to nodes and do not attempt to identifythe exact positions of nodes within the network [23].Previously considered metrics have, however, implicitlyassumed randomness of the distribution of hubs [3,24,25].Because of the commonality in distribution of networksthat follow power-law, some have gone as far as consid-ering PINs in the same manner as social networks [26].In point of fact, networks of protein interactions havebeen shown in separate organisms to form, in varyingdegree of statistical significance, scale-free networks inwhich the distribution of degrees of nodes is power-law[27,28]. It has thus been assumed that this property cap-tures the essence of the pertinent features of the networks.In this article, it will become evident that paralleling thesystems theory that has been developed in social net-works to biological networks may not reveal a clearerpicture.
The point of departure from these previous studies isthat we model PPI graphs as metric spaces, which are well-defined topological spaces with a long history and deeptheory [29,30]. This precise strategy provides a powerfulway to view PINs in their entirety from a spatial point ofview, using distance as the key modeling measure. Whilewe do not attempt to weight proteins, it enables us topinpoint exactly where nodes are located in respect toeach other, even in very large PINs with several hundredthousands of proteins and many interactions. By identi-fying the network centre(s) using a formal method thatidentifies the protein(s) that have the smallest maximaldistance to other proteins in the network, and then cat-egorizing all proteins into zones based on distance fromthe centre, we are able to find exactly where any protein islocated relative to the centre and its corresponding neigh-bours in the network at large. We show here that modeling
and analysing PINs from several sources and organismsin this much more precise manner than can be achievedwith centrality metrics reveals deep shared core-peripherytopological pattern, and we also present strong evidenceof its functional significance.
Results and discussionMultiple protein interaction networks from differentorganisms all have single topological centresWhile the Human Functional Protein Interaction Network(HPFIN), the Human Signalling Network (HSN) andmultiple sources of Saccharomyces cerevisiae, Arabidop-sis thaliana and Escherichia coli PINs all appear to bepower-law distributed as expected (see Additional file 1:Figures S1a, S1b, S1c, S1d and S1e), we modelled eachone of the PINs as metric spaces in order to identify eachnetwork’s topological centre(s) and to classify remainingproteins into ‘zones’ based on graph theoretic distancefrom the central protein. Zone 1, for example, refers toproteins which are 1 step from the topological centre,zone 2 is 2 steps away, etc. By modelling the giant com-ponent of each PIN in this manner, we found that despiteour method’s inevitable ability to identify multiple topo-logical centres if they exist, all PINs analysed had only asingle central protein that have key biological functions.The centres of the HFPIN and the HSN, MAPK14 andMAPK1 respectively, belong to the same protein familyand play similar key roles in signal transduction [31] andthe centre of the Arabidopsis thaliana PIN is AT1G78300,which plays a key role in brassinosteroid mediated sig-naling [http://www.ncbi.nlm.nih.gov/pubmed/17681130].Saccharomyces cerevisiae has SSC1, involved in stressresponse [http://www.molbiolcell.org/content/22/5/541.full] at the centre of its PIN and Escherichia coli has rpsB,a ribosomal protein S2 that is an essential component ofthe organisms translation machinery [http://www.ncbi.nlm.nih.gov/pubmed/23104805].
PINs analysed as metric spaces form a dense core/sparseperiphery structureThe majority of proteins in PINs are located in zones1–3. For the HFPIN and the HSN respectively, 92% and95% proteins are in these zones. The same phenomenonis observed in Saccharomyces cerevisiae, Arabidopsisthaliana and Escherichia coli, albeit with varying pro-portionality (Table 1). When analysing zones as inducedsub-networks, we found in all cases that zone 1 is the mosthighly connected with few quills, if any. Zone connectivitydecreases with increasing distance from the centre, withzone 2 having some quills (nodes with degree 1) and zone3 having many more quills (see the numbers of quills inTable 1). Beyond zone 3, due to very low connectivity, theinduced subgraphs disintegrate into many componentsand in the zones on the fringes there are only quills.

Fadhaletal.BMC
SystemsBiology
2014,8:6Page
3of11
http://w
ww
.biom
edcentral.com/1752-0509/8/6
Table 1 Degree distribution of PINs with respect to the centre
Organism Nodes Edges Diameter Centre Zones around centre
1 2 3 4 5 6 7 8 9
Homo sapiens 9448 181706 13 MAPK14
374 4610 3464 578 104 14 2 1 1 Nodes
86 32 52 2 2 1 1 2 1 Average degree
3 1 1 1 1 1 1 2 1 Lowest degree
531 430 393 14 6 2 2 2 1 Highest degree
0 173 653 307 56 12 1 0 1 No of quills
HSN 6291 62737 11 MAPK1
431 3527 1929 206 38 4 Nodes
67 24 7 2 2 3 Average degree
1 1 1 1 1 1 Lowest degree
451 362 89 11 9 5 Highest degree
4 404 757 133 20 2 No of quills
Saccharomyces cerevisiae 5033 22417 10 SSC1
175 1639 2517 565 69 9 Nodes
34 14 4 1 1 1 Average degree
1 1 1 1 1 1 Lowest degree
209 282 109 11 4 1 Highest degree
1 92 609 327 57 9 No of quills
Arabidopsis thaliana 2953 6783 16 AT1G78300
134 216 799 825 443 130 20 5 4 Nodes
3 11 6 3 2 1 1 3 2 Average degree
1 1 1 1 1 1 1 1 1 Lowest degree
62 117 79 43 26 12 4 6 3 Highest degree
81 60 180 355 234 80 10 1 1 No of quills
Escherichia coli 2949 12689 12 rpsB
151 1089 976 260 38 6 Nodes
37 12 3 1 1 1 Average degree
1 1 1 1 1 1 Lowest degree
178 127 56 6 3 2 Highest degree
1 213 349 166 30 5 No of quills

Fadhal et al. BMC Systems Biology 2014, 8:6 Page 4 of 11http://www.biomedcentral.com/1752-0509/8/6
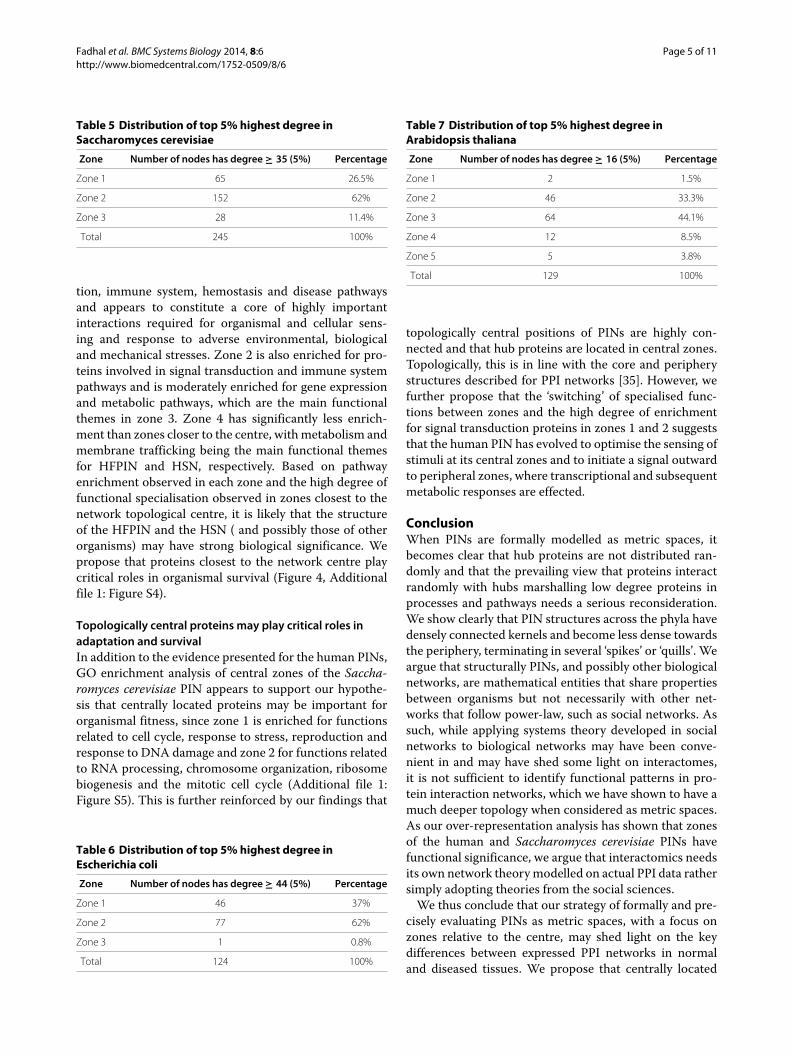
An interesting pattern emerged when we assessed thedistribution of the top 5% most highly connected pro-teins of each network across its zones. Overall, we see thatthese proteins coagulate in zones closer to the centre ofthe networks (Tables 2, 3, 4, 5, 6 and 7). When removinga potentially erroneous dense complete subgraph in zone3 of the HFPIN consisting of 330 zinc finger proteins, themajority of the most highly connected proteins are locatedin zones 1 and 2. The same is observed for both the HSNand E. coli. While Saccharomyces and Arabidopsis PINshave a similar general pattern, they also have some of theseproteins in zone 3, with the latter having an additional 9%in its zones 4 and 5.
It is therefore clear that across the phyla and regardlessof network size, PINs form a structure that has a denselyconnected kernel and a less dense periphery, which termi-nates in ‘quills’ or ‘spikes’ (Figure 1). Furthermore, topo-logically central zones are highly connected and have onlyfew proteins of low degree, which suggests a non-randomdistribution of hub proteins. It has previously been shownthat evolutionarily older proteins have higher degree [32]and that loss and gain of protein-protein interaction sitesare driven by evolutionary mechanisms [33] and there-fore constrained by positive (Darwinian) and negative(purifying) selection. We therefore deem it reasonable toconclude that the core-periphery topologies uncovered byour method are themselves evolved and have functionalsignificance and importance.
There is no phenomenal change (see Additional file 1:Figures S2, S3a, S3b, S3c and S3d) when the analysis isdone on different PINs from different database sources.All the results from the analysis of PINs when treated asmetric spaces confirm that PINs have a densely connectedkernel and becomes less dense towards the periphery,terminating in several ‘spikes’ or ‘quills’.
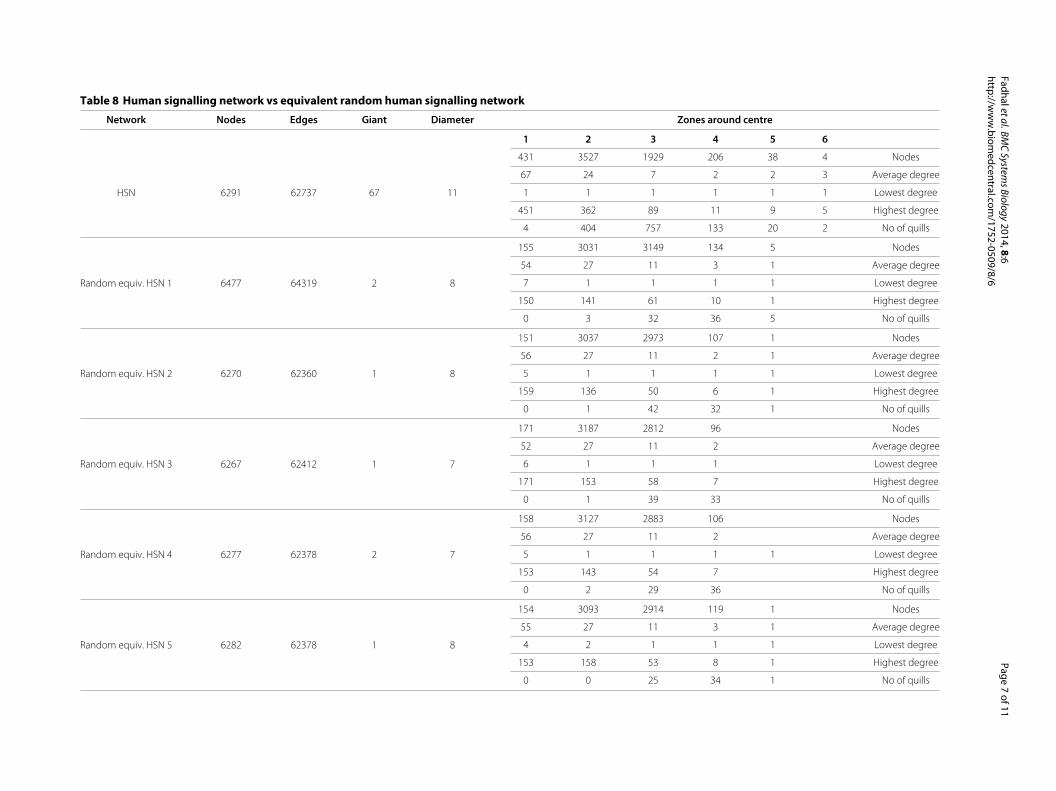
Protein network topologies are not consistent withrandom graphsThe striking similarity across the kingdoms suggests thatthese network topologies have functional significance andare evolved rather than random, especially since the num-ber of proteins and interactions differ widely. In order totest this hypothesis, we performed a comparison of the
Table 2 Distribution of top 5% highest degree in humansignalling network
Zone Number of nodes has degree ≥ 95 (5%) Percentage
Zone 1 106 34.6%
Zone 2 197 64.4%
Zone 3 0 0%
Total 306 100%
Table 3 Distribution of top 5% highest degree in HFPINwithout complete graph
Zone Number of nodes has degree ≥ 200 (5%) Percentage
Zone 1 39 54.9%
Zone 2 32 45.1%
Zone 3 0 0%
Total 71 100%
biological networks to a large number of computationally-generated uniform random power law graphs [34] withsimilar properties in terms of numbers of nodes and edges(interactions). In general, while all PINs have a singlecentre and large diameter, their random power-law equiv-alents often have multiple centres and significantly smallerdiameters. PPI datasets also represented many compo-nents with a single giant component, while the randomgraphs consistently had at most 2 components. The num-ber and distribution of quills, nodes of degree 1, is alsoremarkably different, with PINs having a high number ofnodes with low degree in comparison to uniform randompower-law graphs (Table 8). This distorts archetypicalpower-law distribution of nodes. Furthermore, each PINhas a small number of nodes that have remarkably higherdegrees than the highest degree nodes of the uniform ran-dom power-law graphs (Figures 2 and 3). The significantincongruence of topological patterns between PINs andrandom graphs add further plausibility to our hypoth-esis that the biological networks arose through positiveselection.
Central zones of human PINs are functionally specialisedIn order to assess whether the observed topological pat-terns have potential functional significance, we performedpathway enrichment analysis and observed strong zone-specific functional enrichment in the first four zones ofthe HFPIN and the HSN . Moreover, those zones alsoappear to be functionally specialised with most proteinsin a zone belonging to the top four enriched pathways,while the outer zones are much more functionally diver-sified (Table 9, Additional file 1: Table S1). Zone 1 ishighly enriched for proteins involved in signal transduc-
Table 4 Distribution of top 5% highest degree in HFPINwith complete graph
Zone Number of nodes has degree ≥ 200 (5%) Percentage
Zone 1 39 8.5%
Zone 2 32 7.6%
Zone 3 380 83.9%
Total 458 100%
Fadhal et al. BMC Systems Biology 2014, 8:6 Page 5 of 11http://www.biomedcentral.com/1752-0509/8/6
Table 5 Distribution of top 5% highest degree inSaccharomyces cerevisiae
Zone Number of nodes has degree ≥ 35 (5%) Percentage
Zone 1 65 26.5%
Zone 2 152 62%
Zone 3 28 11.4%
Total 245 100%
tion, immune system, hemostasis and disease pathwaysand appears to constitute a core of highly importantinteractions required for organismal and cellular sens-ing and response to adverse environmental, biologicaland mechanical stresses. Zone 2 is also enriched for pro-teins involved in signal transduction and immune systempathways and is moderately enriched for gene expressionand metabolic pathways, which are the main functionalthemes in zone 3. Zone 4 has significantly less enrich-ment than zones closer to the centre, with metabolism andmembrane trafficking being the main functional themesfor HFPIN and HSN, respectively. Based on pathwayenrichment observed in each zone and the high degree offunctional specialisation observed in zones closest to thenetwork topological centre, it is likely that the structureof the HFPIN and the HSN ( and possibly those of otherorganisms) may have strong biological significance. Wepropose that proteins closest to the network centre playcritical roles in organismal survival (Figure 4, Additionalfile 1: Figure S4).
Topologically central proteins may play critical roles inadaptation and survivalIn addition to the evidence presented for the human PINs,GO enrichment analysis of central zones of the Saccha-romyces cerevisiae PIN appears to support our hypothe-sis that centrally located proteins may be important fororganismal fitness, since zone 1 is enriched for functionsrelated to cell cycle, response to stress, reproduction andresponse to DNA damage and zone 2 for functions relatedto RNA processing, chromosome organization, ribosomebiogenesis and the mitotic cell cycle (Additional file 1:Figure S5). This is further reinforced by our findings that
Table 6 Distribution of top 5% highest degree inEscherichia coli
Zone Number of nodes has degree ≥ 44 (5%) Percentage
Zone 1 46 37%
Zone 2 77 62%
Zone 3 1 0.8%
Total 124 100%
Table 7 Distribution of top 5% highest degree inArabidopsis thaliana
Zone Number of nodes has degree ≥ 16 (5%) Percentage
Zone 1 2 1.5%
Zone 2 46 33.3%
Zone 3 64 44.1%
Zone 4 12 8.5%
Zone 5 5 3.8%
Total 129 100%
topologically central positions of PINs are highly con-nected and that hub proteins are located in central zones.Topologically, this is in line with the core and peripherystructures described for PPI networks [35]. However, wefurther propose that the ‘switching’ of specialised func-tions between zones and the high degree of enrichmentfor signal transduction proteins in zones 1 and 2 suggeststhat the human PIN has evolved to optimise the sensing ofstimuli at its central zones and to initiate a signal outwardto peripheral zones, where transcriptional and subsequentmetabolic responses are effected.
ConclusionWhen PINs are formally modelled as metric spaces, itbecomes clear that hub proteins are not distributed ran-domly and that the prevailing view that proteins interactrandomly with hubs marshalling low degree proteins inprocesses and pathways needs a serious reconsideration.We show clearly that PIN structures across the phyla havedensely connected kernels and become less dense towardsthe periphery, terminating in several ‘spikes’ or ‘quills’. Weargue that structurally PINs, and possibly other biologicalnetworks, are mathematical entities that share propertiesbetween organisms but not necessarily with other net-works that follow power-law, such as social networks. Assuch, while applying systems theory developed in socialnetworks to biological networks may have been conve-nient in and may have shed some light on interactomes,it is not sufficient to identify functional patterns in pro-tein interaction networks, which we have shown to have amuch deeper topology when considered as metric spaces.As our over-representation analysis has shown that zonesof the human and Saccharomyces cerevisiae PINs havefunctional significance, we argue that interactomics needsits own network theory modelled on actual PPI data rathersimply adopting theories from the social sciences.
We thus conclude that our strategy of formally and pre-cisely evaluating PINs as metric spaces, with a focus onzones relative to the centre, may shed light on the keydifferences between expressed PPI networks in normaland diseased tissues. We propose that centrally located

Fadhal et al. BMC Systems Biology 2014, 8:6 Page 6 of 11http://www.biomedcentral.com/1752-0509/8/6
Figure 1 Model representation of a PINs with respect to distance from the centre. A graph layout representation of the PINs, whichdemonstrates a densely connected centre and ‘quills’ at the periphery.
proteins, particularly those involved in sensing functions,may present good therapeutic targets and should beformally evaluated in future studies based on our met-ric space approach. Our ongoing investigations into thepotential applications of the approach detailed in thispaper indicates that central zones of several human PPInetworks are very strongly enriched for essential proteinsand known drug targets, with central zones again display-ing high enrichment (data not shown), reinforcing ourhypothesis of utility in drug target discovery.
MethodsNotation and definitions in graph theoryThe PPI networks we consider are modelled by graphs. Agraph G = (V , E) is a set V together with an adjacencyrelation E that is not reflexive and at the same time sym-metric. The elements of V are called nodes (one is a node)and those of E are called edges. Thus, in PPI networks, pro-teins are represented by nodes and a pair of proteins formsan edge if they interact; we therefore interchangeably useproteins and nodes in this discussion. In the organisms we
consider, to avoid reflexivity, we ignore considerations ofproteins interacting with themselves. In any case, in mat-ters of distances, reflexivity plays no role. The order of agraph is the number of its nodes and the size is the num-ber of interactions. A graph is complete if every node isrelated to the other. If a node x is related to a node y, wesay that y is adjacent to x and write xy. The set of nodesthat are adjacent to a node x is the neighbourhood of x. Thedegree of x is the number of nodes in its neighbourhood.In the context of PPI networks, the degree of a protein isthe number of proteins that interact with it. A subgraph ofa graph G is a graph whose node set is a subset of that of G,and whose adjacency relation is also a subset of that of G.A subgraph H of a graph G is said to be induced if, for anypair of nodes x and y of H, xy is an edge of H if and onlyif xy is an edge of G; that is, H inherits all the edges thatare in G. If a subgraph H has only a subset of edges weredefined in G, then H is not induced. Of particular impor-tance in PINs are induced subgraphs that define a processor pathway. A path in a graph is a sequence v0v1 · · · vkof distinct nodes such that every two consecutive nodes
Fadhaletal.BMC
SystemsBiology
2014,8:6Page
7of11
http://w
ww
.biom
edcentral.com/1752-0509/8/6
Table 8 Human signalling network vs equivalent random human signalling network
Network Nodes Edges Giant Diameter Zones around centre
1 2 3 4 5 6
HSN 6291 62737 67 11
431 3527 1929 206 38 4 Nodes
67 24 7 2 2 3 Average degree
1 1 1 1 1 1 Lowest degree
451 362 89 11 9 5 Highest degree
4 404 757 133 20 2 No of quills
Random equiv. HSN 1 6477 64319 2 8
155 3031 3149 134 5 Nodes
54 27 11 3 1 Average degree
7 1 1 1 1 Lowest degree
150 141 61 10 1 Highest degree
0 3 32 36 5 No of quills
Random equiv. HSN 2 6270 62360 1 8
151 3037 2973 107 1 Nodes
56 27 11 2 1 Average degree
5 1 1 1 1 Lowest degree
159 136 50 6 1 Highest degree
0 1 42 32 1 No of quills
Random equiv. HSN 3 6267 62412 1 7
171 3187 2812 96 Nodes
52 27 11 2 Average degree
6 1 1 1 Lowest degree
171 153 58 7 Highest degree
0 1 39 33 No of quills
Random equiv. HSN 4 6277 62378 2 7
158 3127 2883 106 Nodes
56 27 11 2 Average degree
5 1 1 1 1 Lowest degree
153 143 54 7 Highest degree
0 2 29 36 No of quills
Random equiv. HSN 5 6282 62378 1 8
154 3093 2914 119 1 Nodes
55 27 11 3 1 Average degree
4 2 1 1 1 Lowest degree
153 158 53 8 1 Highest degree
0 0 25 34 1 No of quills

Fadhal et al. BMC Systems Biology 2014, 8:6 Page 8 of 11http://www.biomedcentral.com/1752-0509/8/6
Figure 2 Degree distribution of HFPIN vs equivalent uniform random power-law graph.
constitute an edge in the graph; its length is k. If for everypair of nodes in a graph there is a path joining them, we saythat the graph is connected; otherwise it is disconnected.A component is a maximally connected subgraph of thegraph and it is giant if contains a majority of the entiregraph’s nodes. The distance between a pair of nodes is thelength of a shortest path joining them. A graph togetherwith this distance defines a metric space. For a fixed nodev, the eccentricity of v is the length of the longest path join-ing itself to all the other nodes. The longest eccentricityof all nodes is the diameter of the graph and nodes withthe shortest eccentricity are said to be at the centre of thegraph. In our context, a quill is a subgraph which is on thefringes of the centre and eventually becomes a path, thatis, a connected subgraph in which one of the nodes hasdegree 1.
PPI data sourcesThe human PIN we considered is the Human FunctionalProtein Interaction Network (HFPIN) [36], which has9448 nodes and 181706 interactions. The human signal-ling network which has 6291 nodes and 62737 inter-actions was downloaded from www.bri.nrc.ca/wang/.PINs for other organisms were downloaded from variousdatabases: the Database of Interacting Proteins (http://
bioinfo.esalq.usp.br) Version 02/28/2012 [37], bioGRIDdatabase (http://thebiogrid.org/download.php), CCSBinteractome database (http://interactome.dfci.harvard.edu/), antAnc database (ftp://ftp.ebi.ac.uk/pub/databases/intact/current) Version 2.0, and MINT database (http://mint.bio.uniroma2.it/mint/download.do). The Saccha-romyces cerevisiae network consisted of 5033 nodes and22417 interactions, the Arabidopsis thaliana network,2953 nodes and 6783 interactions and the Escherichia coliPPI network consisted of 2949 nodes and 12689 inter-actions. In order to compare the biological graphs withrandom graphs, we generated uniform random power-law graphs that are similar in terms of number of nodesand interactions using the Python Webgraph Generator(http://pywebgraph.sourceforge.net/), which implementsthe RMAT algorithm [38].
Evaluation of PPI networks as metric spacesWe considered the Human Functional Protein Interac-tion Network, the human signalling network, the Sac-charomyces cerevisiae, Arabidopsis thaliana, Escherichiacoli, Caenorhabditis elegans and Helicobacter pylori PPInetworks as metric spaces by defining the usual graph the-oretic distance between nodes of a graph. Using a pythonwrapper around the C++ BOOST graph library (http://
Figure 3 Degree distribution of human signalling network vs equivalent uniform random power-law graph.

Fadhal et al. BMC Systems Biology 2014, 8:6 Page 9 of 11http://www.biomedcentral.com/1752-0509/8/6
Table 9 Summary of functional specialization in the central zones of HFPIN
Percentage of proteins
Enriched pathway Zone 1 Zone 2 Zone 3 Zone 4
Signal transduction 38% 24.8% - -
Immune system 29.8% 10.6% 4.5% -
Hemostasis 17% 5.7% 2.7% -
Disease 16.8% 8% 4.1% -
Gene expression 8.2% 8.8% 9.8% -
Metabolism 5.1% 8.4% 7.6% 10.4%
Membrane trafficking - - 1.2% 2.8%
Neuronal system 4.8% 2.5% 2.3% 3.3%
Transmembrane transport of small molecules - 1.9% 2.4% 3.6%
www.boost.org/), we used the Dijkstra algorithm to com-pute the shortest distances between all pairs of nodes andthen identify the node or all nodes whose greatest dis-tance to other nodes is/are smallest. This is the networkcenter(s).
From here, nodes were classified according to their dis-tances from the centre and divided into zones based ondistance from the topological centre(s). From each dis-tance class, we calculated their degree distributions andalso considered their connectivity of the graphs inducedfor each zone.
Pathway and function enrichment analysisIn order to determine whether zones of the HFPIN,human signalling network and Saccharomyces cerevisiae
PIN we considered have biological significance, wedivided proteins into subsets based on their distancefrom the true topological centre. Protein sets represent-ing each zone were then subjected to a pathway over-representation analysis in order to determine whether thezones were specialised for specific functions. The Com-parative Toxigenomics Database’s Gene Set Enricher webservice (http://ctdbase.org/tools/enricher.go) and GeneOntology enrichment (http://www.geneontology.org/GO.tools) was used to perform the enrichment analysis and acorrected P-value of 0.01 was chosen as a statistical signif-icance cutoff. Lastly, when such enrichment was observed,we calculated the proportion of proteins involved in eachenriched pathway as a way to assess whether any zonesdisplay functional specialization.
Figure 4 Summary of functional specialization in the central zones of HFPIN.

Fadhal et al. BMC Systems Biology 2014, 8:6 Page 10 of 11http://www.biomedcentral.com/1752-0509/8/6
Additional file
Additional file 1: Degree distributions of PINs. In all the PINs, thestandard deviation of degree distribution has a remarkably significantvariation. However, the HFPIN has a spike as a result of a zinc finger (ZNF)protein family of 330 proteins which constitutes an induced completegraph, where each protein has a degree of 386. Our main strategy was tocalculate a number of metrics of networks from their topological centremoving outwards. The correlation coefficient calculated for mean degreeand the distance from the centre of the networks is -0.789, -0.814, -0.840,-0.804, -0.865, and -0.876 respectively for HFPIN, human signalling network,Saccharomyces cerevisiae, Escherichia coli, Caenorhabditis elegans andHelicobacter pylori. The correlation is therefore strongly negative. In otherwords, there is a relationship between mean degree and zones. As wemove into the centre the values for the mean degree increase. On theother hand, the average degree of nodes in zones in the peripherydecrease as one moves away from the centre. Figure S1a Degreedistribution of the HFPIN. Figure S1b Degree distribution of Saccharomycescerevisiae. Figure S1c Degree distribution of Arabidopsis thaliana. Figure S1dDegree distribution of Escherichia coli. Figure S1e Degree distribution of theHSN. Figure S2 Summary of degree distribution of PINs with respect to thecentre from different sources. Figure S3a Degree distribution of HFPIN andhuman signalling network follows power-law distribution. Figure S3bDegree distribution of Saccharomyces cerevisiae from different source.Figure S3c Degree distribution of Arabidopsis thaliana from differentsource. Figure S3d Degree distribution of Escherichia coli from differentsource. Figure S4 Summary of functional specialization in the central zonesof human signlling network. Figure S5 Summary of functional specializationin the central zones of Saccharomyces cerevisiae. Table S1 Summary offunctional specialization in the central zones of human signalling network.
Competing interestsThe authors declare that they have no competing interests.
Authors’ contributionsEF developed the concept, implemented the algorithms and performed theanalysis. ECM proposed the concept of analyzing the PPIs as metric spaces. JGoversaw the functional enrichment analysis and the biological interpretationthereof. ECM and JG designed and supervised the study. All authors have readand approved the final manuscript.
AcknowledgementsThis work was supported in part by a grant from South Africa NationalResearch Foundation (NRF).
Author details1South African National Bioinformatics Institute, SA Medical Research CouncilBioinformatics Unit, University of the Western Cape, Bellville 7535, South Africa.2Department of Mathematics and Applied Mathematics, University of theWestern Cape, P/Bag X17, Bellville, South Africa.
Received: 18 February 2013 Accepted: 7 January 2014Published: 18 January 2014
References1. Kar G, Gursoy A, Keskin O: Human cancer protein-protein interaction
network: a structural perspective. PLoS Comput Biol 2009,5(12):e1000601.
2. Koyutürk M, Szpankowski W, Grama A: Assessing significance ofconnectivity and conservation in protein interaction networks.J Comput Biol 2007, 14(6):747–764.
3. Barabasi AL, Oltvai ZN: Network biology: understanding the cell’sfunctional organization. Nat Rev Genet 2004, 5(2):101–113.[http://www.ncbi.nlm.nih.gov/pubmed/14735121]
4. He X, Zhang J: Why do hubs tend to be essential in protein networks?PLoS Genet 2006, 2(6):e88.
5. Jeong H, Mason S, Barabasi A, Oltvai Z: Lethality and centrality inprotein networks. Arxiv preprint cond-mat/0105306 2001.
6. Vallabhajosyula R, Chakravarti D, Lutfeali S, Ray A, Raval A: Identifyinghubs in protein interaction networks. PLoS One 2009, 4(4):e5344.
7. Batada N, Hurst L, Tyers M: Evolutionary and physiological importanceof hub proteins. PLoS Comput Biol 2006, 2(7):e88.
8. Hahn MW, Kern AD: Comparative genomics of centrality andessentiality in three eukaryotic protein-interaction networks.Mol Biol Evol 2005, 22(4):803–806. [http://www.ncbi.nlm.nih.gov/pubmed/15616139]
9. Yu H, Greenbaum D, Xin Lu H, Zhu X, Gerstein M: Genomic analysis ofessentiality within protein networks. Trends Genet 2004,20(6):227–231. [http://www.ncbi.nlm.nih.gov/pubmed/15145574]
10. Yu H, Kim PM, Sprecher E, Trifonov V, Gerstein M: The importance ofbottlenecks in protein networks: correlation with gene essentialityand expression dynamics. PLoS Comput Biol 2007, 3(4):8. [http://www.ncbi.nlm.nih.gov/pubmed/17447836]
11. Zaki N, Berengueres J, Efimov D: Detection of protein complexes usinga protein ranking algorithm. Proteins 2012, 80(10):2459–2468.[http://www.ncbi.nlm.nih.gov/pubmed/22685080]
12. Zaki N, Efimov D, Berengueres J: Protein complex detection usinginteraction reliability assessment and weighted clusteringcoefficient. BMC Bioinformatics 2013, 14:163. [http://www.pubmedcentral.nih.gov/articlerender.fcgi?artid=3680028&tool=pmcentrez&rendertype=abstract]
13. Mete M, Tang F, Xu X, Yuruk N: A structural approach for findingfunctional modules from large biological networks. BMCBioinformatics 2008, 9(Suppl 9):S19. [http://www.ncbi.nlm.nih.gov/pubmed/18793464]
14. Everett M, Borgatti S: The centrality of groups and classes. J Math Sociol1999, 23(3):181–201.
15. Newman MEJ: A measure of betweenness centrality based onrandom walks. 2003. [http://arxiv.org/abs/cond-mat/0309045][Comment: 15 pages, 7 figures, 2 tables]
16. Friedel CC, Zimmer R: Inferring topology from clustering coefficientsin protein-protein interaction networks. BMC Bioinformatics 2006,7:519. [http://www.ncbi.nlm.nih.gov/pubmed/17137490]
17. Silva Md, Ma HMH, Zeng APZAP: Centrality, network capacity, andmodularity as parameters to analyze the core-periphery structure inmetabolic networks. Proc IEEE 2008, 96(8):1411–1420.
18. Ignacio AJ, DallAsta L, Barrat A, Vespignani A: k-core decomposition : atool for the visualization of large scale networks. World Wide WebInternet And Web Info Syst 2005. abs/cs/050. [http://arxiv.org/abs/cs/0504107]
19. Vogelstein B, Lane D, Levine AJ: Surfing the p53 network. Nature 2000,408(6810):307–310.
20. Jeong H, Barab AL, Oltvai ZN: Prediction of protein essentiality basedon genomic data. Complexus 2003, 1:19–28.
21. Lin CC, Juan HF, Hsiang JT, Hwang YC, Mori H, Huang HC: Essential coreof protein-protein interaction network in Escherichia coli. J ProteomeRes 2009, 8(4):1925–1931.
22. Katzir Y, Elhanati Y, Averbukh I, Braun E: Dynamics of the cell-cyclenetwork under genome-rewiring perturbations. Phys Biol 2013,10(6):066001. [http://iopscience.iop.org/1478-3975/10/6/066001/article/]
23. Zhuge H, Zhang J: Topological Centrality and its e-ScienceApplications. J Am Soc Inf Sci Technol 2010, 61(9):1824–1841.
24. Mirzarezaee M, Araabi BN, Sadeghi M: Features analysis foridentification of date and party hubs in protein interaction networkof Saccharomyces Cerevisiae. BMC Syst Biol 2010, 4:172.
25. Patil A, Kinoshita K, Nakamura H: Hub promiscuity in protein-proteininteraction networks. Int J Mol Sci 2010, 11(4):1930–1943. [http://www.pubmedcentral.nih.gov/articlerender.fcgi?artid=2871146&tool=pmcentrez&rendertype=abstract]
26. Bales ME, Johnson SB: Graph theoretic modeling of large-scalesemantic networks. J Biomed Inform 2006, 39(4):451–464. [http://www.ncbi.nlm.nih.gov/pubmed/16442849]
27. Albert R, Barabasi AL: Statistical mechanics of complex networks. RevModern Phys 2002, 74:47. [http://www.springer.com/physics/theoretical,+mathematical+&+computational+physics/book/978-3-540-40372-2]
28. Watts DJ, Strogatz SH: Collective dynamics of ‘small-world’ networks.Nature 1998, 393(6684):440–442. [http://www.ncbi.nlm.nih.gov/pubmed/9623998]
Fadhal et al. BMC Systems Biology 2014, 8:6 Page 11 of 11http://www.biomedcentral.com/1752-0509/8/6
29. Bryant V: Metric Spaces: Iteration and Application. Cambridge: PressSyndicate of the University of Cambridge; 1985.
30. Dugundji J: Topology. Boston: Allyn and Bacon; 1974.31. Bandyopadhyay S, Chiang CY, Srivastava J, Gersten M, White S, Bell R,
Kurschner C, Martin CH, Smoot M, Sahasrabudhe S, Barber DL, Chanda SK,Ideker T: A human MAP kinase interactome. Nat Methods 2010,7(10):801–805. [http://www.ncbi.nlm.nih.gov/pubmed/20936779]
32. Eisenberg E, Levanon EY: Preferential attachment in the proteinnetwork evolution. Phys Rev Lett 2003, 91(13):138701. [http://arxiv.org/abs/cond-mat/0303490]
33. Gibson TA, Goldberg DS: Improving evolutionary models of proteininteraction networks. Bioinformatics 2011, 27(3):376–382. [http://www.ncbi.nlm.nih.gov/pubmed/21067999]
34. Aiello W, Chung F, Lu L: A random graph model for power law graphs.Exp Math 2001, 10:53–66. [http://www.emis.ams.org/journals/EM/restricted/10/10.1/aiello.ps]
35. Luo F, Li B, Wan XF, Scheuermann RH: Core and periphery structures inprotein interaction networks. BMC Bioinformatics 2009, 10(Suppl 4):S8.[http://www.ncbi.nlm.nih.gov/pubmed/19426456]
36. Wu G, Feng X, Stein L: A human functional protein interactionnetwork and its application to cancer data analysis. Genome Biol2010, 11(5):R53.
37. Brandão MM, Dantas LL, Silva-Filho MC: AtPIN: Arabidopsis thalianaprotein interaction network. BMC Bioinformatics 2009, 10:454. [http://www.pubmedcentral.nih.gov/articlerender.fcgi?artid=2810305&tool=pmcentrez&rendertype=abstract]
38. Chakrabarti D, Zhan Y, Faloutsos C: R-MAT: A recursive model for graphmining. Computer 2004, 6:442–446. [http://repository.cmu.edu/cgi/viewcontent.cgi?article=1541&context=compsci]
doi:10.1186/1752-0509-8-6Cite this article as: Fadhal et al.: Protein interaction networks as metricspaces: a novel perspective on distribution of hubs. BMC Systems Biology2014 8:6.
Submit your next manuscript to BioMed Centraland take full advantage of:
• Convenient online submission
• Thorough peer review
• No space constraints or color figure charges
• Immediate publication on acceptance
• Inclusion in PubMed, CAS, Scopus and Google Scholar
• Research which is freely available for redistribution
Submit your manuscript at www.biomedcentral.com/submit