protein quantification assay - macherey-nagel ag · pdf file3 protein quantification assay...
TRANSCRIPT
MACHEREY-NAGEL
EN ISO 9001EN ISO 13485
CERTIFIED
MACHEREY-NAGEL GmbH & Co. KG · Neumann-Neander-Str. 6–8 · 52355 Düren · GermanyFrance:MACHEREY-NAGEL EURLTel.: +33 388 68 22 68E-mail: [email protected]
Switzerland:MACHEREY-NAGEL AGTel.: +41 62 388 55 00E-mail: [email protected]
Germanyand international:Tel.: +49 24 21 969-0E-mail: [email protected]
USA:MACHEREY-NAGEL Inc.Tel.: +1 484 821 0984E-mail: [email protected]
Protein Quantification Assay
User manual
May 2014 / Rev. 04
A036
546
/ 104
0.2

Protein Quantification AssayProtocol-at-a-glance (Rev. 04)
MACHEREY-NAGEL GmbH & Co. KG · Neumann-Neander-Str. 6–8 · 52355 Düren · Germany Tel.: +49 24 21 969-270 · Fax: +49 24 21 969-199 · [email protected] · www.mn-net.com
Microplate assay Semi–micro cuvette assay
Micro cuvette assay
Low volume assay
1 Prepare BSA reference pro-tein dilution series
Dispense 50 μL PSB
per tube # 2–# 7
Dispense 250 μL PSB
per tube # 2–# 7
Dispense 50 μL PSB
per tube # 2–# 7
Dispense 20 μL PSB
per tube # 2–# 6
Pipette 50 μL BSA stock solution
into tube # 2; then 50 μL from # 2 into # 3 etc.*
Pipette 250 μL BSA stock solution
into tube # 2; then 250 μL from # 2 into # 3 etc.*
Pipette 50 μL BSA stock solution
into tube # 2; then 50 μL from # 2 into # 3 etc.*
Pipette 20 μL BSA stock solution
into tube # 2; then 20 μL from # 2 into # 3 etc.*
Dilution series sufficient for
Two calibration curves
One calibration curve
One calibration curve
Two calibration curves
2 Dispense dilution series 20 μL 200 μL 40 μL 7.5 μL
3 Dispense your protein sample
20 μL (1–60 μL)
200 μL (10–600 μL)
40 μL (1–120 μL) 7.5 μL
4 Fill up dilution series and sample with PSB
40 μL (final vol. 60 μL)
400 μL (final vol. 600 μL)
80 μL (final vol. 120 μL) –
5 Add Quantification Reagent QR
40 μL 400 μL 80 μL 5 μL
6 Incubate 30 min at room temperature
7 Measure light extinction At 570 nm (530 nm–700 nm)
8 Calculate protein concentration
Make sure that the signal of your sample lies within the range of the calibration curve.
* Keep tube # 7 as BLANK – Do not add 50 μL from tube # 6 into tube # 7!

3
Protein Quantification Assay
MACHEREY-NAGEL – 05 / 2014, Rev. 04
Table of contents
1 Components 41.1 Kit contents 41.2 Consumables and equipment to be supplied by user 4
2 Product description 52.1 The basic principle 52.2 Kitspecifications 52.3 Handling, preparation, and storage of starting materials 82.4 Calibration curves 92.5 Recommended sample volumes 92.6 Alternative wavelengths for extinction measurement 11
3 Storage conditions and preparation of working solutions 12
4 Safety instructions 13
5 Protocols 155.1 Microplate assay procedure 155.2 Semi-microcuvette assay procedure 185.3 Microcuvette assay procedure 215.4 Low volume assay procedure 24
6 Appendix 276.1 Guidance for data analysis – calculation of protein concentration 276.2 Troubleshooting 306.3 Ordering information 316.4 References 326.5 Product use restriction / warranty 32
Protein Quantification Assay
MACHEREY-NAGEL – 05 / 2014, Rev. 044
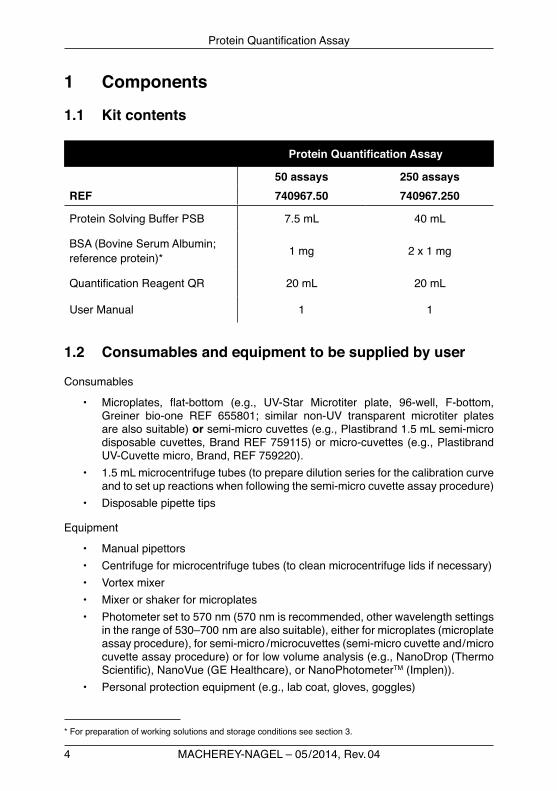
1 Components
1.1 Kit contents
Protein Quantification Assay
50 assays 250 assaysREF 740967.50 740967.250
Protein Solving Buffer PSB 7.5 mL 40 mL
BSA (Bovine Serum Albumin; reference protein)* 1 mg 2 x 1 mg
QuantificationReagentQR 20 mL 20 mL
User Manual 1 1
1.2 Consumables and equipment to be supplied by user
Consumables
• Microplates, flat-bottom (e.g., UV-Star Microtiter plate, 96-well, F-bottom,Greiner bio-one REF 655801; similar non-UV transparent microtiter platesare also suitable) or semi-micro cuvettes (e.g., Plastibrand 1.5 mL semi-micro disposablecuvettes,BrandREF759115)ormicro-cuvettes(e.g.,PlastibrandUV-Cuvettemicro,Brand,REF759220).
• 1.5 mL microcentrifuge tubes (to prepare dilution series for the calibration curve and to set up reactions when following the semi-micro cuvette assay procedure)
• Disposable pipette tips
Equipment
• Manual pipettors• Centrifuge for microcentrifuge tubes (to clean microcentrifuge lids if necessary)• Vortexmixer• Mixer or shaker for microplates• Photometer set to 570 nm (570 nm is recommended, other wavelength settings
in the range of 530–700 nm are also suitable), either for microplates (microplate assayprocedure),forsemi-micro / microcuvettes(semi-microcuvetteand / microcuvette assay procedure) or for low volume analysis (e.g., NanoDrop (Thermo Scientific),NanoVue(GEHealthcare),orNanoPhotometerTM (Implen)).
• Personal protection equipment (e.g., lab coat, gloves, goggles)
*Forpreparationofworkingsolutionsandstorageconditionsseesection3.

5
Protein Quantification Assay
MACHEREY-NAGEL – 05 / 2014, Rev. 04
2 Product description
2.1 The basic principle
The Protein Quantification Assay is a convenient and reliable kit for the determination of protein concentration in samples typically used for SDS-PAGE (sodium dodecylsulfate polyacrylamide gel electrophoresis). It is mainly designed for proteins solved in Protein Solving Buffer PSB or Protein Loading Buffer PLB (components of NucleoSpin®RNA / ProteinandNucleoSpin® TriPrep), but will also work with proteins solved in buffer as described by Laemmli (1970), or similar. These protein sample buffers usually contain SDS, a reducing agent, dye, and a component to increase thebufferdensity.Themajorityofproteinquantificationassays*areeitherinfluencedby or incompatible with SDS, reducing agents, or dyes commonly present in protein sample buffers. The Protein Quantification Assay however, is well suited for such buffersystems.Itisafastandsensitiveassay,basedonamodificationofaprotocoldescribed by Karlsson et al. (1994). The samples are mixed with Protein Solving Buffer PSB and subsequently incubated for 30 minutes with QuantificationReagent QR.After incubation light extinction is measured photometrically. Light extinction is caused by turbidity appearing after addition of Quantification Reagent QR. The proteinconcentration is determined in reference to a BSA (Bovine Serum Albumin) calibration curve (BSA is provided with the Protein Quantification Assay).
2.2 Kit specifications
• Protein Quantification Assay allows the determination of protein concentration insamplescontainingup to10 %SDSandcomprising reducingagent (e.g.,ß-mercaptoethanol (BME), dithiothreitol (DTT), dithioerythritol (DTE) or tris- (2-carboxyethyl) phosphine hydrochloride (TCEP)), buffering salts (e.g., TRIS or BIS-TRIS), dye (bromphenol blue), and a component to create a high density of the solution (e.g., glycerol or sucrose).
• Protein Quantification Assay is designed for the determination of protein concentration in samples with low nucleic acid concentration, as obtained with NucleoSpin®RNA / ProteinorNucleoSpin®TriPrep.Forsamplesrichinnucleicacidsthequantificationislessaccurate.
* Forexample:CoomassieBrilliantBlueG-250,Bradford1979;coppertartratesolutionandFolinreagent,Lowryet al. 1951; Cu2+/Cu1+ - BCA interaction, Smith et al. 1985.

Protein Quantification Assay
MACHEREY-NAGEL – 05 / 2014, Rev. 046
• Protein Quantification Assay is suited for samples comprising protein solved in buffers, commonly used for SDS-PAGE (e.g., Laemmli buffer). Accuracy dependsonnucleicacidcontentofthesample.Fortypicalculturedcells(e.g.,HeLa) accuracy is affected by approximatively 5–20 % due to nucleic acidcontent*.
• The kit REF 740967.50 is sufficient for 50 protein determinations plus sixcalibration curves with seven calibration points each (approx. 100 reactions intotal),accordingtothemicroplateassay.Alternativelythekitissufficientforapprox. 10 reactions according to the semi-micro cuvette assay (three protein determinations plus seven calibration points).
• The kitREF740967.250 is sufficient for 250protein determinationsplus 25calibration curves with seven calibration points each (approx. 450 reactions in total), according to themicroplate assay.Alternatively, the kit is sufficientfor approx. 50 reactions according to the semi-micro cuvette assay (26 protein determinations plus three calibration curves with seven calibration points each).
• Followingthemicroplate assay procedure the kit allows the determination of proteinamount(exemplaryBSA)intherangeof0.6–20μgperassayprovidedin a standard volume of 20μL Protein Solving Buffer PSB (alternatively1–60μL).Thiscorrespondstoaproteinconcentrationof30–1000ng/μL.Thisconcentrationrangecanbeexpandedto10–20,000ng/μLifalternativesamplevolumes(1–60μL)areapplied.
• Following the semi-micro cuvette assay procedure the kit allows the determination of protein (exemplary BSA) amount in the range of 6–200μgperassayprovidedinastandardvolumeof200μLProteinSolvingBufferPSB.Thiscorrespondstoaproteinconcentrationof30–1000ng/μL.
*OnemicrogramDNAcausesca.50–70 %oftheextinctionsignalcausedbyonemicrogramprotein(BSA). OnemicrogramRNAcausesca.10–40 %oftheextinctionsignalcausedbyonemicrogramprotein(BSA).
DNA, RNA, and protein content of a typical cell and influence on the protein quantification:
Molecule Content per cell
Content per one million
cells
Extinction signal obtained with the
Protein Quantification Assay relative to the
reverence protein BSA
Extinction signal obtained relative to
total protein
DNA 6 pg 6 μg ~50–70 % 3–5 %RNA 10–30 pg 10–30μg ~10–40 % 1–12 %
Protein 100–200 pg 100–200μg ~100 % 100 %Total:104–117 %
SignalobtainedfromtotalcellextractcontainingRNAandDNA,relativetonucleicacidfreetotalprotein:104–117 %.
7
Protein Quantification Assay
MACHEREY-NAGEL – 05 / 2014, Rev. 04
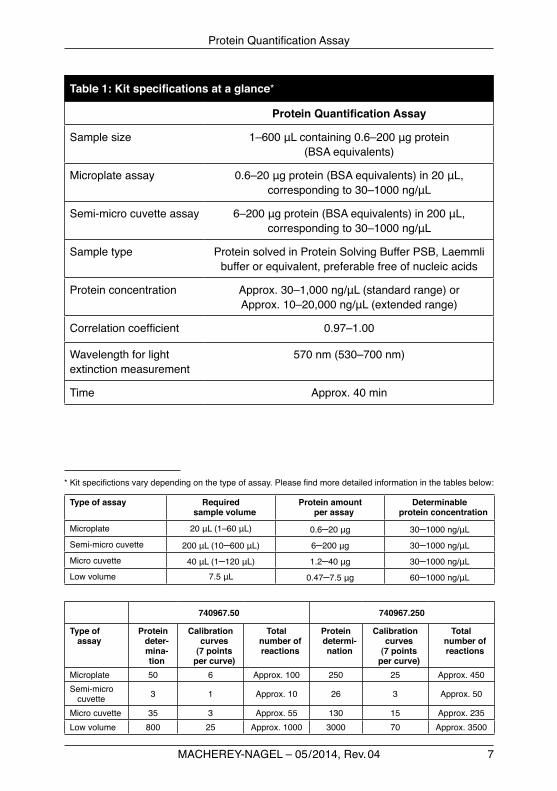
Table 1: Kit specifications at a glance*
Protein Quantification Assay
Sample size 1–600μLcontaining0.6–200μgprotein (BSA equivalents)
Microplate assay 0.6–20μgprotein(BSAequivalents)in20μL, correspondingto30–1000ng/μL
Semi-micro cuvette assay 6–200μgprotein(BSAequivalents)in200μL, correspondingto30–1000ng/μL
Sample type Protein solved in Protein Solving Buffer PSB, Laemmli buffer or equivalent, preferable free of nucleic acids
Protein concentration Approx.30–1,000ng/μL(standardrange)or Approx.10–20,000ng/μL(extendedrange)
Correlationcoefficient 0.97–1.00
Wavelength for light extinction measurement
570 nm (530–700 nm)
Time Approx. 40 min
*Kitspecifictionsvarydependingonthetypeofassay.Pleasefindmoredetailedinformationinthetablesbelow:
Type of assay Required sample volume
Protein amount per assay
Determinable protein concentration
Microplate 20μL(1–60μL) 0.6–20μg 30–1000ng/μLSemi-micro cuvette 200μL(10–600μL) 6–200μg 30–1000ng/μLMicro cuvette 40μL(1–120μL) 1.2–40μg 30–1000ng/μLLow volume 7.5μL 0.47–7.5μg 60–1000ng/μL
740967.50 740967.250
Type of assay
Protein deter-mina-tion
Calibration curves
(7 points per curve)
Total number of reactions
Protein determi-nation
Calibration curves
(7 points per curve)
Total number of reactions
Microplate 50 6 Approx. 100 250 25 Approx. 450Semi-micro
cuvette 3 1 Approx. 10 26 3 Approx. 50
Micro cuvette 35 3 Approx. 55 130 15 Approx. 235Low volume 800 25 Approx. 1000 3000 70 Approx. 3500
Protein Quantification Assay
MACHEREY-NAGEL – 05 / 2014, Rev. 048
2.3 Handling, preparation, and storage of starting materials
After dissolving protein in Protein Solving Buffer PSB or Protein Loading Buffer PLB (with or without Reducing Agent TCEP), Laemmli buffer, or analogs, freeze your proteinsamplesforlongtermstorageorkeepsamplesat4 °Cforshorttermstorage.Before use, make sure that the samples are free of precipitates. If necessary heat to approximately30 °CinordertodissolveanypossibleSDSprecipitate.Subsequently,spinsamplebrieflytoremoveanyfurtherinsolublematter.
Protein samples obtained with NucleoSpin®RNA / ProteinorNucleoSpin® TriPrep and dissolved in Protein Solving Buffer PSB or Protein Loading Buffer PLB (with or without Reducing Agent TCEP), are optimal for determination of protein concentration with the Protein Quantification Assay.
Quantificationofproteinsamplesobtainedbyboilingcellsor tissuedirectly ineitherPSB or PLB (with or without Reducing Agent TCEP), Laemmli buffer, or analogs is possible, but the measurement may be less accurate due to the presence of nucleic acids, which interfere with the assay. The extent of interference depends on the content of protein and nucleic acid in the sample. Many samples, like, for example, cultured HeLa cells or liver tissue, contain much more protein than nucleic acid and thus nucleic acids cause only small interference (see footnote page 7).
Wear gloves at all times during the handling to reduce risk of sample contamination with skin keratins.

9
Protein Quantification Assay
MACHEREY-NAGEL – 05 / 2014, Rev. 04
2.4 Calibration curves
Reference protein (BSA) dilution series give good correlations with measured light extinction.Typical correlation coefficients of 0.97–1.00are obtained in the rangeofapprox. 0.03–1μg/μL BSA concentration. BSA concentration versus extinction andBSAamountversusextinctionareshowninFigure1.
0.001
0.01
0.1
1
0.1 1 10 100 1000BSA amount per assay [µg]
Extrinction E570 nm
microplatey = 0.0088xR2 = 0.998
semi-micro cuvettey = 0.0036xR2 = 0.995
Extin
ctio
n E 57
0 nm
0.001
0.01
0.1
1
0.01 0.1 1
semi-micro cuvettey = 0.712xR2 = 0.995
microplatey = 0.176xR2 = 0.998
BSA concentration [µg/µL]
Extin
ctio
n E 57
0 nm
Figure 1: Correlation between BSA amount and extinction signal as well as between BSA concentration and extinction signal.
For the microplate assay BSA was supplied in 20μL; path length for extinctionmeasurement was 3mm. For the semi-micro cuvette assay BSA was supplied in200μL;pathlengthforextinctionmeasurementwas10mm.
2.5 Recommended sample volumes
As guidance, follow the recommendations of Table 2 – Table 5 to choose an appropriate volume of your sample for measuring. For the initial determination of proteinconcentration in samples containing hard-to-estimate protein amounts, measurement ofmultiplesamplevolumes(e.g.,2μL,5μL,50μL)isrecommended.Thiswillincreasethe probability that one of the measured protein amounts lies within the range of the calibration curve.
ForproteinsamplesobtainedwithNucleoSpin®RNA / ProteinorNucleoSpin® TriPrep, seetherespectiveusermanualforafirstestimationoftheproteinyield.

Protein Quantification Assay
MACHEREY-NAGEL – 05 / 2014, Rev. 0410
Table 2: Microplate assay – Recommended sample volumes for protein quantification
Expected protein concentration
Recommended sample volume
Protein amount per well
0.01–0.33μg/μL 60μL 0.6–20μg
0.03–1.0μg/μL 20μL 0.6–20μg
0.6–20μg/μL 1μL 0.6–20μg
Table 3: Semi-micro cuvette assay – Recommended sample volumes for protein quantification
Expected protein concentration
Recommended sample volume
Protein amount
0.01–0.33μg/μL 600μL 6–200μg
0.03–1.0μg/μL 200μL 6–200μg
0.6–20μg/μL 10μL 6–200μg
Table 4: Microcuvette assay – Recommended sample volumes for protein quantification
Expected protein concentration
Recommended sample volume
Protein amount per microcuvette
0.01–0.33μg/μL 120μL 1.2–40μg
0.03–1.0μg/μL 40μL 1.2–40μg
1.2–40μg/μL 1μL 1.2–40μg
Table 5: Low volume assay – Recommended sample volumes for protein quantification
Expected protein concentration
Recommended sample volume
Protein amount per microcuvette
0.06–1μg/μL 7.5μL 0.47–7.5μg

11
Protein Quantification Assay
MACHEREY-NAGEL – 05 / 2014, Rev. 04
2.6 Alternative wavelengths for extinction measurement
A wavelength in the range of 530–700 nm is recommended for light extinction measurements. Figure2 shows the dependency of correlation coefficient on thewavelength, used for light extinction measurement.
0.0
0.2
0.4
0.6
0.8
1.0
400 500 600 700 800
Wave length [nm]
Cor
rela
tion
coef
ficie
nt
Figure 2: Dependency of correlation coefficient on the wavelength, used for extinction measurement.
LightextinctionofBSAsamplesintherangeof0.3–20μgwasmeasuredforwavelengthbetween400nmand800nm.ThecorrelationcoefficientwascalculatedfromtheBSAamountperassay(0.3–20μgperassay)andcorrespondingextinctionsignal.

MACHEREY-NAGEL – 05 / 2014, Rev. 0412
3 Storage conditions and preparation of working solutions
Attention:
Quantification Reagent QR contains hydrochloric acid. Wear gloves and goggles!
• Allkitcomponentsshouldbestoredatroomtemperature(18–25 °C).Storageatlower temperatures may cause precipitation in the Protein Solving Buffer PSB. Kit components are stable up to one year.
Before starting the Protein Quantification Assaypreparethefollowing:
• Dissolve the reference protein (BSA, 1 mg) in 1 mL Protein Solving Buffer PSB toobtaina1mg / mLBSAstocksolution.FreezeBSAstocksolution for longtermstorage;forshorttermstoragekeepsolutionat4 °C.Ifnecessary,dissolveanyprecipitatebyheating the referencesolution (approx.30 °C)beforeuse.BSAstocksolution(1mg / mLBSAinPSB)isstableat-20 °Cto+20 °Cforsixmonths.
Protein Quantification Assay
50 assays 250 assaysREF 740967.50 740967.250
BSA (reference protein)
1 mg add 1 mL PSB
2 x 1 mg add 1 mL PSB to each vial
ProteinQuantificationAssay
13MACHEREY-NAGEL – 05 / 2014, Rev. 04
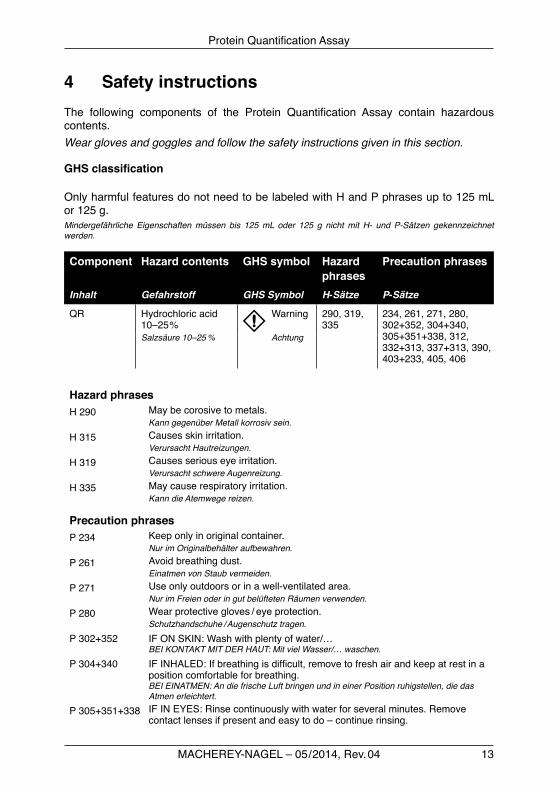
4 Safety instructionsThe following components of the Protein Quantification Assay contain hazardouscontents. Wear gloves and goggles and follow the safety instructions given in this section.
GHS classification
Only harmful features do not need to be labeled with H and P phrases up to 125 mL or 125 g. Mindergefährliche Eigenschaften müssen bis 125 mL oder 125 g nicht mit H- und P-Sätzen gekennzeichnet werden.
Component Hazard contents GHS symbol Hazard phrases
Precaution phrases
Inhalt Gefahrstoff GHS Symbol H-Sätze P-Sätze
QR Hydrochloric acid 10–25 %
Warning 290, 319, 335
234, 261, 271, 280, 302+352, 304+340, 305+351+338, 312, 332+313, 337+313, 390, 403+233, 405, 406
Salzsäure 10–25 % Achtung
Hazard phrasesH 290 May be corosive to metals.
Kann gegenüber Metall korrosiv sein.H 315 Causes skin irritation.
Verursacht Hautreizungen.H 319 Causes serious eye irritation.
Verursacht schwere Augenreizung.H 335 May cause respiratory irritation.
Kann die Atemwege reizen.
Precaution phrasesP 234 Keep only in original container.
Nur im Originalbehälter aufbewahren.P 261 Avoid breathing dust.
Einatmen von Staub vermeiden.P 271 Use only outdoors or in a well-ventilated area.
Nur im Freien oder in gut belüfteten Räumen verwenden.P 280 Wear protective gloves / eye protection.
Schutzhandschuhe / Augenschutz tragen.P 302+352 IFONSKIN:Washwithplentyofwater/…
BEI KONTAKT MIT DER HAUT: Mit viel Wasser/… waschen.P 304+340 IFINHALED:Ifbreathingisdifficult,removetofreshairandkeepatrestina
position comfortable for breathing.BEI EINATMEN: An die frische Luft bringen und in einer Position ruhigstellen, die das Atmen erleichtert.
P 305+351+338 IFINEYES:Rinsecontinuouslywithwaterforseveralminutes.Removecontact lenses if present and easy to do – continue rinsing.
ProteinQuantificationAssay

MACHEREY-NAGEL – 05 / 2014, Rev. 0414
BEI KONTAKT MIT DEN AUGEN: Einige Minuten lang behutsam mit Wasser spülen. Vorhandene Kontaktlinsen nach Möglichkeit entfernen. Weiter spülen.
P 312 CallaPOISONCENTER/doctor/…/ifyoufeelunwell.Bei Unwohlsein GIFTINFORMATIONSZENTRUM / Arzt /… anrufen.
P 332+313 Ifskinirritationoccurs:Getmedicaladvice/attention.Bei Hautreizung: Ärztlichen Rat einholen / ärztliche Hilfe hinzuziehen.
P 337+313 Get medical advice / attention.Bei anhaltender Hautreizung: Ärztlichen Rat einholen / ärztliche Hilfe hinzuziehen.
P 390 Absorb spillage to prevent material damage.Verschüttete Mengen aufnehmen, um Materialschäden zu vermeiden.
P 403+233 Store in a well ventilated place. Keep container tightly closed.Behälter dicht verschlossen an einem gut belüfteten Ort augbewahren.
P 405 Store locked up.Unter Verschluss aufbewahren.
P 406 Store in corrosive resistant container with a resistant inner liner.In korrosionsbeständigem Behälter mit korrosionsbeständiger Auskleidung aufbewahren.
ForfurtherinformationpleaseseeMaterialSafetyDataSheets (www.mn-net.com). Weiterführende Informationen finden Sie in den Sicherheitsdatenblättern (www.mn-net.com).
The symbol shown on labels refers to the precaution phrases of this section.Das auf Etiketten dargestellte Symbol weist auf die P-Sätzen dieses Kapitels hin.
ProteinQuantificationAssay

15MACHEREY-NAGEL – 05 / 2014, Rev. 04
5 Protocols
5.1 Microplate assay procedure
Before starting the preparation:• Check if the BSA reference protein stock solution was prepared according to
section 3.• Make sure that there are no precipitates in Protein Solving Buffer PSB and in
thereverenceprotein(BSA)solution(ifnecessary,heattoapprox.30 °C).
1 Prepare a BSA (reference protein) dilution series
NumbersevenreactiontubesaccordingtocolumnA(seetablebelow;# 1:BSAstock solution).
Add 50 μL Protein Solving Buffer PSBtotubes# 2–# 7(columnB).
Add BSA solutiontotubes# 2–# 6according to column C.
The resulting protein concentration and amount are shown in columns D and E.
PSB contains detergent! When pipetting BSA and PSB solutions avoid bubble formation and foaming as far as possible.
A B C D ETube Add PSB
to tubeAdd BSA solution
to tubeResulting BSA concentration
Resulting BSA in 20 μL
# 1 BSA stock solution 1μg/μL 20μg# 2 50μL 50 μL from tube # 1 0.5μg/μL 10μg# 3 50μL 50μLfromtube# 2 0.25μg/μL 5μg# 4 50μL 50μLfromtube# 3 0.125μg/μL 2.5μg# 5 50μL 50μLfromtube# 4 0.063μg/μL 1.25μg# 6 50μL 50μLfromtube# 5 0.031μg/μL 0.625μg# 7 50μL – 0μg/μL 0μg
The prepared BSA dilutions series is sufficient for the determination of two calibrationcurves.FreezeBSAstocksolutionforstorage.Keepdilutionsseriesat room temperature during use and dispose all dilutions at the end of a working day.
Microplate assay

MACHEREY-NAGEL – 05 / 2014, Rev. 0416
2 Dispense dilution series into microplate
Add 20 μL of each dilution series solution (# 1–# 7) intomicroplate wells.
(# 1: BSA stock solution; # 2–# 6: BSA dilutions; # 7: BSA-free PSB)
20 μL of dilution series
3 Dispense your protein samples
Pipette 20 μL of your samples to empty wells.
Alternatively, 1–60 μL of sample can be applied.
20 μL of samples
4 Fill up dilution series and protein samples
Add 40 μL PSB to each well (dilution series and protein samples). Finalvolumeis60μL.
Alternatively, when applying other sample volumes than 20 μL in step 3, fill up with PSB to a final volume of 60 μL (e.g., 10 μL sample + 50 μL PSB).
+ 40 μL PSB
5 Add Quantification Reagent QR
Add 40 μL Quantification Reagent QR to each well (dilution series and protein samples).
Shake microplate until a complete color change from blue to yellow occurs.
Caution: Quantification Reagent QR contains hydrochloric acid. Wear protective clothing and goggles.
+ 40 μL QR
Shake microplate
6 Incubate
Incubate microplate for 30 min at room temperature.
Gently shake microplate after incubation, but avoid bubble formation and foaming. For optimalmeasurement the solutionsurface in the microplate well should be free of bubbles and foam. Light scattering caused by foam has impact on the measurement.
A variation in incubation time may result in reduced signal and loss of sensitivity. An incubation time of 30 ± 5 min is recommended.
Incubate 30 min
Microplate assay
17MACHEREY-NAGEL – 05 / 2014, Rev. 04
7 Measure light extinction
Measure light extinction photometrically at 570 nm.
Light extinction can be measured in the range of 530–700 nm. Typical correlation coefficients (concentration of BSA versus extinction value) of 0.97–1.00 are obtained within this wavelength range.
Measure extinction at 570 nm
8 Calculate protein concentration
Calculate protein concentration of samples in relation to the BSA dilution series.
Make sure that the protein concentration of your sample lies within the range of the largest (# 1) and the smallest (# 6) concentration of the calibration curve in order to obtain valid measurements. Do not extrapolate beyond this range.
Calculate protein
concentration
Microplate assay

MACHEREY-NAGEL – 05 / 2014, Rev. 0418
5.2 Semi-microcuvette assay procedure
Before starting the preparation:• Check if the BSA reference protein stock solution was prepared according to
section 3.• Make sure that there are no precipitates in Protein Solving Buffer PSB and in
thereverenceprotein(BSA)solution(ifnecessary,heattoapprox.30 °C).
1 Prepare a BSA (reference protein) dilution series
NumbersevenreactiontubesaccordingtocolumnA(seetablebelow;# 1:BSAstock solution).
Add 250 μL Protein Solving Buffer PSBtotubes# 2–# 7(columnB).
Add BSA solutiontotubes# 2–# 6according to column C.
The resulting protein concentration and amount are shown in columns D and E.
A B C D ETube Add PSB
to tubeAdd BSA solution
to tubeResulting BSA concentration
Resulting BSA in 20 μL
# 1 BSA stock solution 1μg/μL 200μg# 2 250μL 250μLfromtube# 1 0.5μg/μL 100μg# 3 250μL 250μLfromtube# 2 0.25μg/μL 50μg# 4 250μL 250μLfromtube# 3 0.125μg/μL 25μg# 5 250μL 250μLfromtube# 4 0.063μg/μL 12.5μg# 6 250μL 250μLfromtube# 5 0.031μg/μL 6.25μg# 7 250μL – 0μg/μL 0μg
The prepared BSA dilutions series is sufficient for the determination of one calibrationcurve.FreezeBSAstocksolutionforstorage.Keepdilutionsseriesatroom temperature during use and dispose all dilutions at the end of a working day.
2 Dispense dilution series into microcentrifuge tubes
Pipette 200 μL of each dilution series solution (# 1–# 7) into1.5 mL microcentrifuge tubes (not supplied).
(# 1: BSA stock solution; # 2–# 6: BSA dilutions; # 7: BSA-free PSB)
200 μL of dilution series
Semi-micro cuvette assay

19MACHEREY-NAGEL – 05 / 2014, Rev. 04
3 Dispense your protein samples
Pipette 200 μL of your samples to (new) microcentrifuge tubes.
Alternatively, 10–600 μL of sample can be applied.
200 μL of samples
4 Fill up dilution series and protein samples
Add 400 μL PSB to each microcentrifuge tube (dilution series andproteinsamples).Finalvolumeis600μL.
Alternatively, when applying other sample volumes than 200 μL in step 3, fill up with PSB to a final volume of 600 μL (e.g., 100 μL sample + 500 μL PSB).
+ 400 μL PSB
5 Add Quantification Reagent QR
Add 400 μL Quantification Reagent QR to each microcentrifuge tube (dilution series and protein samples).
Shake tubes until a complete color change from blue to yellow occurs.
Caution: Quantification Reagent QR contains hydrochloric acid. Wear protective clothing and goggles.
+ 400 μL QR
Shake tubes
6 Incubate
Incubate microcentrifuge tubes for 30 min at room temperature.
Shake tubes after incubation. Do not centrifuge tubes at this point.
A variation in incubation time may result in reduced signal and loss of sensitivity. An incubation time of 30 ± 5 min is recommended.
Incubate 30 min
7 Measure light extinction
Transfer the solution of each tube to a suitable semi-micro cuvette. Measure light extinction photometrically at 570 nm.
Light extinction can be measured in the range of 530–700 nm. Typical correlation coefficients (concentration of BSA versus extinction value) of 0.97–1.00 are obtained within this wavelength range.
Measure extinction at 570 nm
Semi-micro cuvette assay
MACHEREY-NAGEL – 05 / 2014, Rev. 0420
8 Calculate protein concentration
Calculate protein concentration of samples in relation to the BSA dilution series.
Make sure that the protein concentration of your sample lies within the range of the largest (# 1) and the smallest (# 6) concentration of the calibration curve in order to obtain valid measurements. Do not extrapolate beyond this range.
Calculate protein
concentration
Semi-micro cuvette assay
21MACHEREY-NAGEL – 05 / 2014, Rev. 04
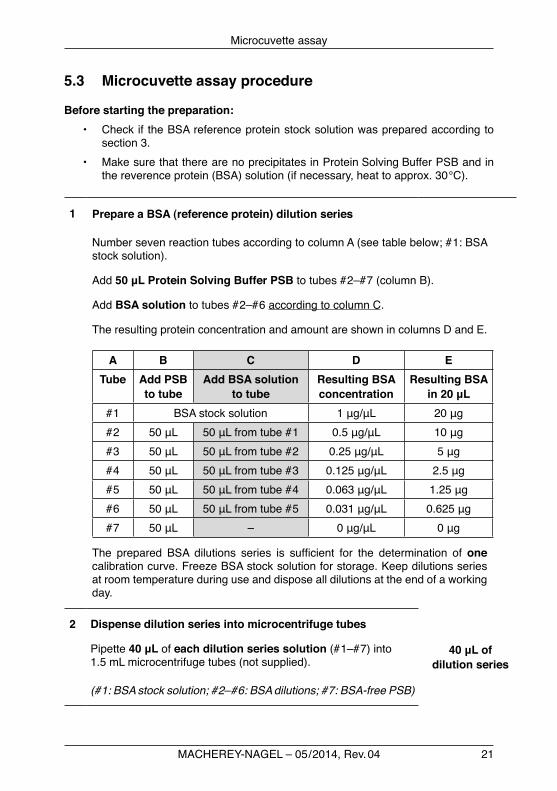
5.3 Microcuvette assay procedure
Before starting the preparation:• Check if the BSA reference protein stock solution was prepared according to
section 3.• Make sure that there are no precipitates in Protein Solving Buffer PSB and in
thereverenceprotein(BSA)solution(ifnecessary,heattoapprox.30 °C).
1 Prepare a BSA (reference protein) dilution series
NumbersevenreactiontubesaccordingtocolumnA(seetablebelow;# 1:BSAstock solution).
Add 50 μL Protein Solving Buffer PSBtotubes# 2–# 7(columnB).
Add BSA solutiontotubes# 2–# 6according to column C.
The resulting protein concentration and amount are shown in columns D and E.
A B C D ETube Add PSB
to tubeAdd BSA solution
to tubeResulting BSA concentration
Resulting BSA in 20 μL
# 1 BSA stock solution 1μg/μL 20μg# 2 50μL 50μLfromtube# 1 0.5μg/μL 10μg# 3 50μL 50μLfromtube# 2 0.25μg/μL 5μg# 4 50μL 50μLfromtube# 3 0.125μg/μL 2.5μg# 5 50μL 50μLfromtube# 4 0.063μg/μL 1.25μg# 6 50μL 50μLfromtube# 5 0.031μg/μL 0.625μg# 7 50μL – 0μg/μL 0μg
The prepared BSA dilutions series is sufficient for the determination ofone calibrationcurve.FreezeBSAstocksolutionforstorage.Keepdilutionsseriesat room temperature during use and dispose all dilutions at the end of a working day.
2 Dispense dilution series into microcentrifuge tubes
Pipette 40 μL of each dilution series solution(# 1–# 7)into1.5 mL microcentrifuge tubes (not supplied).
(# 1: BSA stock solution; # 2–# 6: BSA dilutions; # 7: BSA-free PSB)
40 μL of dilution series
Microcuvette assay

MACHEREY-NAGEL – 05 / 2014, Rev. 0422
3 Dispense your protein samples
Pipette 40 μL of your samples to (new) microcentrifuge tubes.
Alternatively, 1–120 μL of sample can be applied.
40 μL of samples
4 Fill up dilution series and protein samples
Add 80 μL PSB to each well (dilution series and protein samples). Finalvolumeis120μL.
Alternatively, when applying other sample volumes than 40 μL in step 3, fill up with PSB to a final volume of 120 μL (e.g., 10 μL sample + 110 μL PSB).
+ 80 μL PSB
5 Add Quantification Reagent QR
Pipette 80 μL Quantification Reagent QR to each tube (dilution series and protein samples).
Shake tube until a complete color change from blue to yellow occurs.
Caution: Quantification Reagent QR contains hydrochloric acid. Wear protective clothing and goggles.
+ 80 μL QR
Shake tube
6 Incubate
Incubate tubes for 30 min at room temperature.
Shake tubes after incubation. Do not centrifuge tubes at this point!
A variation in incubation time may result in reduced signal and loss of sensitivity. An incubation time of 30 ± 5 min is recommended.
Incubate 30 min
7 Measure light extinction
Transfer the solution of each tube to a suitable microcuvette. Measure light extinction photometrically at 570 nm.
Light extinction can be measured in the range of 530–700 nm. Typical correlation coefficients (concentration of BSA versus extinction value) of 0.97–1.00 are obtained within this wavelength range.
Measure extinction at 570 nm
Microcuvette assay

23MACHEREY-NAGEL – 05 / 2014, Rev. 04
8 Calculate protein concentration
Calculate protein concentration of samples in relation to the BSA dilution series.
Make sure that the protein concentration of your sample lies within the range of the largest (# 1) and the smallest (# 6) concentration of the calibration curve in order to obtain valid measurements. Do not extrapolate beyond this range.
Calculate protein
concentration
Microcuvette assay

MACHEREY-NAGEL – 05 / 2014, Rev. 0424
5.4 Low volume assay procedure
Before starting the preparation:• Check if the BSA reference protein stock solution was prepared according to
section 3.• Make sure that there are no precipitates in Protein Solving Buffer PSB and in
thereverenceprotein(BSA)solution(ifnecessary,heattoapprox.30 °C).
1 Prepare a BSA (reference protein) dilution series
NumbersixreactiontubesaccordingtocolumnA(seetablebelow;# 1:BSAstocksolution).
Add 20 μL Protein Solving Buffer PSBtotubes# 2–# 6(columnB).
Add BSA solutiontotubes# 2–# 5according to column C.
The resulting protein concentration and amount are shown in columns D and E.
A B C D ETube Add PSB
to tubeAdd BSA solution
to tubeResulting BSA concentration
Resulting BSA in 20 μL
# 1 BSA stock solution 1μg/μL 7.5μg# 2 20μL 20μLfromtube# 1 0.5μg/μL 3.75μg# 3 20μL 20μLfromtube# 2 0.25μg/μL 1.88μg# 4 20μL 20μLfromtube# 3 0.125μg/μL 0.94μg# 5 20μL 20μLfromtube# 4 0.063μg/μL 0.47μg# 6 20μL – 0μg/μL 0μg
The prepared BSA dilutions series is sufficient for the determination of two calibrationcurves.FreezeBSAstocksolutionforstorage.Keepdilutionsseriesat room temperature during use and dispose all dilutions at the end of a working day.
2 Dispense dilution series into microcentrifuge tubes
Pipette 7.5 μL of each dilution series solution(# 1–# 6)into1.5 mL microcentrifuge tubes (not supplied).
(# 1: BSA stock solution; # 2–# 5: BSA dilutions; # 6: BSA-free PSB)
7.5 μL of dilution series
Low volume assay

25MACHEREY-NAGEL – 05 / 2014, Rev. 04
3 Dispense your protein samples
Pipette 7.5 μL of your samples to (new) microcentrifuge tubes.
7.5 μL of samples
4 Fill up dilution series and protein samples
Not necessary! Proceed directly with step 5.
5 Add Quantification Reagent QR
Add 5 μL Quantification Reagent QR to each tube (dilution series and protein samples).
Mix (e.g., by pipetting up and down) until a complete color change from blue to yellow occurs.
Caution: Quantification Reagent QR contains hydrochloric acid. Wear protective clothing and goggles.
+ 5 μL QR
Mix
6 Incubate
Incubate tubes for 30 min at room temperature.
Shake tubes after incubation. Do not centrifuge at this point!
A variation in incubation time may result in reduced signal and loss of sensitivity. An incubation time of 30 ± 5 min is recommended.
Incubate 30 min
7 Measure light extinction
Transfer 10μL of the solution of each tube to a suitable low volume photometer with 1 mm path length. Measure light extinction photometrically at 570 nm. Avoid bubbles in the solution because they severely disturb the measurement.
Caution: The solution to be measured contains HCl; check the compatibility of your instrument with HCl. Do not spill. Immediately remove solution from the photometer after measurement.
Light extinction can be measured in the range of 530–700 nm. Typical correlation coefficients (concentration of BSA versus extinction value) of 0.97–1.00 are obtained within this wavelength range.
Measure extinction at 570 nm
Low volume assay

MACHEREY-NAGEL – 05 / 2014, Rev. 0426
8 Calculate protein concentration
Calculate protein concentration of samples in relation to the BSA dilution series.
Make sure that the protein concentration of your sample lies within the range of the largest (# 1) and the smallest (# 5) concentration of the calibration curve in order to obtain valid measurements. Do not extrapolate beyond this range.
Calculate protein
concentration
Low volume assay
27MACHEREY-NAGEL – 05 / 2014, Rev. 04
ProteinQuantificationAssay
6 Appendix
6.1 Guidance for data analysis – calculation of protein concentration
For calculation of protein concentration of unknown samples it is necessary toprepare a BSA (reference protein) dilution series that is generated from known protein concentrations.
As guidance for calculation please follow each calculation steps listed below as an example.
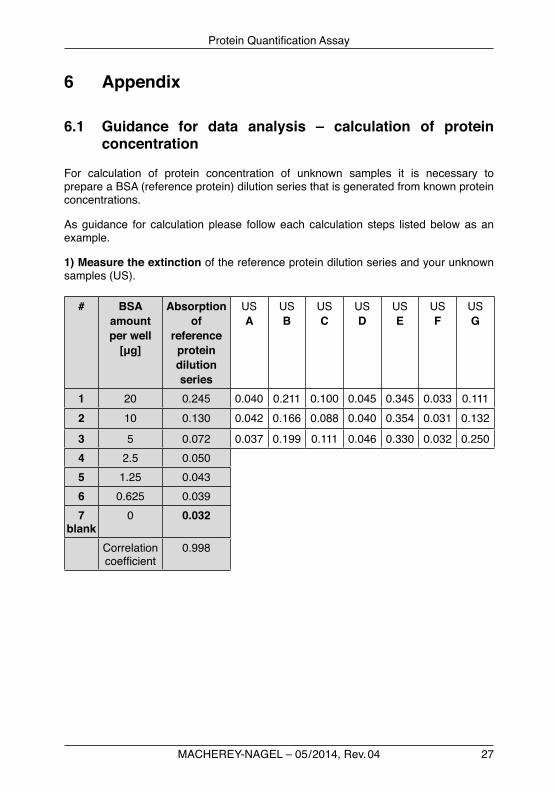
1) Measure the extinction of the reference protein dilution series and your unknown samples (US).
# BSA amount per well
[μg]
Absorption of
reference protein dilution series
US A
US B
US C
US D
US E
US F
US G
1 20 0.245 0.040 0.211 0.100 0.045 0.345 0.033 0.1112 10 0.130 0.042 0.166 0.088 0.040 0.354 0.031 0.132
3 5 0.072 0.037 0.199 0.111 0.046 0.330 0.032 0.2504 2.5 0.0505 1.25 0.0436 0.625 0.0397
blank0 0.032
Correlation coefficient
0.998

MACHEREY-NAGEL – 05 / 2014, Rev. 0428
2) The correct raw data is obtained by subtracting the blank value from the values of the protein standards and unknown samples.
# BSA amount per well
[μg]
Reference protein dilution series
US A
US B
US C
US D
US E
US F
US G
1 20 0.213 0.008 0.179 0.068 0.013 0.313 0.001 0.0792 10 0.098 0.011 0.134 0.056 0.008 0.322 -0.002 0.100
3 5 0.040 0.005 0.167 0.079 0.014 0.298 -0.001 0.2184 2.5 0.0185 1.25 0.0116 0.625 0.0077
blank0 0
3) Create a standard curve by plotting the extinction values versus the reference protein amount per well. Plot a linear regression for the set of standards and calculate the equation of this line.
BSA amount per well [µg]
Extin
ctio
n E 5
70 n
m
0.250
0.200
0.150
0.100
0.050
0.0000 5 10 15 20
Calibration curve – blank corrected
y = 0.0107x – 0.0052R2 = 0.995
In this case the equation is y = 0.0107x - 0.0052.
29
Protein Quantification Assay
MACHEREY-NAGEL – 05 / 2014, Rev. 04
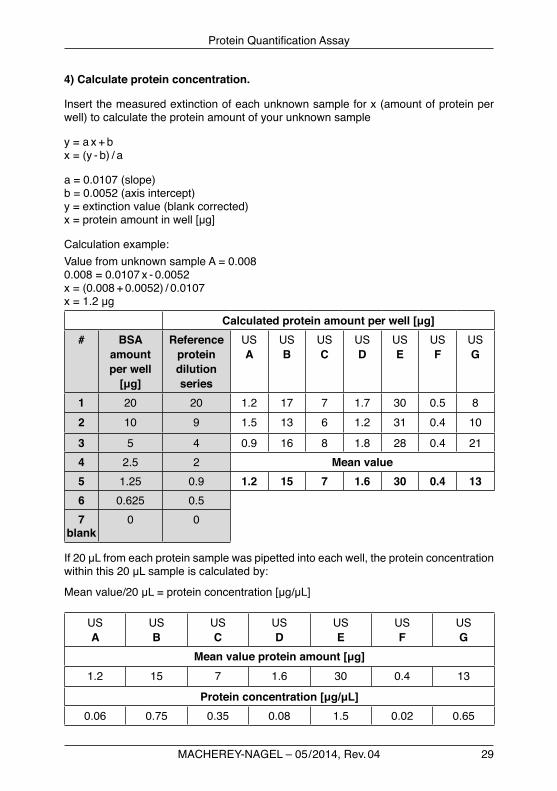
4) Calculate protein concentration.
Insert the measured extinction of each unknown sample for x (amount of protein per well) to calculate the protein amount of your unknown sample
y = a x + b x = (y - b) / a
a = 0.0107 (slope) b = 0.0052 (axis intercept) y = extinction value (blank corrected) x = protein amount in well [μg]
Calculationexample:ValuefromunknownsampleA=0.008 0.008 = 0.0107 x - 0.0052 x = (0.008 + 0.0052) / 0.0107 x = 1.2 μg
Calculated protein amount per well [μg]# BSA
amount per well
[μg]
Reference protein dilution series
US A
US B
US C
US D
US E
US F
US G
1 20 20 1.2 17 7 1.7 30 0.5 82 10 9 1.5 13 6 1.2 31 0.4 10
3 5 4 0.9 16 8 1.8 28 0.4 214 2.5 2 Mean value5 1.25 0.9 1.2 15 7 1.6 30 0.4 136 0.625 0.57
blank0 0
If 20 μL from each protein sample was pipetted into each well, the protein concentration within this 20 μLsampleiscalculatedby:
Mean value/20 μL = protein concentration [μg/μL]
US A
US B
US C
US D
US E
US F
US G
Mean value protein amount [μg]1.2 15 7 1.6 30 0.4 13
Protein concentration [μg/μL]0.06 0.75 0.35 0.08 1.5 0.02 0.65

Protein Quantification Assay
MACHEREY-NAGEL – 05 / 2014, Rev. 0430
5) Interpretate the results.
• Results within the range of the reference dilution series are trustworthy.
• Results higher than for the most concentrated reference dilution should be considered with care. Do not extrapolate, just interpolate. Remeasure your sample with a smaller aliquot.
• Results smaller than for the most diluted reference protein sample should be interpreted with care. Remeasure the sample using a larger aliquot.
6.2 Troubleshooting
Problem Possible cause and suggestions
Lowest value of calibration curve cannot be measured
Storage of dilution series• Do not store dilution series of the BSA reference protein.
Prepare fresh dilution series.
Photometer, microplates or cuvettes• Sensitivity of the assaymaybe influencedby the typeof
photometer, microplates, or cuvettes used. If the lowest calibration point is not discriminated against background, prepare a calibration series with higher BSA amounts.
Samples appear turbid after addition of QuantificationReagent QR
High protein concentration• As long as the measured extinction of your sample falls
within the range of the calibration curve, this is acceptable.
Varyingresultsupon multiple measurements
Samples not mixed immediately before extinction measurement• Shake microplate immediately before extinction measure-
ment.
• Shake reaction tubes after incubation and before transfer to semi-micro cuvettes. After transfer of samples to semi-micro cuvettes, measure extinction immediately.
• Strictly keep to the recommended incubation time.
• DonotcentrifugeatanytimeafteradditionofQuantificationReagent QR.
• Avoid bubble formation and foaming, especially for protocol section 5.1. (microplate assay procedure). Light scattering caused by foam has impact on turbidity measrurements.

31
Protein Quantification Assay
MACHEREY-NAGEL – 05 / 2014, Rev. 04
Problem Possible cause and suggestions
Protein Solving Buffer PSB appears turbid
Low storage temperature• WarmPSBtoapprox.30 °C.
Similar extinction for all dilution series samples
Fill-level of semi-micro or microcuvette not compatible with photometer• Make sure that the sample volume in the semi-micro
cuvette is high enough to let the light beam pass through the solution. Consult your photometer user manual. Check the compatibility of disposable cuvettes used with your photometer – consider light beam center height and cuvette fillvolume.
6.3 Ordering information
Product REF Number of assays or preparations
ProteinQuantificationAssay 740967.50 / .250 50 / 250
NucleoSpin® RNA/Protein 740933.10 / 50 / .250 10 / 50 / 250
NucleoSpin® TriPrep* 740966.10 / 50 / .250 10 / 50 / 250
Porablot transfer membranes see www.mn-net.com/bioanalysis
Blotting paper see www.mn-net.com/bioanalysis
* DISTRIBUTION AND USE OF NUCLEOSPIN® TRIPREP IN THE USA IS PROHIBITED FOR PATENTREASONS.

Protein Quantification Assay
MACHEREY-NAGEL – 05 / 2014, Rev. 0432
6.4 References
Bradford MM (1976):Arapidandsensitivemethodforthequantitationofmicrogramquantities of protein utilizing the principle of protein-dye binding. Anal. Biochem. 72, 248-254.
Karlsson JO et al.(1994):AmethodforproteinassayinLaemmlibuffer.AnalyticalBiochemistry 219, 144-146.
Laemmli UK(1970):Cleavageofstructuralproteinsduringtheassemblyoftheheadof bacteriophage T4. Nature 227, 680-685 (1970).
Lowry OH et al.(1951):ProteinmeasurementwiththeFolinphenolreagent.J.Biol.Chem. 193, 265-275.
Smith PK et al. (1985): Measurement of protein using bicinchoninic acid. Anal.Biochemem. 150(1), 76-85.
6.5 Product use restriction / warranty
Protein Quantification Assay kit components were developed, designed, distributed, andsoldFORRESEARCHPURPOSESONLY,except,however,anyotherfunctionoftheproductbeingexpresslydescribedinoriginalMACHEREY-NAGELproductleaflets.
MACHEREY-NAGEL products are intended for GENERAL LABORATORY USEONLY!MACHEREY-NAGELproductsaresuitedforQUALIFIEDPERSONNELONLY!MACHEREY-NAGEL products shall in any event only be used wearing adequatePROTECTIVE CLOTHING. For detailed information please refer to the respectiveMaterial Safety Data Sheet of the product! MACHEREY-NAGEL products shallexclusivelybeused inanADEQUATETESTENVIRONMENT.MACHEREY-NAGELdoes not assume any responsibility for damages due to improper application of our products inother fieldsofapplication.Applicationon thehumanbody isSTRICTLYFORBIDDEN.Therespectiveuserisliableforanyandalldamagesresultingfromsuchapplication.
DNA/RNA/PROTEIN purification products of MACHEREY-NAGEL are suitable forIN VITRO-USESONLY!
ONLY MACHEREY-NAGEL products specially labeled as IVD are also suitablefor IN VITRO-diagnostic use. Please pay attention to the package of the product. IN VITRO-diagnosticproductsareexpresslymarkedasIVDonthepackaging.
IF THERE IS NO IVD SIGN, THE PRODUCT SHALL NOT BE SUITABLE FORIN VITRO-DIAGNOSTIC USE!
ALL OTHER PRODUCTS NOT LABELED AS IVD ARE NOT SUITED FOR ANYCLINICAL USE (INCLUDING, BUT NOT LIMITED TO DIAGNOSTIC, THERAPEUTIC AND/OR PROGNOSTIC USE).
Noclaimor representations is intended for itsuse to identifyanyspecificorganismor for clinical use (included, but not limited to diagnostic, prognostic, therapeutic, or

33
Protein Quantification Assay
MACHEREY-NAGEL – 05 / 2014, Rev. 04
blood banking). It is rather in the responsibility of the user or - in any case of resale of the products - in the responsibility of the reseller to inspect and assure the use of the DNA/RNA/proteinpurificationproductsofMACHEREY-NAGELforawell-definedandspecificapplication.
MACHEREY-NAGELshallonlyberesponsiblefortheproductspecificationsandtheperformancerangeofMNproductsaccordingtothespecificationsofin-housequalitycontrol, product documentation and marketing material.
ThisMACHEREY-NAGELproductisshippedwithdocumentationstatingspecificationsand other technical information. MACHEREY-NAGEL warrants to meet the statedspecifications.MACHEREY-NAGEL´ssoleobligationandthecustomer´ssoleremedyis limited to replacement of products free of charge in the event products fail to perform as warranted. Supplementary reference is made to the general business terms and conditionsofMACHEREY-NAGEL,whichareprintedonthepricelist.Pleasecontactus if you wish to get an extra copy.
ThereisnowarrantyforandMACHEREY-NAGELisnotliablefordamagesordefectsarising in shipping and handling (transport insurance for customers excluded), or out of accident or improper or abnormal use of this product; defects in products or components not manufactured byMACHEREY-NAGEL, or damages resulting fromsuchnon-MACHEREY-NAGELcomponentsorproducts.
MACHEREY-NAGEL makes no other warranty of any kind whatsoever, andSPECIFICALLY DISCLAIMS AND EXCLUDES ALL OTHER WARRANTIES OFANY KINDORNATUREWHATSOEVER, DIRECTLYOR INDIRECTLY, EXPRESSOR IMPLIED, INCLUDING, WITHOUT LIMITATION, AS TO THE SUITABILITY,REPRODUCTIVITY, DURABILITY, FITNESS FORA PARTICULAR PURPOSE ORUSE,MERCHANTABILITY,CONDITION,ORANYOTHERMATTERWITHRESPECTTOMACHEREY-NAGELPRODUCTS.
In no event shall MACHEREY-NAGEL be liable for claims for any other damages,whether direct, indirect, incidental, compensatory, foreseeable, consequential, or special(includingbutnotlimitedtolossofuse,revenueorprofit),whetherbaseduponwarranty, contract, tort (including negligence) or strict liability arising in connection with thesaleorthefailureofMACHEREY-NAGELproductstoperforminaccordancewiththestatedspecifications.ThiswarrantyisexclusiveandMACHEREY-NAGELmakesno other warranty expressed or implied.
The warranty provided herein and the data, specifications and descriptions of thisMACHEREY-NAGELproductappearinginMACHEREY-NAGELpublishedcataloguesand product literature are MACHEREY-NAGEL´s sole representations concerningthe product and warranty. No other statements or representations, written or oral, by MACHEREY-NAGEL´semployees,agentorrepresentatives,exceptwrittenstatementssignedbyadulyauthorizedofficerofMACHEREY-NAGELareauthorized;theyshouldnot be relied upon by the customer and are not a part of the contract of sale or of this warranty.
Product claims are subject to change. Therefore please contact our Technical Service Team for the most up-to-date information on MACHEREY-NAGEL products. Youmayalsocontactyour localdistributor forgeneralscientific information.Applicationsmentioned inMACHEREY-NAGEL literatureareprovided for informationalpurposesonly.MACHEREY-NAGELdoesnotwarrantthatallapplicationshavebeentestedin
Protein Quantification Assay
MACHEREY-NAGEL – 05 / 2014, Rev. 0434
MACHEREY-NAGELlaboratoriesusingMACHEREY-NAGELproducts.MACHEREY-NAGEL does not warrant the correctness of any of those applications.
Lastupdated:07/2010,Rev.03
Pleasecontact: MACHEREY-NAGELGmbH&Co.KG Tel.:+492421969-270 [email protected]
Trademarks:
NanoPhotometer is a trademark of IMPLEN Ltd. NucleoSpinisaregisteredtrademarkofMACHEREY-NAGELGmbH&CoKG
All used names and denotations can be brands, trademarks, or registered labels of their respective owner – also if they are not special denotation. To mention products and brands is only a kind of information (i.e., it does not offend against trademarks and brands and can not be seen as a kind of recommendation or assessment). Regarding these products or services we can not grant any guaranteesregardingselection,efficiency,oroperation.