proteome analysis of recombinant xylose-fermenting...
TRANSCRIPT

YeastYeast 2003; 20: 295–314.Published online in Wiley InterScience (www.interscience.wiley.com). DOI: 10.1002/yea.960
Research Article
Proteome analysis of recombinant xylose-fermentingSaccharomyces cerevisiae
Laura Salusjarvi1*, Marjo Poutanen2, Juha-Pekka Pitkanen1#, Heini Koivistoinen2, Aristos Aristidou1##,Nisse Kalkkinen2, Laura Ruohonen1 and Merja Penttila1
1VTT Biotechnology, PO Box 1500, FIN-02044 VTT, Finland2 Institute of Biotechnology, Laboratory of Protein Chemistry, PO Box 56, 00014 University of Helsinki, Finland
*Correspondence to:Laura Salusjarvi, VTTBiotechnology, PO Box 1500,FIN-02044 VTT, Finland.E-mail: [email protected]
# Current address: MediCel Ltd,Haartmaninkatu 8, FIN-00290Helsinki, Finland.
## Current address: Cargill DowLLC, 15305 MinnetonkaBoulevard, Minnetonka, MN55345, USA.
Received: 22 July 2002Accepted: 11 November 2002
AbstractIntroduction of an active xylose utilization pathway into Saccharomyces cerevisiae,which does not naturally ferment pentose sugars, is likely to have a major impact onthe overall cellular metabolism as the carbon introduced to the cells will now flowthrough the pentose phosphate pathway. The metabolic responses in the recombinantxylose-fermenting S. cerevisiae were studied at the proteome level by comparativetwo-dimensional gel electrophoresis of cellular proteins within a pH range of 3–10.Glucose-limited chemostat cultivations and corresponding chemostat cultivationsperformed in media containing xylose as the major carbon source were compared.The cultivations were studied in aerobic and anaerobic metabolic steady states andin addition at time points 5, 30 and 60 min after the switch-off of oxygen supply. Weidentified 22 proteins having a significant abundance difference on xylose comparedto glucose, and 12 proteins that responded to change from aerobic to anaerobicconditions on both carbon sources. On xylose in all conditions studied, major changeswere seen in the abundance of alcohol dehydrogenase 2 (Adh2p), acetaldehydedehydrogenases 4 and 6 (Ald4p and Ald6p), and DL-glycerol 3-phosphatase (Gpp1p).Our results give indications of altered metabolic fluxes especially in the acetate andglycerol pathways in cells growing on xylose compared to glucose. Copyright 2003John Wiley & Sons, Ltd.
Keywords: Saccharomyces cerevisiae; xylose; ethanol; proteome; proteomics; two-dimensional gel electrophoresis; pentose phosphate pathway; metabolic engineering
Introduction
Although Saccharomyces cerevisiae is not able toferment or grow on xylose, it has been reported tometabolize it at a slow rate (van Zyl et al., 1989)and evidence for endogenous genes encoding allthree xylose pathway enzymes; xylose reductase,xylitol dehydrogenase and xylulokinase exists (Battet al., 1986; Ho and Chang, 1989; Kuhn et al.,1995; Richard et al., 1999, 2000). Our laboratoryhas constructed a xylose-utilizing yeast strain byintroducing the genes encoding xylose reductase(XYL1 ; XR) and xylitol dehydrogenase (XYL2 ;XDH) from the yeast Pichia stipitis (Kotter et al.,
1990) into S. cerevisiae and recently by over-expressing the endogenous xylulokinase encodinggene (XKS1 ; XK) (Richard et al., 2000; Toivariet al., 2001). These enzymes catalyse the sequen-tial reduction of xylose to xylitol (XR) and oxi-dation of xylitol to xylulose (XDH), followedby the phosphorylation of xylulose to xylulose-5-phosphate (XK), which can then enter the pen-tose phosphate pathway and subsequently be con-verted to ethanol. As a result, aerobic growthand even anaerobic ethanol production on xylosehave been achieved, but still a large fraction ofconsumed xylose is excreted as xylitol (Elias-son et al., 2000; Ho et al., 1998; Toivari et al.,2001).
Copyright 2003 John Wiley & Sons, Ltd.

296 L. Salusjarvi et al.
The introduction of these two redox enzymesis expected to have a major impact on the redoxbalance of the cell. This has been suggested to beone of the major reasons for inefficient incorpora-tion of xylose-derived carbon into the central path-ways leading to ethanol (Kotter and Ciriacy, 1993).Xylose reductase has a preference for NADPH overNADH, while xylitol dehydrogenase is specific forNAD+. Consequently, the conversion of xylose toxylulose results in net NADPH consumption andNADH formation, even though the conversion isoverall redox neutral. Especially under anaerobicconditions, this leads to production of unwantedside products such as xylitol (Kotter and Ciri-acy, 1993).
S. cerevisiae is assumed to import xylose viathe same system as glucose and the possibil-ity that uptake of xylose is a significant limitingstep in xylose fermentation cannot be excluded.The reactions downstream of XDH, including thestep converting xylulose to xylulose-5-phosphateas well as subsequent transketolase and transal-dolase reactions, may also be limiting. In a strainwithout overexpressed xylulokinase, overexpres-sion of the transaldolase-encoding gene enhancedgrowth on xylose, but not in a strain overexpress-ing xylulokinase (Johansson and Hahn-Hagerdal,2002; Walfridsson et al., 1995). However, overex-pression of the endogenous xylulokinase-encodinggene was shown to have a more profound effectswith decreased secretion of xylitol, increased fluxto ethanol and increased ethanol yield on xylosein aerobic and anaerobic conditions (Eliassonet al., 2000; Toivari et al., 2001). In spite of this,metabolic rates and ethanol yields obtained on thispentose sugar remain still considerably below thelevels achieved when hexose sugars are employed.
For the analysis of the overall protein pattern andabundancies proteomics methods offer an attractiveand global strategy, and can be used to study theeffects of the introduction of the xylose pathway onthe cellular metabolism of S. cerevisiae. Proteomeanalysis is already well established in yeast butthere are nevertheless relatively few examples ofits effective application in order to understand andsolve real metabolic problems, although the num-ber of studies is constantly increasing (Brejning andJespersen, 2002; Godon et al., 1998; Gygi et al.,1999a; Haurie et al., 2001; Norbeck and Blomberg,1997; Vido et al., 2001). However, yeast has been
widely used as a model organism for the method-ological development of analytical techniques ofprotein profiling (large-scale protein identification),for characterization of protein complexes and forstudies of protein–protein interactions. The lat-ter two are becoming increasingly popular and,combined with biological and genomic data, theinformation of protein–protein interactions helpsto provide a physical map of the cell (Blackstockand Mann, 1999; Gavin et al., 2002; Gottschalket al., 1999; Ho et al., 2002; Shevchenko et al.,1996; Uetz et al., 2000).
In our study, we carried out controlled chemostatcultures where the cell physiology can be keptin a steady state. We used xylose or glucose ascarbon sources and both aerobic and anaerobicconditions. In addition, we studied the short-termresponse of the proteome to oxygen depletion.Protein spots displaying variation in intensitiesbetween different cultivations were identified bymass spectrometry. Our results indicate how theyeast responds to the redox co-factor imbalancecreated in the xylose pathway and offer also newinsights, for the first time at the proteome level,to the metabolism of xylose in recombinant S.cerevisiae. Major differences observed in cells onxylose compared to glucose centralize around theredox-balancing reactions.
Materials and methods
Yeast strain
The genetically modified Saccharomyces cerevisiaestrain H2490, constructed from the parent strainCEN.PK2 (MATα,leu2-3/112, ura3-52, trp1-289,his3� 1,MAL2-8 c , SUC 2) (Boles et al., 1996) wasused for all experiments. The strain H2490 con-tains the XYL1 and XYL2 genes of Pichia stipitis,encoding xylose reductase and xylitol dehydroge-nase, respectively, chromosomally integrated intothe URA3 locus. XYL1 is expressed under theconstitutive PGK1 promoter and XYL2 under themodified ADH1 promoter (Ruohonen et al., 1995).In addition, the strain contains the endogenousxylulokinase-encoding gene from S. cerevisiaebetween the modified ADH1 promoter and termi-nator on a multicopy plasmid YEplac195 (uracilselection) and the multicopy plasmid YEplac181(leucine selection) (Gietz and Sugino, 1988) with
Copyright 2003 John Wiley & Sons, Ltd. Yeast 2003; 20: 295–314.

Proteome of xylose-utilizing recombinant yeast 297
the PGK1 promoter and terminator expression cas-sette with no insert. The PGK1 promoter and termi-nator were isolated by HindIII digestion as an 1800bp fragment from pMA91 (Mellor et al., 1983).
H2490 is also cured for its histidine and trypto-phan auxotrophies by integrating HIS3 and TRP1genes back to their respective loci. For the inte-gration, a 1500 bp fragment containing the HIS3gene was isolated from plasmid pRS423 (Christian-son et al., 1992) and a 1300 bp fragment of TRP1from pRS424 (Christianson et al., 1992) by DrdIdigestion. The strain H2490 was transformed withthe above-mentioned fragments separately by thelithium acetate transformation method and platedon synthetic complete plates containing 2% glucosebut without histidine or tryptophan, respectively,for HIS3 integration selection or TRP1 integrationselection. The DrdI fragment used in both caseshad, in addition to the functional HIS3 or TRP1,some vector sequence at both 5′ and 3′ ends. Thecorrect integration was confirmed by amplifyingthe HIS3 or TRP1 region outside of the recom-bination site and sequencing the PCR fragment at3′ and 5′ ends to make sure that no vector sequencehad integrated into the yeast chromosome.
Chemostat cultivations
The yeast precultures were grown in 50 ml ofyeast nitrogen base (YNB, Sigma) supplemented
with 20 g/l glucose in 250 ml shake flasks for20 h at 30 ◦C with agitation of 200 rpm. Cellswere harvested by centrifugation and resuspendedin 50 ml of cultivation media aiming at a startingoptical density (OD600) in the fermenter cultivationof about 1.
The chemostat cultivations were carried out witha working volume of 800 ml in 1.8 l ChemapCMF fermenters (Chemap AG, Switzerland) fedwith YNB without amino acids, supplemented with0.5 ml/l silicone antifoam (AnalaR, BDH) andeither 10 g/l glucose, or 27 g/l xylose and 3 g/lglucose. The cultivations were performed at 30 ◦C,with an agitation speed of 500 rpm and a pH of 5.5maintained with 1 M KOH and 1 M H3PO4. Thetotal gas flow under both aerobic and anaerobicconditions was 0.4 L/min maintained by two massflow controllers (Bronkhorst High-Tech BV, TheNetherlands). Anaerobic conditions were achievedby sparging the bioreactor with nitrogen (99.999%AGA quality 5.0, Finland).
Both fermentations were started as aerobic batchcultures run until the carbon dioxide level wasstabilized. The feed flow of the medium wasstarted at this point yielding a dilution rate (D)of 0.05/h. Both cultivations were glucose-limitedbut the cultures carried out aerobically and anaer-obically on 10 g/l glucose had higher volumetricbiomass content than the xylose-grown cultures(Table 1). Cultivation conditions were maintained
Table 1. Carbon uptake rates and productivities under steady-state conditions. Specific (C-mmol/g-cell/h) (A) andvolumetric rates (C-mmol/h/l) (B) of glucose, xylose and oxygen (OUR) consumption and formation of carbon dioxide(CER), biomass, xylitol, glycerol, acetate and ethanol in the continuous cultivation of the strain H2490 on 27 g/l xylose with3 g/l glucose (XYL27/GLC3) and on 10 g/l glucose (GLC10) under aerobic (after 7.5 residence times) and anaerobic (after6.6 residence times) conditions
Glucose Xylose OUR CER Biomass Xylitol Glycerol Acetate Ethanol
(A) Unit: C-mmol/g-cell/hAerobic
GLC10 −7.22 0 −4.19 4.26 1.86 0 <0.01 0.81 0.48XYL27/GLC −1.95 −3.62 −2.26 2.76 1.93 0.74 0.06 0.02 0.04
AnaerobicGLC10 −27.2 0 0 8.60 1.85 0 2.88 0.66 10.6XYL27/GLC −19.1 −15.4 0 7.49 1.83 7.62 2.78 1.04 12.6
(B) Unit: C-mmol/h/lAerobic
GLC 10 −17.66 0 −10.25 10.43 4.56 0 0 1.98 1.18XYL/GLC 3 −4.86 −9.02 −5.63 6.88 4.81 1.85 0.15 0.06 0.10
AnaerobicGLC 10 −16.02 0 0 5.07 1.09 0 1.70 0.39 6.24XYL/GLC 3 −4.36 −3.50 0 1.71 0.42 1.74 0.63 0.24 2.88
Copyright 2003 John Wiley & Sons, Ltd. Yeast 2003; 20: 295–314.

298 L. Salusjarvi et al.
for 6.5 residence times (time required for replac-ing 6.5 times the reactor content) under aerobicconditions to obtain a metabolic steady state. Forfractional NMR studies performed from these samecultivations (Maaheimo et al., manuscript in prepa-ration), media containing U-13C-glucose (MartekBiosciences Corporation, USA) were applied forone residence time at this point. The total amountof labelled glucose used was 0.1% for both cultiva-tion media used. After two residence times from theend of the feed of the labelled media the chemostatswere changed from aerobic to the anaerobic culti-vation. Feed of the non-labelled media was con-tinued for 5.4 residence times before the feed oflabelled media was again started for one resi-dence time.
For proteomics studies, 10–20 ml culture sam-ples were taken from the labelled phases of theaerobic and anaerobic steady states and from timepoints of 5, 30 and 60 min after the switch-off ofoxygen supply. Cells were harvested by centrifuga-tion (3500 rpm, 2 min at 20 ◦C), washed once with0.9% NaCl and after that immediately frozen byliquid nitrogen and stored at −70 ◦C.
Growth and extracellular products
Cell density was followed optically (Shimadzu,Japan) at 600 nm (OD600) or gravimetrically bymeasuring the cell dry weight. For cell dry weight(CDW, g/l) a known volume of culture sample wascentrifuged (4000 rpm/3000 × g , 5 min at +4 ◦C)and washed with distilled water. The precipitatewas dried overnight at +105 ◦C on pre-weigheddry weight cups and then weighted. The extracel-lular metabolite samples were obtained by filter-ing the supernatant through a 0.45 µm syringe fil-ter (MILLEX-GS, Millipore, France) and stored at−20 ◦C. Glucose, xylose, xylitol, glycerol, acetateand ethanol were measured from filtered cultivationsamples with a Waters HPLC system. The systemconsisted of a 510 pump, 717 autosampler, col-umn oven, Aminex HPX-87H column (Bio-Rad,USA) at 35 ◦C, 410 refractive index (RI) detectorand 2487 dual λ UV detector.
The fermenter outlet gas composition was anal-ysed on-line using a QMG 421C quadrupole massspectrometer (Balzers Pfeiffer Scandinavia AB,Sweden). The Balzers Quadstar 422 software wasemployed to calculate the percentage mole frac-tions of O2, CO2, N2 and Ar. The system was
calibrated using two gases containing Ar/O2/N2at 20 : 20 : 60 vol% and CO2 : Ar at 3 : 97 vol%(Messer Griesheim, Germany).
Preparation of protein extract for isoelectricfocusing
5–10 mg dry mass of cells was resuspended in150 µl 50 mM Hepes, pH 7, 1 mM MgCl2, 0.1 mM
EDTA supplemented with phenylmethylsulphonylfluoride (Sigma, USA) to 1 mM and Pepstatin A(Sigma) to a concentration of 13 µM. 100 µl glassbeads (0.5 mm diameter; Biospec Products, USA)were added to the cell suspension and the suspen-sion in 1.5 ml microcentrifuge tubes was insertedinto a MiniBeadbeater 8 (Biospec Products) andshaken at homogenization speed four times for30 s. The tubes were cooled on ice between eachhomogenization step. After cell breakage, 400 µllysis buffer consisting of 7 M urea (Promega,USA), 2 M thiourea (Fluka, USA), 4% CHAPS(Fluka), 1% Pharmalytes 3–10 (Pharmacia, Swe-den) and 1% DTT (Sigma) was added into thetubes and the mixture was incubated by gentlyshaking for 20 min at room temperature. The super-natants were then withdrawn and centrifuged for5 min at 13 000 rpm. The protein concentration ofsupernatants was determined by the non-interferingprotein assay (Gene Technology Inc., USA) andthe samples were stored at −70 ◦C before isoelec-tric focusing.
Two-dimensional polyacrylamide gelelectrophoresis
The first dimension of the two-dimensional poly-acrylamide gel electrophoresis (2D-PAGE) wasperformed on an IPGphor (Amersham Phar-macia Biotech AB, Sweden) isoelectric focus-ing apparatus. Non-linear, 18 cm long, pH 3–10Immobiline gels (IPG-strips; Amersham Pharma-cia Biotech AB) were rehydrated in a strip holderfor 6 h in 350 µl rehydration buffer containing 9 M
urea (Promega), 0.5% CHAPS (Fluka), 0.2% DTT(Sigma), 0.5% Pharmalytes 3–10 (Pharmacia) and75 µg protein extract. Isoelectric focusing was car-ried out at 20 ◦C with the following settings: 30 V,6 h; 150 V, 1 h; 300 V, 1 h; 600 V, 1 h; linear gra-dient 600–5000 V, 4 h; and 5000 V, 12 h or until70 000 Vh was reached. Prior to the second dimen-sion, the IPG-strips were equilibrated for 10 minin 30 ml of 50 mM Tris–HCl, pH 8.8, 6 M urea
Copyright 2003 John Wiley & Sons, Ltd. Yeast 2003; 20: 295–314.

Proteome of xylose-utilizing recombinant yeast 299
(Promega), 30% glycerol, 2% SDS and 1% (w/v)DTT (Sigma) and then a further 10 min in the samebuffer in which DTT was replaced with 4.5% (w/v)iodoacetamide (Sigma).
The second dimension, 12% SDS–PAGE(Laemmli, 1970), was carried out in a HoeferDALT electrophoresis tank (Pharmacia). After theelectrophoresis, the gels were fixed for 1.5 h in30% ethanol and 0.5% acetic acid and silver-stained using the method of O’Connell andStults (1997).
Scanning and computerized data analysis
Silver-stained 2D gels were scanned using a GS-710 Imaging Densitometer (Bio-Rad, USA) andraw scans were processed using the 2D softwarePDQuest (Bio-Rad). The gel scans were first sub-jected to background subtraction and smoothing toproduce a synthetic gel image. The different gelpatterns were then automatically, with some addi-tional manual editing, matched to each other andthe quantities of matched spots in different gelswere compared. For each sample, mean spot quan-tities were derived from three or four gels runin parallel. The quantification of proteins resolvedwas normalized to the total optical density in eachgel image. The statistical and quantitative analy-ses were performed utilizing functions within thePDQuest software. Proteins displaying significantchanges in quantity between aerobic and anaero-bic steady-state samples taken from two differentcultivations were selected using Student’s t-test.
Protein identification
Proteins were excised from the gel, destained,reduced, alkylated and digested in-gel withtrypsin, as described previously (Poutanen et al.,2001). After desalting, the tryptic peptideswere subjected to matrix-assisted laser desorp-tion/ionization (MALDI) mass spectrometric anal-ysis. MALDI–TOF mass spectra for mass map-ping of tryptic peptides were acquired using aBiflex matrix-assisted laser desorption time-of-flight instrument (Bruker-Daltonik GmbH, Bre-men, Germany), equipped with a nitrogen laseroperating at 337 nm in a positive ion reflectormode. α-Cyano-4-hydroxycinnamic acid was usedas the matrix. The MALDI mass spectra were inter-nally calibrated with angiotensin II and ACTH-clip
18–39 (Sigma-Aldrich Chemie GmbH). The massspectrometer parameters were optimized for themeasuring range of 900–2500 Da.
In cases where the identity of proteins presentwas not established by MALDI analysis alone, ananospray liquid chromatography/electrospray ion-ization tandem mass spectrometer (LC–MS–MS)was used for sequence tag analysis (Poutanenet al., 2001). For these LC–MS–MS analyses,the digests were either desalted and concen-trated or loaded into a precolumn (0.3 mm ×1 mm PepMap, MGU-30-C18PM, LCPackings,The Netherlands) at a flow rate of 10 µl/min. Afterthe pre-concentration and clean-up steps, the pre-column was switched in-line with the LC. ForLC–MS–MS analysis, reversed phase chromatog-raphy was performed on an Ultimate nanochro-matography apparatus (LC Packings, The Nether-lands), using a 75 µm i.d. ×15 cm PepMap column(NAN75-15-03-C18-PM, LC Packings). In a typi-cal analysis, 1–2 µl desalted sample were injectedin LC.
Positive ion electrospray ionization (ESI) spec-tra were recorded using a Q-TOF hybrid massspectrometer (Micromass Ltd, Manchester, UK)equipped with an orthogonal electrospray source(Z-spray) and a modified nano ES-interface (LTQ-ADP, New Objective Inc., Cambridge, MA). TheHPLC column effluents were delivered directlythrough a fused silica capillary to the electrosprayneedle, which was a fused silica distal-end coatedtip (FS360-20-10-D-20; New Objective Inc.).
The programs and servers used for protein iden-tification with mass map-data were: ProFound, inhttp://prowl.rockefeller.edu/cgi-bin/ProFound;Peptide map, in PepSea in http://pepsea.protana.com/; and MS-Fit, in http://prospector.ucsf.edu/mshome3.2.htm. For identification of sequence tagdata we used the following programs and servers:Sequence Tag, in PepSea in http://pepsea.prota-na.com/; ProteinInfo, in http://prowl1.rockefeller.edu/prowl/proteininfo.html; and MS-Tag, inhttp://prospector.ucsf.edu/ucsfhtml3.2/mstagfd.htm.
Results
Chemostat cultivations and experimental design
Two different types of chemostat cultivations, bothwith aerobic (20% oxygen) and anaerobic (0%
Copyright 2003 John Wiley & Sons, Ltd. Yeast 2003; 20: 295–314.

300 L. Salusjarvi et al.
oxygen) phases, were carried out with the recom-binant S. cerevisiae strain H2490 harbouring thegenes for XR and XDH from P. stipitis integratedinto the S. cerevisiae genome and the endoge-nous gene for XK on a multicopy plasmid. Thefirst cultivation was carried out with 10 g/l glu-cose and the second with 3 g/l glucose + 27 g/lxylose. The same dilution rate (D) of 0.05/h wasused for all four chemostat conditions studied inorder to keep the growth rate constant, and soavoid growth rate-dependent changes in the pro-teome (Hayes et al., 2002). The small amount ofglucose was added in the feed of the latter chemo-stat to enable anaerobic growth on xylose. Spe-cific and volumetric rates of carbon utilizationand metabolite production in aerobic and anaer-obic steady states are presented in Table 1 (seealso Juha-Pekka Pitkanen et al., in press). Of thefour conditions studied, the specific ethanol pro-duction rate was highest (12.6 C-mmol/h/g) on thexylose + glucose mixture under anaerobic condi-tions. Under aerobic conditions, 20% xylose wasexcreted as xylitol, whereas under anaerobic con-ditions the corresponding amount was 50%. Theresidual glucose on both glucose and on 3 g/l glu-cose + 27 g/l xylose culture was 0 under bothaerobic and anaerobic conditions. Thus, the growthmodes compared in our study are glucose-limitedand can be regarded as growth and metabolism onglucose under glucose-derepressed conditions andgrowth and metabolism on xylose, since glucoserepression should not be present in glucose-limitedchemostat cultivations performed under our condi-tions (Meijer et al., 1998; Sierkstra et al., 1992; terLinde et al., 1999). Hence, from here onward wesimply refer to glucose and xylose cultivations.
Protein extracts from the cells harvested fromaerobic and anaerobic steady states of the glucoseand xylose chemostats were analysed by compara-tive 2D gel electrophoresis. An example is shownin Figure 1. Samples from time points 5, 30 and60 min after the switch-off of oxygen (see Materi-als and methods) were also analysed. For technicalreasons, silver staining was used for spot detection,although it is less sensitive and tends to underes-timate variation of more abundant proteins com-pared, for instance, to radioactive labelling.
Quantification of changes in protein expressionThe silver stained gel scans were processed bythe image analysis software PDQuest. The total
number of spots resolved and quantified in each gelwas on average 833 ± 83 (SD: n = 33) and therewere no significant differences in spot numbersbetween the gels run from glucose and xylose sam-ples. After spot detection, the gels were matchedto each other with the help of the so-called land-mark function and, according to PDQuest software,659 spots in total could be matched in all 33 gelsanalysed. At this point spots that were near thebackground in their intensity in all gels were dis-carded from the analysis. In no case was a dominantor well-focused spot unmatched. The individualprotein spots on the gels were quantified and nor-malized to the total optical density in gel images.
For analysis of changes in the protein patterns,three to four gels were run from each individualsample and mean quantitative values and standarddeviations were calculated for each protein spot.The Student’s t-test within PdQuest software wasperformed to find statistically significant changesbetween aerobic and anaerobic glucose and xylosesteady-state samples. According to this test, pro-teins were divided into groups corresponding totheir response either to the carbon source usedor to the level of oxygen during the cultivations.Only a few proteins had a clear gradual responseto the switch from aerobic to anaerobic condi-tions within the 1 h transition time studied. Dif-ferences were mainly seen between samples takenfrom the fully aerobic and completely anaerobicsteady states on the same carbon source and whenthe two different carbon sources were compared.However, the gels run from the samples collectedwithin the 1 h transition time after the switch toanaerobiosis increased the number of replica gelsanalysed and showed the consistency of the quan-tification. About 50 spots were found to differ inabundance when glucose and xylose samples werecompared, and 30 when aerobic and anaerobic sam-ples were compared.
Protein spots showing consistent differences inintensity between different conditions (aerobic oranaerobic glucose or xylose chemostat cultivations)were identified by mass spectrometric peptide massmapping or by internal peptide sequencing. Someconstant spots were also identified. Protein iden-tifications were verified by comparisons with the-oretical molecular weights and isoelectric points.We identified 22 proteins that show a clear dif-ference in abundance between glucose and xyloseas carbon sources (Table 2 and Figure 2). We also
Copyright 2003 John Wiley & Sons, Ltd. Yeast 2003; 20: 295–314.

Proteome of xylose-utilizing recombinant yeast 301
identified 12 proteins that responded only to thechange in aerobicity in the two chemostat culti-vations (Table 3 and Figure 3). These proteins arediscussed in detail later. We identified 26 proteinsthat did not respond to any changes under thesecultivation conditions (Table 4).
In the analysis it was also noticed that manyproteins appeared in the gels as more than onespot with essentially the same molecular weight butwith different pI values and abundance, presumablydue to post-translational modifications (Gygi et al.,
2000; see Tables 2, 3 and 4, Figure 1). Proteins forwhich two or more spots were positively identi-fied by MS analyses include cytoplasmic aldehydedehydrogenase (Ald6p), enolase 2 (Eno2p), alcoholdehydrogenase 2 (Adh2p) and 3-isopropylmalatedehydrogenase (Leu2p), all detected in three dif-ferent spots, alcohol dehydrogenase 1 (Adh1p),seen as four spots and, adenosine kinase (Ado1p),heat shock protein Sti1p, translation initiation fac-tor eIF-5A (Hyp2p) and 3-phosphoglycerate kinase(Pgk1p) detected as two separate spots. All these
103
88
17
Mol
ecul
ar w
eigh
t (kD
a)
pI
(a)
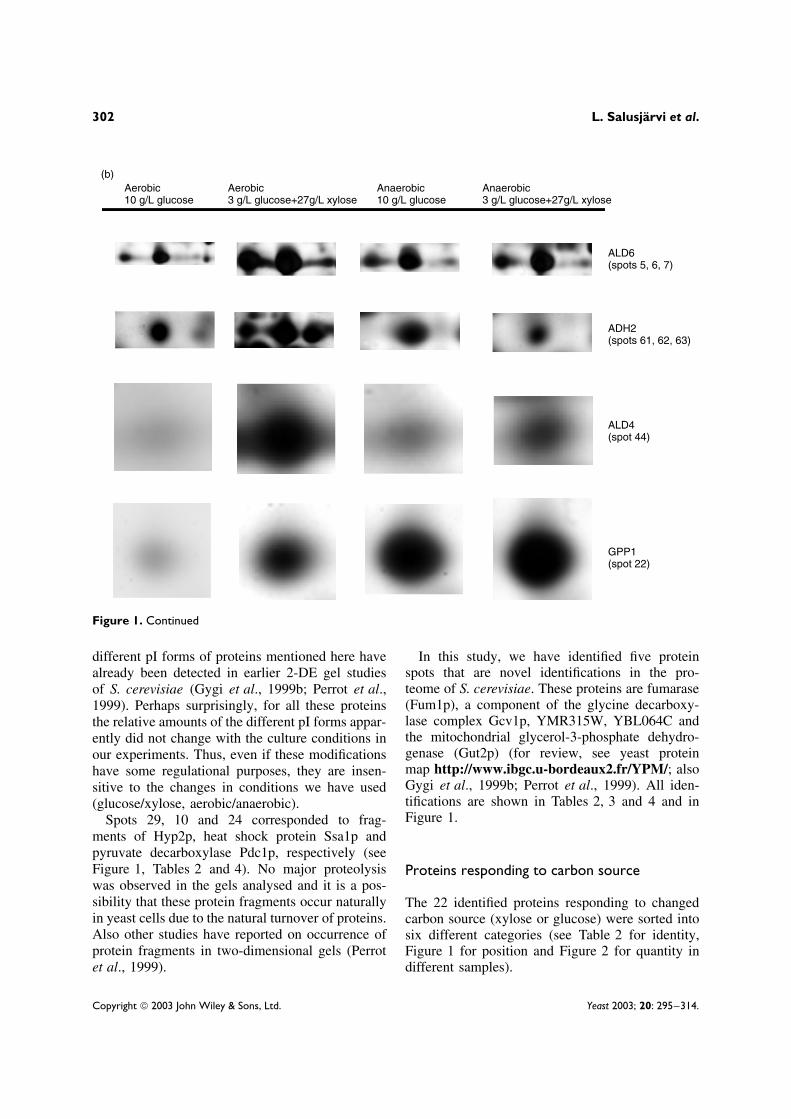
Figure 1. (A) Silver-stained 2D-PAGE pattern of the protein extract from recombinant S. cerevisiae grown aerobically onglucose. The horizontal axis is the isoelectric focusing dimension from pH 3 (left) to pH 10 (right). The vertical axis ispolyacrylamide gel (12%) dimension from 90 kDa to 15 kDa. (B) The protein spots of Ald6p, Adh2p, Ald4p and Gpp1 fromthe gels run from the different chemostat conditions (aerobic 10 g/l glucose, aerobic 3 g/l glucose + 27 g/l xylose, anaerobic10 g/l glucose and anaerobic 3 g/l glucose + 27 g/l xylose). Spot numbers refer to Figure 1A and Table 2
Copyright 2003 John Wiley & Sons, Ltd. Yeast 2003; 20: 295–314.
302 L. Salusjarvi et al.
Aerobic10 g/L glucose
Aerobic3 g/L glucose+27g/L xylose
Anaerobic3 g/L glucose+27g/L xylose
Anaerobic10 g/L glucose
ALD6(spots 5, 6, 7)
ADH2(spots 61, 62, 63)
ALD4(spot 44)
GPP1(spot 22)
(b)
Figure 1. Continued
different pI forms of proteins mentioned here havealready been detected in earlier 2-DE gel studiesof S. cerevisiae (Gygi et al., 1999b; Perrot et al.,1999). Perhaps surprisingly, for all these proteinsthe relative amounts of the different pI forms appar-ently did not change with the culture conditions inour experiments. Thus, even if these modificationshave some regulational purposes, they are insen-sitive to the changes in conditions we have used(glucose/xylose, aerobic/anaerobic).
Spots 29, 10 and 24 corresponded to frag-ments of Hyp2p, heat shock protein Ssa1p andpyruvate decarboxylase Pdc1p, respectively (seeFigure 1, Tables 2 and 4). No major proteolysiswas observed in the gels analysed and it is a pos-sibility that these protein fragments occur naturallyin yeast cells due to the natural turnover of proteins.Also other studies have reported on occurrence ofprotein fragments in two-dimensional gels (Perrotet al., 1999).
In this study, we have identified five proteinspots that are novel identifications in the pro-teome of S. cerevisiae. These proteins are fumarase(Fum1p), a component of the glycine decarboxy-lase complex Gcv1p, YMR315W, YBL064C andthe mitochondrial glycerol-3-phosphate dehydro-genase (Gut2p) (for review, see yeast proteinmap http://www.ibgc.u-bordeaux2.fr/YPM/; alsoGygi et al., 1999b; Perrot et al., 1999). All iden-tifications are shown in Tables 2, 3 and 4 and inFigure 1.
Proteins responding to carbon source
The 22 identified proteins responding to changedcarbon source (xylose or glucose) were sorted intosix different categories (see Table 2 for identity,Figure 1 for position and Figure 2 for quantity indifferent samples).
Copyright 2003 John Wiley & Sons, Ltd. Yeast 2003; 20: 295–314.

Proteome of xylose-utilizing recombinant yeast 303
Table 2. Identified proteins responding to change in carbon source. The spot numbers refer to Figure 1 (see also Figure 2for quantitation). The two right-most columns indicate the mode of response on xylose relative to glucose under aerobicand anaerobic conditions (up, down or same)
Quantity on xylose relative toquantity on glucose
Spot number Genea Description pIb/MWc Aerobic Anaerobic
Proteins of central carbon metabolism11 GPD1 Glycerol-3-phosphate
dehydrogenase5.27/43.2 Same Down
5, 6, 7 ALD6 Aldehyde dehydrogenase,cytoplasmic (NADP+)
5.38/54.4 Up Up
22 GPP1 DL-glycerol-3-phosphatase 5.43/27.8 Up Up44 ALD4 Aldehyde dehydrogenase,
mitochondrial [NAD(P)+ ]5.88/54.1 Up Same
40, 41, 42 ENO2 Enolase 2 5.82/46.8 Up Up61, 62, 63 ADH2 Alcohol dehydrogenase 2 6.51/36.6 Up Down
Proteins of TCA cycle and energy generation52 FUM1 Fumarase 7.00/50.1 Down Down50 CYB2 L-lactate cytochrome c
oxidoreductase cytochrome b2
6.36/56.6 Up Same
67 MDH1 Malate dehydrogenase,mitochondrial
7.00/33.8 Down Down
68 IDH2 Isocitrate dehydrogenase (NAD+)subunit 2
7.36/37.8 Down Down
69 IDH1 Isocitrate dehydrogenase (NAD+)subunit 1
8.13/38.0 Down Down
76 ATP7 F-type H+-transporting ATPase dchain
9.08/19.7 Down Down
Proteins of amino acid metabolism47 LYS4 Homoaconitate hydratase 7.23/75.1 Up Up53 GCV1 Component of glycine decarboxylase
complex, mitochondrial9.02/44.3 Down Down
Proteins related to nucleotide metabolism18, 19 ADO1 Adenosine kinase 5.05/36.2 Down Down31 ADK1 Adenylate kinase 5.97/24.1 Down Down
Heat shock proteins2 SSE1 Heat shock protein of the HSP70
family5.02/77.2 Up Same
25 HSP26 Heat shock protein 26 5.44/23.7 Up Down46 HSP78 Heat shock protein 78 of the ClpB
family of ATP-dependent proteases6.13/85.1 Down Down
Other proteins56 YHB1 Flavohaemoglobin 6.04/44.6 Down Down65 YMR315W Unknown, putative oxidoreductase 6.40/38.1 Up Up74 YBL064C Mitochondrial thiol peroxidase 9.09/29.5 Down Same
a Gene names according to SGD; http://genome-www4.stanford.edu/cgi-bin/SGD/locus.plb Computed in Swiss Prot from the complete sequence; http://www.expasy.ch/sprot/c Predicted mature values in kDa according to YPD; http://www.proteome.com/databases/index.html
Carbon source-responding proteins related tocentral carbon metabolism
The most significant changes in protein quantitiesbetween glucose- and xylose-grown cells weredetected in proteins belonging to this category.
The proteins identified were glycerol-3-phosphatedehydrogenase isoenzyme 1 (Gpd1p), DL-glycerol-3-phosphate phosphatase isoenzyme 1 (Gpp1p),enolase 2 (Eno2p), alcohol dehydrogenase 2(Adh2p), and both mitochondrial and cytoplasmic
Copyright 2003 John Wiley & Sons, Ltd. Yeast 2003; 20: 295–314.

304 L. Salusjarvi et al.
ENO2
0.0
1000.0
2000.0
3000.0
4000.0
5000.0
6000.0
7000.0
G1 G2 G3 G4 G5 X1 X2 X3 X4 X5
Arb
itra
ry u
nit
s
GPD1
0.0
200.0
400.0
600.0
800.0
1000.0
1200.0
1400.0
1600.0
G1 G2 G3 G4 G5 X1 X2 X3 X4 X5A
rbit
rary
un
its
GPP1
0.0
500.0
1000.0
1500.0
2000.0
2500.0
3000.0
3500.0
4000.0
4500.0
5000.0
G1 G2 G3 G4 G5 X1 X2 X3 X4 X5
Arb
itra
ry u
nit
s
ADH2
0.0
1000.0
2000.0
3000.0
4000.0
5000.0
6000.0
7000.0
8000.0
9000.0
10000.0
G1 G2 G3 G4 G5 X1 X2 X3 X4 X5
Arb
itra
ry u
nit
s
ALD4
-500.0
0.0
500.0
1000.0
1500.0
2000.0
2500.0
G1 G2 G3 G4 G5 X1 X2 X3 X4 X5
Arb
itra
ry u
nit
s
ALD6
0.0
1000.0
2000.0
3000.0
4000.0
5000.0
6000.0
7000.0
8000.0
G1 G2 G3 G4 G5 X1 X2 X3 X4 X5
Arb
itra
ry u
nit
s
FUM1
0.0
1000.0
2000.0
3000.0
4000.0
5000.0
6000.0
7000.0
8000.0
9000.0
G1 G2 G3 G4 G5 X1 X2 X3 X4 X5
Arb
itra
ry u
nit
s
IDH1
0.0
5000.0
10000.0
15000.0
20000.0
25000.0
G1 G2 G3 G4 G5 X1 X2 X3 X4 X5
Arb
itra
ry u
nit
s
IDH2
0.0
2000.0
4000.0
6000.0
8000.0
10000.0
12000.0
G1 G2 G3 G4 G5 X1 X2 X3 X4 X5
Arb
itra
ry u
nit
s
MDH1
0.0
1000.0
2000.0
3000.0
4000.0
5000.0
6000.0
7000.0
G1 G2 G3 G4 G5 X1 X2 X3 X4 X5
Arb
itra
ry u
nit
s
ATP7
0.0
500.0
1000.0
1500.0
2000.0
2500.0
3000.0
3500.0
4000.0
G1 G2 G3 G4 G5 X1 X2 X3 X4 X5
Arb
itra
ry u
nit
s
GCV1
0.0
500.0
1000.0
1500.0
2000.0
2500.0
3000.0
3500.0
4000.0
G1 G2 G3 G4 G5 X1 X2 X3 X4 X5
Arb
itra
ry u
nit
s
LYS4
0.0
200.0
400.0
600.0
800.0
1000.0
1200.0
G1 G2 G3 G4 G5 X1 X2 X3 X4 X5
Arb
itra
ry u
nit
s
ADO1
0.0
500.0
1000.0
1500.0
2000.0
2500.0
G1 G2 G3 G4 G5 X1 X2 X3 X4 X5
Arb
itra
ry u
nit
s
ADK1
0.0
1000.0
2000.0
3000.0
4000.0
5000.0
6000.0
G1 G2 G3 G4 G5 X1 X2 X3 X4 X5
Arb
itra
ry u
nit
s
HSP78
0.0
200.0
400.0
600.0
800.0
1000.0
1200.0
1400.0
1600.0
1800.0
G1 G2 G3 G4 G5 X1 X2 X3 X4 X5
Arb
itra
ry u
nit
s
HSP26
0.0
2000.0
4000.0
6000.0
8000.0
10000.0
12000.0
14000.0
G1 G2 G3 G4 G5 X1 X2 X3 X4 X5
Arb
itra
ry u
nit
s
SSE1
0.0
50.0
100.0
150.0
200.0
250.0
300.0
350.0
400.0
450.0
G1 G2 G3 G4 G5 X1 X2 X3 X4 X5
Arb
itra
ry u
nit
s
YMR315W
0.0
500.0
1000.0
1500.0
2000.0
2500.0
3000.0
G1 G2 G3 G4 G5 X1 X2 X3 X4 X5
Arb
itra
ry u
nit
s
CYB2
0.0
200.0
400.0
600.0
800.0
1000.0
1200.0
1400.0
1600.0
G1 G2 G3 G4 G5 X1 X2 X3 X4 X5
Arb
itra
ry u
nit
s
YBL064C
0.0
200.0
400.0
600.0
800.0
1000.0
1200.0
G1 G2 G3 G4 G5 X1 X2 X3 X4 X5
Arb
itra
ry u
nit
s
YHB1
0.0
500.0
1000.0
1500.0
2000.0
2500.0
3000.0
G1 G2 G3 G4 G5 X1 X2 X3 X4 X5
Arb
itra
ry u
nit
s
Figure 2. Quantification of protein expression of xylose-responding protein spots from Figure 1 and Table 2. Spots in gelimages were quantified as described in Materials and methods. The vertical axis represents arbitrary units of expression.Histograms indicate the mean quantitative values and standard deviations calculated from the replica gels. On the x axissamples are in the following order: G1, aerobic glucose chemostat; G2, G3 and G4, 5, 30 and 60 min after the switch-offof oxygen; G5, anaerobic glucose chemostat; X1, aerobic xylose chemostat; X2, X3 and X4, 5, 30 and 60 min after theswitch-off of oxygen; and X5, anaerobic xylose culture
Copyright 2003 John Wiley & Sons, Ltd. Yeast 2003; 20: 295–314.

Proteome of xylose-utilizing recombinant yeast 305
Table 3. Identified proteins responding to the level of oxygen. Spot numbers refer to Figure 1 (see Figure 3 forquantitation). The right-most column indicates the mode of response aerobically relative to anaerobic conditions (up, downor same)
Spot number Genea Description pIb/MWc
Quantity aerobicallycompared to
quantityanaerobically
3, 4 STI1 Heat shock protein 5.42/66.3 Up16 SGT2 Unknown, has 32% identity to STI1 4.63/37.1 Up17 YIL041W Hypothetical ORF 4.71/36.6 Up26 PRE3 20S proteasome subunit 5.73/23.5 Up27, 28, 29 (frag.) HYP2 Translation initiation factor eIF-5A 4.77/17.0 Up32 YMR226C Protein with similarity to insect-type
short-chain alcohol dehydrogenase6.59/29.0 Up
33 GPP2 DL-glycerol-3-phosphatase 5.97/27.7 Up36 YDL124W Hypothetical ORF, has similarity to
aldo/keto reductases5.97/35.4 Same/down
43 FRDS1 Cytoplasmic soluble fumaratereductase
6.11/50.7 Down
49 GUT2 Mitochondrial FAD-dependentglycerol-3-phosphate dehydrogenase
7.14/68.4 Up
57, 58, 59, 60 ADH1 Alcohol dehydrogenase 1 6.30/36.7 Down75 SOD2 Manganese superoxide dismutase 6.29/23.1 Up
a Gene names according to SGD; http://genome-www4.stanford.edu/cgi-bin/SGD/locus.plb Computed in SwissProt from the complete sequence; http://www.expasy.ch/sprot/c Predicted mature values in kDa according to YPD; http://www.proteome.com/databases/index.html
acetaldehyde dehydrogenases, Ald4p and Ald6p,respectively. There are clearly three classesof proteins with respect to the pattern ofchanges observed.
1. Significantly decreased levels on anaerobicxylose. The level of Gpd1p remained relativelyconstant during the glucose chemostat cultiva-tion; however, it had decreased to one half inthe anaerobic steady state. In turn, the amountof Gpd1p in the anaerobic xylose culture wasonly one-third of the amount in the correspond-ing glucose steady state and also significantlylower compared to the aerobic xylose cultiva-tion.
2. Increased levels on anaerobic cultivations andoverall on xylose. The amount of Gpp1p wasthree- to four-fold higher in the anaerobic steadystates on both carbon sources in comparisonwith the corresponding aerobic steady states.Interestingly, the response to oxygen depletionwas much faster on xylose. Already within5 min after the switch-off of oxygen, Gpp1phad reached an about 2.5-fold higher levelthan that of the aerobic steady state. In addi-tion, Gpp1p level was higher throughout the
xylose chemostat cultivation compared to theglucose cultivation, also at the aerobic steadystate. In contrast, Gpp2p, the other DL-glycerol-3-phosphatase isoenzyme, responded mainly tooxygen depletion and not significantly to changein the carbon source (see also below; proteinsresponding to oxygen level). The quantity pro-files of Eno2p were very similar to that ofGpp1p; significantly higher levels in anaerobiccultivations, with a quick response to oxygenswitch-off on xylose, and overall higher levelson this carbon source.
3. Increased levels on aerobic xylose and in addi-tion, one member of this class shows overallincrease on xylose. The abundance of three pro-teins involved in ethanol utilization, Adh2p,Ald4p and Ald6p, was strongly increased inthe aerobic steady state on xylose compared toglucose. While the levels of Adh2p and Ald4premained low on glucose and were stronglydecreased on xylose as soon as oxygen wasdepleted, the level of Ald6p was about threetimes higher in all anaerobic xylose samplescompared to the corresponding samples col-lected from the glucose culture.
Copyright 2003 John Wiley & Sons, Ltd. Yeast 2003; 20: 295–314.

306 L. Salusjarvi et al.
STI1
0.0
200.0
400.0
600.0
800.0
1000.0
1200.0
1400.0
G1 G2 G3 G4 G5 X1 X2 X3 X4 X5
Arb
itra
ry u
nit
s
SGT2
0.0
200.0
400.0
600.0
800.0
1000.0
1200.0
1400.0
1600.0
G1 G2 G3 G4 G5 X1 X2 X3 X4 X5A
rbit
rary
un
its
SOD2
0.0
1000.0
2000.0
3000.0
4000.0
5000.0
6000.0
G1 G2 G3 G4 G5 X1 X2 X3 X4 X5
Arb
itra
ry u
nit
s
YIL041W
0.0
500.0
1000.0
1500.0
2000.0
2500.0
G1 G2 G3 G4 G5 X1 X2 X3 X4 X5
Arb
itra
ry u
nit
s
GUT2
0.0
500.0
1000.0
1500.0
2000.0
2500.0
3000.0
3500.0
G1 G2 G3 G4 G5 X1 X2 X3 X4 X5
Arb
itra
ry u
nit
s
YMR226C
0.0
500.0
1000.0
1500.0
2000.0
2500.0
G1 G2 G3 G4 G5 X1 X2 X3 X4 X5A
rbit
rary
un
its
PRE3
0.0
100.0
200.0
300.0
400.0
500.0
600.0
G1 G2 G3 G4 G5 X1 X2 X3 X4 X5
Arb
itra
ry u
nit
s
YDL124W
0.0
500.0
1000.0
1500.0
2000.0
2500.0
3000.0
3500.0
4000.0
G1 G2 G3 G4 G5 X1 X2 X3 X4 X5
Arb
itra
ry u
nit
s
GPP2
0.0
500.0
1000.0
1500.0
2000.0
2500.0
3000.0
3500.0
G1 G2 G3 G4 G5 X1 X2 X3 X4 X5
Arb
itra
ry u
nit
s
HYP2
0.0
2000.0
4000.0
60000.
8000.0
10000.0
12000.0
G1 G2 G3 G4 G5 X1 X2 X3 X4 X5
Arb
itra
ry u
nit
s
FRDS1
0.0
200.0
400.0
600.0
800.0
1000.0
1200.0
1400.0
G1 G2 G3 G4 G5 X1 X2 X3 X4 X5A
rbit
rary
un
its
ADH1
0.0
1000.0
2000.0
3000.0
4000.0
5000.0
6000.0
7000.0
8000.0
G1 G2 G3 G4 G5 X1 X2 X3 X4 X5
Arb
itra
ry u
nit
s
Figure 3. Quantification of protein expression of protein spots responding to the change in aerobicity from Figure 1 andTable 3. Spots in gel images were quantified as described in Materials and methods. The vertical axis represents arbitraryunits of expression. Histograms indicate the mean quantitative values and standard deviations calculated from the replicagels. On the x axis samples are in the following order: G1 aerobic glucose chemostat; G2, G3 and G4, 5, 30 and 60 minafter the switch-off of oxygen; G5, anaerobic glucose chemostat; X1, aerobic xylose chemostat; X2, X3 and X4, 5, 30 and60 min after the switch-off of oxygen; and X5, anaerobic xylose culture
Carbon source-responding proteins of tricarboxylicacid cycle and energy generation
Six protein spots were identified as two sub-units of mitochondrial NAD+-dependent isoci-trate dehydrogenase (Idh1p and Idh2p), mitochon-drial malate dehydrogenase (Mdh1p), fumarase(Fum1p), L-lactate cytochrome c oxidoreductasecytochrome b2 (Cyb2p), and subunit 7 of F0-ATP synthase (Atp7p). These protein spots, exceptCyb2p, behaved quantitatively in a similar fash-ion. Anaerobic steady-state levels on both car-bon sources were roughly equal but clearly lowerthan the corresponding steady-state aerobic lev-els. More interestingly in respect to the twocarbon sources, they all had an overall lowerlevel in xylose samples, in particular Fum1p andIdh1p. In turn, the amount of Cyb2p was shiftedup on the aerobic xylose cultivation more than
two-fold, whereas its level was otherwise rela-tively low and constant, independent of the carbonsource.
Carbon source-responding proteins of amino acidmetabolism
Two proteins of this category responded tothe two different carbon sources studied. Thequantity of homoaconitase hydratase (Lys4p) waselevated in anaerobic glucose cultivation and wasat this high level also from the beginning tothe end of the xylose cultivation. The otherprotein, (Gcv1p) is a component of the glycinedecarboxylase complex. The level of this proteinwas reduced during anaerobic cultivation onglucose compared to aerobic conditions. Onxylose, the amount was low throughout the xylosecultivation.
Copyright 2003 John Wiley & Sons, Ltd. Yeast 2003; 20: 295–314.

Proteome of xylose-utilizing recombinant yeast 307
Table 4. Identified proteins found at constant abundance in this study. Protein spots numberedaccordingly in Figure 1
Spot number Genea Description pIb/MWc
1 HIS4 Histidinol dehydrogenase 5.13/87.68 TIF2 Translation initiation factor 4A 4.99/44.69 SAM2 S-adenosylmethionine synthetase 2 5.21/42.110 (fragment) SSA1 70 kDa heat shock protein 4.96/69.612, 13, 14 LEU2 3-Isopropylmalate dehydrogenase 5.61/38.815 PEP4 Vacuolar proteinase A 4.41/35.720 EFB1 Translation elongation factor EF-1β 4.30/22.621 IPP1 Inorganic pyrophosphatase 5.46/32.223 YLR301W Protein of unknown function 5.04/27.430 TPI1 Triosephosphate isomerase 5.84/26.734 ASC1 Ribosomal protein of the 40S ribosomal subunit that
influences translational efficiency and cell size5.87/34.7
35 XYL1 D-Xylose reductase of Pichia stipitis 5.76/35.937 ARA1 Subunit of NADP+-dependent D-arabinose
dehydrogenase5.76/38.3
38 XYL2 Xylitol dehydrogenase of Pichia stipitis 5.76/38.539 FBA1 Fructose-bisphosphate aldolase II 5.58/39.648 ACO1 Aconitate hydratase 7.07/82.845, 24 (fragment) PDC1 Pyruvate decarboxylase isozyme 1 5.97/61.551 SHM2 Serine hydroxymethyltransferase 7.25/52.154, 55 PGK1 3-phosphoglycerate kinase 7.11/44.664 LYS12 Homo-isocitrate dehydrogenase 8.24/40.166 TDH2/TDH3 Glyceraldehyde 3-phosphate dehydrogenase 2/3 6.72/35.772 POR1 Outer mitochondrial membrane porin 7.94/30.473 GPM1 Phosphoglycerate mutase 8.95/27.571 TEF1/TEF2 Translational elongation factor EF-1α 9.27/50.070 BAT1 Mitochondrial branched-chain amino acid transaminase 7.83/38.777 CPH1 Cyclophilin (peptidylprolyl cis–trans isomerase or
PPIase)6.75/17.3
a Gene names according to SGD; http://genome-www4.stanford.edu/cgi-bin/SGD/locus.pl.b Computed in Swiss Prot from the complete sequence; http://www.expasy.ch/sprot/c Predicted mature values in kDa according to YPD; http://www.proteome.com/databases/index.html
Carbon source-responding proteins related tonucleotide metabolism
The two proteins belonging to this categorywere adenosine kinase (Ado1p) and adenylatekinase (Adk1p). They were both relativelyabundant protein spots and steadily expressedthroughout the cultivations but nevertheless hadlower abundance anaerobically in the xylosecultivation.
Carbon source-responding heat shock proteins
Hsp78p and Hsp26p were present at lowerlevels in the anaerobic glucose cultivation, andwere present at that or at somewhat higherlevel during the entire xylose cultivation. Inturn Sse1p, a heat shock protein belonging tothe Hsp70 family, was strongly induced on
the aerobic xylose cultivation, but it remainedat very low level at the other cultivationsteps.
Other carbon source- responding proteins
Mitochondrial thiol peroxidase YBL064C andyeast flavohaemoglobin (Yhb1p) showed decreasedlevels in the anaerobic steady state on glucose, andthey both were at similar low quantities in theentire xylose cultivation, in particular Yhb1p. Incontrast, YMR315W was constantly at a higherlevel in the xylose cultivation compared to theglucose cultivation. However, in the anaerobicxylose cultivation the amount of YMR315Wwas only about half of that of the aerobiclevel.
Copyright 2003 John Wiley & Sons, Ltd. Yeast 2003; 20: 295–314.

308 L. Salusjarvi et al.
Proteins responding to oxygen level
Mitochondrial glycerol-3-phosphate dehydrogenase(Gut2p) and mitochondrial manganese superoxidedismutase (Sod2p) had approximately four timeslower abundance in the anaerobic cultivations, andthe 20S proteasome subunit (Pre3p) could not bedetected in anaerobic samples. Furthermore, theheat shock protein Sti1p, and Sgt2p (which has32% identity to Sti1p but is without any specifiedfunction) had a two-fold lower abundance anaer-obically compared to aerobic cultures. In addi-tion, Gpp2p, one of the isoforms of DL-glycerol-3-phosphatase, and the translation initiation fac-tor Hyp2p also had about two-fold lower proteinamounts anaerobically compared to the aerobic cul-tivations. Some of these proteins also appeared tohave slightly different abundances on the two car-bon sources studied. Sgt2p had somewhat reducedlevels in xylose samples, whereas Gpp2p showed aslightly higher level aerobically on xylose in com-parison with glucose. In addition, the response tooxygen depletion seems slightly faster on xylosethan on glucose with Gut2 and Gpp2 proteins.
The quantity of YDL124W, a hypothetical ORFwith significant homology to the gene encodinga glycerol dehydrogenase of Aspergillus niger,did not differ between the aerobic and anaerobiccultivations, but instead seemed to respond todepletion of oxygen by a transient increase in theprotein level right after the switch from aerobicto anaerobic conditions. YMR226C, a proteinwith similarity to short-chain dehydrogenases orreductases, had about two-fold lower abundanceanaerobically in the glucose cultivation. However,in the aerobic xylose cultivation its abundance wasonly slightly higher compared to the anaerobicglucose cultivation, and on xylose it showeda transient increase in abundance in responseto oxygen depletion, in a similar fashion toYDL124W. Furthermore, YIL041W had aboutone-third lower abundance anaerobically on bothcarbon sources.
In addition, cytoplasmic fumarate reductase(Frds1p) and alcohol dehydrogenase 1 (Adh1p)had about two- and three-fold increase inabundance, respectively, during anaerobic growthcompared with aerobic conditions on bothcarbon sources. The changes detected betweenaerobic and anaerobic conditions at the proteinlevel of Adh1p, Frds1p, Gpp2p, Gut2p, Hyp2p,
Sod2p, and Sti1p are in accordance withthe results of a transcriptional analysis ofaerobic and anaerobic chemostat cultures of S.cerevisiae (ter Linde, et al., 1999; see also http://www.imp.leidenuniv.nl/ yeast/search.htm).
Discussion
Efficient utilization of the xylose component ofcarbohydrate feedstocks in addition to hexoseswould make it possible to reduce the cost ofbioethanol production. Thus, the xylose metabolicpathway has been studied intensively over the yearsin various naturally xylose-utilizing yeasts, as wellas in recombinant S. cerevisiae strains that havebeen constructed in order to obtain strains that aresuitable for industrial processes. In S. cerevisiae,despite the recombinant xylose pathway, the rateof xylose utilization and the yield of ethanol arestill low and further strain development is needed.
We report here the first proteome-wide study ofxylose-fermenting recombinant S. cerevisiae, aim-ing at a broad insight to the effects of xylose oncellular metabolism. The strain H2490 was culti-vated in chemostats on xylose as the main carbonsource, and for comparison on glucose under bothaerobic and anaerobic conditions for seven andsix residence times, respectively. Clear changesin the quantities of 22 identified proteins wereseen between xylose and glucose samples har-vested from these chemostat cultivations. The cel-lular functions that were most affected are relatedto glycerol metabolism, ethanol consumption andmitochondrial metabolism.
Proteins of glycerol metabolism
As expected, changes between xylose and glu-cose were seen in proteins related to glycerolmetabolism, since NADH-consuming production ofglycerol has an important role in balancing theintracellular redox potential. Glycerol metabolismin S. cerevisiae has been extensively studied andreviewed, e.g. by Bakker et al. (2001). Glycerol-3-phosphate dehydrogenase (Gpd) and DL-glycerol-3-phosphate phosphatase (Gpp), which catalyse glyc-erol synthesis from dihydroxyacetone phosphate,are both encoded by two isogenes. These isoformshave different roles under osmotic and anaerobicstress conditions. The isoforms encoded by GPD1
Copyright 2003 John Wiley & Sons, Ltd. Yeast 2003; 20: 295–314.

Proteome of xylose-utilizing recombinant yeast 309
and GPP2 are osmotically induced, while GPD2and GPP1 are induced under anaerobic condi-tions (Albertyn et al., 1994; Ansell et al., 1997;Costenoble et al., 2000; Pahlman et al., 2001; terLinde et al., 1999). In our proteome study, Gpd1phad reduced levels under anaerobicity, in particu-lar on xylose, and the amounts of Gpp2p were alsolower under oxygen depletion. Further, Gpp1p hadstrongly elevated levels in anaerobic steady states,well in accordance with previous studies. Inter-estingly, in the xylose culture, Gpp1p respondedmore quickly to the switch-off of oxygen thanit did in the glucose culture. This may be dueto an increased demand for NADH oxidation,even aerobically, because of the NAD+-consumingXDH reaction in the xylose pathway. This possi-ble co-factor demand was not, however, seen asan increased level of the reducing enzyme Gpd1p,and Gpd2p, the isoenzyme that is more probablyresponding in concert with Gpp1p, was not iden-tified amongst the proteins responding differentlyto either the carbon source or oxygen level. Addi-tionally, in the anaerobic xylose culture, where thelevel of Gpp1p was highest, the amount of Gpd1pwas lowest, giving support to the idea that Gpd1pindeed does not play a significant role in anaero-bic redox control. This seems to be true also withGpp2p, as its level in anaerobic steady states wasthe lowest in comparison with the other samples.In summary, even though seen only for the DL-glycerol-3-phosphatases, xylose seems to activatethe cellular pathway where oxidation of NADH iscarried out, as a response for the elevated NADHgeneration during xylose metabolism in compari-son with glucose metabolism.
In addition to glycerol synthesis, cells haveaerobically the option to maintain their cytoplas-mic NAD/NADH balance by transfer of reducingequivalents into the mitochondrial electron trans-port chain (de Vries and Marres, 1987). This canbe achieved either via the external NADH dehy-drogenases facing the outer side of the inner mito-chondrial membrane, or by shuttle systems suchas the glycerol-3-phosphate (G3P) shuttle. In theG3P shuttle, G3P, formed by reduction of dihy-droxyacetone phosphate and concomitant oxidationof NADH, passes through the outer mitochondrialmembrane. G3P is then re-oxidized to dihydroxy-acetone phosphate by the FAD-dependent glycerol-3-phosphate dehydrogenase (Gut2p) located on theouter side of the inner membrane of mitochondria
(Bakker et al., 2001; Larsson et al., 1998). GUT2is aerobically induced according to the transcrip-tional profiling data from aerobic and anaerobicglucose-limited chemostat cultures of yeast (terLinde et al., 1999). In addition, it has been reportedthat the dehydrogenase catalysing the cytosolicreaction of the G3P shuttle is encoded by theGPD1 gene (Larsson et al., 1998). These data arein agreement with the proteome profiles of Gut2pand Gpd1p in our study, as we detected a two-and four-fold reduction in the abundance of Gpd1pand Gut2p, respectively, in the fully anaerobic cul-tures on both carbon sources (Figures 2 and 3). Onxylose, shuttles like the G3P shuttle could alle-viate the NAD+ shortage and also explain thealmost equal specific glycerol production rates onxylose and glucose (see Table 1); Pitkanen et al., inpress). However, according to our data, the Gut2pinvolved in the G3P shuttle has similar abundanceon both xylose and glucose, which does not sup-port the suggestion that the shuttle would be moreactive on xylose.
In S. cerevisiae the NAD/NADH and NADP/NA-DPH pools constitute distinct redox couples, dueto the absence of a transhydrogenase activity inyeast that would be able to convert NADH toNADPH. The existence of systems serving astranshydrogenase-like activities has, however, beenpostulated. A study of the proteome in 1.4 M NaCl(Norbeck and Blomberg, 1997) suggested that cou-pling of glycerol formation and degradation couldprovide the cell with an enzymatic cycle function-ing as a transhydrogenase. Actually, it was pro-posed that the hypothetical protein encoded byORF YDL124W, with significant homology to aglycerol dehydrogenase of Aspergillus niger, is oneof the candidates for a yeast glycerol dehydro-genase taking part in this kind of a cycle (Nor-beck and Blomberg, 1997). However, these authorsfound no transcripts for YDL124W under any ofthe growth conditions studied. We were able toidentify the Ydl124w protein in our proteome,and in our study it is classified to the groupof oxygen-responding proteins moderately upreg-ulated immediately after the switch-off of oxygenon both carbon sources (see Figure 3). However,the level of Ydl124w protein returned to the aero-bic level within the five residence times needed toachieve the anaerobic metabolic steady state. Thus,although Ydl124w protein clearly responds to oxy-gen depletion and does so very rapidly (within
Copyright 2003 John Wiley & Sons, Ltd. Yeast 2003; 20: 295–314.

310 L. Salusjarvi et al.
5 min; Figure 3), and is therefore likely to partic-ipate in the adaptation to anaerobicity, our studydoes not support that it would be needed for along-term redox balancing under anaerobic condi-tions. Further, there is no difference in the pro-tein amount or response between the two carbonsources studied.
Aerobic increase of Adh2p, Ald4p, Ald6p andCyb2p levels on xylose
The higher abundance of alcohol dehydrogenaseisoenzyme Adh2p and the acetaldehyde dehydro-genases Ald6p and Ald4p during aerobic growthon xylose-containing media is, according to ourhypothesis, related to the increased NADPH co-factor demand due to XR reaction in the xylosepathway. The increased levels of Adh2p andacetaldehyde dehydrogenases in the aerobic xylosecultures also render support to the fact that, underaerobic conditions on xylose, acetate and ethanolare used as co-substrates for growth, along withxylose (Meinander and Hahn-Hagerdal, 1997).
While Adh1p reduces acetaldehyde to ethanoland is responsible for ethanol production, whichunder anaerobic conditions is used for NAD+regeneration, Adh2p oxidizes ethanol to acetalde-hyde. NADPH or NADH is regenerated whenacetaldehyde is further oxidized to acetate byacetaldehyde dehydrogenases. Acetaldehyde thusproduced is further metabolized by more than oneoptional pathway, either in the cytosol or in themitochondria, all serving either in balancing theredox pools or producing reducing equivalents forthe production of ATP.
1. Acetaldehyde can freely enter the mitochondriaand serve as a substrate for the mitochondrialalcohol dehydrogenase isozyme Adh3p, to forman ethanol–acetaldehyde shuttle that is used toexport redox equivalents from the mitochondrialmatrix to the cytosol. It is suggested that, inanaerobic cultures, this shuttle may play a keyrole in reoxidation of mitochondrial NADHformed by assimilatory reactions that take placein mitochondria also under anaerobic conditions(Bakker et al., 2000, 2001). On xylose this kindof shuttle may play a role in balancing theNAD+/NADH levels of the cell. The shuttle isin principle reversible, thus ethanol producedin the cytosol could alternatively enter themitochondria, and Adh3p will oxidize ethanol
to acetaldehyde, with concomitant reduction ofNAD+. However, as there is no phenotypeaerobically for the ADH3 deletion mutant, noevidence of a role for the ethanol–acetaldehydecycle under aerobic growth exists (Bakker et al.,2000). Adh3p was not identified in our studyamongst the proteins responding differently tothe carbon source or oxygen level.
2. Based on our proteomics results on xylose, how-ever, a more likely fate of acetaldehyde pro-duced by the action of Adh2p (or by Pdc1p) isto serve as a substrate for acetaldehyde dehydro-genases. NADPH or NADH is regenerated whenacetaldehyde is oxidized to acetate by acetalde-hyde dehydrogenases. The existence of at leastfive acetaldehyde dehydrogenase isoforms withdifferent co-factor specificities, known to beable to complement each other, supports theidea of a role for these isoenzymes in main-taining the cytosolic and mitochondrial redoxco-factor pools. Cytosolic Ald6p, the level ofwhich is clearly elevated in the xylose chemo-stat of our study (Figures 1b, 2), is the majorisoform of acetaldehyde dehydrogenases andit almost exclusively uses NADP+ (Dickinson,1996; Remize et al., 2000; Wang et al., 1998).Ald6p has been shown to be functional in bothglucose- and ethanol-grown yeast cells (Rem-ize et al., 2000). Ald6p is responsible for thecytosolic conversion of acetaldehyde to acetate,the latter acting as substrate for acetyl-CoAsynthase, producing the precursor acetyl-CoA,needed for glyoxylate cycle and lipid biosyn-thesis in the cytosol. Ald6p is thus a member ofthe so-called cytosolic pyruvate dehydrogenasebypass, providing the cytosolic compartmentwith acetyl-CoA. In addition, the physiologicalrole of the Ald reaction is very likely the regen-eration of reducing equivalents, the demand forwhich is increased during xylose metabolism viathe XR reaction.
In contrast, mitochondrial Ald4p that is ableuse both NAD+ and NADP+ does not seem tohave a role in acetate production in fermenta-tive metabolism (Remize et al., 2000). The ele-vated levels of this isoenzyme in aerobic xyloseculture of our study (Figures 1b, 2) gives sup-port to our hypothesis that xylose is not readilyregarded as a fermentable carbon source in theyeast cell. Recently, an interesting physiological
Copyright 2003 John Wiley & Sons, Ltd. Yeast 2003; 20: 295–314.

Proteome of xylose-utilizing recombinant yeast 311
role for Ald4p was proposed as the key playerin the so-called mitochondrial pyruvate dehydro-genase bypass (Boubekeur et al., 1999, 2001).Acetaldehyde produced in the cytosol enters themitochondria, where it is oxidized to acetate withconcomitant formation of NADH, which in turnserves to produce ATP. Further, Ald4p increasesthe overall production of NADH in the cell, asit acts as an acetaldehyde pump, and this NAD+-reducing flux increases both ATP production andbiosynthetic pathways. Alternatively, one can envi-sion a role for Ald4p in ethanol consumption inthe mitochondria. Ethanol produced in the cytosolcould enter the mitochondria and be oxidized toacetaldehyde, and further to acetate, by mitochon-drial Adh and Ald isozymes to produce NADH forenergy metabolism (Bakker et al., 2001).
As increased acetate levels on xylose comparedto glucose were not detected in the growth medium(see Table 1), the acetate possibly produced musthave been converted by acetyl-CoA synthetase toacetyl-CoA to serve as a precursor, e.g. in the TCAcycle and lipid metabolism and glyoxylate cycle.In summary, increased levels of Adh2p, and thetwo Ald isoenzymes are indicative of increaseddemand for redox balancing and energy metabolismduring xylose consumption by the cells. As shownby metabolic flux analysis of xylose metabolism(e.g. Pitkanen et al., submitted), a cycle of carbonback to PPP at the level of glucose-6-P to produceNADPH for the XR reaction results in reducedflux to pyruvate, and thus in a reduced formationof NADH for the energy metabolism in aerobicchemostat cultures.
In yeast, the utilization of L (+)-lactate requiresmitochondrial Cyb2p, which oxidizes L(+)-lactateto pyruvate by coupling L-lactate dehydrogena-tion to cytochrome c reduction. Besides repressionin anaerobiosis on non-repressing carbon sourcessuch as galactose and raffinose, the CYB2 gene isreported to be highly induced by non-fermentablecarbon sources such as ethanol, glycerol and,particularly, by lactate (Guiard, 1985; Lodi andGuiard, 1991; Ramil et al., 2000). It is also fullyrepressed by glucose and inhibited by the absenceof heme biosynthesis (Lodi and Guiard, 1991).Here we show higher levels of Cyb2p also in aero-bic xylose cultures. This strengthens our hypothesisthat the utilization of xylose in aerobic conditionstriggers responses in the cell that are similar tothose found on non-fermentable carbon sources. As
ethanol is likely to be utilized (and also glyceroland acetate) as a co-substrate along with xylose,the co-metabolism of these non-fermentable endproducts may further increase the signal for CYB2expression. Increased levels of Adh2p, Ald4p andCyb2p on aerobic xylose culture in our study arein accordance with results obtained from DNAmicroarray analysis of transcription of S. cerevisiaein aerobic and anaerobic glucose-limited chemo-stat cultures (ter Linde et al., 1999). The levelsof most of the proteins identified in our proteomestudy did not change significantly after switch-offof oxygen within the 1 h time range; however,Adh2p, Ald4p and (to a lesser extent) Cyb2p madean exception by almost disappearing within 5 minafter the switch (Figure 2). Our results also suggestthat downregulation of these genes at the tran-scriptional level probably takes place very rapidlyand that it must be combined to surprisingly fastproteolytic degradation. For example, the well-studied glucose-induced degradation of fructose-1,6-bisphosphatase in yeast results in substantiallydecreased protein amounts only after a 30 min timeperiod (Horak et al., 2002).
Mitochondrial proteins
Under anaerobic conditions, oxidation of intramito-chondrial NADH by the respiratory chain is abol-ished and, as a result, the function of the TCAcycle is diminished as well. In our study we seedecreased levels of mitochondrial proteins in anaer-obic cultivations on both carbon sources (Figure 2).This is not surprising as, under anaerobic con-ditions, cells switch to completely fermentativeenergy metabolism, and the role of mitochondrialfunctions reduces to assimilatory metabolism. Moresurprising, however, is the observation that allseven of the identified mitochondrial proteins alsoshow decreased levels on xylose in aerobic cul-tures. We would anticipate them to be at roughlythe same level as in glucose-grown but derepressedcells (for the reasoning of the derepression statein our glucose-limited chemostat cultures, see sec-tion on Chemostat cultivations and experimentaldesign, end of first paragraph). This is against ourhypothesis of xylose being a non-fermentable car-bon source, as growth on xylose should in con-trast then result in elevated mitochondrial func-tions. Interestingly, the metabolic flux analysis of
Copyright 2003 John Wiley & Sons, Ltd. Yeast 2003; 20: 295–314.

312 L. Salusjarvi et al.
metabolism during growth on xylose gave consis-tent results, showing substantially decreased mito-chondrial fluxes (Pitkanen et al., in press).
The reactions from glucose 6-phosphate to ribu-lose 5-phosphate in the oxidative pentose phos-phate pathway are important for regeneration ofthe cytosolic NADPH. The increased need forNADPH on xylose due to the XR reaction requiresconversion of fructose 6-phosphate to glucose 6-phosphate and may create a cycle around the gly-colysis and pentose phosphate pathway, as firstsuggested by Bruinenberg et al. (1983). As men-tioned previously, such a cycle during xylosemetabolism is suggested by metabolic flux anal-ysis (Pitkanen et al., in press; Wahlbom et al.,2001). The cycling in the upper part of glycol-ysis may explain the increased enolase (Eno2p)levels that we see on aerobic and anaerobicxylose cultures, as high levels of glucose 6-phosphate induce Eno2p activity (Muller et al.,1995).
Increase of YMR315W abundance on xylose
Among proteins identified, the abundance ofYMR315W is most markedly increased in xylose-containing medium in all five samples takenfrom the different time points of the culture(Figure 2). YMR315W is a protein of unknownfunction, but it has a weak similarity to glucose-fructose oxidoreductase of Zymomonas mobilis. Ithas also 31% identity to two protein sequences ofSchizosaccharomyces pombe, coding for putativeoxidoreductases SPAC26145.09c and SPBC115.03,and 26% identity to a dihydrodiol dehydrogenaseof Sz. pombe. Glucose-fructose oxidoreductasefrom Z. mobilis converts glucose and fructoseto gluconolactone and sorbitol. The enzymecontains a non-dissociable NADP+, which transfersreducing equivalents between glucose and fructose(Kanagasundaram and Scopes, 1992).
A further indication for a role of YMR315Win xylose utilization is that a homologue ofYMR315W from the xylose-utilizing fungus Tri-choderma reesei (Hypocrea jecorina) was found inour laboratory in a random cDNA bank screen forclones enhancing growth on xylose of the recom-binant xylose-metabolizing S. cerevisiae (unpub-lished results). The function of this putative oxi-doreductase in yeast is still unknown, but it clearly
seems to be related to xylose consumption. Inter-estingly, D-xylose is a substrate of the glucose-fructose oxidoreductase of Z. mobilis (Zachariouand Scopes, 1986).
The significant advantage of the 2-DE gel pro-teomic technique is that it can reveal changes inprotein abundances not predicted by some a priorihypotheses. Our studies revealed several expected,but also interesting unexpected, responses to xyloseas the carbon source and to aerobic vs. anaero-bic conditions. Many of our findings are relatedto the redox balance and/or energy metabolismof the cell, and especially the reactions aroundethanol and acetaldehyde are highly interesting, asshown by the increased amount of Adh2p, Ald4pand Ald6p in the xylose culture. Another partic-ularly interesting observation was the decreasedamounts of proteins of the TCA cycle in xylose-grown cells. Presumably, redox balancing duringxylose metabolism causes loss of carbon in thefutile cycling in the pentose phosphate pathway,resulting in lower flux to pyruvate and hence tothe TCA cycle. Thus, alternative ways for co-factorregeneration are of high importance to increaseethanol yields from this pentose sugar. It is evi-dent that xylose, as a non-natural energy andcarbon source of S. cerevisiae, causes complexmetabolic responses in the cell. The changes arenot explained solely by glucose derepression tak-ing place in the cells in the absence of glucose,particularly since our glucose reference cultureswere in a derepressed state. Further, many of theresponses are related to changes caused by typi-cal non-fermentable carbon sources, strengtheningour belief that xylose is not readily recognized asa fermentable carbon source by S. cerevisiae.
Acknowledgements
Tiina Pakula is acknowledged for collaboration and manyfruitful methodological and experimental discussions in thefield of proteomics. John Londesborough is warmly thankedfor comments on the manuscript. This study was financiallysupported by the Academy of Finland and the TechnologyAgency of Finland (Tekes).
References
Albertyn J, Hohmann S, Thevelein JM, Prior BA. 1994. GPD1,which encodes glycerol-3-phosphate dehydrogenase, is essentialfor growth under osmotic stress in Saccharomyces cerevisiae,
Copyright 2003 John Wiley & Sons, Ltd. Yeast 2003; 20: 295–314.

Proteome of xylose-utilizing recombinant yeast 313
and its expression is regulated by the high-osmolarity glycerolresponse pathway. Mol Cell Biol 14: 4135–4144.
Ansell R, Granath K, Hohmann S, Thevelein JM, Adler L. 1997.The two isoenzymes for yeast NAD+-dependent glycerol 3-phosphate dehydrogenase encoded by GPD1 and GPD2 havedistinct roles in osmoadaptation and redox regulation. EMBO J16: 2179–2187.
Bakker BM, Bro C, Kotter P, et al. 2000. The mitochondrialalcohol dehydrogenase Adh3p is involved in a redox shuttlein Saccharomyces cerevisiae. J Bacteriol 182: 4730–4737.
Bakker BM, Overkamp KM, van Maris AJ, et al. 2001. Stoi-chiometry and compartmentation of NADH metabolism in Sac-charomyces cerevisiae. FEMS Microbiol Rev 25: 15–37.
Batt CA, Carvallo S, Easson DD, Akedo JM, Sinskey AJ. 1986.Direct evidence for a xylose metabolic pathway in Saccha-romyces cerevisiae. Biotechnol Bioeng 28: 549–553.
Blackstock WP. 1999. Proteomics: quantitative and physicalmapping of cellular proteins. TIBTECH 17: 121.
Boles E, Gohlmann HW, Zimmermann FK. 1996. Cloning ofa second gene encoding 5-phosphofructo-2-kinase in yeast,and characterization of mutant strains without fructose-2,6-bisphosphate. Mol Microbiol 20: 65–76.
Boubekeur S, Bunoust O, Camougrand N, Castroviejo M, Rigou-let M, Guerin B. 1999. A mitochondrial pyruvate dehydroge-nase bypass in the yeast Saccharomyces cerevisiae. J Biol Chem274: 21 044–21 048.
Boubekeur S, Camougrand N, Bunoust O, Rigoulet M, Guerin B.2001. Participation of acetaldehyde dehydrogenases in ethanoland pyruvate metabolism in the yeast Saccharomyces cerevisiae.Eur J Biochem 268: 5057–5065.
Brejning J, Jespersen L. 2002. Protein expression during lag phaseand growth initiation in Saccharomyces cerevisiae. Int J FoodMicrobiol 75: 27–38.
Bruinenberg PM, van Dijken JP, Scheffers WA. 1983. A theoreti-cal analysis of NADPH production and consumption in yeasts.J Gen Microbiol 129: 953–964.
Christianson TW, Sikorski RS, Dante M, Shero JH, Hieter P.1992. Multifunctional yeast high-copy-number shuttle vectors.Gene 110: 119–122.
Costenoble R, Valadi H, Gustafsson L, Niklasson C, Frazen CJ.2000. Microaerobic glycerol formation in Saccharomycescerevisiae. Yeast 16: 1483–1495.
de Vries S, Marres CA. 1987. The mitochondrial respiratory chainof yeast. Structure and biosynthesis and the role in cellularmetabolism. Biochim Biophys Acta 895: 205–239.
Dickinson FM. 1996. The purification and some propertiesof the Mg2+-activated cytosolic aldehyde dehydrogenase ofSaccharomyces cerevisiae. Biochem J 315: 393–399.
Eliasson A, Christensson C, Wahlbom CF, Hahn-Hagerdal B.2000. Anaerobic xylose fermentation by recombinant Saccha-romyces cerevisiae carrying XYL1, XYL2, and XKS1 in min-eral medium chemostat cultures. Appl Environm Microbiol 66:3381–3386.
Gavin AC, Bosche M, Krause R, et al. 2002. Functional organi-zation of the yeast proteome by systematic analysis of proteincomplexes. Nature 415: 141–147.
Gietz RD, Sugino A. 1988. New yeast–Escherichia coli shuttlevectors constructed with in vitro mutagenized yeast geneslacking six-base pair restriction sites. Gene 74: 527–534.
Godon C, Lagniel G, Lee J, et al. 1998. The H2O2 stimulon inSaccharomyces cerevisiae. J Biol Chem 273: 22 480–22 489.
Gottschalk A, Neubauer G, Banroques J, Mann M, Luhrmann R,Fabrizio P. 1999. Identification by mass spectrometry andfunctional analysis of novel proteins of the yeast [U4/U6.U5]tri-snRNP. EMBO J 18: 4535–4548.
Guiard B. 1985. Structure, expression and regulation of a nucleargene encoding a mitochondrial protein: the yeast L(+)-lactatecytochrome c oxidoreductase (cytochrome b2). EMBO J 4:3265–3272.
Gygi SP, Corthals GL, Zhang Y, Rochon Y, Aebersold R. 2000.Evaluation of two-dimensional gel electrophoresis-basedproteome analysis technology. Proc Natl Acad Sci USA 97:9390–9395.
Gygi SP, Rist B, Gerber SA, Turecek F, Gelb MH, Aebersold R.1999a. Quantitative analysis of complex protein mixtures usingisotope-coded affinity tags. Nature Biotechnol 17: 994–999.
Gygi SP, Rochon Y, Franza BR, Aebersold R. 1999b. Correlationbetween protein and mRNA abundance in yeast. Mol Cell Biol19: 1720–1730.
Haurie V, Perrot M, Mini T, Jeno P, Sagliocco F, Boucherie H.2001. The transcriptional activator Cat8p provides a majorcontribution to the reprogramming of carbon metabolism duringthe diauxic shift in Saccharomyces cerevisiae. J Biol Chem 276:76–85.
Hayes A, Zhang N, Wu J, et al. 2002. Hybridization arraytechnology coupled with chemostat culture: tools to interrogategene expression in Saccharomyces cerevisiae. Methods SanDiego CA 26: 281–290.
Ho NW, Chen Z, Brainard AP. 1998. Genetically engineeredSaccharomyces yeast capable of effective co-fermentation ofglucose and xylose. Appl Environm Microbiol 64: 1852–1859.
Ho NWY, Chang S-F. 1989. Cloning of yeast xylulokinase geneby complementation in Escherichia coli and yeast mutations.Enzyme Microb Technol 11: 417–421.
Ho Y, Gruhler A, Heilbut A, et al. 2002. Systematic identificationof protein complexes in Saccharomyces cerevisiae by massspectrometry. Nature 415: 180–183.
Horak J, Regelmann J, Wolf DH. 2002. Two distinct proteolyticsystems responsible for glucose-induced degradation of fructose-1,6-bisphosphatase and the Gal2p transporter in the yeastSaccharomyces cerevisiae share the same protein components ofthe glucose signaling pathway. J Biol Chem 277: 8248–8254.
Johansson B, Hahn-Hagerdal B. 2002. The non-oxidative pentosephosphate pathway controls the fermentation rate of xylulosebut not of xylose in Saccharomyces cerevisiae TMB3001. FEMSYeast Res 2: 277–282.
Kanagasundaram V, Scopes RK. 1992. Cloning, sequence anal-ysis, and expression of the structural gene encoding glucose-fructose oxidoreductase from Zymomonas mobilis . J Bacteriol174: 1439–1447.
Kotter P, Amore R, Hollenberg CP, Ciriacy M. 1990. Isolationand characterization of the Pichia stipitis xylitol dehydrogenasegene, XYL2, and construction of a xylose-utilizing Saccha-romyces cerevisiae transformant. Curr Genet 18: 493–500.
Kotter P, Ciriacy M. 1993. Xylose fermentation by Saccharomycescerevisiae. Appl Microbiol Biotechnol 38: 776–783.
Kuhn A, van Zyl C, van Tonder A, Prior BA. 1995. Purificationand partial characterization of an aldo-keto reductase fromSaccharomyces cerevisiae. Appl Environm Microbiol 61:1580–1585.
Laemmli UK. 1970. Cleavage of structural proteins during theassembly of the head of bacteriophage T4. Nature 227: 680–685.
Copyright 2003 John Wiley & Sons, Ltd. Yeast 2003; 20: 295–314.

314 L. Salusjarvi et al.
Larsson C, Pahlman IL, Ansell R, et al. 1998. The importanceof the glycerol 3-phosphate shuttle during aerobic growth ofSaccharomyces cerevisiae. Yeast 14: 347–357.
Lodi T, Guiard B. 1991. Complex transcriptional regulation of theSaccharomyces cerevisiae CYB2 gene encoding cytochrome b2:CYP1(HAP1) activator binds to the CYB2 upstream activationsite UAS1-B2. Mol Cell Biol 11: 3762–3772.
Meijer MM, Boonstra J, Verkleij AJ, Verrips CT. 1998. Glucoserepression in Saccharomyces cerevisiae is related to the glucoseconcentration rather than the glucose flux. J Biol Chem 273:24 102–24 107.
Meinander NQ, Hahn-Hagerdal B. 1997. Influence of co-substrateconcentration on xylose conversion by recombinant, XYL1-expressing Saccharomyces cerevisiae: a comparison of differentsugars and ethanol as co-substrates. Appl Environm Microbiol63: 1959–1964.
Mellor J, Dobson MJ, Roberts NA, et al. 1983. Efficient synthesisof enzymatically active calf chymosin in Saccharomycescerevisiae. Gene 24: 1–14.
Muller S, Boles E, May M, Zimmermann FK. 1995. Differentinternal metabolites trigger the induction of glycolytic geneexpression in Saccharomyces cerevisiae. J Bacteriol 177:4517–4519.
Norbeck J, Blomberg A. 1997. Metabolic and regulatory changesassociated with growth of Saccharomyces cerevisiae in1.4 M NaCl. Evidence for osmotic induction of glyceroldissimilation via the dihydroxyacetone pathway. J Biol Chem272: 5544–5554.
O’Connell KL, Stults JT. 1997. Identification of mouse liverproteins on two-dimensional electrophoresis gels by matrix-assisted laser desorption/ionization mass spectrometry of in situenzymatic digests. Electrophoresis 18: 349–359.
Pahlman AK, Granath K, Ansell R, Hohmann S, Adler L. 2001.The yeast glycerol 3-phosphatases Gpp1p and Gpp2p arerequired for glycerol biosynthesis and differentially involvedin the cellular responses to osmotic, anaerobic, and oxidativestress. J Biol Chem 276: 3555–3563.
Perrot M, Sagliocco F, Mini T, et al. 1999. Two-dimensional gelprotein database of Saccharomyces cerevisiae (update 1999).Electrophoresis 20: 2280–2298.
Pitkanen J-P, Aristidou A, Salusjarvi L, Ruohonen L, Penttila M.2002. Metabolic flux analysis of xylose metabolism inrecombinant Saccharomyces cerevisiae using continuousculture. Metab Eng (in press).
Poutanen M, Salusjarvi L, Ruohonen L, Penttila M, Kalkkinen N.2001. Use of matrix-assisted laser desorption/ionization time-of-flight mass mapping and nanospray liquid chromatogra-phy/electrospray ionization tandem mass spectrometry sequencetag analysis for high sensitivity identification of yeast proteinsseparated by two-dimensional gel electrophoresis. Rapid CommMass Spectrom 15: 1685–1692.
Ramil E, Agrimonti C, Shechter E, Gervais M, Guiard B. 2000.Regulation of the CYB2 gene expression: transcriptionalcoordination by the Hap1p, Hap2/3/4/5p and Adr1p transcriptionfactors. Mol Microbiol 37: 1116–1132.
Remize F, Andrieu E, Dequin S. 2000. Engineering of thepyruvate dehydrogenase bypass in Saccharomyces cerevisiae:
role of the cytosolic Mg(2+) and mitochondrial K(+)acetaldehyde dehydrogenases Ald6p and Ald4p in acetateformation during alcoholic fermentation. Appl EnvironmMicrobiol 66: 3151–3159.
Richard P, Toivari MH, Penttila M. 1999. Evidence that thegene YLR070c of Saccharomyces cerevisiae encodes a xylitoldehydrogenase. FEBS Lett 457: 135–138.
Richard P, Toivari MH, Penttila M. 2000. The role of xylulokinasein Saccharomyces cerevisiae xylulose catabolism. FEMSMicrobiol Lett 190: 39–43.
Ruohonen L, Aalto MK, Keranen S. 1995. Modifications to theADH1 promoter of Saccharomyces cerevisiae for efficientproduction of heterologous proteins. J Biotechnol 39: 193.
Shevchenko A, Jensen ON, Podtelejnikov AV, et al. 1996. Link-ing genome and proteome by mass spectrometry: large-scaleidentification of yeast proteins from two-dimensional gels. ProcNatl Acad Sci USA 93: 14 440–14 445.
Sierkstra LN, Verbakel JM, Verrips CT. 1992. Analysis oftranscription and translation of glycolytic enzymes in glucose-limited continuous cultures of Saccharomyces cerevisiae. J GenMicrobiol 138(12): 2559–2566.
ter Linde JJ, Liang H, Davis RW, et al. 1999. Genome-widetranscriptional analysis of aerobic and anaerobic chemostatcultures of Saccharomyces cerevisiae. J Bacteriol 181:7409–7413.
Toivari MH, Aristidou A, Ruohonen L, Penttila M. 2001. Conver-sion of xylose to ethanol by recombinant Saccharomyces cere-visiae: importance of xylulokinase (XKS1) and oxygen avail-ability. Metab Eng 3: 236–249.
Uetz P, Giot L, Cagney G, et al. 2000. A comprehensive analysisof protein–protein interactions in Saccharomyces cerevisiae.Nature 403: 623–627.
van Zyl C, Prior BA, Kilian SG, Kock JL. 1989. D-xyloseutilization by Saccharomyces cerevisiae. J Gen Microbiol 135:2791–2798.
Vido K, Spector D, Lagniel G, Lopez S, Toledano MB, Labarre J.2001. A proteome analysis of the cadmium response inSaccharomyces cerevisiae. J Biol Chem 276: 8469–8474.
Walfridsson M, Hallborn J, Penttila M, Keranen S, Hahn-Hager-dal B. 1995. Xylose-metabolizing Saccharomyces cerevisiaestrains overexpressing the TKL1 and TAL1 genes encodingthe pentose phosphate pathway enzymes transketolase andtransaldolase. Appl Environm Microbiol 61: 4184–4190.
Wahlbom CF, Eliasson A, Hahn-Hagerdal B. 2001. Intracellularfluxes in a recombinant xylose-utilizing Saccharomycescerevisiae cultivated anaerobically at different dilution rates andfeed concentrations. Biotechnol Bioeng 72: 289–296.
Wang X, Mann CJ, Bai Y, Ni L, Weiner H. 1998. Molecularcloning, characterization, and potential roles of cytosolic andmitochondrial aldehyde dehydrogenases in ethanol metabolismin Saccharomyces cerevisiae. J Bacteriol 180: 822–830.
Zachariou M, Scopes RK. 1986. Glucose-fructose oxidoreductase,a new enzyme isolated from Zymomonas mobilis thatis responsible for sorbitol production. J Bacteriol 167:863–869.
Copyright 2003 John Wiley & Sons, Ltd. Yeast 2003; 20: 295–314.