provincial report: gauteng - unicef · provincial report: gauteng may 2008 ... the primary school...
TRANSCRIPT

Eva l uat io n o f t h e S c ho o l N u t r i t io n
P r o g r a m m e
Provincial Report: Gauteng
May 2008
EducationDepartment:
REPUBLIC OF SOUTH AFRICA
education

© 2008 UNICEF
This research was commissioned by UNICEF South Africa in collaboration with the Department of Education, and produced by KPMG International.
This report is intended solely and exclusively for the benefit, information and use by UNICEF and the Department of Education. No party, other than UNICEF and the Department of Education, may rely on the contents of this report, either in whole or in part. KPMG Services (Pty) Ltd (hereinafter referred to as “KPMG”), its directors or employees or agents or any body or entity controlled by or owned by or associated with KPMG, accepts no liability or responsibility whatsoever, resulting directly or indirectly from the disclosure of this report to any third party and/or reliance of any third party on the contents of this report, whether in whole or in part.
EnquiriesNokuthula PrusentUNICEF, PO Box 4884, Pretoria, 0001, South AfricaTel: +27 12 3548201Email: [email protected]
Design and Production: Handmade Communications

Department of Education – UNICEF
Eva l uat io n o f t h e S c ho o l N u t r i t io n
P r o g r a m m e
Provincial Report: Gauteng
May 2008
Department of Education – UNICEF

Contents
Table 1 Distribution of sample size .......................................................................................................5Table 2 Sample schools .........................................................................................................................6Table 3: Budget and expenditure .......................................................................................................10Table 4: Cost per child per day ............................................................................................................11Table 5: Filled and vacant posts in the NSNP .....................................................................................13Table 6: Compliance with menu .........................................................................................................16Table 7: Percentage of schools with food gardens ...................................................................................19Table 8: Percentage of schools with economic activity related to the Nutrition Programme ......................20Table 9: Percentage of schools with community participation ................................................................20Table 10: Percentage of schools with nutrition education in curriculum .................................................20Table 11: Percentage of schools that comply with feeding target learners ................................................22Table 12: Percentage of schools that comply with required feeding days ..................................................22Table 13: Percentage of schools that comply with prescribed menus .......................................................23Table 14: Percentage of schools that comply with feeding time ...............................................................23
List of tabLes

1
1 introduCtion
This report provides findings of the evaluation of the National School Nutrition Programme (NSNP) in Gauteng. It is one of nine provincial reports that have contributed to the national report on the evaluation of the programme. The evaluation of the NSNP in Gauteng, as with the other eight provinces, was carried out at provincial, district and school level.
The purpose of the evaluation is to determine how well the following programme objectives were met for the period 2004 to 2006. Data from 2007 has also been used given that information from school visits has made an important contribution to the evaluation:• To contribute to enhanced learning capacity through school feeding.• To generate food production and economic activities in school communities in order to improve
household food security.• To strengthen nutrition education for the school community.
The evaluation also assesses the effectiveness and efficiency of systems for implementing the programme.

2
2 baCkground
The Primary School Nutrition Programme (PSNP) was introduced in 1994 as one of the Presidential lead projects under the Reconstruction and Development Programme. Its aim was to enhance the educational experience of needy primary school learners through promoting punctual school attendance, alleviating short-term hunger, improving concentration and contributing to general health development. In its first ten years, the PSNP was jointly managed at the national level by the Department of Health and the Department of Education. The Department of Health was responsible for the nutritional and health aspects and the Department of Education for the school and educational elements.
In September 2002, Cabinet resolved that school nutrition should be transferred from the Department of Health to the Department of Education, which should assume full responsibility by April 2004. The decision was based on the consideration that school feeding should be housed in the Department of Education given the important education outcomes of the intervention as well as the fact that it is implemented in schools, which are the functional responsibility of the Department of Education. An additional consideration was that it would facilitate the inclusion of school feeding into the broader context of education development, a prerequisite for successful and sustainable school-based programmes.
The NSNP completed a cycle of three years under the management of the Department of Education in the Gauteng Province. The national guidelines (NSNP Implementation, Monitoring and Reporting Manual, January 2004) were adopted by the province as the official provincial guidelines for the implementation of the NSNP and provided to all stakeholders. Key elements of the guidelines include an outline of provincial responsibilities in monitoring and implementing the NSNP which include:• Minimum requirements regarding feeding days (182 days) and time (before 10h00).• Establishing standard menu options including cooked and non-cooked options.• Provision of the necessary utensils to schools for food preparation.• Implementing effective procurement strategies.• Establishing proper business planning and financial management systems.• Giving preference to women’s community-based organisations as service providers.• Facilitating the development of food gardens.• Supporting nutrition education through the curricular activities in life orientation.• Implementing a monitoring system to ensure regular feeding, food quality and safety, as well as an
appropriate information system.
The Department of Education guidelines also stipulate that:• Provinces may elect to supplement the NSNP conditional grant with funds from their budgets.• Provinces must submit an annual business plan in order to access funds and fulfil all financial
management requirements of the Public Financial Management Act.
Key Department of Education responsibilities identified in the guidelines include:• Planning the conditional grant.• Developing necessary guidelines and policy with regard to overall management and targeting of
schools and learners.• Transferring the grant to provinces according to the Division of Revenue Act.• Monitoring expenditure by provinces and accounting to the National Treasury.• Providing necessary support to provinces.

3
When the Gauteng Department of Education took over the management of the NSNP from the Department of Health in April 2004, the department was targeting approximately 1,107 primary schools with 359,613 learners in Gauteng from grades R to 7. Since then there has been a 39% increase in the number of learners fed, with the poorest special and secondary schools also included into the NSNP. Currently the target is 420,000 learners who are fed across 1,133 targeted primary, special and secondary schools.
At the time that the programme was transferred, only one uncooked menu option was provided on every feeding day. Since January 2006, cooked menu options were successfully piloted at 44 primary schools. These menu options were systematically extended to other targeted schools, and by March 2007 all targeted schools were afforded the opportunity to serve cooked meals.
The NSNP enabled all targeted schools to purchase kitchen equipment in order to prepare cooked meals. Many targeted schools do not have adequate food preparation areas and the NSNP ensured the supply of durable and secure mobile units to 113 targeted schools to serve as preparation areas.
The programme manager in the Gauteng Department of Education developed guidelines for the province which have been disseminated to all districts and targeted schools. As required by the Department of Education, the Gauteng guidelines identify:• 182 minimum required feeding days.• That feeding is expected to take place before 10h00.• Standard menu options with portion sizes for the uncooked menu. The cooked menu was still being
piloted at the time guidelines were developed.• Operational indicators are identified to assist in assessing progress on the programme objectives
identified above.
In addition, hygiene guidelines and bid specifications with detailed nutritional requirements for all uncooked menu products are provided.
4
3 MethodoLogy
The evaluation was made up of three main components and included both qualitative and quantitative elements. First, key stakeholder interviews were carried out at provincial, district and school levels. Second, a school survey was carried out in a nationally representative sample of 271 schools. Third, 30 school visits were made across nine provinces. These components are discussed in more detail below.
key stakeholder interviews: Semi-structured interviews were carried out at provincial level with the programme manager, at district level with the nutrition coordinators and liaison officers, and at school level with principals and/or nutrition coordinators in schools. The main aim of these interviews was to get a sense of the programme achievements and challenges.
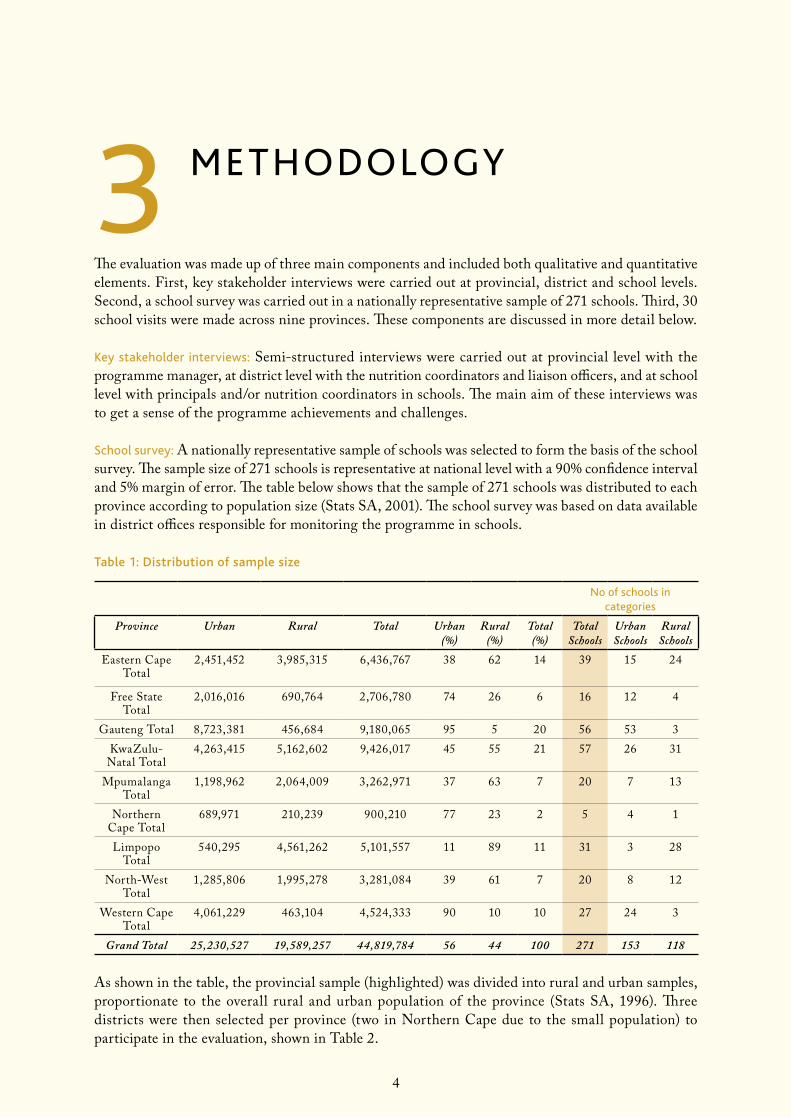
school survey: A nationally representative sample of schools was selected to form the basis of the school survey. The sample size of 271 schools is representative at national level with a 90% confidence interval and 5% margin of error. The table below shows that the sample of 271 schools was distributed to each province according to population size (Stats SA, 2001). The school survey was based on data available in district offices responsible for monitoring the programme in schools.
Table 1: Distribution of sample size
no of schools in categories
Province Urban Rural Total Urban (%)
Rural (%)
Total (%)
Total Schools
Urban Schools
Rural Schools
Eastern Cape Total
2,451,452 3,985,315 6,436,767 38 62 14 39 15 24
Free State Total
2,016,016 690,764 2,706,780 74 26 6 16 12 4
Gauteng Total 8,723,381 456,684 9,180,065 95 5 20 56 53 3KwaZulu-
Natal Total4,263,415 5,162,602 9,426,017 45 55 21 57 26 31
Mpumalanga Total
1,198,962 2,064,009 3,262,971 37 63 7 20 7 13
Northern Cape Total
689,971 210,239 900,210 77 23 2 5 4 1
Limpopo Total
540,295 4,561,262 5,101,557 11 89 11 31 3 28
North-West Total
1,285,806 1,995,278 3,281,084 39 61 7 20 8 12
Western Cape Total
4,061,229 463,104 4,524,333 90 10 10 27 24 3
Grand Total 25,230,527 19,589,257 44,819,784 56 44 100 271 153 118
As shown in the table, the provincial sample (highlighted) was divided into rural and urban samples, proportionate to the overall rural and urban population of the province (Stats SA, 1996). Three districts were then selected per province (two in Northern Cape due to the small population) to participate in the evaluation, shown in Table 2.
5
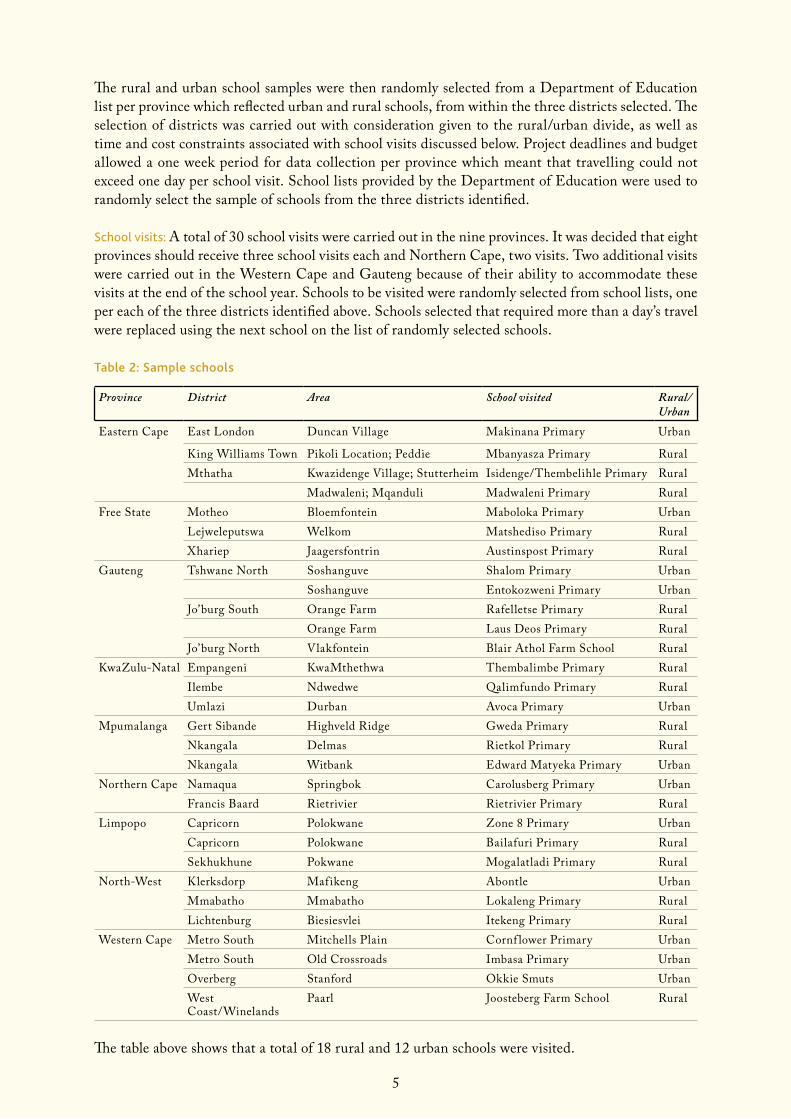
The rural and urban school samples were then randomly selected from a Department of Education list per province which reflected urban and rural schools, from within the three districts selected. The selection of districts was carried out with consideration given to the rural/urban divide, as well as time and cost constraints associated with school visits discussed below. Project deadlines and budget allowed a one week period for data collection per province which meant that travelling could not exceed one day per school visit. School lists provided by the Department of Education were used to randomly select the sample of schools from the three districts identified.
school visits: A total of 30 school visits were carried out in the nine provinces. It was decided that eight provinces should receive three school visits each and Northern Cape, two visits. Two additional visits were carried out in the Western Cape and Gauteng because of their ability to accommodate these visits at the end of the school year. Schools to be visited were randomly selected from school lists, one per each of the three districts identified above. Schools selected that required more than a day’s travel were replaced using the next school on the list of randomly selected schools.
Table 2: Sample schools
Province District Area School visited Rural/Urban
Eastern Cape East London Duncan Village Makinana Primary Urban
King Williams Town Pikoli Location; Peddie Mbanyasza Primary RuralMthatha Kwazidenge Village; Stutterheim Isidenge/Thembelihle Primary Rural
Madwaleni; Mqanduli Madwaleni Primary RuralFree State Motheo Bloemfontein Maboloka Primary Urban
Lejweleputswa Welkom Matshediso Primary RuralXhariep Jaagersfontrin Austinspost Primary Rural
Gauteng Tshwane North Soshanguve Shalom Primary UrbanSoshanguve Entokozweni Primary Urban
Jo’burg South Orange Farm Rafelletse Primary RuralOrange Farm Laus Deos Primary Rural
Jo’burg North Vlakfontein Blair Athol Farm School RuralKwaZulu-Natal Empangeni KwaMthethwa Thembalimbe Primary Rural
Ilembe Ndwedwe Qalimfundo Primary RuralUmlazi Durban Avoca Primary Urban
Mpumalanga Gert Sibande Highveld Ridge Gweda Primary RuralNkangala Delmas Rietkol Primary RuralNkangala Witbank Edward Matyeka Primary Urban
Northern Cape Namaqua Springbok Carolusberg Primary UrbanFrancis Baard Rietrivier Rietrivier Primary Rural
Limpopo Capricorn Polokwane Zone 8 Primary UrbanCapricorn Polokwane Bailafuri Primary RuralSekhukhune Pokwane Mogalatladi Primary Rural
North-West Klerksdorp Mafikeng Abontle UrbanMmabatho Mmabatho Lokaleng Primary RuralLichtenburg Biesiesvlei Itekeng Primary Rural
Western Cape Metro South Mitchells Plain Cornf lower Primary UrbanMetro South Old Crossroads Imbasa Primary UrbanOverberg Stanford Okkie Smuts UrbanWest Coast/Winelands
Paarl Joosteberg Farm School Rural
The table above shows that a total of 18 rural and 12 urban schools were visited.
6
3.1 Limitations
The school survey used data available in district offices. Record keeping, particularly for 2004, was generally found to be poor. Many district offices across the country did not keep files on each school in their jurisdiction that is on the Nutrition Programme. This meant that in certain instances, district programme staff familiar with a school had to be interviewed in order to answer the questionnaire. In some instances, schools were contacted directly for information, or they submitted their records to the district office in order for the school survey to be completed. Records kept by food and beverage interns responsible for monitoring schools in certain areas were used in Gauteng.
The randomness of sampling was constrained by time deadlines and budget. As highlighted above, three districts were selected per province first, based on travel time anticipated to reach district offices. To ensure completion of fieldwork within one week per province, this needed to be within one day. The sample of schools was then randomly selected from within the three districts. Furthermore, schools identified for visits were also randomly selected but from within the three districts identified.

7
4 objeCtives
This section summarises findings on the extent to which objectives are being met by the programme. More detail is provided in the Outcomes and Outputs sections later in the report. Regarding the pri-mary objective of the programme related to contributing to enhanced learning capacity, it is assumed that if most schools are feeding all target learners on all required feeding days with good compliance with menu options and time, then the framework is in place to meet this objective well. If, in addition, on observation at schools and in interviews at school and district level, the quality and quantity of food provided was also found and reported to meet provincial requirements, performance against this objective was considered to be good.
Regarding food production and nutrition education objectives, data from surveys, interviews and school visits were all used to draw conclusions on programme performance.
4.1 Findings
Officials interviewed at the three levels of the programme, i.e. provincial, district and school level, have a thorough understanding of the objectives of the programme. There is general consensus that the programme is meeting its objectives, in the sense that there is a general perception, particularly at school level, that attendance has improved and the concentration levels of the children are higher than before.
Although all managers interviewed agree that the objectives are being met, they indicated that there are more needy learners that should be part of the programme. In 2006, the vast majority of schools (92.9%) in Gauteng were feeding all target learners and 100% of schools in the sample were serving food to needy learners on all required feeding days.
According to these officials, the Gauteng targeting system has limitations in that it targets learners from rural and farm schools (i.e. quintile 1, 2 and 3 schools). The system does not focus on the urban schools though they also have needy learners. An example is Cosmo City where the poor are being resettled in urban areas.
There is generally good compliance with provincial menu options with 98.2% of schools in the Gauteng sample complying, as mentioned in section 7.1 below. However, the officials both at school and district level would like to see fresh vegetables and fruit being included in the menu. There is also the concern that the bread menu is not enough to fill the learners for the whole school day; some of the district officials would like to see the bread menu being improved so that it is more filling. None of the schools surveyed kept to the 10h00 feeding time prescribed by the provincial department. Most of the schools said they were unaware that this was a requirement.
Regarding the secondary objectives, just over half of schools (53.6%) surveyed have food gardens, indicating that this objective is not being given much attention. Over the past two years, the involve-ment of the community in food preparation where this programme has been running has been good. Participation over and above food preparation has, however, not been easy to elicit. Most schools (98.2%) have integrated nutrition education into their curricula.

8
4.2 Conclusion
From the school survey as well as from the perspectives of provincial, district and school officials, it would appear that the primary objectives of the programme, as well as that related to integrating nutritional education into the curriculum, are being well met in Gauteng. The objective related to facilitating food production is in the early stages of development.

9
5 systeMs
Systems evaluated as part of the exercise were financial management, supply chain management, and administrative systems which include human resources, planning and monitoring and evaluation.
5.1 Financialmanagement
5.1.1 Findings
Current systemOnly the provincial office has a financial management function. Its staff alone has access to budgets and the responsibility for payment of service providers. The provincial office has to prepare a business case each year in order to qualify for the conditional grant for this programme. Another requirement is that the provincial office is in total compliance with all the requirements of the Public Finance Management Act (PFMA).
The provincial office is also responsible for the sourcing of service providers. This process complies with all government tender requirements for sourcing service providers for any other service. Payment of service providers, once their service has been provided, is their responsibility. Due to the take-on of some of the North West and Mpumalanga schools, the number of payments has increased. As a result, the staff members carrying out the financial management duties are sometimes overloaded and therefore require the assistance of the project manager. This ends up being the only system they focus on, with no capacity to perform other responsibilities like monitoring and evaluation.
Budget and expenditureBudget and expenditure for the Gauteng NSNP, for the evaluation period, is reflected below.
Table 3: Budget and expenditure
Calendar year Budget % change2004/5 Not available -2005/6 R78,048,610 -2006/7 R93,256,800 19%
It is evident from the above table that there was a 19% increase in the budget in 2006/7. This can be attributed to the increased number of target learners and the increase in the cost of the programme per child per day.
According to the provincial manager, budgets are met and there is no over- or underspending.
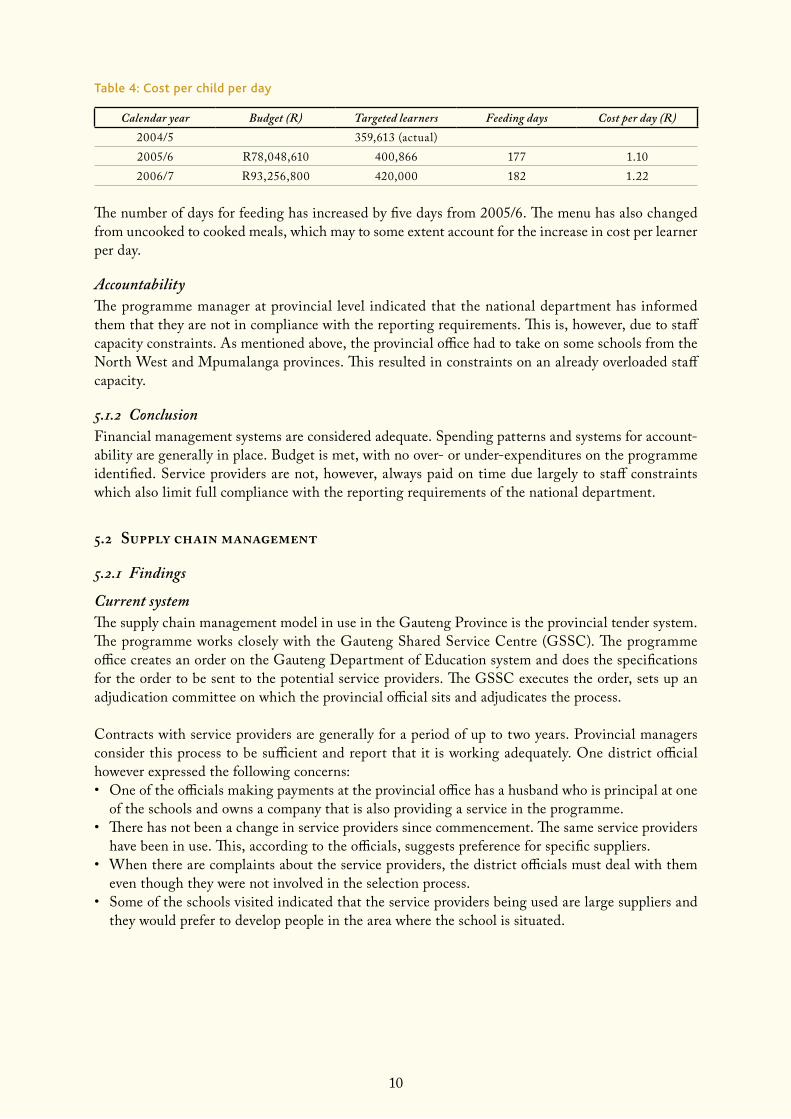
Cost per child per dayTable 4 shows cost per child per day for the evaluation period.
10
Table 4: Cost per child per day
Calendar year Budget (R) Targeted learners Feeding days Cost per day (R)2004/5 359,613 (actual)2005/6 R78,048,610 400,866 177 1.102006/7 R93,256,800 420,000 182 1.22
The number of days for feeding has increased by five days from 2005/6. The menu has also changed from uncooked to cooked meals, which may to some extent account for the increase in cost per learner per day.
AccountabilityThe programme manager at provincial level indicated that the national department has informed them that they are not in compliance with the reporting requirements. This is, however, due to staff capacity constraints. As mentioned above, the provincial office had to take on some schools from the North West and Mpumalanga provinces. This resulted in constraints on an already overloaded staff capacity.
5.1.2 ConclusionFinancial management systems are considered adequate. Spending patterns and systems for account-ability are generally in place. Budget is met, with no over- or under-expenditures on the programme identified. Service providers are not, however, always paid on time due largely to staff constraints which also limit full compliance with the reporting requirements of the national department.
5.2 Supplychainmanagement
5.2.1 Findings
Current systemThe supply chain management model in use in the Gauteng Province is the provincial tender system. The programme works closely with the Gauteng Shared Service Centre (GSSC). The programme office creates an order on the Gauteng Department of Education system and does the specifications for the order to be sent to the potential service providers. The GSSC executes the order, sets up an adjudication committee on which the provincial official sits and adjudicates the process.
Contracts with service providers are generally for a period of up to two years. Provincial managers consider this process to be sufficient and report that it is working adequately. One district official however expressed the following concerns:• One of the officials making payments at the provincial office has a husband who is principal at one
of the schools and owns a company that is also providing a service in the programme.• There has not been a change in service providers since commencement. The same service providers
have been in use. This, according to the officials, suggests preference for specific suppliers.• When there are complaints about the service providers, the district officials must deal with them
even though they were not involved in the selection process.• Some of the schools visited indicated that the service providers being used are large suppliers and
they would prefer to develop people in the area where the school is situated.

11
Bid specificationsThe provincial office creates the specifications per the requirements set out in the business case. These will generally include the following:• Days on which feeding should take place.• The menu plan as provided in the business case.• Feeding times.• Use of volunteers.• Training of volunteers to cook.• Monitoring by the department, etc.
VolunteersVolunteers at most of the schools are parents who are unemployed and would be at home had it not been for this programme. However, there is dissatisfaction with the rates currently being paid. At one of the schools, they reported that they pay R42 per day for the volunteers; at another, they pay R420 per month; a third school reports paying R28 per day. All payments to volunteers are through the suppliers. Schools reported that they frequently receive complaints from volunteers that the rates are too low.
According to one of the school officials, there are times when volunteers are not paid on time. This is usually because service providers are paid late. Interviewed district officials highlighted that delayed payments were one of the main problems experienced by the programme.
Monitoring of service provider performance Monitoring of service providers takes place at district and school level. At school level nutrition coordinators, along with the volunteers, monitor menu compliance and quality of the food.
District officials are expected to carry out spot inspections to ensure compliance. However, due to lack of staffing capacity, they only visit where teachers or school officials have lodged a complaint. According to district officials interviewed, vehicles are not dedicated to the programme; they only have access to vehicles when no one else is using the car. This makes it difficult to schedule school visits effectively.
5.2.2 ConclusionThe supply chain management system in use is considered to be adequate. There are, however, percep-tions at district level that the tender system is not transparent and fair. While it is not possible to conclude on the legitimacy of these concerns in an evaluation of this nature, it is evident that commu-nication between province and districts needs to be improved. Concerns regarding the appointment process of service providers and reports on their performance at school level need to be communicated to the province regularly.
Inefficiencies exist in the supply chain management system related to the late payment of service providers. The reasons for this may be related to insufficient staff to manage the increased work load attached to administrating additional schools from the North West and Mpumalanga provinces.
Staff shortages also make it difficult for managers at both provincial and district level to monitor the service providers to ensure that they comply with the bid specifications.
12
5.3 Administrativesystems
5.3.1 Human resources
Findings
Staff establishment
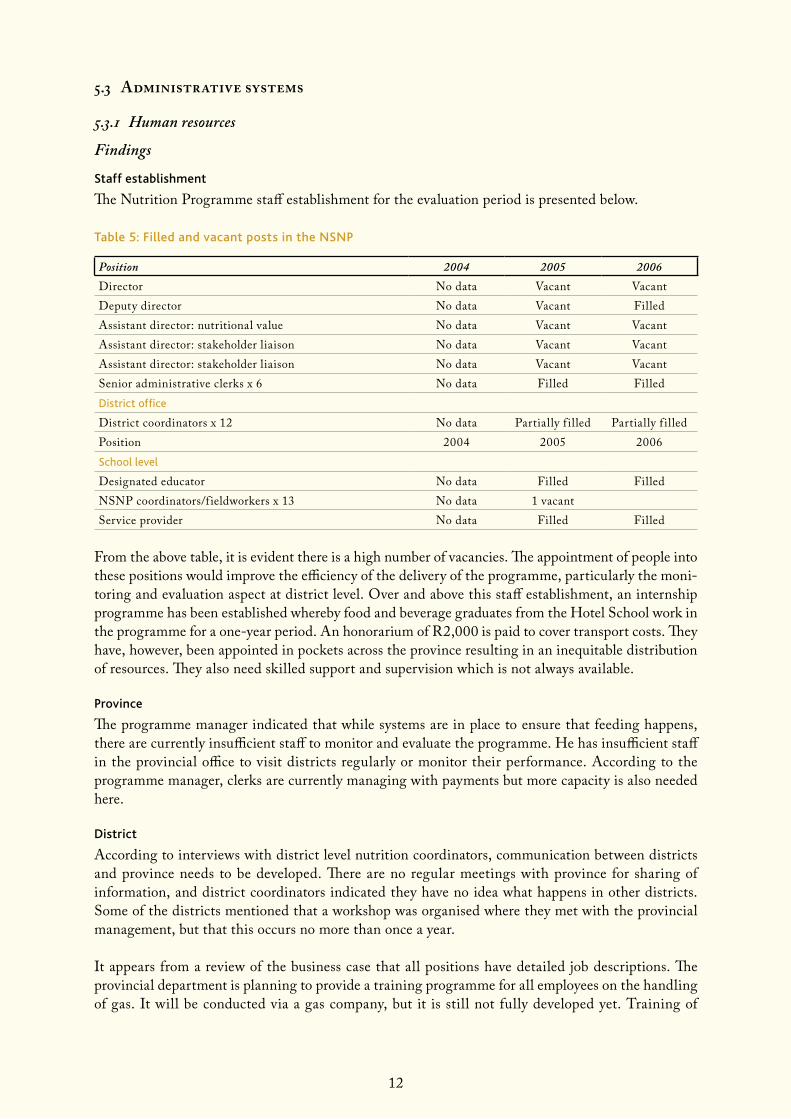
The Nutrition Programme staff establishment for the evaluation period is presented below.
Table 5: Filled and vacant posts in the NSNP
Position 2004 2005 2006Director No data Vacant VacantDeputy director No data Vacant FilledAssistant director: nutritional value No data Vacant VacantAssistant director: stakeholder liaison No data Vacant VacantAssistant director: stakeholder liaison No data Vacant VacantSenior administrative clerks x 6 No data Filled Filleddistrict office
District coordinators x 12 No data Partially f illed Partially f illedPosition 2004 2005 2006school level
Designated educator No data Filled FilledNSNP coordinators/f ieldworkers x 13 No data 1 vacantService provider No data Filled Filled
From the above table, it is evident there is a high number of vacancies. The appointment of people into these positions would improve the efficiency of the delivery of the programme, particularly the moni-toring and evaluation aspect at district level. Over and above this staff establishment, an internship programme has been established whereby food and beverage graduates from the Hotel School work in the programme for a one-year period. An honorarium of R2,000 is paid to cover transport costs. They have, however, been appointed in pockets across the province resulting in an inequitable distribution of resources. They also need skilled support and supervision which is not always available.
Province
The programme manager indicated that while systems are in place to ensure that feeding happens, there are currently insufficient staff to monitor and evaluate the programme. He has insufficient staff in the provincial office to visit districts regularly or monitor their performance. According to the programme manager, clerks are currently managing with payments but more capacity is also needed here.
District
According to interviews with district level nutrition coordinators, communication between districts and province needs to be developed. There are no regular meetings with province for sharing of information, and district coordinators indicated they have no idea what happens in other districts. Some of the districts mentioned that a workshop was organised where they met with the provincial management, but that this occurs no more than once a year.
It appears from a review of the business case that all positions have detailed job descriptions. The provincial department is planning to provide a training programme for all employees on the handling of gas. It will be conducted via a gas company, but it is still not fully developed yet. Training of
13
learners has also taken place with the fire department; learners are trained on how to use a fire extin-guisher. These training programmes are usually carried out twice a year. Several district coordinators, however, indicated that they had no background in nutrition at all and needed more intensive input on the objectives of the programme and how to monitor it. Coordinators with no skills or experience in the field of nutrition, project management or monitoring and evaluation are frequently appointed from other programmes. It was also evident from district interviews that there is a high turnover of nutrition coordinators and that hand-over procedures were unclear and inefficient.
School-level human resources
All schools have appointed nutrition coordinators who are educators and who also supervise the Nutrition Programme. Having educators in this position is not always efficient as they also have teaching responsibilities and they report that the programme frequently interferes with their teaching time. The administration procedures involved are also perceived to be an additional responsibility for teachers who are already overloaded.
Conclusion From the above analysis, it is evident that there are insufficient numbers of dedicated staff with ap-propriate skills at both provincial and district level, which results in a lack of support and coordination of district programme staff. District staff are responsible for five different school programmes so the Nutrition Programme gets limited attention. While food and beverage interns from the Hotel School contribute substantially to the programme, they are distributed inequitably, resulting in pockets of geographical areas receiving excellent support while others receive nothing.
5.3.2 Monitoring and evaluation
Findings
Current system
According to the programme manager, a monitoring and evaluation tool was introduced in August 2007. At the time of the interview, exams were taking place and the plan was that the system would be fully utilised from January 2008 when the pressure from the exams had subsided. The tool however has limitations as it cannot do all the required monitoring, according to the managers. District offices are supposed to be generating reports from the application of this tool and submitting them to the provincial office.
The provincial office pays visits to the district offices on programme support only on request from the district offices. When a district office does not request assistance, it does not get any visits and therefore no monitoring takes place.
Of the five schools that were visited, four did receive training on the use of the tool and the im-plementation guidelines. Only one did not receive any kind of training. Where training was made available, they indicated that they have capacity to manage the reporting and recording process for the programme. Two of the four indicated that this results in too much paperwork for the school and teachers who are already stretched.
Key performance indicators
According to the provincial programme manager, key performance indicators have been identified in the tool, though these were not made available.
School visitsFive school visits were carried out as part of the evaluation of the NSNP. These were carried out in Soshanguve and in Orange Farm.

14
Meeting of objectives
All school nutrition coordinators interviewed had a clear understanding that the primary purpose of the programme was to feed needy children in order to improve concentration and learning. There was acknowledgment that objectives related to food gardens and nutrition education were also important, though they appeared to view the programme largely as a feeding scheme.
Only one of the five coordinators interviewed thought the supplies were insufficient to feed all targeted children as more children were needy.
Targeting
The process used for targeting at school level is as follows: all of the five schools assess children with unemployed and single parents, and those children are then targeted. Only the one school that indicated that supplies are insufficient also said they do not feed all the targeted children. All other schools feed all targeted children.
Mechanisms to support vulnerable children
Four of five schools visited indicated that they keep their own lists of orphans. They then work with the Department of Social Services to make sure that the children receive the grants due to them from that department. Only one school identified a social worker who handles this job and treats all information as confidential. One school indicated that they had a soup kitchen which provided breakfast for the children who had not eaten before leaving for school.
Food storage and facilities
Only one of the schools has storage space allocated for food. The other schools use either one of the classrooms, or the head of department’s office, which is neither convenient or hygienic. The other school uses the sick room and they do not have plates or utensils for learners.
One of the district officials stated that he would like to see learners take the leftover food home over the weekend as the storage areas are sometimes infested with pests. But this does not always happen because sometimes the teachers take the food home. If not taken home, it rots at school over the weekend.
Food preparation and serving facilities and process
kitchens: None of the schools have a kitchen, and one did not have a stove either. The stove which had been delivered was faulty, and it was taken back and never returned. At the time of the survey, the school was using a two-plate stove, which was inadequate.
rubbish disposal: Of the five schools, two had closed containers for the disposal of garbage. One had an open container and at another the container was open but the bags inside were closed. The last school had most of the garbage in closed containers, although some were not closed.
toilets: One school had not had water for some time and the toilets were full. The school had to close at midday because of this. It was reported that this occurred about once a month. The other schools had no visible dirt in or around their toilets. None of the school toilets had toilet paper or soap available, though there were basins. At two of the schools, there was a smell in the toilets; at one of the schools, the bad odour only came from the boys’ toilets. None of the schools had evidence of pests.
One of the schools has a cleaner who comes in to clean the school every day; the cleaner is paid by the department. It is considered to be the cleanest school in the area.

15
hand-washing facilities and practice: Two of the schools have functional hand-washing facilities; how-ever they did not have soap. One school uses buckets for learners to wash their hands in front of their classrooms; however, that was the school that did not have water on the day of the visit, so this could not be observed.
feeding time: None of the schools started or finished feeding on time. Feeding mostly went on un-til 12h00 or just after. Two of the interviewees stated that they were unaware they must finish at 10h00.
food quality and quantity: All schools reported that food was served before expiry dates and was free of any visible form of contamination. This appeared to be the case on observation of food served during visits. Menus and portion sizes are presented below.
Table 6: Compliance with menu
School Menu option served Actual portion size Required portion size* Comment1 Soya mince 80g 30g Portion sizes substantially larger
than required. Dehydrated vegetables, required in the provincial menus were not included.
Pap 220g 65g
2 2 slices of brown bread
2 slices (and can come back for more)
2 slices From observation, portion sizes appeared substantially larger than minimum required. Portions were not measured so cannot give an accurate assessment of compliance or lack thereof.
Peanut butter 15g 15gJam 20g 20gButter 10g 10gMilk 200ml
3 Samp 125g 90g Portion sizes were larger than the minimum requirement. Beans 125g 40g
Soup 200ml 200ml
*Bid Specif ication, 2007
Two school visits took place on the last day of school. Because children leave early, feeding did not take place so it could not be observed.
ConclusionNo formal system is in place for monitoring schools, though the national tool has been distributed to districts by the provincial programme office. There are also no staff dedicated to this function in dis-trict offices. Support from food and beverage interns is important and effective but only covers pockets of Gauteng and skills are not retained in the programme once the internship is complete. Resources are distributed inequitably, with some schools getting weekly visits for limited periods while others receive no visits. There is very limited monitoring and coordination of district offices from province.
Not all schools have proper storage and preparation facilities. Hygiene requirements as outlined by the provincial department are not always complied with.
5.3.3 Targeting
Findings
Current system
The following systems are in place for targeting the poorest learners.
16
School classification
In line with national guidelines, the province is responsible for classifying all schools according to level of poverty, with quintile 1 being the poorest and quintile 5 being least in need. It was reported that the classification system allocates points according to level of poverty of both the school and the community in which the school is located, with 50% of points going to each.
Programme focus
Farm and rural schools, which mostly fall within quintiles 1 and 2, are the primary target of the pro-gramme. The no-fee schools are then next in the priority listing in terms of provincial requirements. The urban schools are not considered needy; however, in reality they have learners who are poor. The Cosmo City project (Tshwane North) for example, is resettling the needy in an urban area. The needy in the urban areas are also considered and catered for. When parents apply at the schools, they are requested to complete an application form which indicates the level of income, and therefore need.
Updating numbers of target learners
A process is in place whereby schools submit the increase or decrease in the number of target learners annually, via districts, to the programme manager. This is then included in the supplier contracts. A constraint of this system noted by managers is that numbers of learners fluctuate throughout the year. There is however a lack of flexibility to increase the number of target learners included in the service provider contract during the year. This results in a delay in the increase of volumes of food products until the numbers are adjusted in the next year.
ConclusionThe targeting of learners for this programme appears to be working as the teachers are not just us-ing the traditional methods, but also encouraging needy learners to be part of the programme. The provincial office is also keeping an eye out for those schools that have poor learners but who are not necessarily in the focus quintiles.
5.3.4 Institutional arrangements
Findings The provincial programme office is well integrated into the Gauteng Department of Education. District managers, however, were concerned that while the programme is integrated into the structure and included in the job description of managers responsible for a number of programmes, the programme does not have its own dedicated staff and vehicles while other programmes do.
Both provincial and district management are satisfied that there is sufficient internal communica-tion between the programme management and overall provincial/district management structures. Programme coordinators participate in routine meetings where feedback on the programme is pro-vided. One of the district officials recommended that there should be provincial coordination of cover-age by interns. He indicated that some schools are not covered because interns are allocated to work in the area in which they live. This has meant, for example, that in Johannesburg South, schools outside Soweto do not get visited at all while schools in Soweto were being visited as often as weekly.
ConclusionThere is adequate integration of the provincial office into the Gauteng Department of Education struc-tures. The programme is, however, still in the process of becoming integrated into district offices.

17
5.3.5 Communication
FindingsThe provincial official is satisfied with the level of communication between their office and the dis-trict offices. However, the district offices identify communication as a weakness; they indicated in interviews that it is inadequately equipping them with an understanding of developments in the province and what is happening in other districts. One district official stated that in the year under review, they had not had even one meeting with the provincial office and suggested that it could be because positions in the provincial office are not filled. The current official does not have any other person assisting him and has to do everything by himself. They do acknowledge though, that there is telephonic communication when necessary between the district and provincial officials.
One of the district officials indicated that the schools had been told to use the bread menu because they did not have the facilities to cook. During the year, without their knowledge, the provincial offices had utensils and stoves delivered to the schools. The service providers were also told to provide for the cooked meals only as the schools now had the necessary utensils. There was no communication to this effect between provincial office and district office.
All the district officials interviewed had been given the guidelines for the implementation of the School Nutrition Programme.
ConclusionCommunication between provincial and district offices is currently inadequate to provide support to and coordination of district programme staff. Improved communication is needed to increase the sharing of a common vision for the province, as well as to encourage and motivate staff.
18
6 outputs
For the purposes of this evaluation, outputs of the programme are defined as achievements of the programme that impact indirectly on learning. Outcomes of the programme, discussed in the next section, were regarded as achievements of the programme that impact more directly on learning, namely the percentage of targeted learners fed and compliance with minimum feeding days. Outputs of the programme were identified as:• The presence of active food gardens in schools.• Economic activity related to food gardens.• Community participation in the running of the programme in the school.
Assessment of all of these achievements was included in the school survey, the findings of which are presented below along with other sources of information.
6.1 Findings
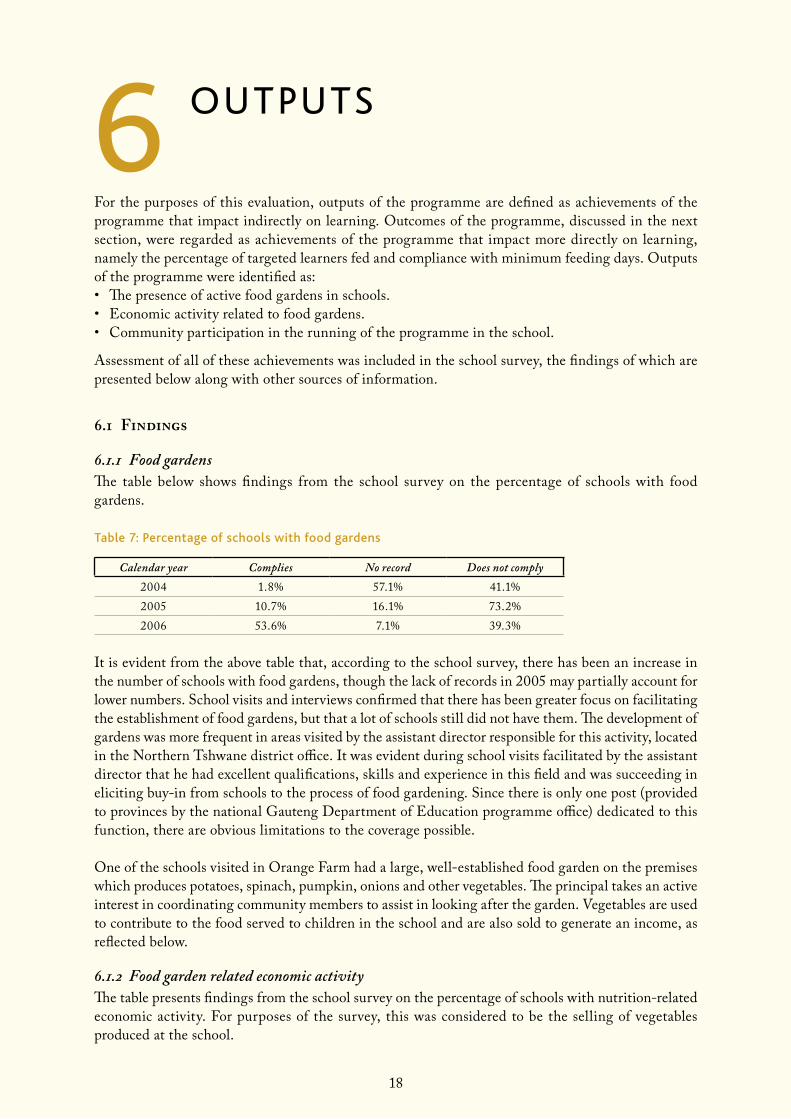
6.1.1 Food gardensThe table below shows findings from the school survey on the percentage of schools with food gardens.
Table 7: Percentage of schools with food gardens
Calendar year Complies No record Does not comply2004 1.8% 57.1% 41.1%2005 10.7% 16.1% 73.2%2006 53.6% 7.1% 39.3%
It is evident from the above table that, according to the school survey, there has been an increase in the number of schools with food gardens, though the lack of records in 2005 may partially account for lower numbers. School visits and interviews confirmed that there has been greater focus on facilitating the establishment of food gardens, but that a lot of schools still did not have them. The development of gardens was more frequent in areas visited by the assistant director responsible for this activity, located in the Northern Tshwane district office. It was evident during school visits facilitated by the assistant director that he had excellent qualifications, skills and experience in this field and was succeeding in eliciting buy-in from schools to the process of food gardening. Since there is only one post (provided to provinces by the national Gauteng Department of Education programme office) dedicated to this function, there are obvious limitations to the coverage possible.
One of the schools visited in Orange Farm had a large, well-established food garden on the premises which produces potatoes, spinach, pumpkin, onions and other vegetables. The principal takes an active interest in coordinating community members to assist in looking after the garden. Vegetables are used to contribute to the food served to children in the school and are also sold to generate an income, as reflected below.
6.1.2 Food garden related economic activity The table presents findings from the school survey on the percentage of schools with nutrition-related economic activity. For purposes of the survey, this was considered to be the selling of vegetables produced at the school.
19
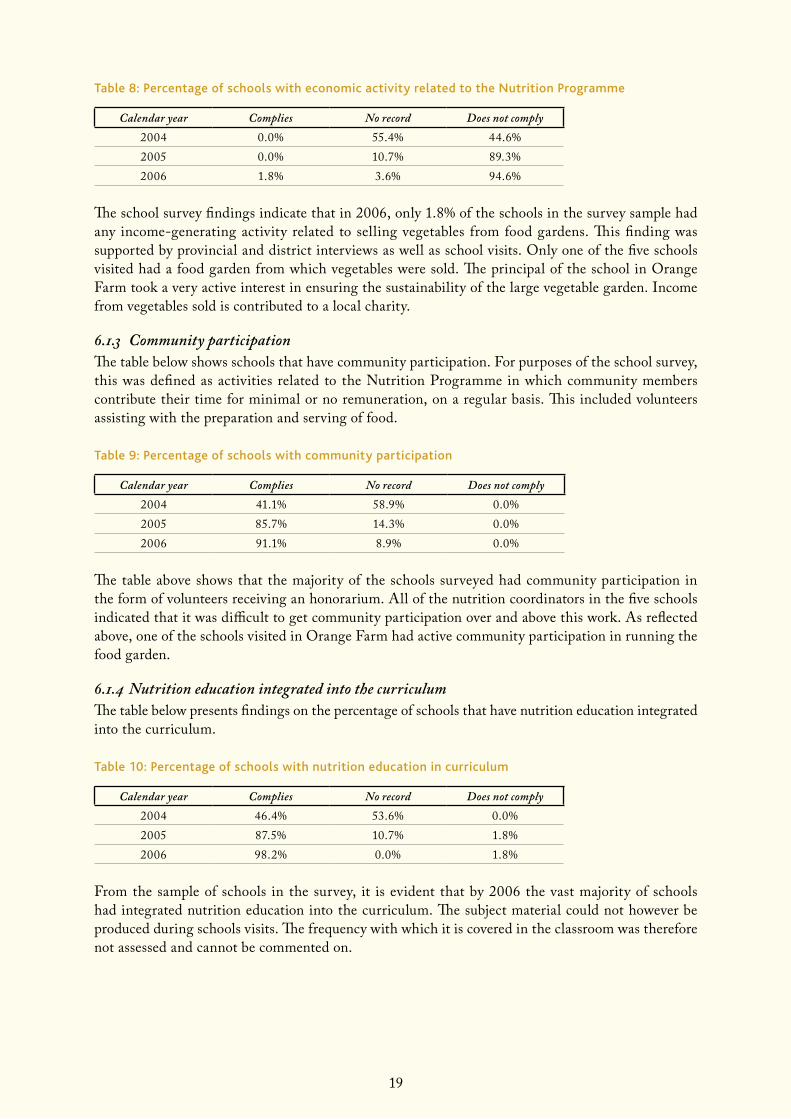
Table 8: Percentage of schools with economic activity related to the Nutrition Programme
Calendar year Complies No record Does not comply2004 0.0% 55.4% 44.6%2005 0.0% 10.7% 89.3%2006 1.8% 3.6% 94.6%
The school survey findings indicate that in 2006, only 1.8% of the schools in the survey sample had any income-generating activity related to selling vegetables from food gardens. This finding was supported by provincial and district interviews as well as school visits. Only one of the five schools visited had a food garden from which vegetables were sold. The principal of the school in Orange Farm took a very active interest in ensuring the sustainability of the large vegetable garden. Income from vegetables sold is contributed to a local charity.
6.1.3 Community participationThe table below shows schools that have community participation. For purposes of the school survey, this was defined as activities related to the Nutrition Programme in which community members contribute their time for minimal or no remuneration, on a regular basis. This included volunteers assisting with the preparation and serving of food.
Table 9: Percentage of schools with community participation
Calendar year Complies No record Does not comply2004 41.1% 58.9% 0.0%2005 85.7% 14.3% 0.0%2006 91.1% 8.9% 0.0%
The table above shows that the majority of the schools surveyed had community participation in the form of volunteers receiving an honorarium. All of the nutrition coordinators in the five schools indicated that it was difficult to get community participation over and above this work. As reflected above, one of the schools visited in Orange Farm had active community participation in running the food garden.
6.1.4 Nutrition education integrated into the curriculumThe table below presents findings on the percentage of schools that have nutrition education integrated into the curriculum.
Table 10: Percentage of schools with nutrition education in curriculum
Calendar year Complies No record Does not comply2004 46.4% 53.6% 0.0%2005 87.5% 10.7% 1.8%2006 98.2% 0.0% 1.8%
From the sample of schools in the survey, it is evident that by 2006 the vast majority of schools had integrated nutrition education into the curriculum. The subject material could not however be produced during schools visits. The frequency with which it is covered in the classroom was therefore not assessed and cannot be commented on.

20
6.2 Conclusion
Output ConclusionFood gardens Partially achieved. Only 53.6% of the schools have food gardens. This is an
improvement on the previous periods. Economic activity resulting from food gardens
Not achieved. Only one of the f ive schools interviewed was able to generate an income from the gardens.
Community participation Some achievements. The focus of community participation in four of the f ive schools was on volunteers as opposed to the f ifth school where the community was involved in the food garden. The other schools do have food gardens, but they are not a priority. The main reason behind the community involvement in the food garden is the principal who took an active interest in ensuring that the community is involved in this project.
Nutrition education in curriculum
Achieved. 98.2% of the schools with records have integrated nutrition into their curriculum, mostly as part of life orientation.

21
7 outCoMes
For the purposes of the evaluation, outcomes were defined as programme achievements that have a direct impact on learning. These include:• The targeted number of learners that were reached by the programme in the evaluation period.• Whether feeding took place on the minimum required number of days.• Compliance with provincial menu.• Compliance with required feeding time.
Given that these are key indicators of whether the objectives of the programme are being met, they were central to the school survey. The findings of the survey along with other sources of information on these indicators are reported below.
7.1 Findings
7.1.1 Target learners fedThe table below shows the percentage of schools in the sample where target learners are fed over the evaluation period.
Table 11: Percentage of schools that comply with feeding target learners
Calendar year 100% and above 90% to 100% 80% to 90% Less than 80% No record2004 69.6% 0.0% 0.0% 0.0% 30.4%2005 80.4% 0.0% 0.0% 1.8% 17.9%2006 92.9% 0.0% 1.8% 0.0% 5.4%
It is evident from the above table that in 2005 and 2006, the majority of sample schools with records were feeding all target learners. This was supported by interviews with managers at all levels who indicated that normally more than the target numbers, but not all enrolled learners, are fed. Only a very small percentage of schools have no record as compared to the 2005 schools with no record.
7.1.2 Compliance with required feeding days The table below shows the percentage of schools in the sample that complied with required feeding days during the evaluation period.
Table 12: Percentage of schools that comply with required feeding days
Calendar year 100% and above 90% to 100% 80% to 90% Less than 80% No record2004 0.0% 0.0% 0.0% 0.0% 100.0%2005 100.0% 0.0% 0.0% 0.0% 0.0%2006 100.0% 0.0% 0.0% 0.0% 0.0%
The table above shows that in 2005 and 2006, 100% of schools in the Gauteng sample were able to serve food on all the feeding days required by the province. Very few records were available for 2004.
22
7.1.3 Compliance with prescribed menuThe table below shows the percentage of sample schools that complied with prescribed menus.
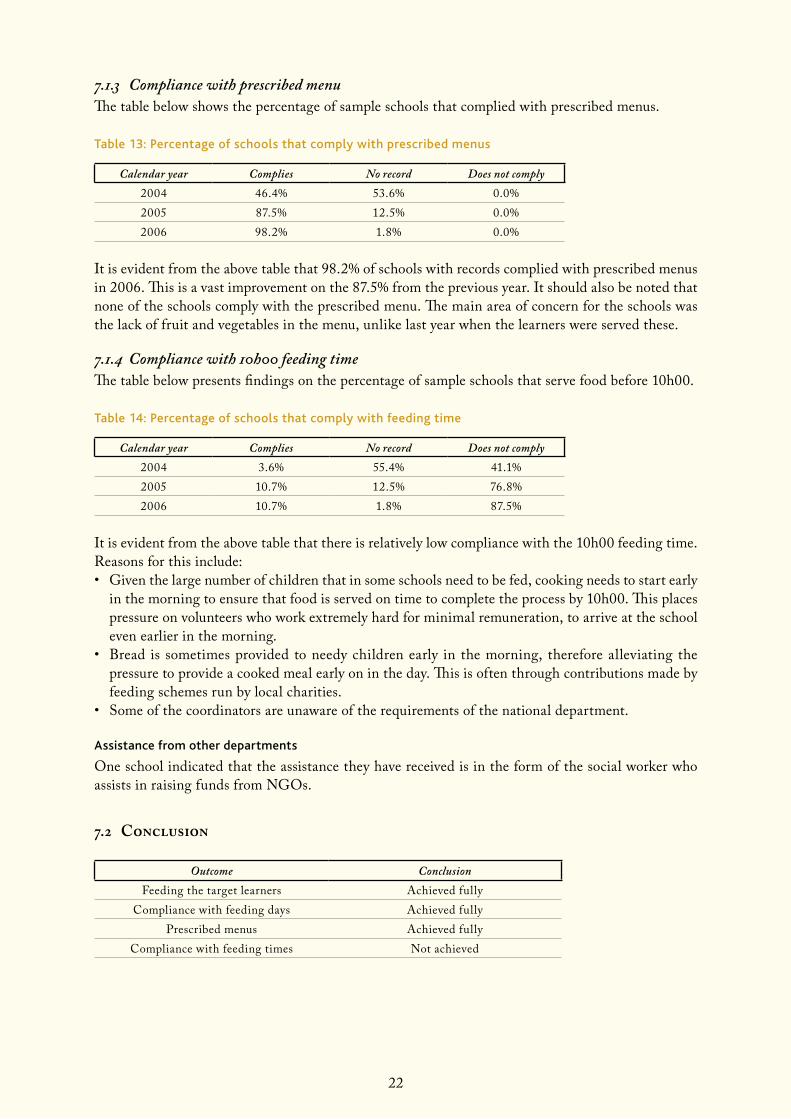
Table 13: Percentage of schools that comply with prescribed menus
Calendar year Complies No record Does not comply2004 46.4% 53.6% 0.0%2005 87.5% 12.5% 0.0%2006 98.2% 1.8% 0.0%
It is evident from the above table that 98.2% of schools with records complied with prescribed menus in 2006. This is a vast improvement on the 87.5% from the previous year. It should also be noted that none of the schools comply with the prescribed menu. The main area of concern for the schools was the lack of fruit and vegetables in the menu, unlike last year when the learners were served these.
7.1.4 Compliance with 10h00 feeding time The table below presents findings on the percentage of sample schools that serve food before 10h00.
Table 14: Percentage of schools that comply with feeding time
Calendar year Complies No record Does not comply2004 3.6% 55.4% 41.1%2005 10.7% 12.5% 76.8%2006 10.7% 1.8% 87.5%
It is evident from the above table that there is relatively low compliance with the 10h00 feeding time. Reasons for this include:• Given the large number of children that in some schools need to be fed, cooking needs to start early
in the morning to ensure that food is served on time to complete the process by 10h00. This places pressure on volunteers who work extremely hard for minimal remuneration, to arrive at the school even earlier in the morning.
• Bread is sometimes provided to needy children early in the morning, therefore alleviating the pressure to provide a cooked meal early on in the day. This is often through contributions made by feeding schemes run by local charities.
• Some of the coordinators are unaware of the requirements of the national department.
Assistance from other departments
One school indicated that the assistance they have received is in the form of the social worker who assists in raising funds from NGOs.
7.2 Conclusion
Outcome ConclusionFeeding the target learners Achieved fully
Compliance with feeding days Achieved fullyPrescribed menus Achieved fully
Compliance with feeding times Not achieved

23
8 ConCLusion
Performance of the programme in Gauteng in meeting provincial and national objectives is considered to be fairly good overall. This is based primarily on school-level recognition of the importance of providing food to needy children and functional provincial supply chain management. Schools have good compliance with required feeding days and prescribed menus. Improvements can be made in terms of feeding before 10h00 and reaching targeted learners. Increased focus on facilitating food gardens and related economic activity will contribute to the effectiveness of the programme in meeting objectives.
The effectiveness and efficiency of most systems needs to be improved. In particular, monitoring of schools from district offices needs to be improved as well as support provided to districts from the pro-vincial office. Record keeping is central to an effective monitoring system and needs to be upgraded. If monitoring of the programme is to be effectively decentralised to district offices, staff shortages need to be addressed and staff dedicated to nutrition appointed. The high turnover of district staff juggling five different programmes has resulted in some districts having poorly motivated staff with no particular interest in the Nutrition Programme. Support and coordination from provincial offices of districts need improvement. Payment of service providers frequently does not take place on time and consequently the volunteers are also not paid on time.

24
9 reCoMMendations
9.1 Improvingperformanceagainstobjectives
objective 1
Provide training to districts and schools on the importance of feeding before 10h00. Prioritise moni-toring of this indicator during regular school visits. Elicit buy-in from circuit manager to support adjusting the school timetables to support early feeding.
objective 2
Closer, direct involvement of school governing boards in programme development is recommended. This should be used to facilitate school principals becoming more active in the programme. Principals need to be encouraged to mobilise the community to get more involved in this project. It would also help if the department considered employing the volunteers on a full-time basis on at least the minimum wage.
Human and financial resources allocated for the development of food gardens is recommended in all districts to ensure greater prioritisation of this objective.
objective 3
The review of nutrition education as prescribed by the national department, by the nutrition coordina-tor is important to ensure compliance.
9.2 Systemsimprovements
Targeting
• Review criteria used for classifying schools into quintiles to increase likelihood that all poor and needy children are reached.
• Given increasing urban poverty, the targeting of pupils could be enhanced so that schools in urban areas are included in the schools targeted for the purposes of this programme. This will increase the inclusion of all needy learners.
Supply chain management
• Transparency of the provincial tender system could be enhanced by involving district officials in the submission of bids from service providers in each district.
• Also participation of local service providers may improve the likelihood of including fresh produce on the menu due to smaller storage demands.
• Communication should be improved by having meetings on a regular basis amongst all the three levels of officials, at least quarterly, to provide a forum where issues such as supply chain processes and plans can be discussed and developed.
Human resources
• Vacant positions need to be filled as a matter of urgency to improve the efficiency in the payments to service providers and support district staff.
• Full-time posts at district level need to be created to ensure that appropriate monitoring and evalu-ation is carried out. Resources that focus on facilitating food gardens and community participation are also required.

25
Monitoring and evaluation
• Involve district staff in developing a formal monitoring and evaluation system with key performance indicators. All schools should receive a minimum of a quarterly visit from the district office.
• Establish quarterly meetings with district offices to provide support, increase communication and joint planning and programme ownership, and provide opportunities for information sharing to district staff.
• Develop efficient systems for record keeping at all levels.


