prudential plc annual report 2011...+5% europeanembeddedvalue new businesspro t1 2010 £2,028 m...
TRANSCRIPT

Prudential plc
Annual Report 2011
An
nu
al Rep
ort 20
11
Long-term thinking
HK Stock Code: 2378

Prudential delivered another strong performance in 2011, with continued growth across the key metrics of IFRS, new business profit and cash while maintaining a robust capital position. In line with our strategy of value optimisation and capital conservation, higher sales and higher profit in 2011 have been achieved while consuming less capital in both relative and absolute terms than in 2010.
We remain on track to deliver the 2013 profit growth and cash generation objectives we announced in December 2010. Our clear strategy and the strength of our products and distribution – combined with our balanced portfolio of businesses and market-leading positions in Asia – mean we are well positioned to deliver continued relative outperformance in the medium-term.
To view our report online go to www.prudential.co.uk
Quick linksFor further information about our KPIs, go to page 2
For further information about our strategy and operating principles, go to page 9
For further information about our Board of Directors, go to page 108
The directors’ report of Prudential plc for the year ended 31 December 2011 is set out on pages 1-130, 436-463 and 466-470, and includes the sections of the Annual Report referred to in these pages.
Prudential plc
Annual Report 2011
An
nu
al Rep
ort 20
11
Long-term thinking
HK Stock Code: 2378
2
Prudential plc Annual Report 2011
3
Overv
iew
Highlights
Overview | Highlights
Annual Premium Equivalent new business premiums1
2010
£3,485m £3,681m
2011
+6%
European Embedded Value operating pro�t from long-term business2
2010
£3,840m£4,043m
2011
+5%
European Embedded Value new business pro�t1
2010
£2,028m£2,151m
2011
+6%
International Financial Reporting Standards operating pro�t based on longer-term investment returns
2010
£1,941m£2,070m
2011
+7%
Key performance indicators Business unit performance highlights
Prudential Corporation Asia•Total IFRS operating profit* up 32 per cent to £709 million – making our
life insurance business in Asia the biggest contributor† to Group IFRS operating profit
•High performing multi-channel distribution with increasing agent activity and productivity and strongly growing sales through an extensive range of bank partners
•Well balanced life insurance product portfolio emphasising regular premium savings and protection that offers good returns for customers and shareholders
•More market leading positions than any other life insurer in the region and the region’s largest onshore mutual fund manager
Jackson•New business profit up 7 per cent to £815 million
•Top three provider of variable and total annuities in US
•Rated as a ‘World Class’ service provider for six successive years by Service Quality Measurement Group
•Highest Customer Satisfaction by Industry award from Service Quality Measurement Group
Prudential UK•Total IFRS operating profit of £723 million
•Strength and investment performance of With-Profits Fund allowed Prudential to deliver strong annualised returns for policyholders
•Two ‘Five Star’ ratings for excellent service in the Investment and Life and Pensions categories at the Financial Adviser Service Awards 2011
M&G•Record operating profit up 22 per cent to £301 million
•M&G’s retail business has been awarded the prestigious Outstanding Investment House of the Year 2011 Award for the second year running at the OBSR Awards
•M&G’s institutional business was recognised for its strength and expertise at the industry flagship Financial News Awards for Excellence in Institutional Asset Management, where it was named Fixed Income Manager of the Year 2011
1 2010 comparative APE new business sales and new business profit exclude those for the Japanese insurance operations which ceased writing new business from 15 February 2010.
2 Including Solvency II implementation costs, restructuring costs, Asia development costs, Asia Regional Head Office costs and in 2011, the impact of the RPI to CPI inflation measure change for defined benefit pension schemes.
* Operating profit from long-term operations excluding Eastspring Investments, development costs and Asia regional head office costs.
† If long-term business is considered separately from asset management and UK general insurance commission.
8
Prudential plc Annual Report 2011
9
Overv
iew
I am pleased to report a strong performance in 2011. We announced in December 2010 clear ‘Growth and Cash’ objectives for 2013. 2011 has marked another year of progress towards achieving these objectives: (i) doubling 2009 Asia IFRS and new business profit by 2013, (ii) cumulative net remittances to the Group of at least £3.8 billion over 2010 to 2013 and (iii) UK, Asia and Jackson to deliver respectively £350 million, £300 million and £200 million of cash in 2013.
We have achieved two key milestones which emphasise the good progress that we have made towards these objectives.
First, our life insurance business in Asia1 is now the biggest contributor to Group IFRS operating profit2, making it our largest business on both IFRS and EEV profitability measures. Since 2008, we have made considerable progress in translating the promise of our Asian life insurance franchise into a solid business, delivering significant growth in sales but also IFRS operating profit and cash. Asia offers some of the most attractive opportunities within the global insurance market and the potential for long-term profitable growth for Prudential in the region is clear. Our focus on Asia is simply a consequence of our approach to shareholder value and capital allocation that prioritises our investment towards the markets, products and channels that offer the most profitable returns and the most attractive payback periods.
We have continued to make progress in Asia as measured by our primary growth metric, new business profit. Six markets have achieved new business profit growth in excess of 20 per cent in 2011. Our focus on profitable growth has not stopped us from continuing to grow our absolute and relative scale: six of our 11 Asian life insurance operations are now market leaders in terms of absolute new business sales and, excluding India, all of our markets have grown their sales in 2011.
Second, as a Group, we have enjoyed a track record of sales growth for a number of years. What is particularly pleasing in our 2011 performance is that our progress on cash has been as visible as our progress on our traditional growth agenda. All four of our business units have remitted significant amounts of cash to the Group. Achieving a balanced funding structure is one of our explicit strategic objectives, moving us away from an operating model that relied historically on our UK life business for cash generation. Our business units’ ability to generate cash is possibly the best evidence that they have navigated well through the financial crisis.
Group performanceAPE sales were up 6 per cent in life insurance in 2011 to £3,681 million (2010: £3,485 million3). New business profit increased by 6 per cent to £2,151 million (2010: £2,028 million3) at attractive new business margins which remained stable at 58 per cent (2010: 58 per cent). Net inflows in our asset management businesses were £4.5 billion (2010: £8.9 billion) following two years of exceptionally high performance. The inflows we have generated in 2011 remain an impressive result in what was a particularly challenging year for the asset management industry due to the weak and volatile performance of global stock markets.
In executing our strategy, we are guided by three clearly defined Group-wide operating principles.
The first of these is a balanced approach to performance management across the three key measures of IFRS, EEV and cash, with an increased emphasis on IFRS and cash. As a result, in 2011, we are reporting results which show growth across all three key measures. This puts us in a strong position to continue to capture the profitable growth opportunities available in our chosen markets.
Notes1 ExcludingEastspringInvestments,developmentcostsandAsiaregionalheadofficeexpenses.
2 Iflong-termbusinessisconsideredseparatelyfromassetmanagementandUKgeneralinsurancecommission.
3 ExcludesJapan,whichceasedwritingnewbusinessin2010.
Our life insurance business in Asia1 is now the biggest contributor to Group IFRS operating profit2, making it our largest business on both IFRS and EEV profitability measures.
Tidjane ThiamGroup Chief Executive
Group Chief Executive’s report
Overview | Group Chief Executive’s report
Group operating principles
• Use of balanced metrics
• Disciplined capital allocation
• Proactive risk management
Strategic framework
Accelerating
AsiaFor further information go to page 24
Strengthening
United StatesFor further information go to page 34
Focusing
United KingdomFor further information go to page 40
Optimising
Asset ManagementFor further information go to page 46
IFRS operating profit based on longer-term investment returns
2010
£1,941m£2,070m
2011
+7%
108
Prudential plc Annual Report 2011
109
Govern
ance
Board of directors
Governance | Board of directors
Chairman
Harvey McGrath Chairman and Chairman of the Nomination CommitteeHarvey McGrath was appointed as an independent non-executive director of Prudential in September 2008 and became the Chairman and Chairman of the Nomination Committee in January 2009. Harvey has a long and distinguished career in the international financial services industry, having started his career at Chase Manhattan Bank in London and New York. From 1980 to 2007 he worked for the Man Group, first as Treasurer, then Finance Director, then President of Man Inc. in New York before being appointed as Chief Executive of Man Group plc in London in 1990 and then Chairman in 2000. He left Man Group in 2007.
Harvey is also Chairman of the London Development Agency which works for the Mayor of London coordinating economic development and regeneration across London. He is the former Chairman of both London
First and the East London Business Alliance and former Vice Chairman of the London Skills and Employment Board from 2006 to 2011. In July 2011, Harvey was appointed as co-chair of the new Board of the London Enterprise Partnership (LEP).
Harvey is Chairman of Governors of Birkbeck College and trustee of a number of charities. These include New Philanthropy Capital, a research based charity which gives advice and guidance to donors and charities; the Royal Anniversary Trust, which operates the Queen’s Anniversary Prizes for Higher and Further Education; Children and Families Across Borders (CFAB), which protects the rights and welfare of children and vulnerable adults across borders; icould, an online careers resource; and the Prince’s Teaching Institute, which promotes subject based professional development for teachers. Harvey will retire from the Board in 2012 once a successor has been found. Age 60.
Executive Directors
Nicolaos Nicandrou ACAChief Financial OfficerNic Nicandrou has been an executive director of Prudential and Chief Financial Officer since October 2009. Before joining Prudential, he worked at Aviva, where he held a number of senior finance roles, including Norwich Union Life Finance Director and Board Member, Aviva Group Financial Control Director, Aviva Group Financial Management and Reporting Director and CGNU Group Financial Reporting Director. Nic started his career at PriceWaterhouseCoopers
where he worked in both London and Paris. Age 46.
Robert DeveyExecutive DirectorRob Devey has been an executive director of Prudential and Chief Executive, Prudential UK and Europe since November 2009. Rob joined Prudential from Lloyds Banking Group where he worked from 2002 in a number of senior leadership roles across insurance and retail banking. Prior to joining Lloyds Banking Group Rob was a consultant with the Boston Consulting Group (BCG) in the
UK, US and Europe. Rob chairs the London Leadership Team of Business in The Community and is also a trustee of the LloydsTSB Foundation for England and Wales. Age 43.
John FoleyExecutive DirectorJohn Foley has been an executive director of Prudential and Group Chief Risk Officer since January 2011. He joined Prudential as Deputy Group Treasurer in 2000 before being appointed Managing Director, Prudential Capital (formerly Prudential Finance (UK))
and Group Treasurer in 2001. He was appointed Chief Executive of Prudential Capital and to the Group Executive Committee in 2007. Prior to joining Prudential, John spent three years with National Australia Bank as General Manager, Global Capital Markets. John began his career at Hill Samuel & Co Limited where, over a 20 year period, he worked in every division of the bank, culminating in senior roles in risk, capital markets and treasury of the combined TSB and Hill Samuel Bank. Age 55.
Group Chief Executive
Tidjane Thiam Group Chief ExecutiveTidjane Thiam has been an executive director of Prudential since 25 March 2008. He was the Chief Financial Officer until 30 September 2009 and became Group Chief Executive with effect from 1 October 2009.
Tidjane was previously Group Executive Director and Chief Executive Officer, Europe at Aviva where he worked from 2002 to 2008 and held successively the positions of Group Strategy and Development Director and Managing Director, Aviva International. Tidjane spent the first part of his professional career with McKinsey & Company in Paris and New York, serving insurance companies and banks. He then spent a number of years in Africa where he was Chief Executive and later Chairman of the National Bureau for Technical Studies and Development in Cote d’Ivoire and a cabinet member as Secretary of Planning and Development. Tidjane returned to France to become a partner with McKinsey
& Company and one of the leaders of their Financial Institutions practice before joining Aviva in 2002.
Tidjane was a non-executive director of Arkema in France until November 2009. He is a member of the Board of the Association of British Insurers (ABI) and a member of the Council of the Overseas Development Institute (ODI) in London. Tidjane is a member of the Africa Progress Panel chaired by Kofi Annan and a sponsor of Opportunity International. In January 2011, he was appointed to chair the G20 High Level Panel for Infrastructure Investment, which reported to the G20 Leaders at the G20 Summit in Cannes in November 2011. Tidjane is a member of the UK-ASEAN Business Council and of the Strategic Advisory Group on UK Trade and Investment. In January 2012, Tidjane was appointed to the Prime Minister’s Business Advisory Group. Tidjane was awarded the Légion d’Honneur by the French President in July 2011. Age 49. Michael McLintock
Executive DirectorMichael McLintock has been an executive director of Prudential since September 2000. He is also Chief Executive of M&G, a position he held at the time of M&G’s acquisition by Prudential in 1999. Michael joined M&G in 1992. He previously also served on the board of Close Brothers Group plc as a non-executive director from 2001 to 2008. Since October 2008, he has been a Trustee of the Grosvenor Estate and was appointed as a non-executive director of Grosvenor Group Limited in March 2012. He has also been a member of the Finance Committee of the MCC since October 2005. Age 50.
Barry Stowe Executive DirectorBarry Stowe has been an executive director of Prudential since November 2006, and Chief Executive, Prudential Corporation Asia since October 2006. He has been a member of the Board of Visitors of Lipscomb University since May 2009 and was a director of the Life Insurance Marketing Research Association (LIMRA) and the Life Office Management Association (LOMA) from October 2008 to October 2011. Previously, Barry was President, Accident & Health Worldwide for AIG Life Companies. He joined AIG in 1995, and prior to that was President and CEO of Nisus, a subsidiary of Pan- American Life, from 1992 to 1995. Before joining Nisus, Barry spent 12 years at Willis Corroon in the US. Age 54.
Michael Wells Executive DirectorMike Wells has been an executive director of Prudential since January 2011 when he succeeded Clark Manning as President and CEO of Jackson National Life Insurance Company. Mike has served in a variety of senior and strategic positions at Jackson over the last 15 years, including President of Jackson National Life Distributors. Mike has been Vice Chairman and Chief Operating Officer of Jackson for the last nine years. During this period he has led the development of Jackson’s variable annuity business and been responsible for IT, strategy, operations, communications, distributions, Curian and the retail broker dealers. Age 51.
76 8
431 52
1 Harvey McGrath2 Tidjane Thiam3 Nicolaos Nicandrou ACA4 Robert Devey5 John Foley6 Michael McLintock7 Barry Stowe8 Michael Wells
1O
ve
rview
Bu
sine
ss review
Go
ve
rna
nce
Dire
ctors’
rem
un
eratio
n rep
ort
Fin
an
cial state
me
nts
Ad
ditio
na
l info
rmatio
nOverview | Contents
Section 1
Overview1-14
2 Highlights4 At a glance6 Chairman’s statement8 Group Chief Executive’s report
Section 2
Business review15-106
16 Financial highlights18 Chief Financial Officer’s review24 Business unit review:
• Insurance operations: Asia, US, UK• Asset management: M&G,
Eastspring Investments, US56 Financial review80 Risk and capital management91 Other corporate information95 Corporate responsibility review
Section 3
Governance107-132
108 Board of directors1 1 3 Governance report130 Additional disclosures1 3 1 Index to principal Directors’ Report disclosures
Section 4
Directors’ remuneration report133-158
134 Directors’ remuneration report
Section 5
Financial statements and European Embedded Value (EEV) basis supplementary information159-464
160 Summary of statutory and supplementary International Financial Reporting Standards (IFRS) basis and EEV basis results
162 Index to Group financial statements 163 Consolidated income statement 164 Consolidated statement of comprehensive income 165 Consolidated statement of changes in equity 167 Consolidated statement of financial position 169 Consolidated statement of cash flows 170 Notes on the Group financial statements 371 Balance sheet of the parent company 372 Notes on the parent company financial statements 383 Statement of directors’ responsibilities in respect
of the Annual Report and the financial statements 384 Independent auditor’s report to the members
of Prudential plc 385 EEV basis supplementary information 391 Notes on the EEV basis supplementary information 433 Statement of directors’ responsibilities in respect
of the EEV basis supplementary information 434 Independent auditor’s report to Prudential plc
on the EEV basis supplementary information 435 Additional unaudited financial information
Section 6
Additional information465-479
466 Risk factors471 Glossary476 Shareholder information478 How to contact us

2
Prudential plc Annual Report 2011
Highlights
Overview | Highlights
Annual Premium Equivalent new business premiums1
2010
£3,485m £3,681m
2011
+6%
European Embedded Value operating pro�t from long-term business2
2010
£3,840m£4,043m
2011
+5%
European Embedded Value new business pro�t1
2010
£2,028m£2,151m
2011
+6%
International Financial Reporting Standards operating pro�t based on longer-term investment returns
2010
£1,941m£2,070m
2011
+7%
Key performance indicators
1 2010 comparative APE new business sales and new business profit exclude those for the Japanese insurance operations which ceased writing new business from 15 February 2010.
2 Including Solvency II implementation costs, restructuring costs, Asia development costs, Asia Regional Head Office costs and in 2011, the impact of the RPI to CPI inflation measure change for defined benefit pension schemes.

3Overv
iew
Business unit performance highlights
Prudential Corporation Asia•Total IFRS operating profit* up 32 per cent to £709 million – making our
life insurance business in Asia the biggest contributor† to Group IFRS operating profit
•High performing multi-channel distribution with increasing agent activity and productivity and strongly growing sales through an extensive range of bank partners
•Well balanced life insurance product portfolio emphasising regular premium savings and protection that offers good returns for customers and shareholders
•More market leading positions than any other life insurer in the region and the region’s largest onshore mutual fund manager
Jackson•New business profit up 7 per cent to £815 million
•Top three provider of variable and total annuities in US
•Rated as a ‘World Class’ service provider for six successive years by Service Quality Measurement Group
•Highest Customer Satisfaction by Industry award from Service Quality Measurement Group
Prudential UK•Total IFRS operating profit of £723 million
•Strength and investment performance of With-Profits Fund allowed Prudential to deliver strong annualised returns for policyholders
•Two ‘Five Star’ ratings for excellent service in the Investment and Life and Pensions categories at the Financial Adviser Service Awards 2011
M&G•Record operating profit up 22 per cent to £301 million
•M&G’s retail business has been awarded the prestigious Outstanding Investment House of the Year 2011 Award for the second year running at the OBSR Awards
•M&G’s institutional business was recognised for its strength and expertise at the industry flagship Financial News Awards for Excellence in Institutional Asset Management, where it was named Fixed Income Manager of the Year 2011
* Operating profit from long-term operations excluding Eastspring Investments, development costs and Asia regional head office costs.
† If long-term business is considered separately from asset management and UK general insurance commission.

4
Prudential plc Annual Report 2011
26,000+employees
Prudential at a glance
PrudentialplcisaninternationalfinancialservicesgroupwithsignificantoperationsinAsia,theUSandtheUK.Weservemorethan26millioncustomersandhave£351billionofassetsundermanagement.WearelistedonstockexchangesinLondon,HongKong,SingaporeandNewYork.
TheGroupisstructuredaroundfourmainbusinessunits:PrudentialCorporationAsia,JacksonNationalLifeInsuranceCompany,PrudentialUKandM&G.
Prudentialuseslong-termthinkingtocreatelong-termvalue.Throughourstrongfinancialperformanceandinternationalstrategy,wecreatefinancialbenefitsforourshareholdersandinvestorsanddelivereconomicandsocialbenefitsforthecommunitiesinwhichweoperate.
Overview | At a glance
Key statistics
Note1 Excludes Japan which ceased writing
new business in 2010.
160+years of understanding and responding to our customers’ needs
£351bn assets under management (at 31 December 2011)
26m+customers
Life assurance% of Group APE new business premiums1
45
%
20
35
Asia US UK
Life assurance% of Group new business pro�t1
50
%
12
38
Asia US UK
Asset management% of Group external funds under management
%
17
83
M&G Asia 4stock exchange listings – London, Hong Kong, New York and Singapore

5Overv
iew
Overview % of Group operating profits
Prudential Corporation Asia PrudentialisaleadinginternationallifeinsurerinAsiawithoperationsin12markets.Wehavebuiltahighperformingplatformwitheffective,multi-channeldistribution,aproductportfoliocentredonregularsavingsandprotection,awardwinningcustomerservicesandawellrespectedbrand.
Prudential’sAsianbasedassetmanagementdivision,EastspringInvestments,isoneoftheregion'sleadingfundmanagersandthelargestonshoreproviderofmutualfunds.
44%EEV*
30%IFRS†
www.prudential corporation-asia.com
For further information go to page 24
Jackson JacksonisoneofthelargestlifeinsurancecompaniesintheUS,providingretirementsavingsandincomesolutionswithmorethan2.9millionpoliciesandcontractsinforce.
JacksonisalsooneofthetopthreeprovidersofvariableandtotalannuitiesintheUS.
Founded50yearsago,Jacksonhasalongandsuccessfulrecordofprovidingadviserswiththeproducts,toolsandsupporttodesigneffectiveretirementsolutionsfortheirclients.
35%EEV*
28%IFRS†
www.jackson.com
For further information go to page 34
Prudential UKPrudentialUKisaleadinglifeandpensionsprovidertoapproximately7millioncustomersintheUnitedKingdom.
Ourexpertiseinareassuchaslongevity,riskmanagementandmulti-assetinvestment,togetherwithourfinancialstrengthandhighlyrespectedbrand,meansthatthebusinessisstronglypositionedtocontinuepursuingavalue-drivenstrategybuiltaroundourcorestrengthsinwith-profitsandannuities.
21%EEV*
28%IFRS†
www.pru.co.uk
For further information go to page 40
M&GM&GisPrudential’sUKandEuropeanfundmanagementbusinesswithtotalassetsundermanagementof£201billion(at31December2011).
M&Ghasbeeninvestingmoneyforindividualandinstitutionalclientsforover80years.TodayitisoneofEurope’slargestactiveinvestmentmanagers,aswellasbeingapowerhouseinfixedincome.
14%IFRS†
www.mandg.co.uk
For further information go to page 46
*Based on long-term business. † Based on operating profit before other
income and expenditure.
6
Prudential plc Annual Report 2011
Overview | Chairman’s statement
Chairman’s statement
I am pleased to introduce Prudential’s 2011 Annual Report. We have followed our excellent results in 2010 with another strong performance, led by our fast-growing Asian business, which is the largest contributor to both the sales and profits of the Group.
In 2011 we saw continued market volatility around the world, caused in part by concerns about sovereign debt, particularly in the Eurozone. However, our disciplined approach to risk and capital management and our focus on high return markets and products has meant the Group has continued to deliver profitable, cash-generative growth.
The Board has therefore recommended a final dividend of 17.24 pence per share, which brings the total dividend for the reporting period to 25.19 pence per share, 1.34 pence (5.6 per cent) higher than the 2010 total dividend. We are focused on delivering a growing dividend from the new higher base established at the year end 2010.
The cash remittance objectives for the Group and the growth and profitability targets for the Asia business announced at our December 2010 investor conference remain on track to be delivered in 2013. These challenging objectives, alongside our progressive dividend policy, demonstrate our commitment to provide both growth and cash to shareholders.
There have been a number of changes to the Board during the year. Bridget Macaskill stepped down in September, having served as a non-executive director of the Company since September 2003. She had been a member of the Remuneration Committee since
‘ �The�quality�of�our�people�and�their�commitment�to�customers,�the�excellence�of�our�products�and�our�proven�strategy�mean�that�we�can�be�confident�that�the�Group�will�continue�to�deliver�sustainable�value�in�the�years�to�come.’

7O
ve
rview
Full year dividend
2010
23.85p 25.19p
2011
+5.6%
2003 and became its Chairman in May 2006. She had also been a member of the Nomination Committee since 2004. Lord Turnbull succeeded her as Chairman of the Remuneration Committee and became a member of the Nomination Committee. In December we announced that Kathleen O’Donovan, who has served as a non-executive director for almost nine years, including chairing the Audit Committee from May 2006 to September 2009, would retire from the Board on 31 March 2012. I would like to acknowledge the considerable contribution both Bridget and Kathleen have made to the Group during their time here.
We also announced the appointment of two new non-executive directors, Kai Nargolwala and Alistair Johnston, who joined on 1 January 2012. Kai was non-executive Chairman of Credit Suisse Asia Pacific and will sit on the Risk and Remuneration Committees. From 1998 to 2007, he worked for Standard Chartered PLC where he was a Group Executive Director responsible for Asia Governance and Risk. Alistair brings extensive global markets, international management and accounting experience from many years at KPMG. He joined KPMG in 1973 and was a partner from 1986 to 2010. During this time he held a number of senior leadership positions including being a Global Vice Chairman from 2007 to 2010. He has joined the Audit Committee.
It is with sadness that we note the passing in February 2012 of Lord Carr of Hadley, former Chairman of Prudential. During his 13 years as a Prudential director, and particularly in his time as Chairman from 1980 to 1985, Lord Carr brought to our organisation the benefits of his wide experience of public and business life.
In December 2011 I announced my intention to retire as Chairman in 2012 once a suitable successor has been found. As I said at the time, I felt it was important to give the Board good notice of my intentions so that the process of appointing a successor could get under way. It has been a great honour to serve as Chairman but my other commitments in the public, educational and philanthropic sectors deserve more of my time and energy. My tenure at Prudential has encompassed a period of great turmoil in the markets. It is testament to the Group’s strategy, the quality and experience of the Board and the efforts of the management team led by the Group Chief Executive, Tidjane Thiam, that we can say with confidence that Prudential has emerged from this period as one of the leading insurance companies in the world.
As Chairman, I have always been proud of how Prudential and its staff strengthen the communities in which we operate. I strongly believe that organisations have a responsibility not only to do well but, where possible, to do good. We achieve this in a number of ways: through offering our customers financial security; through our role as a long-term investor in businesses and infrastructure; and through our corporate responsibility activities.
We aim to direct our community investment towards initiatives which tackle issues where we can make the most impact given our expertise. We have focused on areas such as financial literacy, education for young people and care for the elderly. Across the Group, we are currently increasing our commitment to education-related charities, while in the UK we are engaged in initiatives to tackle youth unemployment through apprenticeship schemes. We actively encourage employee engagement to support and deliver these initiatives, and many of our employees offer their experience and time to charities and their communities. For example, at Prudential UK 40 per cent of staff took part in volunteering to support good causes during 2011. Group-wide, many employees volunteer as part of the Chairman’s Challenge, our flagship volunteering programme, with more than 3,000 colleagues worldwide taking part last year, helping more than 25 projects.
I would like to take this opportunity to express my thanks to our employees around the world who have ensured that Prudential has continued to deliver value to our shareholders. The quality of our people and their commitment to customers, the excellence of our products and our proven strategy mean that we can be confident that the Group will continue to deliver sustainable value in the years to come.
Harvey McGrathChairman

8
Prudential plc Annual Report 2011
Our life insurance business in Asia1 is now the biggest contributor to Group IFRS operating profit2, making it our largest business on both IFRS and EEV profitability measures.
Tidjane ThiamGroup Chief Executive
Group Chief Executive’s report
Overview | Group Chief Executive’s report
IFRS operating profit based on longer-term investment returns
2010
£1,941m£2,070m
2011
+7%

9Overv
iew
I am pleased to report a strong performance in 2011. We announced in December 2010 clear ‘Growth and Cash’ objectives for 2013. 2011 has marked another year of progress towards achieving these objectives: (i) doubling 2009 Asia IFRS and new business profit by 2013, (ii) cumulative net remittances to the Group of at least £3.8 billion over 2010 to 2013 and (iii) UK, Asia and Jackson to deliver respectively £350 million, £300 million and £200 million of cash in 2013.
We have achieved two key milestones which emphasise the good progress that we have made towards these objectives.
First, our life insurance business in Asia1 is now the biggest contributor to Group IFRS operating profit2, making it our largest business on both IFRS and EEV profitability measures. Since 2008, we have made considerable progress in translating the promise of our Asian life insurance franchise into a solid business, delivering significant growth in sales but also IFRS operating profit and cash. Asia offers some of the most attractive opportunities within the global insurance market and the potential for long-term profitable growth for Prudential in the region is clear. Our focus on Asia is simply a consequence of our approach to shareholder value and capital allocation that prioritises our investment towards the markets, products and channels that offer the most profitable returns and the most attractive payback periods.
We have continued to make progress in Asia as measured by our primary growth metric, new business profit. Six markets have achieved new business profit growth in excess of 20 per cent in 2011. Our focus on profitable growth has not stopped us from continuing to grow our absolute and relative scale: six of our 11 Asian life insurance operations are now market leaders in terms of absolute new business sales and, excluding India, all of our markets have grown their sales in 2011.
Second, as a Group, we have enjoyed a track record of sales growth for a number of years. What is particularly pleasing in our 2011 performance is that our progress on cash has been as visible as our progress on our traditional growth agenda. All four of our business units have remitted significant amounts of cash to the Group. Achieving a balanced funding structure is one of our explicit strategic objectives, moving us away from an operating model that relied historically on our UK life business for cash generation. Our business units’ ability to generate cash is possibly the best evidence that they have navigated well through the financial crisis.
Group performanceAPE sales were up 6 per cent in life insurance in 2011 to £3,681 million (2010: £3,485 million3). New business profit increased by 6 per cent to £2,151 million (2010: £2,028 million3) at attractive new business margins which remained stable at 58 per cent (2010: 58 per cent). Net inflows in our asset management businesses were £4.5 billion (2010: £8.9 billion) following two years of exceptionally high performance. The inflows we have generated in 2011 remain an impressive result in what was a particularly challenging year for the asset management industry due to the weak and volatile performance of global stock markets.
In executing our strategy, we are guided by three clearly defined Group-wide operating principles.
The first of these is a balanced approach to performance management across the three key measures of IFRS, EEV and cash, with an increased emphasis on IFRS and cash. As a result, in 2011, we are reporting results which show growth across all three key measures. This puts us in a strong position to continue to capture the profitable growth opportunities available in our chosen markets.
Notes1� �Excluding�Eastspring�Investments,�development�costs�and�Asia�regional�head�office�expenses.
2� �If�long-term�business�is�considered�separately�from�asset�management�and�UK�general�insurance�commission.
3� �Excludes�Japan,�which�ceased�writing�new�business�in�2010.
Group operating principles
• Use of balanced metrics
• Disciplined capital allocation
• Proactive risk management
Strategic framework
Accelerating
AsiaFor further information go to page 24
Strengthening
United StatesFor further information go to page 34
Focusing
United KingdomFor further information go to page 40
Optimising
Asset ManagementFor further information go to page 46

10
Prudential plc Annual Report 2011
Overview | Group Chief Executive’s report | continued
Group Chief Executive’s report
On a statutory IFRS basis, our operating profit based on longer-term investment returns increased by 7 per cent in 2011 to £2,070 million (2010: £1,941 million). IFRS shareholders’ funds increased in 2011 to £9.1 billion, up 14 per cent compared to £8.0 billion as at 31 December 2010. On an EEV basis, Group operating profit based on longer-term investment returns increased by 8 per cent in 2011 to £3,978 million (2010: £3,696 million). Since 2008, we have been using free surplus as the primary indicator of our ability to generate cash and capital and at the end of 2011, free surplus increased to £3.4 billion (2010: £3.3 billion). Underlying free surplus generation was up 16 per cent to £1,983 million (2010: £1,714 million).
Second, we have focused on allocating capital to the highest return and shortest payback opportunities across the Group. This means that we focus our investment on writing new business in the areas of the market where our demanding return and payback criteria are met. In 2011, new business profit increased 6 per cent while investment in new business was £553 million (2010: £643 million1), 14 per cent lower. Since 2008, new business profit has increased 79 per cent while investment in new business has fallen 30 per cent over the same period, a material increase in capital efficiency.
Third, we take a proactive approach to managing risk across the cycle. We have transformed the capital position of the Group since 2008 with an estimated £4.0 billion of Insurance Groups Directive (IGD) capital surplus against £1.5 billion at the end of 2008. We are continuously improving our risk management process and systems to ensure that our key risks are tracked and managed both locally and centrally.
Our operating performance by business unitPrudential Corporation Asia Our medium and long-term growth opportunities are driven by the rapidly expanding middle class across the region, with its strong appetite for savings and protection products. Although the global economic environment has been more challenging in recent times, we continue to believe that our prospects in the region are exciting, as indicated by our commitment to double our key metrics of IFRS operating profit and new business profit between 2009 and 2013.
Across Asia, we continue to innovate both in products and technology, where our investment drives improvements in operational efficiency, helps manage persistency and ensures that we can continue to meet profitably the evolving demands of our customers. Our business is aided by a positive regulatory environment as governments in the region seek to increase insurance penetration, recognising the social role and economic benefits of life insurance as a key provider of long-term capital.
In South East Asia, our ‘sweet spot’, our growth has been largely led by the rising market of Indonesia as well as the more developed economies of Hong Kong, Singapore and Malaysia. These operations are generating sustainable growth and value, supporting our investments in more emerging markets such as the Philippines, Vietnam and Thailand.
Prudential Indonesia is now our largest business in Asia across virtually all metrics and is the clear market leader in a country where the opportunities for continued growth are significant. It is a market that has low insurance penetration, of just 1 per cent. It is the world’s fourth most populous country and a member of the G20. Indonesia has the largest Muslim population in the world; in Syariah products, which are compliant with Islamic law, we have a 54 per cent market share. With 142,000 licensed agents, we have the largest agency network in the country. We believe that the opportunities to further enhance our distribution scale there are significant.
Note1� ��Excludes�Japan,�which�ceased�writing�new�business�in�2010.
‘�We�continue�to�believe�that�our�prospects�in�the�region�are�exciting,�as�indicated�by�our�commitment�to�double�our�key�metrics�of�IFRS�operating�profit�and�new�business�profit�between�2009�and�2013.’
2010
£3,696m£3,978m
2011
Underlying free surplus generation
U121 T c - 0 . 0 2Un

11Overv
iew
In the more emerging markets, we continue to make good operational progress, and over time expect to see a steadily increasing contribution to growth and profits from our businesses in these territories. The Philippines provides a good illustration of these trends. Our business had excellent APE sales growth of 30 per cent, helping it leapfrog from third place to become this rapidly developing country’s largest life insurance provider in terms of new business, a very creditable achievement in this highly competitive market.
As previously indicated, the market in India has been challenging since the fourth quarter of 2010 due to significant regulatory reforms across the industry in that year. We are now coming out of this difficult period, a year after the reform, and our joint venture with ICICI continues to be the leading private sector player. In the fourth quarter of 2011, our sales increased notably, demonstrating that our business in India is gathering some momentum. We remain confident about the long-term prospects of that market as we train our extensive agency force to sell a new product suite.
Central to our success in Asia is distribution. Agency continues to be our largest distribution channel, consistent with our customers’ preference for face-to-face contact when buying life, health and protection products. In addition, and in parallel, Prudential has a number of highly successful bancassurance partnerships across the region. Our distribution through bank branches complements well our agency distribution and gives us a broader and more diversified footprint. These partnership agreements include regional relationships with international banks such as Standard Chartered, which this year was extended to an eleventh country, the Philippines, and local banks such as E.Sun in Taiwan. 2011 has been the first full year in our relationship with UOB. We have already extended our relationship beyond the three original markets of Singapore, Thailand and Indonesia to include Malaysia and China. This partnership has contributed materially to our strong performance, notably in Singapore where APE sales were up 34 per cent, new business profit up 25 per cent and IFRS operating profit up 29 per cent.
Prudential Corporation Asia’s delivery of both profitable growth and cash has validated the central element of the Group’s strategy, to focus on the region as a means to deliver sustainable shareholder value.
Jackson National Life Insurance Company (Jackson)In the United States, the transition of the ‘baby boomer’ generation from employment to retirement which became visible around 2005 to 2006 is now firmly under way. Over the next 20 years, more than 10,000 people a day will reach retirement age in the US1 and these individuals will look to the insurance industry among others to help them convert their accumulated wealth into a steady stream of retirement income.
Jackson’s strategy focuses on capturing this opportunity while balancing value, volume, capital efficiency, cash generation, balance sheet strength and strict pricing discipline. Our capital has primarily been directed towards higher-margin and more capital-efficient variable annuities. Our approach to pricing and hedging is conservative and enables us to mitigate the impact of macroeconomic challenges and ensure that we are able to meet our commitments to our customers.
Policyholder behaviour across our book of in-force policies continues to trend in line with our assumptions. Jackson is financially strong, with a risk-based-capital ratio of 429 per cent at the end of 2011, after paying a large remittance to the Group in June 2011.
Note1� �Source:�US�Census�Bureau.

12
Prudential plc Annual Report 2011
Overview | Group Chief Executive’s report | continued
Group Chief Executive’s report
‘�Prudential�shareholders�are�seeing�the�benefits�of�Jackson’s�counter-cyclical�expansion�in�variable�annuities.’
‘�In�the�UK,�we�focus�on�the�lines�of�business�where�we�have�a�clear�competitive�advantage�and�can�generate�attractive�returns�on�capital�invested.’
In the US, customers and distributors are attracted by Jackson’s track record of financial discipline and strong credit rating. We implemented a number of changes in 2010 and 2011 to proactively manage our sales levels, to comply with revised regulations, enhance risk management flexibility and increase profitability. Our monthly variable annuity sales declined from September 2011 onwards from the peak levels seen in the early summer as a result of, first, a number of proactive changes we made to manage the balance between growth, capital and profitability and second, the performance of US equity markets in the period. We have continued to write our business at attractive internal rates of return (IRRs) throughout the year.
Looking ahead, variable annuity sales volumes are likely to continue to show a good degree of correlation with the performance of the S&P 500 index and will also be impacted by our competitors’ behaviour. Our approach will continue to focus on profitability ahead of sales. Our disciplined approach to pricing will remain unchanged as we continue to manage conservatively the balance of risk and returns. Prudential shareholders are seeing the benefits of Jackson’s counter-cyclical expansion in variable annuities following the financial crisis as Jackson was able to remit £322 million in 2011, the largest net remittance it has ever paid to the Group.
Prudential UK Like Jackson in the US, Prudential UK is well positioned to help British ‘baby boomers’ as they approach retirement. In the UK, like our other chosen markets, in terms of new business, we focus on the lines of business where we have a clear competitive advantage and can generate attractive returns on capital invested; and we manage our in-force book for value.
Our performance in 2011 shows we continue to be a market leader both in individual annuities and in with-profits products. In individual annuities, we registered a decrease in our sales as we continued to proactively control capital consumption. The strength and performance track record of Prudential UK’s With-Profits Fund is widely recognised. Despite the market volatility in 2011, with-profits customers’ policy values were augmented by a total of £2.1 billion. Our customers continue to benefit from solid returns and the security offered by the large inherited estate. Our results in 2010 benefited from a large bulk annuity contract. There were no similar opportunities of comparable size which met our strict value criteria so our level of activity in that segment was materially reduced.
At the end of 2010, the business announced a number of cost-saving initiatives to reduce costs by £75 million per annum by the end of 2013. We remain on track to achieve this objective.

13Overv
iew
Asset management Our asset management businesses have continued to perform well, with M&G IFRS operating profit exceeding £300 million. Our fund managers have a strong track record of outperforming their respective benchmarks and our performance track record has driven another good year for net inflows in what was a challenging environment for the industry. Over the last four years, M&G has risen from being the fifth largest player in the UK retail market in terms of funds under management to now being the second largest, and our UK retail assets have almost trebled over this period to over £35 billion.
After two successive years of extremely high net sales, it was our expectation that net fund flows would revert closer to historic levels in 2011. This was amplified by the macroeconomic environment in Continental Europe, particularly in the second half. However, in the UK, sales remain strong, demonstrating M&G’s strength across asset classes and distribution channels. As at December 2011, we have been number one in retail sales for 13 consecutive quarters1.
Regarding our asset management activities in Asia, we announced in November 2011 that our Asian asset management business would be rebranded Eastspring Investments. It is already a market-leading onshore third party fund management business. This new branding will enable it to establish a more cohesive regional presence, and to market its Asian expertise in Europe and North America. The business had a good year, growing profits by over 11 per cent in spite of a challenging environment characterised by weak stock market performance and the impact of the natural disaster in Japan.
Capital and risk managementProactive and disciplined management and allocation of capital are the foundations of a robust balance sheet and remain critical in the current economic and financial environment. Using the regulatory measure of the Insurance Groups Directive (IGD), before allowing for the final dividend, our Group capital surplus at 31 December 2011 was estimated at £4.0 billion (2010: £4.3 billion). The Group’s required capital is covered 2.75 times.
Solvency II, which is currently anticipated to be implemented from 1 January 2014, represents a major overhaul of the capital adequacy regime for European insurers. We are supportive in principle of the development of a more risk-based approach to capital but we have concerns about the potential consequences of some aspects of the Solvency II regime under consideration. With the continued delays to policy development, the final outcome of Solvency II remains uncertain. We are continuing to engage directly with our peers, policymakers and regulators so that the industry ultimately operates under a fair, effective and reasonable capital adequacy regime. Lack of certainty over the policy content and timetable continues to impede the industry’s ability to prepare fully for the new regime.
Therefore, in parallel to continuing our preparation for eventually implementing the Solvency II rules, we also evaluate actions to mitigate the possible negative effects. We regularly review the range of options available to us to maximise the strategic flexibility of the Group. Among these options is consideration of optimising the Group’s domicile, including as a possible response to an adverse outcome on Solvency II.
‘�Our�asset�management�businesses�have�continued�to�perform�well,�with�M&G�IFRS�operating�profit�exceeding�£300�million.’
Note1� �Source:�Fundscape.�(Q4�issue,�February�2012).�The�Pridham�Report.�Fundscape�LLP.
14
Prudential plc Annual Report 2011
Overview | Group Chief Executive’s report | continued
Group Chief Executive’s report
Dividend In light of the continued strong performance of the business and our focus on a growing dividend, the Board has recommended a final dividend of 17.24 pence per share (2010: 17.24 pence), giving a full 2011 dividend of 25.19 pence (2010: 23.85 pence), representing an increase of 5.6 per cent over 2010.
The Board will maintain its focus on delivering a growing dividend, which will continue to be determined after taking into account the Group’s financial flexibility and our assessment of opportunities to generate attractive returns by investing in specific areas of the business. The Board believes that in the medium-term a dividend cover of around two times is appropriate.
OutlookWe continue to believe our long-term success rests on our substantial presence in fast-growing economies across Asia. Our chosen markets benefit from solid economic growth, increasing wealth, favourable demographics – particularly a rapidly expanding middle class – with significant and increasing health and protection demands.
We expect Jackson to continue to benefit from the opportunity created by the transition of the ‘baby boomers’ into retirement and to make significant remittances to the Group. Our UK life operations should continue in 2012 to deliver significant remittances to the Group and maintain their balance sheet strength. Our asset management businesses, M&G and Eastspring Investments should continue to support our strategy, providing both profitable growth and cash.
The Group’s results are a clear sign of the success of our strategy of focusing our energies and capital on the most attractive opportunities and we are in a strong position to continue to deliver relative outperformance in the medium term. We have made a positive start to 2012 and over the course of the year we expect to continue to make progress towards our 2013 ‘Growth and Cash’ objectives.
Tidjane ThiamGroup Chief Executive
2013 Financial Objectives
Group • All business units in
aggregate to deliver cumulative net cash remittances of at least £3.8 billion over the period 2010 to end-2013
• Net remittances underpinned by targeted level of cumulative underlying free surplus generation of £6.5 billion over the period 2010 to end-2013
Accelerating
Asia• Double 2009 value of
IFRS life and asset management pre-tax operating profit
• Double 2009 value of new business profits
• Deliver £300 million of net cash remittance to the Group
Strengthening
United States• Deliver £200 million of
net cash remittance to the Group
Focusing
United Kingdom• Deliver £350 million of
net cash remittance to the Group

15B
usin
ess rev
iew
Section 2
Business review
16 Financialhighlights18 ChiefFinancialOfficer’sreview24 Businessunitreview: • Insuranceoperations:
Asia,US,UK • Assetmanagement:
M&G,EastspringInvestments,US
56 Financialreview80 Riskandcapitalmanagement91 Othercorporateinformation95 Corporateresponsibility
review
16
Prudential plc Annual Report 2011
Business review | Financial highlights
Financial highlights
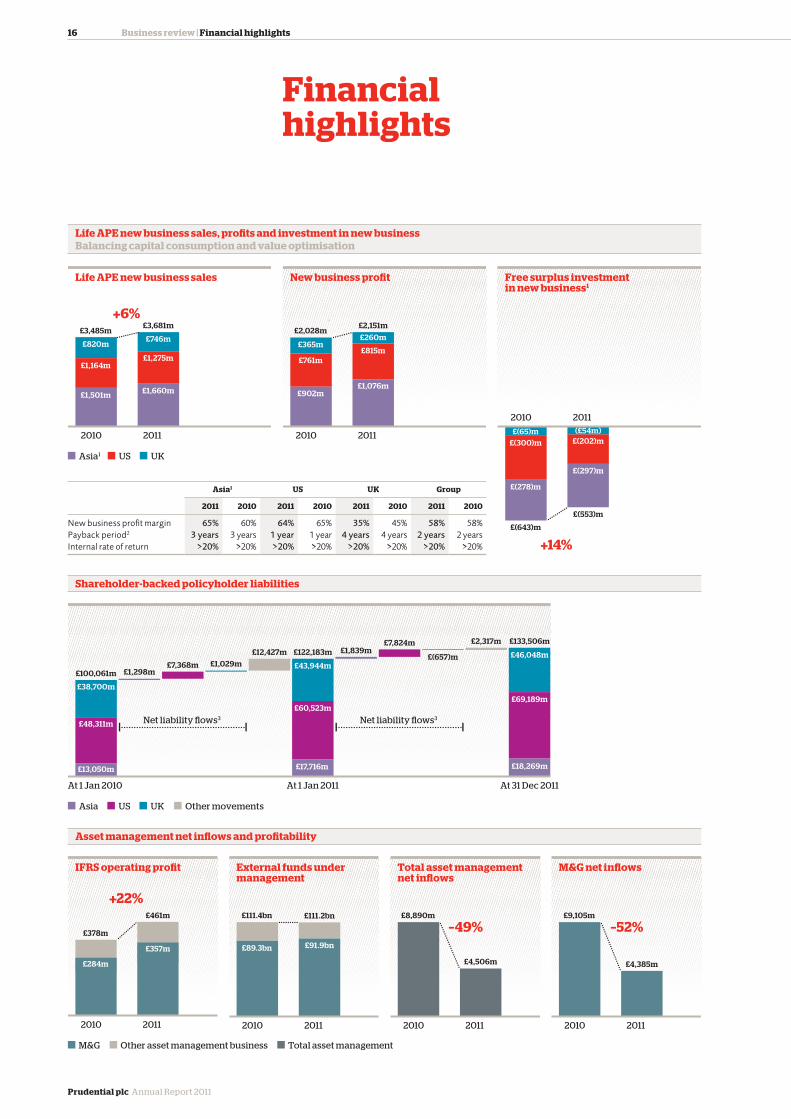
Shareholder-backed policyholder liabilities
At 1 Jan 2010 At 1 Jan 2011 At 31 Dec 2011
Asia US UK Other movements
£13,050m
£48,311m
£38,700m
£100,061m £1,298m£7,368m £1,029m
£12,427m £122,183m
£43,944m
£60,523m
£17,716m
£1,839m£7,824m
£(657)m
£2,317m £133,506m
£46,048m
£69,189m
£18,269m
Net liability �ows3 Net liability �ows3
Asset management net inflows and profitability
IFRS operating profit
+22%
2010
£284m
£378m
£357m
£461m
2011
M&G Other asset management business Total asset management
External funds under management
2010
£89.3bn
£111.4bn
£91.9bn
£111.2bn
2011
Total asset management net in�ows
–49%
2010
£8,890m
£4,506m
2011
M&G net inflows
–52%
2010
£9,105m
£4,385m
2011
Life APE new business sales, profits and investment in new businessBalancing capital consumption and value optimisation
Life APE new business sales
+6%
2010
Asia1
£820m
£3,485m
£1,164m
£1,501m
£746m
£3,681m
£1,275m
£1,660m
2011
US UK
2010
£365m
£2,028m
£761m
£902m
£260m
£2,151m
£815m
£1,076m
2011
Free surplus investmentin new business1
+14%
2010(£54m)
£(202)m
£(297)m
£(65)m£(300)m
£(278)m
£(643)m
£(553)m
2011
Asia1 US UK Group
2011 2010 2011 2010 2011 2010 2011 2010


18
Prudential plc Annual Report 2011
Notes1 If long-term business is considered
separately from asset management and UK general insurance commission.
2 Excludes Japan which ceased writing new business in 2010.
3 Source: Annuity Specs.
The continued growth in the profits of our Asian life insurance business was one of the highlights of our 2011 results, as Asia passed an important milestone becoming the largest contributor 1 to Group IFRS operating profit.
Chief Financial Officer’s overview
Business review | Chief Financial Officer’s overview
2011 was a productive year for Prudential during which we delivered strong performance across all of our key metrics and made clear progress towards our 2013 ‘Growth and Cash’ financial objectives.
At a Group level, the key headlines show that EEV new business profit (‘new business profit’) increased by 6 per cent to £2,151 million (2010: £2,028 million2), IFRS operating profit based on longer-term investment returns (‘IFRS operating profit’) increased by 7 per cent to £2,070 million (2010: £1,941 million) and underlying free surplus generation increased by 16 per cent to £1,983 million (2010: £1,714 million). These results were delivered during a particularly challenging macroeconomic environment and are testament to the quality of our franchises across Asia, the US and the UK.
Growth In life insurance, new business profit was up 6 per cent to £2,151 million (2010: £2,028 million2) on APE sales in 2011 of £3,681 million (2010: £3,485 million2) resulting in a new business margin of 58 per cent (2010: 58 per cent2). The growth in both sales and new business profit was achieved while investing 14 per cent less capital than last year, reflecting our disciplined approach to optimising the balance between value creation and capital utilisation, and our ongoing focus on those products and geographies with the highest returns and shortest payback periods.
Asia produced new business profit of £1,076 million (2010: £902 million2), and APE sales of £1,660 million (2010: £1,501 million2), up 19 per cent and 11 per cent respectively on the previous year. Our new business margin increased from 60 per cent to 65 per cent in 2011, driven by favourable country mix with a particularly strong performance in Indonesia, which is now the largest contributor to virtually all of our key financial metrics in Asia.
Jackson delivered new business profit of £815 million (2010: £761 million), up 7 per cent compared to 2010, based on APE sales of £1,275 million (2010: £1,164 million). Our new business margin in the US remains attractive at 64 per cent (2010: 65 per cent). We continued to focus on variable annuities over the course of 2011 and APE sales in this product line grew by 15 per cent to £1,091 million (2010: £948 million). We remain a top three player in US variable annuities3 and continue to balance value, risk and capital.
In the UK, we delivered new business profit of £260 million (2010: £365 million) and total APE sales of £746 million (2010: £820 million), down 29 per cent and 9 per cent respectively. These declines are primarily due to the level of bulk annuity activity achieved in 2010, which was not repeated in 2011, as there were fewer attractive opportunities in which to deploy our capital in that segment of the market. At a retail level, we delivered new business profit of £231 million (2010: £257 million) and APE sales of £712 million (2010: £725 million) as we continue to apply our value over volume approach, focusing on the product lines that produce the most attractive IRRs and payback periods. In 2011 we delivered a retail new business margin of 32 per cent, down from 35 per cent in 2010, due to lower volumes of higher margin individual annuities.
58%New business margin
Nic NicandrouChief Financial Officer
EEV new business pro�t2
2010
£2,028m £2,151m
2011
+6%

19B
usin
ess rev
iew
Across our life insurance businesses we grew our shareholder-backed policyholder liabilities by £11.3 billion in 2011 to £133.5 billion. This increase was driven by £9.0 billion of net inflows with the balance principally coming from foreign exchange and investment related movements.
In asset management, we have delivered £4.5 billion of net inflows over 2011 (2010: £8.9 billion). This is a good performance in what was a challenging year for asset managers. At the end of 2011, our total funds under management were £351 billion, of which £111 billion are external assets. M&G produced £4.4 billion (2010: £9.1 billion) of net inflows in the period (£3.9 billion retail, £0.5 billion institutional), an excellent result given the market backdrop. M&G has ranked number 1 in the UK retail market for gross and net sales over the last 13 consecutive quarters based on data to the end of December 20111. At 31 December 2011 it had external funds under management of £91.9 billion, 3 per cent higher than at the beginning of the year. External funds comprise £44.2 billion (2010: £42.5 billion) of retail and £47.7 billion (2010: £46.8 billion) of institutional assets. Adding these funds to internal amounts, M&G’s total funds under management were £201.3 billion. Eastspring Investments reported retail and institutional net inflows of £633 million in 2011 (2010: £1.8 billion). At the end of 2011, Eastspring Investments had £50.3 billion of funds under management, of which £19.2 billion were external assets.
ProfitabilityGroup IFRS operating profit increased by 7 per cent to £2,070 million (2010: £1,941 million) and Group EEV operating profit based on longer-term investment returns (‘EEV operating profit’) by 8 per cent to £3,978 million (2010: £3,696 million), equivalent to an annualised return on embedded value of 16 per cent. The contribution to these metrics from each business operation and each source is more balanced than at any previous time in the Group’s history, greatly enhancing both the quality and the resilience of the Group’s earnings.
The continued growth in the profits of our Asian life insurance business was one of the highlights of our 2011 results, as Asia passed an important milestone becoming the largest contributor2 to Group IFRS operating profit. Asia’s long-term business IFRS operating profit was up 32 per cent in 2011 to £709 million (2010: £536 million) with particularly strong performances coming from our businesses in Indonesia, Singapore and Hong Kong. We continue to see significant opportunities to grow both the size and the productivity of our distribution channels across South East Asia while maintaining good penetration of high margin health and protection insurance, and this should aid strong ongoing IFRS performance. Asia’s long-term EEV operating profit, a measure of the economic value creation in the year, grew by 22 per cent in 2011 to £1,764 million (2010: £1,450 million), further underlining the creation of sustainable value by these operations.
In the US, long-term business IFRS operating profit was down 17 per cent in 2011 to £694 million (2010: £833 million). This reduction was due to the expected accounting impact of accelerated deferred acquisition cost (DAC) amortisation of £232 million (2010: £11 million), which masked an underlying improvement in earnings. Excluding this effect, Jackson’s earnings continued to grow during 2011 reflecting the rising asset base which generates both higher revenues and scale economies. Fee income increased by 34 per cent from £506 million in 2010 to £680 million in 2011 as a result of the strong growth in separate account asset balances which at 31 December 2011 were 23 per cent higher at £38 billion (2010: £31 billion) reflecting strong net inflows in variable annuities. Spread income (including the expected return on shareholders’ assets) was £813 million in 2011 (2010: £817 million) and the average spread margin that we earned on general account liabilities increased from 243 bps in 2010 to 258 bps in 2011. The general account closed the period with policyholder liabilities of £31 billion (2010: £29 billion). Jackson’s long-term EEV operating profit decreased by 2 per cent in 2011 to £1,431 million (2010: £1,458 million).
‘WecontinuetoseesignificantopportunitiestogrowboththesizeandtheproductivityofourdistributionchannelsacrossSouthEastAsiawhilemaintaininggoodpenetrationofhighmarginhealthandprotectioninsurance,andthisshouldaidstrongongoingIFRSperformance.’
Notes1 Source:Fundscape.(Q4issue,December2011).ThePridhamReport.FundscapeLLP.
2 Iflong-termbusinessisconsideredseparatelyfromassetmanagementandUKgeneralinsurancecommission.
IFRS operating profitbased on longer-terminvestment returns
+7%
2010
£1,941m£2,070m
2011

20
Prudential plc Annual Report 2011
Business review | Chief Financial Officer’s overview | continued
Chief Financial Officer’s overview
In the UK long-term business IFRS operating profit was up by 1 per cent from £673 million in 2010 to £683 million in 2011, despite 2010 benefiting from a single large bulk annuity deal, which contributed £63 million to the result (2011: £23 million). Our UK business continues to focus on the sustained delivery of IFRS profits. The strength of the with-profits fund, which currently has a surplus estate of £6.1 billion, provides a secure platform to support future IFRS profits and cash generation. EEV operating earnings reduced by 9 per cent in 2011 to £853 million (2010: £936 million), principally reflecting the reduction in new business profits discussed above.
In asset management IFRS operating profit was up 22 per cent to £461 million compared to £378 million in 2010. M&G (including Prudential Capital) delivered a record performance, growing IFRS operating profit by 26 per cent to £357 million, (2010: £284 million) due to rising revenues which increased by 15 per cent on the prior year and a lower cost-income ratio of 60 per cent (2010: 63 per cent). Eastspring Investments produced a good performance as rising revenues and a fall in the cost-income ratio to 62 per cent (2010: 64 per cent) drove IFRS operating profit higher by 11 per cent to £80 million (2010: £72 million).
Capital generationWe take a disciplined approach to capital allocation across the Group. Over the last few years we have taken several important steps to improve the efficiency and effectiveness of the capital allocation process, emphasising an unbiased focus on the products and geographies with the most attractive profitability characteristics. This has improved not only our returns on capital invested, but also our capital strength and capital fungibility. In 2011 we have continued to produce significant amounts of free capital, which we measure as free surplus generated.
In 2011, we generated £2,536 million of underlying free surplus before reinvestment in new business from our life in-force and asset management businesses, up 8 per cent from £2,359 million in 2010. We reinvested £553 million of the free surplus generated in the period into writing new business. The majority of this reinvestment (£297 million) was into Asia, which remains the primary destination for investment within the Group. In the US, we invested £202 million in new business with a continued emphasis on variable annuities as we capitalised on the ‘baby boomer’ demand for the product and a weakened competitive environment following the financial market challenges of the last few years. In the UK, we invested £54 million in new business and our product focus remains annuities and with-profits bonds. The IRRs on this invested capital were more than 20 per cent in Asia, the US, and the UK, with payback periods of three years, one year and four years respectively.
Of the remaining free surplus generated after reinvestment in new business, £1,105 million was remitted from the business units to Group. This cash was used to meet central costs of £195 million, service net interest payments of £282 million and meet dividend payments of £642 million. Furthermore, an aggregate £205 million was paid to secure new distribution agreements in Asia and to the UK tax authorities following the settlement reached in 2010.
The remaining free surplus generated in the period was retained within our businesses and this has bolstered local capital ratios. The total free surplus balance deployed across our life and asset management operations increased from £3,338 million at the beginning of the period to £3,421 million at the end of the period.
‘Growth and Cash’ financial objectives The following discussion contains forward-looking statements that involve inherent risks and uncertainties. Prudential’s actual future financial condition or performance or other indicated results may differ materially from those indicated in any such forward-looking statement, due to a number of important factors (including those discussed under the heading ‘Risk factors’ in this document). See the discussion under the heading ‘Forward-looking statement’ at the end of this report.
‘In2011wehavecontinuedtoproducesignificantamountsoffreecapital,whichwemeasureasfreesurplusgenerated.’
‘TheseresultsweredeliveredduringaparticularlychallengingmacroeconomicenvironmentandaretestamenttothequalityofourfranchisesacrossAsia,theUSandtheUK.’

21B
usin
ess rev
iew
At our 2010 investor conference, entitled ‘Growth and Cash’, we announced new financial objectives demonstrating our confidence in continued rapid growth in Asia, and increasing levels of cash remittances from all of our businesses. These objectives were defined as follows:
(i) Asiagrowthandprofitabilityobjectives1:To double the 2009 value of IFRS life and asset management pre-tax operating profit in 2013 (2009: £465 million); and To double the 2009 value of new business profits in 2013 (2009: £713 million).
(ii) Businessunitcashremittanceobjectives1:Asia to deliver £300 million of net cash remittance to the Group in 2013 (2009: £40 million);
Jackson to deliver £200 million of net cash remittance to the Group in 2013 (2009: £39 million); and
UK to deliver £350 million of net cash remittance to the Group in 2013 (2009: £284 million2).
(iii)Cumulativenetcashremittances1: All business units in aggregate to deliver cumulative net cash remittances of at least £3.8 billion over the period 2010 to end-2013. These net remittances are to be underpinned by a targeted level of cumulative underlying free surplus generation of £6.5 billion over the same period.
As mentioned in the Group Chief Executive’s report we believe we remain on track to achieve these objectives. Below we set out in more detail our progress towards these objectives based on our results in 2011.
Asia profitability objectivesActual Objective
2009£m
2010£m
2011£m
Change (over 2010)
%
Change (since 2009)
%2013£m
Value of new business 713 901 1,076 19 51 1,426IFRS operating profit* 465 604 784 30 69 930
Business unit net remittance objectives
Actual Objective
2009£m
2010£m
2011£m
2013£m
Asia† 40 233 206 300 Jackson‡ 39 80 322 200 UK§ 434 420 297 350 M&G** 175 202 280
Total 688 935 1,105
Objectives for cumulative period 1 January 2010 to 31 December 2013 Actual Objective
Percent-age
achieved
1 Jan 2010 to 31 Dec
2011£m
1 Jan 2010 to 31 Dec
2013£m
At 31 Dec 2011
%
Cumulative net cash remittances from 2010 onwards 2,040 3,800 54Cumulative underlying group free surplus generation (which is net of investment in new business) 3,697 6,500 57
Notes1 TheobjectivesassumecurrentexchangeratesandanormalisedeconomicenvironmentconsistentwiththeeconomicassumptionsmadebyPrudentialincalculatingtheEEVbasissupplementaryinformationforthehalf-yearended30June2010.Theyhavebeenpreparedusingcurrentsolvencyrulesanddonotpre-judgetheoutcomeofSolvencyII,whichremainsuncertain.
2 Representingtheunderlyingremittancesexcludingthe£150millionimpactofproactivefinancingtechniquesusedtobringforwardcashemergenceofthein-forcebookduringthefinancialcrisis.
* TotalAsiaoperatingprofitfromlong-termbusinessandEastspringInvestmentsafterdevelopmentcosts.
† NetremittancesfromAsiain2010includedaone-offremittanceof£130million,representingtheaccumulationofhistoricdistributablereserves.
‡ NetremittancesfromJacksoninclude£122millionin2011representingreleasesofexcesssurplustoGroup.
§ In2009,thenetremittancesfromtheUKincludethe£150millionarisingfromthepro-activefinancingtechniquesusedtobringforwardcashemergenceofthein-forcebookduringthefinancialcrisis.The2010netremittancesincludeanamountof£120millionrepresentingthereleasesofsurplusandnetfinancingpayments.
**IncludingPrudentialCapital.

22
Prudential plc Annual Report 2011
Business review | Chief Financial Officer’s overview | continued
Chief Financial Officer’s overview
In 2011 net remittances from business operations increased to £1,105 million. All of our businesses are now remitting considerable amounts of cash to Group and this is in line with our strategy as we seek to move away from the historical reliance on the UK. Jackson delivered the largest increase in net remittances during 2011, as we began to reap the rewards of our post-financial crisis expansion in variable annuities. It is testament to the quality of what Jackson has achieved in recent years that it can pay such a large remittance while financing growth and maintaining a strong RBC ratio, which at the end of 2011 was 429 per cent. Remittances from the UK life operations continue to be underpinned by the with-profits business but also reflect positive cashflows from the shareholder-backed business. M&G delivered a large increase in net remittances, reflecting its highly profitable growth and its ‘capital-lite’ business model that facilitates a high dividend payout ratio from its earnings. Asia’s remittances were also very strong in 2011 as it matures into an increasingly cash generative business, reaping the rewards of its significant growth and its health and protection product focus.
Against the cumulative 2010 to 2013 target of £3.8 billion, by the end of 2011 a total of £2,040 million has been remitted by business operations. We remain confident of achieving this target. Our confidence is underpinned by the strong underlying free surplus generation of our businesses which, by the end of 2011, had generated a total of £3.7 billion against our 2010 to 2013 cumulative target of £6.5 billion.
Capital position, financing and liquidityThe Group has continued to maintain a strong capital position. At 31 December 2011, our IGD surplus is estimated at £4.0 billion (2010: £4.3 billion), with coverage a very strong 2.75 times the requirement. All of our subsidiaries maintain strong capital positions at the local regulatory level. As mentioned above, Jackson’s RBC ratio at the end of 2011 was 429 per cent.
In addition to our strong capital position, on a statutory (Pillar 1) basis the total credit default reserve for the UK shareholder annuity funds also contributes to protecting our capital position in excess of the IGD surplus. This credit default reserve, as at 31 December 2011, was £2.0 billion, notwithstanding the positive steps taken through 2011 to improve the credit quality of the £26.8 billion asset portfolio (measured on a statutory basis). This represents 33 per cent of the portfolio spread over swaps, compared with 43 per cent at 31 December 2010, when bond spreads over swap rates were much lower. Importantly, it is equivalent to a default rate of 7.6 per cent over the life of these investments, considerably higher than what has been experienced historically for the types of fixed income securities that we hold.
‘AllofourbusinessesarenowremittingconsiderableamountsofcashtoGroupandthisisinlinewithourstrategyasweseektomoveawayfromthehistoricalrelianceontheUK.’

23B
usin
ess rev
iew
Solvency II, which is currently anticipated to be effective from 1 January 2014, represents a major overhaul of the capital adequacy regime for European insurers. We are supportive in principle of the development of a more risk-based approach to capital, but we have concerns as to the potential consequences of some aspects of the Solvency II regime under consideration. With the continued delays to policy development, the final outcome of Solvency II remains uncertain. Despite this uncertainty, we continue to prepare for when the regime is eventually implemented.
Our financing and liquidity position remained strong throughout the year. In December of 2011 we redeemed ¤500 million of Tier 2 subordinated notes at their first call date. This redemption was effectively pre-financed via an issuance of US$550 million of Tier 1 subordinated notes in January of 2011, which raised £340 million net of transaction costs. The next call on external financing is in December 2014 on the US$750 million of Perpetual Subordinated Capital Securities. Our central cash resources amounted to £1.2 billion at the end of 2011, a strong position.
We continue to engage with rating agencies in order to provide insurance financial strength ratings for the Group’s insurance operations. Prudential’s senior debt is currently rated A+ by Standard & Poor’s, A2 by Moody’s and A by Fitch.
Shareholders’ funds In 2011, investment markets experienced considerable volatility and recorded drops in both the global equity market indices and in long-term interest rates. Despite these effects the Group’s EEV shareholders’ funds increased by 8 per cent during 2011 to £19.6 billion (2010: £18.2 billion). On a per share basis EEV at the end of 31 December 2011 stood at 771 pence, up from 715 pence at 31 December 2010. IFRS shareholders’ funds were also 14 per cent higher at £9.1 billion (2010: £8.0 billion).
The increases on both reporting bases are the result of the Group’s strong operating performance, offset by the relatively muted effect of the investment markets on the business, reflecting both the quality of the asset portfolio and the effectiveness of our proactive approach to risk management.
Nic NicandrouChief Financial Officer
‘Ourcentralcashresourcesamountedto£1.2billionattheendof2011,astrongposition.’

24
Prudential plc Annual Report 2011
Business review | Insurance operations | Asia
Accelerating
Asia
Asia looks set to remain a world economic powerhouse
as although lower external demand is impacting growth,
regional and domestic demand remains robust. Prudential is
well placed to participate in this growth as one of the
region’s leading providers of long-term savings and protection products.

Bu
sine
ss review
25
12m+life customers
365,000+agents

26
Prudential plc Annual Report 2011
Business review | Insurance operations | Asia | continued
Accelerating
Asia
Barry StoweChief Executive Prudential Corporation Asia
Notes1 Source: Published in the Asia
Economic Monitor December 2011.2 Excluding Australia and New Zealand3 IFRS operating profit for insurance
operations.
Market overviewThe European debt crisis is driving significant uncertainty in the global economy, however, Asia looks set to remain a world economic powerhouse as although lower external demand is impacting growth, regional and domestic demand remains robust.
The Asian Development Bank1 expects the Asian economies2 to grow by around 7 per cent in 2012, down from about 7.5 per cent in 2011 and 9 per cent in 2010, but still significantly higher than the rest of the world. Prudential is well placed to participate in this growth as one of the region’s leading providers of long-term savings and protection products.
Over the last decade Asia’s sustained economic growth has resulted in the rapid growth of the Asian middle class and now this is one of the fastest growing population groupings in the world. Although Asia currently has less than 25 per cent of the world’s middle class population, the Organisation for Economic Cooperation and Development (OECD) sees this figure doubling in the next 15 years. This middle class now have increasing disposable income, assets and lifestyles they want to protect and the recognition of a need to plan their own financial futures, independent of any state provisions.
Asia is also seeing a significant rise in the incidence of non-communicable diseases such as cancer, heart disease and diabetes as until comparatively recently people used to die from infectious diseases and malnutrition before ‘middle age’ ailments could arise. However, now ‘rich country diseases’ have very quickly become an issue in Asia. The World Health Organisation expects the number of deaths in South East Asia attributable to non-communicable diseases or critical illnesses to increase by 20 per cent over the next 10 years and the number of diabetics in China is expected to double by 2025. These critical illnesses not only have the potential to decimate individual families’ finances, they also impose a huge burden on the economy due to lost working time through sick leave and acquired skills exiting the work force. Raising awareness of lifestyle and related health issues together with the promotion of regular check ups, for example in relation to underwriting insurance policies, is becoming increasingly important as economies continue to develop.
Aligning to these developments, Asia is seeing a significant expansion of its savings and protection industry supported by governments and regulators. For example, regulators in China, Singapore and Malaysia have all recently stressed the importance of continuing to increase the rates of insurance penetration in their markets. Regulatory standards are also being raised with, for example, greater emphasis on ensuring that products are fit for purpose and that customers fully appreciate the features of their policies. Whereas compliance with the relevant regulations was always implicit in the way insurers ran their businesses, there is a trend towards a more explicit demonstration of this through documentation, audits and more formal management structures.
Prudential has a clear strategy in Asia focused on continuing to build high quality, multi-channel distribution that enables us to meet Asia’s fast growing savings and protection needs with a product portfolio centred on regular premium life insurance policies with protection riders.
Total IFRS operating pro�t3
2010
£536m
£709m
2011
+32%
New business pro�t*
2010
£902m
£1,076m
2011
+19%
* Excludes Japan which ceased writing new business in 2010.

27B
usin
ess rev
iew65%New business margin (% APE)
Despite the attractiveness of these markets, the competitive environment in Asia has remained fairly constant over the past few years as barriers to entry remain high due to the material capital requirements combined with a shortage of the strategic and executional expertise needed for securing licences, establishing brands, building quality distribution and launching and administering products. Distribution in the region remains dominated by traditional tied agency forces, but banks are becoming increasingly significant distributors. The industry’s growth has typically been constrained by the pace at which the insurers can build out distribution and assemble the infrastructures needed to administer and manage the increasing volumes of premiums generated by the business.
The size and significance of Asian insurers has increased in recent years. A consequence of this has been their increased presence in the capital markets. Today there is far more disclosure and analysis of the financial performance of the businesses than was the case a few years ago, but there is still some way to go before the industry has common reporting standards and accounting practices. Market leadership is still typically gauged by simple sales metrics although this is changing as metrics that emphasise value generated using a risk-based assessment of returns to policyholders and shareholders are becoming more prevalent. Regulators are now taking a broader view of market leadership too; leaders are expected to behave in an exemplary manner at all times, to drive improvements in all aspects of the business and to champion a variety of social initiatives.
Business performancePrudential has had operations in Asia since the 1920s, but began expanding its Asian business in 1994 as the Asian economic revolution was getting under way. Today Prudential is a leading international insurer in Asia with six of its 11 operations being market leaders in terms of new business scale. Prudential has established a high performance platform with multichannel distribution, a product portfolio based on regular premium savings policies with attached riders that provide additional protections and a well respected brand that is becoming increasingly well known as a champion of CSR initiatives including financial literacy.
Our strategy is focused on building high quality tied agency and complementary third party distribution channels, providing products that demonstrably meet customers’ savings and protection needs and strengthening and deepening customer relationships. It continues to be driven in a highly focused and disciplined way. While market outperformance in terms of new business growth is an indicator of success, Prudential prioritises quality of service, profitability, returns on capital and capital efficiency ahead of top-line growth.
Financial performance AER CER
2011£m
2010£m
Change%
2010£m
Change%
APE sales1 Asia (excluding India) 1,559 1,313 19 1,313 19 India 101 188 (46) 178 (43)
Total APE sales 1,660 1,501 11 1,491 11 NBP1 1,076 902 19 900 20 NBP margin (% APE)1 65% 60% 60 % Total IFRS operating profit* 709 536 32 533 33 Total EEV operating profit* 1,764 1,450 22 1,438 23
* Operating profit from long-term operations excluding Eastspring Investments, development costs and Asia regional head office costs.
Note1 Excludes Japan which ceased writing
new business in 2010.

28
Prudential plc Annual Report 2011
Business review | Insurance operations | Asia | continued
Accelerating
Asia
2013 Financial objectives
• Double 2009 value of IFRS life and asset management pre-tax operating profit
• Double 2009 value of new business profits
• Deliver £300 million of net cash remittance to the Group
At the country level the execution of the strategy varies depending on local conditions and objectives in each market. For example Prudential’s agency management competencies drive effective selection discipline and training designed to ‘fast start’ new agents and improve the skills and productivity of the more experienced ones in all markets. However, agency priorities are differentiated with the emphasis more on increasing scale in some markets, such as Indonesia and Vietnam and productivity improvements in more established markets such as Hong Kong and Singapore.
Prudential has a diverse range of successful bank distribution partnerships across the region that includes regional relationships with international banks such as Standard Chartered and local ones such as E.Sun in Taiwan. We are also successful in working with multiple partners in one market. Key drivers of this success are a long-term commitment to creating value for ourselves and our partners, expertise in developing, training and motivating bank sales teams and committed marketing support.
Prudential’s product mix is orientated around a core of regular premium policies with protection riders. The portfolio is regularly refreshed with new features and benefits that keep pace with evolving customer needs and also drive sales force activities.
Protecting the value of the in-force book is also a core priority for Prudential. Technology, such as iPad-based customer and agent services, drives operational efficiencies. Persistency drivers are actively monitored and achieving persistency targets forms part of compensation calculations for staff and agents. We have a robust claims platform with technical expertise and a disciplined approach to monitoring claims and re-pricing as necessary.
In September 2011 Prudential launched a major new CSR initiative in collaboration with Turner Broadcasting in the form of a fictional band called Cha-Ching, who through episodes running on the Cartoon Network across Asia and a fully interactive website, teach children about the basics of financial planning. Currently Cha-Ching is seen daily in over four million homes in seven markets (Hong Kong, the Philippines, Singapore, Indonesia, Vietnam, Thailand, and Malaysia). Cha-Ching.com has had over 18 million pages viewed in its first four months with an average duration of over nine minutes. The programme is being actively supported by regulators and local schools.
Prudential’s focus on customer service and delivery is reflected through the number of awards received by its operations, that include in China, ‘The Brand with Greatest Potential in the Insurance Industry’, in India, ‘Insurance Company of the Year’, in Indonesia, ‘Best Life Insurance Company’, ‘Best Islamic Insurance Company’, ‘Best Life Insurer in Achieving Total Customer Satisfaction’, and in Vietnam, a Labour Medal from the President’s Office, a first for a foreign insurance company in that country.
‘ Prudential has a diverse range of successful bank distribution partnerships across the region that includes regional relationships with international banks such as Standard Chartered and local ones such as E.Sun in Taiwan.’
www.prudentialcorporation-asia.comCha-Ching
In September 2011 Prudential launched a major new CSR initiative in collaboration with Turner Broadcasting in the form of a fictional band called Cha-Ching, who through episodes running on the Cartoon Network across Asia and a fully interactive website, teach children about the basics of financial planning.
4m homes in seven markets view daily
18m+ page views in first four months – average duration over nine minutes

29B
usin
ess rev
iew
Financial performancePrudential Asia remains well on track to deliver its 2013 new business profit, IFRS operating profit and cash remittance targets despite the more challenging external market conditions seen during 2011 where, for example, the MSCI Asia Pacific Excluding Japan Index was down 15 per cent and economic growth rates moderated.
New business sales APE for 2011 of £1,660 million was a record breaking high, representing an 11 per cent growth over 2010. Excluding India, where the market remains disrupted following the regulatory change in the third quarter 2010, APE growth was up 19 per cent. Prudential has now delivered 10 consecutive quarters where the APE is higher than the same quarter in the prior year and the average growth rate over this period was 19 per cent (including India). The fourth quarter APE at £513 million was also a record high, being up 18 per cent over prior year and 27 per cent higher than the third quarter of 2011.
Agency (excluding India) continues to be our largest distribution channel, generating 66 per cent of APE with a growth rate of 13 per cent over prior year. We ended the year with 228,000 agents (365,000 including India). However, although agency scale is important, management focus is also on further improving agent activity and productivity and we delivered a year-on-year increase in average active agents of 8 per cent, coupled with a 5 per cent increase in productivity.
Prudential’s bancassurance model generated 29 per cent of APE in 2011 with a growth rate of 37 per cent over prior year. New relationships that include our first full year of operations with UOB contributed 16 percentage points of this growth but our long-established relationships with other partners including SCB, Maybank and SingPost also performed well, collectively growing 22 per cent over the prior year and reflecting our ongoing successes in generating value for our partners.
The new business mix for 2011 reflects our ongoing focus on regular premium savings with protection. The proportion of regular premium business remains high at 91 per cent of APE and in line with prior years. The proportion of protection business in the APE mix increased to 30 per cent from 27 per cent in the previous year while the proportion of linked business reduced to 32 per cent compared to 41 per cent in prior year principally due to a lower contribution from India and a move towards non linked policies in that market.
New business profits of £1,076 million are 19 per cent higher than last year and average new business profit margins increased from 60 per cent to 65 per cent. The key driver for the increase in new business profit margin was a favourable change in country mix, in particular, a lower proportion of sales from India.
EEV profits from our in-force business of £688 million are up 25 per cent on prior year mainly driven by higher unwind as the scale of the book continues to grow. We continue to review and update our models to reflect evolving experience trends and for year end 2011 we made a number of changes that resulted in a net positive assumption change of £10 million. This included net positive changes, mainly on mortality and morbidity, totalling £150 million that were offset by a remodelling of withdrawal and lapse trends. The main contributor to this negative adjustment was Malaysia where in the second half of 2011 we decided to strengthen our assumptions to reflect our recent experience on our PruSaver product riders in Malaysia where policyholders that had accumulated gains on the savings component of their unit-linked policies realised some of these when markets were high while continuing to make their regular premium payments. This amounted to a negative charge to in-force profits of £108 million and remodelling of lapse trends in other markets such as India amounted to a net £32 million. Actual net experience variances for the year were positive £65 million reflecting better than expected performances. The assumption changes and variances remain very small in the context of total EEV shareholders’ funds of £8.5 billion.

30
Prudential plc Annual Report 2011
Business review | Insurance operations | Asia | continued
Accelerating
Asia
Operating profit on the IFRS basis grew strongly to £709 million, 32 per cent higher than last year. New business strain as a percentage of APE reduced during 2011 to 3.3 per cent compared to 3.7 per cent in 2010, driven by favourable product and country mix.
During 2011, shareholder-backed business policyholder liabilities have increased to £18.3 billion (2010: £17.7 billion). Our strong business momentum saw net insurance inflows of £1.8 billion (up 42 per cent on last year’s equivalent amount of £1.3 billion), which were offset by falls in market value. As expected outflows including those from partial withdrawals are at a lower run rate than 2010, both in absolute terms and when expressed as a percentage of opening policyholder liabilities.
Underlying free surplus generated by the life operations grew by 26 per cent to £410 million as the emergence of profits from the in-force book is increasing at a faster rate than the investment in new business. The cash generating capacity of the life business is clearly demonstrated by net remittances of £239 million to the Group during 2011. This includes £6 million as Prudential’s share of the first dividend ever to be paid by a life insurance company in India since the industry was nationalised in the 1950s.
Looking at individual countries:
China AER CER
2011£m
2010£m
Change%
2010£m
Change%
APE sales (Prudential’s 50 per cent share) 59 58 2 59 –
CITIC-Prudential remains one of the leading foreign joint ventures in a market that remains dominated by domestic players. We have true multi-channel distribution with a high quality agency force and a diverse range of national, regional and foreign bank partners covering many of the major cities and provinces in China’s more developed eastern regions. Sales for 2011 were £59 million, 2 per cent higher than the prior year.
During the second half of 2011 the market conditions became increasingly challenging with general concerns about the economy reflected by the MSCI China index being down 18 per cent for the year. It remains challenging to recruit and retain good agents in this competitive market. Sales through the bank channel were also impacted by new regulations prohibiting sales by non-bank staff.
Hong Kong AER CER
2011£m
2010£m
Change%
2010£m
Change%
APE sales 331 287 15 276 20
Prudential Hong Kong continues to deliver strong new business APE growth with an increase of 15 per cent over prior year to £331 million. Prudential remains the only leading player in Hong Kong to have a material presence in both the agency and bank distribution channels.
Agency APE grew at 9 per cent driven by increases in the number of active agents and increased case sizes as a new par product has proven to be particularly attractive. Bancassurance sales through Standard Chartered Bank (SCB) grew at a faster pace than agency at 29 per cent demonstrating the strength of this long-term relationship and the significance of the bank channel in Hong Kong. Bancassurance sales accounted for 41 per cent of the total (2010: 37 per cent).

31B
usin
ess rev
iewIndia AER CER
2011£m
2010£m
Change%
2010£m
Change%
APE sales (Prudential’s 26 per cent share) 101 188 (46) 178 (43)
The Indian market has been through a significant period of change during 2011, particularly following the regulatory driven refocus on savings and protection products, which came into effect on 1 September 2010. These factors led to a fall in sales from £188 million in 2010 to £101 million in 2011. Our joint venture with ICICI continues to be a leader in the private sector and the fourth quarter 2011 APE of £28 million was up 33 per cent on prior year, demonstrating some recovery in this business.
Indonesia AER CER
2011£m
2010£m
Change%
2010£m
Change%
APE sales 363 283 28 283 28
Indonesia is rapidly becoming one of Asia’s fastest growing and highest potential economies and Prudential continues to be a clear market leader in the Indonesian life insurance sector.
The strong new business APE growth at 28 per cent to £363 million has been primarily driven by the ongoing, rigorously managed, expansion of the agency force to 142,000 at the end of 2011. Active manpower increased by 18 per cent as our method of recruiting, training and licensing continues to be effective and we increased productivity by 7 per cent. Although still small relative to our agency force, the volume of new business from the bank channel increased by over 81 per cent (accounting for 5 per cent of the total) and has high potential for the future. We are the leader in Syariah products with a 54 per cent market share, contributing 15 per cent of new business sales.
The product mix remains predominantly regular premium unit-linked with protection riders and a new Early Stage Crisis Cover rider launched last year proved very popular with an attachment ratio of 35 per cent.
Korea AER CER
2011£m
2010£m
Change%
2010£m
Change%
APE sales 101 96 5 96 5
In Korea we continue to balance growth and profitability and do not compete in the low margin, capital-intensive guaranteed return segment of the market. Work undertaken over the past 24 months to refocus the business is now showing good results and our own agency force is generating the majority of new business. Sales in the fourth quarter, down 26 per cent on prior year, were impacted by equity market volatility depressing what had otherwise been a strong performance during the rest of the year. Nevertheless, sales in 2011 were 5 per cent higher at £101 million. Encouragingly new business profit margins increased from 31 per cent to 43 per cent reflecting the lower operating costs of the revamped business and an increased proportion of linked products in the mix.

32
Prudential plc Annual Report 2011
Business review | Insurance operations | Asia | continued
Accelerating
Asia
Malaysia AER CER
2011£m
2010£m
Change%
2010£m
Change%
APE sales 223 204 9 207 8
New business growth in Malaysia of 9 per cent to £223 million reflects the continued success of our agency channel and the development of our bank partnership channel which has performed very strongly. Prudential remains a strong market leader with agent recruits up 11 per cent on prior year and the total number of active agents up 9 per cent. We also had great success with bank distribution, up 164 per cent over prior year driven by increased activity with SCB and the launch of our Malaysian UOB partnership in April 2011.
Singapore AER CER
2011£m
2010£m
Change%
2010£m
Change%
APE sales 235 175 34 183 28
Singapore recorded an excellent year with APE of £235 million up 34 per cent on prior year. The principal driver of growth was the partnership channel where we have a cross section of partners enabling us to access a broad customer range. This was our first full year partnering with UOB, who achieved a 154 per cent sales growth. Sales through our other principal partners also grew strongly with Maybank up 67 per cent, SCB up 38 per cent and SingPost up 23 per cent. Partnership channel sales amounted to £97 million (2010: £51 million).
Agency numbers in Singapore remain in line with prior year but agency productivity continues to grow strongly.

33B
usin
ess rev
iewTaiwan AER CER
2011£m
2010£m
Change%
2010£m
Change%
APE sales 148 120 23 123 20
Taiwan is now mainly focused on bank distribution with partners E.Sun and SCB although it does have growing direct marketing and worksite marketing activities, up 21 per cent and 33 per cent respectively in 2011.
Sales for 2011 were 23 per cent higher at £148 million. In particular Taiwan’s fourth quarter sales in 2011 of £53 million, were double those in the equivalent quarter last year, following successful marketing campaigns with SCB.
Others – Philippines, Thailand and Vietnam
AER CER
2011£m
2010£m
Change%
2010£m
Change%
APE sales 99 90 10 86 15
In Vietnam the depreciation of the local currency relative to sterling has made a strong underlying performance where new business APE in local currency is up 14 per cent, less visible in sterling terms. That strong performance has been driven primarily by an increase in agent numbers (38,000) and higher productivity. In Thailand, where we remain a relatively small player with market share of 2 per cent, volumes of new business were 4 per cent higher despite the disruption caused in the fourth quarter by the floods. Encouragingly, sales in December 2011 were 57 per cent higher than prior year. Philippines delivered excellent growth of 30 per cent driven by successes with partnership distribution and increased agency activity and productivity.
JapanAs previously announced, PCA Life Japan ceased writing new business with effect from 15 February 2010. Sales for Japan in 2010 amounted to £7 million.
Barry StoweChief ExecutivePrudential Corporation Asia

34
Prudential plc Annual Report 2011
Business review | Insurance operations | United States
Strengthening
United States
The United States is the world’s largest retirement
savings market. Each year, many of the 78 million ‘baby
boomers’1 reach retirement age. Jackson’s strategy
focuses on capturing this opportunity while balancing
value, volume, capital efficiency, cash generation,
balance sheet strength and strict pricing discipline.

Bu
sine
ss review
35
2.9m+policies and contracts in force
10,000people reaching retirement age every day for next 20 years1
1 Source: US Census Bureau

36
Prudential plc Annual Report 2011
Market overviewThe United States is the world’s largest retirement savings market. Each year, many of the 78 million ‘baby boomers’1 reach retirement age, which will trigger a shift from savings accumulation to retirement income generation for more than US$10 trillion of accumulated wealth over the next decade2.
During 2011, the US equity markets continued to be challenging for the financial services industry, with higher volatility returning during the second half of the year, along with a decline of interest rates to historically low levels. Despite a very volatile year, the S&P 500 index recovered from the large falls in the third quarter to finish flat for the year. Implied volatility ended the year higher than that at year end 2010. Overall, rates on 10-year treasuries reached new historical lows during the second half of 2011, finishing the year below 2 per cent, while AA corporate spreads widened from year end 2010 levels.
In such an environment, Jackson’s asset and liability management continues to incorporate equity and interest rate exposure on an aggregate basis in order to ensure that total economic risk is hedged effectively within our established policy limits. Jackson continues to adapt its hedging programme to market conditions in order to ensure continued strong risk management. Despite historically low interest rates, volatile equity markets and the fluctuations in equity volatility experienced in 2011, Jackson’s hedging programme continued to perform well, mitigating the impact of the macroeconomic challenges and supporting our robust capital position. Jackson’s approach to pricing and hedging has always been to adopt a conservative stance and we believe that this positions Jackson well to outperform its peers during periods of market dislocation. Policyholder behaviour in 2011 continued to trend in line with both our pricing and reserving expectations.
The uncertain environment continues to provide an advantage to companies with good financial strength ratings and a track record of financial discipline. Companies that were hardest hit by the market disruptions over the last few years still have to work to regain market share as customers and distributors seek product providers that offer consistency, stability and financial strength. Jackson continues to benefit significantly from this flight to quality and heightened risk aversion.
Thanks to our financial stability and innovative products, we continue to enhance our reputation as a high-quality and reliable business partner, with sales increasing as more advisers have recognised the benefits of working with Jackson. A significant part of Jackson’s growth continues to come from an increase in its distribution penetration with sales through distributors who either did not previously sell Jackson’s products or simply did not sell variable annuities. In the second half of 2011, Jackson entered into another wirehouse distribution agreement further extending Jackson’s ability to reach all major wirehouse firms in the US on attractive terms.
Our strategy focuses on balancing value, volume, capital efficiency, balance sheet strength and strict pricing discipline for both variable and fixed annuities. Fixed annuity sales have slowed as a result of the current interest rate environment.
Business review | Insurance operations | United States | continued
Strengthening
United States
Mike WellsPresident and Chief Executive OfficerJackson National Life Insurance Company
Our strategy focuses on balancing value, volume, capital efficiency, balance sheet strength and strict pricing discipline for both variable and fixed annuities. Fixed annuity sales have slowed as a result of the current interest rate environment.
Notes1 Source: US Census Bureau2 Source: McKinsey

37B
usin
ess rev
iew
Business performanceContinue to drive positive net retail sales In 2011, Jackson achieved record APE retail sales of £1,251 million, an increase of 7 per cent over 2010. With the addition of modest institutional sales in 2011, total APE sales were £1,275 million, an increase of 10 per cent. Retail annuity net flows continued to benefit from increased sales and low levels of surrender activity, with an increase of 6 per cent from £8.0 billion in 2010 to £8.5 billion in 2011. Jackson’s strategy continues to focus on balancing value, volume and capital consumption for its various annuity products. Jackson’s product diversity allows the company to quickly adapt to changing market conditions and sustain appropriate sales levels in all phases of the business cycle. During the second half of 2011, sales slowed relative to the first half run rate due to proactive changes we made to our product offerings and shifts in the competitive environment. During the third quarter, Jackson implemented various product initiatives to enhance product diversity and margins and further optimise the balance between growth, capital and profitability.
Innovate around our key variable annuity productJackson continues to innovate its product offerings, implementing various changes in 2011 to manage profitability, to comply with revised regulations and enhance risk management flexibility. Jackson continues to actively monitor its product offerings to ensure the company retains the appropriate pricing levels in current market conditions.
Further enhance operational efficiency We continue to invest in our back office staffing and systems to provide world class customer service in an efficient and cost effective manner. In 2011, for the sixth consecutive year, Jackson was rated as a ‘World Class’ service provider by Service Quality Measurement Group. Jackson was able to provide this level of service in 2011 while processing record retail sales, and decreasing its ratio of statutory general expenses to average assets (one measure of efficiency) to 42 basis points, compared to the 2010 level of 44 basis points.
Financial performanceIFRS pre-tax operating profit was £694 million in 2011, down 17 per cent from £833 million in 2010. As previously indicated, this reduction was due to the expected accounting impact of accelerated deferred acquisition cost (DAC) amortisation of £232 million (2010: £11 million), which masked an underlying increase in earnings driven by higher fee income on separate account assets.
At 31 December 2011, Jackson had £37.8 billion in separate account assets, an increase of 21 per cent compared to £31.2 billion in 2010. The increase in separate account assets primarily reflects the impact of substantial positive net flows. This growth resulted in variable annuity separate account fee income of £680 million in 2011, up 34 per cent over the £506 million achieved in 2010.
Financial performance AER CER
2011£m
2010£m
Change%
2010£m
Change%
APE sales 1,275 1,164 10 1,121 14 NBP 815 761 7 734 11 NBP margin (% APE) 64% 65% 65% Total IFRS operating profit 694 833 (17) 803 (14)Total EEV operating profit 1,431 1,458 (2) 1,406 2
New business profit
2010
£761m£815m
2011
+7%
‘ Jackson’s product diversity allows the company to quickly adapt to changing market conditions and sustain appropriate sales levels in all phases of the business cycle.’
‘ In 2011, for the sixth consecutive year, Jackson was rated as a ‘World Class’ service provider by Service Quality Measurement Group.’

38
Prudential plc Annual Report 2011
Total spread income, including the expected return on shareholders’ assets, was £813 million in 2011, compared to £817 million in 2010. Excluding the expected return on shareholders’ assets, spread income was £730 million, an increase of £38 million over 2010. Spread income benefited by £113 million from swap transactions entered into to more closely match the overall asset and liability duration (2010: £108 million). This effect combined with the reduction in crediting rates has mitigated the downward pressures created by the lower interest rate environment.
Acquisition costs have increased in absolute terms compared to 2010 due to the growth in sales volumes. However, acquisition costs as a percentage of APE have decreased to 70 per cent for 2011, compared to 73 per cent for 2010.
The DAC amortisation charge increased in 2011 to £619 million (2010: £334 million). This comprises a core charge of £387 million (2010: £323 million) and an accelerated charge of £232 million (2010: £11 million). The higher core charge is in line with the increase in fee income and spread profits. The accelerated charge reflects the anticipated additional amortisation of £166 million relating to the reversal of the benefit received in 2008 from the mean reversion formula and a charge of £66 million caused by lower than assumed separate account returns.
Administration expenses increased to £412 million in 2011 compared to £344 million in 2010, with the increase due primarily to higher asset-based commissions paid on the larger 2011 separate account balance. These asset-based commissions paid upon policy anniversary dates are treated as an administration expense as opposed to a cost of acquisition and are offset by higher fees.
Jackson continues to actively manage its investment portfolio to mitigate investment risk. Jackson reported net realised gains on debt securities of £106 million in 2011 compared to £11 million in 2010. This comprises interest related realised gains during the period of £158 million (2010: £224 million), primarily due to sales of government and corporate debt, net recoveries on sales of previously impaired securities of £10 million (2010: losses of £89 million) and bond write-downs of £62 million (2010: £124 million). In addition to the net realised gains on debt securities described above, Jackson had write-downs of £28 million (2010: £12 million) on commercial mortgage loans. In 2011 and 2010, Jackson did not experience any defaults in its debt securities portfolio.
The net unrealised gain position has increased from £1,210 million at 31 December 2010 to £2,057 million at 31 December 2011 due primarily to the continued decline in the US Treasury rates. Gross unrealised losses decreased from £370 million at 31 December 2010 to £246 million at 31 December 2011.
Jackson delivered record APE retail sales of £1,251 million in 2011, representing a 7 per cent increase over 2010 (12 per cent at constant exchange rates). Jackson has achieved these sales levels, while maintaining its pricing discipline, as it continued to write new business at aggregate internal rates of return (IRR) in excess of 20 per cent.
In 2011, record variable annuity (VA) APE sales of £1,091 million were 15 per cent higher than in 2010, as Jackson continued to benefit from its customers’ and distributors’ flight to quality. Although we do not target volume or market share, these market conditions allowed Jackson’s ranking to remain at third in variable annuity sales in the US for 2011, while increasing its market share to 11.4 per cent from 10.7 per cent for the full year 20101. Jackson ranks first among VA providers for adviser loyalty. Jackson also earned the top ranking for satisfaction with external and internal wholesaler support among VA providers2.
Jackson’s strategy of proactively managing fixed annuity (FA) volumes resulted in APE sales of £47 million, 44 per cent lower than in 2010. Jackson ranked 14th in sales of traditional deferred fixed annuities through the third quarter of 2011, with a market share of 1.9 per cent, compared to eighth with a 3.4 per cent market share for the full year 20103.
Business review | Insurance operations | United States | continued
Strengthening
United States
2013 Financial objective
• Deliver £200 million of net cash remittance to the Group

39B
usin
ess rev
iew
Fixed index annuity (FIA) APE sales of £93 million in 2011 were down 15 per cent from 2010 as Jackson continued to focus its marketing efforts on higher margin VA products. Jackson ranked ninth in sales of fixed index annuities through the third quarter of 2011, with a market share of 4.6 per cent, down from sixth and a market share of 5.2 per cent in the full year 20104.
Jackson’s growth moderated during the latter part of the year, with full year total retail annuity net flows of £8.5 billion in 2011, an increase of 6 per cent compared to 2010. This modest increase was due to the impact of volatility in the S&P 500 experienced during the second half of the year, along with various product initiatives that were implemented during the third quarter. These initiatives were taken in order to optimise the balance between growth, capital and profitability. Retail annuity net flows continued to benefit from increased sales and continued low levels of surrender activity. Jackson remained the third largest seller of individual annuities in the United States through the third quarter of 2011, with a market share of 8.4 per cent, up from a market share of 8.0 per cent for the full year 20101.
EEV basis new business profit of £815 million was up 7 per cent on 2010, broadly in line with the 10 per cent increase in total APE sales. Total new business margin was 64 per cent, compared to 65 per cent achieved in 2010.
The variable annuity new business margin of 69 per cent in 2011 decreased from 72 per cent in 2010. The adverse effect on margin of the 142 bps decline in 10-year Treasury rates was largely mitigated by pricing actions taken over the past 15 months and a favourable shift in VA business mix. The fixed indexed annuity new business margin remained flat at 41 per cent in 2011. Lower assumed target spreads and future reinvestment yields have resulted in a decrease in the fixed annuity new business margin from 34 per cent to 29 per cent.
Total EEV basis operating profit for the long-term business in 2011 was £1,431 million, compared to £1,458 million in 2010. In-force profits were £81 million lower than 2010, partially offset by the £54 million increase in new business profit. The decline in in-force profits to £616 million (2010: £697 million) was driven largely by a lower contribution from the unwind of the discount on the opening embedded value, as a result of lower interest rates, and by lower positive operating experience variances than seen in 2010.
In 2011, Jackson invested £202 million of free surplus to write £1,275 million of new business APE (2010: £300 million and £1,164 million, respectively). The reduction in capital consumption year-on-year principally reflects the benefit of lower costs generated by economies of scale and favourable business mix in 2011. Jackson wrote a higher proportion of variable annuity business, which consumes lower levels of initial capital and has lower initial reserving requirements as a result of product changes effected at the end of 2010.
Jackson’s RBC level at the end of 2011 was 429 per cent, which compares to 483 per cent in 2010. Jackson continues to have in place a SSAP 865 permitted practice which has the effect of valuing the interest rate hedge programme at cost, thereby not recognising in the RBC ratio the significant mark to market gains on this programme that arose from the decline in interest rates during 2011. The RBC ratio would be 482 per cent (2010: 470 per cent) without the permitted practice. Jackson’s RBC ratio remains at an appropriate level despite net remittances of £322 million during 2011, a testament to both the strength of Jackson’s balance sheet and the effectiveness of the hedging programme.
Mike WellsPresident and Chief Executive OfficerJackson National Life Insurance Company
Notes1 Source: Morningstar Annuity
Research Center (MARC)2 Source: Cogent Research Advisor
BrandscapeTM 20113 Source: LIMRA4 Source: AnnuitySpecs5 Statement of Statutory Principle
No. 86 – Accounting for Derivative Instruments and Hedging, Income Generation, and Replication (Synthetic Asset) Transactions

40
Prudential plc Annual Report 2011
Business review | Insurance operations | United Kingdom
Focusing
United Kingdom

Bu
sine
ss review
41
The UK life & pensions market is characterised
by a concentration of wealth in the 45 to 74 age
group. Prudential UK is well positioned to help
these ‘baby boomers’ and subsequent generations
meet their financial needs.
7mcustomers

42
Prudential plc Annual Report 2011
Business review | Insurance operations | United Kingdom | continued
Market overviewThe UK life & pensions market, which is mature and the third largest in the world, is characterised by a concentration of wealth in the 45 to 74 age group and an ageing population, as the ‘baby boomers’ get older and progressively move into retirement.
Many of these individuals are insufficiently prepared financially for the prospect of spending longer in retirement and as a result, are considering extending their working lives while adopting a more flexible approach towards retirement. Prudential UK is well positioned to help the ‘baby boomers’ and subsequent generations meet their financial needs both as they approach and during retirement through its range of market leading with-profits and annuity products.
In 2011 Prudential UK continued to pursue a value over volume strategy, actively choosing to compete selectively in the retirement savings and income markets, and balancing the writing of new business with sustainable cash generation and capital preservation.
Business performanceStrategic focus on core strengthsPrudential UK has a strong individual annuity business, built on a robust pipeline of internal vestings from maturing individual and corporate pension policies. The internal vestings pipeline is supplemented by sales through intermediaries and strategic partnerships with third parties where Prudential is the recommended annuity provider for customers vesting their pensions at retirement.
Sales of individual annuities of APE £179 million were 13 per cent lower than in 2010 as Prudential UK continues proactively to manage the flow of external conventional new business to control capital consumption. The proportion of with-profits annuity sales continues to increase, from 22 per cent in 2010 to 25 per cent in 2011.
Internal vestings sales of APE £122 million, were 2 per cent lower than in 2010, when a change in the minimum retirement age from 50 to 55 resulted in a temporary increase in sales, and a reduction in expected vestings in 2011. Sales of external annuities of APE £57 million were down 30 per cent on the same period last year, mainly due to the end of a partnership agreement in the second half of 2010, consistent with Prudential UK’s value over volume strategy.
Focusing
United Kingdom
Rob DeveyChief ExecutivePrudential UK and Europe
In 2011 Prudential UK continued to pursue a value over volume strategy, actively choosing to compete selectively in the retirement savings and income markets, and balancing the writing of new business with sustainable cash generation and capital preservation.
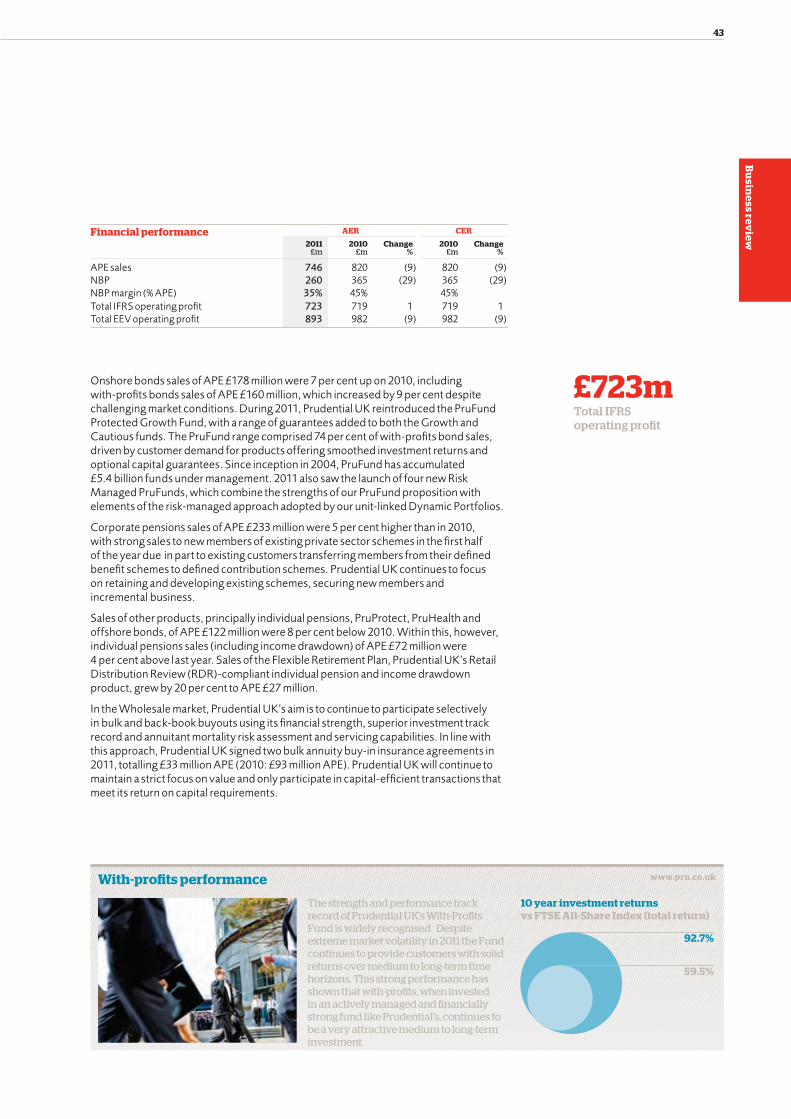
43B
usin
ess rev
iew
Onshore bonds sales of APE £178 million were 7 per cent up on 2010, including with-profits bonds sales of APE £160 million, which increased by 9 per cent despite challenging market conditions. During 2011, Prudential UK reintroduced the PruFund Protected Growth Fund, with a range of guarantees added to both the Growth and Cautious funds. The PruFund range comprised 74 per cent of with-profits bond sales, driven by customer demand for products offering smoothed investment returns and optional capital guarantees. Since inception in 2004, PruFund has accumulated £5.4 billion funds under management. 2011 also saw the launch of four new Risk Managed PruFunds, which combine the strengths of our PruFund proposition with elements of the risk-managed approach adopted by our unit-linked Dynamic Portfolios.
Corporate pensions sales of APE £233 million were 5 per cent higher than in 2010, with strong sales to new members of existing private sector schemes in the first half of the year due in part to existing customers transferring members from their defined benefit schemes to defined contribution schemes. Prudential UK continues to focus on retaining and developing existing schemes, securing new members and incremental business.
Sales of other products, principally individual pensions, PruProtect, PruHealth and offshore bonds, of APE £122 million were 8 per cent below 2010. Within this, however, individual pensions sales (including income drawdown) of APE £72 million were 4 per cent above last year. Sales of the Flexible Retirement Plan, Prudential UK’s Retail Distribution Review (RDR)-compliant individual pension and income drawdown product, grew by 20 per cent to APE £27 million.
In the Wholesale market, Prudential UK’s aim is to continue to participate selectively in bulk and back-book buyouts using its financial strength, superior investment track record and annuitant mortality risk assessment and servicing capabilities. In line with this approach, Prudential UK signed two bulk annuity buy-in insurance agreements in 2011, totalling £33 million APE (2010: £93 million APE). Prudential UK will continue to maintain a strict focus on value and only participate in capital-efficient transactions that meet its return on capital requirements.
Financial performance AER CER
2011£m
2010£m
Change%
2010£m
Change%
APE sales 746 820 (9) 820 (9)NBP 260 365 (29) 365 (29)NBP margin (% APE) 35% 45% 45% Total IFRS operating profit 723 719 1 719 1 Total EEV operating profit 893 982 (9) 982 (9)
www.pru.co.ukWith-profits performance
The strength and performance track record of Prudential UK’s With-Profits Fund is widely recognised. Despite extreme market volatility in 2011 the Fund continues to provide customers with solid returns over medium to long-term time horizons. This strong performance has shown that with-profits, when invested in an actively managed and financially strong fund like Prudential’s, continues to be a very attractive medium to long-term investment.
10 year investment returns vs FTSE All-Share Index (total return)
92.7%
59.5%
£723mTotal IFRS operating profit

44
Prudential plc Annual Report 2011
Business review | Insurance operations | United Kingdom | continued
With-profits performanceThe strength and performance track record of Prudential UK’s With-Profits Fund is widely recognised. Despite extreme market volatility in 2011 the Fund continues to provide customers with solid returns over medium to long-term time horizons. Over 10 years the Fund has delivered investment returns of 92.7 per cent, which compares favourably with other with-profits funds and the FTSE All-Share Index (total return) of 59.5 per cent over the same period. This strong medium to long-term performance has shown that with-profits, when invested in an actively managed and financially strong fund like Prudential’s, continues to be a very attractive medium to long-term investment, offering strong annualised returns compared with other investment options. Prudential’s with-profits customers benefit from the security offered by Prudential’s large inherited estate, with the free assets of the with-profits fund valued at approximately £6.1 billion at the year end, valued on the regulatory realistic basis.
Launch of direct advice serviceIn December 2011 Prudential UK launched a direct advice service, Prudential Financial Planning, to offer financial advice to existing customers who originally came to Prudential through its direct sales force. Starting with 25 advisers, the expectation is that this channel will grow further in 2012 to meet customer demand.
Enhancing customer servicePrudential UK’s focus on delivering improved levels of customer service was recognised again at the 2011 Financial Adviser Service Awards, where it achieved two 5-Star ratings for excellent service in the Life & Pensions and Investment categories.
Financial performanceTotal APE sales of £746 million were down 9 per cent on 2010, including bulk annuities of APE £33 million in 2011 and £93 million in 2010. EEV new business profit reduced by 29 per cent to £260 million and the total new business profit margin was 35 per cent for the period, 10 percentage points lower than in 2010. This reduction reflected the lower impact of bulk annuity transactions in 2011. The 2011 transactions generated EEV new business profit of £28 million (2010: £106 million) and IFRS operating profit of £23 million (2010: £63 million).
Retail sales of APE £712 million (excluding credit life and bulk annuities) were 2 per cent below last year, a reflection of Prudential’s strategy to allocate capital to opportunities that play to the core strengths of the business rather than pursuing top-line sales growth. Retail EEV new business profit at £231 million was 10 per cent below 2010 (£257 million). Retail new business margin reduced to 32 per cent, 3 per cent down on 2010, primarily driven by a changing business mix of lower shareholder-backed annuity sales and higher sales of corporate pensions.
Focusing
United Kingdom
2013 Financial objective
• Deliver £350 million of net cash remittance to the Group

45B
usin
ess rev
iew
IFRS total operating profit was 1 per cent above the previous year at £723 million. Of this total, £293 million (2010: £310 million) relates to with-profits and £390 million (2010: £363 million) to shareholder-backed business reflecting higher annuity profits. Commission received on Prudential-branded General Insurance products contributed £40 million to IFRS operating profit in 2011, £6 million lower than in 2010 as the book of business originally transferred to Churchill in 2004 is, as expected, decreasing.
EEV total operating profit of £893 million was down 9 per cent, mainly due to the fall in new business profits. Life in-force profits were higher at £593 million (2010: £571 million). The contribution from the unwind of the discount on the opening embedded value was lower by £65 million reflecting the 151 bps reduction in long-term gilt yields. The effect of this was offset by higher experience profits and £79 million favourable assumption change arising from the reduction in the long-term tax rate to 25 per cent.
Prudential UK continues to manage actively the retention of the in-force book. During 2011, the experience at an aggregate level was in line with long-term assumptions.
Prudential UK writes with-profits annuity, with-profits bond and with-profits corporate and individual pensions business in its Life Fund, with other products backed by shareholder capital. The weighted average post-tax IRR on the shareholder capital allocated to new business in the UK was in excess of 20 per cent and the undiscounted payback period on that new business was four years.
Underlying free surplus generated from the long-term in-force business in the UK amounted to £503 million (2010: £529 million). Of this total, £54 million (2010: £65 million) was reinvested in writing shareholder-backed business at attractive average IRRs.
At half year 2010 Prudential announced that the UK business had achieved its cost savings target of £195 million per annum. At the end of 2010, the business announced a number of cost saving initiatives to reduce costs by a further £75 million per annum by the end of 2013. The business has made good progress towards this objective and remains on track to deliver these savings by the end of 2013.
During 2011 Prudential UK remitted cash of £297 million to the Group, comprising £223 million from the annual with-profits transfer to shareholders and £74 million from the shareholder-backed business. The business aims to generate £350 million per annum of sustainable cash remittances by 2013, supported by the strength of the with-profits business and surpluses arising from the large book of shareholder-backed annuities, maintained into the future by the pipeline of maturing individual and corporate pensions.
Rob DeveyChief ExecutivePrudential UK and Europe

Prudential plc Annual Report 2011
46 Business review | Asset management
Optimising
AssetManagement
M&G is the UK and European fund manager of the Prudential Group with responsibility
for investments on behalf of both internal and external clients.
£201bnfunds under management – M&G

Bu
sine
ss review
47
£50.3bnfunds under management – Eastspring Investments
Eastspring, Prudential’s asset management business in Asia, manages
investments for Asian third-party retail and institutional clients in addition to
investments of Prudential’s Asian, UK and US life companies.

48
Prudential plc Annual Report 2011
Market overviewM&G is the UK and European fund manager of the Prudential Group with responsibility for investments on behalf of both internal and external clients. M&G is an investment-led business whose aim is to generate superior long-term returns for its third-party investors and the internal funds of the Prudential Group.
This is achieved by creating an environment that is attractive to investment talent. Our investment performance has been robust in the face of ongoing macroeconomic instability. Over the three years to 31 December 2011, 25 retail funds representing approximately 76 per cent of retail funds under management (FUM), delivered first and second quartile investment performance. The performance of our actively managed external institutional fixed income mandates also remains very strong with all of the mandates meeting or outperforming their benchmarks over the three years to 31 December 2011.
In the retail market, M&G’s aim is to operate a single fund range and to diversify the distribution base by accessing a wide variety of channels and geographies. In recent years, this has resulted in significantly increased sales of UK-based funds in European and other international markets.
In the institutional marketplace, M&G’s approach centres on leveraging capabilities developed primarily for the Prudential internal funds to create higher margin external business opportunities. This has allowed M&G to offer third-party clients, such as pension funds, an innovative range of specialist fixed income and related strategies, including private debt opportunities in leveraged finance, and infrastructure investment.
Market contextFollowing considerable uncertainty over sovereign debts on both sides of the Atlantic and concerns over the lack of global economic growth, the third quarter of 2011 saw the FTSE 100 suffer its worst quarter for nine years, falling 14 per cent. Markets rebounded over the fourth quarter with the index rising by 9 per cent. M&G’s FUM has proved resilient in the face of the market volatility experienced over the second half of the year. From a FUM level of £194.4 billion at the end of 30 September 2011, M&G’s FUM increased to £201.3 billion by 31 December 2011. This included external funds under management, representing 46 per cent of total FUM, of £91.9 billion (quarter to 30 September 2011: £87.3 billion).
Optimising
Asset managementM&G
Business review | Asset management | M&G
M&G continues to execute against its strategy and deliver strong performance for both clients and its shareholder, the Prudential Group. M&G’s 2011 financial performance continues the momentum from the strong full year results recorded in 2010.
Michael McLintockChief ExecutiveM&G

49B
usin
ess rev
iew
Business performanceIn 2011, M&G attracted gross inflows of £26.0 billion and net inflows of £4.4 billion, with retail funds contributing the lion’s share of the net position with £3.9 billion. After two successive years of extremely high net sales, it was our expectation that net fund flows would revert to somewhat lower levels in 2011 especially in light of the economic headwinds experienced over the year. However, while net sales are indeed lower, they remain strong. Our ability to maintain this sales performance over the year again demonstrates our strength and depth across all the main asset classes and distribution channels.
Gross new business wins for the fourth quarter to 31 December 2011 totalled £6.2 billion, compared to £6.4 billion for the previous quarter. Outflows totalled £4.4 billion (quarter to 30 September 2011: £6.7 billion), resulting in net inflows for the quarter of £1.8 billion. This was a positive turnaround on the total net outflow of £288 million experienced in the quarter to 30 September 2011.
M&G AER CER
2011£m
2010£m
Change%
2010£m
Change%
Gross investment inflows 25,981 26,372 (1) 26,372 (1)Net investment flows Retail business 3,895 7,416 (47) 7,416 (47) Institutional business 490 1,689 (71) 1,689 (71)
Total 4,385 9,105 (52) 9,105 (52)Revenue 702 612 15 612 15 Other income 4 3 33 3 33 Staff costs (285) (263) (8) (263) (8)Other costs (141) (123) (15) (123) (15)
Underlying profit before performance-related fees 280 229 22 229 22 Performance-related fees 21 17 24 17 24
Operating profit from asset management operations 301 246 22 246 22 Operating profit from Prudential Capital 56 38 47 38 47
Total IFRS operating profit 357 284 26 284 26
Funds under management 201bn 198bn 2 198bn 2
£201bnFunds under management
Total IFRS operating profit
2010
£284m
£357m
2011
+26%
www.mandg.co.ukAwards
RetailOur expertise and strong performance have been recognised by independent authorities within the industry and we have won an array of awards for our funds and as a group. These include M&G being awarded the prestigious 2011 Old Broad Street Research Outstanding Investment House Award for the second year running.
InstitutionalThe strength of M&G’s performance in the institutional market is evidenced by the award of Fixed Income Manager of the Year 2011 at the Financial News Awards for Excellence in Institutional Asset Management.

50
Prudential plc Annual Report 2011
RetailAs announced previously, volatile market conditions and reduced investor confidence led to a considerable worsening of the sales environment in the overall market during the second half of 2011, in both Europe and the UK, and particularly for equity products.
The European funds industry suffered net outflows of ¤69.3 billion in 2011 – only the second time in the past decade (net outflows were ¤298 billion in 2008)1. This result masks a significant divide between the first half of the year, which saw net inflows of ¤96 billion, and the second half with net outflows of around ¤165 billion. It also masks a divide between markets where investors have been the greatest net buyers (notably the UK) and where they have been in significant net outflow (Continental Europe) as 21 out of 33 markets suffered full year outflows.
Despite this challenging flow environment, M&G’s Retail business generated positive net sales in the final quarter. In our core UK market, gross inflows of £2.7 billion were generated over the quarter with corresponding net inflows of over £1.1 billion. Over the full year to 31 December 2011, M&G’s UK Retail business has received gross inflows of £11.2 billion, representing an increase of 10 per cent on 2010 levels. At the net level, the UK Retail business recorded inflows of £4.3 billion, a modest fall of only 3 per cent on 2010 results.
M&G’s UK Retail business has been number one for gross and net retail sales over 13 consecutive quarters based on data to 31 December 20112. The strength of our UK distribution channels has helped to offset the difficult conditions encountered in mainland Europe, where risk-averse investors have been withdrawing money from funds. M&G’s European Retail distribution business did make up lost ground over the fourth quarter with positive net inflows being received. M&G continued to expand its distribution capabilities, registering its OEIC fund range in Finland, Norway and Denmark in the fourth quarter. By retail net sales, M&G ranked ninth out of 48 cross-border groups in 20113. M&G-managed retail FUM sourced outside of the UK now stand at £8.2 billion, the equivalent of almost one-fifth of the total retail external funds managed by M&G.
In product terms, retail fund flows across the industry, affected by the eurozone crisis, have seen muted demand for equity products in aggregate as bond products continue to remain the default choice for risk-averse investors. However, flows into some of M&G’s flagship equity products have remained robust in spite of stock market conditions, with investor appetite for our global equity and emerging market products continuing. M&G’s Property Portfolio Fund has also benefited from a consistent level of net sales over the full year. It is a core pillar of M&G’s business performance that it is able to benefit from changing investor preferences as a result of its diversified product offering. No fewer than 14 of M&G’s retail funds, representing all of the main asset classes, achieved net sales in excess of £50 million over the full year.
Optimising Asset managementM&G
Business review | Asset management | M&G | continued
Notes1 Source: Lipper FMI (February 2012,
data as at December 2011). FundFlash. Thomson Reuters
2 Source: Fundscape. (Q4 issue, February 2012). The Pridham Report. Fundscape LLP
3 Source: Lipper FMI. (February 2012, data as at December 2011). SalesWatch. Thomson Reuters
‘ Sales performance over the year again demonstrates our strength and depth across all the main asset classes and distribution channels.’

51B
usin
ess rev
iew
InstitutionalM&G’s Institutional business had a strong fourth quarter pushing the business into positive territory for the full year with net inflows of £490 million. The outflows experienced over the year included, as expected, a number of segregated clients withdrawing money from public debt funds due to asset allocation decisions. Additionally, outflows also reflected the contractual return of £696 million in capital to investors in mature closed-ended debt structures.
M&G’s Institutional business continues to benefit from its innovative approach to investment. The Alternative Credit team has raised £200 million of capital for a UK social housing fund, the first fund of its kind to capitalise on the income-generating nature of the sector. This is the second instance of M&G creating a fund to assist organisations starved of bank loans since the onset of the credit crisis. The M&G UK Companies Financing Fund (UKCFF), M&G’s loan facility for UK quoted companies, has now made total commitments of £710 million across eight loans, five of which were extended over 2011. Total commitments of £1.4 billion have been raised since its launch in 2009.
The M&G Secured Property Income Fund combines the expertise of both M&G’s Fixed Income Team, with its extensive credit research capability, and PRUPIM, the real estate fund management arm of the M&G Group and its core capability in real estate investment analysis. The Fund, which offers pension fund investors an alternative means of managing their inflation liabilities, passed through a net asset value (NAV) of £1 billion during the final quarter. £350 million in total was added to the NAV in 2011. Fund performance is strong, investor interest remains high and we continue to work hard at maintaining a suitable pipeline of acquisition opportunities.
AwardsOur expertise and strong performance have been recognised by independent authorities within the industry and we have won an array of awards for our funds and as a group. These include M&G being awarded the prestigious 2011 Old Broad Street Research Outstanding Investment House Award for the second year running. The strength of M&G’s performance in the institutional market is evidenced by the award of Fixed Income Manager of the Year 2011 at the Financial News Awards for Excellence in Institutional Asset Management. Indeed, M&G’s flagship institutional UK corporate bond fund, with over £3.5 billion of FUM at 31 December 2011, has outperformed its benchmark1 by 2.0 per cent2 a year since the onset of the credit crisis in December 2008.
52
Prudential plc Annual Report 2011
Business review | Asset management | M&G | continued
Financial performanceM&G continues to execute against its strategy and deliver strong performance for both clients and its shareholder, the Prudential Group. M&G’s 2011 financial performance continues the momentum from the strong full year results recorded in 2010. Revenues have continued to improve steadily, rising £90 million (15 per cent), while costs remain under control, increasing by only £40 million (10 per cent). As a result, operating profits grew by 22 per cent during the year to a record level of £301 million, surpassing the previous best of £246 million set in 2010. M&G’s operating margin increased to 40 per cent (year to 31 December 2010: 37 per cent)1. M&G’s very strong profit performance reflects in particular the transformation in net sales experienced by the business since the beginning of 2009, particularly from the Retail business. We continue to seek operational efficiencies across the M&G Group to support the scalability of our business model. This cost discipline, combined with the rise in FUM has generated a cost/income ratio2 of 60 per cent for the full year, an improvement on the 2010 result of 63 per cent.
Given the ongoing strength of its financial performance, M&G continues to provide capital-efficient profits and cash generation for the Group. This is in addition to the strong investment returns generated on the internally managed funds. M&G remits a substantial proportion of its post-tax profits to the shareholder, which in 2011 amounted to £213 million (2010: £150 million).
Prudential Capital
Prudential Capital manages the Group’s balance sheet for profit by leveraging Prudential’s market position. This business has three strategic objectives: to provide professional treasury services to the Prudential Group; to operate a first-class wholesale and capital markets interface; and to realise profitable opportunities within a tightly controlled risk framework. Prudential Capital generates revenue by providing bridging finance, managing investments and operating a securities lending and cash management business for the Prudential Group and its clients.
The business has consolidated its position in a period of difficult and volatile markets, focusing on liquidity across the Prudential Group, management of the existing asset portfolio and conservative levels of new investment. Development of new product and infrastructure has continued, helping to maintain the dynamism and flexibility necessary to identify and realise opportunities for profit within acceptable risk parameters. Prudential Capital is committed to working closely with other business units across the Prudential Group to exploit opportunities and increase value creation for Prudential as a whole.
Prudential Capital has a diversified earnings base derived from its portfolio of secured loans, debt investments and the provision of wholesale markets services. Despite the continued difficult market conditions, IFRS operating profit was £56 million in 2011 (2010: £38 million). In 2011 a total of £67 million was remitted to the Group.
Michael McLintockChief ExecutiveM&G
Optimising Asset managementM&G
‘ M&G continues to provide capital- efficient profits and cash generation for the Group.’
Notes1 Excluding performance-related fees.2 Excluding performance-related fees
and carried interest on private equity investments.

53B
usin
ess rev
iewBusiness review | Asset management | Eastspring Investments
Market overviewPrudential’s asset management business in Asia manages investments for Asian third-party retail and institutional clients in addition to investments of Prudential’s Asian, UK and US life companies.
Markets remained challenging in 2011, with overall net outflows seen in the Asia (excluding Japan) onshore funds market. Equity markets struggled to gain traction driven by poor investor sentiment in the face of weak macroeconomic signals. Japan was also impacted by the natural disaster which occurred earlier in the year.
Eastspring InvestmentsIn November 2011, Prudential announced that its Asian Fund Management operations would be rebranded Eastspring Investments. The new brand, which was officially launched in February 2012, will enable the business to establish a cohesive regional presence thereby penetrating the offshore segment more effectively. It also supports distribution to new markets beyond Asia.
Business performanceTotal funds under management of £50.3 billion were down 3 per cent over the same period last year. The effect of positive net flows from the Asian Life Business and third party retail and institutional clients, was offset by the combined effect of outflows in the low margin money market funds (MMF) and the negative market movements particularly in the second half of the year.
Net inflows from third parties (excluding MMF) were £633 million compared to net inflows of £1,837 million during 2010. This is attributed to lower bond fund returns and to Japan, where significant inflows from the launch of the Asia Oceania equity fund in 2010 were not repeated in 2011. Clearly the environment in Japan was not conducive to product launches in the first half of 2011. This situation was partially mitigated by net inflows from corporate and institutional clients in Korea, together with new institutional mandates.
Financial performanceIFRS profits of £80 million are a record and were up 11 per cent on prior year as a result of higher average funds under management and disciplined management of costs.
Optimising
Asset managementEastspring Investments
Eastspring Investments AER CER
2011£m
2010£m
Change%
2010£m
Change%
Gross investment inflows (excluding MMF) 7,824 11,973 (35) 11,959 (35)Net investment inflows (excluding MMF) 633 1,837 (66) 1,882 (66)Money Market Funds (MMF) net outflows (512) (2,052) (75) (1,954) (74)Funds under management 50.3bn 51.9bn (3) 51.3bn (2)Total IFRS operating profit 80 72 11 73 10
£50.3bnFunds under management
Total IFRS operating profit
2010
£72m£80m
2011
+11%
www.eastspringinvestments.comEastspring Investments
In November 2011, Prudential announced that its Asian Fund Management operations would be rebranded Eastspring Investments.
The new brand, which was officially launched in February 2012, will enable the business to establish a cohesive regional presence thereby penetrating the offshore segment more effectively. It also supports distribution to new markets beyond Asia.

54
Prudential plc Annual Report 2011
PPM America AER CER
2011£m
2010£m
Change%
2010£m
Change%
Total IFRS operating profit 4 10 (60) 10 (60)
Market overview PPM America (PPMA) manages assets for Prudential’s US, UK and Asian affiliates. PPMA also provides other affiliated and unaffiliated institutional clients with investment services including collateralised debt obligations (CDOs), private equity funds, institutional accounts, and mutual funds. PPMA’s strategy is focused on managing existing assets effectively, maximising the benefits derived from synergies with our international asset management affiliates, and leveraging investment management capabilities across the Prudential Group. PPMA also pursues third-party mandates on an opportunistic basis.
Financial performanceIFRS operating profit in 2011 was £4 million, compared to £10 million in 2010, due to the non-recurrence of the 2010 performance related fees.
At 31 December 2011, funds under management of £55 billion were as follows:
AER
2011 2010
US£bn
UK£bn
Asia£bn
Total£bn
US£bn
UK£bn
Asia£bn
Total£bn
Insurance 32 15 – 47 31 15 – 46 Unitised 1 1 5 7 1 1 5 7 CDOs 1 – – 1 1 – – 1
Total funds under management 34 16 5 55 33 16 5 54
Curian AER CER
2011£m
2010£m
Change%
2010£m
Change%
Gross investment flows 1,684 1,361 24 1,312 28 Revenue 51 39 31 37 38 Costs (45) (38) 18 (36) 25 Total IFRS operating profit 6 1 500 1 500 Total funds under management 4.7bn 3.5bn 34 3.5bn 34
Market overviewCurian Capital, Jackson’s registered investment adviser, provides innovative fee-based managed accounts and investment products to advisers through a sophisticated technology platform. Curian expands Jackson’s access to advisers while also complementing Jackson’s core annuity product lines with Curian’s retail asset management products.
Optimising
Asset managementUnited States
Business review | Asset management | United States

55B
usin
ess rev
iew
Business performanceAt 31 December 2011, Curian had total assets under management of £4.7 billion, compared to £3.5 billion at the end of 2010. Curian generated record deposits of £1,684 million in 2011, up 24 per cent over 2010. Curian continues to benefit from its prior investment platform expansions and its significant expansion in 2011 of the firm’s wholesaling team and new distribution territories.
Financial performanceCurian reported an IFRS basis operating profit of £6 million in 2011 compared to £1 million in 2010.
US Broker-dealerNational Planning Holdings, Inc
AER CER
2011£m
2010£m
Change%
2010£m
Change%
Revenue 491 449 9 433 13 Costs (477) (438) 9 (422) 13
Total IFRS operating profit 14 11 27 10 40
Market overviewNational Planning Holdings, Inc. (NPH) is Jackson’s affiliated independent broker-dealer network. The business is comprised of four broker-dealer firms, including INVEST Financial Corporation, Investment Centers of America, National Planning Corporation, and SII Investments.
NPH continues to grow the business and revenue per representative. By utilising high-quality, state-of-the-art technology, Jackson provides NPH’s advisers with the tools they need to operate their practices more efficiently. At the same time, through its relationship with NPH, Jackson continues to benefit from an important retail distribution outlet, as well as receive valuable insights into the needs of financial advisers and their clients.
Financial performanceNPH generated revenue of £491 million in 2011, up from £449 million in 2010, on gross product sales of £8.6 billion. The network continues to achieve profitable results, with 2011 IFRS operating profit of £14 million, a 27 per cent increase from £11 million in 2010. At 31 December 2011, the NPH network had 3,636 registered advisers, up from 3,461 at year end 2010.

56
Prudential plc Annual Report 2011
Financial review
Business review | Financial review
Results summary
International Financial Reporting Standards (IFRS) basis results* Statutory IFRS basis results
2011 2010
Profit after tax attributable to equity holders of the Company £1,490m £1,431mBasic earnings per share 58.8p 56.7pShareholders’ equity, excluding non-controlling interests £9.1bn £8.0bn
Supplementary IFRS basis information 2011 £m 2010 £m
Operating profit based on longer-term investment returns* 2,070 1,941 Short-term fluctuations in investment returns on shareholder-backed business (148) (123) Shareholders’ share of actuarial and other gains and losses on defined benefit pension schemes 21 (10) Costs of terminated AIA transaction – (377) Gain on dilution of Group holdings – 30
Profit before tax attributable to shareholders 1,943 1,461
Operating earnings per share* (reflecting operating profit based on longer-term investment returns after related tax and non-controlling interests)(i) 63.9p 62.0p
European Embedded Value (EEV) Basis Results* 2011 £m 2010 £m
Asian operations 1,839 1,518 US operations 1,455 1,480 UK operations: UK insurance operations 893 982 M&G 357 284 Other income and expenditure (536) (494) RPI to CPI inflation measure change on defined benefit pension schemes 45 – Restructuring and Solvency II implementation costs (75) (74)
Operating profit based on longer-term investment returns* 3,978 3,696 Short-term fluctuations in investment returns (907) (30) Mark to market value movements on core borrowings (14) (164) Shareholders' share of actuarial and other gains and losses on defined benefit pension schemes 23 (11) Effect of changes in economic assumptions (158) (10) Costs of terminated AIA transaction – (377) Gain on dilution of Group holdings – 3
Profit before tax (including actual investment returns) 2,922 3,107
Operating earnings per share* (reflecting operating profit based on longer-term investment returns after related tax and non-controlling interests)(i) 115.7p 106.9p
Shareholders' equity, excluding non-controlling interests 19.6bn 18.2bn
2011 2010
Dividends per share declared and paid in reporting period 25.19p 20.17pDividends per share relating to reporting period 25.19p 23.85pFunds under management £351bn £340bnInsurance Groups Directive capital surplus (as adjusted)* £4.0bn £4.3bn
*See basis of preparation on following page.
Note(i) Operating earnings per share reflects operating profit based on longer-term investment returns after related tax and non-controlling interests but
excludes in 2010 an exceptional tax credit of £158 million which primarily relates to the impact of a settlement agreed with the UK tax authorities.

57B
usin
ess rev
iew
* Basis of preparation
Results basesThe basis of preparation of the statutory IFRS basis results and supplementary IFRS basis information is consistent with that applied for the full year 2010 results and financial statements. The EEV basis results have been prepared in accordance with the European Embedded Value Principles issued by the CFO Forum of European Insurance Companies in May 2004 and expanded by the Additional Guidance on EEV disclosures published in October 2005. Life insurance products are, by their nature, long-term and the profit on this business is generated over a significant number of years. Accounting under IFRS alone does not, in Prudential’s opinion, fully reflect the value of future profit streams. Prudential considers that embedded value reporting provides investors with a measure of the future profit streams of the Group’s in-force long-term businesses and is a valuable supplement to statutory accounts. There has been no change to the basis of presentation of the EEV results from the 2010 results and financial statements.
Exchange translation – Actual Exchange Rate (AER) and Constant Exchange Rate (CER)The comparative results have been prepared using previously reported exchange rates (AER basis) except where otherwise stated. In particular results on a constant exchange rate (CER) basis are shown for the analysis of IFRS and EEV operating profit based on longer-term investment returns.
Operating profit based on longer-term investment returnsConsistent with previous reporting practice, the Group provides supplementary analysis of IFRS profit before tax attributable to shareholders and analyses its EEV basis results, so as to distinguish operating profit based on longer-term investment returns from other elements of total profit. On both the IFRS and EEV bases, operating earnings per share are calculated using operating profits based on longer-term investment returns, after related tax and non-controlling interests. These profits exclude short-term fluctuations in investment returns and the shareholders’ share of actuarial and other gains and losses on defined benefit pension schemes. The operating profit based on longer-term investment returns for 2010 also excludes the costs associated with the terminated AIA transaction and the gain arising upon the dilution of the Group’s holding in PruHealth.
Under the EEV basis, where additional profit and loss effects arise, operating profit based on longer-term investment returns also excludes the mark to market value movements on core borrowings and the effect of changes in economic assumptions. After adjusting for related tax and non-controlling interests, the amounts excluded from operating profit based on longer- term investment returns are included in the calculation of basic earnings per share, based on total profit attributable to the company’s equity holders.
Insurance Groups Directive capital surplus (as adjusted) The surpluses shown for 2011, which is estimated, and 2010 are before allowing for the final dividends for 2011 and 2010 respectively.
Accounting policy change to be applied in 2012In October 2010, the Emerging Issues Task Force of the US Financial Accounting Standards Board issued new guidance on accounting for Deferred Acquisition Costs (DAC), effective for reporting periods commencing after 15 December 2011. These proposals restrict the acquisition costs that can be deferred to future periods to those costs that are directly incremental to acquiring a new contract. Although Prudential does not report in accordance with US GAAP, under the accounting policies applied in accordance with IFRS 4, US GAAP is used to measure the insurance assets and liabilities of Jackson and certain of Prudential’s Asian operations. Prudential has therefore chosen, as an accounting improvement, to adopt from 1 January 2012 the new US GAAP DAC proposals for these entities. This change will first be applied in the 2012 half year financial report and there is no impact on the results included in this announcement for 2011 and 2010. However, on adoption of the new policy, which will be applied retrospectively, the 2011 IFRS operating profit based on longer-term investment returns will be altered from £2,070 million to £2,027 million, profit before tax attributable to shareholders will be altered from £1,943 million to £1,828 million, and shareholders’ funds at 31 December 2011 will be altered from £9,117 million to £8,564 million. Further details, together with the equivalent impacts on the 2010 results and shareholders’ funds, can be found in note III(a) of the Additional unaudited financial information. The change of policy has no effect on the regulatory capital position of the Group or on the overall EEV basis results, other than the presentational analysis of EEV shareholders’ funds between the component representing IFRS basis shareholders’ equity and the component representing additional shareholders’ retained profit recognised on the EEV basis.
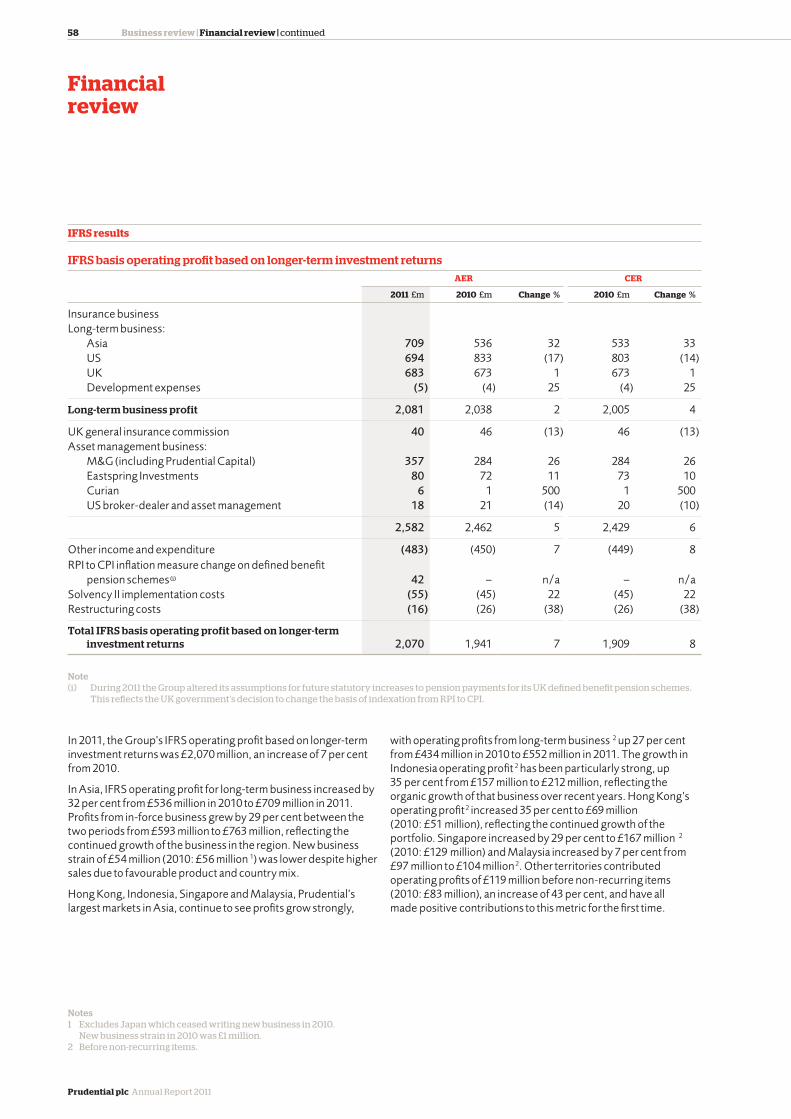
58
Prudential plc Annual Report 2011
Business review | Financial review | continued
Financial review
IFRS results
IFRS basis operating profit based on longer-term investment returnsAER CER
2011 £m 2010 £m Change % 2010 £m Change %
Insurance business Long-term business: Asia 709 536 32 533 33 US 694 833 (17) 803 (14) UK 683 673 1 673 1 Development expenses (5) (4) 25 (4) 25
Long-term business profit 2,081 2,038 2 2,005 4
UK general insurance commission 40 46 (13) 46 (13)Asset management business: M&G (including Prudential Capital) 357 284 26 284 26 Eastspring Investments 80 72 11 73 10 Curian 6 1 500 1 500 US broker-dealer and asset management 18 21 (14) 20 (10)
2,582 2,462 5 2,429 6
Other income and expenditure (483) (450) 7 (449) 8 RPI to CPI inflation measure change on defined benefit
pension schemes(i) 42 – n/a – n/aSolvency II implementation costs (55) (45) 22 (45) 22 Restructuring costs (16) (26) (38) (26) (38)
Total IFRS basis operating profit based on longer-term investment returns 2,070 1,941 7 1,909 8
Note(i) During 2011 the Group altered its assumptions for future statutory increases to pension payments for its UK defined benefit pension schemes.
This reflects the UK government’s decision to change the basis of indexation from RPI to CPI.
In 2011, the Group’s IFRS operating profit based on longer-term investment returns was £2,070 million, an increase of 7 per cent from 2010.
In Asia, IFRS operating profit for long-term business increased by 32 per cent from £536 million in 2010 to £709 million in 2011. Profits from in-force business grew by 29 per cent between the two periods from £593 million to £763 million, reflecting the continued growth of the business in the region. New business strain of £54 million (2010: £56 million1) was lower despite higher sales due to favourable product and country mix.
Hong Kong, Indonesia, Singapore and Malaysia, Prudential’s largest markets in Asia, continue to see profits grow strongly,
with operating profits from long-term business2 up 27 per cent from £434 million in 2010 to £552 million in 2011. The growth in Indonesia operating profit2 has been particularly strong, up 35 per cent from £157 million to £212 million, reflecting the organic growth of that business over recent years. Hong Kong’s operating profit2 increased 35 per cent to £69 million (2010: £51 million), reflecting the continued growth of the portfolio. Singapore increased by 29 per cent to £167 million2 (2010: £129 million) and Malaysia increased by 7 per cent from £97 million to £104 million2. Other territories contributed operating profits of £119 million before non-recurring items (2010: £83 million), an increase of 43 per cent, and have all made positive contributions to this metric for the first time.
Notes1 Excludes Japan which ceased writing new business in 2010.
New business strain in 2010 was £1 million.2 Before non-recurring items.

59B
usin
ess rev
iew
The US long-term business operating profit decreased by 17 per cent from £833 million in 2010 to £694 million in 2011 and is, after charging £232 million (2010: £11 million) of accelerated DAC amortisation, as anticipated. This charge, which is not expected to recur, arises as a result of market movements and their interaction with the mean reversion methodology. It has the effect of masking an underlying improvement in the earnings of the US business, reflecting higher fees from variable annuity business following the growth of separate account balances in recent years. The benefit of higher fees is partially offset by administration expenses which have also increased broadly in line with the scale of business.
In Prudential’s UK business, total IFRS operating profit was slightly higher than the prior year at £723 million (2010: £719 million), with long-term business generating £683 million (2010: £673 million). The year-on-year comparisons are distorted by the effect of bulk annuity transactions which are infrequent and vary in size between financial periods. Our approach to these is very selective and we will only write this business when it meets our strict profitability criteria. Two such transactions were completed in 2011 contributing £23 million to IFRS profits, compared to one transaction in 2010 with an IFRS profit contribution of £63 million.
Life business in the UK (excluding the impact of the bulk annuity transactions), contributed operating profits of £660 million in 2011, 8 per cent higher than the £610 million generated in 2010. The contribution from with-profits business was lower at £293 million (2010: £310 million). Operating profit from non-profit annuity and other life business was £67 million higher at £367 million, reflecting higher annuity profits. Profit from UK general insurance commission were lower at £40 million (2010: £46 million) following the expected decline of the in-force policy numbers as the business matures.
Total operating profit for 2011 from M&G and Prudential Capital was £357 million, an increase of 26 per cent from £284 million in 2010. This performance is driven by improved revenues reflecting the strong net inflows received in recent periods, with funds under management of £201 billion at 31 December 2011, compared with £198 billion at 31 December 2010, together with a continued focus on cost discipline which saw a three percentage point reduction in the cost/income ratio.
Eastspring Investments reported operating profits of £80 million, an increase of 11 per cent from the £72 million recognised in 2010. This improvement is driven both by increased operating revenues from higher average funds under management during 2011 and continued cost discipline resulting in a two percentage point improvement in the cost/income ratio.
The £33 million increase in the charge for other income and expenditure from £450 million in 2010 to £483 million in 2011 primarily reflects an increase in interest payable on core structural borrowings, following additional debt raised in January 2011 to repay debt in December 2011.
Following the UK government’s decision to change the basis of indexation from RPI to CPI, the Group altered its assumptions for future statutory increases to pension payments for its UK-defined benefit pension schemes. This resulted in a one-off credit to operating profit of £42 million in 2011 and will not recur going forward.
A total of £55 million of Solvency II implementation costs were incurred in 2011 (2010: £45 million) as we move closer to the implementation of the new regime.

60
Prudential plc Annual Report 2011
Business review | Financial review | continued
Financial review
IFRS basis results – analysis of long-term insurance business pre-tax IFRS operating profit based on longer-term investment returns by driver
AER AER CER
2011 2010(iii) 2010
Operating profit
£m
Averageliability
£mMargin(i)
bps
Operating profit
£m
Averageliability
£mMargin(i)
bps
Operating profit
£m
Averageliability
£mMargin(i)
bps
Spread income 1,065 57,417 185 1,013 53,894 188 988 53,056 186 Fee income 870 68,298 127 688 56,822 121 669 56,303 119 With-profits 331 93,056 36 342 89,693 38 342 90,060 38 Insurance margin 736 592 582 Margin on revenues 1,425 1,212 1,211 Expenses Acquisition costs (ii) (1,783) 3,681 (48)% (1,645) 3,492 (47)% (1,612) 3,439 (47)% Administration expenses (1,043) 125,715 (83) (924) 110,716 (83) (910) 109,359 (83) DAC adjustments 280 518 498 Expected return on shareholder assets 200 242 237
Operating profit based on longer-term investment returns 2,081 2,038 2,005
Notes(i) Margin represents the operating return earned in the period as a proportion of the relevant class of policyholder liabilities excluding
unallocated surplus. For UK and Asia, opening and closing policyholder liabilities have been used to derive an average balance for the period, as this is seen as a good proxy for average balances throughout the year. Given the volatility in the year, the calculation of average liabilities has been refined for Jackson in two ways: (i) the average for both the general and separate account balances is now derived from month-end balances throughout the year as opposed to opening and closing balances only, and (ii) liabilities held in the general account for variable annuity living and death guaranteed benefits have been excluded from the calculation of the average, as no spread income is earned on these balances. The 2010 balances for Jackson have been amended for consistency, albeit impacts are minimal.
(ii) Acquisition cost ratio represents shareholder acquisition costs as a percentage of total APE (including £7 million of sales for Japan in 2010). (iii) Following the reduction in 2010 of the Group’s interest in the PruHealth and PruProtect businesses from 50 per cent to 25 per cent, the profits of
these businesses have been shown as a single line in the insurance margin line consistent with associate accounting principles. 2010 has been amended in light of this change.
Spread income has increased by £52 million to £1,065 million, an increase of 5 per cent, broadly in line with the growth in average liabilities. The margin secured has fallen from 188 bps in 2010 to 185 bps in 2011, principally due to 2010 benefiting from higher bulk annuity sales. Spread income in the US has increased by £38 million, with 2011 continuing to benefit from transactions to more closely match asset and liability duration, as well as lower amounts credited to policyholders on fixed annuities.
Fee income has increased by £182 million to £870 million, driven by the 20 per cent increase in the Group’s average unit-linked liabilities, which principally reflects the £7.0 billion net inflows into Jackson separate’s accounts in 2011. The fee income margin has increased from 121 bps to 127 bps in 2011 as Jackson contributes a greater proportion to the total, where the fee margin is higher.
Insurance margin has increased by £144 million to £736 million in 2011, driven in part by the continuing growth in the in-force book in Asia, which has a relatively high proportion of risk-based products.
Margin on revenues principally comprises amounts deducted from premiums to cover acquisition costs and administration expenses. The margin has increased by £213 million from £1,212 million in 2010 to £1,425 million in 2011, with Asia accounting for £181 million of the increase. This principally reflects higher premium income.
Acquisition costs have increased in absolute terms to £1,783 million, broadly in line with the increased new business sales. Expressed as a percentage of new business APE, 2011 has seen a marginal increase from 47 per cent in 2010 to 48 per cent in 2011.
Administration expenses have also increased to £1,043 million, reflecting the growth of the business in the year, while the margin remains constant at 83 bps.
DAC adjustments are a net benefit to the result as the deferral of current years acquisition costs exceed the amortisation of previously deferred costs. This net benefit decreased by £238 million in 2011 relative to last year, primarily as a result of the acceleration of DAC amortisation in the US of £232 million. This represents the reversal of the benefit received in 2008 from the mean reversion formula, together with the impact of lower than assumed separate account returns in the year.
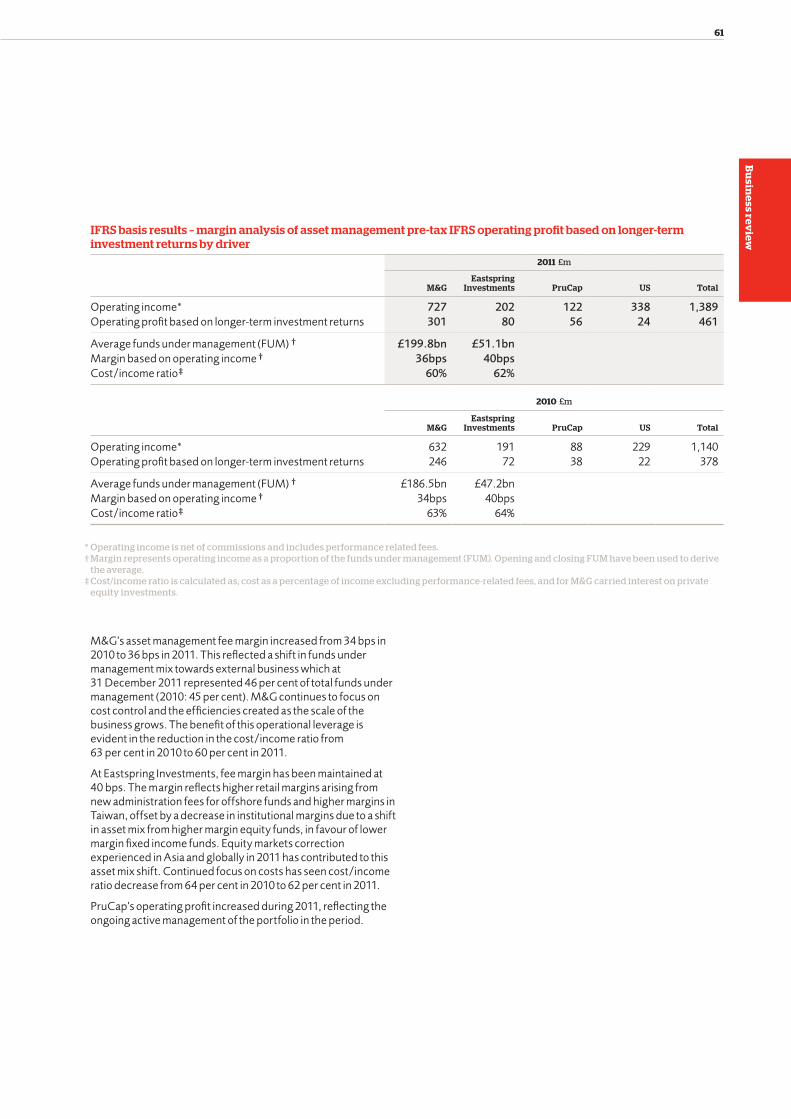
61B
usin
ess rev
iew
IFRS basis results – margin analysis of asset management pre-tax IFRS operating profit based on longer-term investment returns by driver
2011 £m
M&GEastspring
Investments PruCap US Total
Operating income* 727 202 122 338 1,389 Operating profit based on longer-term investment returns 301 80 56 24 461
Average funds under management (FUM)† £199.8bn £51.1bnMargin based on operating income† 36bps 40bpsCost/income ratio‡ 60% 62%
2010 £m
M&GEastspring
Investments PruCap US Total
Operating income* 632 191 88 229 1,140 Operating profit based on longer-term investment returns 246 72 38 22 378
Average funds under management (FUM)† £186.5bn £47.2bnMargin based on operating income† 34bps 40bpsCost/income ratio‡ 63% 64%
* Operating income is net of commissions and includes performance related fees.† Margin represents operating income as a proportion of the funds under management (FUM). Opening and closing FUM have been used to derive the average.
‡ Cost/income ratio is calculated as, cost as a percentage of income excluding performance-related fees, and for M&G carried interest on private equity investments.
M&G’s asset management fee margin increased from 34 bps in 2010 to 36 bps in 2011. This reflected a shift in funds under management mix towards external business which at 31 December 2011 represented 46 per cent of total funds under management (2010: 45 per cent). M&G continues to focus on cost control and the efficiencies created as the scale of the business grows. The benefit of this operational leverage is evident in the reduction in the cost/income ratio from 63 per cent in 2010 to 60 per cent in 2011.
At Eastspring Investments, fee margin has been maintained at 40 bps. The margin reflects higher retail margins arising from new administration fees for offshore funds and higher margins in Taiwan, offset by a decrease in institutional margins due to a shift in asset mix from higher margin equity funds, in favour of lower margin fixed income funds. Equity markets correction experienced in Asia and globally in 2011 has contributed to this asset mix shift. Continued focus on costs has seen cost/income ratio decrease from 64 per cent in 2010 to 62 per cent in 2011.
PruCap’s operating profit increased during 2011, reflecting the ongoing active management of the portfolio in the period.

62
Prudential plc Annual Report 2011
Business review | Financial review | continued
Financial review
IFRS basis profit after tax AER
2011 £m 2010 £m
Operating profit based on longer-term investment returns 2,070 1,941 Short-term fluctuations in investment returns: Insurance operations (28) (148) Other operations (120) 25
(148) (123)Shareholders’ share of actuarial and other gains and losses on defined benefit pension schemes 21 (10)Costs of terminated AIA transaction – (377)Gain on dilution of Group holdings – 30
Profit before tax attributable to shareholders 1,943 1,461 Tax charge attributable to shareholders’ profit(i) (449) (25)Non-controlling interests (4) (5)
Profit for the year attributable to equity holders of the Company 1,490 1,431
Note(i) In 2010, tax charge attributable to shareholders’ profit includes a credit of £158 million which primarily relates to the impact of a settlement
agreed with the UK authorities.
IFRS basis profit after tax The total profit before tax attributable to shareholders was £1,943 million in 2011, compared with £1,461 million in 2010. The improvement reflects the increase in operating profit based on longer-term investment returns, and the fact that in 2010 the profit was reduced by the terminated AIA transaction costs of £377 million.
In calculating the IFRS operating profit, we use longer-term investment return assumptions rather than actual investment returns arising in the year. The difference between actual investment returns recorded in the income statement and longer-term returns is shown in the analysis of profits as short-term fluctuations in investment returns.
IFRS short-term fluctuations in investment returnsShort-term fluctuations in investment returns for our insurance operations comprise negative £92 million for Asia, negative £95 million for US operations and positive £159 million in the UK.
The negative short-term fluctuations of £92 million for our Asian operations in part reflects equity market falls in Taiwan and a partial reversal of unrealised gains recognised in prior years on the Group’s investment in China Life Insurance Company of Taiwan.
Negative fluctuations of £95 million arising in our US operation comprise negative £183 million from short-term fluctuations offset by positive £88 million relating to Jackson’s debt securities portfolio. These gains arise as a result of a high level of realised investment gains in 2011, following management’s credit risk reduction programme.
The positive short-term fluctuations of £159 million for our UK operations principally reflect net valuation gains arising in the period on fixed income assets backing the capital of the shareholder-backed annuity business.
Short-term fluctuations for other operations were negative £120 million representing unrealised losses on investments, principally on centrally held swaps to manage foreign exchange and certain macroeconomic exposures of the Group.
Shareholders’ share of actuarial and other gains and losses on defined benefit pension schemesThe shareholders’ share of actuarial and other gains and losses on defined benefit pension schemes of positive £21 million mainly reflects favourable experience in the year in respect of the Scottish Amicable scheme combined with the impact of assumption changes, primarily from lower inflation and lower expected salary increases, applied to the liabilities of both the Scottish Amicable and M&G schemes.
Effective tax rates The effective rate of tax on operating profit based on longer-term investment returns was 22 per cent (2010: 11 per cent). For 2010, adjusting the reported tax rate to exclude the exceptional tax credit of £158 million which primarily relates to the impact of a settlement agreed with the UK tax authorities, the underlying tax rate operating profit was 19 per cent.
The effective rate of tax at the total IFRS profit level was 23 per cent (2010: 2 per cent). Adjusting the rate in 2010 to exclude the exceptional tax credit of £158 million gives an underlying tax rate at the total IFRS profit level of 13 per cent. In both 2011 and 2010, we have benefited from a reduction in the main UK corporate tax rate from 28 per cent to 26.5 per cent. In 2010, and to a lesser extent in 2011, we also benefited from utilising carried forward tax losses for which no deferred tax asset was previously established.

63B
usin
ess rev
iewEEV results
EEV basis operating profit based on longer-term investment returnsAER CER
2011 £m 2010 £m Change % 2010 £m Change %
Insurance business Asia 1,764 1,450 22 1,438 23 US 1,431 1,458 (2) 1,406 2 UK 853 936 (9) 936 (9) Development expenses (5) (4) 25 (4) 25
Long-term business profit 4,043 3,840 5 3,776 7
UK general insurance commission 40 46 (13) 46 (13)Asset management business: M&G 357 284 26 284 26 Eastspring Investments 80 72 11 73 10 Curian 6 1 500 1 500 US broker-dealer and asset management 18 21 (14) 20 (10)
4,544 4,264 7 4,200 8
Other income and expenditure (536) (494) 9 (493) 9 RPI to CPI inflation measure change on defined benefit
pension schemes(i) 45 – n/a – n/aSolvency II implementation costs (56) (46) 22 (46) 22 Restructuring costs (19) (28) (32) (28) (32)
Total EEV basis operating profit 3,978 3,696 8 3,633 9
Note(i) During the first half of 2011 the Group altered its assumptions for future statutory increases to pension payments for its UK defined benefit
pension schemes. This reflects the UK government’s decision to change the basis of indexation from RPI to CPI.
In 2011, Prudential Group’s total EEV basis operating profit based on longer-term investment returns was £3,978 million, an increase of 8 per cent from 2010.
Long-term business profit generated by the Group increased by 5 per cent to £4,043 million. This profit comprises:
• New business profit of £2,151 million (2010: £2,028 million1);
• In-force profit of £1,897 million (2010: £1,817 million); and
• Negative £5 million for other items including development expenses (2010: negative £5 million).
New business profit at £2,151 million was 6 per cent higher than last year, which compares with the equivalent increase in new business APE of 6 per cent. Group new business margin was unchanged at 58 per cent as pricing actions coupled with favourable changes in business mix fully mitigated the downward pressure on margins from the significant declines in long-term interest rates.
Strong new business margins continue to be recorded across the Group. The margin for the Asian business increased from 60 per cent to 65 per cent driven by a shift in country mix and the ongoing high mix of health and protection business. The reduction in the US new business profit margin was curtailed to a one percentage point decrease to 64 per cent despite the significant falls in 10-year Treasury yields, as management took strong pricing and business actions. The UK new business margin was lower than last year at 35 per cent (2010: 45 per cent). Comparisons here are distorted by our selective approach to bulk annuity sales. The retail margin (which excludes credit life and bulk annuities) fell from 35 per cent in 2010 to 32 per cent in 2011 due to lower sales of the higher margin annuity business.
Note1 Excludes Japan which ceased writing new business in 2010.

64
Prudential plc Annual Report 2011
Business review | Financial review | continued
Financial review
EEV basis operating profit based on longer-term investment returns continuedThe contribution to operating profit from life in-force business increased by 4 per cent to £1,897 million. In-force profit comprises £1,447 million from the unwind of the discount on the opening embedded value and other expected returns (2010: £1,492 million) and £450 million from the effect of operating assumption changes, experience variances and other items (2010: £325 million). The unwind of discount and other expected returns is £45 million lower than 2010 with the growth in the business, being offset by the effect on this profit measure of lower interest rates. We estimate that the fall in long-term interest rates during 2011 adversely impacted the unwind and other expected returns by around £200 million.
In 2011, at £688 million (2010: £549 million), Asia was the highest contributor to the Group’s life in-force profit for the first time. In Asia we have seen improvements in overall experience and operating assumption changes, with a positive impact for the year of £75 million (2010: negative £24 million). This positive trend primarily reflects favourable mortality and morbidity experience partially offset by the effect of strengthening partial withdrawals lapse assumptions in Malaysia following the review undertaken in 2011.
US life in-force profit was lower at £616 million (2010: £697 million). Jackson’s focused approach to managing the in-force portfolio coupled with the benefits of scale, have enabled the business to outperform its expected return in both years, albeit to a lower extent in 2011. The contribution to profits
from experience and operating assumption changes totalled £183 million in 2011, compared to £246 million last year. Within these amounts, swap transactions undertaken to more closely match the overall asset and liability duration in 2010 and 2011, contributed to spread gains of £152 million (2010: £158 million).
UK life in-force profit was also higher at £593 million (2010: £571 million). The reduction in 15-year gilt yields reduced the contribution from the unwind of the discount on the opening embedded value and return on net worth relative to last year by £65 million to £485 million. Disciplined management of the in-force book has enabled the business to outperform the expected returns, generating profits from experience and operating assumption changes of £108 million (2010: £21 million). Included in both years are the beneficial effects on future profits arising from the reduction in UK corporation taxes enacted in both years; in 2011 this amounted to £79 million, while in 2010 this amounted to £41 million.
Operating profit from the asset management business and other non-long-term businesses increased to £501 million, up 18 per cent from £424 million in 2010.
Other income and expenditure totalled a net expense of £536 million compared with £494 million in 2010. The £42 million increase principally reflects the higher interest payable on core structural borrowings on the US$550 million Tier 1 subordinated note issued in January, the proceeds of which were used to redeem the ¤500 million Tier 2 notes in December 2011.

65B
usin
ess rev
iew
EEV basis profit after tax and non-controlling interestsAER
2011 £m 2010 £m
EEV basis operating profit based on longer-term investment returns 3,978 3,696 Short-term fluctuations in investment returns: Insurance operations (787) (55) Other operations (120) 25 (907) (30)Mark to market value movements on core borrowings (14) (164)Shareholders’ share of actuarial and other gains and losses on defined benefit pension schemes 23 (11)Effect of changes in economic assumptions (158) (10)Costs of terminated AIA transaction – (377)Gain on dilution of Group holdings – 3
Profit before tax 2,922 3,107 Tax charge attributable to shareholders’ profit(i) (776) (530)Non-controlling interests (4) (4)
Profit after non-controlling interests 2,142 2,573
Note(i) In 2010 tax charge attributable to shareholders’ profit includes a credit of £158 million which primarily relates to the impact of a settlement
agreed with the UK tax authorities.
EEV basis profit after tax and non-controlling interestsShort-term fluctuations in investment returns EEV operating profit is based on longer-term investment return assumptions rather than actual investment returns achieved. Short-term fluctuations in investment returns represent the difference between the actual investment return and those assumed in arriving at the reported operating profit.
Short-term fluctuations in investment returns for insurance operations of negative £787 million comprise negative £155 million for Asia, negative £491 million for our US operations and negative £141 million in the UK.
For our Asian business, short-term fluctuations of negative £155 million (2010: positive £287 million) reflects the effect on future fee income of the lower than assumed equity market returns in 2011, partially offset by valuation gains on bonds backing shareholder capital arising from the fall in interest rates.
In our US business, short-term fluctuations in investment returns were negative £491 million (2010: negative £678 million), principally reflecting the effect on fee income of the actual separate account return in 2011 of negative 0.5 per cent being lower than the longer term expected level of 5.4 per cent on projected future fees.
For our UK business, the short-term fluctuations in investment returns were negative £141 million (2010: positive £336 million). This reflects the actual return on the with-profits fund in 2011 of 3.2 per cent being lower than the longer-term assumed rate of 5.1 per cent, partly offset by higher than expected returns on the bonds backing the capital of the shareholder annuity business, following the fall in yields in 2011.
Mark to market movement on core borrowingsThe mark to market movement on core borrowings was a negative £14 million in 2011, lower than the negative £164 million reported in 2010 when there was a more significant narrowing of credit spreads as the 2008 market dislocation unwound.

66
Prudential plc Annual Report 2011
Business review | Financial review | continued
Financial review
EEV basis profit after tax and non-controlling interests continuedShareholders’ share of actuarial and other gains and losses on defined benefit pension schemesThe shareholders’ share of actuarial and other gains and losses on defined benefit pension schemes on the EEV basis comprises the IFRS charge attributable to shareholders, and the shareholders’ share of movements in the scheme assets and liabilities attributable to the PAC with-profits fund. On the EEV basis there was a gain of £23 million (2010: charge of £11 million) mainly reflecting favourable experience in the year in respect of the Scottish Amicable scheme combined with the impact of assumption changes, primarily from lower inflation and expected salary increases, applied to the liabilities of both the Scottish Amicable and M&G schemes.
Effect of changes in economic assumptionsThe effect of changes in economic assumptions of negative £158 million, comprises positive £279 million for Asia, negative £144 million for the US and negative £293 million for the UK.
The Asia and UK effect principally reflects the effect on economic profits of the reduction in long-term yields and the associated decrease in the risk discount rates. This effect is positive in Asia given the predominance of health and protection while in the UK this effect is negative as the majority of future profits relate to with-profits business.
In our US business, the reduction in long-term yields and the associated decrease in risk discount rates has a positive effect on future fixed annuity spread profits which broadly offset the negative effect on future variable annuity fee income. The overall negative effect of £144 million principally reflects the prudent decision taken by Jackson to increase the allowance for future credit defaults following the widening of credit spreads in the second half of 2011.
Effective tax ratesThe effective rate of tax on operating profit based on longer-term investment returns was 26 per cent (2010: 23 per cent). For 2010, adjusting the reported tax rate to exclude the exceptional tax credit of £158 million which primarily relates to the impact of a settlement agreed with the UK tax authorities, the underlying tax rate on 2010 operating profits was 27 per cent.
The effective rate of tax at the total EEV profit level was 27 per cent (2010: 17 per cent). Adjusting the rate in 2010 to exclude the exceptional tax credit of £158 million gives an underlying tax rate at the total profit level of 22 per cent.
At the operating profit level, the effective underlying tax rate is lower in 2011 than in 2010, reflecting reduced UK corporation tax rates. At the total profit level, the underlying effective tax rate is higher than in 2010 reflecting the absence of favourable one-off adjustments in the US tax rate, partly offset by reduced UK corporation tax rates.

67B
usin
ess rev
iewEarnings and dividends per share
Earnings per share (EPS)2011
pence
2010Excluding
exceptionaltax credit(i)
pence
2010Including
exceptionaltax credit
pence
Basic EPS based on operating profit after tax and non-controlling interests
IFRS 63.9 62.0 68.3 EEV 115.7 106.9 113.2
Basic EPS based on total profit after non-controlling interests
IFRS 58.8 56.7 EEV 84.6 101.9
Note(i) The exceptional tax credit in 2010 relates to a £158 million credit
which primarily relates to the impact of a settlement agreed with the UK tax authorities.
Dividend per share Interim dividends are recorded in the period in which they are paid. Final dividends are recorded in the period in which they are approved by shareholders. The final dividend for the year ended 31 December 2010 of 17.24 pence per ordinary share was paid to eligible shareholders on 26 May 2011 and the 2011 interim dividend of 7.95 pence per ordinary share was paid to eligible shareholders on 22 September 2011.
In light of the continued strong performance of the business and the Group’s focus on a growing dividend, the Board has recommended a final dividend of 17.24 pence per share (2010: 17.24 pence), giving a full 2011 dividend of 25.19 pence (2010: 23.85 pence), representing an increase of 5.6 per cent over 2010.
The 2011 final dividend of 17.24 pence per ordinary share will be paid on 24 May 2012 in sterling to shareholders on the principal register and the Irish branch register at 6.00 pm BST on Friday, 30 March 2012 (the ‘Record Date’), and in Hong Kong dollars to shareholders on the Hong Kong branch register at 4.30 pm Hong Kong time on the Record Date (HK Shareholders). Holders of US American Depositary Receipts (US Shareholders) will be paid their dividends in US dollars on or about five days after the payment date of the dividend to shareholders on the principal register. The final dividend will be paid on or about 31 May 2012 in Singapore dollars to shareholders with shares standing to the credit of their securities accounts with The Central Depository (Pte.) Limited (CDP) at 5.00 pm Singapore time on the Record Date (SG Shareholders). The dividend payable to the HK Shareholders will be translated using the exchange rate quoted by the WM Company at the close of business on 12 March 2012. The exchange rate at which the dividend payable to the SG Shareholders will be translated into SG$ will be determined by CDP. The dividend will distribute an estimated £439 million of shareholders’ funds.
In line with 2010, shareholders on the principal register and Irish branch register will be able to participate in a Dividend Reinvestment Plan.
The Board will maintain its focus on delivering a growing dividend, which will continue to be determined after taking into account our Group’s financial flexibility and our assessment of opportunities to generate attractive returns by investing in specific areas of the business. The Board believes that in the medium-term a dividend cover of around two times is appropriate.
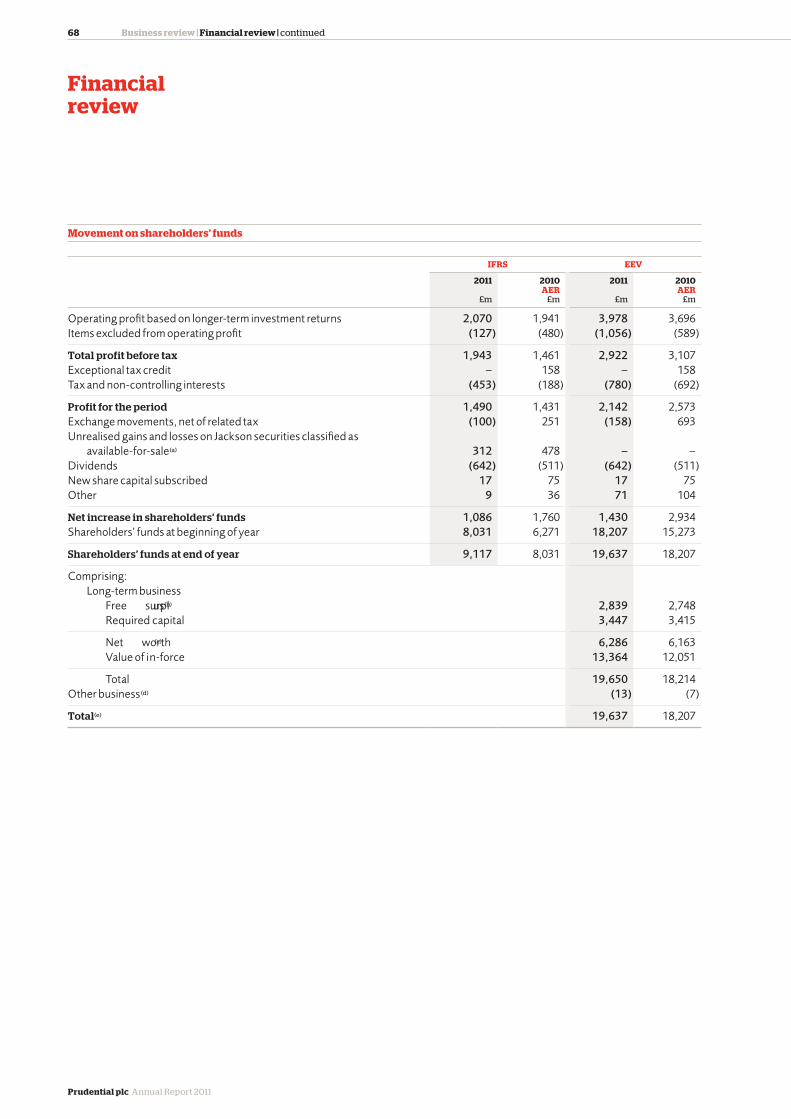
68
Prudential plc Annual Report 2011
Business review | Financial review | continued
Financial review
Movement on shareholders’ funds
IFRS EEV
2011
£m
2010AER£m
2011
£m
2010AER£m
Operating profit based on longer-term investment returns 2,070 1,941 3,978 3,696 Items excluded from operating profit (127) (480) (1,056) (589)
Total profit before tax 1,943 1,461 2,922 3,107 Exceptional tax credit – 158 – 158 Tax and non-controlling interests (453) (188) (780) (692)
Profit for the period 1,490 1,431 2,142 2,573 Exchange movements, net of related tax (100) 251 (158) 693 Unrealised gains and losses on Jackson securities classified as
available-for-sale(a) 312 478 – – Dividends (642) (511) (642) (511) New share capital subscribed 17 75 17 75 Other 9 36 71 104
Net increase in shareholders’ funds 1,086 1,760 1,430 2,934 Shareholders’ funds at beginning of year 8,031 6,271 18,207 15,273
Shareholders’ funds at end of year 9,117 8,031 19,637 18,207
Comprising: Long-term business Free surplus(b) 2,839 2,748 Required capital 3,447 3,415
Net worth(c) 6,286 6,163 Value of in-force 13,364 12,051
Total 19,650 18,214 Other business(d) (13) (7)
Total(e) 19,637 18,207

69B
usin
ess rev
iew
Notes(a) Net of related changes to deferred acquisition costs and tax.(b) The increase in free surplus of £91 million from 31 December 2010 arises primarily from £1,100 million being generated by the long-term
business (net of new business investment and market related movements), less the cash paid to the holding company, market movements, and other items.
(c) The increase in net worth in the period principally reflects the free surplus generated in the period, offset by cash paid to the holding company, changes to required capital and other items.
(d) Shareholders’ funds for other than long-term business comprises:
2011 £m 2010 £m
Asset management operations(i) 1,783 1,787 Holding company net borrowings (2,188) (2,212) Other, net 392 418
Total shareholders' funds for other business (13) (7)
Note (i) Including goodwill of £1,230 million for 31 December 2011 and 2010.
(e) EEV shareholders’ funds excluding goodwill attributable to shareholders at 31 December 2011 is £18,172 million (2010: £16,741 million).
IFRSStatutory IFRS basis shareholders’ funds at 31 December 2011 were £9.1 billion. This compares to £8.0 billion at 31 December 2010 and represents an increase of £1.1 billion, equivalent to 14 per cent.
The movement primarily reflects the profit for the period after tax and non-controlling interests of £1,490 million and the increase in the level of net unrealised gains on Jackson’s debt securities of £312 million from the position at 31 December 2010, offset by the payment of dividends of £642 million and exchange translation losses of £100 million.
EEVOn an EEV basis, which recognises the shareholders’ interest in long-term business, shareholders’ funds at 31 December 2011 were £19.6 billion, an increase of £1.4 billion from the 31 December 2010 level, equivalent to 8 per cent. This increased level of shareholders’ funds primarily reflects the profit after tax of £2,142 million, offset by the negative effects of exchange movements of £158 million and dividend payments of £642 million.
The shareholders’ funds at 31 December 2011 relating to long-term business of £19.7 billion comprise £8.5 billion (up 15 per cent from year end 2010) for our Asian long-term business operations, £5.1 billion (up 6 per cent from year end 2010) for our US long-term business operations and £6.1 billion (up 1 per cent from year end 2010) for our UK long-term business operations.
At 31 December 2011, the embedded value for our Asian long-term business operations was £8.5 billion, with £7.1 billion (up £1.1 billion from 2010) being in the South East Asia countries of Indonesia, Malaysia, Philippines, Singapore, Thailand, Vietnam together with Hong Kong. For Prudential’s other Asian markets, the embedded value was £1.4 billion in aggregate, unchanged from 2010.

70
Prudential plc Annual Report 2011
Business review | Financial review | continued
Financial review
Free surplus and holding company cash flow
The total movement in free surplus net of tax in the year can be analysed as follows:
2011 £m 2010 £m
Free surplus generation Expected in-force cash flows (including expected return on net assets) 2,335 2,139 Life operations 1,972 1,829 Asset management operations 363 310 Changes in operating assumptions and experience variances 168 220 RPI to CPI inflation measure change on defined benefit pension schemes(i) 33 –
Underlying free surplus generated in the period from in-force business 2,536 2,359 Investment in new business (553) (645)
Underlying free surplus generated in the period 1,983 1,714 Market related items (531) (94)
Free surplus generated in the period from retained businesses 1,452 1,620 Net cash remitted by the business units (1,105) (935)Other movements and timing differences (264) 122
Total movement during the period 83 807 Free surplus at 1 January 3,338 2,531
Free surplus at end of period 3,421 3,338
Comprised of: Free surplus relating to long-term insurance business 2,839 2,748 Free surplus of other insurance business 29 33 IFRS net assets of asset management businesses excluding goodwill 553 557
Total free surplus 3,421 3,338
Note(i) During the first half of 2011 the Group altered its assumptions for future statutory increases to pension payments for its UK defined benefit
pension schemes. This reflects the UK government’s decision to change the basis of indexation from RPI to CPI.

71B
usin
ess rev
iew
Free surplus and holding company cash flow continued OverviewThe Group manages its internal cash flow by focusing on the free surplus generated by the life and asset management businesses. Remittances are, however, made as and when required by the holding company, with excess surplus being left in the businesses where it can be redeployed most profitably. The tables below set out the Group’s free surplus generation, and the holding company cash flow statement for 2011.
Free surplus generationSources and uses of free surplus generation from the Group’s insurance and asset management operationsGroup free surplus at the end of the period comprises free surplus for the insurance businesses, representing the excess of the net worth over the required capital included in the EEV results, and IFRS net assets for the asset management businesses excluding goodwill. The free surplus generated during the period comprises the movement in this balance excluding foreign exchange, capital movements, and other reserve movements. Specifically, it includes amounts maturing from the in-force operations during the period less the investment in new business, the effect of market movements and other items.
For asset management operations we have defined free surplus generation to be total post-tax IFRS profit for the period. Group free surplus generated also includes the general insurance commission earned during the period and excludes shareholders’ other income and expenditure, and centrally arising restructuring and Solvency II implementation costs.
During 2011 Prudential generated total free surplus from the retained businesses of £1,452 million (2010: £1,620 million). Underlying free surplus generated from the in-force book in
2011 increased by 8 per cent to £2,536 million (2010: £2,359 million), as a result of increased expected returns from the growing insurance book. Changes in operating assumptions and variances comprise £168 million for our life business (2010: £220 million) and a £33 million credit arising from a reduction in the liabilities of the Group’s defined benefit pension schemes following the UK government’s decision to change the basis of indexation from RPI to CPI. The life business variances comprise positive £52 million in Asia (2010: positive £3 million), negative £38 million in the UK (2010: positive £26 million), and positive £154 million in the US (2010: positive £191 million), principally reflecting favourable spread experience.
Underlying free surplus generated from in-force business has been used by our life businesses to invest in new business. Despite the strong growth in APE sales, investment in new business1 has fallen by 14 per cent to £553 million in 2011 as a result of improved capital efficiency. This compares to a 6 per cent increase in sales1 and a 6 per cent increase in new business profits1. The strong improvement in capital efficiency is primarily the result of continuing the active management of the product and geographical mix of the new business sold, in line with the Group’s disciplined approach to capital conservation and value optimisation.
Market-related movements of negative £531 million in 2011 (2010: negative £94 million) include negative £432 million from the US, principally reflecting the adverse impact on free surplus of the equity volatility experienced in 2011. It also includes negative £49 million in Asia, in part reflecting a fall in equity markets in Taiwan, negative £26 million in the UK and negative £24 million from our asset management businesses.
Note1 Excludes Japan which ceased writing new business in 2010.
Investment in business in Japan in 2011 was £nil (2010: £2 million).

72
Prudential plc Annual Report 2011
Business review | Financial review | continued
Financial review
Value created through investment in new business by life operations2011 £m
Asian operationsUS
insurance operations
UK insurance
operations
Group Total
excluding Japan
Group Total
including Japan
Excluding Japan Japan Total
Free surplus invested in new business (297) – (297) (202) (54) (553) (553)
Increase in required capital 97 – 97 232 77 406 406
Net worth invested in new business (200) – (200) 30 23 (147) (147)
Value of in-force created by new business 1,011 – 1,011 500 172 1,683 1,683
Post-tax new business profit for the year 811 – 811 530 195 1,536 1,536
Tax 265 – 265 285 65 615 615
Pre-tax new business profit for the year 1,076 – 1,076 815 260 2,151 2,151
New business sales (APE) 1,660 1,660 1,275 746 New business margins (% APE) 65% 65% 64% 35% Internal rate of return* >20% >20% >20% >20%
AER
2010 £m
Asian operationsUS
insurance operations
UK insurance
operations
Group Total
excluding Japan
Group Total
including Japan
Excluding Japan Japan Total
Free surplus invested in new business (278) (2) (280) (300) (65) (643) (645)
Increase in required capital 84 – 84 270 107 461 461
Net worth invested in new business (194) (2) (196) (30) 42 (182) (184)
Value of in-force created by new business 866 1 867 525 224 1,615 1,616
Post-tax new business profit for the year 672 (1) 671 495 266 1,433 1,432
Tax 230 – 230 266 99 595 595
Pre-tax new business profit for the year 902 (1) 901 761 365 2,028 2,027
New business sales (APE) 1,501 1,508 1,164 820 New business margins (% APE) 60% 60% 65% 45% Internal rate of return* >20% >20% >20% >20%
* The internal rate of return (IRR) is equivalent to the discount rate at which the present value of the post-tax cash flows expected to be earned over the lifetime of the business written in shareholder-backed life funds is equal to the total invested capital to support the writing of the business. The capital included in the calculation of the IRR is equal to the amount required to pay acquisition costs and set up statutory reserves less premiums received, plus encumbered capital. The impact of the time value of options and guarantees is included in the calculation.

73B
usin
ess rev
iew
Value created through investment in new business by life operations continuedCER
2010 £m
Asian operationsUS
insurance operations
UK insurance
operations
Group Total
excluding Japan
Group Total
including Japan
Excluding Japan Japan Total
Free surplus invested in new business (275) (2) (277) (288) (65) (628) (630)
Increase in required capital 84 – 84 260 107 451 451
Net worth invested in new business (191) (2) (193) (28) 42 (177) (179)
Value of in-force created by new business 862 1 863 505 224 1,591 1,592
Post-tax new business profit for the year 671 (1) 670 477 266 1,414 1,413
Tax 229 – 229 257 99 585 585
Pre-tax new business profit for the year 900 (1) 899 734 365 1,999 1,998
New business sales (APE) 1,491 1,491 1,121 820 New business margins (% APE) 60% 60% 65% 45% Internal rate of return* >20% >20% >20% >20%
* The internal rate of return (IRR) is equivalent to the discount rate at which the present value of the post-tax cash flows expected to be earned over the lifetime of the business written in shareholder-backed life funds is equal to the total invested capital to support the writing of the business. The capital included in the calculation of the IRR is equal to the amount required to pay acquisition costs and set up statutory reserves less premiums received, plus encumbered capital. The impact of the time value of options and guarantees is included in the calculation.
Overall, the Group wrote £3,681 million of sales on an APE basis in 2011 (2010: £3,485 million1) generating a post-tax new business contribution to embedded value of £1,536 million (2010: £1,433 million1). To support these sales, we invested £553 million of capital (2010: £643 million1). By focusing on sales of products and in geographies which are less capital intensive, the Group has increased the amount of post-tax new business profit contribution to embedded value per £1 million of free surplus invested by 27 per cent to £2.8 million (2010: £2.2 million). We estimate the Group’s overall internal rate of return for the year ended 31 December 2011 to be greater than 20 per cent. The amount of capital invested covers both new business strain, including commissions, of £147 million (2010: £182 million1) and the required capital of £406 million (2010: £461 million1). Management will continue to focus on capital preservation and investment in those areas which add most value to the Group.
In Asia, investment in new business was £297 million, a 7 per cent increase over the £278 million1 invested in 2010. This contrasts to an 11 per cent increase in new business sales (APE) in the period. For each £1 million of free surplus invested we generated £2.7 million of post-tax new business contribution to embedded value (2010: £2.4 million), the improvement being driven by geographic and product mix changes. The average
free surplus undiscounted payback period for business written in 2011 was three years (2010: three years).
In the US, investment in new business was £202 million, 33 per cent lower than 2010 (£300 million) and contrasts to a 10 per cent increase in APE new business sales. For each £1 million of free surplus invested we generated £2.6 million of post-tax new business contribution to embedded value (2010: £1.7 million). This higher return reflects both a higher proportion of variable annuity business being sold in the year, with a reduced proportion of more capital intensive fixed annuities, product changes which reduce the reserving requirements and marketing cost efficiency. The average free surplus undiscounted payback period for business written in 2011 was one year (2010: one year).
In the UK, investment in new business was lower, at £54 million compared to £65 million last year. This investment generated APE sales which were 9 per cent lower at £746 million in 2011. For each £1 million of free surplus invested we generated £3.6 million of post-tax new business contribution to embedded value (2010: £4.1 million), with 2010 benefiting from the relatively low capital utilisation of the profitable bulk annuity business written in the last quarter of 2010. The average free surplus undiscounted payback period for shareholder-backed business written in 2011 was four years (2010: four years).
Note1 Excludes Japan which ceased writing new business in 2010.

74
Prudential plc Annual Report 2011
Business review | Financial review | continued
Financial review
Holding company cash flow 2011 £m 2010 £m
Net cash remitted by business units: UK Life fund paid to the Group 223 202 Shareholder-backed business: Other UK paid to the Group 116 275 Group invested in UK (42) (57) Total shareholder-backed business 74 218
UK net 297 420 US paid to the Group 322 80 Group invested in US – –
US net 322 80 Asia paid to the Group Long-term business 289 330 Other operations 55 33
344 363 Group invested in Asia Long-term business (50) (63) Other operations (88) (67)
(138) (130)
Asia net 206 233 M&G paid to the Group 213 150 PruCap paid to the Group 67 52
Net remittances to the Group from business units 1,105 935 Net interest paid (282) (231)Tax received 181 185 Corporate activities (139) (146)Solvency II costs (56) (34)
Total central outflows (296) (226)
Operating holding company* cash flow before dividend 809 709 Dividend paid (net of scrip in respect of 2010) (642) (449)
Operating holding company* cash flow after dividend 167 260 Issue of hybrid debt, net of costs 340 –Repayment of subordinated debt (333) –Costs of terminated AIA transaction – (377)Bank loan reorganisation – 120 Other cash payments (205) (276)
Total holding company cash flow (31) (273) Cash and short-term investments at beginning of period 1,232 1,486 Foreign exchange movements (1) 19
Cash and short-term investments at end of period 1,200 1,232
* Including central finance subsidiaries.
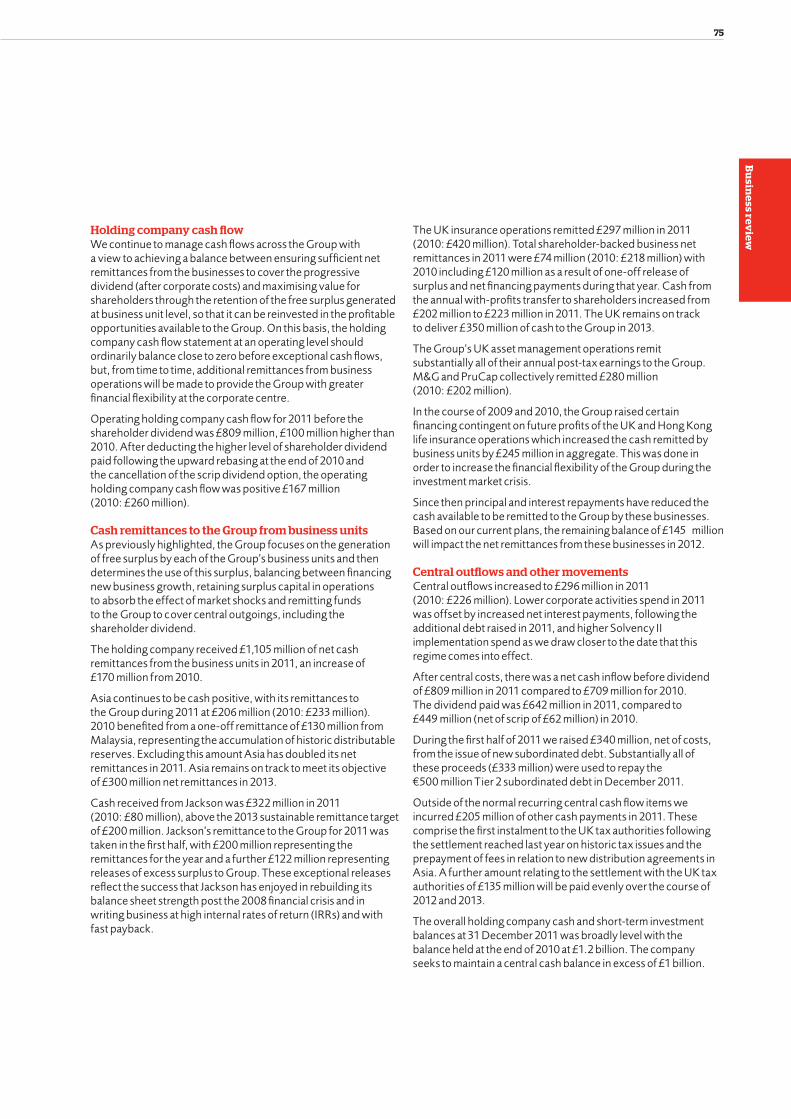
75B
usin
ess rev
iew
Holding company cash flowWe continue to manage cash flows across the Group with a view to achieving a balance between ensuring sufficient net remittances from the businesses to cover the progressive dividend (after corporate costs) and maximising value for shareholders through the retention of the free surplus generated at business unit level, so that it can be reinvested in the profitable opportunities available to the Group. On this basis, the holding company cash flow statement at an operating level should ordinarily balance close to zero before exceptional cash flows, but, from time to time, additional remittances from business operations will be made to provide the Group with greater financial flexibility at the corporate centre.
Operating holding company cash flow for 2011 before the shareholder dividend was £809 million, £100 million higher than 2010. After deducting the higher level of shareholder dividend paid following the upward rebasing at the end of 2010 and the cancellation of the scrip dividend option, the operating holding company cash flow was positive £167 million (2010: £260 million).
Cash remittances to the Group from business units As previously highlighted, the Group focuses on the generation of free surplus by each of the Group’s business units and then determines the use of this surplus, balancing between financing new business growth, retaining surplus capital in operations to absorb the effect of market shocks and remitting funds to the Group to cover central outgoings, including the shareholder dividend.
The holding company received £1,105 million of net cash remittances from the business units in 2011, an increase of £170 million from 2010.
Asia continues to be cash positive, with its remittances to the Group during 2011 at £206 million (2010: £233 million). 2010 benefited from a one-off remittance of £130 million from Malaysia, representing the accumulation of historic distributable reserves. Excluding this amount Asia has doubled its net remittances in 2011. Asia remains on track to meet its objective of £300 million net remittances in 2013.
Cash received from Jackson was £322 million in 2011 (2010: £80 million), above the 2013 sustainable remittance target of £200 million. Jackson’s remittance to the Group for 2011 was taken in the first half, with £200 million representing the remittances for the year and a further £122 million representing releases of excess surplus to Group. These exceptional releases reflect the success that Jackson has enjoyed in rebuilding its balance sheet strength post the 2008 financial crisis and in writing business at high internal rates of return (IRRs) and with fast payback.
The UK insurance operations remitted £297 million in 2011 (2010: £420 million). Total shareholder-backed business net remittances in 2011 were £74 million (2010: £218 million) with 2010 including £120 million as a result of one-off release of surplus and net financing payments during that year. Cash from the annual with-profits transfer to shareholders increased from £202 million to £223 million in 2011. The UK remains on track to deliver £350 million of cash to the Group in 2013.
The Group’s UK asset management operations remit substantially all of their annual post-tax earnings to the Group. M&G and PruCap collectively remitted £280 million (2010: £202 million).
In the course of 2009 and 2010, the Group raised certain financing contingent on future profits of the UK and Hong Kong life insurance operations which increased the cash remitted by business units by £245 million in aggregate. This was done in order to increase the financial flexibility of the Group during the investment market crisis.
Since then principal and interest repayments have reduced the cash available to be remitted to the Group by these businesses. Based on our current plans, the remaining balance of £145 million will impact the net remittances from these businesses in 2012.
Central outflows and other movementsCentral outflows increased to £296 million in 2011 (2010: £226 million). Lower corporate activities spend in 2011 was offset by increased net interest payments, following the additional debt raised in 2011, and higher Solvency II implementation spend as we draw closer to the date that this regime comes into effect.
After central costs, there was a net cash inflow before dividend of £809 million in 2011 compared to £709 million for 2010. The dividend paid was £642 million in 2011, compared to £449 million (net of scrip of £62 million) in 2010.
During the first half of 2011 we raised £340 million, net of costs, from the issue of new subordinated debt. Substantially all of these proceeds (£333 million) were used to repay the ¤500 million Tier 2 subordinated debt in December 2011.
Outside of the normal recurring central cash flow items we incurred £205 million of other cash payments in 2011. These comprise the first instalment to the UK tax authorities following the settlement reached last year on historic tax issues and the prepayment of fees in relation to new distribution agreements in Asia. A further amount relating to the settlement with the UK tax authorities of £135 million will be paid evenly over the course of 2012 and 2013.
The overall holding company cash and short-term investment balances at 31 December 2011 was broadly level with the balance held at the end of 2010 at £1.2 billion. The company seeks to maintain a central cash balance in excess of £1 billion.

76
Prudential plc Annual Report 2011
Business review | Financial review | continued
Financial review
Balance sheet
SummaryAER
2011 £m 2010 £m
Goodwill attributable to shareholders 1,465 1,466 Investments 250,605 239,297 Holding company cash and short-term investments 1,200 1,232 Other 20,310 18,811
Total assets 273,580 260,806
Less: Liabilities Policyholder liabilities 227,075 214,727 Unallocated surplus of with-profits funds 9,215 10,253
236,290 224,980 Less: Shareholders’ accrued interest in the long-term business (10,520) (10,176)
225,770 214,804 Core structural borrowings of shareholders’ financed operations (IFRS book value basis) 3,611 3,676 Other liabilities including non-controlling interest 24,562 24,119
Total liabilities and non-controlling interest 253,943 242,599
EEV basis net assets 19,637 18,207
Share capital and premium 2,000 1,983 IFRS basis shareholders’ reserves 7,117 6,048
IFRS basis shareholders’ equity 9,117 8,031 Additional EEV basis retained profit 10,520 10,176
EEV basis shareholders’ equity (excluding non-controlling interest) 19,637 18,207
Financial instrumentsThe Group is exposed to financial risk through its financial assets, financial liabilities, and policyholder liabilities. The key financial risk factors that affect the Group include market risk, credit risk and liquidity risk. Information on the Group’s exposure to financial risk factors, and our financial risk management objectives and policies, is provided both in the Risk and Capital Management section and the financial statements. Further information on the sensitivity of the Group’s financial instruments to market risk and its use of derivatives is also provided in the financial statements.
The Group’s investments are discussed in further detail in the Risk and Capital Management section B.1.b ‘Credit risk’.

77B
usin
ess rev
iewPolicyholder liabilities and unallocated surplus of with-profits fund
AER
2011 £m 2010 £m
Shareholder-backed business Asia US UK Total Total
At 1 January 17,716 60,523 43,944 122,183 100,061 Premiums 3,807 12,914 3,575 20,296 19,584 Surrenders (1,735) (4,270) (1,970) (7,975) (6,724) Maturities/Deaths (233) (820) (2,262) (3,315) (3,165)
Net cash flows 1,839 7,824 (657) 9,006 9,695 Investment related items and other movements (909) 136 2,761 1,988 9,249 Acquisition of UOB Life Assurance Limited – – – – 464 Dilution of holding in PruHealth – – – – (27) Foreign exchange translation difference (377) 706 – 329 2,741
At 31 December 18,269 69,189 46,048 133,506 122,183
With-profits funds Policyholder liabilities 93,569 92,544 Unallocated surplus 9,215 10,253
Total at 31 December 102,784 102,797
Total policyholder liabilities including unallocated surplus at 31 December 236,290 224,980
Policyholder liabilities and unallocated surplus of with-profits fundPolicyholder liabilities related to shareholder-backed business grew by £11.3 billion from £122.2 billion at 31 December 2010 to £133.5 billion at 31 December 2011.
The increase reflects positive net flows (premiums less surrenders and maturities/deaths) of £9,006 million in 2011 (2010: £9,695 million), driven by strong inflows in the US (£7,824 million) and Asia (£1,839 million). Net flows in Asia have increased by 42 per cent to £1,839 million in 2011 (2010: £1,298 million). Additionally, the rate of surrenders in Asia (expressed as a percentage of opening liabilities) was 4.4 per cent in the second half of 2011, an improvement compared with 5.1 per cent in the first half of 2011 and 6.4 per cent in the second half of 2010. The overall rate of surrender in 2011 was 9.8 per cent compared with 13.8 per cent in 2010.
Other movements include positive foreign exchange movements of £329 million (2010: £2,741 million) together with investment related and other items of £1,988 million. Investment related and other items fell from £9,249 million in 2010 to £1,988 million in 2011 principally as a result of the weaker equity markets.
During 2011, the unallocated surplus, which represents the excess of assets over policyholder liabilities for the Group’s with-profits funds on an IFRS basis, reduced by 10 per cent from £10.3 billion at 31 December 2010 to £9.2 billion at 31 December 2011.

78
Prudential plc Annual Report 2011
Business review | Financial review | continued
Financial review
Shareholders’ net borrowings and ratings
Shareholders’ net borrowings at 31 December 2011:
AER
2011 £m 2010 £m
IFRS basis
Mark to market
valueEEV
basisIFRS
basis
Mark to market
valueEEV
basis
Perpetual subordinated Capital securities (Innovative Tier 1) 1,823 (10) 1,813 1,463 28 1,491 Subordinated notes (Lower Tier 2) 829 120 949 1,255 117 1,372
2,652 110 2,762 2,718 145 2,863 Senior debt 2023 300 56 356 300 33 333 2029 249 21 270 249 (1) 248
Holding company total 3,201 187 3,388 3,267 177 3,444 Prudential Capital 250 – 250 250 – 250 Jackson surplus notes (Lower Tier 2) 160 17 177 159 13 172
Total 3,611 204 3,815 3,676 190 3,866 Less: Holding company cash and short-term
investments (1,200) – (1,200) (1,232) – (1,232)
Net core structural borrowings of shareholder-financed operations 2,411 204 2,615 2,444 190 2,634
Shareholders’ net borrowings and ratingsThe Group’s core structural borrowings at 31 December 2011 totalled £3.6 billion on an IFRS basis, compared with £3.7 billion at 31 December 2010.
In January 2011, the Company issued US$550 million 7.75 per cent Tier 1 subordinated debt, primarily to retail investors. The proceeds, net of costs, were US$539 million (£340 million) and financed the repayment of the ¤500 million Tier 2 subordinated notes in December 2011.
After adjusting for holding company cash and short-term investments of £1,200 million, net core structural borrowings at 31 December 2011 were £2,411 million compared with £2,444 million at 31 December 2010. The decrease of £33 million represents the net fall in borrowings of £65 million, reflecting the debt repayment and issue described above together with foreign exchange movements in the year, offset by a £32 million fall in holding company cash and short-term investments.
In addition to our core structural borrowings set out above, we also have in place an unlimited global commercial paper programme. As at 31 December 2011, we had issued commercial paper under this programme totalling £736 million, US$2,539 million, ¤342 million, CHF62 million and AU$12 million. The central treasury function also manages our £5 billion medium-term note (MTN) programme, covering both core and non-core borrowings. In April and October 2011 we refinanced an existing internal £200 million issue under this programme. In total, at 31 December 2011 the outstanding subordinated debt under the programme was £835 million, US$1,300 million and ¤20 million, while the senior debt outstanding was £550 million. In addition, our holding company has access to £2.1 billion of syndicated and bilateral committed revolving credit facilities, provided by 17 major international banks, expiring between 2013 and 2017. Apart from small drawdowns to test the process, these facilities have never been drawn, and there were no amounts outstanding at 31 December 2011. The commercial paper programme, the MTN programme and the committed revolving credit facilities are all available for general corporate purposes and to support the liquidity needs of our holding company and are intended to maintain a strong and flexible funding capacity.

79B
usin
ess rev
iew
We manage the Group’s core debt within a target level consistent with our current debt ratings. At 31 December 2011, the gearing ratio (debt, net of cash and short-term investments, as a proportion of EEV shareholders’ funds plus net debt) was 10.9 per cent, compared with 11.8 per cent at 31 December 2010. Prudential plc has strong debt ratings from Standard & Poor’s, Moody’s and Fitch. Prudential’s long-term senior debt is rated A+, A2 and A from Standard & Poor’s, Moody’s and Fitch, while short-term ratings are A-1, P-1 and F1 respectively.
The financial strength of PAC is rated AA by Standard & Poor’s, Aa2 by Moody’s and AA by Fitch.
Jackson National Life Insurance Company’s financial strength is rated AA by Standard & Poor’s, A1 by Moody’s and AA by Fitch.
Financial position on defined benefit pension schemes The Group currently operates three defined benefit schemes in the UK, of which by far the largest is the Prudential Staff Pension Scheme (PSPS) and two smaller schemes, Scottish Amicable (SAPS) and M&G.
Defined benefit schemes in the UK are generally required to be subject to a full actuarial valuation every three years, in order to assess the appropriate level of funding for schemes in relation to their commitments. The last completed actuarial valuation of PSPS was as at 5 April 2008, demonstrating the scheme to be 106 per cent funded, but additional funding akin to deficit funding was agreed by the Trustees in recognition of the fall in value of the scheme’s investments between 5 April 2008 and the completion of the valuation in 2009. This additional deficit funding is apportioned in the ratio of 70/30 between the PAC with-profits fund and shareholder-backed operations, reflecting the company’s historic rate of contributions over many years. The total contributions being currently made by the Group into the scheme, representing the annual accrual cost and deficit funding, are £50 million per annum. This amount will continue until the next valuation as at 5 April 2011 is finalised later in 2012 and the future level of company contributions is agreed with the Trustees. The valuation basis under IAS 19 for the Group financial statements differs markedly from the full triennial actuarial valuation basis. In particular, for PSPS, where constraints in the trust deed prevent the Group access to any surplus in the scheme, the IAS 19 surplus, measured on an economic basis net of related tax relief, of £1,391 million at 31 December 2011 (2010: £421 million) is not recognised.
The actuarial valuation of SAPS as at 31 March 2008 demonstrated the scheme to be 91 per cent funded. Based on this valuation and subsequent agreement with the Trustees, £13.1 million per annum of deficit funding is currently being paid into the scheme. The actuarial valuation of SAPS as at 31 March 2011 is currently being finalised.
The actuarial valuation of the M&G pension scheme as at 31 December 2008 demonstrated the scheme to be 76 per cent funded. Based on this valuation, deficit funding amounts designed to eliminate the actuarial deficit over a five year period have been agreed with £14.1 million being paid in each of 2010 and 2011 and £9.3 million per annum for the subsequent three years. In 2011, the Group agreed with the Trustee to pay an additional funding of £1.2 million per annum from January 2012 until the conclusion of the actuarial valuation as at 31 December 2011, which is currently in progress.
As at 31 December 2011, on the Group IFRS statement of financial position, the shareholders’ share of the net liabilities for these UK schemes amounted to a £17 million liability net of related tax relief (2010: £83 million). The total share attributable to the PAC with-profits fund amounted to a liability of £38 million net of related tax relief (2010: £99 million). The adoption by the Group in 2011 of the UK government’s decision to use the CPI in place of the RPI as the basis for inflationary increases to pensions, affected the IAS 19 valuation of certain tranches of the Group’s schemes. This resulted in a credit to pre-tax IFRS operating profit of £42 million. The impact of this change on the shareholders’ share of pension liabilities, net of related tax relief and the total share attributable to the PAC with-profits fund, net of related tax relief, was a reduction of £31 million and £22 million, respectively.
Financial strength of the UK Long-term fundOn a realistic valuation basis, with liabilities recorded on a market consistent basis, the free assets were valued at approximately £6.1 billion at 31 December 2011, before a deduction for the risk capital margin. The value of the shareholders’ interest in future transfers from the UK with-profits fund is estimated at £2.0 billion. The financial strength of PAC is rated AA by Standard & Poor’s, Aa2 by Moody’s and AA by Fitch Ratings.
Despite the decline in financial markets during 2011, Prudential UK’s with-profits fund performed relatively strongly achieving a 2.1 per cent pre-tax investment return for policyholder asset shares during 2011.

80
Prudential plc Annual Report 2011
Business review | Risk and capital management
Risk and capital management
As a provider of financial services, including insurance, the management of risk lies at the heart of our business. As a result, effective risk management capabilities represent a key source of competitive advantage for our Group.
The Group’s risk framework includes our appetite for risk exposures as well as our approach to risk management. Under this approach, we continuously assess the Group’s top risks and monitor our risk profile against approved limits. Our main strategies for managing and mitigating risk include asset liability management, using derivatives to hedge relevant market risks, and implementing reinsurance and corporate insurance programmes.
A. Group risk appetitePrudential defines and monitors aggregate risk limits based on financial and non-financial stresses for its earnings volatility, liquidity and capital requirements.
Earnings volatility: the objectives of the limits are to ensure that:
a the volatility of earnings is consistent with the expectations of stakeholders,
b the Group has adequate earnings (and cash flows) to service debt, expected dividends and to withstand unexpected shocks, and
c earnings (and cash flows) are managed properly across geographies and are consistent with funding strategies.
The two measures used to monitor the volatility of earnings are European Embedded Value (EEV) operating profit and International Financial Reporting Standards (IFRS) operating profit, although EEV and IFRS total profits are also considered.
Liquidity: the objective is to ensure that the Group is able to generate sufficient cash resources to meet financial obligations as they fall due in business as usual and stressed scenarios.
Capital requirements: the limits aim to ensure that:
a the Group meets its internal economic capital requirements,b the Group achieves its desired target rating to meet its
business objectives, andc supervisory intervention is avoided.
The two measures used are the EU Insurance Groups Directive (IGD) capital requirements and internal economic capital requirements. In addition, capital requirements are monitored on a local statutory basis.
Our risk appetite framework forms an integral part of our annual business planning cycle. The Group Risk Committee is responsible for reviewing the risks inherent in the Group’s business plan and for providing the Board with input on the risk/reward trade-offs implicit therein. This review is supported by our Group Risk function, which uses submissions by business units to calculate the Group’s aggregated position (allowing for diversification effects between business units) relative to the limits contained within the risk appetite statements.

81B
usin
ess rev
iew
B. Risk exposures
The Group Risk Framework deploys a common risk language, allowing meaningful comparisons to be made between different business units. Risks are broadly categorised as shown below:
Category Risk type Definition
Financial risks Market risk • The risk of loss for our business, or of adverse change in the financial situation, resulting, directly or indirectly, from fluctuations in the level or volatility of market prices of assets and liabilities.
Credit risk • The risk of loss for our business or of adverse change in the financial position, resulting from fluctuations in the credit standing of issuers of securities, counterparties and any debtors in the form of default or other significant credit event (eg downgrade or spread widening).
Insurance risk • The risk of loss for our business or of adverse change in the value of insurance liabilities, resulting from changes in the level, trend, or volatility of a number of insurance risk drivers. This includes adverse mortality, longevity, morbidity, persistency and expense experience.
Liquidity risk • The risk of the Group being unable to generate sufficient cash resources or raise finance to meet financial obligations as they fall due in business as usual and stress scenarios.
Non-financial risks Operational risk • The risk of loss arising from inadequate or failed internal processes, or from personnel and systems, or from external events.
Business environment risk
• Exposure to forces in the external environment that could significantly change the fundamentals that drive the business’s overall strategy.
Strategic risk • Ineffective, inefficient or inadequate senior management processes for the development and implementation of business strategy in relation to the business environment and the Group’s capabilities.
The key financial and non-financial risks and uncertainties faced by the Group, that have been considered by the Group Risk Committee during the year, and our approaches to managing them, are described below.
B.1 Financial risksa Market riski Equity risk In the UK business, most of our equity exposure is incurred in the with-profits fund, which includes a large inherited estate estimated at £6.1 billion as at 31 December 2011 (2010: £6.8 billion), which can absorb market fluctuations and protect the fund’s solvency. The inherited estate itself is partially protected against falls in equity markets through an active hedging policy.
In Asia our shareholder exposure to equities is minimal and is mainly attributed to revenue from unit-linked products. From a capital perspective, we have a small exposure to falling equity markets from the with-profits businesses.
In the US, where we are a leading provider of variable annuities, there are well-understood risks associated with the guarantees embedded in our products. We provide guaranteed minimum
death benefits (GMDB) on substantially all policies in this class, guaranteed minimum withdrawal benefits (GMWB) on a significant proportion of the book, and guaranteed minimum income benefits (GMIB) on only 5 per cent. To protect the shareholders against the volatility introduced by these embedded options, we use both a comprehensive hedging programme and reinsurance. The GMIB is no longer offered, with existing coverage being reinsured.
The Jackson IFRS shareholders’ equity and US statutory capital are sensitive to the effects of policyholder behaviour on the valuation of GMWB guarantees, but to manageable levels. For example, at 31 December 2011, on two severe stress test scenarios:
• A halving in lapses of significantly ‘in the money’ policies would have given rise to indicative reductions of £200 million in IFRS shareholders’ equity and £235 million on US statutory capital; or
• A 10 per cent increase in utilisation by all policyholders would have given rise to indicative reductions of £100 million on IFRS shareholders’ equity and £240 million on US statutory capital.

82
Prudential plc Annual Report 2011
Business review | Risk and capital management | continued
Risk and capital management
In our variable annuity sales activities, we focus on meeting the needs of conservative and risk averse customers who are seeking reliable income in retirement, and who display little tendency to arbitrage their guarantees. These customers generally select conservative investment options. We are able to meet the needs of these customers because of the strength of our operational platform.
It is our philosophy not to compete on price; rather, we seek to sell at a price sufficient to fund the cost we incur to hedge or reinsure our risks and to achieve an acceptable return for shareholders.
We use a macro approach to hedging that covers the risks inherent across the US business. Within this macro approach we make use of the natural offsets that exist between the variable annuity guarantees and the fixed index annuity book, and then use a combination of over-the-counter (OTC) options and exchange traded derivatives to hedge the remaining risk, considering significant market shocks and limiting the amount of capital we are putting at risk. Internal positions are generally netted before any external hedge positions are considered. The hedging programme also covers the fees on variable annuity guarantees.
Jackson hedges the economics of its products rather than the accounting result. This focus means that we accept a degree of variability in our accounting results in order to ensure we achieve the appropriate economic result. Accordingly, while Jackson’s hedges are effective on an economic basis, due to different accounting treatment for the hedges and some of the underlying hedged items on an IFRS basis, the reported income effect is more variable.
ii Interest rate riskInterest rate risk arises primarily from Prudential’s investments in long-term debt and fixed income securities. Interest rate risk also exists in policies that carry investment guarantees on early surrender or at maturity, where claim values can become higher than the value of backing assets as a result of rises or falls in interest rates.
In the US, there is interest rate risk across the portfolio. The majority of Jackson’s fixed annuity and life liabilities allow for an annual reset of the crediting rate, which provides for a greater level of discretion in determining the amount of interest rate risk to assume. The primary concerns with these liabilities relate to potential surrenders when rates increase and, in a low interest environment, the minimum guarantees required by state law. For variable annuities, interest rate changes will influence the level of reserves held for certain guaranteed benefits. With its large fixed annuity and fixed index annuity books, Jackson has natural offsets for its variable annuity interest-rate related risks. Jackson manages interest rate exposure through a combination of interest rate swaps and interest rate options.
In the UK, the investment policy for the shareholder-backed annuity business is to match the annuity payments with the cash flows from investments. As a result, assets and liabilities are closely matched by duration. The impact on profit of any residual cash flow mismatching can be adversely affected by changes in interest rates; therefore the mismatching position is regularly monitored. The guarantees written in the with-profits business also give rise to some interest rate discounting risk (ie falling rates result in an increase in the cost of guarantees) albeit these impacts are in the first instance absorbed by the with-profits fund and not IFRS shareholders’ equity.
The exposure to interest rate risk arising from guarantees in Asia is at modest levels: for some non-unit-linked investment products it may not be possible to hold assets which will provide cash flows to match exactly those relating to policyholder liabilities. This results in a mismatch due to the duration and uncertainty of the liability cash flows and the lack of sufficient assets of a suitable duration. While this residual asset/liability mismatch risk can be managed, it cannot be eliminated.
iii Foreign exchange risk Prudential principally operates in the UK, the US, and in 13 countries and territories in Asia and the Middle East. The geographical diversity of our businesses means that we are inevitably subject to the risk of exchange rate fluctuations. Prudential’s international operations in the US and Asia, which represent a significant proportion of our operating profit and shareholders’ funds, generally write policies and invest in assets denominated in local currency. Although this practice limits the effect of exchange rate fluctuations on local operating results, it can lead to significant fluctuations in our consolidated financial statements when results are expressed in pounds sterling.
We do not generally seek to hedge foreign currency revenues, as these are substantially retained locally to support the growth of the Group’s business and meet local regulatory and market requirements. However, in cases where a surplus arising in an overseas operation supports Group capital or shareholders’ interest, this exposure is hedged if it is economically optimal to do so. Currency borrowings, swaps and other derivatives are used to manage exposures.
b Credit riskIn addition to business unit and Group-wide operational limits on credit risk, we monitor closely our counterparty exposures at Group level, highlighting those that are large or of concern. Where appropriate, we will reduce our exposure, purchase credit protection or make use of collateral arrangements to control our levels of credit risk.

83B
usin
ess rev
iew
The Group held the following total investments at 31 December 2011.
2011 £bn 2010 £bn
Participating
funds
Unit-linked and variable
annuitiesShareholder-
backed Total
GroupTotal
Group
Debt securities 57.2 8.9 58.4 124.5 116.4 Equity 26.0 59.9 1.4 87.3 86.6 Property investments 8.5 0.7 1.6 10.8 11.2 Mortgage loans 1.0 – 4.7 5.7 5.0 Other loans 1.7 – 2.3 4.0 4.3 Deposits 7.2 1.5 2.0 10.7 10.0 Other investments 4.5 0.1 3.0 7.6 5.8
Total 106.1 71.1 73.4 250.6 239.3
The table below presents the balances of investments related to shareholder-backed operations.
2011 £bn
Asia life UK life US life Other Total
Total shareholder-backed investments 7.1 28.5 34.0 3.8 73.4
Shareholders are not directly exposed to value movements on assets backing participating or unit-linked operations, with sensitivity mainly related to shareholder-backed operations.
i) Debt portfolioThe investments held by the shareholder-backed operations are predominantly debt securities, of which 95 per cent are rated,
either externally or internally, as investment grade compared to 95 per cent at 31 December 2010.
The below table presents the balances of debt securities at 31 December 2011.
2011 £bn 2010 £bn
Participating
funds
Unit-linked and variable
annuitiesShareholder-
backed Total
GroupTotal
Group
Insurance operations UK 47.6 6.2 24.2 78.0 74.3 US – – 27.0 27.0 26.4 Asia 9.6 2.7 5.4 17.7 14.1 Asset management operations – – 1.8 1.8 1.6
Total debt securities 57.2 8.9 58.4 124.5 116.4
UKThe UK’s debt portfolio on an IFRS basis is £78.0 billion as at 31 December 2011, including £47.6 billion within the UK with-profits fund. Shareholders’ risk exposure to the with-profits fund is limited as the solvency is protected by the large inherited estate. Outside the with-profits fund there is £6.2 billion in
unit-linked funds where the shareholders’ risk is limited, with the remaining £24.2 billion backing the shareholders’ annuity business and other non-linked business (of which 78 per cent is rated AAA to A, 20 per cent BBB and 2 per cent non-investment grade). The UK shareholder-backed portfolio did not experience any default losses in 2011.
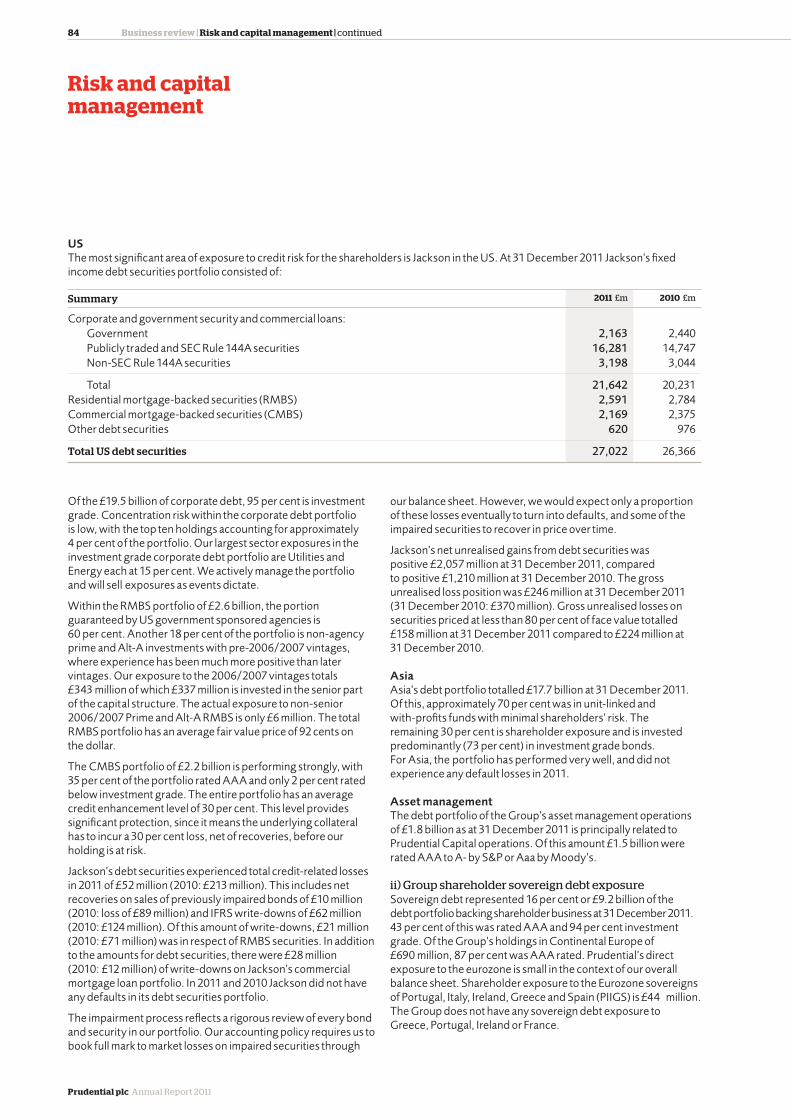
84
Prudential plc Annual Report 2011
Business review | Risk and capital management | continued
Risk and capital management
USThe most significant area of exposure to credit risk for the shareholders is Jackson in the US. At 31 December 2011 Jackson’s fixed income debt securities portfolio consisted of:
Summary 2011 £m 2010 £m
Corporate and government security and commercial loans: Government 2,163 2,440 Publicly traded and SEC Rule 144A securities 16,281 14,747 Non-SEC Rule 144A securities 3,198 3,044
Total 21,642 20,231 Residential mortgage-backed securities (RMBS) 2,591 2,784 Commercial mortgage-backed securities (CMBS) 2,169 2,375 Other debt securities 620 976
Total US debt securities 27,022 26,366
Of the £19.5 billion of corporate debt, 95 per cent is investment grade. Concentration risk within the corporate debt portfolio is low, with the top ten holdings accounting for approximately 4 per cent of the portfolio. Our largest sector exposures in the investment grade corporate debt portfolio are Utilities and Energy each at 15 per cent. We actively manage the portfolio and will sell exposures as events dictate.
Within the RMBS portfolio of £2.6 billion, the portion guaranteed by US government sponsored agencies is 60 per cent. Another 18 per cent of the portfolio is non-agency prime and Alt-A investments with pre-2006/2007 vintages, where experience has been much more positive than later vintages. Our exposure to the 2006/2007 vintages totals £343 million of which £337 million is invested in the senior part of the capital structure. The actual exposure to non-senior 2006/2007 Prime and Alt-A RMBS is only £6 million. The total RMBS portfolio has an average fair value price of 92 cents on the dollar.
The CMBS portfolio of £2.2 billion is performing strongly, with 35 per cent of the portfolio rated AAA and only 2 per cent rated below investment grade. The entire portfolio has an average credit enhancement level of 30 per cent. This level provides significant protection, since it means the underlying collateral has to incur a 30 per cent loss, net of recoveries, before our holding is at risk.
Jackson’s debt securities experienced total credit-related losses in 2011 of £52 million (2010: £213 million). This includes net recoveries on sales of previously impaired bonds of £10 million (2010: loss of £89 million) and IFRS write-downs of £62 million (2010: £124 million). Of this amount of write-downs, £21 million (2010: £71 million) was in respect of RMBS securities. In addition to the amounts for debt securities, there were £28 million (2010: £12 million) of write-downs on Jackson’s commercial mortgage loan portfolio. In 2011 and 2010 Jackson did not have any defaults in its debt securities portfolio.
The impairment process reflects a rigorous review of every bond and security in our portfolio. Our accounting policy requires us to book full mark to market losses on impaired securities through
our balance sheet. However, we would expect only a proportion of these losses eventually to turn into defaults, and some of the impaired securities to recover in price over time.
Jackson’s net unrealised gains from debt securities was positive £2,057 million at 31 December 2011, compared to positive £1,210 million at 31 December 2010. The gross unrealised loss position was £246 million at 31 December 2011 (31 December 2010: £370 million). Gross unrealised losses on securities priced at less than 80 per cent of face value totalled £158 million at 31 December 2011 compared to £224 million at 31 December 2010.
AsiaAsia’s debt portfolio totalled £17.7 billion at 31 December 2011. Of this, approximately 70 per cent was in unit-linked and with-profits funds with minimal shareholders’ risk. The remaining 30 per cent is shareholder exposure and is invested predominantly (73 per cent) in investment grade bonds. For Asia, the portfolio has performed very well, and did not experience any default losses in 2011.
Asset managementThe debt portfolio of the Group’s asset management operations of £1.8 billion as at 31 December 2011 is principally related to Prudential Capital operations. Of this amount £1.5 billion were rated AAA to A- by S&P or Aaa by Moody’s.
ii) Group shareholder sovereign debt exposureSovereign debt represented 16 per cent or £9.2 billion of the debt portfolio backing shareholder business at 31 December 2011. 43 per cent of this was rated AAA and 94 per cent investment grade. Of the Group’s holdings in Continental Europe of £690 million, 87 per cent was AAA rated. Prudential’s direct exposure to the eurozone is small in the context of our overall balance sheet. Shareholder exposure to the Eurozone sovereigns of Portugal, Italy, Ireland, Greece and Spain (PIIGS) is £44 million. The Group does not have any sovereign debt exposure to Greece, Portugal, Ireland or France.

85B
usin
ess rev
iew
The exposure of the Group’s shareholder and with-profits funds to sovereign debt (including credit default swaps that are referenced to sovereign debt) at 31 December 2011 is as follows.
Shareholdersovereign
debt£m
With-profitssovereign
debt£m
Continental Europe Italy 43 52 Spain 1 33 44 85 Germany 598 602 Other Europe (principally Isle of Man and Belgium) 48 62
690 749 United Kingdom 3,254 2,801 United States 2,448 2,615 Other, predominantly Asia 2,850 332
Total 9,242 6,497
iii) Exposure to bank debt securitiesPrudential expects that any second order sovereign credit exposures would most likely be concentrated in the banking sector. The Group’s bank exposure is a function of its core investment business, as well as of the hedging and other activity undertaken to manage its various financial risks. Prudential relies on public information, such as the results of the July 2011 European Banking Authority (EBA) stress tests to identify banks with large concentrations of indirect exposure.
Prudential has a range of controls and processes to manage credit exposure. In addition to the control frameworks that cover shareholder and policyholder credit risk within each Business Unit, the Group Credit Risk Committee oversees shareholder credit risk across the Group. The Committee receives comprehensive management information, including details of counterparty and invested credit exposure (including structured credit and loans), secured and unsecured cash balances, top 30 credit exposures, and an analysis of shareholder exposure by industry/country and rating. The Group Risk function also continually monitors the portfolio for emerging credit risks through various tools and processes.
Prudential actively mitigates the level of Group wide credit risk (invested credit and counterparty) through a comprehensive system of hard limits, collateralisation agreements and centrally managed ‘watch lists’.
Of the £58.4 billion of debt securities backing shareholder business (excluding holdings attributable to external holders of consolidated unit trusts), 4 per cent or £2.1 billion was in Tier 1 and Tier 2 hybrid bank debt. A further £2.2 billion was in the form of senior debt.
In terms of shareholder exposures to the bank debt of PIIGS, we held £328 million at 31 December 2011. This comprised £107 million of covered bonds, £59 million senior debt, £16 million Tier 1 debt and £146 million Tier 2 debt. There was no direct exposure to Greek banks.

86
Prudential plc Annual Report 2011
Business review | Risk and capital management | continued
Risk and capital management
The Group held the following direct exposures to banks’ debt securities of shareholder-backed business at 31 December 2011:
Bank debt securities – shareholder-backed business
Senior debt Subordinated debt
Covered
£mSenior
£m
Total senior debt
£mTier 2
£mTier 1
£m
Total subordinated
debt £m
Total £m
Portugal – 24 24 – – – 24 Ireland – 13 13 – – – 13 Italy – 11 11 56 14 70 81 Greece – – – – – – – Spain 107 11 118 90 2 92 210 107 59 166 146 16 162 328 Austria – – – 9 – 9 9 Belgium – – – – – – – France 2 34 36 78 35 113 149 Germany – 28 28 1 – 1 29 Luxembourg – – – – – – – Netherlands – 7 7 81 64 145 152 United Kingdom 228 145 373 615 95 710 1,083
Total Europe 337 273 610 930 210 1,140 1,750
United States – 1,362 1,362 352 2 354 1,716 Other, predominantly Asia – 246 246 562 33 595 841
Total 337 1,881 2,218 1,844 245 2,089 4,307
In addition to the exposures held by the shareholder-backed business, the Group held the following banks’ securities at 31 December 2011 within its with-profits funds:
Bank debt securities – participating funds
Senior debt Subordinated debt
Covered
£mSenior
£m
Total senior debt
£mTier 2
£mTier 1
£m
Total subordinated
debt £m
Total £m
Portugal – 7 7 – – – 7 Ireland – – – – – – – Italy – 45 45 49 2 51 96 Greece 5 – 5 – – – 5 Spain 137 – 137 1 – 1 138 142 52 194 50 2 52 246 Austria – – – – – – – Belgium – – – – – – – France – 80 80 47 17 64 144 Germany – 7 7 – – – 7 Luxembourg – 7 7 – – – 7 Netherlands – 80 80 14 28 42 122 United Kingdom 319 385 704 772 74 846 1,550
Total Europe 461 611 1,072 883 121 1,004 2,076
United States – 1,378 1,378 396 278 674 2,052 Other, predominantly Asia 1 384 385 341 20 361 746
Total 462 2,373 2,835 1,620 419 2,039 4,874

87B
usin
ess rev
iew
iv) Other possible impacts of a eurozone crisisOther knock on impacts of a eurozone crisis may represent some risk to the Group, both in terms of financial market impact and potential operational issues. These third order exposures are intrinsically more difficult to quantify. However, as well as the monitoring routines noted above, Prudential has also developed tools to identify the Group’s exposure to counterparties at risk (including contingent credit exposures), and has in place Group-wide processes to facilitate the management of such risks should they materialise.
In respect of operational risks, we have strong investment operations, counterparty risk and change management capabilities and we are confident in our ability to manage the transition to a new eurozone regime if events require us to do so.
v) LoansOf the total Group loans of £9.7 billion at 31 December 2011, the following are held by shareholder-backed operations.
2011 £bn 2010 £bn
Mortgageloans
Other loans Total
Mortgageloans
Other loans Total
Asia insurance operations(i) – 0.4 0.4 – 0.5 0.5 US insurance operations(ii) 3.6 0.6 4.2 3.6 0.6 4.2 UK insurance operations(iii) 1.1 – 1.1 1.0 – 1.0 Asset management operations(iv) – 1.3 1.3 – 1.4 1.4
Total loans held by shareholder-backed operations 4.7 2.3 7.0 4.6 2.5 7.1
Notes(i) The majority of Asia insurance operations loans are commercial loans held by the Malaysian operation that are rated investment grade by
two local rating agencies. (ii) All commercial mortgage loans held by US insurance operations are collateralised by properties. The US commercial mortgage loan
portfolio does not include any single-family residential mortgage loans and therefore is not exposed to the risk of defaults associated with residential sub-prime mortgage loans. Jackson incurred impairments of £28 million on its commercial mortgage book (2010: £12 million). Other loans represents policy loans.
(iii) The majority of mortgage loans held by UK insurance operations are mortgage loans collateralised by properties.(iv) Relates to bridging loan finance managed by Prudential Capital.
vi) Counterparty credit riskThe Group enters into a variety of exchange traded and over-the-counter derivative financial instruments, including futures, options, forward currency contracts and swaps such as interest rate swaps, cross-currency swaps, swaptions and credit default swaps.
All over-the-counter derivative transactions, with the exception of some Asian transactions, are conducted under standardised ISDA (International Swaps and Derivatives Association Inc) master agreements and the Group has collateral agreements between the individual Group entities and relevant counterparties in place under each of these market master agreements.
The Group’s exposure to derivative counterparty credit risk is subject to the same framework of Group-wide operational limits and monitoring as our invested credit risk. Where appropriate, we will reduce our exposure, purchase credit protection or make use of additional collateral arrangements to control our levels of counterparty credit risk.
c Insurance risk The processes of determining the price of our products and reporting the results of our long-term business operations require us to make a number of assumptions. In common with other industry players, the profitability of our businesses depends on a mix of factors including mortality and morbidity trends, persistency, investment performance, unit cost of administration and new business acquisition expenses.
We continue to conduct rigorous research into longevity risk using data from our substantial annuity portfolio. The assumptions that Prudential makes about future expected levels of mortality are particularly relevant in its UK annuity business. The attractiveness of reinsurance is regularly evaluated. It is used as a risk management tool where it is appropriate and attractive to do so.
Prudential’s persistency assumptions reflect recent experience for each relevant line of business, and any expectations of future persistency. Persistency risk is mitigated by appropriate training and sales processes and managed proactively post sale. Where appropriate, allowance is also made for the relationship – either assumed or historically observed – between persistency and investment returns, and for the resulting additional risk.

88
Prudential plc Annual Report 2011
Business review | Risk and capital management | continued
Risk and capital management
d Liquidity risk The parent company has significant internal sources of liquidity which are sufficient to meet all of our expected requirements for the foreseeable future without having to make use of external funding. In aggregate the Group has £2.1 billion of undrawn committed facilities, expiring between 2013 and 2017. In addition, the Group has access to liquidity via the debt capital markets. For example, Prudential plc issued US$550 million perpetual subordinated Tier 1 securities in January 2011. Prudential also has in place an unlimited commercial paper programme and has maintained a consistent presence as an issuer in this market for the last decade. Liquidity uses and sources have been assessed at the Group and at a business unit level under base case and stressed assumptions. The liquidity resources available and the subsequent Liquidity Coverage Ratio (LCR) have been assessed to be sufficient under both sets of assumptions.
B.2 Non-financial riskPrudential is exposed to operational, business environment and strategic risk in the course of running its businesses.
With regard to operational risk, the Group is dependent on processing a large number of complex transactions across numerous diverse products, and is subject to a number of different legal and regulatory, including tax, regimes. Prudential also has a significant number of third-party relationships that are important to the distribution and processing of our products, both as market counterparties and as business partners. This results in reliance upon the operational performance of these outsourcing partners.
Prudential’s systems and processes incorporate controls that are designed to manage and mitigate the operational risks associated with its activities. The Prudential Group Governance Manual was developed to make a key contribution to the sound system of internal control that the Group is expected to maintain under the UK Corporate Governance Code and the Hong Kong Code on Corporate Governance Practices. Group Head Office and business units confirm that they have implemented the necessary controls to evidence compliance with the Manual.
The Group has an operational risk management framework in place that facilitates both the qualitative and quantitative analysis of operational risk exposures. The output of this framework, in particular management information on key operational risk and control assessments, scenario analysis, internal incidents and external incidents, is reported by the business units and presented to the Group Operational Risk Committee. This information also supports business decision-making and lessons-learned activities; the ongoing improvement of the control environment; and determination of the adequacy of Prudential’s corporate insurance programme.
With regard to business environment risk, the Group has a wide-ranging programme of active and constructive engagement with governments, policymakers and regulators in our key markets and with relevant international institutions. Such engagement is undertaken both directly and indirectly via trade associations. The Group has procedures in place to monitor and track political and regulatory developments. Where appropriate, the Group provides submissions and technical input to officials and others, either via submissions to formal consultations or through interactions with officials.
With regard to strategic risk, both business units and the Group Head Office are required to adopt a forward-looking approach to risk management by performing risk assessments as part of the annual strategic planning process. This supports the identification of potential threats and the initiatives needed to address them, as well as competitive opportunities. The impact on the underlying businesses and/or Group-wide risk profile is also considered to ensure that strategic initiatives are within the Group’s risk appetite.
Solvency II represents a regulatory risk due to the uncertainty of what the rules will be when finalised, their potential impacts, and the timing of their introduction. The risks are that the Group may not be able to respond sufficiently quickly to the strategic implication of the change given levels of uncertainty around the content and timing; operational risk in terms of the scale and complexity of the delivery and uncertainty over timelines; and the additional capital that the Group may be required to hold. Solvency II is covered in more detail in the Capital Management section below.
B.3 Risk factorsOur disclosures covering risk factors can be found at the end of this document.
C. Capital management C.1 Regulatory capital (IGD)Prudential is subject to the capital adequacy requirements of the European Union (EU) Insurance Groups Directive (IGD) as implemented by the Financial Services Authority (FSA) in the UK. The IGD capital adequacy requirements involve aggregating surplus capital held in our regulated subsidiaries, from which Group borrowings, except those subordinated debt issues that qualify as capital, are deducted. No credit for the benefit of diversification is permitted under this approach.
Our capital position remains strong. We have continued to place emphasis on maintaining the Group’s financial strength through optimising the balance between writing profitable new business, conserving capital and generating cash. We estimate that our IGD capital surplus is £4.0 billion at 31 December 2011 (before taking into account the 2011 final dividend), with available capital covering our capital requirements 2.75 times. This compares to a capital surplus of £4.3 billion at the end of 2010 (before taking into account the 2010 final dividend).

89B
usin
ess rev
iew
The movements during 2011 mainly comprise:
• Net capital generation mainly through operating earnings (in-force releases less investment in new business, net of tax) of £1.5 billion;
Offset by:
• Investment market related impacts of £0.6 billion;
• Final 2010 dividend of £0.4 billion and interim 2011 dividend of £0.2 billion;
• External financing costs and other central costs, net of tax, of £0.5 billion; and
• Net impact of £0.1 billion arising from issuance of the US$550 million perpetual subordinated Tier 1 securities in January 2011 and repayment of the ¤500 million subordinated notes in December 2011.
We continue to have further options available to us to manage available and required capital. These could take the form of increasing available capital (for example, through financial reinsurance) or reducing required capital (for example, through the mix and level of new business) and the use of other risk mitigation measures such as hedging and reinsurance.
In addition to our strong capital position, on a statutory (Pillar 1) basis, the total credit reserve for the UK shareholder annuity funds also protects our capital position in excess of the IGD surplus. This credit reserve as at 31 December 2011 was £2.0 billion. This credit risk allowance represents 33 per cent of the bond portfolio spread over swap rates, compared to 43 per cent as at 31 December 2010.
Stress testing As at 31 December 2011, stress testing of our IGD capital position to various events has the following results:
• An instantaneous 20 per cent fall in equity markets from 31 December 2011 levels would reduce the IGD surplus by £350 million;
• A 40 per cent fall in equity markets (comprising an instantaneous 20 per cent fall followed by a further 20 per cent fall over a four-week period) would reduce the IGD surplus by £900 million;
• A 100 bps reduction (subject to a floor of zero) in interest rates would reduce the IGD surplus by £650 million; and
• Credit defaults of 10 times the expected level would reduce IGD surplus by £500 million.
We believe that the results of these stress tests, together with the Group’s strong underlying earnings capacity, our established hedging programmes and our additional areas of financial flexibility, demonstrate that we are in a position to withstand significant deterioration in market conditions.
We also use an economic capital assessment to monitor our capital requirements across the Group, allowing for realistic diversification benefits and continue to maintain a strong position. This assessment provides valuable insights into our risk profile.
C.2 Solvency II The European Union (EU) is developing a new solvency framework for insurance companies, referred to as ‘Solvency II’. The Solvency II Directive, which sets out the new framework, was formally approved by the Economic and Financial Affairs Council in November 2009 and is anticipated to be transposed into local regulations and take effect for supervisors from 2013, with implementation currently anticipated from 2014. The new approach is based on the concept of three pillars – minimum capital requirements, supervisory review of firms’ assessments of risk, and enhanced disclosure requirements.
Specifically, Pillar 1 covers the quantitative requirements around own funds, valuation rules for assets and liabilities and capital requirements. Pillar 2 provides the qualitative requirements for risk management, governance and controls, including the requirement for insurers to submit an Own Risk and Solvency Assessment (ORSA) which will be used by the regulator as part of the supervisory review process. Pillar 3 deals with the enhanced requirements for supervisory reporting and public disclosure.
A key aspect of Solvency II is that the assessment of risks and capital requirements are intended to be aligned more closely with economic capital methodologies. Companies may be allowed to make use of internal economic capital models if approved by the local regulator.
The European Parliament is currently discussing the Omnibus II Directive which, once approved, will amend certain aspects of the Solvency II Directive, including the anticipated implementation date as described above. The Omnibus II Directive is expected to be finalised during 2012.
In addition the European Commission is continuing to develop, in consultation with stakeholders including industry, detailed rules that complement the high-level principles in the Solvency II Directive, referred to as ‘implementing measures’. These are not expected to be finalised until later in 2012. Further guidance and technical standards are also currently being developed by the European Insurance and Occupational Pensions Authority (EIOPA). These are expected to be subject to a formal consultation and are unlikely to be finalised before early 2013.

90
Prudential plc Annual Report 2011
Business review | Risk and capital management | continued
Risk and capital management
There remains significant uncertainty regarding the outcome from this process. In particular, the Solvency II rules relating to the determination of the liability discount rate and to the treatment of US business remain unclear and Prudential’s capital position is sensitive to these outcomes. With reference to the liability discount rate, solutions to remove artificial volatility from the balance sheet have been suggested by policymakers as the regulations continue to evolve. These solutions, along with transitional arrangements for the treatment of the US business, are continuing to be considered by the European Parliament as part of the process to reach agreement on the Omnibus II Directive. There is a risk that the effect of the final measures could be adverse for Prudential, including potentially that a significant increase in capital may be required to support its business and that Prudential may be placed at a competitive disadvantage to other European and non-European financial services groups. Prudential is actively participating in shaping the outcome through our involvement in industry bodies and trade associations, including the Chief Risk Officer and Chief Financial Officer Forums, together with the Association of British Insurers (ABI) and Insurance Europe (formerly known as the Comité Européen des Assurances).
Having assessed the requirements of Solvency II, an implementation programme was initiated with dedicated teams to manage the required work across the Group. The activity of the local Solvency II teams is being coordinated centrally to achieve consistency in the understanding and application of the requirements. We are continuing our preparations to adopt the regime when it eventually arrives and are undertaking in parallel an evaluation of the possible actions to mitigate its effects. Prudential regularly reviews its range of options to maximise the strategic flexibility of the Group. This includes consideration of optimising the Group’s domicile, including as a possible response to an adverse outcome on Solvency II.
Over the coming months we will be progressing our implementation and remaining in regular contact with the FSA as we continue to engage in the ‘pre-application’ stage of the approval process for the internal model.
C.3 Capital allocation Prudential’s approach to capital allocation takes into account a range of factors, especially risk adjusted returns on capital, the impact of alternative capital measurement bases (accounting, regulatory, economic and ratings agency assessments), tax efficiency, and wider strategic objectives.
We optimise capital allocation across the Group by using a consistent set of capital performance metrics across all business units to ensure meaningful comparison. Capital utilisation, return on capital and new business value creation are measured at a product level. The use of these capital performance metrics is embedded into our decision-making processes for product design and product pricing.
Our capital performance metrics are based on economic capital, which provides a view of our capital requirements across the Group, allowing for realistic diversification benefits. Economic capital also provides valuable insights into our risk profile and is used both for risk measurement and capital management.
C.4 Risk mitigation and hedging We manage our actual risk profile against our tolerance of risk. To do this, we maintain risk registers that include details of the risks we have identified and of the controls and mitigating actions we employ in managing them. Any mitigation strategies involving large transactions such as a material derivative transaction are subject to review at Group level before implementation.
We use a range of risk management and mitigation strategies. The most important of these include: adjusting asset portfolios to reduce investment risks (such as duration mismatches or overweight counterparty exposures); using derivatives to hedge market risks; implementing reinsurance programmes to manage insurance risk; implementing corporate insurance programmes to limit the impact of operational risks; and revising business plans where appropriate.

91B
usin
ess rev
iewBusiness review | Other corporate information
Products and drivers of insurance operations’ profits Overview of the Group’s principal activities Prudential plc is the holding company of the Prudential Group. The principal activity of our subsidiary operations is the provision of financial services to individuals and businesses in Asia, the US and UK. We offer a wide range of retail financial products and services, and asset management services, throughout these territories. The retail financial products and services principally include life insurance, pensions and annuities as well as collective investment schemes.
Asia The life insurance products offered by Prudential Corporation Asia include with-profits (participating) and non-participating term, whole life and endowment and unit-linked policies often combined with protection riders and typically with regular premium payments.
In 2011, the new business profit mix in our Asian insurance business was derived 60 per cent (2010: 59 per cent) from health and protection products, 27 per cent (2010: 32 per cent) from unit-linked products and 13 per cent (2010: 9 per cent) from non-linked products.
Unit-linked products combine savings with protection, with the cash value of the policy depending on the value of the underlying unitised funds. Participating products provide savings with protection where the basic sum assured can be enhanced by a profit share (or bonus) from the underlying fund as determined at the discretion of the insurer. Non-participating products offer savings with protection where the benefits are guaranteed or determined by a set of defined market-related parameters. Accident and health products provide mortality or morbidity benefits and include health, disablement, critical illness and accident cover. These products are commonly offered as supplements to main life policies, but can also be sold separately.
Policyholder and insurer share the profits from participating policies (typically in a 90:10 ratio) in the same way as with-profits business in the UK. With unit-linked products, shareholders receive the profits arising from managing the policy, its investments and the insurance risk. Policyholders within the underlying unitised fund receive investment gains. The profits from accident and health and non-participating products come from any surplus remaining after paying policy benefits.
Unit-linked products tend to have higher profits on the EEV basis of reporting than traditional non-linked products, as expenses and charges are better matched and solvency capital requirements are lower. At the end of 2011, we were offering unit-linked products in all markets except Thailand.
In Malaysia and Indonesia, Prudential also offers life insurance policies that are constructed to comply with Islamic principles otherwise known as Takaful. The main principles are policyholders co-operate among themselves for the common good, uncertainty is eliminated in respect of subscription and compensation and there is no investment in prohibited areas such as gambling or alcohol.
In addition to the life products described above, we offer mutual fund investment products in India, Taiwan, Japan, Singapore, Malaysia, Hong Kong, Korea, Vietnam and China, thus enabling customers to participate in debt, equity and money market investments. We are also licensed in the United Arab Emirates. Eastspring Investments (our asset management business in Asia) earns a fee based on assets under management.
United StatesJackson’s product offerings include variable, fixed and fixed index annuities, as well as life insurance and institutional products.
AnnuitiesAnnuity products are long-term individual retirement products, which offer tax-deferred accumulation on the funds invested until proceeds are withdrawn from the policy.
Fixed annuities are used for asset accumulation in retirement planning and for providing income in retirement and offer flexible payout options. The contract holder pays us a premium, which is credited to the contract holder’s account. Periodically, interest is credited to the contract holder’s account and administrative charges are deducted. The interest rate may be reset on each contract anniversary, subject to a guaranteed minimum, in line with state regulations. When the annuity matures, the contract holder is paid either the amount in the contract holder account or staggered payments in the form of an immediate annuity – similar to a UK annuity in payment.
Policyholder behaviour is relevant when looking at profits for fixed annuity contracts. The relevant factors are the potential for surrenders when interest rates rise and, in a low interest environment, the influence of the minimum guarantees required by state law. Fixed annuity policies are subject to early surrender charges for the first six to nine years of the contract. In addition, the contract may be subject to a market value adjustment at the time of surrender. During the surrender charge period, the contract holder may cancel the contract for the surrender value. Our profits on fixed annuities come primarily from the spread between the return earned on investments and the interest credited to the contract holder’s account, less expenses.
Other corporateinformation

92
Prudential plc Annual Report 2011
Business review | Other corporate information | continued
Other corporateinformation
Fixed index annuities are similar to fixed annuities, in that the contract holder pays a premium that is credited to the contract holder’s account, and also in that interest is periodically credited to the contract holder’s account. An annual minimum interest rate is guaranteed, although actual interest credited may be higher and is linked to an equity index over the product’s index option period. Profit comes primarily from the spread between the return earned on investments and the amounts credited to the contract holder’s account, less expenses, which include the costs of hedging the equity component of the interest credited to the contract. The net hedge results are reflected in short-term fluctuations. Fixed index annuities are subject to early surrender charges for the first five to 12 years of the contract. During the surrender charge period, the contract holder may cancel the contract for the surrender value. The fixed index book provides natural offsetting equity exposure to the guarantees issued in connection with our variable annuity products, which allows for efficient hedging of the net equity exposure.
Variable annuities are tax-advantaged, deferred annuities where the rate of return depends upon the performance of the underlying investment portfolio, similar in principle to UK unit-linked products. They are also used for asset accumulation in retirement planning and to provide income in retirement.
The contract holder can allocate the premiums between a variety of variable sub-accounts, with a choice of fund managers and/or guaranteed fixed-rate options. As with a unit-linked fund, the contract holder’s premiums allocated to the variable accounts are held separately from Jackson’s general account assets. The value of the portion of the separate account allocated to variable sub-accounts fluctuates with the underlying investments. Variable annuity policies are subject to early surrender charges for the first four to nine years of the contract. During the surrender charge period, the contract holder may cancel the contract for the surrender value. Jackson offers one variable annuity that has no surrender charges and also offers a choice of guaranteed benefit options within their variable annuity product portfolio, which customers can elect and pay for. These options include the guaranteed minimum death benefit (GMDB), which guarantees that, upon death of the owner, the beneficiary receives a minimum value regardless of past market performance. These guaranteed death benefits might be expressed as the return of original premium, the highest past anniversary value of the contract, or as the original premium accumulated at a fixed rate of interest. In addition, there are three other types of guarantees: guaranteed minimum withdrawal benefits (GMWB), guaranteed minimum accumulation benefits (GMAB) and guaranteed minimum income benefits (GMIB).
GMWBs provide a guaranteed return of the principal invested by allowing for periodic withdrawals that are limited to a maximum percentage of the initial premium. One version of the GMWBs provides for a minimum annual withdrawal amount that is guaranteed for the contract holder’s life without annuitisation. Variations of the GMWBs are offered whereby the guaranteed base can be increased, either through step-ups to a more recent market value of the account, or through bonuses offered if withdrawals are delayed for a particular number of years. Additional charges are assessed for these features. GMABs generally provide a guarantee for a return of a certain amount of principal after a specified period. This benefit was eliminated from Jackson’s product offerings in 2011. GMIBs provide for a minimum level of benefits upon annuitisation regardless of the value of the investments underlying the contract at the time of annuitisation. Jackson stopped offering GMIBs in 2009, with existing coverage being reinsured with an unaffiliated reinsurer.
As the investment return on the separate account assets is attributed directly to the contract holders, Jackson’s profit arises from the fees charged on the contracts, less the expenses incurred, which include the costs of hedging and the eventual payment of benefits guarantees. The net hedge results are reflected in short-term fluctuations. In addition to being a profitable book of business in its own right, the variable annuity book also provides an opportunity to utilise the offsetting equity risk among various lines of business to manage in a cost-effective manner our equity exposure. Profits in the variable annuity book of business will continue to be subject to the impact of market movements on both sales and allocations to the variable accounts and the effects of the economic hedging programme. While risk is hedged on an economic basis, the nature and duration of the hedging instruments, which are recorded at fair value through the income statement, will fluctuate and produce some accounting volatility. Management continues to believe that, on a long-term economic basis, the equity exposure remains well managed.
Life insuranceJackson also sells several types of life insurance including term life, universal life and variable universal life. Term life provides protection for a defined period of time and a benefit that is payable to a designated beneficiary upon the insured’s death. Universal life provides permanent individual life insurance for the life of the insured and includes a savings element. Variable universal life is a life insurance policy that combines death benefit protection with the ability for the policyholder account to be invested in separate account funds. The Jackson life insurance book has also delivered consistent profitability, driven primarily by favourable mortality experience.

93B
usin
ess rev
iew
Institutional productsJackson’s institutional products division markets institutional products such as traditional Guaranteed Investment Contracts (GICs), Funding Agreements and Medium Term Note (MTN) funding agreements. The institutional product offerings also include Jackson’s funding agreements issued to the Federal Home Loan Bank. Institutional products are distributed directly to investors, through investment banks, or through funding agreement brokers. Jackson sold no institutional products during 2010 or 2009, as available capital was directed to support higher- margin variable annuity sales. In 2011, Jackson re- entered the institutional market on a limited and selective basis, taking advantage of the high returns available at particular times during the year.
United KingdomIn common with other UK long-term insurance companies, Prudential UK’s products are structured as either with-profits (or participating) products, or non-participating products including annuities in payment and unit-linked products. Depending on the structure, the level of shareholders’ interest in the value of policies and the related profit or loss varies.
With-profits policies are supported by a with-profits sub-fund and can be single premium (for example, Onshore Bonds or Flexible Investment Bonds) or regular premium (for example, certain pension products). Prudential UK’s primary with-profits sub-fund is part of The Prudential Assurance Company Limited’s (PAC) long-term fund. The return to shareholders on virtually all with-profits products is in the form of a statutory transfer to PAC shareholders’ funds. This is analogous to a dividend from PAC’s long-term fund, and is dependent upon the bonuses credited or declared on policies in that year. Prudential’s with-profits policyholders currently receive 90 per cent of the distribution from the main with-profits sub-fund as bonus additions to their policies, while shareholders receive 10 per cent as a statutory transfer.
The Defined Charge Participating Sub-Fund (DCPSF) forms part of the PAC long-term fund. It is comprised of the accumulated investment content of premiums paid in respect of the defined charge participating with-profits business issued in France and the defined charge participating with-profits business reassured into PAC from Prudential International Assurance plc and Canada Life (Europe) Assurance Ltd. It also includes the portfolio of with-profits annuity policies acquired from Equitable Life in 2007. All profits in this fund accrue to policyholders in the DCPSF.
The profits from almost all of the new non-participating business accrue solely to shareholders. Such business is written in the non-profit sub-fund within PAC’s long-term fund, or in various shareholder-owned direct or indirect subsidiaries. The most significant of these is Prudential Retirement Income Limited (PRIL), which also writes all new immediate annuities arising from vesting deferred annuity policies in the with-profits sub-fund of PAC. There is a substantial volume of in-force non-participating business in PAC’s with-profits sub-fund and that fund’s wholly owned subsidiary Prudential Annuities Limited (PAL), which is closed to new business. Profits from this business accrue to the with-profits sub-fund.
Description of EEV basis reporting Prudential’s results are prepared on two accounting bases – the supplementary EEV basis, and the IFRS basis for the financial statements. Over the life of any given product, the total profit recognised will be the same under either the IFRS or the EEV basis. However, the two methods recognise the emergence of that profit in different ways, with profits emerging earlier under the EEV basis than under IFRS. This section explains how EEV differs from IFRS and why it is used.
In broad terms, IFRS profits for long-term business reflect the aggregate of statutory transfers from UK-style with-profits funds and profit on a traditional accounting basis for other long-term business. By their nature, the products sold by the life insurance industry are long-term, as insurance companies commit to service these products for many years into the future. The profit on these insurance sales is generated over this long-term period. In our view, the result under IFRS does not properly reflect the inherent value of these future profits, as it focuses instead on the amounts accruing to shareholders in the current year.
In May 2004 the CFO Forum, representing the Chief Financial Officers of 19 European insurers, published the European Embedded Value Principles (expanded by the Additional Guidance of EEV Disclosures published in October 2005), that provide consistent definitions, a framework for setting actuarial assumptions, and a more explicit approach to the underlying methodology and disclosures. So for example:
• The allowance for risk is explicit for EEV through: (i) an allowance for the cost of capital (at the higher of economic capital and the local statutory minimum), (ii) stochastic or other appropriate modelling of financial options and guarantees to ensure that an allowance for their cost is irrespective of their value at the balance sheet date, and (iii) an explicit allowance in the risk discount rate for financial and non-financial risks;
• EEV specifically allows for the look-through into profits arising in shareholder service companies, most notably the profit arising in investment management companies from managing the insurance companies funds for covered business;
• There are extensive disclosures required for EEV on all aspects of the calculations, including the methodology adopted and the analysis of return.

94
Prudential plc Annual Report 2011
Business review | Other corporate information | continued
Other corporateinformation
It is thought that the EEV basis not only provides a good indication of the value being added by management in a given accounting period, but also helps demonstrate whether shareholder capital is being deployed to best effect. Indeed insurance companies in many countries use comparable bases of accounting for management purposes.
The EEV basis is a value-based method of reporting in that it reflects the change in value of the business over the accounting period. This value is called the shareholders’ funds on the EEV basis which, at a given point in time, is the value of future profits expected to arise from the current book of long-term insurance business plus the net worth of the company. In determining these expected profits, full allowance is made for the risks attached to their emergence and the associated cost of capital, and takes into account recent experience in assessing likely future persistency, mortality and expenses.
The change in value is typically analysed into the following components:
• the value added from new business sold during the year,
• the change in value from existing business already in place at the start of the year,
• short-term fluctuations in investment returns,
• change in economic assumptions,
• change in the time value of cost of options and guarantees and economic assumption changes,
• other items (for example, profit from other Group operations, tax, foreign exchange, exceptional items), and
• dividends.
The value added from new business – defined as the present value of the future profits arising from new business written in the year – is a key metric used in the management of our business. The change in value of business in-force at the start of the year demonstrates how the existing book is being managed. Together, these metrics provide management and shareholders with valuable information about the underlying development of the Group’s business and the success or otherwise of management actions.
EEV basis results are prepared by first of all setting ‘best estimate’ assumptions, by product, for all relevant factors including expenses, surrender levels and mortality. Economic assumptions as to future investment returns and inflation are generally based on a combination of market data and long-term assumptions. These assumptions are used to project future cash flows. The present value of the future cash flows is then calculated using a discount rate which reflects both the time value of money and the risks associated with the cash flows. The risk discount rate is determined by adding a risk margin to the appropriate risk free rate of return. The actual outcome may differ from that projected, in which case the effect will be reflected in the experience variances for that year.
The assumptions used for the EEV basis of accounting are set out in the notes that accompany the supplementary EEV basis information. An indication of the sensitivity of the results to changes in key assumptions is also provided within that information.

95B
usin
ess rev
iewBusiness review | Corporate responsibility review
Corporate Responsibility (CR) is integral to the way we do business at Prudential. Our CR activities during 2011 continued to be guided by the Chairman, Harvey McGrath.
This review gives an overview of our activities and progress. Prudential also publishes an annual CR report which is available online at www.prudential.co.uk
Creating social and economic valueAs a business that provides savings, income, investment and protection products and services we create social value through our day-to-day operations. First, we provide customers with ways to help manage uncertainty and build a more secure future. Second, by playing a key role in financial markets, we provide long-term capital that finances businesses, builds infrastructure and fosters growth in both developed and developing countries.
At Prudential we aim to be sustainable in the broadest sense – financially, socially and environmentally. Sustainability is integral to the way we do business. We have long-term liabilities and investments, and our commitments to our customers and our employees, as well as our support for communities and our responsibility towards the environment, are rooted in our aim of continuing to deliver strong financial performance sustainably.
We believe that CR is best managed on the ground by those closest to the customer and local stakeholders. Underpinning this approach are our four global CR themes (see panel below).
These themes demonstrate our CR commitments and principles to our stakeholders and provide clarity to our businesses on where they should focus their CR efforts and resources in the context of their individual markets.
Our customers Today we serve more than 26 million customers in diverse markets where people’s specific savings, investment and protection needs are different. However, what is common among all our customers is that the financial decisions they make are among the most important of their lives.
We do not underestimate how important these decisions are for our customers, nor do we take for granted the trust they place in us to deliver for them over the long term. Our customers have made a choice to purchase from us, and we value highly their decision and their loyalty.
We want our customers to stay with us for the long term. We know this means we must constantly listen to them to understand their changing needs, and that we must provide them with fair and transparent products – and customer service – that maintains their trust and faith in our business.
Our Customer Charter, which is available on the Prudential plc website at www.prudential.co.uk/prudential-plc/cr/ cr-principles/customer-charter/ highlights our commitments to our customers. These commitments, together with our customer insights research and ongoing dialogue with our customers, help us to shape the products we develop and the service we deliver.
We are in no doubt that good customer service and performance are critical to our reputation and, across all our markets, we constantly monitor this and take action when required. In 2011 our customer service and performance continued to be recognised through a number of awards and industry rankings.
Corporate responsibility review
Our four global CR themes
1. Our customersUsing our financial strength, knowledge and skills to provide fair and transparent products, which meet customers’ needs.
2. Our peopleRecruiting, developing and retaining the best people for the best-performing business.
3. The environment Increasing the efficiency of our business by reducing the direct impact of the properties we occupy and the properties we manage as part of our investment portfolio.
4. Our communities Supporting our communities through donations, employee volunteering and long-term partnerships with charitable organisations that make a real difference.
‘ Sustainability is integral to the way we do business. We have long-term liabilities and investments, and our commitments to our customers and our employees, as well as our support for communities and our responsibility towards the environment, are rooted in our aim of continuing to deliver strong financial performance sustainably.’

96
Prudential plc Annual Report 2011
Business review | Corporate responsibility review | continued
Corporate responsibility review
Customer service and performance awards in 2011
Prudential Corporation Asia ‘Best in Achieving Total Customer Satisfaction in Life Insurance Category’, Indonesia Customer Satisfaction Awards 2011 – SWA Magazine
‘Best-in-Class for Japan Equity in Asia’, Benchmark Fund of the Year Awards 2011 in Singapore
‘Best Contribution in Investor Education and Category Enhancement – Mutual Fund’, The Bloomberg UTV Financial Leadership Awards 2011 in India
Jackson ‘World Class’ customer service by Service Quality Measurement Group. This marked the sixth consecutive year in which the company has received both the ‘World Class’ designation for call centre customer satisfaction and a ‘Highest Customer Satisfaction by Industry’ award, achieving the highest rating in financial services1
Prudential UKFive-star rating in the ‘Financial Adviser Service Awards’ in the investment providers and packagers category for a third year running, and five stars for life and pensions
Five-star rating from independent product research company Defaqto for several investment and pension products
‘Best Investment Bond Provider’ in the Moneyfacts Investment Life & Pensions Awards
M&GOBSR Honours 2011, ‘Outstanding Investment House’
Financial News Awards for Excellence in Institutional Asset Management, ‘Fixed Income Manager of the Year 2011’
European Pensions Awards 2011, ‘Fixed Income Manager of the Year’
Morningstar European Fund Awards 2011, Graham French – ‘Best Manager – Global Equity’
Professional Adviser Awards 2011, ‘Best Fixed Interest Group (UK and International)’
Professional Adviser Awards 2011, ‘Best UK Growth Group’
PCA – serving growing societiesIn Asia we serve more than 16 million customers with a mix of life insurance, pensions, mutual funds, consumer finance, asset management and health and protection products.
Particularly in the emerging markets of South-East Asia, the demand for savings and protection products continues to grow as people seek greater financial security and peace of mind. We continue to broaden our offering to help meet our customers’ goals.
Health care is one example of where protection continues to be increasingly important in many markets across Asia, and in 2011 we further evolved our health-related cover with the launch of PRUearly stage crisis cover.
The majority of critical illness cover in the region only provides benefits at the more advanced stages of illness, which can leave a financial burden during the early stages of diagnosis. To help provide greater peace of mind – and enable customers to seek earlier-stage treatment and recovery – last year we launched PRUearly stage crisis cover, which provides financial support in the early stages of diagnosis.
Beyond health, we recognise the importance of providing practical information and training to help educate young people in the region about the need to prepare for their financial future. We have also introduced new products that help to cater to this need, and PRUlife ready, introduced in 2011, is one example. This is a savings product for young adults, which rewards policyholders as they reach different phases of their lives, including marriage, childbirth and purchasing a home.
Across the region we have a highly trained tied agency force, and we provide ongoing training to both new and experienced agents so that they can deliver the best possible service for our customers. For example, in Indonesia our fully licensed agents receive training at Prudential training centres and accredited institutions, such as the University of Indonesia, to enhance their skills and gain professional qualifications.
Note1 Service Quality Measurement Group benchmarks more than
450 North American contact centres annually, and has evaluated customer satisfaction for contact centres since 1996.
97B
usin
ess rev
iew
Throughout 2011, Prudential Corporation Asia also continued to provide a range of tools to help financial advisers and service representatives identify and meet consumers’ needs. For example, an iPad application was launched in Hong Kong integrating advice, sales and service. In Malaysia and Singapore, we continued to develop PRUway, a tool which helps advisers to tailor financial solutions based on an analysis of their customers’ needs.
We strive to live up to our brand promise in the region of always listening, always understanding, and regularly monitor our customers’ trust in us. In 2011 our customer retention rates across the region were maintained at 93 per cent1, and 42 per cent of new business was derived from existing customers.
The prestigious Top 1,000 Asia Brands survey, published in 2011 by Campaign Asia-Pacific and based on over 3,000 consumer interviews from across the region, placed Prudential in the top quartile of all brands in the region for trust and reputation.
This has also been validated by our brand-tracking studies in 2011, with increased trust scores in Singapore, Hong Kong and Malaysia.
Jackson – providing security in uncertain timesFounded over 50 years ago, Jackson National Life is one of the largest life insurance companies in the United States, providing retirement savings and income solutions, with more than 2.9 million policies and contracts in force.
The United States is the world’s largest retirement saving market, with more than 78 million ‘baby boomers’2 moving into retirement each year.
The economic downturn and demographic changes have led many people to be unprepared as they approach retirement. In 2011 Jackson continued to implement its educational programme, Retirementology, which is designed to help people understand how better to prepare for their financial future.
As well as Jackson’s reputation for financial stability, the company is widely recognised as one of the leading providers of variable annuities, which provide greater security to customers in times of economic uncertainty.
Jackson’s products are sold through banks and broker dealers and last year we continued to increase the number of advisers selling our variable annuity products to more than 140,000 – up 10,000 from 2010 – to make them more widely available to customers.
Jackson forges long-lasting strong relationships with its distribution partners and was ranked number one in the sector for advocacy and loyalty among advisers in the Cogent 2011 Advisor Brandscape Report.3
Jackson also maintained its reputation as a customer service leader last year when it was rated a ‘World Class’ customer service provider – for the sixth consecutive year – by Service Quality Measurement Group (SQM) in its latest benchmark study of North American contact centres. In the same study we also received the ‘Highest Customer Satisfaction by Industry’, achieving the highest rating in the financial services industry.
Prudential UK – helping customers through economic difficultiesIn the UK, continuing difficult economic conditions have led customers, more than ever, to seek financial products that offer them the highest level of security from companies they feel they can trust.
Annuities are a key product for Prudential UK and market rates were at a historic low during 2011. This means that it is more important than ever for customers looking to take income from their pensions to make informed choices.
In 2011, a new Customer Relationship Team was established to provide support directly to those customers seeking further information to help them with this important decision.
Notes1 Excludes India.2 Source: US Census Bureau.3 The annual Cogent report is a key industry benchmark study
surveying 1,643 advisers.
98
Prudential plc Annual Report 2011
Business review | Corporate responsibility review | continued
Corporate responsibility review
There is also a growing demand for face-to-face advice, especially for investment and retirement planning. In response, we have set up a new service – Prudential Financial Planning – which was piloted during 2011.
Our UK customer service performance is continuously monitored through a telephone research service which gauges customer experience1. Throughout 2011 we achieved a 96.6 per cent satisfaction level. This compares with a financial industry average of 91.8 per cent. Of those customers who had contact with the new Customer Relationship Team, 98 per cent agreed that they felt valued as a result.
We are one of 23 members of the Association of British Insurers that participate in an annual Life & Savings Benchmarking Study, which seeks to drive continuous improvement through monitoring customers’ experiences. In 2011 we began a programme of service initiatives designed to make it easier for customers to deal with us. This is already delivering results, as evidenced by our overall satisfaction score for customer service rising to 84 per cent in 2011/12 – up from 81 per cent in 2010, which is the current industry average.
We are committed to responding to customer concerns quickly and efficiently. The details of our approach to customers are published on the Prudential UK website in line with FSA guidance at www.pru.co.uk/about_us/complaints_data/ Prudential UK fell into the best-performing 15 per cent of financial companies included in data published by the Financial Ombudsman Service.
We actively review our operational processes, as we seek to continually improve the level of service we deliver. Some examples include: enabling advisers to submit and track new business applications online; continued reductions in the transfer times between annuity providers; streamlining of the claims payment process; earlier engagement with mortgage providers where we need to understand if they have any further legal interest in a forthcoming maturing, and better use of automated payment technology.
Our financial strength, longstanding commitment to building customers’ trust and listening to our customers have never been more important than during these difficult economic times. A core focus for Prudential UK in 2011 was monitoring the strength of trust in our brand and our understanding of customers’ needs. Independent tracking research – conducted in November 2011 by Opinion Research – identified us as one of the three most trusted life and pension providers in the UK.
Asset management – a history of trustM&G, Prudential’s UK and European asset management business, has served retail and institutional investors for over 80 years, investing customers’ money in equities, fixed income and real estate.
M&G is a long-term investor that takes its responsibilities as a shareholder seriously, often working closely with the management of the companies in which it invests. Active voting is an integral part of M&G’s investment approach. We believe that exercising our votes both adds value and protects our interests as shareholders. The M&G website provides an overview of voting history: www.mandg.co.uk/Corporate/CorporateResponsibility/CorporateGovernance/ Votinghistory.jsp
At a time when security is a particularly high priority for customers, M&G’s retail business launched the European M&G Inflation Linked Corporate Bond Fund, enabling savers to protect their investments in corporate bonds from rising prices.
M&G’s institutional business also added to its stable of inflation- linked products for pension funds with a new UK social housing debt fund, in addition to £2 billion already invested in the sector.
The business also continues to advance into lending markets that were once the preserve of banks, notably in commercial mortgages and lending to companies.
In 2011, M&G’s UK Companies Financing Fund, set up in 2009 to help fill the lending gap left by banks in the wake of the financial crisis, lent £505 million to mid-cap UK companies.
Note1 Viewscast independent research run by IPSOS Mori.
‘ In 2011, M&G’s UK Companies Financing Fund, set up in 2009 to help fill the lending gap left by banks in the wake of the financial crisis, lent £505 million to mid-cap UK companies. ’

99B
usin
ess rev
iew
M&G continues to have one of the highest trust scores among sector peers. For the intermediary audience we ranked number one for trustworthiness1, and for private investors we ranked, on average, within the top two most trusted asset management brands in 20112.
Informing global debatesAs a business that is built around a long-term perspective, we actively participate in global debates and policy considerations that affect our customers by sharing our knowledge and insights.
The complexities and challenges surrounding ageing populations have significant policy implications in many countries around the world. Through our partnership with the Washington DC-based think tank, the Center for Strategic and International Studies (CSIS) we have continued to contribute to the debate during 2011, through events and seminars with policymakers promoting the Global Aging Preparedness Index.
This Index, sponsored by Prudential, is a detailed study evaluating the preparedness of 20 of the world’s emerging and established economies resulting from demographic changes.
A copy of the report is available at http://gapindex.csis.org
In 2011, we commissioned additional demographic research in partnership with CSIS, looking in further detail at retirement expectations in Asia. The findings of the study, which will be shared with policymakers, will be available in 2012.
We are also actively engaged with a number of institutions, such as the International Centre for Financial Regulation, in promoting the understanding of the broader socio-economic contribution made by insurance. As part of this we have been promoting the need to ensure that this is properly recognised as a key part of the debate around future rule-making in the sector.
Our peopleAcross the Group, we employ more than 26,000 people. It is vital to our continued success that we create an environment that develops and retains committed and motivated people, people who are able to achieve excellence and deliver outstanding performance for our customers, our shareholders and our communities.
To achieve this our people strategy focuses on four areas.
Employee engagement Across Prudential we encourage an ongoing dialogue with our employees through events such as ‘open forums’. These allow employees to hear directly from their executive teams and raise questions. There are also a number of employee consultation forums in place, such as the M&G Staff Consultative Committee and the UK Employee Forum within Prudential UK. Our UK business also has a long-standing relationship with the union Unite. In addition, our dedicated intranet sites allow us to share information.
Engaging effectively with our employees is critical to building and sustaining a high-performing business and retaining talent within Prudential. We conduct surveys in our businesses to monitor levels of engagement with Prudential as an employer, identify the effectiveness of our organisation’s structures and practices and highlight areas for improvement. Our successful approach to employee engagement in our UK business was recognised at workingmums.co.uk’s Top Employer Awards in October 2011. We were also commended for our commitment and strategy enabling colleagues, at all levels, to provide feedback on policies such as flexible working, and a willingness to take this on board.
Across our businesses we also encourage employee volunteering to support charitable organisations and we recognise that such initiatives not only bring advantages to the charities but also provide development opportunities for our employees. For example, employees from our Asian businesses travelled to Japan and spent time supporting recovery efforts following the earthquake in March; while, in the UK, we provide time for employees to act as mentors through the Social Mobility Foundation.
Notes1 Source: ORC International Investrack Syndicated Research,
August 2011.2 Source: TNS Tracking Research Dec 2011 – UK Private Investors.

100
Prudential plc Annual Report 2011
Business review | Corporate responsibility review | continued
Corporate responsibility review
DiversityAt Prudential we provide opportunities for our people regardless of their gender, ethnicity, disability status, age, religion, caring responsibilities or sexual orientation. Our policies are guided by the principles of the UN’s Universal Declaration of Human Rights and the International Labour Organisation’s core labour standards. These are also incorporated into our Group Code of Business Conduct, which sets individual standards of employee behaviour. This is made available to all employees on our Group intranet.
The diversity of our employees across the Group is fundamental to the growth and success of the business. We believe that great companies not only accept diversity, but also recognise it as a source of innovation and competitive advantage.
Talent managementTalent management takes place at both overall Group level and locally within each of our businesses. All employees are encouraged to take responsibility for driving their own development and agreeing a development plan with their manager. To support them, Prudential provides ongoing development activities.
At Group level the emphasis is on succession planning for senior roles and development of our overall leadership talent pipeline. Through periodical reviews, the Group Executive Committee ensures that we have a flow of suitable candidates to fill key roles across the organisation. In support of this we have a number of Group-wide programmes including:
• Future Forum – which brings together key leadership talent from across the Group to network, develop their thinking and share ideas for application in the business; and
• Momentum – which recruits talented individuals early on in their careers and, through structured development and role rotations, prepares them for senior roles within the organisation.
At a local level, building a strong technical and commercial leadership pipeline is essential to the success of our business strategy. Some examples of our commitment to developing talent within our businesses are:
• Prudential Corporation Asia: Identifying the right talent and leaders is critical to supporting the expansive growth of our Asian business. In 2011 we cascaded a consistent approach to our development centres, where we identify the next generation of leaders. We believe there is considerable untapped talent in our employee base and building leadership capability will continue to be a focus in 2012.
• Jackson: The Jackson University provides business-specific development activities for employees. Jackson’s senior management team play a key role in shaping the curriculum, ensuring it aligns to key corporate initiatives for the business. In addition, the LEAP programme, launched in January 2011 and targeted at senior leaders within Jackson, aims to accelerate their leadership potential and organisational impact.
• Prudential UK: Career development centres are held for middle managers, focusing on their career aspirations and the opportunities available to them.
• M&G: Participation in one of M&G’s Leadership and Talent Development Programmes is identified through the business succession planning process. The programmes are designed to create focused learning networks and active talent communities. Examples include:
• The Cornerstone Programme: Focused on developing individuals with the potential to excel among senior management;
• The Catalyst Programme: Aimed at more junior talent and focused on developing them into wider and more senior roles;
• The Investor Development Programmes: Focused on enabling investment talent to drive investment and business success.
• Group Head Office: The ‘Enhance’ programme offers employees the opportunity to hone their skills for working effectively and includes development in areas such as cross-cultural awareness and building effective partnerships.
101B
usin
ess rev
iew
Performance and rewardThe performance objectives of our employees are linked to the delivery of business goals. Throughout the year, employees are engaged in regular reviews with their managers to understand how they are performing against their objectives.
Each individual contributes to the success of the Group and should be rewarded accordingly. Our reward system ensures that overall Group and specific Business Unit results, as well as individual performance and behaviours, are fairly reflected in each employee’s remuneration. These policies and structures are regularly reviewed to ensure that they are appropriate and competitive in the markets in which we operate, and that they remain aligned with our business plans and priorities.
We believe it is important for our employees to have the opportunity to benefit from the Group’s success through share ownership. In the UK, we operate two all-employee share plans: a Share Incentive Plan (SIP) and a Save As You Earn (SAYE) scheme. In 2011, 64 per cent of eligible employees participated in one or both of these plans. In Asia, we operate two SAYE schemes, similar to those in the UK. Almost a quarter of eligible employees and 18 per cent of eligible agents participated in these schemes in 2011.
Protecting the environmentWe recognise that protecting the environment is an important part of managing a sustainable business, and that an effective environmental strategy is good both for the planet and for business efficiency.
We aim to ensure that we minimise the impact of our activities on the environment. Our strategy focuses on reducing the direct impact of the properties we occupy as well as the properties we manage through PRUPIM, which is a top-20 global real estate fund manager, with £15.8 billion of assets under management (at 31 December 2011).
Reducing our direct impact: occupied propertiesWe monitor energy consumption, carbon dioxide emissions, water consumption, waste, paper use, recycling and travel at all our UK sites, and at Jackson’s main premises in North America in Lansing, Michigan, Denver, Colorado, and Nashville, Tennessee.
In 2011 we also conducted a monitoring trial at our sites in Asia, enabling us to measure the environmental impact of those offices as a first step in improving our environmental performance in these growing markets.
In July 2011 we submitted the first year of energy consumption figures as part of the UK government’s Carbon Reduction Commitment (CRC), a mandatory energy efficiency scheme for qualifying UK public and private sector organisations.1 The government is committed to reducing national carbon emissions by 80 per cent from 1990 levels by 2050. A central part of its strategy is the introduction of the CRC, which encourages organisations to develop energy management strategies that promote a better understanding of energy use.
Under the CRC, we submitted figures covering all properties occupied in the UK by Prudential companies and the PRUPIM investment property portfolio between April 2010 and March 2011.
The CRC includes a publicly available annual performance table, which ranks participants’ energy efficiency performance. Credits were awarded for installing automatic meter readers and complying with the BSI Kitemark Energy Reduction Verification scheme, approved by the Environment Agency. As a result of verified energy savings, we were ranked number 531 from 2,103 participants, and were placed well ahead of our peers in our industry.
Under the European Union Energy Performance of Buildings Directive, Energy Performance Certificates (EPCs) are required for any building that is constructed, sold or rented. EPCs rate energy use and efficiency, enabling property investors and prospective occupiers to consider ratings and levels of carbon emissions for our occupied and commercial properties in the UK. In 2011 we retained ISO 14001 environmental management certification for all our UK occupied properties.
In the US, Jackson has also focused on reducing energy use. For example, high-efficiency, extreme-density air-conditioning units were installed during the construction of a new data centre. Jackson also installed two units at its existing data centre, to increase energy efficiency and cooling capacity. In addition, low-energy lighting has been installed at its headquarters.
Note1 To qualify for the CRC companies must have at least one half-hourly
meter, settled on the half-hourly market across the whole organisation, with total half-hourly electricity consumption over 6,000 MWh after usage for transport and domestic accommodation have been excluded.

102
Prudential plc Annual Report 2011
Business review | Corporate responsibility review | continued
Corporate responsibility review
Reducing our impact: property investment portfolioPRUPIM believes that taking a lead in its approach to responsible property investment protects and enhances returns for its clients.
In 2011, PRUPIM revised its Responsible Investment Strategy to reflect its new focus on fund management. This strategy delivers a sector-leading approach to managing and responding to the growing range of environmental and social issues that can have an impact on property values, helping to protect and enhance fund and asset performance for clients. The strategy focuses on four areas: ensuring portfolio resilience, driving environmental improvements, building strong relationships, and responsibility in its own operations.
Three of the funds managed by PRUPIM were awarded a ‘Green Star’ in the Global Real Estate Sustainability Benchmark (GRESB). Around 340 real estate funds with assets worth nearly US$1 trillion participated in the benchmark, covering around 21,000 assets. Only 65 funds were awarded a GRESB Green Star and, by achieving this on three funds, PRUPIM continues to demonstrate leadership by integrating sustainability into its fund management activities.
PRUPIM’s focus on delivering environmental improvements across its managed portfolio saw it reduce its carbon emissions intensity in 2010/11 by an average of 9 per cent at UK shopping centres and ISO 14001-accredited offices, compared to a 2008/09 baseline. Nearly 63 per cent of waste from UK shopping centres was diverted from landfill. Water consumption across the entire UK investment portfolio was reduced by 12 per cent in 2010/11 compared to a 2008/09 baseline.1
PRUPIM’s approach and progress can be found in its annual Responsible Property Investment report at www.prupim.com/rpi
Supporting local communitiesFor us, part of being a long-term business means a commitment to supporting the long-term well-being of the communities in which we operate.
The social value of our business – helping customers manage uncertainty and build a more secure future, as well as our investments providing long-term capital that finances businesses, builds infrastructure and fosters economic growth – is further underpinned by our community programmes and activities.
All our businesses have community investment programmes in place, guided by committees that determine where funds are best spent.
Across the Group, our activities include a mix of charitable donations, employee volunteering schemes and charity partnerships, many of which we work with directly, on the ground, to develop and implement community projects. Our ethos is to establish long-term relationships with our charity partners to ensure that the projects we support are sustainable. We also work closely with our partners to ensure that our programmes continuously improve.
The diversity of our markets means that our programmes vary from country to country, but a common point of emphasis for our community investment is education. This includes mentoring by employees, financial education and support to improve social mobility.
Note1 Data based on PRUPIM’s reporting year from April to March.
2,415employees donated to charity through payroll giving schemes
£9.1 mGroup charitable donations – increase of over 21%
28%of employees volunteered their time to good causes in 2011
+21%increase in Group employee volunteer numbers
Local community support highlights in 2011

103B
usin
ess rev
iew
Financial educationFinancial education forms an important part of our educational activity. We believe that encouraging people to be financially literate helps to underpin overall economic development and success for communities. This is particularly true for young people at times of economic volatility.
A number of financial education projects are supported through the Chairman’s Challenge, our Group-wide volunteering programme. This includes our financial literacy projects with Junior Achievement – the worldwide charity focused on building young people’s financial skills – in the US and Asia, as well as our partnership with Plan International in Thailand. These six-year partnerships have benefited approximately 90,000 young people.
Aside from the Chairman’s Challenge, we also provide ongoing support to additional initiatives to help improve financial knowledge and understanding. In 2011, in response to the growing need for financial education for children across Asia, we launched Cha-Ching Money-Smart Kids, the first programme of its kind in the region, aimed at helping parents to instil money- smart skills in their children.
Following extensive research and working closely with Dr Alice Wilder, the award-winning researcher and child learning expert, we launched a series of three-minute musical animated short stories, broadcast on Turner Cartoon Network – the number one children’s channel in Asia – based on characters in a band and featuring financial education storylines. The episodes are shown daily, reaching over four million homes and seven markets in Asia.
Recognising Asian children’s media habits, a dedicated website – www.cha-ching.com – was developed with digital resources for parents and educators. Eighteen million website page views were recorded in the first four months of the programme, with an average website visit duration in excess of nine minutes.
In addition to on-air and online presence, we work closely with non-governmental organisations and government agencies to bring Cha-Ching to schools incorporating interactive money management activities for students.
During 2011, we also continued to run our highly successful financial training seminars for women – ‘Investing in Your Future’ – and this year more than 4,500 women in China, Indonesia and Vietnam took part. The events, supporting women with lower incomes, were first launched in China in 2004 to help women who are often responsible for planning their families’ financial needs, but who traditionally had limited financial training. Approximately 32,000 women have attended the seminars to date.
Since 2007, Prudential has also partnered with the Chinese Ministry of Education, the Chinese Academy of Social Science and the Chinese Insurance Regulatory Commission on an insurance education curriculum in schools. The programme has reached more than 26,000 students from 28 schools across seven provinces.
In the UK we have continued our partnerships with a range of organisations in support of financial education, including Citizens Advice, the Personal Finance Education Group and The Schools Network. Through our work with these organisations, thousands of adults and children are developing essential financial literacy skills, to make decisions that will have a positive effect on their financial welfare.
Prudential UK has worked with Citizens Advice since 2002, and we are now a leading partner on its Financial Skills for Life programme. Our partnership with Personal Finance Education Group began in 2001, and our funding has allowed it to maintain and develop its Quality Mark accreditation system for financial capability teaching resources. Also in the UK, an online financial education training tool in partnership with The Schools Network attracted 8,700 visits in 2011. The resource, called ‘Adding Up to a Lifetime’, has been used in English schools since 2006.

104
Prudential plc Annual Report 2011
Business review | Corporate responsibility review | continued
Corporate responsibility review
Improving education and skillsAnother element of our education activity is Prudential UK’s partnership with Business in the Community, which includes the Business Class programme, for which we are a National Champion. Our three-year commitment involves working in partnership with local schools in Reading, Stirling and Westminster to develop a strategic plan to support them in areas such as leadership and governance, the curriculum and employability.
We also support projects that encourage people from low-income backgrounds into leading educational institutions. M&G has a longstanding relationship with the Social Mobility Foundation – www.socialmobility.org.uk – which helps high-achieving young people from low-income backgrounds to get into top universities and professions. The Social Mobility Foundation is supported through charitable donations, formal internships and mentors drawn from senior employees, who are matched with students to provide guidance and support. The charity Springboard for Children also received assistance from M&G in 2011, supporting literacy programmes in schools.
Our intention for the future is to increase the level of support we provide to education. Especially in the UK, where the difficult economic conditions mean that youth unemployment is a growing problem, there is an increasing need for initiatives that can drive educational improvement and help get people into work. As part of that ambition, in 2012 we plan to increase our commitment to apprenticeship schemes in the UK, as well as establishing further long-term partnerships with charities working in education.
Supporting children beyond educationAs well as its education support through our global partnership with Junior Achievement, Jackson has a community fund that matches its employees’ donations to approved charities on a two-to-one basis, which includes donations to children’s causes around Jackson’s sites. In addition, in 2011 Jackson continued to partner with the Big Brother Big Sister – the oldest and largest youth mentoring organisation in the US – providing employee mentors for at-risk youth.
In 2011, M&G continued to support children and youth organisations working with disadvantaged young people. This included support for: Leap, a UK charity specialising in youth and conflict resolution; Kids Company, which provides practical, emotional and educational support to vulnerable inner-city children; and Blind in Business, which helps blind and partially sighted students to make the transition from education to employment. Last year, selected employees from Prudential UK were trained to mentor young people on a one-to-one basis for 12 months.
Employee volunteeringIn 2011, 7,209 employees across the Group volunteered in their communities on a range of projects, an increase of nearly 21 per cent in the number of volunteers compared with 2010. At Prudential UK alone, 40 per cent of employees took part in volunteering during 2011. Activities across the Group varied from supporting financial literacy through programmes such as the Investing in Your Future seminars and the Insurance Education Programme in Asia, providing support to local charities benefiting children and the elderly in the US, and mentoring schoolchildren, supporting the elderly and skills- sharing with charities in the UK. We recognise that employee volunteering brings benefit not only to the charities but also to the development of our people, and we actively encourage colleagues to participate in our volunteering programmes.
Chairman’s ChallengeMany of our volunteers are involved in our flagship volunteering programme, the Chairman’s Challenge, which was launched six years ago. Since then 133 projects have been supported by our employees in partnership with charities. In 2011, more than 3,000 employees signed up as Chairman’s Challenge volunteers, an increase of 14 per cent on 2010. Last year, our office in Mumbai joined the programme for the first time and 23 per cent of employees participated. All of the projects included in the Chairman’s Challenge receive a financial donation from the Group for each employee who signs up as a volunteer and five shortlisted projects receive additional funding.
3,000+employees signed up as Chairman’s Challenge volunteers, +14% on 2010

105B
usin
ess rev
iew
Chairman’s Challenge Winner 2011Each year employees across the Group vote for the shortlisted project they believe has made the greatest impact. In 2011, the winning project, as voted for by employees, was ‘Learning about Earning’. This programme – in partnership with Prestasi Junior, the Indonesian branch of Junior Achievement – benefited over 200 street children at a safe house in Jakarta, through the commitment of over 170 employees from our Indonesian business, who helped children to develop basic communication and financial skills.
Shortlisted projects 2011• Junior Achievement, Hong Kong: more than 1,700 students
benefited from financial management workshops run by over 290 Prudential Assurance Hong Kong volunteers;
• Junior Achievement, US: 176 Jackson employees dedicated 651 hours to educating young people in financial literacy skills;
• Plan International, Thailand: 230 Prudential employees in Thailand conducted a variety of educational programmes on financial management and disaster relief, benefiting more than 300 students; and
• Prudential UK: 65 employees dedicated 1,884 hours to Age UK’s Call in Time programme, which supports over 500 isolated older people.
Disaster reliefThe Group maintains a disaster relief fund which can be activated to support relief efforts following disasters in countries where we operate. Our commitment to disaster relief also often goes beyond financial aid, with our people helping on the ground.
During 2011, 37 volunteers from 10 countries spent nine days in Japan supporting relief efforts following the earthquake and tsunami that struck the country in March. The team partnered with local NPO Project Yui, based in Ishinomaki, in the Miyagi prefecture, which was one of the worst-hit areas, assisting with logistics, clearing debris and mentoring children displaced by the tsunami. Prudential Corporation Asia’s Caring Fund also made a donation to the relief effort, and donations made by colleagues were matched by the business.
In 2011 the Group continued to be a partner of Save the Children through support for its Children’s Emergency Fund.
DonationsWe calculate our community investment spend using the internationally recognised London Benchmarking Group standard. This includes cash donations to registered charitable organisations, as well as a cash equivalent for in-kind contributions.
In 2011, the Group spent £9.1 million supporting community activities, an increase of 21.3 per cent on 2010.
The direct cash donations to charitable organisations amounted to £7.2 million, of which approximately £2.8 million came from our EU operations, which are principally our UK insurance operation and M&G.
The cash contribution to charitable organisations from our EU operations is broken down as follows: education £1,211,000; social and welfare £1,371,000; environment and regeneration £27,000; cultural £74,000 and staff volunteering £93,000.
The cash contribution to charitable organisations from Prudential’s non-EU operations – Jackson National Life Insurance Company and Prudential Corporation Asia – amounted to £4.4 million.
It is the Group’s policy not to make donations to political parties nor to incur political expenditure, within the meaning of those expressions as defined in the Political Parties, Elections and Referendums Act 2000. The Group did not make any such donations or incur any such expenditure in 2011.

106
Prudential plc Annual Report 2011
Business review | Corporate responsibility review | continued
Corporate responsibility review
Accountability and governanceThe BoardThe Board discusses the Group’s CR performance at least once a year and also reviews and approves the Group CR Report and strategy on an annual basis.
Responsibility CommitteeBelow the Board, the Responsibility Committee comprises senior representatives from relevant Group functions and each of our core businesses. This committee is responsible for monitoring the Group’s CR activities and reviewing CR policies.
Code of Business ConductConsideration of environmental, social and community matters is integrated in our Code of Business Conduct. Our code is reviewed by the Board on an annual basis. Refer to page 129 for more information.
Local GovernanceIn M&G, Jackson and Prudential UK there are governance committees in place – with senior management representation – which agree strategy and spend.
Payment policyIt is Group policy to agree terms of payment when orders for goods and services are placed, and to pay in accordance with those terms.
In the UK, we have signed up to the Prompt Payment Code, launched in December 2008 by the UK Department for Business, Enterprise and Regulatory Reform. In 2011, our trade creditor days, based on the ratio of amounts that were owed to trade creditors at the year end to the aggregate of the amounts invoiced by trade creditors during the year, were 22 days.
The Prompt Payment Code and its signatories can be found at www.promptpaymentcode.org.uk
Supply chain managementPrudential recognises that its own social, environmental and economic impacts go beyond the products and services it supplies to include the performance of its suppliers and contractors.
It is our policy to work in partnership with suppliers whose values and standards are aligned with our Group Code of Business Conduct.
Procurement practices in Prudential UK have been successfully accredited with the Chartered Institute of Purchasing and Supply (CIPS) certification, an industry benchmark of recognised good practice.

107107G
ov
ern
an
ce
108 Board of directors113 Governance report:
• Corporate governance• Risk governance• Corporate responsibility
governance130 Additional disclosures131 Index to principal Directors’
report disclosures
Section 3
Governance

108
Prudential plc Annual Report 2011
Board of directors
Governance | Board of directors
Chairman
Harvey McGrath Chairman and Chairman of the Nomination CommitteeHarvey McGrath was appointed as an independent non-executive director of Prudential in September 2008 and became the Chairman and Chairman of the Nomination Committee in January 2009. Harvey has a long and distinguished career in the international financial services industry, having started his career at Chase Manhattan Bank in London and New York. From 1980 to 2007 he worked for the Man Group, first as Treasurer, then Finance Director, then President of Man Inc. in New York before being appointed as Chief Executive of Man Group plc in London in 1990 and then Chairman in 2000. He left Man Group in 2007.
Harvey is also Chairman of the London Development Agency which works for the Mayor of London coordinating economic development and regeneration across London. He is the former Chairman of both London
First and the East London Business Alliance and former Vice Chairman of the London Skills and Employment Board from 2006 to 2011. In July 2011, Harvey was appointed as co-chair of the new Board of the London Enterprise Partnership (LEP).
Harvey is Chairman of Governors of Birkbeck College and trustee of a number of charities. These include New Philanthropy Capital, a research based charity which gives advice and guidance to donors and charities; the Royal Anniversary Trust, which operates the Queen’s Anniversary Prizes for Higher and Further Education; Children and Families Across Borders (CFAB), which protects the rights and welfare of children and vulnerable adults across borders; icould, an online careers resource; and the Prince’s Teaching Institute, which promotes subject based professional development for teachers. Harvey will retire from the Board in 2012 once a successor has been found. Age 60.
Group Chief Executive
Tidjane Thiam Group Chief ExecutiveTidjane Thiam has been an executive director of Prudential since 25 March 2008. He was the Chief Financial Officer until 30 September 2009 and became Group Chief Executive with effect from 1 October 2009.
Tidjane was previously Group Executive Director and Chief Executive Officer, Europe at Aviva where he worked from 2002 to 2008 and held successively the positions of Group Strategy and Development Director and Managing Director, Aviva International. Tidjane spent the first part of his professional career with McKinsey & Company in Paris and New York, serving insurance companies and banks. He then spent a number of years in Africa where he was Chief Executive and later Chairman of the National Bureau for Technical Studies and Development in Cote d’Ivoire and a cabinet member as Secretary of Planning and Development. Tidjane returned to France to become a partner with McKinsey
& Company and one of the leaders of their Financial Institutions practice before joining Aviva in 2002.
Tidjane was a non-executive director of Arkema in France until November 2009. He is a member of the Board of the Association of British Insurers (ABI) and a member of the Council of the Overseas Development Institute (ODI) in London. Tidjane is a member of the Africa Progress Panel chaired by Kofi Annan and a sponsor of Opportunity International. In January 2011, he was appointed to chair the G20 High Level Panel for Infrastructure Investment, which reported to the G20 Leaders at the G20 Summit in Cannes in November 2011. Tidjane is a member of the UK-ASEAN Business Council and of the Strategic Advisory Group on UK Trade and Investment. In January 2012, Tidjane was appointed to the Prime Minister’s Business Advisory Group. Tidjane was awarded the Légion d’Honneur by the French President in July 2011. Age 49.
1 2

109G
ov
ern
an
ce
Executive Directors
Nicolaos Nicandrou ACAChief Financial OfficerNic Nicandrou has been an executive director of Prudential and Chief Financial Officer since October 2009. Before joining Prudential, he worked at Aviva, where he held a number of senior finance roles, including Norwich Union Life Finance Director and Board Member, Aviva Group Financial Control Director, Aviva Group Financial Management and Reporting Director and CGNU Group Financial Reporting Director. Nic started his career at PriceWaterhouseCoopers
where he worked in both London and Paris. Age 46.
Robert DeveyExecutive DirectorRob Devey has been an executive director of Prudential and Chief Executive, Prudential UK and Europe since November 2009. Rob joined Prudential from Lloyds Banking Group where he worked from 2002 in a number of senior leadership roles across insurance and retail banking. Prior to joining Lloyds Banking Group Rob was a consultant with the Boston Consulting Group (BCG) in the
UK, US and Europe. Rob chairs the London Leadership Team of Business in The Community and is also a trustee of the LloydsTSB Foundation for England and Wales. Age 43.
John FoleyExecutive DirectorJohn Foley has been an executive director of Prudential and Group Chief Risk Officer since January 2011. He joined Prudential as Deputy Group Treasurer in 2000 before being appointed Managing Director, Prudential Capital (formerly Prudential Finance (UK))
and Group Treasurer in 2001. He was appointed Chief Executive of Prudential Capital and to the Group Executive Committee in 2007. Prior to joining Prudential, John spent three years with National Australia Bank as General Manager, Global Capital Markets. John began his career at Hill Samuel & Co Limited where, over a 20 year period, he worked in every division of the bank, culminating in senior roles in risk, capital markets and treasury of the combined TSB and Hill Samuel Bank. Age 55.
Michael McLintockExecutive DirectorMichael McLintock has been an executive director of Prudential since September 2000. He is also Chief Executive of M&G, a position he held at the time of M&G’s acquisition by Prudential in 1999. Michael joined M&G in 1992. He previously also served on the board of Close Brothers Group plc as a non-executive director from 2001 to 2008. Since October 2008, he has been a Trustee of the Grosvenor Estate and was appointed as a non-executive director of Grosvenor Group Limited in March 2012. He has also been a member of the Finance Committee of the MCC since October 2005. Age 50.
Barry Stowe Executive DirectorBarry Stowe has been an executive director of Prudential since November 2006, and Chief Executive, Prudential Corporation Asia since October 2006. He has been a member of the Board of Visitors of Lipscomb University since May 2009 and was a director of the Life Insurance Marketing Research Association (LIMRA) and the Life Office Management Association (LOMA) from October 2008 to October 2011. Previously, Barry was President, Accident & Health Worldwide for AIG Life Companies. He joined AIG in 1995, and prior to that was President and CEO of Nisus, a subsidiary of Pan- American Life, from 1992 to 1995. Before joining Nisus, Barry spent 12 years at Willis Corroon in the US. Age 54.
Michael Wells Executive DirectorMike Wells has been an executive director of Prudential since January 2011 when he succeeded Clark Manning as President and CEO of Jackson National Life Insurance Company. Mike has served in a variety of senior and strategic positions at Jackson over the last 15 years, including President of Jackson National Life Distributors. Mike has been Vice Chairman and Chief Operating Officer of Jackson for the last nine years. During this period he has led the development of Jackson’s variable annuity business and been responsible for IT, strategy, operations, communications, distributions, Curian and the retail broker dealers. Age 51.
76 8
43 5
1 Harvey McGrath2 Tidjane Thiam3 Nicolaos Nicandrou ACA4 Robert Devey5 John Foley6 Michael McLintock7 Barry Stowe8 Michael Wells
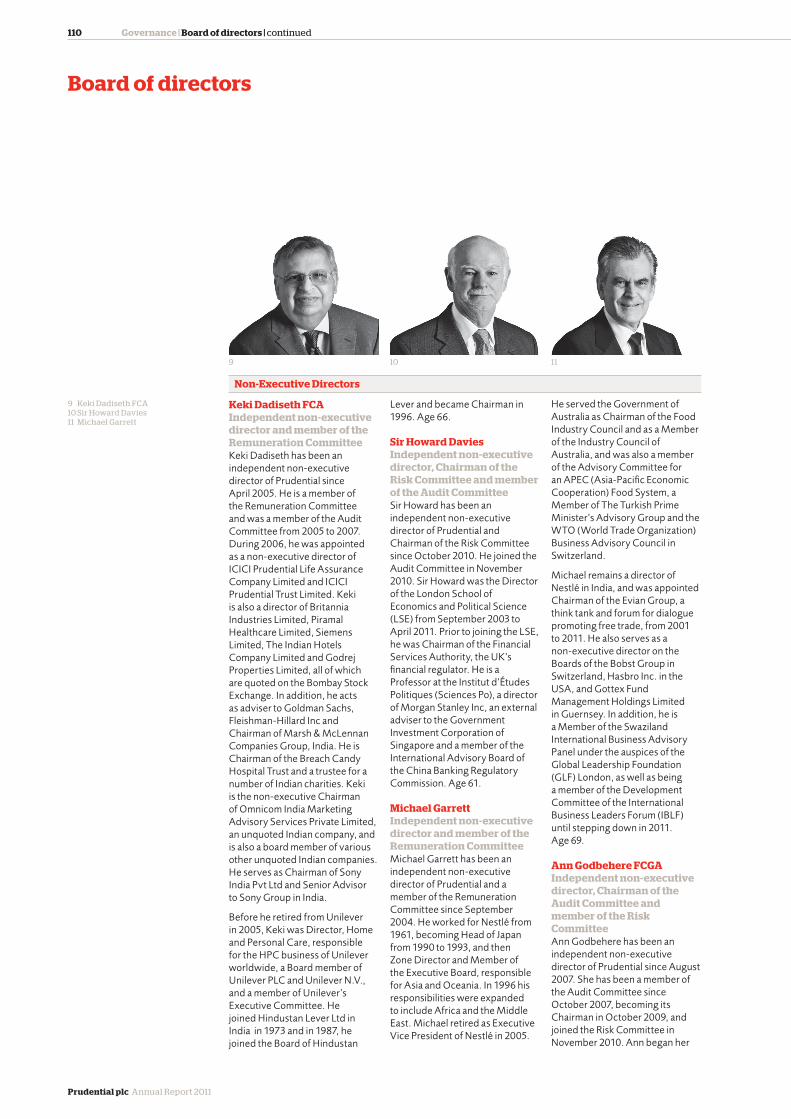
110
Prudential plc Annual Report 2011
Governance | Board of directors | continued
Board of directors
Keki Dadiseth FCAIndependent non-executive director and member of the Remuneration CommitteeKeki Dadiseth has been an independent non-executive director of Prudential since April 2005. He is a member of the Remuneration Committee and was a member of the Audit Committee from 2005 to 2007. During 2006, he was appointed as a non-executive director of ICICI Prudential Life Assurance Company Limited and ICICI Prudential Trust Limited. Keki is also a director of Britannia Industries Limited, Piramal Healthcare Limited, Siemens Limited, The Indian Hotels Company Limited and Godrej Properties Limited, all of which are quoted on the Bombay Stock Exchange. In addition, he acts as adviser to Goldman Sachs, Fleishman-Hillard Inc and Chairman of Marsh & McLennan Companies Group, India. He is Chairman of the Breach Candy Hospital Trust and a trustee for a number of Indian charities. Keki is the non-executive Chairman of Omnicom India Marketing Advisory Services Private Limited, an unquoted Indian company, and is also a board member of various other unquoted Indian companies. He serves as Chairman of Sony India Pvt Ltd and Senior Advisor to Sony Group in India.
Before he retired from Unilever in 2005, Keki was Director, Home and Personal Care, responsible for the HPC business of Unilever worldwide, a Board member of Unilever PLC and Unilever N.V., and a member of Unilever’s Executive Committee. He joined Hindustan Lever Ltd in India in 1973 and in 1987, he joined the Board of Hindustan
Lever and became Chairman in 1996. Age 66.
Sir Howard DaviesIndependent non-executive director, Chairman of the Risk Committee and member of the Audit CommitteeSir Howard has been an independent non-executive director of Prudential and Chairman of the Risk Committee since October 2010. He joined the Audit Committee in November 2010. Sir Howard was the Director of the London School of Economics and Political Science (LSE) from September 2003 to April 2011. Prior to joining the LSE, he was Chairman of the Financial Services Authority, the UK’s financial regulator. He is a Professor at the Institut d’Études Politiques (Sciences Po), a director of Morgan Stanley Inc, an external adviser to the Government Investment Corporation of Singapore and a member of the International Advisory Board of the China Banking Regulatory Commission. Age 61.
Michael GarrettIndependent non-executive director and member of the Remuneration CommitteeMichael Garrett has been an independent non-executive director of Prudential and a member of the Remuneration Committee since September 2004. He worked for Nestlé from 1961, becoming Head of Japan from 1990 to 1993, and then Zone Director and Member of the Executive Board, responsible for Asia and Oceania. In 1996 his responsibilities were expanded to include Africa and the Middle East. Michael retired as Executive Vice President of Nestlé in 2005.
He served the Government of Australia as Chairman of the Food Industry Council and as a Member of the Industry Council of Australia, and was also a member of the Advisory Committee for an APEC (Asia-Pacific Economic Cooperation) Food System, a Member of The Turkish Prime Minister’s Advisory Group and the WTO (World Trade Organization) Business Advisory Council in Switzerland.
Michael remains a director of Nestlé in India, and was appointed Chairman of the Evian Group, a think tank and forum for dialogue promoting free trade, from 2001 to 2011. He also serves as a non-executive director on the Boards of the Bobst Group in Switzerland, Hasbro Inc. in the USA, and Gottex Fund Management Holdings Limited in Guernsey. In addition, he is a Member of the Swaziland International Business Advisory Panel under the auspices of the Global Leadership Foundation (GLF) London, as well as being a member of the Development Committee of the International Business Leaders Forum (IBLF) until stepping down in 2011. Age 69.
Ann Godbehere FCGA Independent non-executive director, Chairman of the Audit Committee and member of the Risk CommitteeAnn Godbehere has been an independent non-executive director of Prudential since August 2007. She has been a member of the Audit Committee since October 2007, becoming its Chairman in October 2009, and joined the Risk Committee in November 2010. Ann began her
Non-Executive Directors
9 10 11
9 Keki Dadiseth FCA10 Sir Howard Davies11 Michael Garrett

111G
ov
ern
an
ce
career in 1976 with Sun Life of Canada, joining Mercantile & General Reinsurance Group in 1981, where she held a number of management roles rising to Senior Vice President and Controller for life and health and property/casualty businesses in North America in 1995. In 1996 Swiss Re acquired Mercantile & General Reinsurance Group and Ann became Chief Financial Officer of Swiss Re Life & Health, North America. In 1997 she was made Chief Executive Officer of Swiss Re Life & Health, Canada. She moved to London as Chief Financial Officer of Swiss Re Life & Health Division in 1998 and joined the Property & Casualty Business Group, based out of Zurich, as Chief Financial Officer on its establishment in 2001. From 2003 until February 2007, Ann was Chief Financial Officer of the Swiss Re Group.
Ann is also a non-executive director of Rio Tinto plc, Rio Tinto Limited, UBS AG, Ariel Holdings Limited, Atrium Underwriting Group Limited and Atrium Underwriters Limited. From its nationalisation in 2008 until January 2009, Ann was Interim Chief Financial Officer and Executive Director of Northern Rock. Ann joined the Board of British American Tobacco plc in October 2011 as a non-executive director. Age 56.
Alexander (Alistair) Johnston CMG FCA Independent non-executive director and member of the Audit CommitteeAlistair Johnston has been an independent non-executive director of Prudential and a member of the Audit Committee since January 2012.
Alistair was a partner of KPMG from 1986 to 2010. He joined KPMG (then Peat Marwick Mitchell) in 1973 and held a number of senior leadership positions. These included Vice Chairman of UK Financial Services and Head of UK Insurance Practice, International Managing Partner – Global Markets and UK Vice Chairman. Latterly he served as a Global Vice Chairman of the firm from 2007 to 2010.
Alistair acted as a non-executive director of the Foreign & Commonwealth Office from 2005 to 2010 and chaired the audit committee until 2009. He was an Association Member of BUPA until January 2012. Alistair is a member of the Strategy and Development Board and a Visiting Professor at Cass Business School. In February 2012 Alistair was appointed as a Trustee of the Design Museum in London. Age 59.
Paul ManducaSenior independent non-executive director and member of the Audit, Remuneration and Nomination CommitteesPaul Manduca has been an independent non-executive director of Prudential since October 2010 and succeeded James Ross as the Board’s Senior Independent Director in January 2011. He joined the Audit and Remuneration Committees in November 2010 and became a member of the Nomination Committee in January 2011.
Paul was appointed as a non-executive director of Wm Morrison Supermarkets Plc (Morrisons) in September 2005. He was the Senior Independent
Director, a member of the Nomination Committee and Chairman of the Remuneration Committee of Morrisons. He previously chaired the Audit Committee and stepped down from the Board of Morrisons in March 2011. He is also Chairman of Aon Limited, a non-executive director and Chairman of the Audit Committee of KazmunaiGas Exploration & Production Plc, Chairman of Henderson Diversified Income Limited and Chairman of JPM European Smaller Companies Investment Trust Plc. Paul was a director of Development Securities plc until March 2010, Chairman of Bridgewell Group plc until 2007 and a director of Henderson Smaller Companies Investment Trust plc until 2006. Paul was European CEO of Deutsche Asset Management from 2002 to 2005, global CEO of Rothschild Asset Management from 1999 to 2002 and founding CEO of Threadneedle Asset Management Limited from 1994 to 1999 when he was also a director of Eagle Star and Allied Dunbar. Paul is a member of the Securities Institute. Age 60.
13 1412
12 Ann Godbehere FCGA13 Alexander (Alistair) Johnston
CMG FCA14 Paul Manduca

112
Prudential plc Annual Report 2011
Governance | Board of directors | continued
Board of directors
Kaikhushru Nargolwala FCAIndependent non-executive director and member of the Risk and Remuneration CommitteesKai Nargolwala has been an independent non-executive director of Prudential and a member of the Risk and Remuneration Committees since January 2012. Until December 2011 he was the non-executive Chairman of Credit Suisse Asia Pacific, having joined Credit Suisse in 2008 as a member of the Executive Board and CEO of the Asia Pacific region.
From 1998 to 2007, Kai worked for Standard Chartered PLC where he was a Group Executive Director responsible for Asia Governance and Risk. His responsibilities included developing strategy and business performance across Asia, as well as strategic merger and acquisition activity. Prior to that, he spent 19 years at Bank of America and from 1990 was based in Asia as Group Executive Vice President and Head of the Asia Wholesale Banking Group. From 2004 to 2007, he was a non-executive director at Tate & Lyle plc and at Visa International, where he served on the Asia Pacific Board.
Kai is currently a non-executive director and lead independent director of Singapore Telecommunications Limited, a member of the Board of the Casino Regulatory Authority of Singapore and a member of the Governing Board of the Duke-NUS Graduate Medical School. Age 61.
Kathleen O’Donovan ACAIndependent non-executive director and member of the Audit and Nomination CommitteesKathleen O’Donovan has been an independent non-executive director of Prudential since May 2003. She has been a member of the Audit Committee since 2003 and was its Chairman from May 2006 until September 2009. Kathleen joined the Nomination Committee in November 2010. Kathleen is also a director and Chairman of the Audit Committee of Trinity Mirror plc, the Senior Independent Director and Chairman of the Audit Committee of ARM Holdings plc and Chairman of the Invensys Pension Scheme.
Previously, Kathleen was a non-executive director and Chairman of the Audit Committees of Great Portland Estates PLC, EMI Group plc and the Court of the Bank of England, and a non-executive director of O2 plc. From 1991 to 2002, Kathleen was Chief Financial Officer of BTR and Invensys and prior to that she was a partner at Ernst & Young. Kathleen will retire from the Prudential Board on 31 March 2012. Age 54.
Lord Turnbull KCB CVO Independent non-executive director, Chairman of the Remuneration Committee and member of the Risk and Nomination CommitteesLord Turnbull has been an independent non-executive director of Prudential since May 2006. He joined the Risk Committee and the Remuneration Committee in November 2010, and became Chairman of the Remuneration Committee and a member of the Nomination Committee in June 2011. From January 2007 to November 2010 he was a member of the Audit Committee. He entered the House of Lords as a Life Peer in 2005. In 2002 he became Secretary of the Cabinet and Head of the Home Civil Service until he retired in 2005. Prior to that he held a number of positions in the Civil Service, including Permanent Secretary at HM Treasury; Permanent Secretary at the Department of the Environment (later Environment, Transport and the Regions); Private Secretary (Economics) to the Prime Minister; and Principal Private Secretary to Margaret Thatcher and then John Major. He joined HM Treasury in 1970.
Lord Turnbull is Chairman of BH Global Limited and a non- executive director of Frontier Economics Limited and The British Land Company PLC, and was formerly a non-executive director of the Arup Group from 2006 to 2007. He also worked part-time as a Senior Adviser to the London partners of Booz and Co (UK) until February 2011. Age 67.
Non-Executive Directors
1715 16
15 Kaikhushru Nargolwala FCA16 Kathleen O’Donovan ACA17 Lord Turnbull KCB CVO

113Govern
ance
Compliance with the Corporate Governance CodesUK Corporate Governance Code Prudential plc has a premium listing on the London Stock Exchange and is subject to the UK Corporate Governance Code (the ‘UK Code’). The UK Code was published by the Financial Reporting Council (‘FRC’) in May 2010 and is applicable to financial reporting periods beginning on or after 29 June 2010.
A copy of the UK Code can be viewed on the FRC’s website www.frc.org.uk/corporate/ukcgcode.cfm
For the financial year ended 31 December 2011, the Board confirms that it has complied with the provisions of the UK Code.
Code on Corporate Governance Practices (Hong Kong)Prudential plc also has a primary listing on the main board of the Stock Exchange of Hong Kong and is subject to the Code on Corporate Governance Practices (the ‘HK Code’) in Appendix 14 to the Rules Governing the Listing of Securities on the Stock Exchange of Hong Kong Limited (the ‘Hong Kong Listing Rules’).
The HK Code is issued by the Stock Exchange of Hong Kong and can be viewed on their website www.hkex.com.hk/eng/rulesreg/listrules/mbrules/documents/appendix_14.pdf
The Board confirms that it has also complied with the HK Code throughout the period other than in respect of the Terms of Reference of the Remuneration Committee as regards making recommendations to the Board in respect of the remuneration of the non-executive directors. It would be inconsistent with the principles of the UK Code for the Remuneration Committee to be involved in setting the fees of non-executive directors.
The principles of the UK and HK Codes (the ‘Corporate Governance Codes’) have been applied as set out below and in the Directors’ remuneration report, which can be found on pages 134 to 157.
LeadershipRole of the BoardThe Board is collectively responsible for the success of the Group and provides leadership within a framework of effective controls, enabling appropriate risk management. The Board is responsible for setting strategic objectives and for ensuring the Group is adequately placed and resourced to achieve those objectives, and for ensuring obligations to its shareholders, and wider stakeholders, are met in a manner consistent with its statutory duties.
The Board has approved a governance framework which maps out the internal approvals processes and those matters which may be delegated. These principally relate to the operational management of the Group’s businesses and include pre-determined authority limits delegated by the Board to the Group Chief Executive for further delegation by him in respect of matters which are necessary for the effective day-to-day running and management of the businesses. The chief executive of each business unit has authority for the management of that business unit and has established a management board comprising its most senior executives.
The Board has Terms of Reference which specifically set out matters reserved for its decision. The Terms of Reference are regularly reviewed and enable the Board to exercise effective control over the Group’s affairs. These include approval of the annual and interim results, strategy and corporate objectives, operating plans, significant transactions and matters affecting the Company’s share capital. Under the internal governance framework, all business units are required to seek approval from the Board for matters above pre-determined authority limits.
The executive directors are responsible for running the business operations and the non-executive directors for bringing independent judgement and scrutiny.
The Board may exercise all powers conferred on it by the Articles of Association and the Companies Act 2006. This includes the powers of the Company to borrow money and to mortgage or charge any of its assets (subject to the limitations set out in the Companies Act 2006 and the Company’s Articles of Association) and to give a guarantee, security or indemnity in respect of a debt or other obligation of the Company.
In performing its duties, the Board has direct access to the services of the Company Secretary who advises on corporate governance matters, Board procedures and compliance with applicable rules and regulations. Directors have the right to seek independent professional advice at the Company’s expense and copies of such advice are circulated to other directors where applicable and appropriate.
In the ordinary course of business, Board and Committee papers are provided to the Directors approximately one week in advance of each meeting.
Chairman and Chief ExecutiveThe roles of Chairman and Group Chief Executive are separate and clearly defined. The scope of these roles is approved and kept under regular review by the Board so that no individual has unfettered decision-making powers.
The Chairman is responsible for the leadership and governance of the Board and the Group Chief Executive for the management of the Group and the implementation of Board strategy and policy on the Board’s behalf. In discharging his responsibilities, the Group Chief Executive is advised and assisted by the Group Executive Committee which comprises all the business unit heads and a Group Head Office team of functional specialists.
Senior Independent DirectorPaul Manduca has been the Senior Independent Director throughout the year. The role includes maintaining contact with shareholders with a view to understanding their concerns and issues, as well as providing ongoing support to the Chairman and acting as an intermediary for the other non-executive directors if required. Paul is accessible to all stakeholders who have concerns and where contact through the normal channels may have failed or would be inappropriate.
The senior independent director is also responsible for leading the performance evaluation of the Chairman.
Governance | Corporate governance
Corporategovernance

114
Prudential plc Annual Report 2011
Governance | Corporate governance | continued
Corporategovernance
MeetingsThe Board held twelve meetings during 2011 and a separate strategy event. A detailed forward agenda has been in operation for a number of years. This is kept updated to reflect not only scheduled regular items of business but also any topical matters arising during the year.
At least one board meeting a year is usually held at a Group business operation in order to facilitate a fuller understanding of that business. In 2011, the Board held one meeting in Hong Kong and undertook two overseas visits, with board meetings in Nashville, USA and Hanoi, Vietnam. On each overseas visit, the directors met with senior members of the management teams in those countries and attended presentations on each of the businesses.
The table below details the number of Board and Committee meetings attended by each director during the year. Where directors were not able to attend a meeting, their views were canvassed by the Chairman prior to the meeting.
The Chairman met with the non-executive directors without the executive directors being present seven times during the year and the non-executive directors met once during the year without the presence of the Chairman. All directors in office at the time of the Annual General Meeting held on 19 May 2011 attended the AGM with the exception of Keki Dadiseth and Michael Garrett.
Meeting attendance for 2011
Board Meetings6
Group Audit Committee
Meetings
Remuneration Committee
Meetings
Nomination Committee
Meetings
Group Risk Committee
Meetings
Number of meetings in a year 12 10 7 8 5
Chairman Harvey McGrath 11(12) – – 8(8) – Executive directors Tidjane Thiam 12(12) – – – – Nic Nicandrou 12(12) – – – – Rob Devey 12(12) – – – – John Foley 12(12) – – – – Michael McLintock 12(12) – – – – Barry Stowe 12(12) – – – – Mike Wells 4 11(12) – – – – Non-executive directors Keki Dadiseth 5 9(12) – 5(7) – – Howard Davies 12(12) 10(10) – – 5(5) Michael Garrett 12(12) – 7(7) – – Ann Godbehere 11(12) 10(10) – – 5(5) Bridget Macaskill 1 8(8) – 5(5) 2(3) – Paul Manduca 12(12) 10(10) 7(7) 7(8) – Kathleen O’Donovan 11(12) 8(10) – 7(8) – James Ross 2 4(4) – – 2(2) 0(1) Lord Turnbull 3 12(12) – 7(7) 6(6) 5(5)
Figures in brackets indicate the maximum number of meetings which the individual could have attended in the period in which they were a Board or Committee member.
Notes1 Ceased to be Chairman of the Remuneration Committee and a member of the Nomination Committee on 14 June 2011, ceased to be a director on
30 September 2011.2 Retired as a director and ceased to be a member of the Group Risk and Nomination Committees on 19 May 2011.3 Appointed as Chairman of the Remuneration Committee and as a member of the Nomination Committee on 14 June 2011.4 Was unable to attend one meeting due to a pre-existing commitment.5 Was unable to attend certain of the meetings due to illness.6 Two board meetings were unscheduled and called at short notice.

115Govern
ance
EffectivenessComposition At the date of this report, the Board comprised the Chairman, seven executive directors and nine independent non-executive directors.
On 1 January 2012, Kai Nargolwala and Alistair Johnston joined the board as non-executive directors. Kathleen O’Donovan will step down from the Board on 31 March 2012 after serving almost nine years, and Harvey McGrath, Chairman of the Board, has signalled his intention to retire once a suitable successor has been found.
John Foley and Mike Wells were appointed as executive directors on 1 January 2011. John became the Group Chief Risk Officer and Mike took over as President and Chief Executive Officer of Jackson National Life Insurance Company.
James Ross retired as a non-executive director at the conclusion of the 2011 Annual General Meeting on 19 May. He had been succeeded as the senior independent director by Paul Manduca on 1 January 2011. Bridget Macaskill stepped down as a director on 30 September 2011. She was succeeded as Chairman of the Remuneration Committee by Lord Turnbull on 14 June 2011. The biographies of all current directors are set out on pages 108 to 112.
The Board, or the members in a general meeting, may appoint directors up to a maximum total number of 20 as set out in the Company’s Articles of Association. The removal and resignation of the Company’s directors is governed by the relevant provisions of the Companies Act 2006, the UK and HK Codes and the Company’s Articles of Association.
Terms of appointment for non-executive directorsNon-executive directors are usually appointed for an initial three-year term commencing with their election by shareholders at the first Annual General Meeting following their appointment by the Board. Each appointment is reviewed towards the end of the three-year term against performance and the requirements of the Group’s businesses. The terms and conditions of all directors’ appointments are available for inspection at the Company’s registered office during normal business hours and at the Annual General Meeting.
Non-executive directors are typically expected to serve for two terms of three years from their initial election by shareholders although the Board may invite them to serve for an additional period. Directors serving a third term are subject to rigorous annual review.
Re-electionDirectors appointed to the Board since the 2011 Annual General Meeting will stand for election for the first time and, in accordance with the provisions of the UK Code, all other directors will offer themselves for re-election at the Annual General Meeting to be held on 17 May 2012.
The Board believes that the non-executive directors bring a wide range of business, financial and international experience to the Board and its committees. The executive directors, who head up the main businesses of the Group, each bring an in-depth understanding to the Board of their particular business, its markets and its challenges, ensuring coverage of the breadth and depth of the Group’s principal activities.
Succession planningThe Board is actively engaged in succession planning for both executive and non-executive roles to ensure that Board composition is regularly refreshed and that the Board retains its effectiveness at all times. This is delivered through an established review process that is applied across all businesses and covers both director and senior management succession and development and also through the work of the Nomination Committee as described more fully on page 122. The Board considers annually the outcome of the review and actions arising from the review are implemented as part of the management development agenda.
Gender diversityThe Company seeks, through its diversity policy, to encourage the recruitment and retention of talented women at all levels. Furthermore, the Board remains committed to inclusion in all its forms and believes that leading companies seek out, and not simply tolerate, diversity.
The inclusion of women extends to the plc Board and is an important consideration during searches for new Board members. Prudential embraces the proposition that more women on boards would be advantageous to companies as well as to society at large. We remain duty bound to recruit the best available talent, and although the Board does not endorse quotas, it does commit to having an increasing representation of women in senior positions in the Company and on the Board.
IndependenceThe independence of the non-executive directors is determined with reference to the UK and HK Codes. Prudential is required to affirm annually the independence of the non-executive directors under the Hong Kong Listing Rules and also the independence of its Audit Committee members under the Sarbanes-Oxley legislation. The Board has appropriate processes in place to manage any potential conflicts of interest.
Throughout the year the non-executive directors were considered by the Board to be independent in character and judgement and met the provisions for independence as set out in the UK and HK Codes. The Company has received confirmation of independence from each of the independent non-executive directors as required by the Hong Kong Listing Rules.

116
Prudential plc Annual Report 2011
Governance | Corporate governance | continued
Corporategovernance
Keki Dadiseth and Barry Stowe serve as non-executive directors of ICICI Prudential Life Insurance Company Limited, an Indian company which is owned 26 per cent by Prudential. In addition, Keki serves, at Prudential’s request, as a non-executive director of ICICI Prudential Trust Limited, an Indian company which is owned 49 per cent by Prudential. The Board does not consider that these appointments in any way affect Keki’s status as an independent director of Prudential.
Alistair Johnston was a partner in the Company’s auditor, KPMG, from 1986 to 2010. However, he did not audit the Prudential Group and he no longer has any financial or other interest in KPMG. The Board does not consider that this former relationship with KPMG affects Alistair’s status as an independent director of Prudential.
Prudential is one of the UK’s largest institutional investors and the Board does not believe that this situation compromises the independence of those non-executive directors who are on the boards of companies in which the Group has a shareholding. The Board also believes that such shareholdings should not preclude the Company from having the most appropriate and highest calibre non-executive directors.
Induction and developmentThe Company Secretary supports the Chairman in providing tailored induction programmes for new directors and ongoing development for all directors. On appointment, all directors embark upon a wide-ranging induction programme covering, among other things, the principal bases of accounting for the Group’s results, the role of the Board and its key committees and the ambit of the internal audit and risk management functions. In addition, they receive detailed briefings on the Group’s principal businesses, its product range, the markets in which it operates and the overall competitive environment. Other areas addressed include the directors’ obligations under the different listing regimes, legal issues affecting directors of financial services companies, the Group’s governance arrangements and its investor relations programme as well as its remuneration policies.
Throughout their period in office directors are regularly updated on the Group’s businesses and the regulatory and industry-specific environments in which it operates, as well as on their legal and other duties and obligations as directors where appropriate. These updates can be in the form of written reports to the Board, presentations by senior executives or by external advisers where appropriate. In order to enhance their knowledge and effectiveness throughout their term in office, non-executive directors serving on key committees are updated regularly on matters specific to the relevant committee and receive presentations from senior executives on topics of interest to them.
Ongoing professional development was undertaken by all directors during 2011. This included a number of sector-specific and business issues as well as legal, accounting and regulatory changes and developments. A number of business unit chief executive officers together with relevant senior executives gave presentations to the Board during the course of the year on the challenges and opportunities currently faced by their business unit. In addition, senior managers within certain head office functions presented to the Board on the key issues currently facing their function and directors received regular briefings on Solvency II. In addition, members of the Group Audit Committee have the option to attend meetings of the business unit audit committees to aid their understanding of topical matters of interest to them and how they are handled by the Group.
Performance evaluation Prudential continued its programme of annual evaluation of the performance of the Board and its Committees in respect of 2011, in line with the requirements of the UK Code. The aim is to continue to improve the effectiveness of the Board and its Committees and enhance the Group’s performance.
The review was carried out by an external evaluator, Dr Tracy Long of Boardroom Review, in consultation with the Chairman, the Senior Independent Director and the Group Chief Executive. Boardroom Review has no other connection with the Company. The findings of the review will be discussed by the Board in March and an action plan will be implemented during the year.
In addition, the performance of the non-executive directors and the Group Chief Executive is evaluated by the Chairman in individual meetings. The Chairman also leads the non-executive directors in a performance assessment of the executive directors and the Senior Independent Director leads the non-executive directors in a performance evaluation of the Chairman.
Executive directors are subject to regular review and the Group Chief Executive individually appraises the performance of each of the executive directors as part of the annual Group-wide performance evaluation of all staff.
Conflicts of interestDirectors have a statutory duty to avoid conflicts of interest with the Company. The Company’s Articles of Association allow the directors to authorise conflicts of interest and the Board has adopted a policy and effective procedures on managing and, where appropriate, approving conflicts or potential conflicts of interest. Under these procedures directors are required to declare all directorships or other appointments to companies which are not part of the Group, as well as other situations which could result in conflicts or could give rise to a potential conflict. The Nomination Committee, or the Board where appropriate, evaluates and approves each such situation individually where applicable.

117Govern
ance
Directors’ interests Individual directors’ interests are set out on page 147 of the Directors’ Remuneration Report.
External appointmentsDirectors may hold directorships or other significant interests in companies outside the Group which may have business relationships with the Group.
Executive directors may accept external directorships and retain any fees earned from those directorships subject to prior discussion with the Group Chief Executive and always provided this does not lead to any conflicts of interest. In line with the UK Code, executive directors would be expected to hold no more than one non-executive directorship, nor the chairmanship, of a FTSE 100 company. Some of our executive directors hold directorships or trustee positions of unquoted companies or institutions. Details of any fees retained are included in the Directors’ remuneration report on page 146 and major commitments of our executive directors are detailed in their biographies on pages 108 and 109.
Non-executive directors may serve on a number of other boards provided that they are able to demonstrate satisfactory time commitment to their role at Prudential and that they discuss any new appointment with the Chairman prior to accepting. This ensures that they do not compromise their independence and that any potential conflicts of interest and any possible issues arising out of the time commitments required by the new role can be identified and addressed appropriately. The major commitments of our non-executive directors are detailed in their biographies set out on pages 110 to 112.
The Board was satisfied that during 2011 the Chairman’s other commitments did not hinder the day-to-day performance of his duties for the Group and that he had the commitment and capability to make himself available under unforeseen circumstances. The major commitments of the Chairman, including changes during the year where applicable, are detailed in his biography on page 108.
Directors’ indemnities and protections The Company has arranged appropriate insurance cover in respect of legal action against directors and senior managers of companies within the Prudential Group. In addition, the Articles of Association of the Company permit the directors and officers of the Company to be indemnified in respect of liabilities incurred as a result of their office. Prudential also provides protections for directors and certain senior managers of companies within the Group against personal financial exposure they may incur in their capacity as such. These include qualifying third party indemnity provisions (as defined where relevant by the Companies Act 2006) for the benefit of directors of Prudential plc and other such persons including, where applicable, in their capacity as directors of other companies within the Group. These indemnities were in force during 2011 and remain in force.
AccountabilityInternal control and risk management The Board has overall responsibility for the system of internal control and risk management and for reviewing its effectiveness. The framework setting out the Group’s approach to internal control, risk management and corporate responsibility comprises the following:
Group governance framework: Documents the Group’s internal control policies and processes in an online manual, including the Group’s risk framework, code of business conduct and detailed policies on key operational and financial risks. Business units are also required to follow any additional processes necessary to comply with local statutory and regulatory requirements.
Group risk framework: Provides an overview of the Group-wide philosophy and approach to risk management and sets out the key risk management processes which support the Group’s compliance with internal, statutory and regulatory requirements.
Corporate responsibility framework: Provides an overview of the Group-wide philosophy and approach to corporate responsibility; supports the Group’s commercial focus and the increasing challenges faced including changes in stakeholder expectations. A key element is the Group Code of Business Conduct which sets out the ethical standards the Board requires of itself, employees, agents and others working on behalf of the Group, in their dealings with employees, customers, shareholders, suppliers, and competitors, in the wider community and in respect of the environment.
The Business Review provides further detail on Prudential’s risk appetite and exposures on pages 80 to 90 and corporate responsibility activities on pages 95 to 106.
Further details on the procedures for the management of risk and the systems of internal control operated by the Group are given in the section on Risk Governance on pages 124 and 125. The governance framework principally relates to the operational management of the Group’s businesses and includes pre-determined authority limits delegated by the Board in respect of matters which are necessary for the effective day-to-day running and management of the business. The Group Chief Executive has been delegated management authority by the Board and in turn grants authority to the executive, including the chief executive officers of each business unit who report to him for the management of that business unit. In addition, each of those chief executives has established a management board comprising the business unit’s most senior executives.

118
Prudential plc Annual Report 2011
Governance | Corporate governance | continued
Corporategovernance
The system is regularly reviewed and complies with the UK and HK Codes. In complying with the UK Code, the Group follows the 2005 Turnbull Guidance relating to the sections of the Code dealing with risk management and internal control. The Board reviewed the effectiveness of the system of internal control in February 2012, covering all material controls, including financial, operational and compliance controls, risk management systems and the adequacy of the resources, qualifications and experience of staff of the issuer’s accounting and financial reporting function. The system is designed to manage, rather than eliminate, the risk of failure to achieve business objectives and gives reasonable, but not absolute assurance. The Board confirms that there is an ongoing process for identifying, evaluating and managing the significant risks faced by the Group, which has been in place throughout the period and up to the date of this report.
The chief executive and chief financial officer of each business unit, as well as the senior management in Group head office, annually certify compliance with the Group’s governance, internal control and risk management requirements. The risk management function reviewed any matters identified by the certification process, and also assessed the risk and control issues that arose and were reported during the year. This included: routine and exception-based risk reporting; matters identified and reported by other Group head office oversight functions and the findings from the work of the internal audit function, which executes risk-based audit plans throughout the Group. The results were reported to and reviewed by the Group Audit Committee.
In line with the Turnbull guidance, the certification provided above does not apply to certain material joint ventures where the Group does not exercise full management control. In these cases, the Group satisfies itself that suitable governance and risk management arrangements are in place to protect the Group’s interests. However, the relevant Group company which is party to the joint venture must, in respect of any services it provides in support of the joint venture, comply with the requirements of the Group’s internal governance framework.
The internal control and risk management systems described above and also under the sections on Risk Governance on pages 124 and 125 and the Group Audit Committee on page 120, cover the Company’s financial reporting process and the Group’s process for the preparation of consolidated financial statements.
CommitteesThe Board has established audit, remuneration, nomination and risk committees as principal standing committees of the Board. Each committee has written terms of reference which are kept under regular review. These committees are key elements of the Group’s corporate governance framework and reports on each committee are included below.
Prudential plc Board*
• Chairman
• Nine non-executivedirectors
• Seven executivedirectors
Group Audit Committee*
• Five non-executivedirectors
Nomination Committee*
• The Chairman and three non-executive directors
Group Risk Committee
• Four non-executivedirectors
Remuneration Committee
• Five non-executivedirectors
*As at 12 March 2012. Kathleen O’Donovan will retire from the Board, the Group Audit Committee and the Nomination Committee on 31 March 2012.

119Govern
ance
Group Audit Committee report
The responsibilities of the Group Audit Committee (the ‘Committee’) and the activities it carried out during the year are set out below.
Role of the CommitteeThe Committee’s principal responsibilities consist of oversight over financial reporting, the effectiveness of the internal control systems and monitoring auditor independence. Its duties include gaining assurance on the control over financial processes and the integrity of the Group’s financial reports, monitoring the performance, objectivity and independence of the external auditor, and reviewing the work of the internal auditor.
ResponsibilitiesThe Committee’s principal business during the year consisted of the following:
• Monitoring the integrity of the financial statements, including the review of half- and full-year results, the annual report and accounts and other significant financial announcements and reviewing the critical accounting policies and key judgmental areas contained therein;
• Monitoring of the framework and effectiveness of the Group’s systems of internal control, including the Turnbull compliance statement and Sarbanes-Oxley procedures;
• Monitoring auditor independence and the external auditor’s plans and audit strategy, the effectiveness of the external audit process, the external auditor’s qualifications, expertise and resources, and making recommendations for the re-appointment of the external auditor;
• Reviewing the internal audit plan and resources, and monitoring the audit framework and effectiveness of the internal audit function;
• Monitoring the effectiveness of compliance processes and controls, and performance against the Group Compliance Plan;
• Reviewing the anti-money laundering procedures in place, as well as the review of procedures operated for handling allegations from whistleblowers; and
• Reviewing the effectiveness of the business unit audit committees.
In performing its duties, the Committee has access to employees and their financial or other relevant expertise across the Group and to the services of the Group-wide Internal Audit Director and the Company Secretary. The Committee may also seek external professional advice at the Group’s expense.
The Committee’s terms of reference, which are approved by the Board and kept under regular review, are available on our website at www.prudential.co.uk/prudential-plc/aboutpru/corporategovernance/ Alternatively, copies may be obtained by writing to the Company Secretary at the registered office.
MembershipThe Committee is comprised of independent non-executive directors as set out below:
• Ann Godbehere (Chairman)
• Howard Davies
• Alistair Johnston (from 1 January 2012)
• Paul Manduca
• Kathleen O’Donovan (to 31 March 2012)
The membership is selected to provide a broad set of financial, commercial and other experience relevant to meet the Committee’s objectives.
The Board has determined that Ann Godbehere and Kathleen O’Donovan have recent and relevant financial experience in respect of the financial reporting period under review and for the purposes of the UK Code and the Hong Kong Listing Rules. In March 2011, the Board designated Ann Godbehere as its audit committee financial expert for Sarbanes-Oxley Act purposes. This will be reviewed during 2012 in conjunction with the publication of Form 20-F.
Full biographical details of the members of the Committee are set out in their biographies on pages 110 to 112.
MeetingsThe Committee meets at least five times a year and gives consideration to the financial statements of the Group and the Group’s system of internal control, as well as its internal and external audit providers.
By invitation, the Chairman of the Board, the Group Chief Executive, the Chief Financial Officer, the Group General Counsel and Company Secretary, the Group-wide Internal Audit Director, the Group Chief Risk Officer and other senior staff from the group finance, internal audit, risk, compliance and security functions attended some of the meetings to contribute to the discussions relating to their respective areas of expertise. The lead and other partners of the external auditor also attended the meetings.
During 2011, the Committee met on 10 occasions and details of Committee members’ attendance is set out on page 114.
A detailed forward agenda has been in operation for a number of years and is reviewed and updated continually to ensure all matters for which the Committee is responsible are addressed at the appropriate time of year.

120
Prudential plc Annual Report 2011
Governance | Corporate governance | continued
Corporategovernance
The Committee also received in-depth presentations on a range of topics and received the minutes of both the Disclosure Committee and the Assumptions Approval Committee. Further information on the Disclosure Committee appears under the heading US corporate governance and regulations on page 128. The Assumptions Approval Committee reviews the economic assumptions to be used for EEV reporting, business planning, forecasting and the IAS19 valuation of the three UK defined benefit pension schemes.
The Committee Chairman reported to the Board on matters of particular significance after each meeting and the minutes were circulated to all Board members. The Committee regularly reviews its Terms of Reference, which were last refreshed and recommended to the Board for approval in December 2011.
The Committee recognises the need to meet without the presence of executive management. Such sessions were held with the external auditor in February and July 2011, and with the internal auditor in February and October 2011. At all other times management and auditors had open access to the Chairman and the Committee.
Financial reporting As part of its review of financial statements prior to recommending their publication to the Board, the Committee focused on the critical accounting policies and practices, and any changes or decisions requiring a major element of judgement, unusual transactions, clarity of disclosures, significant audit adjustments (of which there were none in 2011), the going concern assumption, compliance with accounting standards, and compliance with obligations under applicable laws, regulations and governance codes.
In addition, the Committee is regularly briefed by management on developments in International Financial Reporting Standards.
Confidential reporting One of the standing agenda items of the Committee is to review a report on the use of the confidential reporting procedures, which are available to employees to enable them to communicate confidentially, and anonymously if they so wish, on matters of concern and actions taken in response to these communications. No material control implications were raised through these procedures during the year.
Business unit audit committeesEach business unit has its own audit committee to provide oversight to the respective business unit and to assist the Committee in its oversight responsibilities for the Group. The members and chairmen are comprised primarily of senior management who are independent of the respective business unit. The minutes of these committees are reported regularly to the Committee and their meetings are attended by senior management of the respective business unit, including the business units’ heads of finance, risk, compliance and Group-wide internal audit. Business unit audit committees have adopted standard terms of reference across the Group with
minor variations to address local requirements or particular requirements of the business. The terms of reference of those committees were reviewed during the year and all include escalation of significant matters to the Committee, recommendations for approval of the business unit internal audit plans and overseeing the adequacy of internal audit resources. During the year the business unit audit committees reviewed their respective internal audit plans, resources and the results of internal audit work, and both external and internal auditors were able to discuss any relevant matters with the Chairman and members of the Committee as required.
Effectiveness of business unit audit committeesGroup-wide Internal Audit has reviewed the effectiveness of each business unit audit committee using an established evaluation tool. The evaluation comprises an annual review questionnaire which is divided into specific areas for appraisal and a walk through of each committee’s terms of reference, assessing whether these are appropriate for the business unit and if the committee has fulfilled its responsibilities under the terms. A memorandum summarising the findings of the review, as well as any action points, is compiled for each business unit audit committee.
The findings were reviewed by the Group-wide Internal Audit business unit audit director in conjunction with the Chairman and discussed by the respective business unit audit committees. In addition, the Chairman of each business unit audit committee has confirmed that, in their opinion, the current members have the appropriate balance of skills, knowledge and expertise to oversee the relevant business unit.
On completion of the review, Group-wide Internal Audit concluded that the overall arrangements for the business unit audit committees remained appropriate for the nature and purpose of each business unit and that each business unit audit committee continued to meet the responsibilities as set out in their respective terms of reference.
Internal control and risk management The Committee reviewed the Group’s statement on internal control systems prior to its endorsement by the Board.
Pursuant to the requirements of Section 404 of the Sarbanes-Oxley Act, the Group undertakes an annual assessment of the effectiveness of internal control over financial reporting. Further details are provided below.
Group-wide Internal AuditThe Committee regards its relationship with the internal audit function as pivotal to the effectiveness of its own activities. Group-wide Internal Audit plays an important role in supporting the Committee to fulfil its responsibilities under the UK and HK Codes, as well as the Sarbanes-Oxley Act, and provides independent assurance on the Company’s processes of identification and control of risk. Each of the Group’s business units has an internal audit team, the heads of which report to the Group-wide Internal Audit Director. Internal audit resources,

121Govern
ance
plans and work are overseen by the Committee and by the business unit audit committees. Total approved internal audit headcount across the Group was 136 at 31 December 2011. The Group-wide Internal Audit Director reports functionally to the Committee and for management purposes to the Chief Financial Officer.
The Committee assesses the effectiveness of the internal audit function by means of regular reviews, some of which are carried out by external advisers, and through ongoing dialogue with the Group-wide Internal Audit Director. An external review of Group-wide internal audit arrangements and standards was undertaken in respect of the period 1 January 2010 to 31 March 2011, the findings of which were reported to the Committee in detail in July 2011. The purpose of the review was to ensure that the activities and resources of internal audit continue to be effectively organised to support the oversight responsibilities of the Committee. The review, performed by PwC, confirmed that Group-wide Internal Audit is ‘Generally Conforming’ with the Institute of Internal Auditors (IIA) International Standards, the highest classification available.
The Committee approved the Group-wide Internal Audit annual audit plan of assurance work to be undertaken during 2012.
External auditThe Committee has a key oversight role in relation to the external auditor, KPMG Audit Plc, whose primary relationship is with the Committee. The Group’s Auditor Independence Policy ensures that the independence and objectivity of the external auditor is not impaired. The policy sets out four key principles which underpin the provision of non-audit services by the external auditor, namely that the auditor should not:
• audit its own firm’s work,
• make management decisions for the Group,
• have a mutuality of financial interest with the Group, or
• be put in the role of advocate for the Group.
All services provided by the auditor under this policy are provided in accordance with a pre-approved budget and are reviewed by the Committee and approved where necessary. The Committee regularly reviews and updates the policy to ensure alignment with the latest standards and best practice in establishing, maintaining and monitoring auditor independence and objectivity.
Fees payable to the auditorDuring the year ended 31 December 2011 the Committee approved fees of £13.3 million to its auditor, KPMG Audit Plc, for audit services and other services supplied pursuant to relevant legislation. In addition, the Committee approved fees of £2.9 million to KPMG for services not related to audit work which accounted for 18 per cent of total fees paid to the external auditor in the year. In accordance with the Group’s Auditor Independence Policy, all services were approved prior to work commencing and each of the non-audit services was confirmed
to be permissible for the external auditor to undertake as defined by the Sarbanes-Oxley Act. The Committee reviewed the non-audit services being provided to the Group by KPMG at regular intervals during 2011. A summary of fees payable to the auditor for the year ended 31 December 2011 is provided in Note I6 to the Group financial statements.
Auditor performance and independenceAs part of its work during the year, the Committee assessed the performance of the external auditor, its independence and objectivity, and the effectiveness of the audit process. In addition to questioning the external auditor, which is a regular feature of meetings, the review of the effectiveness of the external audit process was conducted through a questionnaire-based exercise administered by Group-wide Internal Audit. The Committee reviewed the external audit strategy and received reports from the auditor on its own policies and procedures regarding independence and quality control, including an annual confirmation of its independence in line with industry standards.
Re-appointment of auditor The Group operates a policy under which at least once every five years a formal review is undertaken by the Committee to assess whether the external audit should be re-tendered. The external audit was last put out to competitive tender in 1999 when the present auditor was appointed. Since 2005 the Committee has annually considered the need to re-tender the external audit service. It again considered this in February 2012 and concluded that there was nothing in the performance of the auditor requiring a change. In line with the Auditing Practices Board Ethical Statements and the Sarbanes-Oxley Act, the lead audit partner, who was appointed by KPMG Audit Plc in 2007, will be replaced by a new lead audit partner in respect of the 2012 financial year.
Following its review of the external auditor’s effectiveness and independence, the Committee has recommended to the Board that KPMG Audit Plc be re-appointed as auditor of the Company and a resolution for the re-appointment of KPMG Audit Plc as auditor of the Company will be put to a shareholder vote at the Annual General Meeting on 17 May 2012.
Review of Committee effectivenessAs part of the performance evaluation of the Board, the Committee undertook an externally facilitated performance assessment of the qualitative aspects of its performance during the year. The results of this assessment will be reviewed by the Board in March 2012. In addition, an internal evaluation was carried out addressing compliance with various regulations and codes of conduct applicable to the Committee, and the results of that assessment were reported to the Committee in December 2011. The Committee is satisfied, taking into account the findings of the internal review, that it had been operating as an effective audit committee throughout the year. Further reviews of the effectiveness of the Committee will be undertaken regularly and will from time to time be conducted by external consultants.
122
Prudential plc Annual Report 2011
Governance | Corporate governance | continued
Corporategovernance
Nomination Committee report
The responsibilities of the Nomination Committee (the ‘Committee’) and the activities it carried out during the year are set out below.
Role of the CommitteeThe Committee in consultation with the Board, evaluates the balance of skills, knowledge and experience of the Board, taking into account the Group’s business and with due regard for the benefits of diversity, including gender, identifies the roles and capabilities required to meet the demands of the business. Candidates are considered on merit against specific criteria and the Committee makes recommendations to the Board regarding suitable candidates for appointment to the Board.
The Committee also reviews the conflicts of interest or potential conflicts of interest raised by directors between Board meetings or for prospective new Board members. In cases where there might be an actual or potential conflict of interest the Committee has powers to authorise any such actual or potential conflict situation on behalf of the Board, imposing any terms and conditions it deems appropriate, or to make recommendations to the Board as to whether the conflict or potential conflict should be authorised and on what terms.
ResponsibilitiesThe Committee’s principal business during the year consisted of the following:
• Reviewing the size, structure and composition of the Board, including the skills, knowledge, experience and diversity of Board members, and making recommendations to the Board with regard to any changes;
• Identifying and nominating candidates for appointment to the Board, based on merit and against objective criteria;
• Making recommendations on the appointment and removal of any members of the audit, risk, remuneration and nomination committees in consultation with the Chairman of those Committees; and
• Considering and, where necessary, authorising any actual or potential situational conflicts, upon such terms and conditions as the Committee considered appropriate, arising out of a proposed new appointment, the changed circumstances of an existing appointment or that of a director’s connected person.
The Committee’s terms of reference, which are set by the Board and kept under regular review, are available on our website at www.prudential.co.uk/prudential-plc/aboutpru/corporate governance/ Alternatively, copies may be obtained by writing to the Company Secretary at the registered office.
MembershipThe Committee is comprised of independent non-executive directors and the Chairman, as set out below:
• Harvey McGrath (Chairman)
• Bridget Macaskill (to 14 June 2011)
• Paul Manduca
• Kathleen O’Donovan (to 31 March 2012)
• James Ross (to 19 May 2011)
• Lord Turnbull (from 14 June 2011)
MeetingsThe Committee meets at least twice a year to consider the Board composition and membership of the principal Committees and to consider the suitability of all directors standing for re-election at the AGM. In addition, the Committee meets to consider candidates for appointment to the Board. The Group Chief Executive is closely involved in the work of the Committee and is invited to attend and contribute to meetings.
During 2011, the Committee met on eight occasions and details of Committee members’ attendance is set out on page 114.
The appointments of Kai Nargolwala and Alistair Johnston, made by unanimous decision of the Board, was the culmination of a comprehensive search process which commenced in the first half of the year under the direction of the Committee. With the assistance of external search consultants, a number of candidates meeting the criteria set by the Committee were identified. As part of the process, Alistair and Kai met the Chairman and Group Chief Executive, as well as a number of other directors prior to being appointed to the Board. The Committee will continue to play a key role in the search for a successor to the current Chairman, Harvey McGrath.
The Committee Chairman reported to the Board on matters of particular significance after each meeting.

123Govern
ance
Group Risk Committee report
The responsibilities of the Group Risk Committee (the ‘Committee’) and the activities it carried out during the year are set out below.
Role of the CommitteeThe Committee provides leadership, direction and oversight in relation to the Group’s overall risk appetite and tolerance and the risk management framework. Oversight of the framework includes reviewing the Group’s risk policies and standards, supporting risk limits, methodologies adopted and the processes and controls in place for assessing the Group’s risks.
The Committee also provides oversight in respect of the Group Chief Risk Officer’s responsibilities and the Group Chief Risk Officer has open access to the Committee Chairman and the Committee.
In performing its duties, the Committee has access to employees and their relevant expertise across the Group and to the services of the Group Chief Risk Officer, the Group-wide Internal Audit Director and the Company Secretary. The Committee may also seek external professional advice at the Group’s expense.
ResponsibilitiesThe Committee’s principal business during the year consisted of the following:
• Reviewing the Group risk, capital and liquidity management framework, as well as the Group’s risk appetite, its risk policies and standards, including the parameters used and methodologies and processes adopted for identifying and assessing risks;
• Reviewing the material and emerging risk exposures of the Group, including market, credit, insurance, operational, liquidity and economic and regulatory capital risks as well as regulatory and compliance matters;
• Overseeing the Group’s processes and policies for determining risk tolerance and reviewing management’s measurement and effectiveness of the Group’s risk tolerance levels;
• Receiving and reviewing Group-wide Internal Audit Reports on the risk management function;
• Assisting the Board in reviewing the risks inherent in the business plans; and
• Providing qualitative and quantitative advice to the Remuneration Committee on risk weightings applied to performance objectives incorporated in executive remuneration and evaluating whether the remuneration approach for senior executives was positioned within the Group’s overall risk appetite framework.
The Committee’s terms of reference, which are set by the Board and kept under regular review, are available on our website at www.prudential.co.uk/prudential-plc/aboutpru/corporate governance/ Alternatively, copies may be obtained by writing to the Company Secretary at the registered office.
MembershipThe Committee is comprised of independent non-executive directors as set out below:
• Howard Davies (Chairman)
• Ann Godbehere
• Kai Nargolwala (from 1 January 2012)
• James Ross (to 19 May 2011)
• Lord Turnbull
MeetingsThe Committee meets at least four times a year to consider the Group’s risk appetite and provide oversight to the management of risk within the Group. The Chairman of the Committee is a member of the Group Audit Committee and works closely with that Committee in fulfilling the Committee’s responsibilities.
The Chairman of the Board, the Group Chief Executive, the Chief Financial Officer and the General Counsel and Company Secretary are invited to attend the meetings. The Group Chief Risk Officer is closely involved in the work of the Committee and is invited to attend and contribute to the meetings. The Group-wide Internal Audit Director and the Group Risk Director are also invited to attend.
During 2011, the Committee met on five occasions and details of Committee members’ attendance is set out on page 114.
The Committee was constituted in November 2010 and agreed the work plan for its first year of operation early in 2011. The Committee undertook a comprehensive analysis of the Group’s key risks and received presentations by the relevant managers in these areas. The Committee further received presentations from certain of the business units on the particular risks inherent in those businesses, as well as the systems and controls in place to monitor and manage those risks. The Group Chief Risk Officer briefed the Committee on the structure and organisation of the Group Risk function. The Committee worked closely with the Group Audit Committee to ensure any risk assurance relevant to financial reporting was referred to the Group Audit Committee and with the Remuneration Committee on providing risk adjustment measures for executive remuneration.
The Chairman reviewed the work of the Committee, and the risk framework with the Financial Services Authority as part of the regular processes of supervision. The Committee received regular reports from the Group-wide Internal Audit Director, the Group Executive Risk Committee, the Group Operational Risk Committee and the Group Credit Risk Committee. Further information on these committees appears on pages 124 and 125.
The effectiveness of the Committee was reviewed as part of the externally facilitated review of the Board and its committees. The findings will be discussed by the Board in March 2012.
The Committee Chairman reported to the Board on matters of particular significance after each meeting and the minutes were circulated to all Board members.

124
Prudential plc Annual Report 2011
Governance | Risk governance
Risk governance
OrganisationPrudential’s risk governance framework requires that all of the Group’s businesses and functions establish processes for identifying, evaluating and managing the key risks faced by the Group. The framework is based on the concept of ’three lines of defence’ (LoD): risk management, risk oversight and independent assurance.
The diagram above outlines the Group-level framework.
As described in this Corporate Governance Report, primary responsibility for strategy, performance management and risk control lies with the Board, which has established the Risk Committee to assist in providing leadership, direction and oversight, and with the Group Chief Executive and the chief executives of each business unit.
Risk management (1st LoD):Balance Sheet and Capital Management Committee: Meets monthly to monitor the Group’s liquidity and oversee the activities of Prudential Capital.
Risk oversight (2nd LoD):Risk exposures are monitored and reviewed by Group-level risk committees chaired by the Group Chief Risk Officer or the Chief Financial Officer.
Group Executive Risk Committee: Meets monthly to oversee the Group’s risk exposures (market, credit, liquidity, insurance and operational risks) and to monitor capital.
Group Credit Risk Committee: Reports to the Group Executive Risk Committee and meets monthly to review the Group’s investment and counterparty credit risk positions.
Board
Board
RemunerationCommittee
Group RiskCommittee
Group AuditCommittee
1st Line of Defence 2nd Line of Defence 3rd Line of Defence
Group-level framework
NominationCommittee
Executives
CFO
GEC
GERC
Group CEO
GCRC GORC STOC
Group-wideinternal audit
Grouprisk
Groupcompliance
Groupsecurity
Board-level Committees GEC Group Executive CommitteeBSCMC Balance Sheet & Capital Management CommitteeGERC Group Executive Risk CommitteeGCRC Group Credit Risk CommitteeGORC Group Operational Risk CommitteeSTOC Solvency II Technical Oversight Committee (permanent successor to Technical Assurance Committee)
Executive personnel
Direct Reporting Line
Exec/Management Committee
GHO Functions
Regular Communicationand Escalation
Management
Group CRO
Key
BSCMC

125Govern
ance
Group Operational Risk Committee: Reports to the Group Executive Risk Committee and meets quarterly to oversee the Group’s non-financial (operational, business environment and strategic) risk exposures.
Solvency II Technical Oversight Committee: Will be created when the Solvency II programme is complete, to provide ongoing technical oversight and advice to the executive and the Board in carrying out their duties with regard to the Group’s Internal Model.
The committees’ oversight is supported by the Group Chief Risk Officer with functional oversight provided by:
Group Security: Develop and deliver appropriate security measures to protect the Group’s staff, physical assets and intellectual property.
Group Compliance: Verify compliance with regulatory standards and inform the Group’s management and the Board on key regulatory issues affecting the Group.
Group Risk: Establish and embed a capital management and risk oversight framework and culture consistent with Prudential’s risk appetite that protects and enhances the Group’s embedded and franchise value.
Independent assurance (3rd LoD):Group Audit Committee: The committee, supported by Group-wide Internal Audit, provides independent assurance and oversight of the effectiveness of the Group’s system of internal control and risk management.
Principles and objectivesRisk is defined as the uncertainty that Prudential faces in successfully implementing its strategies and objectives. This includes all internal or external events, acts or omissions that have the potential to threaten the success and survival of Prudential.
The control procedures and systems established within the Group are designed to manage rather than eliminate the risk of failure to meet business objectives. They can only provide reasonable and not absolute assurance against material misstatement or loss and focus on aligning the levels of risk-taking with the achievement of business objectives.
Material risks will only be retained where this is consistent with Prudential’s risk appetite framework and its philosophy towards risk-taking, that is:
• the retention of the risk contributes to value creation;
• the Group is able to withstand the impact of an adverse outcome; and
• the Group has the necessary capabilities, expertise, processes and controls to manage the risk.
The Group has five objectives for risk and capital management:
Framework: Design, implement and maintain a capital management and risk oversight framework consistent with the Group’s risk appetite and Risk-Adjusted Profitability model.
Monitoring: Establish a ‘no surprises’ risk management culture by identifying the risk landscape, assessing and monitoring risk exposures and understanding change drivers.
Control: Implement risk mitigation strategies and remedial actions where exposures are deemed inappropriate and manage the response to extreme events.
Communication: Communicate the Group risk, capital and profitability position to internal and external stakeholders and rating agencies.
Culture: Foster a risk management culture, providing quality assurance and facilitating the sharing of best practice risk measurement and management across the Group.
ReportingThe Group’s economic capital position and overall position against risk limits is reviewed regularly by the Group Executive Risk Committee. Key economic capital metrics, as well as risk-adjusted profitability information, are included in business plans, which are reviewed by the Group Executive Committee and approved by the Board.
The Group Risk Committee is provided with regular reports on the activities of the Group Risk function and where it affects the results of assurances under Turnbull, the Group Audit Committee receives appropriate reporting. Reports to the Group Risk Committee include information on the activities of the Group Executive Risk Committee, the Group Operational Risk Committee and Group Credit Risk Committee, as well as reports from Group-wide Internal Audit.
Group Head Office oversight functions have clear escalation criteria and processes for the timely reporting of risks and incidents by business units. As appropriate, these risks and incidents are escalated to the various Group-level risk committees and the Board.
Internal business unit routine reporting requirements vary according to the nature of the business. Each business unit is responsible for ensuring that its risk reporting framework meets both the needs of the business unit (for example, reporting to the business unit risk and audit committees) and the minimum standards set by the Group (for example, to meet Group-level reporting requirements).
Business units review their risks as part of the annual preparation of their business plans, and review opportunities and risks against business objectives regularly with Group Head Office. Group Risk reviews and reports to Group Head Office on the impact of large transactions or divergences from the business plan.
RemunerationThe report on the responsibilities and activities of the Remuneration Committee can be found in the Directors’ Remuneration Report, which is set out on pages 134 to 157.

126
Prudential plc Annual Report 2011
Governance | Relations with shareholders
Relations with shareholders
Communication with shareholders As a major institutional investor, the Company is very aware of the importance of maintaining good relations with its shareholders. Discussions are held regularly with major shareholders and a programme of meetings took place throughout the year. In addition, Prudential also held an investor conference in November in Kuala Lumpur, Malaysia.
Board members regularly receive copies of the latest analysts’ and brokers’ reports on the Company and the sector to further develop their knowledge and understanding of external views about the Company. The Chairman and the non-executive directors provided feedback to the Board on topics raised with them by major shareholders. Should major shareholders wish to meet newly appointed directors, or any of the directors generally, they are welcome to do so.
The Group maintains a corporate website www.prudential.co.uk containing a wide range of relevant information for private and institutional investors, including the Group’s financial calendar. The shareholder information section on pages 476 and 477 contains further details which may be of interest to shareholders.
Annual General MeetingThe Annual General Meeting will be held in the Churchill Auditorium at The Queen Elizabeth II Conference Centre, Broad Sanctuary, Westminster, London SW1P 3EE on 17 May 2012 at 11.00am.
The Company believes the Annual General Meeting is an important forum for both institutional and private shareholders and encourages all its shareholders to vote. Shareholders are given the opportunity during annual general meetings to put questions to the Board on matters relating to the Group’s operations and performance.
At the 2011 Annual General Meeting the Company continued its practice of calling a poll on all resolutions. The voting results and all proxies lodged prior to the meeting were displayed at the meeting and published on the Company’s website. This practice provides shareholders present with sufficient information regarding the level of support and opposition to each resolution and ensures all votes cast either at the meeting or through proxies are included in the result.
Shareholders holding 5 per cent or more of the fully paid up issued share capital of the Company, are able to require the directors to hold a general meeting. If the shareholders’ request identifies a resolution to be moved at the meeting, the resolution must be included in the notice of meeting. Where such a request has been duly lodged with the Company, the directors are obliged to call a general meeting within 21 days of becoming
subject to the request and must set a date for the meeting not more than 28 days from the date of the issue of the notice. Shareholders can also require the Company to circulate a statement of not more than 1,000 words on the subject matter of the resolution. Shareholders need not cover the costs of circulating such statements where the requests relate to the annual general meeting of a public company and provided sufficient requests to require the circulation are received prior to the financial year end preceding the meeting. Written shareholder requests should be addressed to the Company Secretary at the registered office.
Company constitutionThe Company is governed by the Companies Act 2006, other applicable legislation and regulation as well as by provisions of its Articles of Association. The Memorandum and Articles of Association are available on our website at www.prudential.co.uk/prudential-plc/aboutpru/memorandum
Any change to the Articles must be approved by special resolution of the shareholders in accordance with the provisions of the Companies Act 2006. There were no changes to the Company’s constitutional documents during 2011.
Share capital On 31 December 2011, the Company’s issued share capital, which is set out in note H11 on page 337, consisted of 2,548,039,330 (2010: 2,545,594,506) ordinary shares of 5 pence each, all fully paid up and listed on the London Stock Exchange and the Stock Exchange of Hong Kong. Subject to applicable local securities law, the Company’s shares may be registered on the main register in the UK or the Company’s branch registers in Ireland or Hong Kong. The number of accounts on the share registers at 31 December 2011 was 63,338 (2010: 66,048). The Company maintains secondary listings on the New York Stock Exchange in the form of American Depositary Receipts which are referenced to ordinary shares on the main UK register, under a depositary agreement with J.P. Morgan, and on the Singapore Stock Exchange in the form of interests in shares, which are referenced to the shares on the Hong Kong register under a depository agreement with the Central Depository (Pte) Limited (the ‘CDP’).
In compliance with the Hong Kong Listing Rules, the Company has maintained a sufficiency of public float throughout the period.
A number of dividend waivers are in place and these relate to shares issued but not allocated under the Group’s employee share plans. These shares are held by the Trustees and will, in due course, be used to satisfy requirements under the Group’s employee share plans.

127G
ov
ern
an
ce
Rights and obligations The rights and obligations attaching to the Company’s shares are set out in full in the Company’s Articles of Association. There are currently no voting restrictions on the ordinary shares, all of which are fully paid, and each share carries one vote on a poll. If votes are cast on a show of hands, each shareholder present in person or by proxy, or in the case of a corporation, each of its duly authorised corporate representatives, has one vote except that if a proxy is appointed by more than one member, the proxy has one vote for and one vote against if instructed by one or more members to vote for the resolution and by one or more members to vote against the resolution.
Where, under an employee share plan operated by the Company, participants are the beneficial owners of the shares but not the registered owners, the voting rights are normally exercisable by the registered owner in accordance with the relevant plan rules. Trustees may vote at their discretion, but do not vote on any unawarded shares held as surplus assets.
As at 12 March 2012, Trustees held 0.31 per cent of the issued share capital of the Company under the various plans in operation.
Rights to dividends under the various schemes are set out in note I4 on page 363.
Restrictions on transferIn accordance with English company law, shares may be transferred by an instrument of transfer or through an electronic system (currently CREST) and transfer is not restricted except that the directors may in certain circumstances refuse to register transfers of shares, but only if such refusal does not prevent dealings in the shares from taking place on an open and proper basis. If the directors make use of that power, they must send the transferee notice of the refusal within two months.
Certain restrictions may be imposed from time to time by applicable laws and regulations (for example, insider trading laws) and pursuant to the Listing Rules of both the Financial Services Authority and the Stock Exchange of Hong Kong, as well as Prudential’s own share dealing rules, whereby directors and certain employees of the Company require the approval of the Company to deal in the Company’s ordinary shares.
Some of the Company’s employee share plans include restrictions on transfer of shares while the shares are subject to the plan. All directors are required to obtain a number of qualification shares within one year of appointment, which they would also be expected to retain under guidelines approved by the Board and as described on page 143 of the Directors’ Remuneration Report.
Significant shareholdingsAs at 31 December 2011, the Company had received notification of interests in the shares of Prudential plc, in accordance with Rule 5.1.2 R of the Disclosure and Transparency Rules of the Financial Services Authority, from Capital Research and Management Company, BlackRock Inc., Norges Bank and Legal and General Group plc that they held 9.91 per cent, 4.99 per cent, 4.03 per cent and 3.99 per cent respectively of the Company’s ordinary issued share capital at the time of notification. No further notifications have been received between the end of 2011 and the date of this report.
Authority to issue sharesThe directors require authority from shareholders in relation to the issue of shares by the Company. Whenever shares are issued the Company has to offer the shares to existing shareholders pro rata to their holdings unless it has been given authority by shareholders to issue shares without offering them first to existing shareholders. The Company seeks authority from its shareholders on an annual basis to issue shares up to a maximum amount and to issue up to 5 per cent of its issued share capital without observing pre-emption rights, in line with relevant regulations and best practice. Dis-application of statutory pre-emption procedures is also sought for rights issues. The Company’s existing authorities to issue shares and to do so without observing pre-emption rights are due to expire at the end of this year’s Annual General Meeting. An ordinary resolution and a special resolution to approve the renewal of these authorities respectively will be put to shareholders at the Annual General Meeting on 17 May 2012.
Details of shares issued during 2011 and 2010 are given in note H11 on page 337.
In accordance with the terms of a waiver granted by the Hong Kong Stock Exchange, the Company confirms that it complies with the applicable law and regulation in the UK in relation to the holding of shares in treasury and with the conditions of the waiver in connection with the purchase of own shares and any treasury shares it may hold.
Authority to purchase own sharesThe directors also require authority from shareholders in relation to the purchase of own shares by the Company. The Company seeks authority by special resolution on an annual basis for the buyback of its own shares in accordance with the relevant provisions of the Companies Act 2006 and other related guidance. The Company has not made use of that authority since it was last granted at its Annual General Meeting in 2011. This existing authority is due to expire at the end of this year’s Annual General Meeting. A special resolution to approve the renewal of this authority will be put to shareholders at the Annual General Meeting on 17 May 2012.

128
Prudential plc Annual Report 2011
Governance | Relations with shareholders | continued
Relations with shareholders
Model code for securities transactions by directorsThe Company confirms that it has adopted a code of conduct regarding securities transactions by directors on terms no less exacting than required by Appendix 10 of the Hong Kong Listing Rules, and that the directors of the Company have complied with this code of conduct throughout the period.
US corporate governance and regulations As a result of the listing of its securities on the New York Stock Exchange, the Company is required to comply with the relevant provisions of the Sarbanes-Oxley Act 2002 (the ‘Act’) as they apply to foreign private issuers and has adopted procedures to ensure this is the case.
In particular, in relation to the provisions of Section 302 of that Act, which covers disclosure controls and procedures, a Disclosure Committee has been established reporting to the Group Chief Executive, chaired by the Chief Financial Officer and comprising members of senior management. The objectives of this Committee are to:
• assist the Group Chief Executive and the Chief Financial Officer in designing, implementing and periodically evaluating the Company’s disclosure controls and procedures;
• monitor compliance with the Company’s disclosure controls and procedures;
• review and provide advice to the Group Chief Executive and Chief Financial Officer with regard to the scope and content of all public disclosures made by the Company which are of material significance to the market or investors; and
• review and consider, and where applicable follow up on, matters raised by other components of the disclosure process. These may include, to the extent they are relevant to the disclosure process, any matters to be raised with the Group Audit Committee, the internal auditors or the external auditor on the Company’s internal controls.
In discharging these objectives, the Committee helps to support the certifications by the Group Chief Executive and the Chief Financial Officer of the effectiveness of disclosure procedures and controls required by Section 302 of the Act.
The provisions of Section 404 of the Act require the Company’s management to report on the effectiveness of internal controls over financial reporting in its annual report on Form 20-F, which is filed with the US Securities and Exchange Commission. To comply with this requirement to report on the effectiveness of internal control, the Group has documented and tested its internal controls over financial reporting in the format required by the Act. The annual assessment and related report from the external auditor will be included in the Group’s annual report on Form 20-F.
In addition, the Disclosure Committee evaluates whether or not a particular matter requires disclosure to the market, taking into account relevant regulations and reviews all forward looking statements.

129G
ov
ern
an
ce
The Board is committed to achieving the highest standards of corporate responsibility in directing and controlling the business. In terms of the governance of our corporate responsibility strategy, Harvey McGrath, Chairman, has Board level responsibility for social, environmental and ethical risk management. The Board discusses Prudential’s performance in these areas at least once a year and also reviews and approves Prudential’s corporate responsibility report and strategy on an annual basis.
Below Board level, the Responsibility Committee is a specialist Group-wide committee. This committee is responsible for reviewing Prudential’s business conduct and social and environmental policy and ensures consistency of approach across the Group’s international businesses. Consideration of environmental, social and community matters is embedded in our Code of Business Conduct and supported by our corporate responsibility philosophy and programme, which takes into account local cultures and requirements across our businesses.
The Corporate Responsibility team, which is located in our Group Head Office, develops Prudential’s corporate responsibility strategy and works closely with individual business units to provide advice. The team also assists with the development and adaptation of Group-wide initiatives so that they not only fit with our overall Group principles but are also adapted to meet local needs.
Governance | Corporate responsibility governance
Corporateresponsibilitygovernance
130
Prudential plc Annual Report 2011
130
Prudential plc Annual Report 2011
Additional disclosures
Governance | Additional disclosures
The following additional disclosures are made in compliance with the Companies Act 2006, the Disclosure and Transparency Rules and the Corporate Governance Codes.
Financial reporting The directors have a duty to report to shareholders on the performance and financial position of the Group and are responsible for preparing the financial statements on pages 163 to 382 and the supplementary information on pages 385 to 432. It is the responsibility of the auditor to form independent opinions, based on its audit of the financial statements and its audit of the EEV basis supplementary information; and to report its opinions to the Company’s shareholders and to the Company. Its opinions are given on pages 384 and 434.
Company law requires the directors to prepare financial statements for each financial year which give a true and fair view of the state of affairs of the Company and of the Group. The criteria applied in the preparation of the financial statements are set out in the statement of directors’ responsibilities on pages 383 and 433.
The directors are further required to confirm that the directors’ report includes a fair review of the development and performance of the business, with a description of the principal risks and uncertainties. Such confirmation is included in the statement of directors’ responsibilities on pages 383 and 433.
The Chief Financial Officer’s Review provides, on pages 80 to 90, a description of the Group’s risk and capital management, which includes a description of the Group’s liquidity position. These risks are also discussed in Note C to the financial statements on page 215. The Group has considerable internal and external financial resources and the directors believe that the Group is well placed to manage its business risks successfully.
The directors who held office at the date of approval of this directors’ report confirm that, so far as they are each aware, there is no relevant audit information of which the Company’s auditor is unaware; and each director has taken all the steps that he or she ought to have taken as a director to make himself or herself aware of any relevant audit information and to establish that the Company’s auditor is aware of that information. This confirmation is given and should be interpreted in accordance with the provisions of section 418 of the Companies Act 2006.
Going Concern After making enquiries the directors have a reasonable expectation that the Company and the Group have adequate resources to continue their operations for the foreseeable future. In support of this expectation, the Company’s business activities, together with the factors likely to affect its future development, successful performance and position in the current economic climate are set out in the Business Review on pages 15 to 106. The risks facing the Group’s capital and liquidity positions and their sensitivities are referred to in the Chief Financial Officer’s Review. Specifically, the Group’s borrowings are detailed in note H13 on pages 340 to 342, the market risk and liquidity
analysis associated with the Group’s assets and liabilities can be found in note G2 on pages 316 to 320, policyholder liability maturity profile by business units in notes D2, D3, D4 on pages 244, 266 and 275 respectively, cash flow details in the consolidated statement of cash flows and provisions and contingencies in note H14. The directors therefore have continued to adopt the going concern basis of accounting in preparing the financial statements.
Post-balance sheet events Important events affecting the Company after the end of the financial year are detailed in note I11 on page 370.
Change of controlUnder the agreements governing Prudential Corporation Holdings Limited’s life insurance and fund management joint ventures with China International Trust & Investment Corporation (‘CITIC’), if there is a change of control of the Company, CITIC may terminate the agreements and either (i) purchase the Company’s entire interest in the joint venture or require the Company to sell its interest to a third party designated by CITIC, or (ii) require the Company to purchase all of CITIC’s interest in the joint venture. The price of such purchase or sale is to be the fair value of the shares to be transferred, as determined by the auditor of the joint venture.
Essential contracts or arrangementsThere are a number of significant relationships with third parties, which have value to the business. No single relationship, however, is considered to be essential to the Group as a whole.
At no time during the year did any director hold a material interest in any contract of significance with the Company or any subsidiary undertaking.
Compensation for loss of office None of the terms of employment of the Company’s directors includes provisions for payment of compensation for loss of office or employment that occurs as a result of a change of control. Terms applying on a termination of their office are set out in the Directors’ Remuneration Report. In the US senior executives participate on a discretionary basis in a plan which entitles them to compensation, in the event that their employment is terminated or adversely affected as a result of a change of control.
CustomersThe five largest customers of the Group constituted in aggregate less than 30 per cent of its total sales for each of 2011 and 2010.
For the year ended 31 December 2011, none of the directors of the Company, their associates or any shareholders of the Company (which have, to the knowledge of the directors of the Company, owned more than 5 per cent of the Company’s issued share capital) had any interest in the Group’s major customers.

131G
ov
ern
an
ce131
Go
ve
rna
nce
Index to principal directors’report disclosures
Information required to be disclosed in the directors’ report may be found in the following sections:
Information Section in Annual Report Page number(s)
Business review Business review 15-106
Essential contracts or arrangements Additional disclosures 130
Disclosure of information to auditor Additional disclosures 130
Directors in office during the year Board of directors 108-112; 115
Principal activities Business review 4-5; 91-94
Dividend recommended for the year Business review 67
Details of qualifying third-party indemnity provisions Corporate governance 117
Political and charitable donations and expenditure Corporate responsibility review 105
Financial instruments – risk management objectives and policies
Business review 76
Post-balance sheet events Note I11 of the Notes on the Group financial statements and Additional disclosures
370
Future developments of the business of the Company Group Chief Executive’s report 14
Employment policies and employee involvement Corporate responsibility review 99-101
Creditors – policy on payment and practice Corporate responsibility review 106
Structure of share capital, including restrictions on the transfer of securities, voting rights and significant shareholders
Corporate governance 126-127
Rules governing appointments of directors Corporate governance 115
Rules governing changes to the articles of association Corporate governance 126
Powers of directors Corporate governance 113
Significant agreements impacted by a change of control Additional disclosures 130
Agreements for compensation for loss of office or employment on takeover
Additional disclosures 130
In addition, the risk factors set out on pages 466 to 470 and the additional unaudited financial information set out on pages 436 to 463 are incorporated by reference into this directors’ report.
Signed on behalf of the Board of Directors
Margaret ColtmanCompany Secretary12 March 2012
Governance | Index to principal directors’ report disclosures

132
Prudential plc Annual Report 2011

Section 4
Directors’remuneration report
134 Directors’remunerationreport
133D
irecto
rs’re
mu
ne
ration
repo
rt

134
Prudential plc Annual Report 2011
Directors’ remuneration report
DearShareholderI am pleased to present the Remuneration Committee’s report on directors’ remuneration for the year to 31 December 2011.
This report is the first prepared since I became Chairman of the Remuneration Committee in June 2011. I would like to take this opportunity to thank my predecessor, Bridget Macaskill, for her contribution to the Committee over the last eight years. I would also like to welcome Kai Nargolwala, who joined the Committee on 1 January 2012.
OuraimsThe primary aims of our remuneration policy remain unchanged:
• To attract and retain the high calibre executives required to lead and develop the Group, and
• To reward executives for delivering our business plans and generating sustainable growth and returns for shareholders.
In order to achieve the first of these aims, the Committee reviews remuneration packages regularly, taking account of individual performance and contributions, and information about the reward offered by the UK and overseas organisations with which we compete for executive talent.
In order to achieve the second of these aims, the Group’s reward arrangements are robustly connected to the achievement of its key financial objectives and support its approach to risk management. The Group believes that increasing new business profitability, IFRS profitability and cash generation simultaneously will create sustainable growth. The combination of measures used to determine annual bonuses rewards the achievement of all three of these objectives, attained whilst maintaining adequate levels of capital and adhering to the Group’s risk appetite. The performance measure for our Group long-term incentive plan is Total Shareholder Return (the combination of share price growth and dividends paid). This performance measure ensures that the interests of our executives are closely aligned with those of shareholders.
RewardingstrongperformanceThe financial results presented earlier in this Annual Report show that the Group delivered increases in new business profits, IFRS profits and cash generation during 2011. This growth outstripped both the stretching targets set by the Committee at the start of 2011 and market expectations, notwithstanding challenging global market conditions. These results were achieved whilst maintaining better than adequate levels of capital and working within the Group’s risk appetite. The 2011 bonuses awarded to executive directors recognise this outstanding achievement.
Our 2011 results built on the strong performance over recent years which has delivered significant value to our shareholders. Over the last three financial years, Prudential’s share price and dividend payments have grown; £1 invested in Prudential in January 2009 was worth more than £2 at the end of December 2011. This return for shareholders has significantly outperformed that produced by our peers in the international insurance industry. Since the growth of our share price and dividend payments relative to an index of our peers determines the vesting of Group Performance Share Plan awards, the awards made in 2009 will be released in full.
ReviewingthestructureofremunerationforthefutureThe structure of remuneration arrangements for Prudential’s executive team has remained substantially unchanged since 2006. During the course of 2012, the Remuneration Committee will undertake a review of these arrangements to ensure that the Group’s reward structure continues to give the Company a competitive advantage in the international talent market and that it aligns the pay of executives with the Group’s business strategy and ambitions. This review will take account of the new regulatory requirements of Solvency II and evolving guidelines, regulations and legislation. Information about any resulting proposals and changes will be provided in the Committee’s report for 2012.
The UK Government has put forward proposals aimed at increasing the information available to shareholders in the remuneration report. We have anticipated the likely changes and, in the spirit of transparency, have included additional information on the compensation for our directors in 2012 in this year’s report. You will see that we are continuing to ensure that our total remuneration packages remain competitive. The structure of remuneration for 2012 is substantially the same as that in 2011 and it will reward the delivery of the Group’s business priorities and returns to shareholders.
I trust that you will support the policies outlined in our 2011 report.
Lord TurnbullChairman, Remuneration Committee12 March 2012
Directors’ remuneration report

135D
irecto
rs’re
mu
ne
ration
repo
rt
Directors’ remuneration report
Thedirectors’remunerationreporthasbeenpreparedbytheRemunerationCommittee(the‘Committee’)andhasbeenapprovedbytheBoard.ShareholderswillbegiventheopportunitytoapprovethereportattheAnnualGeneralMeetingon17May2012.
This report has been drawn up in accordance with the UK Corporate Governance Code, Schedule 8 of the Large and Medium Sized Companies and Groups (Accounts and Reports) Regulations 2008, the UK Listing Authority Listing Rules and the Code on Corporate Governance Practices in Appendix 14 of the Rules Governing the Listing of Securities on the Stock Exchange of Hong Kong. KPMG Audit Plc has audited the information provided on pages 148 to 156.
During the year, the Company has complied with the provisions of Section D and Schedule A of the UK Corporate Governance Code which are in force regarding directors’ remuneration.
TheRemunerationCommitteeThe Committee is responsible for:
• Determining the remuneration policy for the Chairman and approving the remuneration of the executive directors of the Company;
• Monitoring the remuneration of a defined leadership population and for individuals with the opportunity to earn over £1 million per annum.
The Committee’s terms of reference are available on the Company’s website and a copy may be obtained from the Company Secretary. These terms of reference are reviewed annually.
Each business unit also has its own remuneration committee, with similar terms of reference, to ensure effective remuneration governance in all our businesses.
The members of the Committee during 2011 are listed below. All are independent non-executive directors:
• LordTurnbullKCBCVO(Chairmanfrom14June2011)• KekiDadiseth• MichaelGarrett• BridgetMacaskill(until14June2011)• PaulManduca
KaiNargolwalajoinedtheCommitteeon1January2012
In 2011, the Committee met seven times. Key activities at each meeting are shown in the table below:
Meeting Keyactivities
February 2011 • Reviewtherequirementsofthelatestgovernanceguidelinesandconsultations,includingtheFSA’srevisedRemunerationCode;
• Approvethe2010Directors’remunerationreport;• Consider2010annualbonusesandthevestingof2008long-termincentiveawards.
March 2011 (2 meetings)
• Determine2010annualbonusesandthevestingof2008long-termincentiveawardsinlightofauditedfinancialresultsfor2010.
April 2011 • ReviewoftherewardimplicationsofM&G’sbusinessmodelandKPIs;• Approvetheperformancemeasurestobeusedforannualbonusesandlong-termincentiveawards.
June 2011 • ConsidertheremunerationoftheGroupLeadershipTeam(comprisingaround100seniorindividualsincludingtheGroupExecutiveCommittee),seniorriskstaffandofemployeeswitharemunerationopportunityover£1millionperannum;
• Considertrendsinremunerationcorporategovernanceandthecompetitivelandscape;• Reviewcurrentexecutiveremunerationstructures;• NotethedilutionlevelsresultingfromtheCompany’sshareplans.
September 2011 • ReviewthestructureofremunerationforstaffintheGroupRiskfunction;• Monitorperformanceagainstlong-termincentivetargetstothemidyear;• Agreethetimelineforthereviewofexecutiveremunerationstructure.
December 2011 • NotethelevelofparticipationintheCompany’sall-employeeshareplans;• Reviewtherequirementsofthelatestgovernanceguidelinesandconsultations;• Providefeedbackonanumberofexecutiveremunerationstructurealternatives;• Considertheinitialdraft2011Directors’remunerationreport;• Reviewthesalariesandincentiveopportunitiesforexecutivedirectorsin2012;• Considerthemeasurestobeusedfor2012annualbonuses;• Approvetheshareholdingguidelinespolicy;• ApprovetheCommittee’sTermsofReferenceand2012workplan;• AppointtheindependentadvisertotheRemunerationCommittee.
136
Prudential plc Annual Report 2011
Directors’ remuneration report | continued
Directors’ remuneration report
The Chairman and the Group Chief Executive attend meetings by invitation. The Committee also had the benefit of advice from the Chief Financial Officer, Group Chief Risk Officer, Group Human Resources Director and Director of Group Reward and Employee Relations. Individuals are never present when their own remuneration is discussed.
During 2011 Deloitte LLP were reappointed as the independent adviser to the Committee following a competitive tender process. Advice was also provided by PricewaterhouseCoopers LLP. Market data was sourced from Deloitte LLP, PricewaterhouseCoopers LLP, Towers Watson, McLagan Partners and LOMA. Linklaters, Norton Rose and Slaughter & May provided legal counsel, including advice on employment law and the operation of the Company’s share plans. Some of these firms also provided other services to the Company: Deloitte LLP and PricewaterhouseCoopers LLP in relation to Solvency II, taxation and other financial matters, Towers Watson in relation to actuarial advice and Slaughter & May and Norton Rose in relation to commercial, corporate and general legal advice.
RemunerationprinciplesThe primary aims of our remuneration policy are:
• To attract and retain the high calibre executives required to lead and develop the Group, and
• To reward executives for delivering our business plans and generating sustainable growth and returns for shareholders.
In order to achieve these aims, the Committee applies the following principles:
• A substantial portion of total remuneration is delivered through performance-related reward with the highest levels of reward only being paid for the highest levels of achievement;
• A significant element of performance-related reward is provided in the form of shares;
• The total remuneration package for each executive director is set with reference to the relevant employment market;
• The performance of executive directors responsible for business units is measured at both a business unit and Group level;
• Performance measures include absolute financial measures and relative measures, as appropriate, to provide alignment between achieving results for shareholders and the rewards for executives;
• Reward structures are designed to deliver fair and equitable remuneration for all employees; and
• Reward arrangements are designed to be consistent with the Group’s risk appetite and minimise regulatory and operational risk.
These principles shape remuneration policies and practices which are aligned with our business model. They are designed to ensure that a strong governance approach is adopted and applied across all business units. The Committee continues to review these principles regularly.

137D
irecto
rs’re
mu
ne
ration
repo
rt
SummaryofmaincomponentsofremunerationandrelatedrequirementsThe table below summarises the Company’s policies as they were applied during 2011:
Element Purpose Approach
Total compensation
Adoptsappropriatecompensationstructuresandrewardpayoutstoattracthighcalibreexecutivedirectors.
Benchmarked against the relevant market for the role, taking into account the individual’s contribution and experience. Market position is compared with companies of similar size and complexity to Prudential in the relevant market(s) for the role.
Consideration is also given to remuneration arrangements and levels offered to other Prudential employees.
Base salary Alongwithbenefits,providestheguaranteedelementofremunerationnecessarytorecruitandretainthebestpeopletoleadourbusiness.
Based on the scope of role and market position, as well as the individual’s contribution and experience, taking into account total remuneration, market movement of salaries in comparator organisations and salary increases for employees generally.
The Committee reviews salaries annually. Changes in base salaries are generally effective from 1 January.
Annual bonus Rewardstheachievementofbusinessresultsandindividualobjectivesinagivenyear.
Deferralreinforcestheneedforannualresultstobegroundedinbusinessperformancewhichissustainedoverthelongerterm.
Executive directors have annual bonus plans based on the achievement of Group and business unit financial performance measures and personal objectives. 2011 Group and business unit targets focused on profitability, cash flow and capital preservation.
Executive directors are required to defer between 30 per cent and 50 per cent of annual bonus (for Michael McLintock, 50 per cent of bonus over £500,000 is deferred) into Prudential shares for three years.
Bonuses are not pensionable.
Long-term incentive
Rewardsexecutivedirectorsfordeliveringsustainablelong-termreturnsforshareholders.
All executive directors participate in the Group Performance Share Plan (GPSP) under which awards vest based on relative TSR (Total Shareholder Return, a combination of share price growth and dividends paid) performance relative to an index of international insurers.
Business unit Chief Executives also participate in business unit plans that focus on financial measures which contribute to the long-term success of the business unit and, therefore, the Group. Given the cash-generative priorities of the UK business unit, the Chief Executive of UK & Europe participates in a plan using the same TSR measures as the GPSP.
Shareholding guidelines
EncourageexecutivestobuildaninterestintheCompany’ssharesandsupportalignmentwithshareholderinterests.
The Group Chief Executive and Chief Executive of M&G are required to build up and hold shares equal to 200 per cent of base salary. Other executive directors are required to build up and hold shares equal to 100 per cent of base salary.
All-employee share plans
OfferallemployeesanopportunitytoparticipateinthesuccessoftheCompany.
The structure of plans is determined by local market practice and legislation. Executive directors are eligible to participate in all-employee plans on the same basis as other employees in their location.
Benefits Providehealthandsecuritybenefitsaspartofthefixedelementofremuneration.
Set at an appropriate level. Executive directors receive benefits, for example participation in medical insurance schemes, health assessments, the use of a car and driver, and security arrangements.
No benefits are pensionable.
Pension Providesopportunitiesforexecutivedirectorstosaveforanincomeinretirementinacostefficientmanner.
It is the Company’s policy to provide efficient pension plans to allow executive directors to save for their retirement. The Company’s policy for all external appointments since June 2003 has been to provide a pension contribution as a fixed percentage of salary.
The level of the Company’s pension contribution is related to competitive practice in the executive directors’ employment markets.
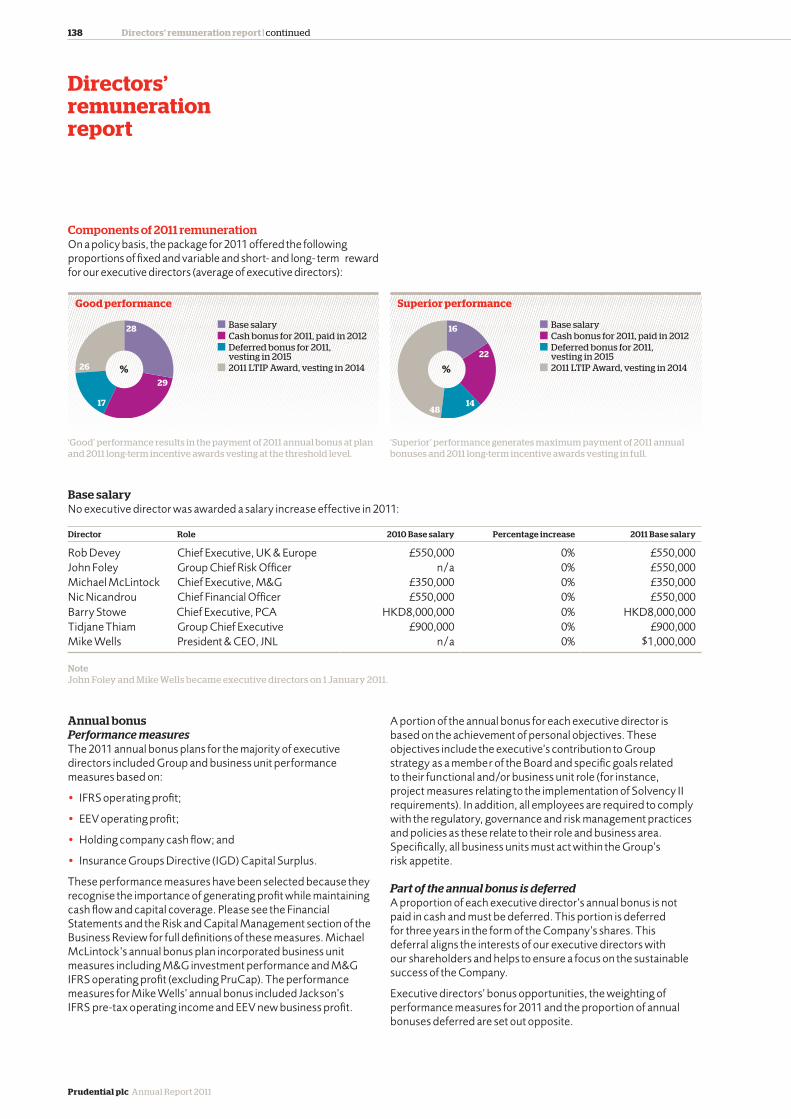
138
Prudential plc Annual Report 2011
Directors’ remuneration report | continued
Directors’ remuneration report
Componentsof2011remunerationOn a policy basis, the package for 2011 offered the following proportions of fixed and variable and short- and long- term
Good performance
%26
17
28
29
Base salaryCash bonus for 2011, paid in 2012Deferred bonus for 2011, vesting in 20152011 LTIP Award, vesting in 2014
reward for our executive directors (average of executive directors):
Superior performance
Base salaryCash bonus for 2011, paid in 2012Deferred bonus for 2011, vesting in 20152011 LTIP Award, vesting in 2014
4814
16
22
%
‘Good’ performance results in the payment of 2011 annual bonus at plan and 2011 long-term incentive awards vesting at the threshold level.
‘Superior’ performance generates maximum payment of 2011 annual bonuses and 2011 long-term incentive awards vesting in full.
BasesalaryNo executive director was awarded a salary increase effective in 2011:
Director Role 2010Basesalary Percentageincrease 2011Basesalary
Rob Devey Chief Executive, UK & Europe £550,000 0% £550,000John Foley Group Chief Risk Officer n/a 0% £550,000Michael McLintock Chief Executive, M&G £350,000 0% £350,000Nic Nicandrou Chief Financial Officer £550,000 0% £550,000Barry Stowe Chief Executive, PCA HKD8,000,000 0% HKD8,000,000Tidjane Thiam Group Chief Executive £900,000 0% £900,000Mike Wells President & CEO, JNL n/a 0% $1,000,000
NoteJohn Foley and Mike Wells became executive directors on 1 January 2011.
AnnualbonusPerformance measuresThe 2011 annual bonus plans for the majority of executive directors included Group and business unit performance measures based on:
• IFRS operating profit;
• EEV operating profit;
• Holding company cash flow; and
• Insurance Groups Directive (IGD) Capital Surplus.
These performance measures have been selected because they recognise the importance of generating profit while maintaining cash flow and capital coverage. Please see the Financial Statements and the Risk and Capital Management section of the Business Review for full definitions of these measures. Michael McLintock’s annual bonus plan incorporated business unit measures including M&G investment performance and M&G IFRS operating profit (excluding PruCap). The performance measures for Mike Wells’ annual bonus included Jackson’s IFRS pre-tax operating income and EEV new business profit.
A portion of the annual bonus for each executive director is based on the achievement of personal objectives. These objectives include the executive’s contribution to Group strategy as a member of the Board and specific goals related to their functional and/or business unit role (for instance, project measures relating to the implementation of Solvency II requirements). In addition, all employees are required to comply with the regulatory, governance and risk management practices and policies as these relate to their role and business area. Specifically, all business units must act within the Group’s risk appetite.
Part of the annual bonus is deferredA proportion of each executive director’s annual bonus is not paid in cash and must be deferred. This portion is deferred for three years in the form of the Company’s shares. This deferral aligns the interests of our executive directors with our shareholders and helps to ensure a focus on the sustainable success of the Company.
Executive directors’ bonus opportunities, the weighting of performance measures for 2011 and the proportion of annual bonuses deferred are set out opposite.
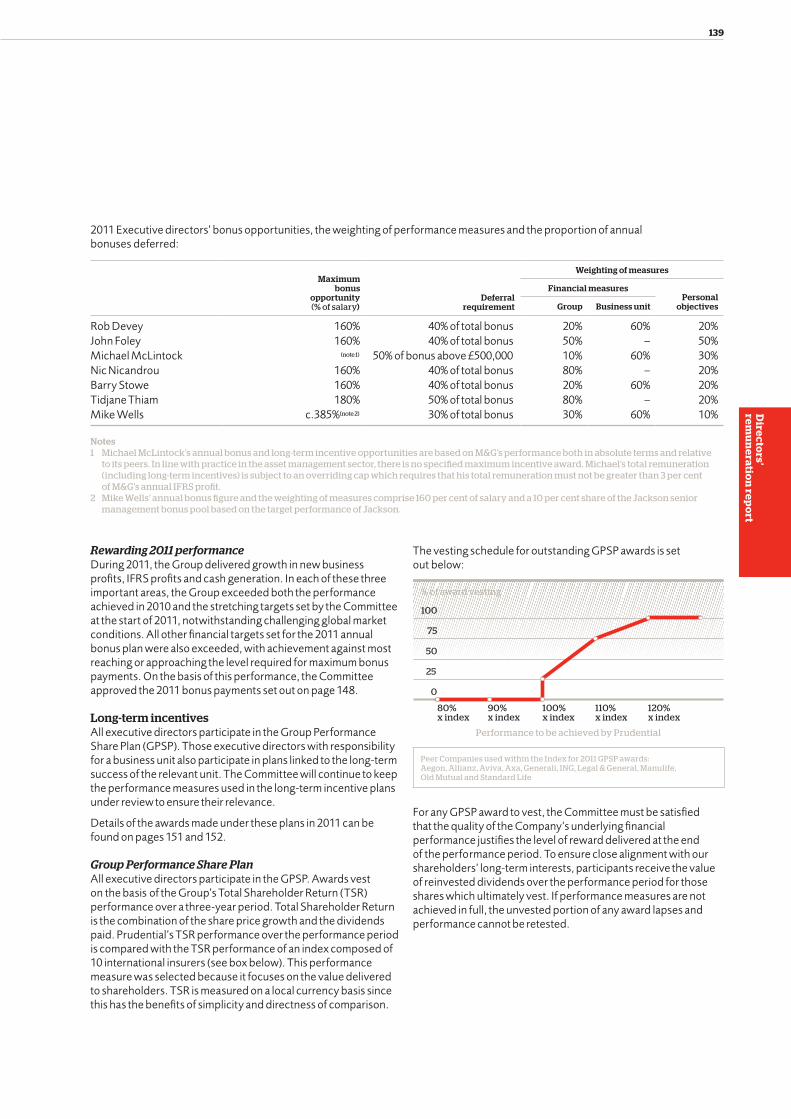
139D
irecto
rs’re
mu
ne
ration
repo
rt
2011 Executive directors’ bonus opportunities, the weighting of performance measures and the proportion of annual bonuses deferred:
Maximumbonus
opportunity (% of salary)
Deferralrequirement
Weightingofmeasures
FinancialmeasuresPersonal
objectivesGroup Businessunit
Rob Devey 160% 40% of total bonus 20% 60% 20%John Foley 160% 40% of total bonus 50% – 50%Michael McLintock (note 1) 50% of bonus above £500,000 10% 60% 30%Nic Nicandrou 160% 40% of total bonus 80% – 20%Barry Stowe 160% 40% of total bonus 20% 60% 20%Tidjane Thiam 180% 50% of total bonus 80% – 20%Mike Wells c.385%(note 2) 30% of total bonus 30% 60% 10%
Notes1 Michael McLintock’s annual bonus and long-term incentive opportunities are based on M&G’s performance both in absolute terms and relative
to its peers. In line with practice in the asset management sector, there is no specified maximum incentive award. Michael’s total remuneration (including long-term incentives) is subject to an overriding cap which requires that his total remuneration must not be greater than 3 per cent of M&G’s annual IFRS profit.
2 Mike Wells’ annual bonus figure and the weighting of measures comprise 160 per cent of salary and a 10 per cent share of the Jackson senior management bonus pool based on the target performance of Jackson.
Rewarding 2011 performanceDuring 2011, the Group delivered growth in new business profits, IFRS profits and cash generation. In each of these three important areas, the Group exceeded both the performance achieved in 2010 and the stretching targets set by the Committee at the start of 2011, notwithstanding challenging global market conditions. All other financial targets set for the 2011 annual bonus plan were also exceeded, with achievement against most reaching or approaching the level required for maximum bonus payments. On the basis of this performance, the Committee approved the 2011 bonus payments set out on page 148.
Long-termincentivesAll executive directors participate in the Group Performance Share Plan (GPSP). Those executive directors with responsibility for a business unit also participate in plans linked to the long-term success of the relevant unit. The Committee will continue to keep the performance measures used in the long-term incentive plans under review to ensure their relevance.
Details of the awards made under these plans in 2011 can be found on pages 151 and 152.
Group Performance Share PlanAll executive directors participate in the GPSP. Awards vest on the basis of the Group’s Total Shareholder Return (TSR) performance over a three-year period. Total Shareholder Return is the combination of the share price growth and the dividends paid. Prudential’s TSR performance over the performance period is compared with the TSR performance of an index composed of 10 international insurers (see box below). This performance measure was selected because it focuses on the value delivered to shareholders. TSR is measured on a local currency basis since this has the benefits of simplicity and directness of comparison.
The vesting schedule for outstanding GPSP awards is set out below:
% of award vesting
120%x index
110%x index
100%x index
90%x index
80%x index
0
25
75
50
100
Performance to be achieved by Prudential
Peer Companies used within the Index for 2011 GPSP awards:Aegon, Allianz, Aviva, Axa, Generali, ING, Legal & General, Manulife, Old Mutual and Standard Life
For any GPSP award to vest, the Committee must be satisfied that the quality of the Company’s underlying financial performance justifies the level of reward delivered at the end of the performance period. To ensure close alignment with our shareholders’ long-term interests, participants receive the value of reinvested dividends over the performance period for those shares which ultimately vest. If performance measures are not achieved in full, the unvested portion of any award lapses and performance cannot be retested.

140
Prudential plc Annual Report 2011
Directors’ remuneration report | continued
Directors’ remuneration report
On 31 December 2011, the performance period for the 2009 GPSP award (which began on 1 January 2009) came to an end. The peer group used for this award was the 10 companies listed above plus Friends Provident (Friends Provident is included in the calculation until its delisting in November 2009). Since the peer group’s TSR index was 100 at the start of the 2009 to 2011 performance period and was 120 at the end of the period, (as illustrated below) in order for the 2009 GPSP awards to vest in full, Prudential’s TSR index over the period had to increase from 100 to at least 144 (ie 120 x 1.2). The Committee believes that this is a stretching requirement that requires exceptional performance, relative to other international insurance companies, for awards to be released in full.
Prudential’s TSR performance over this period was 201.84, equal to 169 per cent of the peer index. The Committee, having satisfied itself about the quality of the Company’s underlying financial performance, confirmed vesting of 100 per cent of the 2009 GPSP award (for reference, 100 per cent of the 2008 GPSP award vested).
The line chart below compares Prudential’s Total Shareholder Return (TSR) during the three years from 1 January 2009 to 31 December 2011 with that of the peer group against which TSR is measured for the purposes of the GPSP.
Jan 2009 Dec 2011Dec 2010Dec 2009
Prudential Peer group index
220
200
180
160
140
120
100
Prudential TSR v peer group total returns index % over the three years to December 2011
201.84
119.62
Business Unit Performance Plan (BUPP)For executives with regional responsibilities, the Business Unit Performance Plan (BUPP) provides awards which vest subject to performance over a three-year period.
For any BUPP award to vest, the Committee must be satisfied that the quality of underlying financial performance of the relevant business unit justifies the level of reward delivered at the end of the performance period. To ensure close alignment with our shareholders’ long-term interests, participants receive the value of reinvested dividends over the performance period for those shares which ultimately vest. If the performance conditions are not achieved in full, the unvested portion of any award lapses and cannot be retested.
Asia BUPPIn 2009, 2010 and 2011 Barry Stowe was granted Asia BUPP awards with a performance measure based on the growth of the Shareholder Capital Value (SCV) of the Asian business. SCV represents shareholders’ capital and reserves on a European Embedded Value (EEV) basis for each business unit.
Over this period we redirected the key metrics so that the performance of the Asian business has been managed and measured based on three core metrics of new business profit, IFRS profit and cash remittance. Given the success of this approach, SCV has been de-emphasised in the way that we manage and measure the PCA business and the associated reward mechanisms.
The Committee therefore felt that it was appropriate to revise the performance conditions attached to outstanding awards to align them with the business plan and the long-term objectives of the Asian business. Vesting of these awards will now be dependent on the new business profit, IFRS profit and cash remittance performance of the Asian business. Each of these measures will determine vesting of one third of each award. For the 2009, 2010 and 2011 BUPP awards, performance will be measured over the periods 2009 to 2011, 2010 to 2013 and from 2011 to 2014 respectively. The Committee is satisfied that these conditions are more relevant than the original SCV measure and that they are broadly equivalent in their degree of stretch. This revision is also consistent with the change made to the performance condition of the UK BUPP award in 2010.
On 31 December 2011, the performance period for the 2009 Asia BUPP award (which began on 1 January 2009) came to an end. Over the period, the new business profit, IFRS profit and cash remittance achieved by the Asian business meant that the Committee, having satisfied itself as to the quality of the business units’ underlying financial performance, confirmed vesting of 86.50 per cent of Barry Stowe’s 2009 Asia BUPP award (for reference, 30 per cent of Barry Stowe’s 2008 Asia BUPP award vested). Please see pages 151 and 152 for details.

141D
irecto
rs’re
mu
ne
ration
repo
rt
Jackson BUPPIn 2011 Mike Wells was granted a Jackson BUPP award with vesting dependent on the increase in Jackson’s Shareholder Capital Value (SCV) over the performance period.
The levels of SCV growth required for vesting of Mike Wells’ award are set out in the table below. Vesting occurs between these performance levels on a straight line basis. On 31 December 2011, the performance period for the 2009 Jackson BUPP award came to an end. Although no current executive director had a 2009 award under this plan the vesting level for other participants was 93.75 per cent (for reference, the SCV performance measure attached to the 2008 Jackson BUPP award was not achieved and so no part of that award vested).
PercentageofBUPPawardwhichvests
CompoundannualgrowthinSCVoverthreeyears
0% <8% 30% 8% 75% 10% 100% 12%
UK BUPPIn 2009, 2010 and 2011 Rob Devey was granted UK BUPP awards. Given the cash-generative priorities of the UK business unit, UK BUPP awards are assessed using the same relative TSR measure applied to GPSP awards. As a result, all Rob Devey’s outstanding UK BUPP awards have the same TSR conditions applied to them as the GPSP awards made in the same year.
On 31 December 2011, the performance period for the 2009 UK BUPP (which began on 1 January 2009) came to an end. As illustrated by the chart opposite, Prudential’s TSR over this period was equal to 169 per cent of the peer index. The Committee, having satisfied itself as to the quality of the business unit’s underlying financial performance, confirmed vesting of 100 per cent of Rob Devey’s 2009 UK BUPP award (for reference, no current executive director had a 2008 UK BUPP award).
Limits on award sizesThe rules of the GPSP and BUPP set a limit on the value of shares which may be awarded to an executive in a financial year. The combined value of shares awarded under the two plans may not exceed a maximum of 550 per cent of salary although the awards made in a particular year are often significantly below this limit. On a change in control of Prudential, vesting of awards made under these arrangements would be prorated for performance and to reflect the elapsed portion of the performance period.
M&G Executive Long-Term Incentive PlanIn 2009, 2010 and 2011 Michael McLintock was granted M&G Executive LTIP awards. Under this plan an annual award of phantom shares is made with a notional starting share price of £1. The phantom share price at vesting is determined by the increase or decrease in M&G’s profitability over the three-year performance period with profit and investment performance adjustments also applied:
Profit growthThe value of phantom shares vesting will be adjusted by a profit measure as follows:
• No adjustment will be made if profits in the third year of the performance period are at least equal to the average annual profit generated over the performance period;
• A loss or zero profit will result in the value of the award being reduced to zero, irrespective of investment performance;
• Between these points, the value of phantom shares will be reduced on a straight line basis from no reduction to the complete elimination of the value of the award.
Investment performanceThe value of phantom shares vesting will be adjusted by an investment performance measure as follows:
• Where the investment performance of M&G’s funds is in the top two quartiles during the three-year performance period, the value of phantom shares vesting will be enhanced. The value of phantom shares may be doubled if performance is in the top quartile;
• Investment performance in the third quartile will not change the value of phantom shares vesting;
• Investment performance in the bottom quartile will result in awards being forfeited, irrespective of any profit growth.
The value of the vested phantom shares will be paid in cash after the end of the three-year performance period.
On 31 December 2011, the performance period for the 2009 award under the M&G Executive Long-Term Incentive Plan (which began on 1 January 2009) came to an end. M&G’s profit grew by 103 per cent over the period and M&G’s investment performance was in the second quartile. The Committee, having satisfied itself about the quality of M&G’s underlying financial performance, confirmed vesting of Michael McLintock’s 2009 award with a value of £2.96 per share (for reference, the 2008 award vested with a value of £2.62 per share).

142
Prudential plc Annual Report 2011
Directors’ remuneration report | continued
Directors’ remuneration report
The number of phantom shares awarded depends on the performance of M&G and Michael McLintock’s individual contribution in the financial year prior to the year in which the award is made. Therefore, the number of phantom shares to be awarded in 2012 relates to M&G’s performance in 2011 and is calculated on the basis of the award’s expected value. The expected value of the award is determined by a third party (PricewaterhouseCoopers LLP). Based on 2011 performance, an award of 952,960 phantom shares with an anticipated value of £1,238,849 will be made to Michael McLintock in 2012. The ultimate value of the award will be determined with reference to the profit and investment performance of M&G over the three years from 1 January 2012 to 31 December 2014. Based on 2010 performance, an award of 1,318,148 phantom shares with an anticipated value of £1,779,500 was made to Michael McLintock in 2011.
Jackson Long-Term Incentive PlansPrior to his appointment as an executive director, Mike Wells participated in the two long-term incentive plans offered to senior staff within Jackson. Mike Wells was awarded ADRs under the JNL US Performance Share Plan and cash-based awards under the JNL Long-Term Incentive Plan. Awards made under both plans have a performance period of four years and vesting is dependent on the achievement of shareholder value targets. Up to 150% of the original number of ADRs awarded under the JNL Performance Share Plan may be released if stretch performance targets are achieved.
Outstanding awards made to Mike Wells before his appointment as an executive director will remain subject to the original performance conditions and vesting schedule. No further awards will be made to Mike Wells under these plans.
On 31 December 2011, the performance periods for the 2008 awards under the JNL long-term incentive plans (which began on 1 January 2008) came to an end. Over the period the shareholder value of the US business grew by 18.1 per cent per annum (on a compound basis) and 94.7 per cent over the performance period. This resulted in vesting of 150 per cent of Mike Wells’ 2008 JNL US Performance Share Plan award and 95 per cent of his 2008 cash-settled JNL Long-Term Incentive Plan award.
All-employeeshareplansIt is important that all employees are offered the opportunity to own shares in Prudential, connecting them both to the success of the Company and to the interests of other shareholders. Executive directors are invited to participate in these plans on the same basis as other staff in their location.
Save As You Earn (SAYE) schemesUK-based executive directors are eligible to participate in the Prudential HM Revenue & Customs (HMRC) approved UK SAYE scheme and Barry Stowe is invited to participate in the equivalent International Share Ownership Scheme. These schemes allow employees to save towards the exercise of options over Prudential plc shares with the option price set at the beginning of the savings period at a discount of up to 20 per cent of the market price.
Participants elect to enter into savings contracts of up to £250 per month for a period of three or five years. At the end of this term, participants may exercise their options within six months and purchase shares. If an option is not exercised within six months, participants are entitled to a refund of their cash savings plus interest if applicable under the rules. Shares are issued to satisfy those options which are exercised. No options may be granted under the schemes if the grant would cause the number of shares which have been issued, or which remain issuable pursuant to options granted in the preceding 10 years under the scheme and any other option schemes operated by the Company, or which have been issued under any other share incentive scheme of the Company, to exceed 10 per cent of the Company’s ordinary share capital at the proposed date of grant.
Share Incentive Plan (SIP)UK-based executive directors are also eligible to participate in the Company’s HMRC approved Share Incentive Plan (SIP). This allows all UK-based employees to purchase Prudential plc shares up to a value of £125 per month from their gross salary (partnership shares). For every four partnership shares bought, an additional matching share is awarded which is purchased by Prudential on the open market. Dividend shares accumulate while the employee participates in the plan. Partnership shares may be withdrawn from the scheme at any time. If the employee withdraws from the plan within five years, matching shares are forfeited.
No directors or other employees are provided with loans to enable them to buy shares.

143D
irecto
rs’re
mu
ne
ration
repo
rt
ShareholdingguidelinesAs a condition of serving, all executive and non-executive directors are required to have beneficial ownership of a minimum of 2,500 ordinary shares in the Company. This interest in shares must be acquired within 12 months of appointment to the Board if the director does not have such an interest upon appointment.
Executive directors should have a substantial shareholding to maximise the community of interest between them and other shareholders. This may be built up over a period of five years. Shares earned and deferred under the annual incentive plan are included in calculating the executive director’s shareholding.
Shareholdingguideline
as%ofbasesalary
Shareholdingat12March2012
as%ofbasesalary
(note 1)
Rob Devey 100% 146%John Foley 100% 423%Michael McLintock 200% 1,086%Nic Nicandrou 100% 195%Barry Stowe(note 2) 100% 274%Tidjane Thiam 200% 461%Mike Wells(note 2) 100% 449%
Notes1 Based on the shar e price as at 31 December 2011 (£6.39). Calculated
using base salaries on 31 December 2011. 2 Shareholdings for Barry Stowe and Mike Wells include American
Depositary Receipts (ADRs). One ADR is equivalent to two Prudential plc shares.
Pensionsandlong-termsavingsFor executive directors based in the UK and Asia, it is the Company’s policy to provide a supplement in lieu of pension of 25 per cent of base salary. This includes, where relevant, any Company contributions to the staff defined contribution pension, which UK executive directors may choose to join and which has no salary cap. Executives are provided with life assurance cover of up to four times salary plus a dependants’ pension.
Before becoming an executive director, John Foley participated in the Company’s defined benefit pension arrangement on the same basis as other employees who joined the Group before 2003. John Foley elected to become a deferred member of this arrangement on 31 December 2010 and to join the defined contribution scheme with effect from 1 April 2011.
Michael McLintock participates in a contributory defined benefit scheme that provides a target pension of two thirds of final pensionable earnings on retirement at age 60 for an employee with 30 years or more potential service, for which his contribution is 4 per cent of base salary. Michael McLintock participates on the same basis as other employees who joined M&G at the same date. Benefits under the plan are subject to a notional scheme earnings cap (set at £123,600 for the 2010/11 tax year and at £129,600 for the 2011/12 tax year) which replicates the HMRC earnings cap in force before A-Day (6 April 2006). Michael McLintock is entitled to supplements based on his salary above the notional earnings cap.
Other executive directors based in the UK and Asia have elected to receive their pension benefits in the form of a cash supplement. Barry Stowe also receives a payment to the Hong Kong Mandatory Provident Fund.
Mike Wells is eligible to participate in Jackson’s Defined Contribution Retirement Plan, a qualified 401(k) retirement plan, on the same basis as all other US-based employees. The Company provides matching contributions of 6 per cent of base salary (Mike Wells’ salary for pension purposes is limited to $245,000). He is also eligible to participate in the profit sharing element of the plan which provides eligible participants with an annual profit sharing contribution, depending on the financial results of Jackson for the plan year, to a maximum of an additional 6 per cent of pensionable salary. An annual profit sharing contribution equivalent to 5 per cent of pensionable salary was made in 2011 (in 2010, the profit share contribution was 5 per cent of pensionable salary). Mike Wells is provided with life assurance cover of two times salary.

144
Prudential plc Annual Report 2011
Directors’ remuneration report | continued
Directors’ remuneration report
Componentsof2012remunerationPrudential’s remuneration structures for 2012 are unchanged from those used in 2011, detailed in the preceding pages. A review of these structures will take place in 2012 for implementation in 2013, subject to shareholder approval (if required) at the 2013 AGM.
In December 2011 the Remuneration Committee undertook a review of the compensation levels of the executive directors. The Committee considered the performance, experience and internal relativities for each director as well as the business performance of Prudential over recent financial years (illustrated opposite).
To provide context for this review, each director’s remuneration was benchmarked against appropriate market reference point(s). The Committee felt that the benchmarks used represent the markets from which Prudential would be most likely to recruit future executives, and to which the Group might lose leaders, if reward were not to be competitive. The benchmarks used are set out below:
Director Role Benchmark(s) used to assess remuneration
Rob Devey
Chief Executive, UK & Europe
• FTSE40
• InternationalInsuranceCompanies
John Foley Group Chief Risk Officer • FTSE40
Michael McLintock
Chief Executive, M&G
• PwCUKAssetManagementSurvey
• McLaganUKInvestmentManagementSurvey
Nic Nicandrou
Chief Financial Officer
• FTSE40
• InternationalInsuranceCompanies
Barry Stowe Chief Executive, PCA • TowersWatsonAsianInsuranceSurvey
Tidjane Thiam
Group Chief Executive
• FTSE40
• InternationalInsuranceCompanies
Mike Wells
President & CEO, JNL
• TowersWatsonUSFinancialServicesSurvey
• LOMAUSInsuranceSurvey
Notes1 Excludes Japan and Taiwan agency.2 In 2010, the Group amended the presentation of IFRS operating
profit for its US insurance operations to remove the net equity hedge accounting effect (incorporating related amortisation of deferred acquisition costs) and include it in short-term fluctuations. The prior period comparatives for 2009 and 2008 have been amended accordingly. Excludes Taiwan agency.
New business profit1
CAGR
+18.2%
2007 2008 2009 2010
£2,028m£2,151m
2011
£1,103m £1,205m
£1,619m
IFRS operating profit2
CAGR
+15.8%
2007 2008 2009 2010
£1,941m£2,070m
2011
£1,152m £1,212m
£1,564m
Business unit net remittances
CAGR
+27.6%
2007 2008 2009 2010
£935m
£1,105m
2011
£417m£515m
£688m

145D
irecto
rs’re
mu
ne
ration
repo
rt
Over the same period (2007 to 2011), the base salary for the Group Chief Executive has been largely unchanged while total remuneration delivered to the Group Chief Executive rose by an average of 4.8 per cent per annum on a compound basis; substantially lower than the growth in the key performance metrics (illustrated opposite) used to assess business performance.
In light of the Remuneration Committee’s compensation review and the Company’s sustained performance, changes were made to the remuneration for the executive directors for 2012.
In 2012, executive directors will be rewarded on the basis set out below:
Director
Role
BaseSalaryat1January2012
2012AnnualBonus
Long-termincentives(2012awardasapercentageofsalary)
Maximum%ofsalary
Deferralrequirement
GroupPerformance
SharePlan(GPSP)
BusinessUnit
PerformancePlan(BUPP) Total
Rob Devey Chief Executive, UK & Europe £600,000 160% 40% of total bonus 112.5% 112.5% 225.0%
John Foley Group Chief Risk Officer £610,000 160% 40% of total bonus 250.0% – 250.0%
Michael McLintock Chief Executive, M&G £360,000 note 1
50% of bonus above £500,000 100.0% 344.1% 444.1%
Nic Nicandrou Chief Financial Officer £630,000 175% 40% of total bonus 225.0% – 225.0%Barry Stowe Chief Executive, PCA £641,000 160% 40% of total bonus 112.5% 112.5% 225.0%Tidjane Thiam Group Chief Executive £1,000,000 200% 50% of total bonus 400.0% – 400.0%Mike Wells President & CEO, JNL £655,000 note 2 30% of total bonus 230.0% 230.0% 460.0%
Notes1 Michael McLintock’s annual bonus and long-term incentive opportunity under the M&G Executive LTIP are based on M&G’s performance both in
absolute terms and relative to its peers. In line with practice in the asset management sector, there is no specified maximum incentive award. Michael’s total remuneration is subject to an overriding cap such that his total remuneration should not be greater than 3 per cent of M&G’s annual IFRS profits.
2 Mike Wells’ maximum annual bonus figure is comprised of 160 per cent of salary and a 10 per cent share of the Jackson senior management bonus pool based on the target performance of Jackson.
On a policy basis, the package for 2012 will offer the following proportions of fixed and variable and short- and long-term reward to executive directors (average of executive directors):
Good performance
Base salaryCash bonus for 2012, paid in 2013Deferred bonus for 2012, vesting in 20162012 LTIP Award, vesting in 2015%26
18
26
30
Superior performance
Base salaryCash bonus for 2012, paid in 2013Deferred bonus for 2012, vesting in 20162012 LTIP Award, vesting in 2015
5014
15
21
%
‘Good’ performance results in the payment of plan annual bonuses in respect of 2012 and 2012 long-term incentive awards vesting at the threshold level.
‘Superior’ performance generates maximum payment of annual bonuses in respect of 2012 and 2012 long-term incentive awards vesting in full.

146
Prudential plc Annual Report 2011
Directors’ remuneration report | continued
Directors’ remuneration report
ServicecontractsExecutivedirectors’servicecontractsandlettersofappointmentThe normal notice of termination that the Company is required to give executive directors is 12 months. Accordingly, in normal circumstances, a director whose contract is terminated would be entitled to one year’s salary and benefits in respect of their notice
period. Additionally, outstanding awards under annual and long-term incentive plans may vest depending on the circumstances and according to the rules of the plans. When considering the termination of any service contract, the Remuneration Committee will have regard to the specific circumstances of each case, including the director’s obligation to mitigate his loss. Payments are phased over the notice period.
Executivedirector Dateofcontract
Noticeperiodtothe
Company
Noticeperiod
fromtheCompany
Rob Devey 1 July 2009 12 months 12 monthsJohn Foley 8 December 2010 12 months 12 monthsMichael McLintock 21 November 2001 6 months 12 monthsNic Nicandrou 26 April 2009 12 months 12 monthsBarry Stowe 18 October 2006 12 months 12 monthsTidjane Thiam 20 September 2007 12 months 12 monthsMike Wells(note 1) 15 October 2010 12 months 12 months
Note1 The contract for Mike Wells is a renewable one-year fixed term contract. The contract is renewable automatically upon the same terms and
conditions unless the Company or the director gives at least 90 days’ notice prior to the end of the relevant term.
PolicyonexternalappointmentsSubject to the Group Chief Executive’s or Chairman’s approval, executive directors are able to accept external appointments as non-executive directors of other organisations. Any fees paid may be retained by the executive director. During 2011, Michael McLintock received £45,000 as a trustee of another organisation (for reference, Michael McLintock received £42,500 for this role in 2010). Other directors served as non-executive directors on the boards of educational and cultural organisations without receiving a fee for such services.
Non-executivedirectors’lettersofappointmentNon-executive directors do not have service contracts but are appointed pursuant to letters of appointment with notice periods of six months without liability for compensation.
Under the terms of their letters of appointment, continuation of the non-executive directors’ appointment is contingent on satisfactory performance and re-election by shareholders. Non-executive directors are typically expected to serve two three-year terms from the date of their election by shareholders. Thereafter, the Board may invite the Director to serve for an additional period.
Non-executivedirector AppointmentbytheBoardInitialelectionby
shareholdersatAGM NoticeperiodExpirationofcurrenttermofappointment
Keki Dadiseth1 1 April 2005 AGM 2005 6 months AGM 2012Howard Davies 15 October 2010 AGM 2011 6 months AGM 2014Michael Garrett1 1 September 2004 AGM 2005 6 months AGM 2012Ann Godbehere 2 August 2007 AGM 2008 6 months AGM 2014Alistair Johnston2 1 January 2012 AGM 2012 6 months AGM 2015Bridget Macaskill3 1 September 2003 AGM 2004 6 months n/aPaul Manduca 15 October 2010 AGM 2011 6 months AGM 2014Kaikhushru Nargolwala2 1 January 2012 AGM 2012 6 months AGM 2015Kathleen O’Donovan4 8 May 2003 AGM 2004 6 months n/aJames Ross5 6 May 2004 AGM 2005 6 months n/aLord Turnbull 18 May 2006 AGM 2006 6 months AGM 2012
Notes1 Keki Dadiseth and Michael Garrett were reappointed in 2011 for one year. The Board will consider a further renewal term in May 2012.2 For Alistair Johnston and Kaikhushru Nargolwala, the table assumes initial election by shareholders at the 2012 AGM. 3 Bridget Macaskill retired from the Board on 30 September 2011.4 Kathleen O’Donovan will step down from the Board on 31 March 2012.5 James Ross retired from the Board at the AGM on 19 May 2011.

147D
irecto
rs’re
mu
ne
ration
repo
rt
Non-executivedirectors’feesNon-executive directors are not eligible to participate in annual bonus plans, long-term incentive plans or pension arrangements. Their fees are determined by the Board and reflect their individual responsibilities, including chairmanship and membership of committees where appropriate. The Board reviews fees annually and revised fees, for the first time since 2008, with effect from 1 July 2011 (see the table below for details of the fee structure in place from this date). The fee levels established in 2011 recognise the impact that the increased size, complexity and the burden of regulatory scrutiny of the Group have had on the time commitment required from non-executive directors since fee levels were last varied in 2008.
AnnualFees
From1July2011
(£)
Basic fee 85,000 Audit Committee Chairman – additional fee 70,000 Audit Committee member – additional fee 25,000 Remuneration Committee Chairman
– additional fee 50,000 Remuneration Committee member
– additional fee 25,000 Risk Committee Chairman – additional fee 60,000 Risk Committee member – additional fee 25,000 Senior Independent Director – additional fee 50,000
Notes1 No fee is payable for chairmanship or membership of the Nominations
Committee.2 The Company may determine that additional fees should be paid if, in
a particular year, the number of meetings is materially greater than usual.
Please see the table on page 148 for details of the fees received by individual non-executive directors during 2011.
Until July 2011, non-executive directors used the net value of £25,000 of their total annual fees to purchase shares in the Company. In July 2011, this arrangement was replaced with a share ownership requirement for non-executive directors, described below.
In July 2011, a new share ownership requirement for non-executive directors was introduced. Non-executive directors are required to hold shares with a value equivalent to one times the annual basic fee (excluding additional fees for chairmanship and membership of any committees). Non-executive directors will be expected to attain this level of share ownership within three years of the implementation of this requirement (or within three years of their date of appointment, if later). The Chairman is required to hold shares with a value equivalent to one times his annual base fee and is expected to attain this level of share ownership within five years of the date of his appointment.
Chairman’sletterofappointmentandbenefitsHarvey McGrath was appointed as a non-executive director on 1 September 2008 and became Chairman on 1 January 2009. He is paid an annual fee of £500,000. A contractual notice period of 12 months by either party applies. Harvey McGrath is provided with life assurance cover of four times his annual fees and the use of a car and driver. No pension allowance is paid and he is not a member of any Group pension scheme. Harvey McGrath is also entitled to medical insurance coverage but he has not taken up this benefit.
Harvey McGrath will retire from the Board in 2012 when a successor has been found.
Directors’shareholdingsThe interests of directors in ordinary shares of the Company are set out below. This includes shares acquired under the Share Incentive Plan (detailed in the table on page 155), deferred annual incentive awards and interests in shares awarded on appointment (detailed in the ‘Other Share Awards’ table on pages 153 to 155). All interests are beneficial.
1January2011
31December2011
12March2012
Keki Dadiseth 30,655 32,196 32,196 Howard Davies 575 3,083 3,083 Rob Devey 78,261 126,006 126,006 John Foley 535,386 364,378 364,378 Michael Garrett 36,972 39,233 39,233 Ann Godbehere 14,628 15,914 15,914 Alistair Johnston (note 1) – – –Bridget Macaskill(note 2) 44,006 – –Paul Manduca 1,260 2,500 2,500 Harvey McGrath 299,540 300,636 300,636 Michael McLintock 604,390 595,363 595,363 Kaikhushru Nargolwala (note 3) – – 16,000 Nic Nicandrou(note 4) 133,555 167,655 167,724 Kathleen O’Donovan 23,484 24,425 24,425 James Ross(note 5) 21,190 – –Barry Stowe(note 6) 264,437 274,575 274,575 Tidjane Thiam 273,025 650,116 650,116 Lord Turnbull 15,589 16,624 16,624 Mike Wells(note 7) 293,842 438,718 438,718
Notes1 Alistair Johnston was appointed to the Board on 1 January 2012.2 Bridget Macaskill retired from the Board on 30 September 2011.3 Kaikhushru Nargolwala was appointed to the Board on
1 January 2012.4 Nic Nicandrou’s interest in shares on 12 March 2012 includes his
monthly purchases made under the SIP plan in January, February and March 2012.
5 James Ross retired from the Board on 19 May 2011.6 Part of Barry Stowe’s interest in shares is made up of 77,724 ADRs
(representing 155,448 ordinary shares. 8,513.73 of these ADRs are held within an investment account which secures premium financing for a life assurance policy).
7 Mike Wells’ interest in shares is made up of 219,359 ADRs (representing 438,718 ordinary shares).

148
Prudential plc Annual Report 2011
Directors’ remuneration report | continued
Directors’ remuneration report
Directors’ remuneration for 2011 (audited information)
£000 Salary/fees
2011Cash
bonus
2011Deferred
bonus
Total2011
bonus Benefits*
Cashsupplementsforpensionpurposes†
Totalemoluments
2011
Valueofanticipated
releasesfromLTIPs
inrespectofperformance
periodsending
31December2011‡
Chairman Harvey McGrath 500 – – – 82 – 582 – Executivedirectors Rob Devey 550 479 319 798 111 138 1,597 1,544 John Foley(note 1) 550 518 345 863 139 100 1,652 – Michael McLintock 350 779 279 1,058 93 96 1,597 6,005 Nic Nicandrou 550 507 338 845 84 138 1,617 2,020 Barry Stowe (note 2) 641 579 386 965 544 160 2,310 2,341 Tidjane Thiam 900 785 785 1,570 116 225 2,811 1,910 Mike Wells(notes 1 and 3) 624 1,660 711 2,371 64 – 3,059 1,369
Totalexecutivedirectors 4,165 5,307 3,163 8,470 1,151 857 14,643 15,189
Non-executivedirectors Keki Dadiseth(note 4) 102 102 Howard Davies 153 153 Michael Garrett 93 93 Ann Godbehere 158 158 Bridget Macaskill(note 5) 65 65 Paul Manduca 156 156 Kathleen O’Donovan 98 98 James Ross(note 6) 33 33 Lord Turnbull 129 129
Totalnon-executivedirectors 987 987
Overalltotal 5,652 5,307 3,163 8,470 1,233 857 16,212 15,189
* Benefits include (where provided) the cost of providing the use of a car and driver, medical insurance, security arrangements and expatriate benefits.
† Pension benefits are described in the section on Pensions and long-term savings on page 143. ‡ Value of anticipated long-term incentive plan releases is the total of cash paid plus, for shares released, the value of the released shares based on
the share price at 31 December 2011. All executive directors participate in long-term incentive plans and the details of share releases from awards with a performance period ending 31 December 2011 are provided in the footnotes to the tables on share awards on pages 151 to 152. This figure does not include releases from other share plans (detailed on pages 153 to 155) or all-employee share plans, (set out on pages 155 and 156). Dividend equivalents will be released on these vested shares.
Notes1 John Foley and Mike Wells were appointed to the board on 1 January 2011.2 Barry Stowe’s benefits relate primarily to his expatriate status, including costs of £184,489 for housing, £32,077 for children’s education, £35,093
for home leave and a £245,114 Executive Director Location Allowance.3 Mike Wells’ bonus figure excludes a contribution of $12,250 from a profit sharing plan which has been made into a 401(k) retirement plan. This is
included in the table on pension contributions on page 156.4 Keki Dadiseth was paid allowances totalling £8,997 in respect of his accommodation expenses in London whilst on the Company’s business as is
the usual practice for directors who are not resident in the UK.5 Bridget Macaskill retired from the Board on 30 September 2011.6 James Ross retired from the Board on 19 May 2011.

149D
irecto
rs’re
mu
ne
ration
repo
rt
Directors’ remuneration for 2010 (audited information)
£000 Salary/fees
2010Cash
bonus
2010Deferred
bonus
Total2010
bonus Benefits*
Cashsupplementsforpensionpurposes†
Totalemoluments
2010
Valueofanticipated
releasesfromLTIPs
inrespectofperformance
periodsending
31December2010‡
Chairman Harvey McGrath 500 – – – 43 – 543 – Executivedirectors Rob Devey(note 1) 550 496 331 827 43 154 1,574 – Michael McLintock 350 1,052 552 1,604 53 87 2,094 3,312 Nic Nicandrou (note 2) 550 512 341 853 43 161 1,607 – Barry Stowe(note 3) 666 625 417 1,042 285 167 2,160 937 Tidjane Thiam 900 – 1,570 1,570 64 225 2,759 2,099
Totalexecutivedirectors 3,016 2,685 3,211 5,896 488 794 10,194 6,348
Non-executivedirectors Keki Dadiseth(note 4) 87 87 Howard Davies 27 27 Michael Garrett 77 77 Ann Godbehere 119 119 Bridget Macaskill 89 89 Paul Manduca 18 18 Kathleen O’Donovan 87 87 James Ross 108 108 Lord Turnbull 88 88
Totalnon-executivedirectors 700 700
Overalltotal 4,216 2,685 3,211 5,896 531 794 11,437 6,348
* Benefits include (where provided) the use of a car and driver, medical insurance, security arrangements and expatriate benefits. † Pension supplements that are paid in cash and contributions to the LTSP and/or the ARBS are included in the table. ‡ Value of anticipated long-term incentive plan releases is the total of cash paid plus, for shares released, the value of the released shares based on
the share price at 31 December 2010.
Notes1 Rob Devey elected not to receive his cash supplement for pension purposes in full during 2010. The Company made a request to the Trustees of
the Alternative Retirement Benefit Scheme to accept a contribution equivalent to this supplement. The value of this contribution is included in the table above.
2 Nic Nicandrou elected not to receive his cash supplement for pension purposes in full during 2010. The Company made a request to the Trustees of the Long Term Savings Plan to accept a contribution equivalent to this supplement. The value of this contribution is included in the table above.
3 Barry Stowe’s benefits relate primarily to his expatriate status, including costs of £153,384 for housing, £47,639 for children’s education and £42,509 for home leave.
4 Keki Dadiseth was paid allowances totalling £10,083 in respect of his accommodation expenses in London whilst on the Company’s business as is the usual practice for directors who are not resident in the UK.

150
Prudential plc Annual Report 2011
Directors’ remuneration report | continued
Directors’ remuneration report
Paymentsandsharereleasesin2011topastexecutivedirectorsMarkTuckerThe 2008 Directors’ remuneration report provided details of the remuneration arrangements which applied to Mark Tucker following his resignation as Group Chief Executive. These arrangements were implemented as intended by the Committee.
On 31 December 2010, the performance period for Mark Tucker’s 2008 GPSP award came to an end. His GPSP award was prorated for service (21/36ths) and its vesting remained dependent on TSR performance achieved over the three-year performance period. Since this condition was met in full, Mark Tucker’s prorated 2008 GPSP award vested and was released at the same time as for all other participants in the GPSP. This award was the last that Mark Tucker had outstanding under a Prudential long-term incentive plan.
NickPrettejohnThe 2009 Directors’ remuneration report provided details of the remuneration arrangements that would apply to Nick Prettejohn after he resigned from the position of Chief Executive UK & Europe. These arrangements were implemented as intended by the Committee.
The performance periods of Nick Prettejohn’s GPSP and UK BUPP awards for 2008 and 2009 ended on 31 December 2010 and 31 December 2011 respectively. Vesting was prorated based on service (ie 21/36ths and 9/36ths). Vesting remained dependent on performance achieved over the performance period and shares were released at the same time as for all other participants in these plans.
The performance condition attached to the 2008 GPSP award was met in full and 100 per cent of the proportion of the award which was outstanding was released in 2011. Achievement of the SCV performance measure attached to the 2008 UK BUPP award was not achieved and so no part of the award vested.
The performance condition attached to the 2009 GPSP award was met in full and 100 per cent of the proportion of the award which was outstanding will be released during 2012. Achievement of the SCV performance measure attached to the 2009 UK BUPP award was 12.5 per cent per annum (on a compound basis), so 87.5 per cent of the outstanding portion of this award will be released during 2012.
ClarkManningClark Manning stepped down from his role as President and Chief Executive of Jackson and as an executive director on 31 December 2010. Clark Manning remained Chairman of Jackson until 30 April 2011 and acted in an advisory role until 31 December 2011. The 2010 Directors’ remuneration report provided details of the remuneration arrangements that would apply to Clark Manning after his resignation. These arrangements were implemented as intended by the Committee.
During 2011, Clark Manning received the following payments:
• Salary and benefits were paid to Clark Manning until 31 December 2011;
• Clark Manning had a prorated 2011 annual bonus opportunity (4/12ths) based on his length of service as Chairman of Jackson during 2011. On this basis, a cash payment of £725,389 will be made to him in 2012;
• The deferred portion of the bonus awarded to Clark Manning in respect of performance in 2007 was released to him in March 2011. Other outstanding deferred bonus shares will be released to Clark Manning in July 2012.
• The performance condition attached to the 2008 GPSP award was met in full and 100 per cent of the award was released in 2011.
• Achievement of the SCV performance measure attached to the 2008 JNL BUPP award was not achieved and so no part of the award vested.
The performance condition attached to the 2009 GPSP award was met in full and 100 per cent of the award will be released during 2012. Achievement of the SCV performance measure attached to the 2009 Jackson BUPP award was 11.5 per cent per annum (on a compound basis), so 93.75 per cent of the outstanding portion of this award will be released during 2012.
Outstanding awards made under the GPSP and BUPP will vest (subject to the achievement of performance conditions) on the same schedule as awards made to other executive directors. These awards will be prorated to reflect the portion of the performance periods which had elapsed on 31 December 2011.
No awards were made to Clark Manning under any long-term incentive plan during 2011 and none will be made in any subsequent year.
No other amounts were paid during the financial year or were receivable by directors (or past directors) in connection with leaving the organisation.
Paymentsandsharereleasesin2011tonewlyappointedexecutivedirectorsShares awards made to Tidjane Thiam and Nic Nicandrou in connection with their appointment were released, as scheduled, during 2011. Details of these awards were originally set out in the Directors’ remuneration reports for 2008 and 2009. Please see the Other Share Awards table on pages 153 to 155 for details.
No amounts were paid to Mike Wells or John Foley in connection with their appointment as executive directors.

151D
irecto
rs’re
mu
ne
ration
repo
rt
Directors’outstandinglong-termincentiveawardsShare-basedlong-termincentiveawardsThe table below sets out the outstanding share awards under the Group Performance Share Plan and Business Unit Performance Plan.
PlannameYearof
initialaward
Conditionalshareawardsoutstandingat1January
2011 (Number of
shares)
Conditionalawardsin2011
(Number of shares)
Marketpriceatdateoforiginalaward
(pence)
Dividendequivalents
onvestedshares
(Number of shares
released) (note 3)
Rightsexercised
in2011
Rightslapsedin2011
Conditionalshareawardsoutstanding
at31December2011
(Number of shares)
Dateofendof
performanceperiod
RobDevey GPSP 2009 120,898 639 120,898 31 Dec 11 BUPP 2009 120,897 639 120,897 31 Dec 11 GPSP 2010 104,089 568.5 104,089 31 Dec 12 BUPP 2010 104,089 568.5 104,089 31 Dec 12 GPSP 2011 76,242 733.5 76,242 31 Dec 13 BUPP 2011 76,242 733.5 76,242 31 Dec 13
449,973 152,484 602,457
JohnFoley GPSP 2011 152,484 733.5 152,484 31 Dec 13
152,484 152,484
MichaelMcLintock GPSP 2008 48,330 674.5 5,696 48,330 – 31 Dec 10 GPSP 2009 92,022 455.5 92,022 31 Dec 11 GPSP 2010 66,238 568.5 66,238 31 Dec 12 GPSP 2011 48,517 733.5 48,517 31 Dec 13
206,590 48,517 5,696 48,330 206,777
NicNicandrou GPSP 2009 316,328 639 316,328 31 Dec 11 GPSP 2010 208,179 568.5 208,179 31 Dec 12 GPSP 2011 152,484 733.5 152,484 31 Dec 13
524,507 152,484 676,991
BarryStowe GPSP 2008 107,988 674.5 12,728 107,988 – 31 Dec 10 BUPP 2008 53,994 674.5 1,908 16,198 37,796 – 31 Dec 10 GPSP (note 1) 2009 196,596 455.5 196,596 31 Dec 11 BUPP (note 1) 2009 196,596 455.5 196,596 31 Dec 11 GPSP (note 1) 2010 129,076 568.5 129,076 31 Dec 12 BUPP (note 1) 2010 129,076 568.5 129,076 31 Dec 12 GPSP (note 1) 2011 88,270 733.5 88,270 31 Dec 13 BUPP (note 1) 2011 88,270 733.5 88,270 31 Dec 13
813,326 176,540 14,636 124,186 37,796 827,884
TidjaneThiam GPSP 2008 314,147 674.5 37,035 314,147 – 31 Dec 10 GPSP 2009 299,074 455.5 299,074 31 Dec 11 GPSP 2010 510,986 568.5 510,986 31 Dec 12 GPSP 2011 374,279 733.5 374,279 31 Dec 13
1,124,207 374,279 37,035 314,147 1,184,339
MikeWells( note 2) JNL PSP (note 4) 2007 85,500 700.0 85,500 – 31 Dec 10 JNL PSP (note 4) 2008 84,900 546 84,900 31 Dec 11 JNL PSP (note 4) 2009 218,100 455.5 218,100 31 Dec 12 JNL PSP (note 4) 2010 141,000 568.5 141,000 31 Dec 13 GPSP 2011 197,648 733.5 197,648 31 Dec 13 BUPP 2011 197,648 733.5 197,648 31 Dec 13
529,500 395,296 85,500 839,296

152
Prudential plc Annual Report 2011
Directors’ remuneration report | continued
Directors’ remuneration report
Cash rights granted under the Business Unit Performance Plan.
PlannameYearofinitial
award
Facevalueofconditional
awardsoutstandingat
1January2011
£000
Conditionallyawardedin
2011£000
Paymentsmadein2011
£000
Cashrightslapsedin2011
£000
Facevalueofconditional
awardsoutstandingat31December
2011£000
Dateofendofperformance
period
BarryStowe BUPP 2008 358 107 251 – 31 Dec 10
358 107 251 –
Notes1 The awards made in 2009, 2010 and 2011 for Barry Stowe were made in ADRs (1 ADR = 2 Prudential plc shares). The figures in the table are
represented in terms of Prudential shares.2 The awards for Mike Wells were all made in ADRs (1 ADR = 2 Prudential plc shares). The figures in the table are represented in terms of Prudential shares.3 In 2009 and 2010 a scrip dividend equivalent and in 2011 a DRIP dividend equivalent was accumulated on these awards. 4 The table above reflects the maximum number of shares (150 per cent of the original awarded) which may be released to Mike Wells under the
JNL Performance Share Plan. This maximum number of shares may be released if stretch performance targets are achieved.5 At 31 December 2011, Prudential’s TSR performance was 168.7 per cent of the TSR performance of the peer index. On this basis, it is anticipated that
awards granted under this plan in 2009 will vest in full. This will result in 120,898 shares vesting for Rob Devey, 92,022 shares for Michael McLintock, 316,328 shares for Nic Nicandrou, 196,596 shares for Barry Stowe and 299,074 shares for Tidjane Thiam under this plan. Dividend equivalents will be released on these vested shares.
6 At 31 December 2011, the performance period of the 2009 BUPP awards came to an end. Over the performance period the new business profit, IFRS profit and cash remittance achieved by the Asian business meant that it is anticipated that 86.50 per cent of the award will vest. This will result in 170,055 shares being released to Barry Stowe under this plan. Since the UK BUPP uses the same TSR performance measure as the GPSP, it is anticipated that 120,897 shares will be released to Rob Devey under this plan. No current executive director participated in the 2009 JNL BUPP. Dividend equivalents will be released on these vested shares.
Business-specificcash-basedlong-termincentiveplansDetails of all outstanding awards under cash-based long-term incentive plans are set out in the table below. The performance period for all M&G Executive LTIP awards is three years while the performance period for all JNL LTIP awards is four years:
Yearofinitial
award
Facevalueofconditional
awardsoutstandingat
1January2011
£000
Conditionallyawarded
in2011 £000
Paymentsmade
in2011£000
Facevalueofconditional
shareawardsoutstandingat31December
2011£000
Dateofendofperformance
period
MichaelMcLintock M&G Executive LTIP 2008 1,141 2,990 – 31 Dec 10M&G Executive LTIP 2009 1,830 1,830 31 Dec 11M&G Executive LTIP 2010 987 987 31 Dec 12M&G Executive LTIP 2011 1,318 1,318 31 Dec 13Total cash payments made in 2011 2,990
MikeWells JNL LTIP 2007 699 858 – 31 Dec 10JNL LTIP 2008 756 756 31 Dec 11JNL LTIP 2009 894 894 31 Dec 12JNL LTIP 2010 906 906 31 Dec 13Total cash payments made in 2011 858
NoteUnder the M&G Executive LTIP, the value of each unit at award is £1. The value of units changes based on M&G’s profit growth and investment performance over the performance period. For the 2008 award of 1,141,176 units, the unit price at the end of the performance period was £2.62. This resulted in a payment of £2,989,881 to Michael McLintock. For the 2009 award of 1,830,189 units, the unit price at the end of the performance period was £2.96, which will result in a payment of £5,417,359 to Michael McLintock during 2012.
In the 2010 Annual Report, the value shown for Michael McLintock’s 2010 M&G Executive LTIP award was the expected value rather than the face value of the award. This has been amended in the table above.
See page 142 for a description of the JNL LTIP. Performance over the period from 2007 to 2010 resulted in a payment of £857,617 to Mike Wells in 2011. Performance over the period from 2008 to 2011 will result in a payment of £826,975 to Mike Wells during 2012. The awards above were made before Mike Wells became an executive director. Mike Wells was not made a 2011 JNL LTIP award and it is anticipated that no further awards will be made to him under this Plan.
The sterling face value of Mike Wells’ JNL LTIP awards have been calculated using the average exchange rate for the year in which the grant was made. The face value of conditional share awards outstanding on 1 January 2011 and 31 December 2011 was $5,600,000 and $4,200,000 respectively.

153D
irecto
rs’re
mu
ne
ration
repo
rt
OthershareawardsThe table below sets out the share awards that have been made to executive directors under their appointment terms and those deferred from annual incentive plan payouts. The number of shares is calculated using the average share price over the three business days commencing on the day of the announcement of the Group’s annual financial results for the relevant year. For the awards from the 2010 annual incentives, made in 2011, the average share price was 735 pence. Please see the table on page 155 for details of shares acquired under the Share Incentive Plan.
Yearofinitialaward
Con-ditionalshare
awardsout-standingat1January
2011(Number
of shares)
Con-ditionallyawarded
in2011(Number
of shares)
Dividendsaccumu-
lated(Number
of shares) (note 2)
Sharesreleased
in2011(Number
of shares)
Con-ditionalshare
awardsout-ostanding
at31December
2011(Number
of shares)
Dateofendof
restrictedperiod
Sharesreleasedin2011
(Number of shares)
Dateofrelease
Marketpriceatoriginaldateofaward
(pence)
Marketpriceatdateofvesting
orrelease(pence)
RobDevey Awards under
appointment terms 2009 50,575 50,575 31 Mar 12 639
Deferred 2009 annual incentive award
2010
27,686
1,051
28,737
31 Dec 12
552.5
Deferred 2010 annual incentive award
2011
44,987
1,707
46,694
31 Dec 13
721.5
JohnFoley Deferred
2008 deferred PruCap award
2010
233,333
8,858
242,191
–
16 Dec 11
242,191
16 Dec 11
612
609.5
Deferred 2009 deferred PruCap award
2010
166,667
6,326
172,993
14 Dec 12
612
MichaelMcLintock Deferred
2007 annual incentive award
2010
68,385
68,385
–
31 Dec 10
68,385
10 Mar 11
519.5
735
Deferred 2008 annual incentive award
2010
132,664
5,036
137,700
31 Dec 11
519.5
Deferred 2009 annual incentive award
2010
72,104
2,736
74,840
31 Dec 12
552.5
Deferred 2010 annual incentive award
2011
75,136
2,852
77,988
31 Dec 13
721.5

154
Prudential plc Annual Report 2011
Directors’ remuneration report | continued
Directors’ remuneration report
Yearofinitialaward
Con-ditionalshare
awardsout-standingat1January
2011(Number
of shares)
Con-ditionallyawarded
in2011(Number
of shares)
Dividendsaccumu-
lated(Number
of shares) (note 2)
Sharesreleased
in2011(Number
of shares)
Con-ditionalshare
awardsout-ostanding
at31December
2011(Number
of shares)
Dateofendof
restrictedperiod
Sharesreleasedin2011
(Number of shares)
Dateofrelease
Marketpriceatoriginaldateofaward
(pence)
Marketpriceatdateofvesting
orrelease(pence)
NicNicandrouAwards under
appointment terms
2009 13,898 13,898 – 31 Mar 11 13,898 30 Mar 11 639 721.5
16,059 16,059 – 31 Mar 11 16,059 30 Mar 11 639 721.5
68,191 68,191 31 Mar 12 639
Deferred 2009 annual incentive award
2010
25,380
962
26,342
31 Dec 12
552.5
Deferred 2010 annual incentive award
2011
46,394
1,761
48,155
31 Dec 13
721.5
BarryStowe Deferred
2007 annual incentive award
2008
45,339
45,339
–
31 Dec 10
45,339
10 Mar 11
635
735
Deferred 2008 annual incentive award
2009
21,815
828
22,643
31 Dec 11
349.5
Deferred 2009 annual incentive award(note 1)
2010
37,650
1,438
39,088
31 Dec 12
552.5
Deferred 2010 annual incentive award(note 1)
2011
54,244
2,072
56,316
31 Dec 13
721.5
TidjaneThiam Awards under
appointment terms 2008 49,131 49,131 – 31 Mar 11 49,131 30 Mar 11 662 721.5
Deferred 2008 annual incentive award
2010
67,367
2,557
69,924
31 Dec 11
552.5
Deferred 2009 annual incentive award
2010
60,928
2,312
63,240
31 Dec 12
552.5
Deferred 2010 annual incentive award
2011
213,550
8,107
221,657
31 Dec 13
721.5

155D
irecto
rs’re
mu
ne
ration
repo
rt
Yearofinitialaward
Con-ditionalshare
awardsout-standingat1January
2011(Number
of shares)
Con-ditionallyawarded
in2011(Number
of shares)
Dividendsaccumu-
lated(Number
of shares) (note 2)
Sharesreleased
in2011(Number
of shares)
Con-ditionalshare
awardsout-ostanding
at31December
2011(Number
of shares)
Dateofendof
restrictedperiod
Sharesreleasedin2011
(Number of shares)
Dateofrelease
Marketpriceatoriginaldateofaward
(pence)
Marketpriceatdateofvesting
orrelease(pence)
MikeWells 2009 After Tax Deferral
Program award(notes 1 & 3) 2010 32,250 32,250 15 Mar 13 520
Deferred 2010 Group
Deferred Bonus Plan award(note 1 ) 2011 87,508 3,346 90,854 31 Dec 13 721.5
Notes1 The Deferred Share Awards in 2010 and 2011 for Barry Stowe and Mike Wells were made in ADRs (1 ADR = 2 Prudential plc shares). The figures
in the table are represented in terms of Prudential shares.2 In 2009 and 2010 a scrip dividend equivalent and in 2011 a DRIP dividend equivalent were accumulated on these awards.3 This award attracts dividends in the form of cash rather than shares.
SharesacquiredundertheShareIncentivePlan
Yearofinitialaward
ShareIncentive
PlanawardsheldinTrustat1January
2011(Number
of shares)
Partnershipshares
accumulatedin2011
(Number of shares)
Matchingshares
accumulatedin2011
(Number of shares)
Dividendshares
accumulatedin2011
(Number of shares)
ShareIncentivePlanawardsheldin
Trustat31December
2011(Number
of shares)
NicNicandrou Shares held in Trust 2010 303 222 55 16 596
NoteThe table above provides information about shares purchased under the SIP together with Matching shares (awarded on a 1:4 basis) and Dividend shares. The total number of shares will only be released if Nic Nicandrou remains in employment for five years.

156
Prudential plc Annual Report 2011
Directors’ remuneration report | continued
Directors’ remuneration report
OutstandingshareoptionsThe following table sets out the share options held by the directors in the UK Savings Related Share Option Scheme (SAYE) as at the end of the period. No other directors held shares in any other option scheme.
Dateofgrant
Exercise
price
Marketpriceat30Dec
2011
Exerciseperiod Numberofoptions
Beginning EndBeginningofperiod Granted Exercised Cancelled Forfeited Lapsed
Endofperiod
TidjaneThiam 25 Apr 08 551 638.5 01 Jun 11 30 Nov 11 1,705 1,705 – JohnFoley 25 Apr 08 551 638.5 01 Jun 13 29 Nov 13 2,953 2,953 TidjaneThiam 16 Sep 11 465.8666 638.5 01 Dec 14 29 May 15 965 965 NicNicandrou 16 Sep 11 465.8666 638.5 01 Dec 16 31 May 17 3,268 3,268 RobDevey 16 Sep 11 465.8666 638.5 01 Dec 16 31 May 17 3,268 3,268
Notes1 Tidjane Thiam made a total gain of £665 on the exercise of SAYE options during 2011 (2010: £nil). 2 No price was paid for the award of any option. 3 The highest and lowest share prices during 2011 were 777 pence and 509 pence respectively.
DilutionReleases from Prudential’s GPSP and BUPP are satisfied using new issue shares rather than by purchasing shares in the open market. Shares relating to options granted under all-employee share plans are also satisfied by new issue shares. The combined dilution from all outstanding shares and options at 31 December 2011 was 0.2 per cent of the total share capital at the time. Deferred shares will continue to be satisfied by the purchase of shares in the open market.
Directors’pensionsandlifeassuranceThe Company’s pension policy is set out on page 143. Details of directors’ pension entitlements under HMRC approved defined benefit schemes and supplements in the form of contributions to pension arrangements paid by the Company are set out in the following table:
No enhancements to retirement benefits were paid to or receivable by directors or former directors other than the discretionary pension increases awarded to all pensioners which have been made during the year.
Additionalpensionearnedduringyearended31December2011
Transfervalueofaccruedbenefitat31December 3
Ageat31December
2011
Yearsofpensionable
serviceat31December
2011
Accruedbenefit
at31December
2011(£per
annum)£000
Ignoringinflation
onpensionearnedto
31December20101£000
Allowingforinflationonpensionearnedto
31December20102£000
Increaseintransfer
valuelesscontributions
madebydirectors
during2011£000
Contributionstopensionandlifeassurancearrangements4
£000 2011
£0002010
£000
Rob Devey 43 5 John Foley 55 37 Michael McLintock 50 19 55 5 3 1,102 856 232 22 Nic Nicandrou 46 5 Barry Stowe 54 2 Tidjane Thiam 49 9 Mike Wells 51 19
Notes1 As required by the Companies Act remuneration regulations. 2 As required by Stock Exchange Listing rules.3 The transfer value equivalent has been calculated in accordance with the M&G Group Pension Scheme’s transfer basis.4 This table includes employer contributions to defined contribution plans. Supplements in the form of cash are included in the table on page 148.5 Total contributions to directors’ pension and life assurance arrangements in 2011, including cash supplements for pension purposes, were
£957,960 (2010: £624,921) of which £100,960 (2010: £44,608) related to money purchase schemes.

157D
irecto
rs’re
mu
ne
ration
repo
rt
CompanyTSRperformance(unauditedinformation)As required by the Companies Act, the line chart below compares Prudential’s Total Shareholder Return (TSR) during the five years from 1 January 2007 to 31 December 2011, with that of the peer group against which TSR is measured for the purposes
of the Group Performance Share Plan. Our performance is also shown relative to the FTSE 100 since Prudential is a major company within this index. This chart is prepared using the methodology stipulated in the Companies Act remuneration regulations:
Dec 2006 Dec 2007 Dec 2008 Dec 2009 Dec 2010 Dec 2011
107.83107.03
49.26
Prudential FTSE 100 Peer group index
120
100
80
60
40
20
Prudential TSR v FTSE 100 and peer group total returns index % over the five years to December 2011
Fivehighestpaidindividuals(unauditedinformation)Of the five individuals with the highest emoluments in 2011, two were directors whose emoluments are disclosed in this report (2010: one; 2009: two). The aggregate of the emoluments of the other three individuals for 2011 (2010: four; 2009: three) were as follows:
£000,000 2009 2010 2011
Base salaries, allowances and benefits in kind 1 1 1
Pension contributions* – – – Bonuses paid or receivable 12 18 23 Share-based payments and other
cash payments 4 6 2
Total 17 25 26
* Pension contributions payable in the period were less than £150,000 in each period.
Their emoluments were within the following bands:
2009 2010 2011
£5,000,001 – £5,100,000 1 £5,200,001 – £5,300,000 1 £5,300,001 – £5,400,000 1 £5,400,001 – £5,500,000 1 £6,000,001 – £6,100,000 1 £6,600,001 – £6,700,000 1 £8,200,001 – £8,300,000 1 £8,300,001 – £8,400,000 1 £8,400,001 – £8,500,000 2
Signed on behalf of the Board of directors
Lord Turnbull Harvey McGrathChairman, Remuneration Committee Chairman 12 March 2012

158
Prudential plc Annual Report 2011

159159F
ina
ncia
l statem
en
ts
Section 5
Financial statements and European Embedded Value (EEV) basis supplementary information
160 SummaryofstatutoryandsupplementaryInternationalFinancialReportingStandards(IFRS)basisandEEVbasisresults
162 IndextoGroupfinancialstatements163 Consolidatedincomestatement164 Consolidatedstatement
ofcomprehensiveincome165 Consolidatedstatementofchanges
inequity167 Consolidatedstatementof
financialposition169 Consolidatedstatementofcashflows170 NotesontheGroupfinancialstatements371 Balancesheetoftheparentcompany372 Notesontheparentcompany
financialstatements383 Statementofdirectors’responsibilities
inrespectoftheAnnualReportandthefinancialstatements
384 Independentauditor’sreporttothemembersofPrudentialplc
385 EEVbasissupplementaryinformation391 NotesontheEEVbasissupplementary
information433 Statementofdirectors’responsibilities
inrespectoftheEEVbasissupplementaryinformation
434 Independentauditor’sreporttoPrudentialplcontheEEVbasissupplementaryinformation
435 Additionalunauditedinformation

160
Prudential plc Annual Report 2011
Financial statements | Primary statements
Summary of statutory and supplementary IFRS and EEV basis resultsYear ended 31 December 2011
The following tables and referenced disclosure notes show the results reported in the statutory IFRS financial statements on pages 163 to 382 and supplementary EEV basis results on pages 385 to 432. This page does not form part of the statutory financial statements.
InternationalFinancialReportingStandards(IFRS)basisresultsStatutoryIFRSbasisresults
Primary statement or note reference Page 2011 2010
Profit after tax attributable to equity holders of the Company IFRS Income Statement 163 £1,490m £1,431mBasic earnings per share IFRS Income Statement 163 58.8p 56.7pDividends per share declared and paid in reporting period IFRS note B3 197 25.19p 20.17pShareholders’ equity, excluding non-controlling interest IFRS Statement of financial position 167 £9,117m £8,031m
SupplementaryIFRSbasisinformation
Primary statement or note reference Page 2011 2010
Operating profit based on longer-term investment returns
IFRS note B1
192 £2,070m £1,941mShort-term fluctuations in investment returns on
shareholder-backed business 192 £(148)m £(123)mShareholders’ share of actuarial and other gains and losses
on defined benefit pension schemes 192 £21m £(10)mCosts of terminated AIA transaction 192 – £(377)mGain on dilution of Group holdings 192 – £30m
Profit from continuing operations before tax attributable to shareholders (including actual investment returns) IFRS note B1 192 £1,943m £1,461m
Operating earnings per share after related tax and non-controlling interests (excluding 2010 exceptional tax credit) IFRS note B2 196 63.9p 62.0p
Operating earnings per share after related tax and non-controlling interests (including 2010 exceptional tax credit) IFRS note B2 196 63.9p 68.3p
Dividends per share in respect of the reporting period (including interim dividend of 7.95p (2010: 6.61p) and final dividend of 17.24p (2010: 17.24p) declared after the end of the reporting period) IFRS note B3 197 25.19p 23.85p

161F
ina
ncia
l statem
en
tsP
rimary
statemen
ts
SupplementaryEuropeanEmbeddedValue(EEV)basisresults
Primary statement or note reference Page 2011 2010
Operating profit based on longer-term investment returns
EEV income statement
387 £3,978m £3,696mShort-term fluctuations in investment returns 387 £(907)m £(30)mMark to market value movements on core borrowings 387 £(14)m £(164)mShareholders’ share of actuarial and other gains and losses
on defined benefit pension schemes 387 £23m £(11)mEffect of changes in economic assumptions 387 £(158)m £(10)mCosts of terminated AIA transaction 387 – £(377)mGain on dilution of Group holdings 387 – £3mProfit from continuing operations before tax attributable to
shareholders (including actual investment returns) 387 £2,922m £3,107m
Operating earnings per share after related tax and non-controlling interests (excluding 2010 exceptional tax credit) EEV note 12 415 115.7p 106.9p
Operating earnings per share after related tax and non-controlling interests (including 2010 exceptional tax credit) 415 115.7p 113.2p
Earnings per share 415 84.6p 101.9p
Shareholders’ equity, excluding non-controlling interestsEEV statement of financial position 390 £19,637m £18,207m
NotesBasis of preparation
Results basesThe basis of preparation of the statutory IFRS basis results and supplementary IFRS basis information is consistent with that applied for the 2010 results and financial statements. The EEV basis results have been prepared in accordance with the European Embedded Value Principles issued by the CFO Forum of European Insurance Companies in May 2004 and expanded by the Additional Guidance on EEV disclosures published in October 2005. Life insurance products are, by their nature, long-term and the profit on this business is generated over a significant number of years. Accounting under IFRS alone does not, in Prudential’s opinion, fully reflect the value of future profit streams. Prudential considers that embedded value reporting provides investors with a measure of the future profit streams of the Group’s in-force long-term businesses and is a valuable supplement to statutory accounts. There has been no change to the basis of presentation of the EEV results from the 2010 results and financial statements.
Operating profit based on longer-term investment returnsConsistent with previous reporting practice, the Group provides supplementary analysis of IFRS profit before tax attributable to shareholders and analyses its EEV basis results, so as to distinguish operating profit based on longer-term investment returns from other elements of total profit. On both the IFRS and EEV bases, operating earnings per share are calculated using operating profits based on longer-term investment returns, after related tax and non-controlling interests. These profits exclude short-term fluctuations in investment returns and the shareholders’ share of actuarial and other gains and losses on defined benefit pension schemes. The operating profit based on longer-term investment returns for 2010 also excludes the costs associated with the terminated AIA transaction and the gain arising upon the dilution of the Group’s holding in PruHealth. Under the EEV basis, where additional profit and loss effects arise, operating profit based on longer-term investment returns also excludes the mark to market value movements on core borrowings and the effect of changes in economic assumptions. After adjusting for related tax and non-controlling interests, the amounts excluded from operating profit based on longer-term investment returns are included in the calculation of earnings per share.

162
Prudential plc Annual Report 2011
Financial statements | Primary statements
Index to Group financial statements
Primarystatements163 Consolidated income statement164 Consolidated statement of comprehensive income165 Consolidated statement of changes in equity167 Consolidated statement of financial position169 Consolidated statement of cash flows
NotesontheGroupfinancialstatementsSectionA: Backgroundandaccountingpolicies170 A1: Nature of operations170 A2: Basis of preparation170 A3: Critical accounting policies, estimates and judgements176 A4: Significant accounting policies189 A5: New accounting pronouncements
SectionB: Summaryofresults192 B1: Segment disclosure – income statement196 B2: Earnings per share197 B3: Dividends198 B4: Exchange translation198 B5: Group statement of financial position212 B6: New business
SectionC: Groupriskmanagement215 C: Group risk management
SectionD: Lifeassurancebusiness220 D1: Group overview227 D2: UK insurance operations245 D3: US insurance operations 267 D4: Asian insurance operations 276 D5: Capital position statement for life assurance businesses
SectionE: Assetmanagement(includingUSbrokerdealer)andotheroperations285 E1: Income statement for asset management operations287 E2: Statement of financial position for asset management
operations 289 E3: Regulatory and other surplus 290 E4: Sensitivity of profit and shareholders’ equity to market
and other financial risk290 E5: Other operations
SectionF: Incomestatementnotes291 F1: Segmental information 293 F2: Revenue295 F3: Acquisition costs and other expenditure 296 F4: Finance costs: Interest on core structural borrowings
of shareholder-financed operations296 F5: Tax304 F6: Allocation of investment return between policyholders
and shareholders306 F7: Benefits and claims and movements in unallocated
surplus of with-profits funds, net of reinsurance
SectionG: Financialassetsandliabilities307 G1: Financial instruments – designation and fair values316 G2: Market risk321 G3: Derivatives and hedging 322 G4: Derecognition and collateral323 G5: Impairment of financial assets
SectionH:Otherinformationonstatementoffinancialpositionitems324 H1: Intangible assets attributable to shareholders 328 H2: Intangible assets attributable to with-profits funds329 H3: Reinsurers’ share of insurance contract liabilities 330 H4: Tax assets and liabilities 331 H5: Accrued investment income and other debtors 332 H6: Property, plant and equipment 333 H7: Investment properties 334 H8: Investments in associates and joint ventures336 H9: Properties held for sale 337 H10: Cash and cash equivalents 337 H11: Shareholders’ equity: Share capital, share premium
and reserves339 H12: Insurance contract liabilities and unallocated surplus
of with-profits funds 340 H13: Borrowings 342 H14: Provisions and contingencies 348 H15: Other liabilities
SectionI: Othernotes349 I1: Acquisition of United Overseas Bank Life Assurance
Limited in 2010350 I2: Changes to Group’s holdings350 I3: Staff and pension plans363 I4: Share-based payments366 I5: Key management remuneration 367 I6: Fees payable to auditor 367 I7: Related party transactions 368 I8: Subsidiary undertakings 370 I9: Commitments 370 I10: Cash flows370 I11: Post balance sheet events
Parentcompanyfinancialstatements371 Balance sheet of the parent company372 Notes on the parent company financial statements
Statementofdirectors’responsibilitiesandindependentauditor’sreport383 �Statement of directors’ responsibilities in respect of
the Annual Report and the financial statements384 Independent auditor’s report to the members of
Prudential plc
EuropeanEmbeddedValue(EEV)basissupplementaryinformation385 �Operating profit based on longer-term investment returns
– EEV basis387 �Summarised consolidated income statement – EEV basis388 Earnings per share – EEV basis388 �Dividends per share388 �Movement in shareholders’ equity (excluding
non-controlling interests) – EEV basis390 Net asset value per share – EEV basis390 �Summary statement of financial position – EEV basis391 �Notes on the EEV basis supplementary information433 �Statement of directors’ responsibilities in respect of the
European Embedded Value (EEV) basis supplementary information
434 �Independent auditor’s report to Prudential plc on the European Embedded Value (EEV) basis supplementary information
Additionalunauditedfinancialinformation435 Additional unaudited financial information

163F
ina
ncia
l statem
en
tsP
rimary
statemen
ts
Consolidated income statement
Year ended 31 December Note 2011 £m 2010 £m
Gross premiums earned 25,706 24,568 Outward reinsurance premiums (429) (357)
Earned premiums, net of reinsurance F2 25,277 24,211 Investment return F2 9,360 21,769 Other income F2 1,869 1,666
Total revenue, net of reinsurance F1,F2 36,506 47,646
Benefits and claims (31,060) (40,608) Outward reinsurers’ share of benefit and claims F1 746 335 Movement in unallocated surplus of with-profits funds H12 1,025 (245)
Benefits and claims and movement in unallocated surplus of with-profits funds, net of reinsurance (29,289) (40,518)
Acquisition costs and other expenditure F3 (5,005) (4,799) Finance costs: interest on core structural borrowings of shareholder-financed operations F4 (286) (257)
Total charges, net of reinsurance F1 (34,580) (45,574)
Profit before tax (being tax attributable to shareholders’ and policyholders’ returns)* 1,926 2,072 Tax credit (charge) attributable to policyholders’ returns F5 17 (611)
Profit before tax attributable to shareholders B1 1,943 1,461 Tax charge F5 (432) (636) Less: tax attributable to policyholders’ returns (17) 611Tax charge attributable to shareholders’ returns† F5 (449) (25)
Profit for the year 1,494 1,436
Attributable to: Equity holders of the Company 1,490 1,431 Non-controlling interests 4 5
Profit for the year 1,494 1,436
Earnings per share (in pence) Based on profit attributable to the equity holders of the Company: Basic B2 58.8p 56.7p Diluted B2 58.7p 56.6p
*ThismeasureistheformalprofitbeforetaxmeasureunderIFRSbutitisnottheresultattributabletoshareholders.The2010profitbeforetaxisstatedafter£377millionofpre-taxcostsoftheterminatedAIAtransaction.SeeNoteB1.
†The2010taxchargeattributabletoshareholders’returnincludedanexceptionaltaxcreditof£158millionwhichprimarilyrelatedtotheimpactofasettlementagreedwiththeUKtaxauthorities.

164
Prudential plc Annual Report 2011
Financial statements | Primary statements
Consolidated statement of comprehensive income
Note 2011 £m 2010 £m
Profit for the year 1,494 1,436 Other comprehensive income: Exchange movements on foreign operations and net investment hedges: Exchange movements arising during the year B4 (32) 217 Related tax (68) 34
(100) 251
Available-for-sale securities: Unrealised valuation movements on securities of US insurance operations classified as
available-for-sale: D3(a) Unrealised holding gains arising during the year 912 1,170 Deduct net (gains)/add back net losses included in the income statement on disposal
and impairment (101) 51
Total 811 1,221 Related change in amortisation of deferred income and acquisition costs H1 (331) (496)Related tax (168) (247)
312 478
Other comprehensive income for the year, net of related tax 212 729
Total comprehensive income for the year 1,706 2,165
Attributable to: Equity holders of the Company 1,702 2,160 Non-controlling interests 4 5
Total comprehensive income for the year 1,706 2,165

165F
ina
ncia
l statem
en
tsP
rimary
statemen
ts
Consolidated statement of changes in equity
2011 £m
Year ended 31 December 2011 NoteShare
capitalShare
premiumRetained earnings
Trans- lation
reserve
Available-for-sale
securities reserve
Share-holders’ equity
Non-controlling
interestsTotal
equity
Reserves Profit for the year – – 1,490 – – 1,490 4 1,494 Other comprehensive income Exchange movements on foreign operations and net investment
hedges, net of related tax – – – (100) – (100) – (100) Unrealised valuation movements, net of related change in amortisation
of deferred income and acquisition costs and related tax – – – – 312 312 – 312
Total other comprehensive income – – – (100) 312 212 – 212
Total comprehensive income for the year – – 1,490 (100) 312 1,702 4 1,706 Dividends B3 – – (642) – – (642) – (642)Reserve movements in respect of
share-based payments – – 44 – – 44 – 44 Change in non-controlling interests arising
principally from purchase and sale of property partnerships of the PAC with-profits fund and other consolidated investment funds – – – – – – (5) (5)
Share capital and share premium New share capital subscribed H11 – 17 – – – 17 – 17 Treasury shares Movement in own shares in respect of
share-based payment plans – – (30) – – (30) – (30)Movement in Prudential plc shares purchased
by unit trusts consolidated under IFRS – – (5) – – (5) – (5)
Net increase/(decrease) in equity – 17 857 (100) 312 1,086 (1) 1,085 At beginning of year 127 1,856 4,982 454 612 8,031 44 8,075
At end of year H11 127 1,873 5,839 354 924 9,117 43 9,160

166
Prudential plc Annual Report 2011
Financial statements | Primary statements
Consolidated statement of changes in equitycontinued
2010 £m
Year ended 31 December 2010 NoteShare
capitalShare
premiumRetained earnings
Trans- lation
reserve
Available-for-sale
securities reserve
Share-holders’ equity
Non-controlling
interestsTotal
equity
Reserves Profit for the year – – 1,431 – – 1,431 5 1,436 Other comprehensive income Exchange movements on foreign operations and net investment
hedges, net of related tax – – – 251 – 251 – 251 Unrealised valuation movements, net of related change in amortisation
of deferred income and acquisition costs and related tax – – – – 478 478 – 478
Total other comprehensive income – – – 251 478 729 – 729
Total comprehensive income for the year – – 1,431 251 478 2,160 5 2,165 Dividends B3 – – (511) – – (511) – (511)Reserve movements in respect of
share-based payments – – 37 – – 37 – 37 Change in non-controlling interests arising
principally from purchase and sale of property partnerships of the PAC with-profits fund and other consolidated investment funds – – – – – – 7 7
Share capital and share premium New share capital subscribed (including
shares issued in lieu of cash dividends) H11 – 75 – – – 75 – 75 Reserve movements in respect of shares
issued in lieu of cash dividends H11 – (62) 62 – – – – – Treasury shares Movement in own shares in respect
of share-based payment plans – – (4) – – (4) – (4)Movement in Prudential plc shares purchased
by unit trusts consolidated under IFRS – – 3 – – 3 – 3
Net increase in equity – 13 1,018 251 478 1,760 12 1,772 At beginning of year 127 1,843 3,964 203 134 6,271 32 6,303
At end of year H11 127 1,856 4,982 454 612 8,031 44 8,075

167F
ina
ncia
l statem
en
tsP
rimary
statemen
ts
Consolidated statement of financial positionAssets
31 December 2011 Note 2011 £m 2010 £m
Intangible assets attributable to shareholders: Goodwill H1(a) 1,465 1,466 Deferred acquisition costs and other intangible assets H1(b) 5,069 4,667
Total 6,534 6,133
Intangible assets attributable to with-profits funds: In respect of acquired subsidiaries for venture fund and other investment purposes H2(a) 178 166 Deferred acquisition costs and other intangible assets H2(b) 89 110
Total 267 276
Total intangible assets 6,801 6,409
Other non-investment and non-cash assets: Property, plant and equipment H6 748 554 Reinsurers’ share of insurance contract liabilities H3 1,647 1,344 Deferred tax assets H4 2,276 2,188 Current tax recoverable H4 546 555 Accrued investment income G1,H5 2,710 2,668 Other debtors G1,H5 987 903
Total 8,914 8,212
Investments of long-term business and other operations: Investment properties H7 10,757 11,247 Investments accounted for using the equity method H8 70 71 Financial investments*: G1 Loans 9,714 9,261 Equity securities and portfolio holdings in unit trusts 87,349 86,635 Debt securities 124,498 116,352 Other investments 7,509 5,779 Deposits 10,708 9,952
Total investments 250,605 239,297
Properties held for sale H9 3 257 Cash and cash equivalents G1,H10 7,257 6,631
Total assets B5 273,580 260,806
*Includedwithinfinancialinvestmentsare£7,843million(2010:£8,708million)oflentsecurities.SeenoteG4.

168
Prudential plc Annual Report 2011
Financial statements | Primary statements
Consolidated statement of financial position Equityandliabilities
31 December 2011 Note 2011 £m 2010 £m
Equity Shareholders’ equity H11 9,117 8,031 Non-controlling interests 43 44
Total equity 9,160 8,075
Liabilities Policyholder liabilities and unallocated surplus of with-profits funds: Insurance contract liabilities H12 180,363 171,291 Investment contract liabilities with discretionary participation features G1 29,745 25,732 Investment contract liabilities without discretionary participation features G1 16,967 17,704 Unallocated surplus of with-profits funds H12 9,215 10,253
Total 236,290 224,980
Core structural borrowings of shareholder-financed operations: Subordinated debt H13 2,652 2,718 Other H13 959 958
Total G1,H13 3,611 3,676
Other borrowings: Operational borrowings attributable to shareholder-financed operations G1,H13 3,340 3,004 Borrowings attributable to with-profits operations G1,H13 972 1,522 Other non-insurance liabilities: Obligations under funding, securities lending and sale and repurchase agreements G1 3,114 4,199 Net asset value attributable to unit holders of consolidated unit trusts and similar funds G1 3,840 3,372 Deferred tax liabilities H4 4,211 4,224 Current tax liabilities H4 930 831 Accruals and deferred income 736 707 Other creditors G1 2,544 2,321 Provisions H14 529 729 Derivative liabilities G1,G3 3,054 2,037 Other liabilities G1,H15 1,249 1,129
Total 20,207 19,549
Total liabilities B5 264,420 252,731
Total equity and liabilities 273,580 260,806
The consolidated financial statements on pages 163 to 370 were approved by the Board of directors on 12 March 2012 and signed on its behalf.
Harvey McGrath Tidjane Thiam Nic NicandrouChairman Group Chief Executive Chief Financial Officer

169F
ina
ncia
l statem
en
tsP
rimary
statemen
ts
Year ended 31 December 2011 Note 2011 £m 2010 £m
Cash flows from operating activities Profit before tax (being tax attributable to shareholders’ and policyholders’ returns)note(i) 1,926 2,072 Non-cash movements in operating assets and liabilities reflected in profit before tax: Investments (8,854) (24,594) Other non-investment and non-cash assets (1,038) (1,161) Policyholder liabilities (including unallocated surplus) 10,874 24,287 Other liabilities (including operational borrowings) (845) 1,332 Interest income and expense and dividend income included in result before tax (7,449) (7,514)Other non-cash itemsnote(ii) 18 139 Operating cash items: Interest receipts 6,365 6,277 Dividend receipts 1,302 1,412 Tax paid (561) (302)
Net cash flows from operating activities 1,738 1,948
Cash flows from investing activities Purchases of property, plant and equipment (124) (93)Proceeds from disposal of property, plant and equipment 10 4 Acquisition of subsidiaries, net of cash balancenote(iii) I1 (53) (145)
Net cash flows from investing activities (167) (234)
Cash flows from financing activities Structural borrowings of the Group: I10 Shareholder-financed operations:note(iv) Issue of subordinated debt, net of costs 340 – Redemption of senior debt (333) – Bank loan – 250 Interest paid (286) (251) With-profits operations:note(v) Interest paid (9) (9)Equity capital:note(vi) Issues of ordinary share capital H11 17 13 Dividends paid B3 (642) (449)
Net cash flows from financing activities (913) (446)
Net increase in cash and cash equivalents 658 1,268 Cash and cash equivalents at beginning of year 6,631 5,307 Effect of exchange rate changes on cash and cash equivalents (32) 56
Cash and cash equivalents at end of year H10 7,257 6,631
Notes(i) This measure is the formal profit before tax measure under IFRS but it is not the result attributable to shareholders.(ii) Other non-cash items consist of the adjustment of non-cash items to profit before tax together with other net items, net
purchases of treasury shares and other net movements in equity.(iii) The acquisition of subsidiaries in 2011 related to the PAC with-profits fund’s purchase of Earth & Wind and Alticom venture
investments with an outflow of £53 million. In 2010 the acquisition of United Overseas Bank Life Assurance Limited (UOB) resulted in an outflow of cash from investing activities of £133 million with the remaining outflow of £12 million relating to the PAC with-profits fund purchase of Meterserve (see note I8(iii)).
(iv) Structural borrowings of shareholder-financed operations comprise the core debt of the parent company, a PruCap bank loan and Jackson surplus notes. Core debt excludes borrowings to support short-term fixed income securities programmes, non-recourse borrowings of investment subsidiaries of shareholder-financed operations and other borrowings of shareholder-financed operations. Cash flows in respect of these borrowings are included within cash flows from operating activities.
(v) Interest paid structural borrowings of with-profits operations relate solely to the £100 million 8.5 per cent undated subordinated guaranteed bonds which contribute to the solvency base of the Scottish Amicable Insurance Fund (SAIF), a ring-fenced sub-fund of the PAC with-profits fund. Cash flows in respect of other borrowings of with-profits funds, which principally relate to consolidated investment funds, are included within cash flows from operating activities.
(vi) Cash movements in respect of equity capital in 2010 exclude scrip dividends. The scrip dividend alternative has been replaced by the Dividend Re-investment Plan (DRIP) from the 2010 final dividend.
Consolidated statement of cash flows

170
Prudential plc Annual Report 2011
Financial statements | Notes on the Group financial statements
A: Background and accounting policies
A1: Nature of operations
Prudential plc (the Company) together with its subsidiaries (collectively, the Group or Prudential) is an international financial services group with its principal operations in Asia, the US and the UK. Prudential offers a wide range of retail financial products and services and asset management services throughout these territories. The retail financial products and services principally include life insurance, pensions and annuities as well as collective investment schemes. In Asia, the Group has operations in Hong Kong, Malaysia, Singapore, Indonesia and other Asian countries. The life insurance products offered by the Group’s operations in Asia include with-profits (participating) and non-participating term, whole life and endowment and unit-linked policies. In Asia, unit-linked policies are usually sold with insurance riders such as health covers. In the US, the Group’s principal subsidiary is Jackson National Life Insurance Company (Jackson). The principal products written by Jackson are fixed annuities (interest-sensitive, fixed indexed and immediate annuities), variable annuities (VA), life insurance and institutional products. The Group operates in the UK through its subsidiaries, primarily The Prudential Assurance Company Limited (PAC), Prudential Annuities Limited (PAL), Prudential Retirement Income Limited (PRIL) and M&G Investment Management Limited. Long-term business products written in the UK are principally with-profits deposit administration, other conventional and unitised with-profits policies and non-participating pension annuities in the course of payment. Long-term business written in the UK also includes unit-linked products. Prudential plc is a public limited company incorporated and registered in England and Wales. The registered office is:
Laurence Pountney Hill London EC4R 0HH UK Companies House registered number: 1397169
A2: Basis of preparation
The consolidated financial statements consolidate the Group and the Group’s interest in associates and jointly-controlled entities. The parent company financial statements present information about the Company as a separate entity and not about the Group. The consolidated financial statements have been prepared and approved by the directors in accordance with International Financial Reporting Standards (IFRS) as issued by the International Accounting Standards Board (IASB) and as endorsed by the European Union (EU) as required by EU law (IAS regulation EC 1606/2032). The Company has elected to prepare its parent company financial statements in accordance with UK Generally Accepted Accounting Practice (GAAP). These are presented on pages 371 to 382. A reconciliation to IFRS has also been provided for shareholders’ equity and profit for the year of the parent company. The Group has applied all IFRS standards and interpretations adopted by the EU that are effective for financial years commencing on or before 1 January 2011. The Group has applied the same accounting policies in preparing the 2011 results as for 2010 except for the adoption of the new accounting pronouncements effective in 2011. Further details on the new accounting pronouncements and accounting policy changes are provided in note A5.
A3: Critical accounting policies, estimates and judgements
a CriticalaccountingpoliciesPrudential’s discussion and analysis of its financial condition and results of operations are based upon Prudential’s consolidated financial statements, which have been prepared in accordance with IFRS as issued by the IASB and as endorsed by the EU. EU-endorsed IFRS may differ from IFRS as issued by the IASB if, at any point in time, new or amended IFRSs have not been endorsed by the EU. As at 31 December 2011, there were no unendorsed standards effective for the two years ended 31 December 2011 affecting the consolidated financial information of Prudential and there were no differences between IFRSs endorsed by the EU and IFRSs issued by the IASB in terms of their application to Prudential. Accordingly, Prudential’s financial information for the two years ended 31 December 2011 is prepared in accordance with IFRS as issued by the IASB. Prudential adopts mandatory requirements of new or altered EU-adopted IFRS standards where required, and may consider earlier adoption where permitted and appropriate in the circumstances. The preparation of these financial statements requires Prudential to make estimates and judgements that affect the reported amounts of assets, liabilities, and revenues and expenses, and related disclosure of contingent assets and liabilities. On an ongoing basis, Prudential evaluates its estimates, including those related to long-term business provisioning, the fair value of assets and the declaration of bonus rates. Prudential bases its estimates on historical experience and on various other assumptions that are believed to be reasonable under the circumstances, the results of which form the basis for making judgements about the carrying value of assets and liabilities that are not readily apparent from other sources. Actual results may differ from these estimates under different assumptions or conditions. Critical accounting policies are defined as those that are reflective of significant judgements and uncertainties, and potentially give rise to different results under different assumptions and conditions. Prudential believes that its critical accounting policies are limited to those described below.

171F
ina
ncia
l statem
en
tsA:B
ackgro
undan
d
accountin
gpolicies
The critical accounting policies in respect of the items discussed below are critical for the Group’s results insofar as they relate to the Group’s shareholder-financed business. In particular this applies for Jackson which is the largest shareholder-backed business in the Group. The policies are not critical in respect of the Group’s with-profits business. This distinction reflects the basis of recognition of profit and accounting treatment of unallocated surplus of with-profits funds as a liability. Additional explanation is provided later in this note and cross-referenced notes as to why the distinction between with-profits business and shareholder-backed business is relevant. The items discussed below and in cross-referenced notes explain the effect of changes in estimates and the effect of reasonably likely changes in the key assumptions underlying these estimates as of the latest statement of financial position date so as to provide analysis that recognises the different accounting effects on profit and loss or equity. In order to provide relevant analysis that is appropriate to the circumstances applicable to the Group’s businesses, the explanations refer to types of business, fund structure, the relationship between asset and policyholder liability measurement, and the differences in the method of accounting permitted under IFRS 4, ‘Insurance Contracts’ for accounting for insurance contract assets, policyholder liabilities and unallocated surplus of the Group’s with-profits funds.
InsurancecontractaccountingWith the exception of certain contracts described in note D1, the contracts issued by the Group’s life assurance business are classified as insurance contracts and investment contracts with discretionary participating features. As permitted by IFRS 4, assets and liabilities of these contracts are accounted for under previously applied GAAP. Accordingly, except as described below, the modified statutory basis (MSB) of reporting as set out in the revised Statement of Recommended Practice (SORP) issued by the Association of British Insurers (ABI) has been applied. In 2005, the Group elected to improve its IFRS accounting for UK regulated with-profits funds by the voluntary application of the UK accounting standard FRS 27, ‘Life Assurance’. Under this standard, the main accounting changes that were required for UK with-profits funds were:
• derecognition of deferred acquisition costs and related deferred tax, and • replacement of MSB liabilities with adjusted realistic basis liabilities.
The results included in the financial statements for 2011 and 2010 reflect this basis. Unallocated surplus represents the excess of assets over policyholder liabilities for the Group’s with-profits funds that have yet to be appropriated between policyholders and shareholders. The Group has elected to account for unallocated surplus wholly as a liability with no allocation to equity. This treatment reflects the fact that shareholders’ participation in the cost of bonuses arises only on distribution. Shareholder profits on with-profits business reflect one-ninth of the cost of declared bonus. For Jackson, applying the MSB as applicable to overseas operations which permits the application of local GAAP in some circumstances, the assets and liabilities of insurance contracts are accounted for under insurance accounting prescribed by US GAAP. For the assets and liabilities of insurance contracts of Asian operations, the local GAAP is applied with adjustments, where necessary, to comply with UK GAAP. For the operations in India, Japan, Taiwan and Vietnam, countries where local GAAP is not appropriate in the context of the previously applied MSB, accounting for insurance contracts is based on US GAAP. For participating business, the liabilities include provisions for the policyholders’ interest in realised investment gains and other surpluses that, where appropriate, have yet to be declared as bonuses. The usage of these bases of accounting has varying effects on the way in which product options and guarantees are measured. For UK regulated with-profits funds, options and guarantees are valued on a market consistent basis. The basis is described in note D2(g)(ii). For other operations, a market consistent basis is not applied under the accounting basis described in note A4. Details of the guarantees, basis of setting assumptions, and sensitivity to altered assumptions are described in notes D3 and D4.
ValuationandaccountingpresentationoffairvaluemovementsofderivativesanddebtsecuritiesofJacksonUnder IAS 39, ‘Financial Instruments: Recognition and Measurement’, derivatives are required to be carried at fair value. Unless net investment hedge accounting is applied, value movements on derivatives are recognised in the income statement. For derivative instruments of Jackson, the Group has considered whether it is appropriate to undertake the necessary operational changes to qualify for hedge accounting so as to achieve matching of value movements in hedging instruments and hedged items in the performance statements. In reaching the decision a number of factors were particularly relevant. These were:
• IAS 39 hedging criteria have been designed primarily in the context of hedging and hedging instruments that are assessable as financial instruments that are either stand-alone or separable from host contracts, rather than, for example, duration characteristics of insurance contracts;
• the high hurdle levels under IAS 39 of ensuring hedge effectiveness at the level of individual hedge transactions;• the difficulties in applying the macro hedge provisions under IAS 39 (which are more suited to banking arrangements) to Jackson’s
derivative book, the complexity of asset and liability matching of US life insurers such as those with Jackson’s product range; and• whether it is possible or desirable, without an unacceptable level of costs and constraint on commercial activity, to achieve the
accounting hedge effectiveness required under IAS 39.

172
Prudential plc Annual Report 2011
Financial statements | Notes on the Group financial statements
A: Background and accounting policies continued
A3: Critical accounting policies, estimates and judgements continued
Taking account of these considerations the Group has decided that, except for certain minor categories of derivatives, it is not appropriate to seek to achieve hedge accounting under IAS 39. As a result of this decision the total income statement results are more volatile as the movements in the value of Jackson’s derivatives are reflected within it. Under IAS 39, unless carried at amortised cost (subject to impairment provisions where appropriate) under the held-to-maturity category, debt securities are also carried at fair value. The Group has chosen not to classify any financial assets as held-to-maturity. Debt securities of Jackson are designated as available-for-sale with value movements, unless impaired, being recorded as movements within other comprehensive income. Impairments are recorded in the income statement.
PresentationofresultsbeforetaxThe total tax charge for the Group reflects tax that in addition to relating to shareholders’ profits is also attributable to policyholders and unallocated surplus of with-profits funds and unit-linked policies. This is explained in more detail in note F5. However, pre-tax profits are determined after transfers to or from unallocated surplus of with-profits funds. These transfers are in turn determined after taking account of tax borne by with-profits funds. Consequently reported profit before the total tax charge is not representative of pre-tax profits attributable to shareholders. In order to provide a measure of pre-tax profits attributable to shareholders the Group has chosen to adopt an income statement presentation of the tax charge and pre-tax results that distinguishes between policyholder and shareholder components.
SegmentalanalysisofresultsandearningsattributabletoshareholdersThe Group uses operating profit based on longer-term investment returns as the segmental measure of its results. The basis of calculation is disclosed in note A4(d). For shareholder-backed business, with the exception of debt securities held by Jackson and assets classified as loans and receivables, all financial investments and investment property are designated as assets at fair value through profit and loss. Short-term fluctuations in investment returns on such assets held by with-profits funds, do not affect directly reported shareholder results. This is because (i) the unallocated surplus of with-profits funds is accounted for as liabilities and (ii) excess or deficits of income and expenditure of the funds over the required surplus for distribution are transferred to or from unallocated surplus. However, for shareholder-backed businesses the short-term fluctuations affect the result for the year and the Group provides additional analysis of results before and after short-term fluctuations in investment returns.
b CriticalaccountingestimatesandjudgementsInvestmentsDetermining the fair value of financial investments when the markets are not activeThe Group holds certain financial investments for which the markets are not active. These can include financial investments which are not quoted on active markets and financial investments for which markets are no longer active as a result of market conditions eg market illiquidity. When the markets are not active, there is generally no or limited observable market data to account for financial investments at fair value. The determination of whether an active market exists for a financial investment requires management’s judgement. If the market for a financial investment of the Group is not active, the fair value is determined by using valuation techniques. The Group establishes fair value for these financial investments by using quotations from independent third-parties, such as brokers or pricing services or by using internally developed pricing models. Priority is given to publicly available prices from independent sources when available, but overall the source of pricing and/or the valuation technique is chosen with the objective of arriving at a fair value measurement which reflects the price at which an orderly transaction would take place between market participants on the measurement date. The valuation techniques include the use of recent arm’s length transactions, reference to other instruments that are substantially the same, discounted cash flow analysis, option adjusted spread models and, if applicable, enterprise valuation and may include a number of assumptions relating to variables such as credit risk and interest rates. Changes in assumptions relating to these variables could positively or negatively impact the reported fair value of these financial investments. The financial investments measured at fair value are classified into the following three level hierarchy on the basis of the lowest level of inputs that is significant to the fair value measurement of the financial investment concerned:
Level 1: Quoted prices (unadjusted) in active markets for identical assets and liabilities; Level 2: Inputs other than quoted prices included within level 1 that are observable either directly or indirectly
(ie derived from prices); and Level 3: Significant inputs for the asset or liability that are not based on observable market data (unobservable inputs).
At 31 December 2011, £4,565 million (2010: £4,573 million) of the financial investments (net of derivative liabilities) valued at fair value were classified as level 3. Of these £800 million (2010: £866 million) are held to back shareholder non-linked business and so changes to these valuations will directly impact shareholders’ equity. Further details of the classification of financial instruments are given in note G1.

173F
ina
ncia
l statem
en
tsA:B
ackgro
undan
d
accountin
gpolicies
Determining impairments relating to financial assetsi Available-for-sale securitiesFinancial investments carried on an available-for-sale basis are represented by Jackson’s debt securities portfolio. The consideration of evidence of impairment requires management’s judgement. In making this determination the factors considered include, for example:
• Whether the decline of the financial investment’s fair value is substantial; A substantial decline in fair value might be indicative of a credit loss event that would lead to a measurable decrease in the estimated future cash flows;
• The impact of the duration of the security on the calculation of the revised estimated cash flows; • The duration of a security to maturity helps to inform whether assessments of estimated future cash flows that are higher than market
value are reasonable;• The duration and extent to which the amortised cost exceeds fair value;
This factor provides an indication of how the contractual cash flows and effective interest rate of a financial asset compares with the implicit market estimate of cash flows and the risk attaching to a ‘fair value’ measurement. The length of time for which that level of difference has been in place may also provide further evidence as to whether the market assessment implies an impairment loss has arisen; and
• The financial condition and prospects of the issuer or other observable conditions that indicate the investment may be impaired. If a loss event that will have a detrimental effect on cash flows is identified an impairment loss in the income statement is recognised. The loss recognised is determined as the difference between the book cost and the fair value of the relevant impaired securities. This loss comprises the effect of the expected loss of contractual cash flows and any additional market-price-driven temporary reductions in values.
For Jackson’s residential mortgage-backed and other asset-backed securities, all of which are classified as available-for-sale, the model used to analyse cash flows, begins with the current delinquency experience of the underlying collateral pool for the structure, by applying assumptions about how much of the currently delinquent loans will eventually default, and multiplying this by an assumed loss severity. Additional factors are applied to anticipate ageing effect. After applying a cash flow simulation an indication is obtained as to whether or not the security has suffered, or is anticipated to suffer, contractual principal or interest payment shortfall. If a shortfall applies an impairment charge is recorded. The difference between the fair value and book cost for unimpaired securities designated as available-for-sale, is accounted for as unrealised gains or losses, with the movements in the accounting period being included in other comprehensive income. The Group’s review of fair value involves several criteria, including economic conditions, credit loss experience, other issuer-specific developments and future cash flows. These assessments are based on the best available information at the time. Factors such as market liquidity, the widening of bid/ask spreads and a change in cash flow assumptions can contribute to future price volatility. If actual experience differs negatively from the assumptions and other considerations used in the consolidated financial statements, unrealised losses currently in equity may be recognised in the income statement in future periods. The preceding note in this section provides explanation on how fair value is determined when the markets for the financial investments are not active. Further, additional details on the impairments of the available-for-sale securities of Jackson are described in notes D3 and G5.
ii Assets held at amortised costFinancial assets classified as loans and receivables under IAS 39 are carried at amortised cost using the effective interest rate method. Certain mortgage loans of the UK insurance operations have been designated at fair value through profit and loss as this loan portfolio is managed and evaluated on a fair value basis and these are included within loans in the balance sheet. The loans and receivables include loans collateralised by mortgages, deposits and loans to policyholders. In estimating future cash flows, the Group looks at the expected cash flows of the assets and applies historical loss experience of assets with similar credit risks that has been adjusted for conditions in the historical loss experience which no longer exist or for conditions that are expected to arise. The estimated future cash flows are discounted using the financial asset’s original or variable effective interest rate and exclude credit losses that have not yet been incurred. The risks inherent in reviewing the impairment of any investment include: the risk that market results may differ from expectations, facts and circumstances may change in the future and differ from estimates and assumptions, or the Group may later decide to sell the asset as a result of changed circumstances.
InsurancecontractsProduct classificationIFRS 4 requires contracts written by insurers to be classified as either ‘insurance contracts’ or ‘investment contracts’ depending on the level of insurance risk transferred. Insurance risk is a pre-existing risk, other than financial risk, transferred from the contract holder to the contract issuer. If significant insurance risk is transferred by the contract then it is classified as an insurance contract. Contracts that transfer financial risk but not significant insurance risk are termed investment contracts. Furthermore, some contracts, both insurance and investment, contain discretionary participating features representing the contractual right to receive additional benefits as a supplement to guaranteed benefits:
a that are likely to be a significant portion of the total contract benefits,b whose amount or timing is contractually at the discretion of the insurer, andc that are contractually based on asset or fund performance, as discussed in IFRS 4.

174
Prudential plc Annual Report 2011
Financial statements | Notes on the Group financial statements
A3: Critical accounting policies, estimates and judgements continued
Accordingly, insurers must perform a product classification exercise across their portfolio of contracts issued to determine the allocation to these various categories. IFRS 4 permits the continued usage of previously applied GAAP for insurance contracts and investment contracts with discretionary participating features. Except for UK regulated with-profits funds, as described subsequently in section A4(b), this basis has been applied by the Group. For investment contracts that do not contain discretionary participating features, IAS 39 and, where the contract includes an investment management element, IAS 18,’Revenue’, apply measurement principles to assets and liabilities attaching to the contract.
Valuation assumptionsi Contracts of with-profits fundsThe Group’s with-profits funds write with-profits and other protection type policies classified as insurance contracts and investment contracts with discretionary participating features. For UK regulated with-profits funds, the contract liabilities are valued by reference to the UK Financial Services Authority’s (FSA) realistic basis as described in section A4(b). In aggregate, this basis has the effect of placing a value on the liabilities of UK with-profits contracts, which reflects the amounts expected to be paid based on the current value of investments held by the with-profits funds and current circumstances. The basis of determining liabilities for the Group’s with-profits business has little or no effect on the results attributable to shareholders. This is because movements on liabilities of the with-profits funds are absorbed by the unallocated surplus. Except through indirect effects, or in remote circumstances as described below, changes to liability assumptions are therefore reflected in the carrying value of the unallocated surplus, which is accounted for as a liability rather than shareholders’ equity. A detailed explanation of the basis of liability measurement is contained in note D2(g)(ii). The Group’s other with-profits contracts are written in with-profits funds that operate in some of the Group’s Asian operations. The liabilities for these contracts and those of Prudential Annuities Limited, which is a subsidiary company of the PAC with-profits fund, are determined differently. For these contracts the liabilities are estimated using actuarial methods based on assumptions relating to premiums, interest rates, investment returns, expenses, mortality and surrenders. The assumptions to which the estimation of these reserves is particularly sensitive are the interest rate used to discount the provision and the assumed future mortality experience of policyholders. For liabilities determined using the basis described above for UK regulated with-profits funds, and the other liabilities described in the preceding paragraph, changes in estimates arising from the likely range of possible changes in underlying key assumptions have no direct impact on the reported profit. This lack of sensitivity reflects the with-profits fund structure, basis of distribution, and the application of previous GAAP to the unallocated surplus of with-profits funds as permitted by IFRS 4. Changes in liabilities of these contracts that are caused by altered estimates are absorbed by the unallocated surplus of the with-profits funds with no direct effect on shareholders’ equity. The Company’s obligations and more detail on such circumstances are described in note H14.
ii Other contractsContracts, other than those of with-profits funds, are written in shareholder-backed operations of the Group. The significant shareholder-backed product groupings and the factors that may significantly affect IFRS results due to experience against assumptions or changes of assumptions vary significantly between business units. For some types of business the effect of changes in assumptions may be significant, whilst for others, due to the nature of the product, assumption setting may be of less significance. The nature of the products and the significance of assumptions are discussed in notes D2, D3 and D4. From the perspective of shareholder results the key sensitivity relates to the assumption for allowance for credit risk for UK annuity business, as described in note D2(g)(iii).
JacksonJackson offers individual fixed annuities, fixed index annuities, immediate annuities, variable annuities, individual and variable life insurance and institutional products. With the exception of institutional products and an incidental amount of business for annuity certain contracts, which are accounted for as investment contracts under IAS 39, all of Jackson’s contracts are accounted for under IFRS 4 as insurance contracts by applying US GAAP, the previous GAAP used before IFRS adoption. The accounting requirements under these standards and the effect of changes in valuation assumptions are considered below for fixed annuity, variable annuity and traditional life insurance contracts. Fixed annuity contracts, which are investment contracts under US GAAP terminology, are accounted for by applying in the first instance a retrospective deposit method to determine the liability for policyholder benefits. This is then augmented by potentially three additional amounts, namely deferred income, any amounts previously assessed against policyholders that are refundable on termination of the contract, and any premium deficiency, ie, any probable future loss on the contract. These types of contracts contain considerable interest rate guarantee features. Notwithstanding the accompanying market risk exposure, except in the circumstances of interest rate scenarios where the guarantee rates included in contract terms are higher than crediting rates that can be supported from assets held to cover liabilities, the accounting measurement of Jackson’s fixed annuity products is not generally sensitive to interest rate risk. This position derives from the nature of the products and the US GAAP basis of measurement.
A: Background and accounting policies continued

175F
ina
ncia
l statem
en
tsA
: Back
grou
nd
and
acco
un
ting p
olicies
Variable annuity contracts written by Jackson may provide for guaranteed minimum death, income, or withdrawal benefit features. In general terms, liabilities for these benefits are accounted for under US GAAP by using estimates of future benefits and fees under best estimate assumptions. For variable annuity business the key assumption is the investment return from the separate accounts, which for all years included was 8.4 per cent per annum (after deduction of external fund management fees) determined using a mean reversion methodology. Under the mean reversion methodology, projected returns over the next five years are flexed (subject to capping) so that, combined with the actual rates of return for the current and the previous two years the 8.4 per cent rate is maintained. The projected rates of return are capped at no more than 15 per cent for each of the next five years. Further details are explained in note D3(g). These returns affect the level of future expected profits through their effects on the fee income with consequential impact on the amortisation of deferred acquisition costs as described below and the required level of provision for guaranteed minimum death benefit claims. For traditional life insurance contracts, provisions for future policy benefits are determined using the net level premium method and assumptions as of the issue date as to mortality, interest, policy lapses and expenses plus provisions for adverse deviation. Except to the extent of mortality experience, which primarily affects profits through variations in claim payments and the guaranteed minimum death benefit reserves, the profits of Jackson are relatively insensitive to changes in insurance risk. This reflects the principally spread and fee-based nature of Jackson’s business.
Asian operationsThe insurance products written in the Group’s Asian operations principally cover with-profits business, unit-linked business, and other non-participating business. The results of with-profits business are relatively insensitive to changes in estimates and assumptions that affect the measurement of policyholder liabilities. As for the UK business, this feature arises because unallocated surplus is accounted for by the Group as a liability. The results of Asian unit-linked business are also relatively insensitive to changes in estimates or assumptions. The remaining non-participating business in Asia has some limited sensitivity to interest rates. Further details are provided in D4(j). DeferredacquisitioncostsSignificant costs are incurred in connection with acquiring new insurance business. Except for acquisition costs of with-profits contracts of the UK regulated with-profits funds, which are accounted for under the realistic FSA regimes as described in note A4, these costs are accounted for in a way that is consistent with the principles of the ABI SORP with deferral and amortisation against margins in future revenues on the related insurance policies. In general, this deferral is presentationally shown by an explicit carrying value for deferred acquisition costs (DAC) in the balance sheet. However, in some Asian operations the deferral is implicit through the reserving methodology. The recoverability of the explicitly and implicitly deferred acquisition costs is measured and are deemed impaired if the projected margins are less than the carrying value. To the extent that the future margins differ from those anticipated, then an adjustment to the carrying value will be necessary. The deferral and amortisation of acquisition costs is of most relevance to the Group’s results for shareholder-financed long-term business of Jackson and Asian operations. The majority of the UK shareholder-backed business is individual and group annuity business where the incidence of acquisition costs is negligible.
JacksonFor term business, acquisition costs are deferred and amortised in line with expected premiums. For annuity business, acquisition costs are deferred and amortised in line with expected gross profits on the relevant contracts. For interest-sensitive business, the key assumption is the long-term spread between the earned rate and the rate credited to policyholders, which is based on the annual spread analysis. In addition, expected gross profits depend on mortality assumptions, assumed unit costs and terminations other than deaths (including the related charges), all of which are based on a combination of Jackson’s actual industry experience and future expectations. A detailed analysis of actual experience is measured by internally developed mortality studies. For variable annuity business, the key assumption is the expected long-term level of equity market returns as described above. The level of acquisition costs carried in the statement of financial position is also sensitive to unrealised valuation movements on debt securities held to back the liabilities and solvency capital. Further details are explained in notes D3(g) and H1.
Asian operationsFor those territories applying US GAAP to insurance assets and liabilities, as permitted by the ABI SORP, principles similar to those set out in the Jackson paragraph above are applied to the deferral and amortisation of acquisition costs. For other Asian territories, the general principles of the ABI SORP are applied with, as described above, deferral of acquisition costs being either explicit or implicit through the reserving basis.

176
Prudential plc Annual Report 2011
Financial statements | Notes on the Group financial statements
A3: Critical accounting policies, estimates and judgements continued
PensionsThe Group applies the requirements of IAS 19, ‘Employee benefits’ and associated interpretations including IFRIC 14 ’IAS 19 – The Limit on a Defined Benefit Asset, Minimum Funding Requirements and their Interaction’, to its defined benefit pension schemes. The principal defined benefit pension scheme is the Prudential Staff Pension Scheme (PSPS). For PSPS the terms of the trust deed restrict shareholders’ access to any underlying surplus. Accordingly, applying the interpretation of IFRIC 14, any underlying IAS 19 basis surplus is not recognised for IFRS reporting. The financial position for PSPS recorded in the IFRS financial statements reflects the higher of any underlying IAS 19 deficit and any obligation for deficit funding. The economic participation in the surplus or deficits attaching to the PSPS and the smaller Scottish Amicable Pensions Scheme (SAPS) are shared between the PAC with-profits sub-fund (WPSF) and shareholder operations. The economic interest reflects the source of contributions over the scheme life, which in turn reflects the activity of the members during their employment. In the case of PSPS, movements in the apportionment of the financial position for PSPS between the WPSF and shareholders’ funds in 2011 reflect the 70/30 ratio applied to the base deficit position as at 31 December 2005 but with service cost and contributions for ongoing service apportioned by reference to the cost allocation for activity of current employees. For SAPS the ratio is estimated to be approximately 50/50 between the WPSF and shareholders’ funds. Due to the inclusion of actuarial gains and losses in the income statement rather than being recognised in other comprehensive income, the results of the Group are affected by changes in interest rates for corporate bonds that affect the rate applied to discount projected pension payments, changes in mortality assumptions and changes in inflation assumptions.
DeferredtaxDeferred tax assets are recognised to the extent that they are regarded as recoverable, that is to the extent that, on the basis of all the available evidence, it can be regarded as more likely than not that there will be suitable taxable profits against which the losses can be relieved. The taxation regimes applicable across the Group apply separate rules to trading and capital profits and losses. The distinction between temporary differences that arise from items of either a capital or trading nature may affect the recognition of deferred tax assets. The judgements made, and uncertainties considered, in arriving at deferred tax balances in the financial statements are discussed in note H4.
GoodwillGoodwill impairment testing requires the exercise of judgement by management as to prospective future cash flows. Further information is disclosed in note H1.
A4: Significant accounting policies
a Financialinstrumentsotherthanfinancialinstrumentsclassifiedaslong-termbusinesscontractsInvestmentclassificationUnder IAS 39, subject to specific criteria, financial instruments should be accounted for under one of the following categories: financial investments at fair value through profit and loss, financial investments held on an available-for-sale basis, financial investments held-to-maturity or loans and receivables. Upon initial recognition, financial investments are measured at fair value plus, in the case of a financial asset or financial liability not at fair value through profit or loss, transaction costs that are directly attributable to the acquisition or issue of the financial asset or financial liability. These IAS 39 classifications have been changed by IFRS 9 ‘Financial Investments: Classification and Measurement’ which is not required to be adopted until 2015 and is still subject to EU endorsement. This standard has not been adopted by the Group in 2011. The Group holds financial investments on the following bases:
i Financial assets and liabilities at fair value through profit and loss – this comprises assets and liabilities designated by management as fair value through profit and loss on inception and derivatives that are held for trading. These investments are measured at fair value with all changes thereon being recognised in investment income;
ii Financial investments on an available-for-sale basis – this comprises assets that are designated by management and/or do not fall into any of the other categories. Available-for-sale financial assets are initially recognised at fair value plus attributable transaction costs. For available-for-sale debt securities, the difference between their cost and par value is amortised to the income statement using the effective interest rate. Available-for-sale financial assets are subsequently measured at fair value. Interest income is recognised on an effective interest basis in the income statement. Except for foreign exchange gains and losses on debt securities, not in functional currency, which are included in the income statement, unrealised gains and losses are recognised in other comprehensive income (ie outside of the income statement). Upon disposal or impairment, accumulated unrealised gains and losses are transferred from other comprehensive income to the income statement as realised gains or losses; and
iii Loans and receivables – this comprises non-quoted investments that have fixed or determinable payments and are not designated as fair value through profit and loss or available-for-sale. These investments include loans collateralised by mortgages, deposits, loans to policyholders and other unsecured loans and receivables. These investments are initially recognised at fair value plus transaction costs. Subsequently, these investments are carried at amortised cost using the effective interest method.
A: Background and accounting policies continued

177F
ina
ncia
l statem
en
tsA
: Back
grou
nd
and
acco
un
ting p
olicies
As permitted under IAS 39 the Group has designated certain financial assets as fair value through profit and loss as these assets are managed and their performance is evaluated on a fair value basis. These assets represent all of the Group’s financial assets other than the majority of loans and receivables and debt securities held by Jackson. Debt securities held by Jackson are accounted for on an available-for-sale basis. The use of the fair value option is consistent with the Group’s risk management and investment strategies. The Group uses the trade date method to account for regular purchases and sales of financial assets.
UseoffairvaluesThe Group uses current bid prices to value its investments with quoted prices. Actively traded investments without quoted prices are valued using prices provided by third parties. If there is no active established market for an investment, the Group applies an appropriate valuation technique such as a discounted cash flow technique. Additional details are provided in note G1.
ImpairmentsThe Group assesses at each statement of financial position date, whether there is objective evidence that a financial asset or group of financial assets not held at fair value through profit and loss is impaired. A financial asset or group of financial assets is impaired and impairment losses are incurred only if there is objective evidence of impairment as a result of one or more events that have occurred after the initial recognition of the asset (a loss event) and that a loss event (or events) has an impact on the estimated future cash flows of the financial asset or group of financial assets that can be reliably estimated. Objective evidence that a financial asset or group of financial assets is impaired includes observable data that comes to the attention of the Group. For assets designated as available-for-sale, the initial impairment is the cumulative loss which is removed from the available-for-sale reserve within equity and recognised in the income statement. Any subsequent impairment loss is measured as the cumulative loss, less any impairment loss previously recognised. For loans and receivables carried at amortised cost, the impairment amount is the difference between carrying value and the present value of the expected cash flows discounted at the original effective interest rate. If, in subsequent periods, an impaired debt security held on an available-for-sale basis or an impaired loan or receivable recovers in value (in part or in full), and this recovery can be objectively related to an event occurring after the impairment, then the previously recognised impairment loss is reversed through the income statement (in part or in full).
DerivativesandhedgeaccountingDerivative financial instruments are used to reduce or manage investment, interest rate and currency exposures, to facilitate efficient portfolio management and for investment purposes. The Group may designate certain derivatives as hedges. This includes fair value hedges, cash flow hedges and hedges of net investments in foreign operations. If the criteria for hedge accounting are met then the following accounting treatments are applied from the date at which the designation is made and the accompanying requisite documentation is in place:
i Hedges of net investments in foreign operations – the effective portion of any change in fair value of derivatives or other financial instruments designated as net investment hedges are recognised in other comprehensive income (ie outside of the income statement). The ineffective portion of changes in the fair value of the hedging instrument is recorded in the income statement. The gain or loss on the hedging instrument recognised directly in other comprehensive income, is recognised in the income statement on disposal of the foreign operation;
ii Fair value hedges – movements in the fair value of the hedged item attributable to the hedged risk are recognised in the income statement; and
iii Cash flow hedges – the effective portion of changes in the fair value of derivatives designated as cash flow hedges is recognised in other comprehensive income (ie outside of the income statement). Movements in fair value relating to the ineffective portion are booked in the income statement. Amounts recognised in other comprehensive income are recorded in the income statement in the periods in which the hedged item affects profit or loss.
All derivatives that do not meet the relevant hedging criteria are carried at fair value with movements in fair value being recorded in the income statement. The primary areas of the Group’s continuing operations where derivative instruments are held are the UK with-profits funds and annuity business, and Jackson. For the Group’s continuing operations, hedge accounting under IAS 39 is not usually applied. The exceptions, where hedge accounting has been applied in 2011 and 2010, are summarised in note G3. Where the hedge relationship has been de-designated and re-designated, the fair value adjustment to the hedged item up to the point of de-designation continues to be reported as part of the basis of the hedged item and is amortised to the income statement based on a recalculated effective interest rate over the residual period to the first break clause date of the perpetual subordinated capital securities. For UK with-profits funds the derivative programme is undertaken as part of the efficient management of the portfolio as a whole. As noted in note D2 value movements on the with-profits funds investments are reflected in changes in asset-share liabilities to policyholders or the liability for unallocated surplus. Shareholders’ profit and equity are not affected directly by value movements on the derivatives held.

178
Prudential plc Annual Report 2011
Financial statements | Notes on the Group financial statements
A4: Significant accounting policies continued
For shareholder-backed UK annuity business the derivatives are held to contribute to the matching as far as practical, of asset returns and duration with those of liabilities to policyholders. The carrying value of these liabilities is sensitive to the return on the matching financial assets including derivatives held. Except for the extent of minor mismatching, value movements on derivatives held for this purpose do not affect shareholders’ profit or equity. For Jackson an extensive derivative programme is maintained. Value movements on the derivatives held can be very significant in their effect on shareholder results. The Group has chosen generally not to seek to construct the Jackson derivative programme so as to facilitate hedge accounting where theoretically possible, under IAS 39. Further details on this aspect of the Group’s financial reporting are described in note A3.
EmbeddedderivativesEmbedded derivatives are present in host contracts issued by various Group companies, in particular for Jackson. They are embedded within other non-derivative host financial instruments and insurance contracts to create hybrid instruments. Embedded derivatives meeting the definition of an insurance contract are accounted for under IFRS 4. Where economic characteristics and risks of the embedded derivatives are not closely related to the economic characteristics and risks of the host instrument, and where the hybrid instrument is not measured at fair value with the changes in fair value recognised in the income statement, the embedded derivative is bifurcated and carried at fair value as a derivative in accordance with IAS 39. In addition, the Group applies the requirement of IFRS 4 to not separate and fair value surrender options embedded in host contracts and with-profits investment contracts whose strike price is either a fixed amount or a fixed amount plus interest. Further details on the valuation basis for embedded derivatives attaching to Jackson’s life assurance contracts are provided in note D3(g).
SecuritieslendingincludingrepurchaseagreementsThe Group is party to various securities lending agreements under which securities are loaned to third-parties on a short-term basis. The loaned securities are not derecognised; rather, they continue to be recognised within the appropriate investment classification. The Group’s policy is that collateral in excess of 100 per cent of the fair value of securities loaned is required from all securities’ borrowers and typically consists of cash, debt securities, equity securities or letters of credit. In cases where the Group takes possession of the collateral under its securities lending programme, the collateral, and corresponding obligation to return such collateral, are recognised in the consolidated statement of financial position.
DerecognitionoffinancialassetsandliabilitiesThe Group’s policy is to derecognise financial assets when it is deemed that substantially all the risks and rewards of ownership have been transferred. The Group also derecognises a financial asset when the contractual rights to the cash flows from the financial asset expire. Where the Group neither transfers nor retains substantially all the risks and rewards of ownership, the Group will derecognise the financial asset where it is deemed that the Group has not retained control of the financial asset. Where the transfer does not result in the Group transferring the right to receive the cash flows of the financial assets, but does result in the Group assuming a corresponding obligation to pay the cash flows to another recipient, the financial assets are also accordingly derecognised providing all of the following conditions are met:
• the Group has no obligation to pay amounts to the eventual recipients unless it collects the equivalent amounts from the original asset,• the Group is prohibited by the terms of the transfer contract from selling or pledging the original asset, and• the Group has an obligation to remit any cash flows it collects on behalf of the eventual recipients without material delay.
The Group derecognises financial liabilities only when the obligation specified in the contract is discharged, cancelled or has expired.
BorrowingsAlthough initially recognised at fair value, net of transaction costs, borrowings, excluding liabilities of consolidated collateralised debt obligations, are subsequently accounted for on an amortised cost basis using the effective interest method. Under the effective interest method, the difference between the redemption value of the borrowing and the initial proceeds (net of related issue costs) is amortised through the income statement to the date of maturity or for hybrid debt, over the expected life of the instrument.
FinancialliabilitiesdesignatedatfairvaluethroughprofitandlossConsistent with the Group’s risk management and investment strategy and the nature of the products concerned, the Group has designated under IAS 39 classification certain financial liabilities at fair value through profit and loss as these instruments are managed and their performance evaluated on a fair value basis. These instruments include liabilities related to consolidated collateralised debt obligations and net assets attributable to unit holders of consolidated unit trusts and similar funds.
A: Background and accounting policies continued

179F
ina
ncia
l statem
en
tsA
: Back
grou
nd
and
acco
un
ting p
olicies
b Long-termbusinesscontractsIncomestatementtreatmentPremiums and claimsPremium and annuity considerations for conventional with-profits policies and other protection type insurance policies are recognised as revenue when due. Premiums and annuity considerations for linked policies, unitised with-profits and other investment type policies are recognised as revenue when received or, in the case of unitised or unit-linked policies, when units are issued. These amounts exclude UK premium taxes and similar duties where Prudential collects and settles taxes borne by the customer. Policy fees charged on linked and unitised with-profits policies for mortality, asset management and policy administration are recognised as revenue when related services are provided. Claims paid include maturities, annuities, surrenders and deaths. Maturity claims are recorded as charges on the policy maturity date. Annuity claims are recorded when each annuity instalment becomes due for payment. Surrenders are charged to the income statement when paid and death claims are recorded when notified. For investment contracts which do not contain discretionary participating features, the accounting is carried out in accordance with IAS 39 to reflect the deposit nature of the arrangement, with premiums and claims reflected as deposits and withdrawals and taken directly to the statement of financial position as movements in the financial liability balance.
Acquisition costsWith the exception of costs incurred in respect of with-profits contracts valued on a realistic basis, costs of acquiring new insurance business, principally commissions, marketing and advertising costs and certain other costs associated with policy issuance and underwriting that are not reimbursed by policy charges, are specifically identified and capitalised as part of deferred acquisition costs (DAC), which are included as an asset in the statement of financial position. The DAC asset in respect of insurance contracts is amortised against margins in future revenues on the related insurance policies, to the extent that the amounts are recoverable out of the margins. Recoverability of the unamortised DAC asset is assessed at the time of policy issue and reviewed if profit margins have declined. Under IFRS, investment contracts (excluding those with discretionary participation features) accounted for as financial liabilities in accordance with IAS 39 which also offer investment management services, require the application of IAS 18 for the revenue attached to these services. The Group’s investment contracts primarily comprise certain unit-linked savings contracts in the UK and Asia and contracts with fixed and guaranteed terms in the US (such as guaranteed investment contracts and annuity-certains) all of which offer an investment service. Incremental, directly attributable acquisition costs relating to the investment management element of these contracts are capitalised and amortised in line with the related revenue. If the contracts involve up-front charges, this income is also deferred and amortised through the income statement in line with contractual service provision.
UKregulatedwith-profitsfundsPrudential’s long-term business written in the UK comprises predominantly life insurance policies with discretionary participating features under which the policyholders are entitled to participate in the returns of the funds supporting these policies. Business similar to this type is also written in certain of the Group’s Asian operations subject to local market and regulatory conditions. Such policies are called with-profits policies. Prudential maintains with-profits funds within the Group’s long-term business funds, which segregate the assets and liabilities and accumulate the returns related to that with-profits business. The amounts accumulated in these with-profits funds are available to provide for future policyholder benefit provisions and for bonuses to be distributed to with-profits policyholders. The bonuses, both annual and final, reflect the right of the with-profits policyholders to participate in the financial performance of the with-profits funds. Shareholders’ profits with respect to bonuses declared on with-profits business correspond to the shareholders’ share of the cost of bonuses as declared by the Board of directors. The shareholders’ share currently represents one-ninth of the cost of bonuses declared for with-profits policies. Annual bonuses are declared and credited each year to with-profits policies. The annual bonuses increase policy benefits and, once credited, become guaranteed. Annual bonuses are charged to the profit and loss account in the year declared. Final bonuses are declared each year and accrued for all policies scheduled to mature and for death benefits expected to be paid during the next financial year. Final bonuses are not guaranteed and are only paid on policies that result from claims through the death of the policyholder or maturity of the policy within the period of declaration or by concession on surrender. No policyholder benefit provisions are recorded for future annual or final bonus declarations. The policyholders’ liabilities of the regulated with-profits funds are accounted for under FRS 27. Under FRS 27 for the UK with-profits funds:
• no deferred acquisition costs and related deferred tax are recognised, and• adjusted realistic basis liabilities instead of MSB liabilities are recognised.
FRS 27 realistic basis liabilities are underpinned by the FSA’s Peak 2 basis of reporting. This Peak 2 basis requires the value of liabilities to be calculated as:
• a with-profits benefits reserve (WPBR), plus• future policy related liabilities (FPRL), plus• the realistic current liabilities of the fund.

180
Prudential plc Annual Report 2011
Financial statements | Notes on the Group financial statements
A4: Significant accounting policies continued
The WPBR is primarily based on the retrospective calculation of accumulated asset shares but is adjusted to reflect future policyholder benefits and other outgoings. The FPRL must include a market consistent valuation of costs of guarantees, options and smoothing, less any related charges, and this amount is determined using either a stochastic approach, hedging costs or a series of deterministic projections with attributed probabilities. The assumptions used in the stochastic models are calibrated to produce risk-free returns on each asset class. Volatilities of, and correlations between, investment returns from different asset classes are as determined by the Group’s Portfolio Management Group on a market consistent basis. The cost of guarantees, options and smoothing is very sensitive to the bonus, market value reduction (MVR) and investment policies the Group employs and therefore the stochastic modelling incorporates a range of management actions that would help to protect the fund in adverse scenarios. Substantial flexibility has been included in the modelled management actions in order to reflect the discretion that the Group retains in adverse investment conditions, thereby avoiding the creation of unreasonable minimum capital requirements. The management actions assumed are consistent with management’s policy for with-profits funds and the disclosures made in the publicly available Principles and Practices of Financial Management. The realistic basis liabilities representing the Peak 2 basis realistic liabilities for with-profits business included in Form 19 of the FSA regulatory returns include the element for the shareholders’ share of the future bonuses. For accounting purposes under FRS 27, this latter item is reversed because, consistent with the current basis of financial reporting, shareholder transfers are recognised only on declaration.
Unallocated surplusThe unallocated surplus represents the excess of assets over policyholder liabilities for the Group’s with-profits funds. As allowed under IFRS 4, the Group has opted to continue to record unallocated surplus of with-profits funds wholly as a liability. The annual excess (shortfall) of income over expenditure of the with-profits funds, after declaration and attribution of the cost of bonuses to policyholders and shareholders, is transferred to (from) the unallocated surplus each year through a charge (credit) to the income statement. The balance retained in the unallocated surplus represents cumulative income arising on the with-profits business that has not been allocated to policyholders or shareholders. The balance of the unallocated surplus is determined after full provision for deferred tax on unrealised appreciation on investments.
Otherinsurancecontracts(iecontractswhichcontainsignificantinsuranceriskasdefinedunderIFRS4)For these contracts UK GAAP has been applied, which reflects the MSB. Under this basis the following approach applies:
i Other UK insurance contractsOther UK insurance contracts that contain significant insurance risk include unit-linked, annuity and other non-profit business. For the purposes of local regulations, segregated accounts are established for linked business for which policyholder benefits are wholly or partly determined by reference to specific investments or to an investment-related index. The interest rates used in establishing policyholder benefit provisions for pension annuities in the course of payment are adjusted each year. Mortality rates used in establishing policyholder benefits are based on published mortality tables adjusted to reflect actual experience.
ii Overseas subsidiariesThe assets and liabilities of insurance contracts of overseas subsidiaries are determined initially using local GAAP bases of accounting with subsequent adjustments where necessary to comply with the Group’s accounting policies.
JacksonThe future policyholder benefit provisions for Jackson’s conventional protection-type policies are determined using the net level premium method under US GAAP principles and the locked in assumptions as to mortality, interest, policy lapses and expenses plus provisions for adverse deviations. For non-conventional protection-type policies, the policyholder benefit provision included within policyholder liabilities in the consolidated statement of financial position is the policyholder account balance. For the business of Jackson, the determination of the expected emergence of margins, against which the amortisation profile of the DAC asset is established, is dependent on certain key assumptions. For single premium deferred annuity business, the key assumption is the expected long-term spread between the earned rate and the rate credited to policyholders. For variable annuity business, the key assumption is the expected long-term level of separate account returns, which for 2011 and 2010 was 8.4 per cent. The impact of using this return is reflected in two principal ways, namely:
i Through the projected expected gross profits which are used to determine the amortisation of deferred acquisition costs. This is applied through the use of a mean reversion technique which is described in more detail in note D3; and
ii The required level of provision for guaranteed minimum death benefit claims.
A: Background and accounting policies continued

181F
ina
ncia
l statem
en
tsA
: Back
grou
nd
and
acco
un
ting p
olicies
Jackson accounts for the majority of its investment portfolio on an available-for-sale basis (see investment policies above) whereby unrealised gains and losses are recognised in other comprehensive income. As permitted by IFRS 4, Jackson has used shadow accounting. Under shadow accounting, to the extent that recognition of unrealised gains or losses on available-for-sale securities causes adjustments to the carrying value and amortisation patterns of DAC and deferred income, these adjustments are recognised in other comprehensive income to be consistent with the treatment of the gains or losses on the securities. More precisely, shadow DAC adjustments reflect the change in DAC that would have arisen if the assets held in the statement of financial position had been sold, crystallising unrealised gains or losses, and the proceeds reinvested at the yields currently available in the market.
Asian operationsExcept for the operations in India, Japan, Taiwan and Vietnam, the future policyholder benefit provisions for Asian businesses are determined in accordance with methods prescribed by local GAAP adjusted to comply, where necessary, with UK GAAP. For the Hong Kong business, which is a branch of the PAC, and the Singapore and Malaysian operations, the valuation principles and sensitivities to changes of assumptions of conventional with-profits and other protection-type policies are similar to those described above for equivalent products written by the UK operations. Refinements to the local reserving methodology are generally treated as change in estimates, dependent on the nature of the change. For the operations in India, Japan, Taiwan and Vietnam countries where local GAAP is not appropriate in the context of the previously applied MSB, accounting for insurance contracts is based on US GAAP. For these operations the business written is primarily non-participating linked and participating business. The future policyholder benefit provisions for non-linked business are determined using the net level premium method, with an allowance for surrenders, maintenance and claim expenses. Rates of interest used in establishing the policyholder benefit provisions vary by operation depending on the circumstances attaching to each block of business. Where appropriate, liabilities for participating business for these three operations include provisions for the policyholders’ interest in realised investment gains and other surpluses that have yet to be declared as bonuses. Although the basis of valuation of Prudential’s overseas operations is in accordance with the requirements of the Companies Act 2006 and ABI SORP, the valuation of policyholder benefit provisions for these businesses may differ from that determined on a UK MSB for UK operations with the same features. These differences are permitted under IFRS 4.
Liability adequacyThe Group performs liability adequacy testing on its insurance provisions to ensure that the carrying amounts of provisions (less related DAC and present value of in-force business – see policy on business acquisitions and disposals) is sufficient to cover current estimates of future cash flows. When performing the liability adequacy test, the Group discounts all contractual cash flows and compares this amount to the carrying value of the liability. Any deficiency is immediately charged to the income statement.
ReinsuranceIn the normal course of business, the Group seeks to reduce loss exposure by reinsuring certain levels of risk in various areas of exposure with other insurance companies or reinsurers. An asset or liability is recognised in the consolidated statement of financial position representing premiums due to, or payments due from reinsurers and the share of benefits and claims recoverable from reinsurers. The measurement of reinsurance assets is consistent with the measurement of the underlying direct insurance contracts. The treatment of any gains or losses arising on the purchase of reinsurance contracts is dependent on the underlying accounting basis of the entity concerned amongst other things.
Investmentcontracts(contractswhichdonotcontainsignificantinsuranceriskasdefinedunderIFRS4)For investment contracts with discretionary participation features, the accounting basis is consistent with the accounting for similar with-profits insurance contracts. Other investment contracts are accounted for on a basis that reflects the hybrid nature of the arrangements whereby part is accounted for as a financial instrument under IAS 39 and the investment management service component is accounted for under IAS 18. For those investment contracts in the US with fixed and guaranteed terms, the Group uses the amortised cost model to measure the liability. On contract inception, the liability is measured at fair value less incremental, directly attributable acquisition costs. Remeasurement at future reporting dates is on an amortised cost basis utilising an effective interest rate methodology whereby the interest rate utilised discounts to the net carrying amount of the financial liability. Those investment contracts without fixed and guaranteed terms are designated at fair value through profit and loss because the resulting liabilities are managed and their performance is evaluated on a fair value basis. Fair value is based upon the fair value of the underlying assets of the fund. Where the contract includes a surrender option its carrying value is subject to a minimum carrying value equal to its surrender value.

182
Prudential plc Annual Report 2011
Financial statements | Notes on the Group financial statements
A4: Significant accounting policies continued
c Otherassets,liabilities,incomeandexpenditureBasisofconsolidationThe Group consolidates those entities it is deemed to control. The degree of control is determined by the ability of the Group to govern the financial and operating policies of an entity in order to obtain benefits. Consideration is given to other factors such as potential voting rights. The Group has consolidated special purpose entities (SPEs), such as funds holding collateralised debt obligations (CDOs), where evaluation of the substance of the relationship between the SPE and the Group indicates that the Group is deemed to control the SPE under IFRS. The Group holds investments in internally and externally managed open-ended investment companies (OEICs) and unit trusts. These are consolidated where the Group’s percentage ownership level is 50 per cent or greater. The Group’s percentage ownership levels in these entities can fluctuate from day to day according to changes in the Group’s and third-party participation in the funds. In instances where the Group’s ownership of internally managed funds declines marginally below 50 per cent and, based on historical analysis and future expectations the decline in ownership is expected to be temporary, the funds continue to be consolidated as subsidiaries under IAS 27, ‘Consolidated and Separate Financial Statements’. Where the Group exercises significant influence or has the power to exercise significant influence over an entity, generally through ownership of 20 per cent or more of the entity’s voting rights, but does not control the entity, then this is considered to be an investment in an associate. With the exception of those referred to below, the Group’s investments in associates are recorded at the Group’s share of the associates’ net assets including any goodwill and intangibles arising upon initial acquisition. The carrying value of investments in associates is adjusted each year for the Group’s share of the entities’ profit or loss. This does not apply to investments in associates held by the Group’s insurance or investment funds including the venture capital business or mutual funds and unit trusts, which as permitted by IAS 28, ‘Investments in Associates’, are carried at fair value through profit and loss. The Group’s investments in joint ventures are recognised using proportional consolidation whereby the Group’s share of an entity’s individual balances are combined line-by-line with similar items into the Group financial statements. Other interests in entities, where significant influence is not exercised, are carried as investments at fair value through profit and loss. The consolidated financial statements of the Group include the assets, liabilities and results of the Company and subsidiary undertakings in which Prudential has a controlling interest, using accounts drawn up to 31 December 2011 except where entities have non-coterminous year ends. In such cases, the information consolidated is based on the accounting period of these entities and is adjusted for material changes up to 31 December. Accordingly, the information consolidated is deemed to cover the same period for all entities throughout the Group. The results of subsidiaries are included in the financial statements from the date control commences to the date control ceases. All inter-company transactions are eliminated on consolidation. Results of asset management activities include those for managing internal funds.
InvestmentpropertiesInvestments in leasehold and freehold properties not for occupation by the Group, including properties under development for future use as investment properties, are carried at fair value, with changes in fair value included in the income statement. Properties are valued annually either by the Group’s qualified surveyors or by taking into consideration the advice of professional external valuers using the Royal Institution of Chartered Surveyors (RICS) guidelines. The RICS guidelines apply separate assumptions to the value of the land, buildings and tenancy associated with each property. Each property is externally valued at least once every three years. The cost of additions and renovations is capitalised and considered when estimating fair value. Fair value is based on active market prices, adjusted, if necessary, for any difference in the nature, location or condition of the specific property. If this information is not available, the Group uses alternative valuation methods such as discounted cash flow projections or recent prices in less active markets. Leases of investment property where the Group has substantially all the risks and rewards of ownership are classified as finance leases (leasehold property). Finance leases are capitalised at the lease’s inception at the lower of the fair value of the leased property and the present value of the minimum lease payments. Where a lease has a contingent rent element, the rent is calculated in accordance with individual lease terms and charged as an expense as incurred.
PensionschemesThe Group operates a number of pension schemes around the world. The largest of these schemes is the PSPS, a defined benefit scheme. The Group also operates defined contribution schemes. Defined contribution schemes are schemes where the Company pays contributions into a fund and the Company has no legal or constructive obligation to pay further contributions should the assets of that fund be insufficient to pay the employee benefits relating to employee service in both current and prior periods. Defined benefit schemes are post-employment benefit plans that are not defined contribution schemes. For the Group’s defined benefit schemes, if the present value of the defined benefit obligation exceeds the fair value of the scheme assets, then a liability is recorded in the Group’s statement of financial position. By contrast, if the fair value of the assets exceeds the present value of the defined benefit obligation then the surplus will only be recognised if the nature of the arrangements under the trust deed, and funding arrangements between the Trustee and the Company support the availability of refunds or recoverability through agreed reductions in future contributions. In addition, if there is a constructive obligation for the Company to pay deficit funding, this is also recognised.
A: Background and accounting policies continued

183F
ina
ncia
l statem
en
tsA
: Back
grou
nd
and
acco
un
ting p
olicies
The Group utilises the projected unit credit method to calculate the defined benefit obligation. Estimated future cash flows are then discounted at a high-quality corporate bond rate, adjusted to allow for the difference in duration between the bond index and the pension liabilities where appropriate, to determine its present value. These calculations are performed by independent actuaries. The plan assets of the Group’s pension schemes exclude several insurance contracts that have been issued by the Group. These assets are excluded from plan assets in determining the pension obligation recognised in the consolidated statement of financial position. The aggregate of the actuarially determined service costs of the currently employed personnel and the unwind of discount on liabilities at the start of the period, less the expected investment return on scheme assets at the start of the period, is charged to the income statement. Actuarial gains and losses as a result of changes in assumptions or experience variances are also charged or credited to the income statement. Contributions to the Group’s defined contribution schemes are expensed when due. Once paid, the Group has no further payment obligations. Any prepayments are reflected as an asset on the statement of financial position.
Share-basedpaymentsThe Group offers share award and option plans for certain key employees and a Save As You Earn (SAYE) plan for all UK and certain overseas employees. The arrangements for distribution to employees of shares held in trust relating to share award plans and for entitlement to dividends depend upon the particular terms of each plan. Shares held in trust relating to these plans are conditionally gifted to employees. The compensation expense charged to the income statement is primarily based upon the fair value of the options granted, the vesting period and the vesting conditions. Vesting conditions exclude the ability of an employee to voluntarily exit a scheme and such exits are treated as an acceleration of vesting and hence a shortening of the period over which the expense is charged. The Group revises its estimate of the number of options likely to be exercised at each statement of financial position date and adjusts the charge to the income statement accordingly. Where the share-based payment depends upon vesting outcomes attaching to market-based performance conditions, additional modelling is performed to estimate the fair value of the awards. No subsequent adjustment is then made to the fair value charge for awards that do not vest on account of these performance conditions not being met. The Company has established trusts to facilitate the delivery of Prudential plc shares under employee incentive plans and savings-related share option schemes. None of the trusts that hold shares for employee incentive and savings plans continue to hold these shares once they are issued to employees. The cost to the Company of acquiring these treasury shares held in trusts is shown as a deduction from shareholders’ equity. TaxThe Group’s UK subsidiaries each file separate tax returns. Jackson and other foreign subsidiaries, where permitted, file consolidated income tax returns. In accordance with UK tax legislation, where one domestic UK company is a 75 per cent owned subsidiary of another UK company or both are 75 per cent owned subsidiaries of a common parent, the companies are considered to be within the same UK tax group. For companies within the same tax group, trading profits and losses arising in the same accounting period may be offset for purposes of determining current and deferred taxes. Current tax expense is charged or credited to operations based upon amounts estimated to be payable or recoverable as a result of taxable operations for the current year. To the extent that losses of an individual UK company are not offset in any one year, they can be carried back for one year or carried forward indefinitely to be offset against profits arising from the same company. Deferred taxes are provided under the liability method for all relevant temporary differences, being the difference between the carrying amount of an asset or liability in the statement of financial position and its value for tax purposes. IAS 12, ‘Income Taxes’ does not require all temporary differences to be provided for, in particular, the Group does not provide for deferred tax on undistributed earnings of subsidiaries where the Group is able to control the timing of the distribution and the temporary difference created is not expected to reverse in the foreseeable future. The tax effects of losses available for carry forward are recognised as an asset. Deferred tax assets are only recognised when it is more likely than not, that future taxable profits will be available against which these losses can be utilised. Deferred tax related to charges or credits taken to other comprehensive income is also credited or charged to other comprehensive income and is subsequently recognised in the income statement together with the deferred gain or loss. The tax charge for long-term business includes tax expense on with-profits funds attributable to both the policyholders and the shareholders. Different tax rules apply under UK law depending upon whether the business is life insurance or pension business. Tax on the life insurance business is based on investment returns less expenses attributable to that business. Tax on the pension business is based on the shareholders’ profits or losses attributable to that business. The shareholders’ portion of the long-term business is taxed at the shareholders’ rate with the remaining portion taxed at rates applicable to the policyholders. Deferred tax is measured at the tax rates that are expected to apply to the period when the asset is realised or the liability settled, based on tax rates (and laws) that have been enacted or are substantively enacted at the end of the reporting period.

184
Prudential plc Annual Report 2011
Financial statements | Notes on the Group financial statements
A4: Significant accounting policies continued
Basis of presentation of tax chargesTax charges in the income statement reflect the aggregate of the shareholder tax on the long-term business result and on the Group’s other results. Under UK Listing Authority rules, profit before tax is required to be presented. This requirement, coupled with the fact that IFRS does not contemplate tax charges which are attributable to policyholders and unallocated surplus of with-profits funds and unit-linked policies, necessitates the reporting of total tax charges within the presented results. The result before all taxes (ie ‘profit before tax’ as shown in the income statement) represents income net of post-tax transfers to unallocated surplus of with-profits funds, before tax attributable to policyholders and unallocated surplus of with-profits funds, unit-linked policies and shareholders. Separately within the income statement, ‘profit before tax attributable to shareholders’ is shown after deduction of taxes attributable to policyholders and unallocated surplus of with-profits funds and unit-linked policies. Tax charges on this measure of profit reflect the tax charges attributable to shareholders. In determining the tax charges attributable to shareholders, the Group has applied a methodology consistent with that previously applied under UK GAAP reflecting the broad principles underlying the tax legislation of life assurance companies.
Property,plantandequipmentAll property, plant and equipment such as owner occupied property, computer equipment and furniture and fixtures, are carried at depreciated cost. Costs including expenditure directly attributable to the acquisition of the assets are capitalised. Depreciation is calculated and charged on a straight-line basis over an asset’s estimated useful life. The residual values and useful lives are reviewed at each statement of financial position date. If the carrying amount of an asset is greater than its recoverable amount then its carrying value is written down to that recoverable amount. Leasehold improvements to owner occupied property are depreciated over the shorter of the economic life and the life of the lease. Assets held under finance leases are capitalised at their fair value.
BusinessacquisitionsanddisposalsBusiness acquisitions are accounted for by applying the purchase method of accounting, which adjusts the net assets of the acquired company to fair value at the date of purchase. The excess of the acquisition consideration over the fair value of the assets and liabilities of the acquired entity is recorded as goodwill. Expenses related to acquiring new subsidiaries are expensed in the period in which they are incurred. Should the fair value of the identifiable assets and liabilities of the entity exceed the acquisition consideration then this amount is recognised immediately in the income statement. Income and expenses of acquired entities are included in the income statement from the date of acquisition. Income and expenses of entities sold during the period are included in the income statement up to the date of disposal. The gain or loss on disposal is calculated as the difference between sale proceeds, net of selling costs, less the net assets of the entity at the date of disposal. For life insurance company acquisitions, the adjusted net assets include an identifiable intangible asset for the present value of in-force business which represents the profits that are expected to emerge from the acquired insurance business. The present value of in-force business is calculated using best estimate actuarial assumptions for interest, mortality, persistency and expenses and is amortised over the anticipated lives of the related contracts in the portfolio. The net carrying amount of insurance liabilities acquired less the value of in-force business, represents the fair value of the insurance liabilities acquired. An intangible asset may also be recognised in respect of acquired investment management contracts representing the fair value of contractual rights acquired under these contracts.
GoodwillGoodwill arising on acquisitions of subsidiaries and businesses is capitalised and carried on the Group statement of financial position as an intangible asset at initial value less any accumulated impairment losses. Goodwill impairment testing is conducted annually and when there is an indication of impairment. For the purposes of impairment testing, goodwill is allocated to cash generating units. These cash generating units reflect the smallest group of assets that includes the goodwill and generates cash flows that are largely independent of the cash inflows from other groups of assets. If the carrying amount of the cash generating unit exceeds its recoverable amount then the goodwill is considered impaired. Impairment losses are recognised immediately in the income statement and may not be reversed in future periods.
IntangibleassetsIntangible assets acquired on the purchase of a subsidiary or portfolio of contracts are fair valued at acquisition. Other intangible assets, such as software, are valued at the price paid to acquire them. Intangible assets are carried at cost less amortisation and any accumulated impairment losses. Amortisation calculated is charged on a straight-line basis over the estimated useful life of the assets. The residual values and useful lives are reviewed at each statement of financial position date.
A: Background and accounting policies continued

185F
ina
ncia
l statem
en
tsA
: Back
grou
nd
and
acco
un
ting p
olicies
CashandcashequivalentsCash and cash equivalents consist of cash at bank and in hand, deposits held at call with banks, treasury bills and other short-term highly liquid investments with less than 90 days maturity from the date of acquisition.
RightsofoffsetAssets and liabilities in the consolidated financial statements are only reported on a net basis when there is a legally enforceable right to offset and there is an intention to settle on a net basis.
SegmentsUnder IFRS 8, ‘Operating Segments’, the Group determines and presents operating segments based on the information that is internally provided to the Group Executive Committee (GEC), which is the Group’s chief operating decision maker. An operating segment is a component of the Group that engages in business activities from which it may earn revenues and incur expenses, including revenues and expenses that relate to transactions with any of the Group’s other components. An operating segment’s operating results are reviewed regularly by the GEC to make decisions about resources to be allocated to the segment and assess its performance, and for which discrete financial information is available. The operating segments identified by the Group reflect the Group’s organisational structure, which is by both geography (Asia, US and UK) and by product line (insurance operations and asset management). Insurance operations principally comprise of products that contain both significant and insignificant elements of insurance risk. The products are managed together and there is no distinction between these two categories other than for accounting purposes. This segment also includes the commission earned on general insurance business and investment subsidiaries held to support the Group’s insurance operations. Asset management comprises both internal and third-party asset management services, inclusive of portfolio and mutual fund management, where the Group acts as an advisor, and broker-dealer activities. The nature of the products and the managing of the business differ from the risks inherent in the insurance operations segments, and the regulatory environment of the asset management industry differs from that of the insurance operations segments. The Group’s operating segments determined in accordance with IFRS 8, are as follows:
Insurance operations • Asia• US (Jackson)• UK
Asset management operations • M&G (including Prudential Capital)• Eastspring investments (the new brand name for Asian asset management)• US broker-dealer and asset management (including Curian)
The Group’s operating segments are also its reportable segments with the exception of Prudential Capital which has been incorporated into the M&G operating segment for the purposes of segment reporting. The performance measure of operating segments utilised by the Company is IFRS operating profit attributable to shareholders based on longer-term investment returns. This measure excludes the recurrent items of short-term fluctuations in investment returns and the shareholders’ share of actuarial and other gains and losses on defined benefit pension schemes. In addition for 2010 this measure excluded costs associated with the terminated AIA transaction and gain arising upon the dilution of the Group’s holding in PruHealth. Operating earnings per share is based on operating profit based on longer-term investment returns, after tax and non-controlling interests. Further details on the determination of the performance measure of operating profit based on longer-term investment returns is provided below in note A4 (d). Segment results that are reported to the Group Executive Committee include items directly attributable to a segment as well as those that can be allocated on a reasonable basis. Unallocated items are mainly in relation to the Group Head Office and the Asian Regional Head Office.
Shareholders’dividendsInterim dividends are recorded in the period in which they are paid. Final dividends are recorded in the period in which they are approved by shareholders.
SharecapitalWhere there is no obligation to transfer assets, shares are classified as equity. The difference between the proceeds received on issue of the shares, net of share issue costs, and the nominal value of the shares issued, is credited to share premium. Where the Company purchases shares for the purposes of employee incentive plans, the consideration paid, net of issue costs, is deducted from retained earnings. Upon issue or sale any consideration received is credited to retained earnings net of related costs.

186
Prudential plc Annual Report 2011
Financial statements | Notes on the Group financial statements
A4: Significant accounting policies continued
ForeignexchangeThe Group’s consolidated financial statements are presented in pounds sterling, the Group’s presentation currency. Accordingly, the results and financial position of foreign subsidiaries must be translated into the presentation currency of the Group from their functional currencies, ie the currency of the primary economic environment in which the entity operates. All assets and liabilities of foreign subsidiaries are converted at year end exchange rates whilst all income and expenses are converted at average exchange rates where this is a reasonable approximation of the rates prevailing on transaction dates. The impact of these currency translations is recorded as a separate component in the Statement of comprehensive income. Foreign currency borrowings that are used to provide a hedge against Group equity investments in overseas subsidiaries are translated at year end exchange rates and movements recognised in other comprehensive income. Other foreign currency monetary items are translated at year end exchange rates with changes recognised in the income statement. Foreign currency transactions are translated at the spot rate prevailing at the time.
d Operatingprofitbasedonlonger-terminvestmentreturnsThe Group provides supplementary analysis of profit before tax attributable to shareholders that distinguishes operating profit based on longer-term investment returns from other constituent elements of the total profit. Except in the case of the assets backing the UK annuity business, unit-linked and US variable annuity separate account liabilities, operating profit based on longer-term investment returns for shareholder-financed business is determined on the basis of expected longer-term investment returns. In the case of assets backing the UK annuity business, unit-linked and US variable annuity separate account liabilities, the basis of determining operating profit based on longer-term investment returns is as follows:
• Assets backing UK annuity business liabilities. For UK annuity business, policyholder liabilities are determined by reference to current interest rates. The value movements of the assets covering liabilities are closely correlated with the related change in liabilities. Accordingly, asset value movements are recorded within the ‘operating results based on longer-term investment returns’. Policyholder liabilities include a margin for credit risk. Variations between actual and best estimate expected impairments are recorded as a component of short-term fluctuations in investment returns; and
• Assets backing unit-linked and US variable annuity business separate account liabilities. For such business, the policyholder unit liabilities are directly reflective of the asset value movements. Accordingly, the operating results based on longer-term investment returns reflect the current period value movements in unit liabilities and the backing assets.
In the case of other shareholder-financed business, the measurement of operating profit based on longer-term investment returns reflects the particular features of long-term insurance business where assets and liabilities are held for the long-term and for which the accounting basis for insurance liabilities under current IFRS is not generally conducive to demonstrating trends in underlying performance of life businesses exclusive of the effects of short-term fluctuations in market conditions. In determining the profit on this basis, the following key elements are applied to the results of the Group’s shareholder-financed operations as reflected in the segment results shown in note B1.
i Debt and equity-type securitiesLonger-term investment returns for both debt and equity-type securities comprise longer-term actual income receivable for the period (interest/dividend income) and longer-term capital returns. In principle, for debt securities, the longer-term capital returns comprise two elements. The first element is a risk margin reserve (RMR) based charge for the expected level of defaults for the period, which is determined by reference to the credit quality of the portfolio. The difference between impairment losses in the reporting period and the RMR charge to the operating result is reflected in short-term fluctuations in investment returns. The second element is for the amortisation of interest-related realised gains and losses to operating results based on longer-term investment returns to the date when sold bonds would have otherwise matured. The shareholder-backed operation for which the distinction between impairment losses and interest-related realised gains and losses is in practice relevant to a significant extent is Jackson. Jackson has used the ratings by Nationally Recognised Statistical Ratings Organisations (NRSRO) or ratings resulting from the regulatory ratings detail issued by the National Association of Insurance Commissioners (NAIC) developed by external third parties such as PIMCO or Black Rock Solutions to determine the average annual RMR. Further details of the RMR charge, as well as the amortisation of interest related realised gains and losses, for Jackson are shown in note B1(iv) of the financial statements.
A: Background and accounting policies continued

187F
ina
ncia
l statem
en
tsA
: Back
grou
nd
and
acco
un
ting p
olicies
For debt securities backing non-linked shareholder-financed business of the UK insurance operations (other than the annuity business) and of the Asian insurance operations, the realised gains and losses are principally interest related. Accordingly, all realised gains and losses to date for these operations are being amortised over the period to the date those securities would otherwise have matured, with no explicit RMR charge. At 31 December 2011 the level of unamortised interest-related realised gains and losses related to previously sold bonds for the Group was a net gain of £462 million (31 December 2010: £373 million). For equity-type securities, the longer-term rates of return are estimates of the long-term trend investment return for income and capital having regard to past performance, current trends and future expectations. Equity-type securities held for shareholder-financed operations other than the UK annuity business, unit-linked and US variable annuity are of significance for the US and Asian insurance operations. Different rates apply to different categories of equity-type securities. As at 31 December 2011, the equity-type securities for US insurance non-separate account operations amounted to £902 million (31 December 2010: £852 million). For these operations, the longer term rates of return for income and capital applied in 2011 ranged from 5.9 per cent to 7.5 per cent for equity-type securities such as common and preferred stock and portfolio holdings in mutual funds and from 7.9 per cent to 9.5 per cent for certain other equity-type securities such as investments in limited partnerships and private equity funds (2010: 6.5 per cent to 7.9 per cent and 8.5 per cent to 9.9 per cent, respectively). For Asian insurance operations, investments in equity securities held for non-linked shareholder-financed operations amounted to £590 million as at 31 December 2011 (31 December 2010: £506 million). Of this balance, £88 million (31 December 2010: £101 million) related to the Group’s 7.37 per cent (31 December 2010: 8.66 per cent) stake in China Life Insurance Company of Taiwan. This £88 million (31 December 2010: £101 million) investment is in the nature of a trade investment for which the determination of longer-term investment returns is on the basis as described in note (e) below. For the investments representing the other equity securities which had year end balances of £502 million (31 December 2010: £405 million), the rates of return applied in the years 2011 and 2010 ranged from 1.7 per cent to 13.8 per cent with the rates applied varying by territory. The longer-term rates of return discussed above for equity-type securities are determined after consideration by the Group’s in-house economists of long-term expected real government bond returns, equity risk premium and long-term inflation. These rates are broadly stable from period to period but may be different between countries, reflecting, for example, differing expectations of inflation in each territory. The assumptions are for returns expected to apply in equilibrium conditions. The assumed rates of return do not reflect any cyclical variability in economic performance and are not set by reference to prevailing asset valuations.
ii US variable and fixed index annuity businessThe following value movements for Jackson’s variable and fixed index annuity business are excluded from operating profit based on longer-term investment returns:
• Fair value movements for equity-based derivatives;• Fair value movements for embedded derivatives for Guaranteed Minimum Withdrawal Benefit (GMWB) ‘not for life’ and fixed index
annuity business, and Guaranteed Minimum Income Benefit (GMIB) reinsurance (see note);• Movements in accounts carrying value of Guaranteed Minimum Death Benefit (GMDB) and GMWB ‘for life’ liabilities, for which,
under the ‘grandfathered’ US GAAP applied under IFRS, for Jackson insurance assets and liabilities the measurement basis gives rise to a muted impact of current period market movements;
• Fee assessments and claim payments, in respect of guarantee liabilities; and• Related changes to amortisation of deferred acquisition costs for each of the above items.
Note: US operations – Embedded derivatives for variable annuity guarantee features
The GMIB liability, which is fully reinsured, subject to a deductible and annual claim limits, is accounted for in accordance with FASB ASC Subtopic 944-80 Financial Services – Insurance – Separate Accounts (formerly SOP 03-1) under IFRS using ‘grandfathered’ US GAAP. As the corresponding reinsurance asset is net settled, it is considered to be a derivative under IAS 39 and the asset is therefore recognised at fair value. As the GMIB benefit is economically reinsured the mark to market element of the reinsurance asset is included as a component of short-term fluctuations in investment returns.
iii Other derivative value movementsGenerally, derivative value movements are excluded from operating results based on longer-term investment returns (unless those derivative value movements broadly offset changes in the accounting value of other assets and liabilities included in operating profit). The principal example of non-equity based derivatives (for example interest rate swaps and swaptions) whose value movements are excluded from operating profit arises in Jackson. Non-equity based derivatives are primarily held by Jackson as part of a broadly-based hedging programme for features of Jackson’s bond portfolio (for which value movements are booked in the statement of comprehensive income rather than the income statement), product liabilities (for which US GAAP accounting as ‘grandfathered’ under IFRS 4 does not fully reflect the economic features being hedged), and the interest rate exposure attaching to equity based embedded derivatives.

188
Prudential plc Annual Report 2011
Financial statements | Notes on the Group financial statements
A4: Significant accounting policies continued
iv Other liabilities to policyholders and embedded derivatives for product guaranteesUnder IFRS, the degree to which the carrying values of liabilities to policyholders are sensitive to current market conditions varies between territories depending upon the nature of the ‘grandfathered’ measurement basis. In general, in those instances where the liabilities are particularly sensitive to routine changes in market conditions, the accounting basis is such that the impact of market movements on the assets and liabilities is broadly equivalent in the income statement, and operating profit based on longer-term investments returns is not distorted. In these circumstances, there is no need for the movement in the liability to be bifurcated between the elements that relate to longer-term market conditions and short-term effects.However, for some types of business movements in liabilities do require bifurcation to ensure that at the net level (ie after allocated investment return and change for policyholder benefits) the operating result reflects longer-term market returns.
Examples where such bifurcation is necessary are:
a Asiai Vietnamese participating businessFor the participating business in Vietnam the liabilities include policyholders’ interest in investment appreciation and other surplus. Bonuses paid in a reporting period and accrued policyholders’ interest in investment appreciation and other surpluses primarily reflect the level of realised investment gains above contract specific hurdle levels. For this business, operating profit based on longer-term investment returns includes the aggregate of longer-term returns on the relevant investments, a credit or charge equal to movements on the liability for the policyholders’ interest in realised investment gains (net of any recovery of prior deficits on the participating pool), less amortisation over five years of current and prior movements on such credits or charges. The overall purpose of these adjustments is to ensure that investment returns included in operating results equal longer-term returns but that in any one reporting period movements on liabilities to policyholders caused by investment returns are substantially matched in the presentation of the supplementary analysis of profit before tax attributable to policyholders.
ii Guaranteed Minimum Death Benefit (GMDB) product featuresFor unhedged GMDB liabilities accounted for under IFRS using ‘grandfathered’ US GAAP, such as in the Japanese business, the change in carrying value is determined under FASB ASC subtopic 944-80, Financial Services – Insurance – Separate Accounts (formerly SOP 03-1), which partially reflects changes in market conditions. Under the company’s segmental basis of reporting the operating profit reflects the change in liability based on longer-term market conditions with the difference between the charge to the operating result and the movement reflected in the total result included in short-term fluctuations in investment returns.
b UK shareholder-backed annuity businessWith one exception, the operating result based on longer-term investment returns reflects the impact of all value movements on policyholder liabilities for annuity business in PRIL and the PAC non-profit sub-fund. The exception is for the impact on credit risk provisioning of actual downgrades during the period. As this feature arises due to short-term market conditions, the effect of downgrades, if any, in a particular period, on the overall provisions for credit risk is included in the category of short-term fluctuations in investment returns. The effects of other changes to credit risk provisioning are included in the operating result, as is the net effect of changes to the valuation rate of interest due to portfolio rebalancing to align more closely with the Group’s internal benchmark.
v Fund management and other non-insurance businessesFor these businesses it is inappropriate to include returns in the operating result on the basis described above. Instead, it is appropriate to generally include realised gains and losses (including impairments) in the operating result with unrealised gains and losses being included in short-term fluctuations. For this purpose impairments are calculated as the credit loss determined by comparing the projected cash flows discounted at the original effective interest rate to the carrying value. In some instances it may also be appropriate to amortise realised gains and losses on derivatives and other financial instruments to operating results over a time period that reflects the underlying economic substance of the arrangements.
A: Background and accounting policies continued

189F
ina
ncia
l statem
en
tsA
: Back
grou
nd
and
acco
un
ting p
olicies
A5: New accounting pronouncements
The following standards, interpretations and amendments have either been adopted for the first time in 2011 or have been issued but are not yet effective in 2011, including those which have not yet been adopted in the EU. This is not intended to be a complete list as only those standards, interpretations and amendments that could have an impact upon the Group’s financial statements have been discussed. The accounting policies applied by the Group in determining the IFRS basis results in this report are the same as those previously applied in the Group’s consolidated financial statements for the year ended 31 December 2010, except for the adoption of the new accounting pronouncements in 2011 as described below.
a Accountingpronouncementsadoptedin2011ImprovementstoIFRSs(2010)The 2010 annual improvements include minor changes to seven IFRSs. Amongst others, these include changes to the measurement of non-controlling interests under IFRS 3, ‘Business combinations’ and clarification on the required level of disclosure around credit risk and collateral held in IFRS 7, ‘Financial instruments: Disclosure’. The Group has reviewed and adopted these changes in 2011 with no significant impact on the Group’s results and financial position.
AmendmentstoIAS24,‘Relatedpartydisclosures’The main revisions relate to exemption for government-related entities and are therefore not applicable to the Group. The amendment also clarifies and simplifies the definition of a related party albeit the nature of the change is minor. The adoption of these revisions did not have a significant impact on the Group’s related party disclosures.
AmendmenttoIFRIC14,‘Prepaymentofaminimumfundingrequirement’This amendment removes an unintended consequence of IFRIC 14 relating to voluntary pension pre-payments when there is a minimum funding requirement. IFRIC 14 was amended to require an asset to be recognised for any surplus arising from voluntary pre-payment of minimum funding contributions in respect of future service. The adoption of this amendment did not have an impact on the Group’s financial statements.
IFRIC19,‘Extinguishingfinancialliabilitieswithequityinstruments’In November 2009, the IFRIC issued guidance on how to account for the extinguishment of a financial liability by the issue of equity instruments. The adoption of this interpretation did not have a material effect on the Group’s financial statements.
b AdoptionofalteredUSGAAPrequirementsforGroupIFRSreportingin2012In October 2010, the Emerging Issues Task Force of the US Financial Accounting Standards Board issued Update No 2010-26 on ‘Accounting for Costs Associated with Acquiring or Renewing Insurance Contracts’. The update was issued to address perceived diversity by companies preparing financial statements in accordance with US GAAP as regards the types of acquisition costs being deferred. Under US GAAP, costs that can be deferred and amortised are those that ‘vary with and are primarily related to the acquisition of insurance contracts’. The Update requires insurers to capitalise only those incremental costs directly related to acquiring a contract for financial statements for reporting periods starting after 15 December 2011. All other indirect acquisition expenses are required to be charged to the income statement as incurred expenses. Accordingly, the main impact of the Update is to disallow insurers from deferring costs that are not directly related to successful sales. Under the Group’s IFRS reporting, Prudential has the option to either continue with its current basis of measurement or improve its accounting policy under IFRS 4 to acknowledge the issuance of the Update. Prudential has chosen to continue with its current basis of measurement for reporting of its 2011 results and improve its policy in 2012 to apply the US GAAP update on the retrospective basis to the results of its US insurance operation Jackson National Life. The reason and timing for the change is to achieve consistency with the basis expected to be applied by peer competitor companies in the US market in their US GAAP financial statements. To ensure consistency it is also intended to make the change on the retrospective basis in 2012 for the Asian operations that historically have effectively applied US GAAP for measuring insurance assets and liabilities.

190
Prudential plc Annual Report 2011
Financial statements | Notes on the Group financial statements
A5: New accounting pronouncements continued
The effect of the change is as follows:
Year ended 31 December 2011 £m Year ended 31 December 2010 £m
Asreportedundercurrent
policyEffectofchange
Undernewpolicyfrom1Jan2012
Asreportedundercurrent
policyEffectofchange
Undernewpolicyfrom1Jan2012
Profit after tax and non controlling interests 1,490 (75) 1,415 1,431 (125) 1,306 Shareholders’ equity 9,117 (553) 8,564 8,031 (510) 7,521
For further information, please refer to note D3(g) and the additional unaudited financial information note III(a).
c AccountingpronouncementsendorsedbytheEUbutnotyeteffectiveThe following accounting pronouncements potentially relevant to the Group have been issued and endorsed for use in the EU but are not mandatory for adoption for the 31 December 2011 year end.
AmendmentstoIFRS7,‘Financialinstruments:Disclosures–Transfersoffinancialassets’The amendments, which were issued in October 2010 and are effective for annual periods beginning on or after 1 January 2012, introduce new disclosure requirements about transfers of financial assets. These include disclosures for financial assets that are not derecognised in their entirety and financial assets that are derecognised in their entity but for which the entity retains continuing involvement. The Group is evaluating the implications of the amendments but they are not expected to have a significant impact on the Group’s disclosures.
AmendmentstoIAS12,‘Incometaxes’On 20 December 2010, the IASB published amendments to IAS 12. The amendments are effective for annual periods beginning on or after 1 January 2012. The amendments require the measurement of deferred tax assets and liabilities arising from investment properties and plant, property and equipment valued at fair value on the presumption that the carrying amount of the asset will be, normally, recovered through sale. These amendments are not expected to have a material effect on the Group’s financial statements.
d AccountingpronouncementsnotyetendorsedbytheEUThe following accounting pronouncements potentially relevant to the Group have been issued but not yet endorsed for use in the EU.
IFRS9,‘Financialinstruments:Classificationandmeasurement’In November 2009, the IASB issued a new standard which altered the classification and measurement of financial assets. Under the new standard only two possible classifications arise, rather than the four existing classifications currently available under IAS 39, and will result in all financial assets being valued at amortised cost or fair value through profit and loss. In October 2010, the IASB issued requirements on the accounting for financial liabilities. These requirements maintain the existing amortised cost measurement for most liabilities but will require changes in fair value due to changes in the entity’s own credit risk to be recognised in the other comprehensive income (OCI) section of the comprehensive income statement, rather than within profit or loss for liabilities measured at fair value. In December 2011, the IASB issued Mandatory Effective Date and Transition Disclosures (Amendments to IFRS 9 and IFRS 7), which amended the effective date of IFRS 9 to annual periods beginning on or after 1 January 2015 (from the previous 1 January 2013), and modified the relief from restating comparative periods and the associated disclosures in IFRS 7. The Group is still assessing the full impact of this standard.
A: Background and accounting policies continued

191F
ina
ncia
l statem
en
tsA
: Back
grou
nd
and
acco
un
ting p
olicies
Standardsonconsolidation,jointarrangementsanddisclosures:IFRS10,‘Consolidatedfinancialstatements’,IFRS11,‘Jointarrangements’,IFRS12,‘Disclosureofinterestsinotherentities’,IAS27,‘Consolidatedandseparatefinancialstatements’,andIAS28,‘Investmentsinassociatesandjointventures’In May 2011, the IASB issued a package of five new standards as listed above to address the scope of the consolidation reporting standards. IFRS 10 replaces all of the guidance on control and consolidation in IAS 27 and SIC 12, ‘Consolidation – Special purpose entities’. IAS 27 was amended to deal only with requirements on separate financial statements, which have been carried forward largely unchanged. IFRS 10 provides a single consolidation model. The key changes include revised definition of control so that the same criteria which focus on the need to have both power and variable returns are applied to all entities. The remaining standards of IFRS 11, IFRS 12 and consequential amendments to IAS 28 include replacement of the previous guidance on interests in joint ventures and on the disclosure requirements. IFRS 11 includes a new definition of joint ventures and unlike the previous guidance, proportionate consolidation is no longer permitted for joint ventures. IFRS 12 sets out the disclosure requirements for subsidiaries, joint ventures, associates and unconsolidated structured entities. These standards are effective for annual periods beginning on or after 1 January 2013. Early application is permitted; though entities must adopt all five standards in the package. IFRS 10 excludes guidance specifically for investment entities, as the IASB continues to work on this with an exposure draft issued on 25 August 2011. The Group’s investments in joint ventures are currently recognised using proportional consolidation. With the application of IFRS 11, the Group’s investments in joint ventures will be accounted for on a single line equity method. This is a presentational change and is not expected to have an impact on the Group’s results and financial position. The Group is still assessing the full impact of this standard in particular on the Group’s consolidated investment funds (including OEICs and unit trusts).
IFRS13,‘Fairvaluemeasurements’IFRS 13 creates a uniform framework to explain how to measure fair value and aims to enhance fair value disclosures, but it does not change when to measure fair value or require additional fair value measurements. The standard requires additional disclosure on the fair value of non-financial assets and liabilities and enhanced disclosure for recurring Level 3 fair value measurements. IFRS 13 is effective for prospective application on 1 January 2013. The Group is still assessing the full impact of this standard, but these amendments are not expected to have a material effect on the Group’s financial statements.
AmendmentstoIAS19,‘Employeebenefits’In June 2011, the IASB published an amended version of IAS 19 on the accounting for pensions and other post-employment and is effective for annual periods beginning on or after 1 January 2013. The key revisions to the standard include:
• the removal of the corridor option for actuarial gains and losses, • presentation of all actuarial gains and losses in other comprehensive income rather than in profit and loss,• the replacement of the expected return on plan assets with an amount based on the liability discount rate in the determination
of pension costs, and• enhanced disclosures, specifically on risks arising from defined benefit plans.
The Group does not apply the corridor option, therefore the removal of the corridor option has no impact to the Group. However, the Group currently presents actuarial gains and losses in the income statement, with the shareholder’s share presented below operating profit in the supplementary analysis of profit in the segmental income statement. With the revised standard, the actuarial gains and losses will be presented in the statement of comprehensive income. The Group is still assessing the full impact of the other amendments to the standard.
AmendmentstoIAS1,‘Presentationoffinancialstatements’This amendment changes the requirement for the disclosure of items presented in other comprehensive income, requiring items to be presented separately based on whether or not they may be recycled to profit or loss in the future. The amendment is effective from 1 January 2013. The Group is still assessing the full impact of these amendments but is expecting the amendments to be presentational with no significant impact on the Group’s results and financial position.
OffsettingFinancialAssetsandFinancialLiabilities(AmendmentstoIAS32,‘Financialinstruments:Presentation’andIFRS7‘Financialinstruments:Disclosures’)In December 2011, the IASB published amendments to the application guidance of IAS 32 clarifying the criteria for offsetting financial assets and financial liabilities in the statement of financial position. In addition, the IASB has also published amendments to IFRS 7 to enhance current offsetting disclosures. The amendments to IAS 32 and IFRS 7 are effective for the annual periods beginning on or after 1 January 2013 and 2013, respectively. The Group is currently assessing the impact of these amendments.

192
Prudential plc Annual Report 2011
Financial statements | Notes on the Group financial statements
B: Summary of results
B1: Segment disclosure – income statement
The determination of the operating segments and performance measure of the operating segments of the Group are as detailed in note A4. Further segmentation of the income statement is provided in note F1 of these financial statements.
2011 £m 2010 £m
Asian operations Insurance operations notes (i),(ii) 709 536 Development expenses (5) (4)
Total Asian insurance operations after development expenses 704 532 Eastspring Investments 80 72
Total Asian operations 784 604
US operations Jackson (US insurance operations) notes (i),(ii),(iii) 694 833 Broker-dealer and asset management 24 22
Total US operations 718 855
UK operations UK insurance operations: notes (i),(ii) Long-term business 683 673 General insurance commission note (v) 40 46
Total UK insurance operations 723 719 M&G 357 284
Total UK operations 1,080 1,003
Total segment profit 2,582 2,462
Other income and expenditure Investment return and other income 22 30 Interest payable on core structural borrowings (286) (257)Corporate expenditureF3 (219) (223)
Total (483) (450)
RPI to CPI inflation measure change on defined benefit pension schemes note (vi) 42 – Solvency II implementation costs (55) (45)Restructuring costs note (vii) (16) (26)
Operating profit based on longer-term investment returns 2,070 1,941 Short-term fluctuations in investment returns on shareholder-backed business note (viii) (148) (123)Shareholders’ share of actuarial and other gains and losses on defined benefit pension schemes note (ix) 21 (10)Costs of terminated AIA transaction note (x) – (377)Gain on dilution of Group holdings I2 – 30
Profit before tax attributable to shareholders 1,943 1,461
Notes (i) Operating profit based on longer-term investment returns. The Group provides supplementary analysis of IFRS profit before tax attributable to shareholders so as to distinguish operating profit based on
longer-term investment returns from other elements of total profit. Operating profit based on longer-term investment returns is the basis on which management regularly reviews the performance of Prudential’s segments as defined by IFRS 8. Further discussion on the determination of operating profit based on longer-term investment returns is provided in note A4(d).

193F
ina
ncia
l statem
en
ts B: Su
mmary
of resu
lts
(ii) Effect of changes to assumptions, estimates and bases of determining life assurance liabilities. The results of the Group’s long-term business operations are affected by changes to assumptions, estimates and bases of preparation. These are described in notes D2(i), D3(i) and D4(i). (iii) Jackson operating results based on longer-term investment returns. IFRS basis operating profits for US operations include the following amounts (net of related change in amortisation of deferred acquisition costs,
where applicable) so as to derive longer-term investment returns.
2011 £m 2010 £m
Debt securities: Amortisation of interest related realised gains and losses 64 63 Risk margin reserve charge for longer-term credit related losses (see (iv) below) (53) (55)Equity type investments: Longer-term returns 51 51
(iv) The risk margin reserve (RMR) charge for longer-term credit related losses included in operating profit based on longer-term investment returns of Jackson for 2011 is based on an average annual RMR of 25 basis points (2010: 26 basis points) on average book values of US$44.4 billion (2010: $44.2 billion) as shown below:
2011 2010
Moody’s rating category (or equivalent under NAIC ratings of MBS)
Average book value
US $mRMR
%
Annual expected losses
Average book value
US $mRMR
%
Annual expected losses
US $m £m US $m £m
A3 or higher 21,255 0.08 (17) (11) 20,622 0.06 (12) (8)Baa1, 2 or 3 20,688 0.26 (54) (34) 20,785 0.26 (53) (34)Ba1, 2 or 3 1,788 1.04 (19) (11) 1,935 1.04 (20) (13)B1, 2 or 3 474 3.01 (14) (9) 500 2.99 (15) (10)Below B3 211 3.88 (8) (5) 321 3.88 (13) (8)
Total 44,416 0.25 (112) (70) 44,163 0.26 (113) (73)
Related change to amortisation of deferred acquisition costs (see below)
27 17 28 18
Risk margin reserve charge to operating profit for longer-term credit related losses (85) (53) (85) (55)
Consistent with the basis of measurement of insurance assets and liabilities for Jackson’s IFRS results, the charges and credits to operating profits based on longer-term investment returns are partially offset by related changes to amortisation of deferred acquisition costs.
(v) UK operations transferred its general insurance business to Churchill in 2002, with general insurance commission representing the commission received net of expenses for Prudential-branded general insurance products as part of this arrangement.
(vi) During 2011 the Group altered its inflation measure basis for future statutory increases to pension payments for certain tranches of its UK defined benefit pension schemes. This reflects the UK Government’s decision to replace the basis of indexation from Retail Prices Index (RPI)with Consumer Prices Index (CPI). This resulted in a credit to the operating profit before tax of £42 million.
(vii) Restructuring costs are incurred in the UK as part of EEV covered business and represent one-off expenses incurred in securing expense savings. 2011: £16 million (2010: £26 million).
(viii) Short-term fluctuations in investment returns on shareholder-backed business.
2011 £m 2010 £m
Insurance operations: Asia (92) 114 US (95) (378) UK 159 116 Other operations Other (120) 25
Total (148) (123)
General overview of defaults The Group did not experience any defaults of its shareholder-backed debt securities portfolio in 2011 and 2010. Asian insurance operations The short-term fluctuations for Asian insurance operations of negative £92 million (2010: positive £114 million) in part reflects equity market
falls in Taiwan and a partial reversal of unrealised gains recognised in prior years on the Group’s 7.37 per cent (2010: 8.66 per cent) stake in China Life Insurance Company of Taiwan.

194
Prudential plc Annual Report 2011
Financial statements | Notes on the Group financial statements
B: Summary of results continued
B1: Segment disclosure – income statement continued
US insurance operations The short-term fluctuations in investment returns for US insurance operations comprise the following items:
2011 £m 2010 £m
Short-term fluctuations relating to debt securities: Charges in the year Defaults – – Losses on sales of impaired and deteriorating bonds (32) (99) Bond write downs (62) (124) Recoveries/reversals 42 10
Total charges in the year note (a) (52) (213)Less: Risk margin charge included in operating profit based on longer-term investment returns note (iii) 70 73
18 (140)
Interest related realised gains: Arising in the year 158 224 Less: Amortisation of gains and losses arising in current and prior years to operating profit based on longer-term investment returns (84) (82)
74 142
Related change to amortisation of deferred acquisition costs (4) (3)
Total short-term fluctuations related to debt securities 88 (1)Derivatives (other than equity related): market value movement
(net of related change to amortisation of deferred acquisition costs) note (b) 472 (15)Net equity hedge results (principally guarantees and derivatives, net of related change
to amortisation of deferred acquisition costs) note (c) (632) (365)Equity type investments: actual less longer-term return
(net of related change to amortisation of deferred acquisition costs) A4(d)(i) – 3 Other items (net of related change to amortisation of deferred acquisition costs) (23) –
Total (95) (378)
The short-term fluctuations shown in the table above are stated net of the related change to amortisation of deferred acquisition costs of £359 million (2010: £358 million) (see note H1).
Notes (a) The charges on the debt securities of Jackson comprise the following:
Defaults
£m
Bond write downs
£m
Losses on sale of
impaired and
deteriorating bonds
£m
Recoveries/ reversals
£m
2010Total
£m
2011Total
£m
Residential mortgage-backed securities: Prime (including agency) – (19) (6) – (25) (56) Alt-A – (2) (5) 6 (1) (54) Sub-prime – – (1) 1 – (13)
Total residential mortgage-backed securities – (21) (12) 7 (26) (123)Corporate debt securities – – (18) 4 (14) (37)Other – (41) (2) 31 (12) (53)
Total – (62) (32) 42 (52) (213)
(b) The gain of £472 million (2010: loss of £15 million) is principally for the value movement of non-equity freestanding derivatives held to manage interest rate exposures, duration matching and for the GMIB reinsurance asset that is considered to be a derivative under IAS 39.
Under IAS 39, unless hedge accounting is applied value movements on derivatives are recognised in the income statement. For the derivatives programme attaching to the fixed annuity and other general account business, the Group has continued its approach of not seeking to apply hedge accounting under IAS 39. This decision reflects the inherent constraints of IAS 39 for hedge accounting investments and life assurance assets and liabilities under ‘grandfathered’ US GAAP under IFRS 4.

195F
ina
ncia
l statem
en
ts B: Su
mmary
of resu
lts
(c) The amount of £632 million in 2011 (2010: £365 million) relates to the net equity hedge accounting effect of the equity-based derivatives and associated guarantee liabilities of Jackson’s variable and fixed index annuity business. The details of the value movements excluded from operating profit based on longer-term investment returns are as described in note A4(d)(iii). The principal movements are for (i) value for free-standing and GMWB ‘not for life’ embedded derivatives, (ii) accounting values for GMDB and GMWB ‘for life’ guarantees and (iii) related changes to DAC amortisation. These movements include the effect of lower interest rates which were particularly significant in 2011. The value movements on derivatives held to manage this and other interest rate exposure are included in the £472 million (2010: loss of £15 million) described above in note (b).
In addition to the items discussed above, for US insurance operations, included within the statement of comprehensive income is an increase in net unrealised gains on debt securities classified as available-for-sale of £811 million (2010: increase in net unrealised gains of £1,221 million). Temporary market value movements do not reflect defaults or impairments. Additional details on the movement in the value of the Jackson portfolio are included in note D3.
UK Insurance operations The short-term fluctuations gain for UK insurance operations of £159 million (2010: £116 million) principally reflect net investment gains arising
in the period on fixed income assets backing the capital of the shareholder-backed annuity business.
Other operations Short-term fluctuations of other operations were negative £120 million (2010: positive £25 million) representing unrealised value movements
on investments, including centrally held swaps to manage foreign exchange and certain macro-economic exposures of the Group.
(ix) Shareholders’ share of actuarial and other gains and losses on defined benefit pension schemes
2011 £m 2010 £m
Actuarial gains and losses Actual less expected return on scheme assets 9 31Experience gains (losses) on scheme liabilities 19 (5)Gains (losses) on changes of assumptions for scheme liabilities 12 (41)
40 (15)Less: amount attributable to the PAC with-profits sub-fund (18) 5
22 (10)
Other gains and losses Movement in the provision for deficit funding of PSPS (4) – Less: amount attributable to the PAC with-profits sub-fund 3 –
(1) –
Total 21 (10)
The actuarial gains and losses shown in the table above relate to the Scottish Amicable and M&G. The amounts did not include actuarial gains and losses for the Prudential Staff Pension Scheme (PSPS) for which the Group has not recognised its interest in the scheme’s underlying surplus.
The losses of £12 million (2010: losses of £41 million) primarily reflect the effect of changes in the inflation rate, expected salary increases and risk discount rate. Further details on the Group’s defined benefit pension schemes are shown in note I3.
(x) The following costs were incurred in the first six months of 2010 in relation to the proposed, and subsequently terminated transaction, to purchase AIA Group Limited and related rights issue.
2010 £m
AIG termination break fee 153 Underwriting fees 58 Costs associated with foreign exchange hedging 100 Adviser fees and other 66
Total costs before tax 377 Associated tax relief (93)
Total costs after tax 284
Of the £377 million total costs before tax, the £100 million associated with foreign exchange hedging has been recorded within ‘Investment return’ and the other £277 million has been recorded as ‘Other expenditure’ within ‘Acquisition costs and other expenditure’ in the consolidated income statement.

196
Prudential plc Annual Report 2011
Financial statements | Notes on the Group financial statements
B: Summary of results continued
B2: Earnings per share
Basic earnings per share is calculated by dividing the earnings attributable to ordinary shareholders by the weighted average number of ordinary shares outstanding during the year, excluding those held in employee share trusts and consolidated unit-trusts and OEICs, which are treated as cancelled. For diluted earnings per share, the weighted average number of shares in issue is adjusted to assume conversion of all dilutive potential ordinary shares. The Group’s only class of potentially dilutive ordinary shares are those share options granted to employees where the exercise price is less than the average market price of the Company’s ordinary shares during the year. No adjustment is made if the impact is anti-dilutive overall. Earnings per share are calculated based on earnings attributable to ordinary shareholders, after related tax and non-controlling interests.
2011
Before tax B1
£m
Tax F5
£m
Non-controlling
interests
£m
Net of tax and non-
controllinginterests
£m
Basic earnings per share
Pence
Diluted earnings per share
Pence
Based on operating profit based on longer-term investment return 2,070 (448) (4) 1,618 63.9p 63.8p
Short-term fluctuations in investment returns on shareholder-backed business (148) 4 – (144) (5.7)p (5.7)p
Shareholders’ share of actuarial and other gains and losses on defined benefit pension schemes 21 (5) – 16 0.6p 0.6p
Based on profit for the year 1,943 (449) (4) 1,490 58.8p 58.7p
2010
Before tax B1
£m
Tax F5
£m
Non-controlling
interests
£m
Net of tax and non-
controllinginterests
£m
Basic earnings per share
Pence
Diluted earnings per share
Pence
Based on operating profit based on longer-term investment returns, excluding exceptional tax credit 1,941 (371) (5) 1,565 62.0p 61.9p
Exceptional tax credit* – 158 – 158 6.3p 6.3p
Based on operating profit based on longer-term investment return 1,941 (213) (5) 1,723 68.3p 68.2p
Short-term fluctuations in investment returns on shareholder-backed business (123) 92 – (31) (1.2)p (1.2)p
Shareholders’ share of actuarial and other gains and losses on defined benefit pension schemes (10) 3 – (7) (0.3)p (0.3)p
Costs of terminated AIA transaction (377) 93 – (284) (11.3)p (11.3)pGain on dilution of Group's holdings 30 – – 30 1.2 p 1.2p
Based on profit for the year including exceptional tax credit 1,461 (25) (5) 1,431 56.7p 56.6p
* The tax charge attributable to shareholders’ return included an exceptional tax credit of £158 million which primarily related to the impact of a settlement agreed with the UK tax authorities.

197F
ina
ncia
l statem
en
ts B: Su
mmary
of resu
lts
Number of sharesA reconciliation of the weighted average number of ordinary shares used for calculating basic and diluted earnings per share is set out as below:
2011 £m 2010 £m
Weighted average shares for calculation of basic earnings per share 2,533 2,524 Shares under option at end of year 13 13 Number of shares that would have been issued at fair value on assumed option exercise (8) (8)
Weighted average shares for calculation of diluted earnings per share 2,538 2,529
B3: Dividends
2011 £m 2010 £m
Dividends declared and paid in reporting periodParent company: Interim dividend (2011: 7.95p; 2010: 6.61p) 203 168 Final/second interim dividend for prior period (2011: 17.24p; 2010: 13.56p) 439 343
Total 642 511
Dividends paid in cash, as set in the consolidated statement of cash flows for 2011 were £642 million. As a result of shares issued in lieu of dividends of £62 million in 2010 dividends paid in cash, were £449 million in 2010.The scrip dividend alternative was replaced by the Dividend Re-investment Plan from the 2010 final dividend.
2011 £m 2010 £m
Parent company dividends relating to reporting period: Interim dividend (2011: 7.95p; 2010: 6.61p) 203 168 Final dividend (2011: 17.24p; 2010: 17.24p) 439 439
Total 642 607
Dividend per share Interim dividends are recorded in the period in which they are paid. Final dividends are recorded in the period in which they are approved by shareholders. The final dividend for the year ended 31 December 2010 of 17.24 pence per ordinary share was paid to eligible shareholders on 26 May 2011 and the 2011 interim dividend of 7.95 pence per ordinary share was paid to eligible shareholders on 22 September 2011. The 2011 final dividend of 17.24 pence per ordinary share will be paid on 24 May 2012 in sterling to shareholders on the principal register and the Irish branch register at 6.00 pm BST on Friday, 30 March 2012 (the ‘Record Date’), and in Hong Kong dollars to shareholders on the Hong Kong branch register at 4.30 pm Hong Kong time on the Record Date (HK Shareholders). Holders of US American Depositary Receipts (US Shareholders) will be paid their dividends in US dollars on or about five days after the payment date of the dividend to shareholders on the principal register. The final dividend will be paid on or about 31 May 2012 in Singapore dollars to shareholders with shares standing to the credit of their securities accounts with The Central Depository (Pte.) Limited (CDP) at 5.00 pm Singapore time on the Record Date (SG Shareholders). The dividend payable to the HK Shareholders will be translated using the exchange rate quoted by the WM Company at the close of business on 12 March 2012. The exchange rate at which the dividend payable to the SG Shareholders will be translated into SG$ will be determined by CDP. The dividend will distribute an estimated £439 million of shareholders’ funds. In line with 2010, shareholders on the principal register and Irish branch register will be able to participate in a Dividend Reinvestment Plan.

198
Prudential plc Annual Report 2011
Financial statements | Notes on the Group financial statements
B4: Exchange translation
Exchange movement recognised in other comprehensive income
2011 £m 2010 £m
Asian operations (30) 164 US operations 42 88 Unallocated to a segment (central funds) (44) (35)
(32) 217
The movements for Asian and US operations reflect the application of year end exchange rates to the assets and liabilities and average exchange rates to the income statement on translation of these operations into the presentation currency of the Group. The movement unallocated to a segment mainly reflects the translation of currency borrowings and forward contracts which have been designated as a net investment hedge against the currency risk of the net investment in Jackson. The exchange rates applied were:
Local currency: £
Closingrate at
31 Dec 2011Averagefor 2011
Closingrate at
31 Dec 2010Averagefor 2010
Hong Kong 12.07 12.48 12.17 12.01 Indonesia 14,091.80 14,049.41 14,106.51 14,033.41 Malaysia 4.93 4.90 4.83 4.97 Singapore 2.02 2.02 2.01 2.11 India 82.53 74.80 70.01 70.66 Vietnam 33,688.16 33,139.22 30,526.26 29,587.63 US 1.55 1.60 1.57 1.55
B5: Group statement of financial position
To explain more comprehensively the assets, liabilities and capital of the Group’s businesses, it is appropriate to provide analyses of the Group’s statement of financial position by operating segment and type of business. The tables below aggregate the three asset management segments for ease of presentation and hence should be read in conjunction with the associated tables on asset management in note E2.
B: Summary of results continued

199F
ina
ncia
l statem
en
ts B: Su
mmary
of resu
lts
a Group statement of financial position by operating segmenti Position at 31 December 2011
2011 £m
By operating segment
Insurance operations Total insurance
opera-tions
Assetmanage-
mentopera-tions
E2
Unallo-cated to a
segment (centralopera-tions)
Intra-group
elimina-tions
31 Dec2011
Group Total
UK D2
US D3
Asia D4
Assets Intangible assets attributable to shareholders: Goodwill – – 235 235 1,230 – – 1,465 Deferred acquisition costs and other
intangible assets 113 3,900 1,027 5,040 16 13 – 5,069
TotalH1 113 3,900 1,262 5,275 1,246 13 – 6,534
Intangible assets attributable to with-profits funds: In respect of acquired subsidiaries for venture fund and other investment purposes 178 – – 178 – – – 178 Deferred acquisition costs and other
intangible assets 6 – 83 89 – – – 89
TotalH2 184 – 83 267 – – – 267
Total intangible assets 297 3,900 1,345 5,542 1,246 13 – 6,801
Deferred tax assets H4 231 1,392 115 1,738 129 409 – 2,276 Other non-investment and non-cash assets H3,H6 4,771 1,542 1,024 7,337 1,000 4,532 (6,231) 6,638 Investment of long-term business and other
operations: Investment propertiesH7 10,712 35 10 10,757 – – – 10,757 Investments accounted for using the equity methodH8 70 – – 70 – – – 70 Financial investments: Loans note (d)(iv) 3,115 4,110 1,233 8,458 1,256 – – 9,714 Equity securities and portfolio holdings
in unit trusts 36,722 38,036 11,997 86,755 594 – – 87,349 Debt securities note (d)(i) 77,953 27,022 17,681 122,656 1,842 – – 124,498 Other investments 4,568 2,376 470 7,414 78 17 – 7,509 Deposits 9,287 167 1,165 10,619 89 – – 10,708
Total investmentsG1, note (c) 142,427 71,746 32,556 246,729 3,859 17 – 250,605
Properties held for sale H9 – 3 – 3 – – – 3 Cash and cash equivalents H10 2,965 271 1,977 5,213 1,735 309 – 7,257
Total assets 150,691 78,854 37,017 266,562 7,969 5,280 (6,231) 273,580
Note(i) Further segmental analysis: The non-current assets of the Group comprise goodwill, intangible assets other than DAC and present value of acquired in-force business and
property, plant and equipment included within ‘other non-investment and non-cash assets’. Items defined as financial instruments or related to insurance contracts are excluded. The Group’s total non-current assets at 31 December comprise:
2011 £m 2010 £m
UK including insurance operations, M&G and Central operations 1,906 1,708 US 144 131 Asia* 681 615
Total 2,731 2,454
* No individual country in Asia held non-current assets at the end of the year which exceeds 10 per cent of the Group total.

200
Prudential plc Annual Report 2011
Financial statements | Notes on the Group financial statements
B: Summary of results continued
B5: Group statement of financial position continued
2011 £m
By operating segment
Insurance operations Total insurance
opera-tions
Assetmanage-
mentopera-tions
E2
Unallo-cated to a
segment (centralopera-tions)
Intra-group
elimina-tions
31 Dec2011
Group Total
UK D2
US D3
Asia D4
Equity and liabilities Equity Shareholders’ equity H11 2,581 4,271 2,349 9,201 1,783 (1,867) – 9,117 Non-controlling interests 33 – 5 38 5 – – 43
Total equity 2,614 4,271 2,354 9,239 1,788 (1,867) – 9,160
Liabilities Policyholder liabilities and unallocated surplus of
with-profits funds: Insurance contract liabilitiesH12 82,732 67,278 30,353 180,363 – – – 180,363 Investment contract liabilities with discretionary participation featuresG1 29,348 – 397 29,745 – – – 29,745 Investment contract liabilities without discretionary participation
featuresG1 14,944 1,911 112 16,967 – – – 16,967 Unallocated surplus of with-profits funds (reflecting application of ‘realistic’
basis provisions for UK regulated with-profits funds)D2, H12 9,165 – 50 9,215 – – – 9,215
Total policyholder liabilities and unallocated surplus of with-profits funds 136,189 69,189 30,912 236,290 – – – 236,290
Core structural borrowings of shareholder-financed operations:H13
Subordinated debt – – – – – 2,652 – 2,652 Other – 160 – 160 250 549 – 959
Total – 160 – 160 250 3,201 – 3,611
Operational borrowings attributable to shareholder-financed operationsG1,H13 103 127 141 371 13 2,956 – 3,340
Borrowings attributable to with-profits operations 972 – – 972 – – – 972 Other non-insurance liabilities:G1,H13 Obligations under funding, securities lending and sale and repurchase agreementsG1 1,945 1,169 – 3,114 – – – 3,114 Net asset value attributable to unit holders of consolidated unit trusts and similar fundsG1 2,043 18 1,101 3,162 678 – – 3,840 Deferred tax liabilitiesH4 1,349 2,093 513 3,955 5 251 – 4,211 Current tax liabilitiesH4 553 – 116 669 106 155 – 930 Accruals and deferred income 321 – 103 424 290 22 – 736 Other creditorsG1 2,829 548 660 4,037 4,493 245 (6,231) 2,544 ProvisionsH14 266 13 47 326 133 70 – 529 Derivative liabilitiesG1,G3 1,298 887 480 2,665 182 207 – 3,054 Other liabilitiesG1,H15 209 379 590 1,178 31 40 – 1,249
Total 10,813 5,107 3,610 19,530 5,918 990 (6,231) 20,207
Total liabilities 148,077 74,583 34,663 257,323 6,181 7,147 (6,231) 264,420
Total equity and liabilities 150,691 78,854 37,017 266,562 7,969 5,280 (6,231) 273,580

201F
ina
ncia
l statem
en
ts B: Su
mmary
of resu
lts
ii Position at 31 December 2010
2010 £m
By operating segment
Insurance operationsTotal
insurance opera-tions
Assetmanage-
mentopera-tions
E2
Unallo-cated to a
segment (centralopera-tions)
Intra-group
elimina-tions
31 Dec2010
Group Total
UK D2
US D3
Asia D4
Assets Intangible assets attributable to shareholders: Goodwill – – 236 236 1,230 – – 1,466 Deferred acquisition costs and other
intangible assets 120 3,559 962 4,641 13 13 – 4,667
TotalH1 120 3,559 1,198 4,877 1,243 13 – 6,133
Intangible assets attributable to with-profits funds: In respect of acquired subsidiaries for venture fund and other investment purposes 166 – – 166 – – – 166 Deferred acquisition costs and other intangible
assets 13 – 97 110 – – – 110
TotalH2 179 – 97 276 – – – 276
Total intangible assets 299 3,559 1,295 5,153 1,243 13 – 6,409
Deferred tax assetsH4 214 1,391 98 1,703 123 362 – 2,188 Other non-investment and non-cash assets H3,H6 4,631 1,225 788 6,644 995 4,146 (5,761) 6,024 Investment of long-term business and other
operations: Investment propertiesH7 11,212 26 9 11,247 – – – 11,247 Investments accounted for using the
equity methodH8 69 – 2 71 – – – 71 Financial investments: Loans note (d)(iv) 2,302 4,201 1,340 7,843 1,418 – – 9,261 Equity securities and portfolio holdings in unit trusts 40,519 31,501 14,464 86,484 151 – – 86,635 Debt securities note (d)(i) 74,304 26,366 14,108 114,778 1,574 – – 116,352 Other investments 3,998 1,199 382 5,579 59 141 – 5,779 Deposits 9,022 212 638 9,872 80 – – 9,952
Total investmentsG1, note (c) 141,426 63,505 30,943 235,874 3,282 141 – 239,297
Properties held for sale H9 254 3 – 257 – – – 257 Cash and cash equivalents H10 2,839 232 1,601 4,672 1,436 523 – 6,631
Total assets 149,663 69,915 34,725 254,303 7,079 5,185 (5,761) 260,806

202
Prudential plc Annual Report 2011
Financial statements | Notes on the Group financial statements
B: Summary of results continued
B5: Group statement of financial position continued
2010 £m
By operating segment
Insurance operations Total insurance
opera-tions
Assetmanage-
mentopera-tions
E2
Unallo-cated to a
segment (centralopera-tions)
Intra-group
elimina-tions
31 Dec2010
Group Total
UK D2
US D3
Asia D4
Equity and liabilities Equity Shareholders’ equity H11 2,148 3,815 2,149 8,112 1,787 (1,868) – 8,031 Non-controlling interests 35 – 5 40 4 – – 44
Total equity 2,183 3,815 2,154 8,152 1,791 (1,868) – 8,075
Liabilities Policyholder liabilities and unallocated surplus of
with-profits funds: Insurance contract liabilitiesH12 84,152 58,641 28,498 171,291 – – – 171,291 Investment contract liabilities with discretionary participation featuresG1 25,613 – 119 25,732 – – – 25,732 Investment contract liabilities without discretionary participation
featuresG1 15,765 1,882 57 17,704 – – – 17,704 Unallocated surplus of with-profits funds (reflecting application of ‘realistic’
basis provisions for UK regulated with-profits funds)D2, H12 10,187 – 66 10,253 – – – 10,253
Total policyholder liabilities and unallocated surplus of with-profits funds 135,717 60,523 28,740 224,980 – – – 224,980
Core structural borrowings of shareholder- financed operations:H13
Subordinated debt – – – – – 2,718 – 2,718 Other – 159 – 159 250 549 – 958
Total – 159 – 159 250 3,267 – 3,676
Operational borrowings attributable to shareholder-financed operationsG1,H13 162 90 189 441 3 2,560 – 3,004
Borrowings attributable to with-profits operations 1,522 – – 1,522 – – – 1,522 Other non-insurance liabilities:G1,H13 Obligations under funding, securities lending
and sale and repurchase agreements G1 2,398 1,801 – 4,199 – – – 4,199 Net asset value attributable to unit holders of consolidated unit trusts and similar fundsG1 1,755 33 1,126 2,914 458 – – 3,372 Deferred tax liabilitiesH4 1,738 1,776 495 4,009 5 210 – 4,224 Current tax liabilitiesH4 399 34 70 503 33 295 – 831 Accruals and deferred income 340 – 109 449 244 14 – 707 Other creditorsG1 1,939 511 1,122 3,572 4,039 471 (5,761) 2,321 ProvisionsH14 442 19 61 522 157 50 – 729 Derivative liabilitiesG1,G3 792 799 222 1,813 78 146 – 2,037 Other liabilitiesG1,H15 276 355 437 1,068 21 40 – 1,129
Total 10,079 5,328 3,642 19,049 5,035 1,226 (5,761) 19,549
Total liabilities 147,480 66,100 32,571 246,151 5,288 7,053 (5,761) 252,731
Total equity and liabilities 149,663 69,915 34,725 254,303 7,079 5,185 (5,761) 260,806

203F
ina
ncia
l statem
en
ts B: Su
mmary
of resu
lts
b Group statement of financial position by business type
2011 £m 2010 £m
Parti-cipating
funds
Shareholder-backed business
Intra-group
elimin-ations
31 Dec2011
Group Total
31 Dec2010
Group Total
Unit- linked
and variable annuity
Non-linked
business
Asset manage-
ment operations
E2
Unallo-cated to a
segment (centralopera-tions)
Assets Intangible assets attributable to shareholders: Goodwill – – 235 1,230 – – 1,465 1,466 Deferred acquisition costs and other
intangible assets – – 5,040 16 13 – 5,069 4,667
TotalH1 – – 5,275 1,246 13 – 6,534 6,133
Intangible assets attributable to with-profits funds: In respect of acquired subsidiaries for venture fund and other investment purposes 178 – – – – – 178 166 Deferred acquisition costs and other
intangible assets 89 – – – – – 89 110
TotalH2 267 – – – – – 267 276
Total intangible assets 267 – 5,275 1,246 13 – 6,801 6,409
Deferred tax assetsH4 101 2 1,635 129 409 – 2,276 2,188 Other non-investment and non-cash assets 2,622 457 4,258 1,000 4,532 (6,231) 6,638 6,024 Investment of long-term business and other
operations: Investment propertiesH7 8,461 682 1,614 – – – 10,757 11,247 Investments accounted for using the equity methodH8 – – 70 – – – 70 7 1 Financial investments: Loansnote (d)(iv) 2,747 – 5,711 1,256 – – 9,714 9,261 Equity securities and portfolio holdings in unit trusts 26,047 59,890 818 594 – – 87,349 86,635 Debt securitiesnote (d)(i) 57,232 8,861 56,563 1,842 – – 124,498 116,352 Other investments 4,423 113 2,878 78 17 – 7,509 5,779 Deposits 7,207 1,544 1,868 89 – – 10,708 9,952
Total investmentsG1 and note (c) 106,117 71,090 69,522 3,859 17 – 250,605 239,297
Properties held for saleH9 – – 3 – – – 3 257 Cash and cash equivalentsH10 2,564 1,245 1,404 1,735 309 – 7,257 6,631
Total assets 111,671 72,794 82,097 7,969 5,280 (6,231) 273,580 260,806

204
Prudential plc Annual Report 2011
Financial statements | Notes on the Group financial statements
B: Summary of results continued
B5: Group statement of financial position continued
2011 £m 2010 £m
Parti-cipating
funds
Shareholder-backed business
Intra-group
elimin-ations
31 Dec2011
Group Total
31 Dec2010
Group Total
Unit-linked
and variable annuity
Non-linked
business
Asset manage-
ment operations
E2
Unallo-cated to a
segment (centralopera-tions)
Equity and liabilities Equity Shareholders’ equity H11 – – 9,201 1,783 (1,867) – 9,117 8,031 Non-controlling interests 33 – 5 5 – – 43 44
Total equity 33 – 9,206 1,788 (1,867) – 9,160 8,075
Liabilities Policyholder liabilities and unallocated surplus of
with-profits funds: Contract liabilities (including amounts in respect
of contracts classified as investment contracts under IFRS 4) 93,569 71,129 62,377 – – – 227,075 214,727
Unallocated surplus of with-profits funds (reflecting application of ‘realistic’ basis provisions for UK regulated with-profits funds)H12 9,215 – – – – – 9,215 10,253
Total policyholder liabilities and unallocated surplus of with-profits funds 102,784 71,129 62,377 – – – 236,290 224,980
Core structural borrowings of shareholder-financed operations:H13
Subordinated debt – – – – 2,652 – 2,652 2,718 Other – – 160 250 549 – 959 958
Total – – 160 250 3,201 – 3,611 3,676
Operational borrowings attributable to shareholder- financed operationsG1,H13 – 1 370 13 2,956 – 3,340 3,004
Borrowings attributable to with-profits operationsG1,H13 972 – – – – – 972 1,522 Deferred tax liabilitiesH4 1,215 33 2,707 5 251 – 4,211 4,224 Other non-insurance liabilities 6,667 1,631 7,277 5,913 739 (6,231) 15,996 15,325
Total liabilities 111,638 72,794 72,891 6,181 7,147 (6,231) 264,420 252,731
Total equity and liabilities 111,671 72,794 82,097 7,969 5,280 (6,231) 273,580 260,806

205F
ina
ncia
l statem
en
ts B: Su
mmary
of resu
lts
c Reconciliation of movement in investmentsA reconciliation of the Group’s directly held investments from the beginning of the year to the end of the year is as follows:
Insurance operationsTotal
insurance operations
£m
Assetmanage-
ment£m
Unallo-catedto a
segment£m
GroupTotal
£mUK£m
US£m
Asia£m
At 31 December 2009/1 January 2010 Total investments (including derivative assets) 132,690 49,576 23,390 205,656 2,890 176 208,722 Less: investments held by consolidated investment funds (1,835) – (718) (2,553) – – (2,553) Less: derivative liabilitiesG3 (709) (461) (146) (1,316) (49) (136) (1,501)
Directly held investments, net of derivative liabilities 130,146 49,115 22,526 201,787 2,841 40 204,668
Net cash inflow from operating activities 1,329 7,306 2,167 10,802 329 120 11,251 Realised gains (losses) in the year 2,233 21 984 3,238 11 (148) 3,101 Unrealised gains and losses and exchange movements
in the year 5,958 6,264 3,301 15,523 23 (17) 15,529 Dilution of PruHealth investment 56 – – 56 – – 56 Acquisition of UOB Life Assurance Ltd – – 1,004 1,004 – – 1,004
Movement in the year of directly held investments, net of derivative liabilities 9,576 13,591 7,456 30,623 363 (45) 30,941
At 31 December 2010/1 January 2011 Total investments (including derivative assets) 141,426 63,505 30,943 235,874 3,282 141 239,297 Less: investments held by consolidated investment funds (912) – (739) (1,651) – – (1,651) Less: derivative liabilitiesG3 (792) (799) (222) (1,813) (78) (146) (2,037)
Directly held investments, net of derivative liabilities 139,722 62,706 29,982 232,410 3,204 (5) 235,609
Net cash effect from purchases and sales of investments (920) 6,669 2,287 8,036 540 (95) 8,481 Realised gains (losses) in the year 3,852 102 503 4,457 17 – 4,474 Unrealised gains and losses and exchange movements
in the year (2,502) 1,382 (1,343) (2,463) (84) (90) (2,637)
Movement in the year of directly held investments, net of derivative liabilities 430 8,153 1,447 10,030 473 (185) 10,318
At 31 December 2011 Total investments (including derivative assets) 142,427 71,746 32,556 246,729 3,859 17 250,605 Less: investments held by consolidated investment funds (977) – (647) (1,624) – – (1,624) Less: derivative liabilitiesG3 (1,298) (887) (480) (2,665) (182) (207) (3,054)
Directly held investments, net of derivative liabilities 140,152 70,859 31,429 242,440 3,677 (190) 245,927
* The above reconciliation analyses the movement of directly held investments net of derivative liabilities. The deduction of derivative liabilities reflects the fact that these are considered an integral part of the Group’s investment portfolio and the exclusion from investments is merely a matter of required balance sheet presentation. The analysis excludes investments held in the balance sheet as a result of the consolidation of OEICS and unit trusts, as the Group’s exposure is merely to its share of the value of the fund as a whole rather than to the underlying investments and other assets and liabilities.

206
Prudential plc Annual Report 2011
Financial statements | Notes on the Group financial statements
B: Summary of results continued
B5: Group statement of financial position continued
d Debt securities and loans i Information on the credit risks of debt securities
2011 £m 2010 £m
Insurance operations Totalinsurance operations
£m
Assetmanage-
ment£m
GroupTotal
£m
GroupTotal
£mUK£m
US£m
Asia£m
S&P – AAA 9,928 133 1,423 11,484 1,109 12,593 26,838 S&P – AA+ to AA- 8,647 4,476 3,843 16,966 72 17,038 9,967 S&P – A+ to A- 21,474 6,382 3,055 30,911 250 31,161 29,959 S&P – BBB+ to BBB- 15,746 8,446 1,451 25,643 217 25,860 22,033 S&P – Other 3,175 999 2,137 6,311 35 6,346 6,048
58,970 20,436 11,909 91,315 1,683 92,998 94,845
Moody’s – Aaa 7,945 62 1,489 9,496 119 9,615 864 Moody’s – Aa1 to Aa3 651 15 128 794 12 806 521 Moody’s – A1 to A3 1,008 29 304 1,341 11 1,352 798 Moody’s – Baa1 to Baa3 1,030 67 131 1,228 – 1,228 1,119 Moody’s – Other 242 17 59 318 – 318 417
10,876 190 2,111 13,177 142 13,319 3,719
Implicit ratings of MBS based on NAIC valuations (see below)
– NAIC 1 – 2,577 – 2,577 – 2,577 3,083 – NAIC 2 – 147 – 147 – 147 181 – NAIC 3-6 – 368 – 368 – 368 232
– 3,092 – 3,092 – 3,092 3,496
Fitch 492 184 351 1,027 12 1,039 855 Other 7,615 3,120 3,310 14,045 5 14,050 13,437
Total debt securities 77,953 27,022 17,681 122,656 1,842 124,498 116,352
In the table above, with the exception of some mortgage-backed securities within Jackson, Standard & Poor’s (S&P) ratings have been used where available. For securities where S&P ratings are not immediately available, those produced by Moody’s and then Fitch have been used as an alternative. For some mortgage-backed securities within Jackson, the table above includes these securities using the regulatory ratings detail issued by the NAIC. These regulatory ratings levels were established by external third parties (PIMCO for residential mortgage-backed securities and BlackRock Solutions for commercial mortgage-backed securities). Notes D2(d), D3(d), D4(d) and E2 provide further details on the credit risks of debt securities by segment.

207F
ina
ncia
l statem
en
ts B: Su
mmary
of resu
lts
ii Group exposure to holdings in asset-backed securitiesThe Group’s exposure to holdings in asset-backed securities, which comprise residential mortgage-backed securities (RMBS), commercial mortgage-backed securities (CMBS), CDO funds and other asset-backed securities (ABS), at 31 December 2011 is as follows:
2011 £m 2010 £m
Shareholder-backed operations (excluding assets held in unit-linked funds): UK insurance operationsnote (i) 1,358 1,181 US insurance operationsnote (ii) 5,380 6,135 Asian insurance operationsnote (iii) 176 113 Other operations 594 437
7,508 7,866
With-profits operations: UK insurance operationsnote (i) 5,351 5,237 Asian insurance operationsnote (iii) 454 435
5,805 5,672
Total 13,313 13,538
Notes(i) UK insurance operations The UK insurance operations’ exposure to asset-backed securities at 31 December 2011 comprises:
2011 £m 2010 £m
Shareholder-backed business (2011: 38% AAA, 18% AA)(i) 1,358 1,181 With-profits operations (2011: 58% AAA, 9% AA)(ii) 5,351 5,237
Total 6,709 6,418
(i) All of the exposure of the shareholder-backed business relates to the UK market and primarily relates to investments held by PRIL. (ii) Exposure of the with-profits operations relates to exposure to:
2011 £m 2010 £m
UK market 4,037 3,685 US market 1,314 1,552
5,351 5,237
(ii) US insurance operations US insurance operations’ exposure to asset-backed securities at 31 December 2011 comprises:
2011 £m 2010 £m
RMBS Sub-prime (2011: 20% AAA, 4% AA) 207 224 Alt-A (2011: 12% AAA, 4% AA) 310 415 Prime including agency (2011: 3% AAA, 76% AA) 2,074 2,145 CMBS (2011: 35% AAA, 12% AA) 2,169 2,375 CDO funds (2011: 16% AAA, 0% AA)*, including £nil million exposure to sub-prime 44 162 Other ABS (2011: 23% AAA, 17% AA), including £6.6 million exposure to sub-prime 576 814
Total 5,380 6,135
* Including the Group’s economic interest in Piedmont and other consolidated CDO funds.

208
Prudential plc Annual Report 2011
Financial statements | Notes on the Group financial statements
B: Summary of results continued
B5: Group statement of financial position continued
(iii) Asian insurance operations The Asian insurance operations’ exposure to asset-backed securities is primarily held by the with-profits operations. The £454 million (2010: £435 million) asset-backed securities exposure of the Asian with-profit operations comprises:
2011 £m 2010 £m
CMBS 149 251 CDO funds and ABS 305 184
Total 454 435
The £454 million (2010: £435 million) includes £398 million (2010: £341 million) held by investment funds consolidated under IFRS in
recognition of the control arrangements for those funds and include an amount not owned by the Group with a corresponding liability of £20 million (2010: £7 million) on the statement of financial position for net asset value attributable to external unit-holders in respect of these funds, which are non-recourse to the Group. Of the £454 million, 75 per cent (2010: £435 million, 43 per cent) are investment graded by Standard and Poor’s.
(iv) Other operations Other operations’ exposure to asset-backed securities at 31 December 2011 is held by Prudential Capital and comprises:
2011 £m 2010 £m
RMBS: Prime (2011: 91% AAA, 9% AA) 340 197 CMBS (2011: 27% AAA, 16% AA) 146 184 CDO funds and other ABS - all without sub-prime exposure (2011: 98% AAA) 108 56
Total 594 437

209F
ina
ncia
l statem
en
ts B: Su
mmary
of resu
lts
iii Sovereign debtSovereign debt represented 16 per cent or £9.2 billion of the debt portfolio backing shareholder business at 31 December 2011. 43 per cent of this was rated AAA and 94 per cent investment grade. Of the Group’s holdings in Continental Europe of £690 million, 87 per cent was AAA rated. Shareholder exposure to the eurozone sovereigns of Portugal, Italy, Ireland, Greece and Spain (PIIGS) is £44 million. The Group does not have any sovereign debt exposure to Greece, Portugal, Ireland or France. The exposure of the Group’s shareholder and with-profits funds to sovereign debt (including credit default swaps that are referenced to sovereign debt) at 31 December 2011 is as follows:
Shareholdersovereign
debt£m
With-profitssovereign
debt £m
Continental Europe Italy 43 52 Spain 1 33 44 85 Germany 598 602 Other Europe (principally Isle of Man and Belgium) 48 62
690 749 United Kingdom 3,254 2,801 United States 2,448 2,615 Other, predominantly Asia 2,850 332
Total 9,242 6,497
Exposure to bank debt securitiesThe Group held the following direct exposures to banks’ debt securities of shareholder-backed business at 31 December 2011.
Bank debt securities – shareholder-backed business £m
Senior debt Subordinated debt
Covered Senior Total senior
debt Tier 2 Tier 1
Totalsubordinated
debt Total
Portugal – 24 24 – – – 24 Ireland – 13 13 – – – 13 Italy – 11 11 56 14 70 81 Greece – – – – – – – Spain 107 11 118 90 2 92 210 107 59 166 146 16 162 328 Austria – – – 9 – 9 9 Belgium – – – – – – – France 2 34 36 78 35 113 149 Germany – 28 28 1 – 1 29 Luxembourg – – – – – – – Netherlands – 7 7 81 64 145 152 United Kingdom 228 145 373 615 95 710 1,083
Total Europe 337 273 610 930 210 1,140 1,750
United States – 1,362 1,362 352 2 354 1,716 Other, predominantly Asia – 246 246 562 33 595 841
Total 337 1,881 2,218 1,844 245 2,089 4,307

210
Prudential plc Annual Report 2011
Financial statements | Notes on the Group financial statements
B: Summary of results continued
B5: Group statement of financial position continued
In addition to the exposures held by the shareholder-backed business, the Group held the following banks’ securities at 31 December 2011 within its with-profits funds.
Bank debt securities – participating funds £m
Senior debt Subordinated debt
Covered Senior Total senior
debt Tier 2 Tier 1
Totalsubordinated
debt Total
Portugal – 7 7 – – – 7 Ireland – – – – – – – Italy – 45 45 49 2 51 96 Greece 5 – 5 – – – 5 Spain 137 – 137 1 – 1 138 142 52 194 50 2 52 246 Austria – – – – – – – Belgium – – – – – – – France – 80 80 47 17 64 144 Germany – 7 7 – – – 7 Luxembourg – 7 7 – – – 7 Netherlands – 80 80 14 28 42 122 United Kingdom 319 385 704 772 74 846 1,550
Total Europe 461 611 1,072 883 121 1,004 2,076
United States – 1,378 1,378 396 278 674 2,052 Other, predominantly Asia 1 384 385 341 20 361 746
Total 462 2,373 2,835 1,620 419 2,039 4,874
iv LoansInformation on the credit quality of the portfolio of loans, which almost wholly is for amounts which are neither past due or impaired is shown in notes D2, D3, D4 and E2. Details of allowances for loans, losses and amounts past due are shown in notes G1 and G2. No additional analysis is provided of the element of loans and receivables that were neither past due nor impaired from those of the total portfolio on the grounds of the immateriality of the difference between the neither past due nor impaired element and the total portfolio.

211F
ina
ncia
l statem
en
ts B
: Sum
mary
of resu
lts
e Reconciliation of movement in policyholder liabilities and unallocated surplus of with-profits fundsA reconciliation of the total policyholder liabilities and unallocated surplus of with-profits funds of the Group from the beginning of the year to the end of the year is as follows:
Insurance operations £m
UK US Asia Total
Policyholder liabilities 116,229 48,311 21,858 186,398 Unallocated surplus of with-profits funds 9,966 – 53 10,019
At 1 January 2010 126,195 48,311 21,911 196,417 Premiums 7,890 11,735 4,308 23,933 Surrenders (3,779) (3,598) (2,241) (9,618)Maturities/Deaths (7,303) (769) (498) (8,570)
Net flows (3,192) 7,368 1,569 5,745 Shareholders transfers post tax (223) – (24) (247)Investment-related items and other movements 13,172 3,464 2,235 18,871 Foreign exchange translation differences (208) 1,380 2,081 3,253 Dilution of Group’s holdings (27) – – (27)Acquisition of UOB Life Assurance Limited – – 968 968
As at 31 December 2010 / 1 January 2011 135,717 60,523 28,740 224,980
Comprising: – Policyholder liabilities 125,530 60,523 28,674 214,727 – Unallocated surplus of with-profits funds 10,187 – 66 10,253
At 1 January 2011 135,717 60,523 28,740 224,980 Premiums 6,988 12,914 5,079 24,981 Surrenders (4,255) (4,270) (2,237) (10,762)Maturities/Deaths (7,813) (820) (664) (9,297)
Net flows (5,080) 7,824 2,178 4,922 Shareholders transfers post tax (216) – (30) (246)Investment-related items and other movements 5,862 136 365 6,363 Foreign exchange translation differences (94) 706 (341) 271
At 31 December 2011 136,189 69,189 30,912 236,290
Comprising: – Policyholder liabilities 127,024 69,189 30,862 227,075 – Unallocated surplus of with-profits funds 9,165 – 50 9,215
Average policyholder liability balances*
2011 126,277 64,856 29,768 220,901
2010 120,880 54,417 25,750 201,047
* Averages have been based on opening and closing balances and adjusted for acquisition and disposals in the period and excluding unallocated surplus of with-profits funds.
The items above represent the amount attributable to changes in policyholder liabilities and unallocated surplus of with-profits funds as a result of each of the components listed.
The policyholder liabilities shown include investment contracts without discretionary participation features (as defined in IFRS 4) and their full movement in the year. The items above are shown gross of reinsurance.

212
Prudential plc Annual Report 2011
Financial statements | Notes on the Group financial statements
B: Summary of results continued
B5: Group statement of financial position continued
The analysis above represents the impact of premiums, claims and investment movements on policyholders’ liabilities. It does not represent premiums, claims and investment movements as reported in the income statement, for example the premiums shown above will exclude any deductions for fees/charges and claims represent the policyholder liabilities provision released rather than the claim amount paid to the policyholder. B6: New business
Insurance products and investment products note (i)
Insurance products gross premiums
Investment products gross inflows Total
2011 £m 2010 £mnote (iii)
2011 £m
2010 £mnote (ii)
2011 £m
2010 £m
Asian operations 2,970 2,495 63,726 80,597 66,696 83,092 US operations 12,581 11,439 – – 12,581 11,439 UK operations 5,130 5,910 25,981 26,372 31,111 32,282
Group total 20,681 19,844 89,707 106,969 110,388 126,813

213F
ina
ncia
l statem
en
ts B
: Sum
mary
of resu
lts
Insurance products – new business premiums and contributions notes (i), (ii)
Single RegularAnnual premium and
contribution equivalents (APE)
2011 £m 2010 £m 2011 £m 2010 £m 2011 £m 2010 £m
Group insurance operations Asia - excluding Indianote (iii) 1,321 1,019 1,426 1,211 1,559 1,313 India 135 85 88 180 101 188
Asia 1,456 1,104 1,514 1,391 1,660 1,501 US 12,562 11,417 19 22 1,275 1,164 UK 4,871 5,656 259 254 746 820
Group Total 18,889 18,177 1,792 1,667 3,681 3,485 Group Total – excluding India 18,754 18,092 1,704 1,487 3,580 3,297
Asian insurance operations Hong Kong 180 107 313 276 331 287 Indonesia 250 141 338 269 363 283 Malaysia 79 58 215 198 223 204 Philippines 95 64 20 17 30 23 Singapore 371 318 198 143 235 175 Thailand 11 15 26 25 27 26 Vietnam 1 1 42 41 42 41
SE Asian operations including Hong Kong 987 704 1,152 969 1,251 1,039 Chinanote (iv) 46 103 54 48 59 58 Korea 71 66 94 89 101 96 Taiwan 217 146 126 105 148 120
Total Asian operations – excluding India note (iii) 1,321 1,019 1,426 1,211 1,559 1,313 India 135 85 88 180 101 188
Total Asian operations 1,456 1,104 1,514 1,391 1,660 1,501
US insurance operations Fixed annuities 472 836 – – 47 84 Fixed index annuities 934 1,089 – – 93 109 Life 10 11 19 22 20 23 Variable annuities 10,909 9,481 – – 1,091 948 Wholesale 237 – – – 24 –
Total US insurance operations 12,562 11,417 19 22 1,275 1,164
UK and Europe insurance operations Direct and partnership annuities 328 593 – – 33 59 Intermediated annuities 241 221 – – 24 22 Internal vesting annuities 1,223 1,235 – – 122 124
Total individual annuities 1,792 2,049 – – 179 205
Corporate pensions 184 228 215 198 233 221 Onshore bonds 1,779 1,660 – – 178 166 Other products 780 774 44 56 122 133 Wholesale 336 945 – – 34 95
Total UK and Europe insurance operationsnote (v) 4,871 5,656 259 254 746 820
Group Total 18,889 18,177 1,792 1,667 3,681 3,485
Group Total – excluding India 18,754 18,092 1,704 1,487 3,580 3,297

214
Prudential plc Annual Report 2011
Financial statements | Notes on the Group financial statements
B6: New business continued
Investment products – funds under management notes (ii) and (iv)
2011 £m
1 Jan 2011
Marketgross
inflows Redemptions
Marketexchange
translationand other
movements31 Dec2011
Eastspring Investments 22,048 63,726 (63,605) (2,948) 19,221 M&G 89,326 25,981 (21,596) (1,763) 91,948
Group Total 111,374 89,707 (85,201) (4,711) 111,169
2010 £m
1 Jan 2010
Marketgross
inflows Redemptions
Marketexchange
translationand other
movements31 Dec2010
Eastspring Investments 19,474 80,597 (80,812) 2,789 22,048 M&G 70,306 26,372 (17,267) 9,915 89,326
Group Total 89,780 106,969 (98,079) 12,704 111,374
Notes(i) The tables shown above are provided as an indicative volume measure of transactions undertaken in the reporting period that have the potential
to generate profits for shareholders. The amounts shown are not, and not intended to be, reflective of premium income recorded in the IFRS income statement.
Annual Premium Equivalents (APEs) are calculated as the aggregate of regular new business amounts and one-tenth of single new business amounts. New business premiums for regular premium products are shown on an annualised basis. Department of Work and Pensions (DWP) rebate business is classified as single recurrent business. Internal vesting business is classified as new business where the contracts include an open market option.
The format of the tables shown above is consistent with the distinction between insurance and investment products as applied for previous financial reporting periods. With the exception of some US institutional business, products categorised as ‘insurance’ refer to those classified as contracts of long-term insurance business for regulatory reporting purposes, ie falling within one of the classes of insurance specified in Part II of Schedule 1 to the Regulated Activities Order under FSA regulations.
The details shown above for insurance products include contributions for contracts that are classified under IFRS 4 ‘Insurance Contracts’ as not containing significant insurance risk. These products are described as investment contracts or other financial instruments under IFRS. Contracts included in this category are primarily certain unit-linked and similar contracts written in UK insurance operations and Guaranteed Investment Contracts and similar funding agreements written in US operations.
(ii) Investment products referred to in the table for funds under management above are unit trust, mutual funds and similar types of retail fund management arrangements. These are unrelated to insurance products that are classified as ‘investment contracts’ under IFRS 4, as described in the preceding paragraph, although similar IFRS recognition and measurement principles apply to the acquisition costs and fees attaching to this type of business.
(iii) New business sales for the Group’s Japanese insurance subsidiary, which ceased selling new business with effect from 15 February 2010, have been excluded from the 2010 comparative.
(iv) New business and market gross inflows and redemptions have been translated at the average exchange rate for the year applicable. Funds under management at points in time are translated at the exchange rate applicable at those dates.
(v) The Prudential’s European operation is based in Ireland and sells products into Jersey, Guernsey, Isle of Man, Gibraltar, Cyprus, Malta, Belgium, Spain and UK.

215F
ina
ncia
l statem
en
tsC: G
roup risk
man
agemen
t
C: Group risk management
a: Overview
As a provider of financial services, including insurance, the management of risk lies at the heart of the Group’s business. The control procedures and systems established within the Group are designed to manage, rather than eliminate, the risk of failure to meet business objectives. They can only provide reasonable and not absolute assurance against material misstatement or loss, and focus on aligning the levels of risk-taking with the achievement of business objectives. The Group’s internal control processes are detailed in the Group Governance Manual. This is supported by the Group Risk Framework, which provides an overview of the Group-wide philosophy and approach to risk management. Where appropriate, more detailed policies and procedures have been developed at Group and/or business unit levels. These include Group-wide mandatory policies on certain operational risks, including health, safety, fraud, money laundering, bribery, business continuity, information security and operational security, and policies on certain financial risks. Additional guidelines are provided for some aspects of actuarial and financial activity. Prudential’s risk governance framework requires that all of the Group’s businesses and functions establish processes for identifying, evaluating and managing the key risks faced by the Group. The risk governance framework is based on the concept of ‘three lines of defence’: Risk management; risk oversight and independent assurance. Primary responsibility for strategy, performance management and risk control lies with the Board, which has established the Group Risk Committee to assist in providing leadership, direction and oversight, and with the Group Chief Executive and the chief executive of each business unit. Risk oversight is provided by Group-level risk committees, chaired by the Group Chief Risk Officer or the Chief Financial Officer. Independent assurance on the Group’s internal control and risk management systems is provided by the Group Audit Committee, supported by the Group-wide Internal Audit. The Group’s risk reporting framework forms an important part of the Group’s business processes and planning. Business units review their risks as well as opportunities as part of their business plans, and risks against business objectives are regularly discussed with Group executive management. Additional information on the Group’s risk framework is included in the risk and capital management section. The management of the risk attached to the Group’s financial instruments and insurance liabilities, together with the inter-relationship with the management of capital, is summarised in the following sections.
b: Group risk appetite
The Group’s risk framework includes its appetite for risk exposures as well as its approach to risk management. Under this approach, the Group continuously assesses the Group’s top risks and monitors its risk profile against approved limits. Prudential defines and monitors aggregate risk limits based on financial and non-financial stresses for its earnings volatility, liquidity and capital requirements.
Earnings volatility: The objectives of the limits are to ensure that:
a the volatility of earnings is consistent with the expectations of stakeholders,b the Group has adequate earnings (and cash flows) to service debt, expected dividends and to withstand unexpected shocks, andc earnings (and cash flows) are managed properly across geographies and are consistent with funding strategies.
The two measures used to monitor the volatility of earnings are European Embedded Value (EEV) operating profit and IFRS operating profit, although EEV and IFRS total profits are also considered.
Liquidity: The objective is to ensure that the Group is able to generate sufficient cash resources to meet financial obligations as they fall due in business as usual and stressed scenarios.
Capital requirements: The limits aim to ensure that:
a the Group meets its internal economic capital requirements,b the Group achieves its desired target rating to meet its business objectives, andc supervisory intervention is avoided.
The two measures used are the EU Insurance Groups Directive (IGD) capital requirements and internal economic capital requirements. In addition, capital requirements are monitored on a local statutory basis. The Group’s risk appetite framework forms an integral part of our annual business planning cycle. The Group Risk Committee is responsible for reviewing the risks inherent in the Group’s business plan and for providing the Board with input on the risk/reward trade-offs implicit therein. This review is supported by our Group Risk function, which uses submissions by business units to calculate the Group’s aggregated position (allowing for diversification effects between business units) relative to the limits contained within the risk appetite statements.

216
Prudential plc Annual Report 2011
Financial statements | Notes on the Group financial statements
C: Group risk management continued
c: Risk mitigation and hedging
The Group manages its actual risk profile against its tolerance of risk. To do this, the Group maintains risk registers that include details of the identified risks and of the controls and mitigating actions employed in managing them. The Group uses a range of risk management and mitigation strategies. The most important of these include: adjusting asset portfolios to reduce investment risks (such as duration mismatches or overweight counterparty exposures); using derivatives to hedge market risks; implementing reinsurance programmes to manage insurance risk; implementing corporate insurance programmes to limit the impact of operational risks; and revising business plans where appropriate. Any mitigation strategies involving large transactions, such as material derivative transactions, are subject to scrutiny at Group level before implementation.
i Use of derivativesIn the UK business, most of our equity exposure is incurred in the with-profits fund, which includes a large inherited estate. The inherited estate itself is partially protected against falls in equity markets through an active hedging policy. In the US, to protect the shareholders against the volatility introduced by embedded options, Jackson uses both a comprehensive hedging programme and reinsurance. Jackson makes use of the natural offsets that exist between the variable annuity guarantees and the fixed index annuity book, and then uses a combination of over-the-counter (OTC) options and exchange-traded derivatives to hedge the residual risk, allowing for significant market shocks and limiting the amount of capital at risk. Internal positions are generally netted before any external hedge positions are considered. Jackson manages fixed annuity interest rate exposure through a combination of interest rate swaps and interest rate options to protect capital against rates rising quickly, and through the contractual ability to reset crediting rates annually. Prudential principally operates in the UK, the US, and in 13 countries and territories in Asia and the Middle East. The geographical diversity of the Group’s business means that Prudential is subject to the risk of exchange rate fluctuations. The Group does not generally seek to hedge foreign currency revenues, as these are substantially retained locally to support the growth of the Group’s business, and meet local regulatory and market requirements. However, in cases where a surplus arising in an overseas operation supports Group capital or shareholders’ interest, this exposure is hedged if it is economically optimal to do so. Currency borrowings, swaps and other derivatives are used to manage exposures. Further details of the Group’s use of derivatives are explained in note G3.
ii Asset/liability managementPrudential actively manages its assets and liabilities, testing the adequacy of its reserves and the strength of the solvency position through a combination of analysis, scenarios and stochastic modelling. A stochastic approach models the inter-relationship between asset and liability movements, taking into account asset correlation and policyholder behaviour, under a large number of possible scenarios. These scenarios are projected forward over time and the liabilities and solvency position of the fund are calculated in each scenario in each future year. This allows the identification of which extreme scenarios will have the most adverse effects and what the best estimate outcome may be. The fund’s policy on management actions, including bonus and investment policy, is set, such that they are consistent with the available capital and the targeted risk of default. This differs from a deterministic model, which would only consider the results from one carefully selected scenario. For businesses that are most sensitive to interest rate changes, such as immediate annuity business, Prudential uses cash flow analysis to create a portfolio of fixed income securities whose value changes in line with the value of liabilities when interest rates change. This type of analysis helps protect profits and the capital position from changing interest rates. In the UK, the cash flow analysis is used in Prudential’s annuity business while, in the US, it is used for its interest-sensitive and fixed index annuities and stable value products such as Guaranteed Investment Contracts (GICs). Perfect matching is not possible, for example because of the nature of the liabilities (which might include guaranteed surrender values) and options for prepayment contained in the assets or the unavailability of assets with a sufficiently long duration. For businesses that are most sensitive to equity price changes, Prudential uses stochastic modelling and scenario testing to look at the expected future returns on its investments under different scenarios that best reflect the large diversity in returns that equities can produce. This allows Prudential to devise an investment and with-profits policyholder bonus strategy that, on the model assumptions, allows it to optimise returns to its policyholders and shareholders over time, while maintaining appropriate financial strength. Prudential uses this method extensively in connection with its UK with-profits business.
d: Risk exposures
The Group publishes separately within ‘Additional Information’ of its Group Annual Report, a section on key risk factors, which discusses inherent risks in the business and trading environment.
i Market risksMarket risk is the risk of loss for our business, or of adverse change in the financial situation, resulting directly or indirectly from fluctuations in the level or volatility of market prices of assets and liabilities.

217F
ina
ncia
l statem
en
ts
Equity and interest rate riskPrudential invests in equity type investments which are subject to equity price risk, as well as in bonds, mortgages and cash deposits, the values of which are subject to interest rate risk. The amount of risk borne by Prudential’s shareholders depends on the nature of its liabilities and the extent to which its customers share the investment risk through the structure of Prudential’s products. Prudential has some liabilities that contain guaranteed returns (for example, interest-sensitive fixed annuities and immediate annuities), which generally will be supported by fixed income investments. In the US, Jackson is a leading provider of variable annuities for which guarantees are included as part of the contract terms. GMDB are provided on all policies in this class, GMWB on 70 per cent of the book and GMIB on 5 per cent. To protect the shareholders against the volatility introduced by these embedded options, Jackson used both a comprehensive hedging programme and reinsurance. The GMIB is no longer offered, with existing coverage being reinsured. In the case of other liabilities, where customers share the investment risk, Prudential invests a substantial portion of the assets in equity and property investments that Prudential believes produce greater returns over the long-term. Foreign exchange risk70 per cent of Prudential’s operating profit based on longer-term investment returns, as described in note B1, for the year ended 31 December 2011, came from US and Asian operations. The resulting exposure from the translation of these reported earnings to Sterling is not separately managed, although its impact is reduced by interest payments on foreign currency borrowings and by the adoption of average exchange rates for the translation of foreign currency revenues. Approximately 77 per cent of the Group’s IFRS basis shareholders’ equity at 31 December 2011 arose in Prudential’s US and Asian operations (2010: approximately 79 per cent). To mitigate the exposure of the US component there are US$2.85 billion of borrowings held centrally, which are formally designated as net investment hedges at 31 December 2011. Net of the currency position arising from these borrowings some 57 per cent of the Group’s shareholders’ funds are represented by net assets in currencies other than sterling. Additional details on the market risks’ exposures of the UK, US and Asian insurance operations are provided in notes D2, D3 and D4, respectively.
ii Credit riskThe risk of loss for our business or of adverse change in the financial position, resulting from fluctuations in the credit standing of issuers of securities, counterparties and any debtors in the form of default or other significant credit event (eg downgrade or spread widening). Some of Prudential’s businesses, in particular Jackson, the PAC with-profits fund and Prudential’s UK pension annuity business hold large amounts of investments that contain credit risk on which a certain level of default is expected. These expected losses are considered when Prudential determines the crediting rates, deposit rates and premium rates for the products that will be supported by these assets. Certain OTC derivatives contain a credit risk element that is controlled through the evaluation of collateral agreements and master netting agreements on interest rate and currency swaps. Prudential is also exposed to credit-related losses in the event of non-performance by counterparties. Further analysis of the credit quality of debt securities held by the Group is shown in note B5. Additional details on the credit quality of the debt security portfolios of UK, US and Asian insurance operations are shown in notes D2, D3 and D4, respectively.
iii Liquidity riskLiquidity risk is the risk of the Group being unable to generate sufficient cash resources or raise finance to meet financial obligations as they fall due in business as usual and stress scenarios. The assets of insurers are in general relatively liquid, whilst the majority of liabilities are long-term products held by policyholders. Prudential regularly monitors and analyses its liquidity position at the Group level and performs stress tests of this position. The liquidity of the Group is monitored on a monthly basis by comparing the predicted cash needs of the Group centre, to meet corporate and financing costs (net of expected dividends from the business units), to the liquid resources available to it. These liquid resources include cash held and cash that could be raised through internal resources (for example by reporting unencumbered bonds). The stresses consider changes to cash requirements, the availability of external financing and internal sources of liquidity and the sufficiency of external back-up lines. The holding company has significant internal sources of liquidity which are sufficient to meet all of our expected requirements for the foreseeable future without having to make use of external funding. The Group maintains £2.1 billion of undrawn syndicated and bilateral committed banking facilities, maturing between 2013 and 2017.
iv Insurance riskInsurance risk is the risk of loss for our business or of adverse change in the value of insurance liabilities, resulting from changes in the level, trend or volatility of a number of insurance risk drivers. This includes adverse mortality, longevity, morbidity, persistency and expense experience. Prudential needs to make assumptions about a number of factors in determining the pricing of its products and for reporting the results of its long-term business operations. In common with other industry participants, the profitability of the Group’s businesses depends on a mix of factors, including mortality and morbidity trends, persistency, investment performance, unit cost of administration and new business acquisition expenses.
C: G
roup risk
man
agemen
t

218
Prudential plc Annual Report 2011
Financial statements | Notes on the Group financial statements
d: Risk exposures continued
For example, the assumption that Prudential makes about future expected levels of mortality is particularly relevant for its UK annuity business where, in exchange for their accumulated pension fund, pension annuity policyholders receive a guaranteed payment, for as long as they live. Prudential conducts extensive research into longevity risk using data from its substantial annuitant portfolio. As part of its pension annuity pricing and reserving policy, Prudential UK assumes that current rates of mortality continuously improve over time at levels based on adjusted data from the Continuous Mortality Investigations (CMI) projections as published by the Institute and Faculty of Actuaries. Prudential’s persistency assumptions reflect recent past experience for each relevant line of business, and any expectations of future persistency. Where appropriate, allowance is also made for the relationship, which is either assumed or historically observed, between persistency and investment returns, and for the resulting additional risk.
v Non-financial risks – operational, business environment and strategic risk Operational risk is the risk of loss arising from inadequate or failed internal processes, or from personnel and systems, or from external events. Business environment risk is the exposure to forces in the external environment that could significantly change the fundamentals that drive the business’s overall strategy. Strategic risk is the risk of ineffective, inefficient or inadequate senior management processes for the development and implementation of business strategy in relation to the business environment and the Group’s capabilities. Prudential is exposed to operational, business environment and strategic risk in the course of running its businesses. Prudential processes a large number of complex transactions across numerous products, and is subject to a number of different legal and regulatory, including tax, regimes. Prudential also has a significant number of third-party relationships that are important to the distribution and processing of our products. This results in reliance upon the operational performance of these outsourcing partners. Prudential’s systems and processes incorporate controls that are designed to manage and mitigate the operational risks associated with its activities. Business units are required to confirm that they have implemented the necessary controls to evidence compliance with the UK Corporate Governance Code and the Hong Kong Code on Corporate Governance Practices. The Group has an operational risk management framework and policy in place that facilitates both the qualitative and quantitative analysis of operational risk exposures. The output of this framework, in particular management information on key operational risk and control assessments, scenario analysis, internal incidents and external incidents, is reported by the business units and presented to the Group Operational Risk Committee. This information also supports business decision-making and lessons-learned activities; the ongoing improvement of the control environment; determining the operational risk capital requirements; and determination of the adequacy of Prudential’s corporate insurance programme. With regard to business environment risk, the Group has a wide-ranging programme of active and constructive engagement with governments, policymakers and regulators in our key markets and with relevant international institutions. Such engagement is undertaken both directly and indirectly via trade associations. The Group has procedures in place to monitor and track political and regulatory developments. Where appropriate, the Group provides submissions and technical input to officials and others, either via submissions to formal consultations or through interactions with officials. With regard to strategic risk, both business units and Group Head Office are required to adopt a forward-looking approach to risk management when performing risk assessments and the annual strategic planning process. This supports the identification of potential threats and the initiatives needed to address them, as well as competitive opportunities. The impact on the underlying businesses and/or Group-wide risk profile is also considered to ensure that strategic initiatives are within the Group’s risk appetite. The European Union (EU) is developing a new solvency framework for insurance companies, referred to as ‘Solvency II’. The Solvency II Directive, which sets out the new framework, was formally approved by the Economic and Financial Affairs Council in November 2009, and is currently anticipated to be transposed into local regulations and to take effect for supervisors from 2013, with implementation currently anticipated from 2014. Solvency II represents a regulatory risk due to the uncertainty of what the rules will be when finalised, their potential impacts and the timing of their introduction. The risks are that the Group may not be able to respond sufficiently quickly to the strategic implication of the change given levels of uncertainty around the content and timing; operational risk in terms of the scale and complexity of the delivery and uncertainty over timelines; and the additional capital that the Company may be required to hold. Solvency II is covered in more detail in the Regulatory Capital requirements section below.
e: Regulatory capital requirements
Regulatory capital requirements apply at an individual company level for the Group’s life assurance and asset management business. These are described in sections D5 and E3 respectively. In addition, the Group as a whole is subject to the capital adequacy requirements of the EU IGD as implemented by the Financial Services Authority (FSA) in the UK. The IGD pertains to groups whose activities are primarily concentrated in the insurance sector. The IGD capital adequacy requirements involves aggregating surplus capital held in our regulated subsidiaries, from which Group borrowings, except those subordinated debt issues that qualify as capital, are deducted. The test is passed when this aggregate number is positive: a negative result at any point in time is a notifiable breach of UK regulatory requirements. Due to the geographically diverse nature of Prudential’s operations, the application of these requirements to Prudential is complex. In particular, for many of the Group’s Asian operations, the assets, liabilities and capital requirements have to be recalculated based on FSA regulations as if the companies were directly subject to FSA regulation.
C: Group risk management continued

219F
ina
ncia
l statem
en
ts
The FSA has established a structure for determining how much hybrid debt can count as capital which is similar to that used for banks. It categorises capital as Tier 1 (equity and preference shares), Upper Tier 2 and Lower Tier 2. Up to 15 per cent of Tier 1 capital can be in the form of hybrid debt and is called ‘Innovative Tier 1’. At 31 December 2011, the Group held £1,823 million (2010: £1,463 million) of Innovative Tier 1 capital in the form of perpetual securities, £nil (2010: £nil) of Upper Tier 2 and £829 million (2010: £1,255 million) of Lower Tier 2 capital. In addition, Jackson held £160 million of surplus notes at the end of the financial year 2011 (2010: £159 million) which, although the US does not have a similar capital categorisation under its regulatory framework, are akin to the FSA’s Lower Tier 2 Capital and have been disclosed as such in note H13. Further details on Group borrowings are shown in note H13. At 31 December 2010, Prudential met the requirements of the IGD with £4.3 billion of surplus capital before allowing for the 2010 final dividend. In addition, during 2011, Prudential met the requirements of the FSA under the IGD. The IGD position as at 31 December 2011 will be submitted to the FSA by 30 April 2012, and at the time of preparation of these financial statements, the surplus capital under the test was estimated to be around £4.0 billion before allowing for the 2011 final dividend, giving a solvency ratio of circa 275 per cent. The main components of the decrease in IGD surplus during 2011 are:
• net capital generation mainly through operating earnings (in-force releases less investment in new business, net of tax) of £1.5 billion.
Offset by:
• investment market-related impacts of £0.6 billion,• final 2010 dividend of £0.4 billion and interim 2011 dividend of £0.2 billion,• external financing costs and other central costs, net of tax, of £0.5 billion, and• net impact of £0.1 billion arising from issuance of the $550 million perpetual subordinated Tier 1 securities in January 2011 and
repayment of the ¤500 million subordinated notes in December 2011.
Prudential’s approach to capital allocation takes into account a range of factors, especially risk-adjusted returns on capital, the impact of alternative capital measurement bases (accounting, regulatory, economic and ratings agency assessments), tax efficiency and wider strategic objectives. Prudential optimises capital allocation across the Group by using a consistent set of capital performance metrics across all business units to ensure meaningful comparison. Capital utilisation, return on capital and new business value creation are measured at a product level. The use of these capital performance metrics is embedded into our decision-making processes for product design and product pricing. Prudential’s capital performance metrics are based on economic capital, which provides a view of our capital requirements across the Group, allowing for realistic diversification benefits. Economic capital also provides valuable insights into our risk profile and is used both for risk measurement and capital management. As noted above, the EU is developing a new solvency framework for insurance companies, referred to as ‘Solvency II’. The Solvency II Directive, which sets out the new framework, was formally approved by the Economic and Financial Affairs Council in November 2009, and is expected to be transposed into local regulations and take effect for supervisors from 2013, with implementation for firms currently anticipated from 2014. The new approach is based on the concept of three pillars – minimum capital requirements, supervisory review of firms’ assessments of risk, and enhanced disclosure requirements. Specifically, Pillar 1 covers the quantitative requirements around own funds, valuation rules for assets and liabilities and capital requirements. Pillar 2 provides the qualitative requirements for risk management, governance and controls, including the requirement for insurers to submit an Own Risk and Solvency Assessment (ORSA), which will be used by the regulator as part of the supervisory review process. Pillar 3 deals with the enhanced requirements for supervisory reporting and public disclosure. A key aspect of Solvency II is that the assessment of risks and capital requirements are intended to be aligned more closely with economic capital methodologies. Companies may be allowed to make use of internal economic capital models if approved by the local regulator. The European Parliament is currently discussing the Omnibus II Directive which, once approved, will amend certain aspects of the Solvency II Directive, including the implementation date as described above. The Omnibus II Directive is expected to be finalised during 2012. In addition, the European Commission is continuing to develop, in consultation with stakeholders including industry, detailed rules that complement the high-level principles in the Solvency II Directive, referred to as ‘implementing measures’. These are not expected to be finalised until later in 2012. Further guidance and technical standards are also currently being developed by the European Insurance and Occupational Pensions Authority (EIOPA). These are expected to be subject to a formal consultation and are unlikely to be finalised before early 2013. There remains significant uncertainty regarding the outcome from this process. In particular, the Solvency II rules relating to the determination of the liability discount rate and to the treatment of US business remain unclear, and Prudential’s capital position is sensitive to these outcomes. With reference to the liability discount rate, solutions to remove artificial volatility from the balance sheet have been suggested by policymakers as the regulations continue to evolve. These solutions, along with transitional arrangements for the treatment of US business, are continuing to be considered by the European Parliament as part of the process to reach agreement on the Omnibus II Directive. There is a risk that the effect of the final measures could be adverse for Prudential, including potentially that a significant increase in capital may be required to support its business, and that Prudential may be placed at a competitive disadvantage to other European and non-European financial services groups.
C: G
roup risk
man
agemen
t

220
Prudential plc Annual Report 2011
Financial statements | Notes on the Group financial statements
D: Life assurance business
D1: Group overview
a ProductsandclassificationforIFRSreportingThe measurement basis of assets and liabilities of long-term business contracts is dependent upon the classification of the contracts under IFRS. Under IFRS 4, contracts are initially classified as being either ‘insurance’ contracts, if the level of insurance risk in the contracts is significant, or ‘investment’ contracts, if the insurance risk is insignificant.
InsurancecontractsInsurance contracts are permitted to be accounted for under previously applied GAAP. The Group has chosen to adopt this approach. However, as an improvement to accounting policy, permitted by IFRS 4, the Group has applied the measurement principles for with-profits contracts of UK regulated entities and disclosures of the UK Standard FRS 27 from 1 January 2005. An explanation of the provisions under FRS 27 is provided in note D2. Under the previously applied GAAP, UK GAAP, the assets and liabilities of contracts are reported in accordance with the Modified Statutory Basis (MSB) of reporting as set out in the ABI SORP. The insurance contracts of the Group’s shareholder-backed businesses fall broadly into the following categories:
• UK insurance operations – bulk and individual annuity business, written primarily by Prudential Retirement Income Limited and other categories
of non-participating UK business;• Jackson
– fixed and variable annuity business and life insurance; and• Prudential Corporation Asia
– non-participating term, whole life, and unit-linked policies, together with accident and health policies.
InvestmentcontractsInvestment contracts are further delineated under IFRS 4 between those with and without discretionary participation features. For those contracts with discretionary participation features, IFRS 4 also permits the continued application of previously applied GAAP. The Group has adopted this approach, again subject to the FRS 27 improvement. For investment contracts that do not contain discretionary participation features, IAS 39 and, where the contract includes an investment management element, IAS 18, apply measurement principles to assets and liabilities attaching to the contract that may diverge from those previously applied. Contracts of the Group, which are classified as investment contracts that do not contain discretionary participation features, can be summarised as:
• UK – certain unit-linked savings and similar contracts,
• Jackson – GICs and funding agreements – minor amounts of ‘annuity certain’ contracts, and
• Prudential Corporation Asia – minor amounts for a number of small categories of business.
The accounting for the investment contracts of UK insurance operations and Jackson’s GICs and funding agreements are considered in turn below:
i Certain UK unit-linked savings and similar contractsDeferred acquisition costsAcquisition costs are deferred to the extent that it is appropriate to recognise an asset that represents the entity’s contractual right to benefit from providing investment management services and are amortised as the entity recognises the related revenue. IAS 18 further reduces the costs potentially capable of deferral to incremental costs only. Deferred acquisition costs are amortised to the income statement in line with service provision.
Deferred income reservesThese are required to be established under IAS 18 with amortisation over the expected life of the contract. The majority of the relevant UK contracts are single premium with the initial deferred income reflecting the ‘front-end load’ ie the difference between the premium paid and the amount credited to the unit fund. Deferred income is amortised to the income statement in line with service provision. The amortisation profile is either on a straight-line basis or, if more appropriate, a further deferral of income recognition is applied.

221F
ina
ncia
l statem
en
tsD:L
ifeassuran
cebusin
ess
Sterling reservesPrudent provisions established for possible future expenses not covered by future margins at a policy level reflecting the regulatory approach in the UK are not permitted for those contracts with insignificant insurance risk that are classified as investment contracts.
ii Jackson – GICs and funding arrangementsUnder a traditional GIC, the policyholder makes a lump sum deposit. The interest rate paid is fixed and established when the contract is issued. Funding agreements are of a similar nature but the interest rate may be floating, based on a rate linked to an external index. The US GAAP accounting requirements for such contracts are very similar to those under IFRS on the amortised cost model for liability measurement.
b Concentrationofriski BusinessacceptedThe Group’s exposure to life assurance risks is well diversified. This is achieved through the geographical spread of the Group’s operations and, within those operations, through a broad mix of product types. As part of the risk management framework, the Group regularly monitors concentration of risk using a variety of risk monitoring tools including common scenario testing and sensitivity analysis of the Group capital and profitability metrics involving IGD, Group economic capital, EEV and IFRS help identify concentrations of risks by risk types, products and business units, as well as the benefits of diversification of risks. An example of the diversification benefits for Prudential is that adverse scenarios do not affect all business units in the same way, providing natural hedges within the Group. For example, the Group’s US business is sensitive to increasing interest rates, whereas, in contrast, several business units in Asia benefit from increasing rates. Conversely, these Asian business units are sensitive towards low interest rates, whereas certain products in the US benefit from falling interest rates. The economic capital framework also takes into account situations where factors are correlated, for example, the extent of correlation between UK and US economies. Business units are also required to disclose to the Group risk function all material risks, along with information on their severity and likelihood, and mitigating actions taken or planned. Credit risk remains one of the largest risk exposures. This reflects the relative size of exposure in Jackson and the UK shareholder annuities business. The Group manages concentration of credit risks by setting limits on the maximum exposure to each counterparty based on their credit ratings.
ii CededbusinessThe Group cedes certain business to other insurance companies. Although the ceding of insurance does not relieve the Group of liability to its policyholders, the Group participates in such agreements for the purpose of managing its loss exposure. The Group evaluates the financial condition of its reinsurers and monitors concentration of credit risk from similar geographic regions, activities or economic characteristics of the reinsurers to minimise its exposure from reinsurer insolvencies. Reinsurance recoverable insurance assets are not a significant component of the Group’s statement of financial position and accordingly, exposure to concentrations of reinsurance risk is not significant to the Group. At 31 December 2011, 91 per cent (2010: 97 per cent) of the reinsurance recoverable insurance assets were ceded by the Group’s UK and US operations, of which 94 per cent (2010: 90 per cent) of the balance were from reinsurers with Standard & Poor’s rating A- and above.
c GuaranteesNotes D2(e), D3(e) and D4(e) provide details of guarantee features of the Group’s life assurance products. In the UK, guarantees of the with-profits products are valued for accounting purposes on a market consistent basis for 2011 as described in section D2(g)(ii). The UK business also has products with guaranteed annuity option features, mostly within the Scottish Amicable Insurance Fund (SAIF), as described in section D2(e). There is little exposure to financial options and guarantees in the shareholder-backed business of the UK operations. The US business annuity products have a variety of option and guarantee features as described in section D3(e). Jackson’s derivative programme seeks to manage the exposures as described in section D3(f).
d SensitivityofEEVbasisshareholders’profitandequityformarketandotherrisksThe Group prepares supplementary EEV basis financial statements for half-yearly and annual publication. These statements include sensitivity disclosures which are part of the market risk information provided to key management. The 2011 EEV sensitivity disclosures are shown in note 16 of the EEV basis supplementary information in this Annual Report.

222
Prudential plc Annual Report 2011
D: Life assurance business continued
Financial statements | Notes on the Group financial statements
D1: Group overview continued
e SensitivityofIFRSbasisprofitorlossandshareholders’equitytomarketandotherrisksi OverviewofrisksbybusinessunitThe financial and insurance assets and liabilities attaching to the Group’s life assurance business are, to varying degrees, subject to market and insurance risk and other changes of experience assumptions that may have a material effect on IFRS basis profit or loss and shareholders’ equity. Market risk is the risk that the fair value or future cash flows of a financial instrument or, in the case of liabilities of insurance contracts, their carrying value will fluctuate because of changes in market prices. Market risk comprises three types of risk, namely:
• Currency risk: due to changes in foreign exchange rates;• Interest rate risk: due to changes in market interest rates; and• Other price risk: due to fluctuations in market prices (other than those arising from interest rate risk or currency risk).
Policyholder liabilities relating to the Group’s life assurance businesses are also sensitive to the effects of other changes in experience, or expected future experience, such as for mortality, other insurance risk and lapse risk.
Three key points are to be noted, namely:
• The Group’s with-profit and unit-linked funds absorb most market risk attaching to the funds’ investments. Except for second order effects, for example, on asset management fees and shareholders’ share of cost of bonuses for with-profits business, shareholder results are not directly affected by market value movements on the assets of these funds;
• The Group’s shareholder results are most sensitive to market risks for assets of the shareholder-backed business; and• The main exposures of the Group’s IFRS basis results to market risk for its life assurance operations on investments of the
shareholder-backed business are for debt securities.
The most significant items for which the IFRS basis shareholders’ profit or loss and shareholders’ equity for the Group’s life assurance business is sensitive to these variables are shown in the following tables. The distinction between direct and indirect exposure is not intended to indicate the relative size of the sensitivity.
Marketandcreditrisk Insuranceandlapserisk
Typeofbusiness Investments/derivatives Liabilities/unallocatedsurplus Otherexposure
UKinsuranceoperations(seealsosectionD2(j))
With-profits business (including Prudential Annuities Limited)
Net neutral direct exposure (Indirect exposure only) Investment performance subject to smoothing through declared bonuses
Persistency risk to future shareholder transfers
SAIF sub-fund Net neutral direct exposure (Indirect exposure only) Asset management fees earned by M&G
Unit-linked business Net neutral direct exposure (Indirect exposure only) Investment performance through asset management fees
Persistency risk
Asset/liability mismatch risk
Shareholder-backed annuity business
Credit risk for assets covering liabilities and shareholder capital
Interest rate risk for assets in excess of liabilities ie assets representing shareholder capital
Mortality experience and assumptions for longevity

223F
ina
ncia
l statem
en
tsD: L
ife assuran
ce busin
ess
Marketandcreditrisk Insuranceandlapserisk
Typeofbusiness Investments/derivatives Liabilities/unallocatedsurplus Otherexposure
USinsuranceoperations(seealsosectionD3(j))
All business Currency risk Persistency risk
Variable annuity business Net effect of market risk arising from incidence of guarantee features and variability of asset management fees offset by derivative hedging programme
Fixed indexed annuity business
Derivative hedge programme to the extent not fully hedged against liability and fund performance
Incidence of equity participation features
Fixed indexed annuities, Fixed annuities and GIC business
Credit riskInterest rate risk
Spread differencebetween earnedrate and ratecreditedto policyholders
Lapse risk, but the effects of extreme events are mitigated by the application of market value adjustments and by the use of swaption contracts
Profit and loss and shareholders’ equity are volatile for these risks as they affect the values of derivatives and embedded derivatives and impairment losses. In addition, shareholders’ equity is volatile for the incidence of these risks on unrealised appreciation of fixed income securities classified as available-for-sale under IAS 39
Asianinsuranceoperations(seealsosectionD4(j))
All business Currency risk Mortality and morbidity risk Persistency risk
With-profits business Net neutral direct exposure (Indirect exposure only) Investment performance subject to smoothing through declared bonuses
Unit-linked business Net neutral direct exposure (Indirect exposure only) Investment performance through asset management fees
Non-participating business
Interest rate and price risk Interest rates for those operations where the basis of insurance liabilities is sensitive to current market movements .

224
Prudential plc Annual Report 2011
D: Life assurance business continued
Financial statements | Notes on the Group financial statements
D1: Group overview continued
ii IFRSshareholderresults–ExposuresformarketandotherriskKey Group exposuresDetailed analyses of sensitivity of IFRS basis profit or loss and shareholders’ equity to key market and other risks are provided in notes D2(j), D3(j), D4(j) and E4. The sensitivity analyses provided show the effect on profit or loss and shareholders’ equity to changes in the relevant risk variables, all of which are reasonably possible at the relevant balance sheet date. In the analysis of exposure to interest rate risk, given the low interest rate environment, certain of the sensitivities to a decrease of 2 per cent include the effect of reducing the rate to near zero where rates are lower than 2 per cent. The IFRS operating profit based on longer-term investment returns for UK insurance operations has high potential sensitivity for changes to longevity assumptions affecting the carrying value of liabilities to policyholders for UK shareholder-backed annuity business. In addition, at the total IFRS profit level the result is particularly sensitive to temporary value movements on assets backing US and Asia policyholder liabilities (which in general are measured on a basis that is insensitive to current market movements) and shareholder equity. For Jackson at the level of operating profit based on longer-term investment returns, the results are sensitive to market conditions to the extent of income earned on spread-based products and second order equity-based exposure in respect of variable annuity asset management fees. Further information is given below under the US insurance operations section of market and credit risk. Jackson’s derivative programme is used to manage interest rate risk associated with a broad range of products and substantially mitigate equity market risk attaching to its equity-based products. Movements in equity markets, interest rates and credit spreads materially affect the carrying value of derivatives which are used to manage the liabilities to policyholders and backing investment assets. Combined with the use of US GAAP measurement (as ‘grandfathered’ under IFRS 4) for the insurance contracts assets and liabilities which is largely insensitive to current period market movements, the Jackson total profit (ie including short-term fluctuations in investment returns) is very sensitive to market movements. In addition to these effects the Jackson IFRS shareholders’ equity is sensitive to the impact of interest rate and credit spread movements on the value of fixed income securities. Movements in unrealised appreciation on these securities are included as movement in shareholders’ equity (ie outside the income statement). See D3(j) for details of the hedging. For Asian operations, the operating profit based on longer-term investment returns is mainly affected by the impact of market levels on unit-linked business persistency, and other insurance risk. At the total IFRS profit level the Asian result is affected by short-term value movements on the asset portfolio for non-linked shareholder-backed business. M&G profits are affected primarily by movements in the growth in funds under management and by the effect of any impairments on the loan book and fair value movements on debt securities held by Prudential Capital. In addition, total profits and shareholders’ equity are sensitive to market value movements and centrally held swaps. These are used to manage foreign currency and other macroeconomic exposures.
Marketandcreditriska UK insurance operations(i) With-profits businessUK business of PAC with-profits fundShareholder results of UK with-profits business are sensitive to market risk only through the indirect effect of investment performance on declared policyholder bonuses. The investment assets of the PAC with-profits fund are subject to market risk. However, changes in their carrying value, net of related changes to asset-share liabilities of with-profit contracts, affect the level of unallocated surplus of the fund. As unallocated surplus is accounted for as a liability under IFRS, movements in its value do not affect shareholders’ profit or equity. The shareholder results of the UK with-profits fund correspond to the shareholders’ share of the cost of bonuses declared on the with-profits business. This currently corresponds to one-ninth of the cost of bonuses declared. Investment performance is a key driver of bonuses, and hence the shareholders’ share of cost of bonuses. Due to the ‘smoothed’ basis of bonus declaration the sensitivity to investment performance in a single year is low relative to the movements in the period to period performance. However, over multiple periods it is important.
Prudential Annuities Limited (PAL)PAL writes annuity business. However, as PAL is owned by the PAC with-profits sub-fund, changes in the carrying value of PAL’s assets and liabilities are reflected in the liability for unallocated surplus which as described above, do not affect shareholder results.
Scottish Amicable Insurance Fund (SAIF)SAIF is a ring-fenced fund in which, apart from asset management fees, shareholders have no interest. Accordingly, the Group’s IFRS profit and equity are insensitive to the direct effects of market risk attaching to SAIF’s assets and liabilities.

225F
ina
ncia
l statem
en
tsD: L
ife assuran
ce busin
ess
(ii) Shareholder-backed businessThe factors that may significantly affect the IFRS results of UK shareholder-backed business are the mortality experience and assumptions, and credit risk attaching to the annuity business of Prudential Retirement Income Limited and the PAC non-profit sub-fund. The sensitivity to market risk for the main constituents elements of the shareholder-backed business of the UK insurance operations is as follows:
Prudential Retirement Income Limited (PRIL)The assets covering PRIL’s liabilities are principally debt securities and other investments that are held to match the expected duration and payment characteristics of the policyholder liabilities. These liabilities are valued for IFRS reporting purposes by applying discount rates that reflect the market rates of return attaching to the covering assets. Except to the extent of any asset/liability duration mismatch which is reviewed regularly, and exposure to credit risk, the sensitivity of the Group’s results to market risk for movements in the carrying value of PRIL’s liabilities and covering assets is broadly neutral on a net basis. The main market risk sensitivity for PRIL arises from interest rate risk on the debt securities which substantially represent shareholders’ equity. This shareholders’ equity comprises the net assets held within the long-term fund of the company that cover regulatory basis liabilities that are not recognised for IFRS reporting purposes, for example contingency reserves, and shareholder capital held outside the long-term fund. The principal items affecting the IFRS results for PRIL are mortality experience and assumptions, and credit risk.
PAC non-profit sub-fundThe PAC non-profit sub-fund principally comprises annuity business previously written by Scottish Amicable Life, unit-linked and other non-participating business. The financial assets covering the liabilities for those types of business are subject to market risk. However, for the annuity business the same considerations as described above for PRIL apply, whilst the liabilities of the unit-linked business change in line with the matching linked assets. Other liabilities of the PAC non-profit sub-fund are broadly insensitive to market risk.
Other shareholder-backed unit-linked businessDue to the matching of policyholder liabilities to attaching asset value movements the UK unit-linked business is not directly affected by market or credit risk. The principal factor affecting the IFRS results is investment performance through asset management fees.
b US insurance operations (Jackson)The IFRS basis results of Jackson are highly sensitive to market risk on the assets covering liabilities other than variable annuity business segregated in the separate accounts. Invested assets covering liabilities (other than the separate accounts) and related capital comprise principally debt securities classified as available-for-sale. Value movements for these securities are reflected as movements in shareholders’ equity through the statement of comprehensive income. Other invested assets and derivatives are carried at fair value with the value movements reflected in the income statement. By contrast, the IFRS insurance liabilities for business written by Jackson, by the application of ‘grandfathered’ GAAP under IFRS 4, are measured on US GAAP bases which, with the exception of certain items covered by the equity hedging programme, are generally insensitive to temporary changes in market conditions or the short-term returns on the attaching asset portfolios. These differences in carrying value of debt securities, other invested assets, derivatives and insurance liabilities give rise to potentially significant volatility in the IFRS income statement and shareholders’ equity. As with other shareholder-backed business the profit or loss for Jackson is presented by distinguishing the result for the year between an operating result based on longer-term investment returns and short-term fluctuations in investment returns. In this way the most significant direct effect of market changes that have taken place to the Jackson result are separately identified. Excluding these short-term effects, the factors that most significantly affect the Jackson IFRS operating result based on long-term investment returns are:
• Variable annuity business – effect of market risk arising from the variability of asset management fees,• Fixed annuity and fixed index annuity business – the spread differential between the earned rate and the rate credited
to policyholders, and• Amortisation of deferred acquisition costs.

226
Prudential plc Annual Report 2011
D: Life assurance business continued
Financial statements | Notes on the Group financial statements
D1: Group overview continued
c Asian insurance operationsFor Asian with-profits business the same features apply as described above for UK with-profits business. Similarly, as for other parts of the Group, for unit-linked business the main factor affecting IFRS basis results is investment performance through asset management fees. The sensitivity of the IFRS basis results of the Group’s Asian operations to market risk is primarily restricted to the non-participating business. This sensitivity is primarily reflected through the volatility of asset returns coupled with the fact that the accounting carrying value of liabilities to policyholders are only partially sensitive to changed market conditions. As for UK shareholder-backed operations and Jackson, the IFRS profit is distinguished in the Group’s segmental analysis so as to distinguish operating profits based on longer-term investment return and short-term fluctuations in investment returns.
InsuranceandlapseriskThe features described above cover the main sensitivities of IFRS profit and loss and equity for market and credit risk. Lapse and longevity risk may also be a key determination of IFRS basis results with variable impacts. In the UK, adverse persistency experience can affect the level of profitability from with-profits and unit-linked business. For with-profits business in any given year, the amount represented by the shareholders’ share of cost of bonus may only be marginally affected. However, altered persistency trends may affect future expected shareholder transfers. By contrast, Group IFRS operating profit is particularly sensitive to longevity outlook that results in changes of assumption for the UK shareholder-backed annuity business. Jackson is sensitive to lapse risk. However, Jackson uses swaption derivatives to ameliorate the effect of a sharp rise in interest rates, which would be the most likely cause of a sudden change in policyholder behaviour. In Asia, adverse persistency experience can impact the IFRS profitability of certain business written in the region. This risk is managed at a business unit level through monthly monitoring of experience and the implementation of management actions as necessary. These actions could include product enhancements, increased management focus on premium collection as well as other customer retention efforts. The potential financial impact of lapses is often mitigated through the specific features of the products, eg surrender charges.
ImpactofdiversificationonriskexposureThe Group enjoys significant diversification benefits. This arises because not all risk scenarios will happen at the same time and across all geographic regions. The Group tests the sensitivities of results to different correlation factors such as:
Correlation across geographic regions• financial risk factors• non-financial risk factors
Correlation across risk factors• longevity risk• expenses• persistency• other risks
The effect of Group diversification is to significantly reduce the aggregate standalone volatility risk to IFRS operating profit based on longer-term investment returns. The effect is almost wholly explained by the correlations across risk types, in particular longevity risk.
f DurationofliabilitiesUnder the terms of the Group’s contracts, as for life assurance contracts generally, the contractual maturity date is the earlier of the end of the contract term, death, other insurable events or surrender. The Group has therefore chosen to provide details of liability duration that reflect the actuarially determined best estimate of the likely incidence of these factors on contract duration. Details are shown in sections D2(k), D3(k) and D4(k). In the years 2007 to 2011, claims paid on the Group’s life assurance contracts including those classified as investment contracts under IFRS 4 ranged from £17 billion to £19 billion. Indicatively, it is to be expected that, of the Group’s policyholder liabilities (excluding unallocated surplus) at 31 December 2011 of £227.1 billion, the amounts likely to be paid in 2012 will be of a similar magnitude.

227F
ina
ncia
l statem
en
tsD: L
ife assuran
ce busin
ess
D2: UK insurance operations
a SummarystatementoffinancialpositionIn order to show the statement of financial position by reference to the differing degrees of policyholder and shareholder economic interest of the different types of fund and business, the analysis below is structured to show separately assets and liabilities of the SAIF, the PAC with-profits sub-fund (WPSF), unit-linked assets and liabilities and annuity (principally PRIL) and other long-term business. £92.6 billion of the £142.4 billion of investments are held by SAIF and the PAC WPSF. Shareholders are exposed only indirectly to value movements on these assets.
PACwith-profitssub-fund note (i) Otherfundsandsubsidiaries
Byoperatingsegment
ScottishAmicableInsurance
Fundnote (ii)
£m
ExcludingPrudentialAnnuitiesLimited
£m
PrudentialAnnuitiesLimitednote (iii)
£m
Totalnote (iv)
£m
Unit-linkedassets
andliabilities
£m
Annuityandotherlong-termbusiness
£m
Total
£m
2011Total
£m
2010Total
£m
AssetsIntangible assets attributable to
shareholders: Deferred acquisition costs and other
intangible assets – – – – – 113 113 113 120
Total – – – – – 113 113 113 120
Intangible assets attributable to with-profits funds:
In respect of acquired subsidiaries for venture fund and other investment
purposes – 178 – 178 – – – 178 166 Deferred acquisition costs – 6 – 6 – – – 6 13
Total – 184 – 184 – – – 184 179
Total intangible assets – 184 – 184 – 113 113 297 299
Deferred tax assets – 99 2 101 – 130 130 231 214 Other non-investment and
non-cash assets 413 1,799 107 1,906 364 2,088 2,452 4,771 4,631 Investment of long-term business and
other operations: Investment propertiesnote (viii) 571 7,164 726 7,890 682 1,569 2,251 10,712 11,212 Investments accounted for using
the equity method – – – – – 70 70 70 69 Financial investments: Loans note (v) 143 1,752 78 1,830 – 1,142 1,142 3,115 2,302 Equity securities and portfolio
holdings in unit trusts 2,448 20,685 170 20,855 13,394 25 13,419 36,722 40,519 Debt securities 4,349 37,696 5,633 43,329 6,115 24,160 30,275 77,953 74,304 Other investmentsnote (vi) 281 3,550 306 3,856 87 344 431 4,568 3,998 Deposits 693 6,155 236 6,391 966 1,237 2,203 9,287 9,022
Total investments 8,485 77,002 7,149 84,151 21,244 28,547 49,791 142,427 141,426
Properties held for sale – – – – – – – – 254 Cash and cash equivalents 112 1,636 191 1,827 666 360 1,026 2,965 2,839
Totalassets 9,010 80,720 7,449 88,169 22,274 31,238 53,512 150,691 149,663

228
Prudential plc Annual Report 2011
D: Life assurance business continued
Financial statements | Notes on the Group financial statements
D2: UK insurance operations continued
PACwith-profitssub-fund note (i) Otherfundsandsubsidiaries
ScottishAmicableInsurance
Fundnote (ii)
£m
ExcludingPrudentialAnnuitiesLimited
£m
PrudentialAnnuitiesLimitednote (iii)
£m
Totalnote (iv)
£m
Unit-linkedassets
andliabilities
£m
Annuityandotherlong-termbusiness
£mTotal
£m
2011GroupTotal
£m
2010GroupTotal
£m
EquityandliabilitiesEquity Shareholders’ equity – – – – – 2,581 2,581 2,581 2,148 Non-controlling interests – 33 – 33 – – – 33 35
Total equity – 33 – 33 – 2,581 2,581 2,614 2,183
Liabilities Policyholder liabilities and unallocated
surplus of with-profits funds: Contract liabilities (including amounts in respect of contracts classified as
investment contracts under IFRS 4) 8,555 67,098 5,323 72,421 21,281 24,767 46,048 127,024 125,530 Unallocated surplus of with-profits funds (reflecting application of
‘realistic’ basis provisions for UK regulated with-profits funds) note (vii) – 7,743 1,422 9,165 – – – 9,165 10,187
Total 8,555 74,841 6,745 81,586 21,281 24,767 46,048 136,189 135,717
Operational borrowings attributable to shareholder-financed operations – – – – 1 102 103 103 162
Borrowings attributable to with-profits funds 17 955 – 955 – – – 972 1,522
Deferred tax liabilities 41 691 135 826 – 482 482 1,349 1,738 Other non-insurance liabilities 397 4,200 569 4,769 992 3,306 4,298 9,464 8,341
Total liabilities 9,010 80,687 7,449 88,136 22,274 28,657 50,931 148,077 147,480
Totalequityandliabilities 9,010 80,720 7,449 88,169 22,274 31,238 53,512 150,691 149,663
Notes(i) For the purposes of this table and subsequent explanation, references to the WPSF also include, for convenience, the amounts attaching to the
Defined Charges Participating Sub-fund, which comprises 3.4 per cent of the total assets of the WPSF and includes the with-profits annuity business transferred to Prudential from the Equitable Life Assurance Society on 1 December 2007 (with assets of approximately £1.7 billion). Profits to shareholders on this with-profits annuity business emerge on a ‘charges less expenses’ basis and policyholders are entitled to 100 per cent of the investment earnings.
(ii) SAIF is a separate sub-fund within the PAC long-term business fund.(iii) Wholly-owned subsidiary of the PAC WPSF that writes annuity business. The closing liabilities are significantly lower than in 2010 due to
a recapture of business by the PAC WPSF.(iv) Excluding policyholder liabilities of the Hong Kong branch of PAC.

229F
ina
ncia
l statem
en
tsD: L
ife assuran
ce busin
ess
(v) UK Insurance operations The loans of the Group’s UK insurance operations comprise:
2011 £m 2010 £m
SAIF and PAC WPSF Mortgage loans* 1,036 256 Policy loans 20 21 Other loans† 917 993
Total SAIF and PAC WPSF loans 1,973 1,270
Shareholder-backed Mortgage loans* 1,137 1,027 Other loans 5 5
Total shareholder-backed loans 1,142 1,032
Total UK insurance operations loans 3,115 2,302
* The mortgage loans are collateralised by properties. By carrying value, 96 per cent of the £1,137 million held for shareholder-backed business relates to lifetime (equity release) mortgage business which has an average loan to property value of 27 per cent.
† Other loans held by the PAC WPSF are all commercial loans and comprise mainly syndicated loans.(vi) Other investments comprise:
2011 £m 2010 £m
Derivative assets* 1,461 926 Partnerships in investment pools and other† 3,107 3,072
4,568 3,998
* In the UK, Prudential uses derivatives to reduce equity and credit risk, interest rate and currency exposures, and to facilitate efficient portfolio management. After derivative liabilities of £1,298 million (2010: £792 million), which are also included in the statement of financial position, the overall derivative position was a net asset of £163 million (2010: £134 million).
† Partnerships in investment pools and other comprise mainly investments held by the PAC with-profits fund. These investments are primarily investments in limited partnerships and additionally, investments in property funds.
(vii) Unallocated surplus of with-profits funds Prudential’s long-term business written in the UK comprises predominantly life insurance policies under which the policyholders are entitled
to participate in the returns of the funds supporting these policies. Business similar to this type is also written in certain of the Group’s Asian operations, subject to local market and regulatory conditions. Such policies are called with-profits policies. Prudential maintains with-profits funds within the Group’s long-term business funds, which segregate the assets and liabilities and accumulate the returns related to that with-profits business. The amounts accumulated in these with-profits funds are available to provide for future policyholder benefit provisions and for bonuses to be distributed to with-profits policyholders. The bonuses, both annual and final, reflect the right of the with-profits policyholders to participate in the financial performance of the with-profits funds. Shareholders’ profits with respect to bonuses declared on with-profits business correspond to the shareholders’ share of the cost of bonuses as declared by the Board of Directors. The shareholders’ share currently represents one-ninth of the cost of bonuses declared for with-profits policies.
The unallocated surplus represents the excess of assets over policyholder liabilities for the Group’s with-profits funds. As allowed under IFRS 4, the Group has opted to continue to record unallocated surplus of with-profits funds wholly as a liability. The annual excess (shortfall) of income over expenditure of the with-profits funds, after declaration and attribution of the cost of bonuses to policyholders and shareholders, is transferred to (from) the unallocated surplus each year through a (charge) credit to the income statement. The balance retained in the unallocated surplus represents cumulative income arising on the with-profits business that has not been allocated to policyholders or shareholders. The balance of the unallocated surplus is determined after full provision for deferred tax on unrealised appreciation of investments.
(viii) Investment properties At 31 December 2011, the Group’s UK insurance operations had £10,712 million (2010: £11,212 million) of investment properties. The following
table shows the property portfolio by type of investment. The properties are shown at market value below in accordance with the policies described in note A4.
2011 2010
£m % £m %
Office buildings 4,443 41.5 4,617 41.2 Shopping centres/commercial 4,315 40.3 3,777 33.7 Retail warehouses/industrial 1,406 13.1 2,184 19.5 Development 383 3.6 402 3.6 Other 165 1.5 232 2.0
Total 10,712 100.0 11,212 100.0
Approximately 42.9 per cent (2010: 46.2 per cent) of the UK-held investment property is located in London and south east England including Buckinghamshire, Berkshire, East and West Sussex, Hampshire, Isle of Wight, Kent, Oxfordshire and Surrey, with 41.1 per cent (2010: 36.7 per cent) located throughout the rest of the UK and the remaining 16.0 per cent (2010: 17.1 per cent) located overseas.

230
Prudential plc Annual Report 2011
D: Life assurance business continued
Financial statements | Notes on the Group financial statements
D2: UK insurance operations continued
b ReconciliationofmovementininvestmentsA reconciliation of the total investments of UK insurance operations from the beginning of the year to the end of the year is as follows:
PACwith-profitssub-fundOtherfundsandsubsidiaries
ScottishAmicableInsurance
Fund£m
ExcludingPrudentialAnnuitiesLimited
£m
PrudentialAnnuitiesLimited
£mTotal
£m
Unit-linkedassets
andliabilities
£m
Annuityandotherlong-termbusiness
£m
UKinsuranceoperations
Total£m
At1January2010 Total investments (including derivative assets) 9,848 67,832 13,794 81,626 18,421 22,795 132,690 Less: Investments held by consolidated investment funds – (1,050) (19) (1,069) (729) (37) (1,835) Less: Derivative liabilities (37) (317) (166) (483) – (189) (709)
Directly held investments, net of derivative liabilities 9,811 66,465 13,609 80,074 17,692 22,569 130,146
Net cash (outflow) inflow from operating activities (762) (838) (21) (859) 1,000 1,950 1,329 Realised gains in the year 368 1,502 73 1,575 267 23 2,233 Unrealised gains and losses and exchange movements
in the year 249 2,963 608 3,571 1,131 1,007 5,958 Reclassification of property under development – – – – – 56 56
Movement in the year of directly held investments, net of derivative liabilities (145) 3,627 660 4,287 2,398 3,036 9,576
At31December2010/1January2011 Total investments (including derivative assets) 9,704 70,576 14,496 85,072 20,795 25,855 141,426 Less: Investments held by consolidated investment funds – (140) (22) (162) (705) (45) (912) Less: Derivative liabilitiesG3 (38) (344) (205) (549) – (205) (792)
Directly held investments, net of derivative liabilities 9,666 70,092 14,269 84,361 20,090 25,605 139,722
Net cash (outflow) inflow from operating activities (1,154) 6,746 (8,184) (1,438) 638 1,034 (920)Realised gains in the year 349 2,047 785 2,832 607 64 3,852 Unrealised gains and losses and exchange movements
in the year (448) (2,606) (12) (2,618) (888) 1,452 (2,502)
Movement in the year of directly held investments, net of derivative liabilities (1,253) 6,187 (7,411) (1,224) 357 2,550 430
At31December2011 Total investments (including derivative assets) 8,485 77,002 7,149 84,151 21,244 28,547 142,427 Less: Investments held by consolidated investment funds – (52) (23) (75) (793) (109) (977) Less: Derivative liabilities G3 (72) (671) (268) (939) (4) (283) (1,298)
Directly held investments, net of derivative liabilities 8,413 76,279 6,858 83,137 20,447 28,155 140,152

231F
ina
ncia
l statem
en
tsD: L
ife assuran
ce busin
ess
c Reconciliationofmovementinpolicyholderliabilitiesandunallocatedsurplusofwith-profitsfundsA reconciliation of the total policyholder liabilities and unallocated surplus of with-profits funds of UK insurance operations from the beginning of the year to the end of the year is as follows:
Othershareholder-backedfundsandsubsidiaries
SAIFandPACwith-profits
sub-fund£m
Unit-linkedliabilities
£m
Annuityandotherlong-termbusiness
£mTotal
£m
At1January2010 87,495 19,035 19,665 126,195 Comprising: –Policyholderliabilities 77,529 19,035 19,665 116,229 –Unallocatedsurplusofwith-profitsfunds 9,966 – – 9,966
Premiums 3,311 2,301 2,278 7,890 Surrenders (2,453) (1,272) (54) (3,779)Maturities/Deaths (5,079) (726) (1,498) (7,303)
Net flowsnote (a) (4,221) 303 726 (3,192)Shareholders’ transfers post-tax (223) – – (223)Switches (236) 236 – – Investment-related items and other movementsnote (b) 9,165 2,097 1,910 13,172 Dilution of Group’s holdings – – (27) (27)Foreign exchange translation differences (207) – (1) (208)
At31December2010/1January2011 91,773 21,671 22,273 135,717
Comprising: –Policyholderliabilities 81,586 21,671 22,273 125,530 –Unallocatedsurplusofwith-profitsfunds 10,187 – – 10,187
Premiums 3,413 1,854 1,721 6,988 Surrenders (2,285) (1,851) (119) (4,255)Maturities/Deaths (5,551) (655) (1,607) (7,813)
Net flowsnote (a) (4,423) (652) (5) (5,080)Shareholders’ transfers post-tax (216) – – (216)Switches (237) 237 – – Investment-related items and other movementsnote (b) 3,338 25 2,499 5,862 Foreign exchange translation differences (94) – – (94)
At31December2011 90,141 21,281 24,767 136,189
Comprising: –Policyholderliabilities 80,976 21,281 24,767 127,024 –Unallocatedsurplusofwith-profitsfunds 9,165 – – 9,165
Average policyholder liability balances* 2011 81,281 21,476 23,520 126,277
2010 79,558 20,353 20,969 120,880
* Excluding the unallocated surplus of the with-profits funds and as adjusted for corporate transactions in the period.
Notes(a) Net outflows increased from £3,192 million in 2010 to £5,080 million in 2011, principally as a result of stock transfer activity within the unit-linked
business (2011 saw a large transfer out, while 2010 benefited from a large transfer in) and a lower level of bulk annuity transactions in 2011. (b) Investment-related items and other movements of £5,862 million was lower than the £13,172 million benefit seen in 2010 principally as a result
of weaker performance of UK equity markets in 2011.

232
Prudential plc Annual Report 2011
D: Life assurance business continued
Financial statements | Notes on the Group financial statements
D2: UK insurance operations continued
d InformationoncreditriskofdebtsecuritiesThe following table summarises by rating the securities held by UK insurance operations as at 31 December 2011 and 2010:
(i) UK insurance operations
PACwith-profitssub-fund OtherfundsandsubsidiariesUKinsuranceoperations
ScottishAmicableInsurance
Fund£m
ExcludingPrudentialAnnuitiesLimited
£m
PrudentialAnnuitiesLimited
£mTotal
£m
Unit-linkedassets
£mPRIL
£m
Otherannuity
andlong-termbusiness
£m
2011Total
£m
2010Total
£m
S&P – AAA 578 4,292 585 4,877 699 3,302 472 9,928 18,833 S&P – AA+ to AA- 554 3,323 645 3,968 792 3,008 325 8,647 6,885 S&P – A+ to A- 1,104 10,257 1,318 11,575 1,444 6,525 826 21,474 21,508 S&P – BBB+ to BBB- 1,014 9,551 541 10,092 917 3,186 537 15,746 12,848 S&P – Other 311 2,461 62 2,523 142 174 25 3,175 3,403
3,561 29,884 3,151 33,035 3,994 16,195 2,185 58,970 63,477
Moody’s – Aaa 263 2,350 1,169 3,519 1,411 2,153 599 7,945 765 Moody’s – Aa1 to Aa3 26 180 33 213 88 269 55 651 360 Moody’s – A1 to A3 41 456 125 581 51 290 45 1,008 632 Moody’s – Baa1 to Baa3 56 516 109 625 74 236 39 1,030 949 Moody’s – Other 16 152 6 158 37 24 7 242 233
402 3,654 1,442 5,096 1,661 2,972 745 10,876 2,939
Fitch 20 185 80 265 26 163 18 492 630 Other 366 3,973 960 4,933 434 1,776 106 7,615 7,258
Total UK debt securities 4,349 37,696 5,633 43,329 6,115 21,106 3,054 77,953 74,304
Where no external ratings are available, internal ratings produced by the Group’s asset management operation, which are prepared on the Company’s assessment of a comparable basis to external ratings, are used where possible. The £7,615 million total debt securities held at 31 December 2011 (2010: £7,258 million) which are not externally rated are either internally rated or unrated. These are analysed as follows:
2011 £m 2010£m
Internal ratings or unrated: AAA to A- 2,726 2,210 BBB to B- 3,773 3,861 Below B- or unrated 1,116 1,187
Total 7,615 7,258
The majority of unrated debt security investments were held in SAIF and the PAC with-profits fund and relate to convertible debt and other investments which are not covered by ratings analysts nor have an internal rating attributed to them. Of the £1,882 million PRIL and other annuity and long-term business investments which are not externally rated, £9 million were internally rated AAA, £114 million AA, £590 million A, £887 million BBB, £92 million BB and £190 million were internally rated B+ and below or unrated. During the year Standard and Poor’s withdrew its ratings of debt securities issued by a number of Sovereigns. Where these are no longer available Moody’s ratings have been used. This primarily impacts the UK and Asia insurance operations. As detailed in note D2(j) below, the primary sensitivity of IFRS basis profit or loss and shareholders’ equity relates to non-linked shareholder-backed business which covers ‘PRIL’ and ‘other annuity and long-term business’ in the table above.

233F
ina
ncia
l statem
en
tsD: L
ife assuran
ce busin
ess
e ProductsandguaranteesPrudential’s long-term products in the UK consist of life insurance, pension products and pension annuities. These products are written primarily in:
• One of three separate sub-funds of the PAC long-term fund, namely the with-profits sub-fund, SAIF, and the non-profit sub-fund;• Prudential Annuities Limited, which is owned by the PAC with-profits sub-fund;• Prudential Retirement Income Limited, a shareholder-owned subsidiary; or• Other shareholder-backed subsidiaries writing mainly non-profit unit-linked business.
i With-profitsproductsandPACwith-profitssub-fundWithin the statement of financial position of UK insurance operations at 31 December 2011, as shown in note D2(a), there are policyholder liabilities and unallocated surplus of £81.6 billion (2010: £82.0 billion) that relate to the WPSF. These amounts include the liabilities and capital of Prudential Annuities Limited, a wholly-owned subsidiary of the fund. The WPSF mainly contains with-profits business but it also contains some non-profit business (unit-linked, term assurances and annuities). The WPSF’s profits are apportioned 90 per cent to its policyholders and 10 per cent to shareholders as surplus for distribution is determined via the annual actuarial valuation. The WPSF held a provision of £90 million at 31 December 2011 (2010: £24 million) to honour guarantees on a small amount of guaranteed annuity products. SAIF’s exposure to guaranteed annuities is described below. Beyond the generic guarantees described above, there are very few explicit options or guarantees such as minimum investment returns, surrender values or annuities at retirement and any granted have generally been at very low levels. With-profits products provide returns to policyholders through bonuses that are ‘smoothed’. There are two types of bonuses: ‘annual’ and ‘final’. Annual bonuses are declared once a year and, once credited, are guaranteed in accordance with the terms of the particular product. Unlike annual bonuses, final bonuses are guaranteed only until the next bonus declaration. The main factors that influence the determination of bonus rates are the return on the investments of the with-profits fund, inflation, taxation, the expenses of the fund chargeable to policyholders and the degree to which investment returns are smoothed. The overall rate of return earned on investments and the expectation of future investment returns are the most important influences on bonus rates. A high proportion of the assets backing the with-profits business are invested in equities and real estate. If the financial strength of the with-profits business is affected, then a higher proportion of fixed interest or similar assets might be held by the fund. Further details on the determination of the two types of the bonuses: ‘regular’ and ‘final’, the application of significant judgement, key assumptions and the degree of smoothing of investment returns in determining the bonus rates are provided below.
Regular bonus ratesFor regular bonuses, the bonus rates are determined for each type of policy primarily by targeting the bonus level at a prudent proportion of the long-term expected future investment return on underlying assets. The expected future investment return is reduced as appropriate for each type of policy to allow for items such as expenses, charges, tax and shareholders’ transfers. However, the rates declared may differ by product type or by the date of payment of the premium or date of issue of the policy or if the accumulated annual bonuses are particularly high or low relative to a prudent proportion of the achieved investment return. When target bonus levels change the PAC Board of Directors (PAC Board) has regard to the overall strength of the long-term fund when determining the length of time over which it will seek to achieve the amended prudent target bonus level. In normal investment conditions, PAC expects changes in regular bonus rates to be gradual over time, and these are not expected to exceed 1 per cent per annum over any year. However, the PAC Directors retain the discretion whether or not to declare a regular bonus each year, and there is no limit on the amount by which regular bonus rates can change.
Final bonus ratesA final bonus, which is normally declared yearly, may be added when a claim is paid or when units of a unitised product are realised. The rates of final bonus usually vary by type of policy and by reference to the period, usually a year, in which the policy commences or each premium is paid. These rates are determined by reference to the asset shares for the sample policies but subject to the smoothing approach, explained below. In general, the same final bonus scale applies to maturity, death and surrender claims except that:
• The total surrender value may be impacted by the application of a Market Value Reduction (MVR) which is for accumulating with-profits policies and is affected by the surrender bases (for conventional with-profits business); and
• For the SAIF and Scottish Amicable Life (SAL), the final bonus rates applicable on surrender may be adjusted to reflect expected future bonus rates.

234
Prudential plc Annual Report 2011
D: Life assurance business continued
Financial statements | Notes on the Group financial statements
D2: UK insurance operations continued
Application of significant judgementThe application of the above method for determining bonuses requires the PAC Board to apply significant judgement in many respects, including in particular the following:
• Determining what constitutes fair treatment of customers: Prudential is required by UK law and regulation to consider the fair treatment of its customers in setting bonus levels. The concept of determining what constitutes fair treatment, while established by statute, is not defined;
• Smoothing of investment returns: This is an important feature of with-profits products. Determining when particular circumstances, such as a significant rise or fall in market values, warrant variations in the standard bonus smoothing limits that apply in normal circumstances requires the PAC Board to exercise significant judgement; and
• Determining at what level to set bonuses to ensure that they are competitive: The overall return to policyholders is an important competitive measure for attracting new business.
Key assumptionsAs noted above, the overall rate of return on investments and the expectation of future investment returns are the most important influences in bonus rates, subject to the smoothing described below. Prudential determines the assumptions to apply in respect of these factors, including the effects of reasonably likely changes in key assumptions, in the context of the overarching discretionary and smoothing framework that applies to its with-profits business as described above. As such, it is not possible to specifically quantify the effects of each of these assumptions or of reasonably likely changes in these assumptions. Prudential’s approach, in applying significant judgement and discretion in relation to determining bonus rates, is consistent conceptually with the approach adopted by other firms that manage a with-profits business. It is also consistent with the requirements of UK law, which require all UK firms that carry out a with-profits business to define, and make publicly available, the Principles and Practices of Financial Management (PPFM) that are applied in the management of their with-profits funds. Accordingly, Prudential’s PPFM contains an explanation of how it determines regular and final bonus rates within the discretionary framework that applies to all with-profits policies, subject to the general legislative requirements applicable. The purpose of Prudential’s PPFM is therefore to:
• explain the nature and extent of the discretion available,• show how competing or conflicting interests or expectations of: – different groups and generations of policyholders, and – policyholders and shareholders are managed so that all policyholders and shareholders are treated fairly, and • provide a knowledgeable observer (eg a financial adviser) with an understanding of the material risks and rewards from starting and
continuing to invest in a with-profits policy with Prudential.
Furthermore, in accordance with industry-wide regulatory requirements, the PAC Board has appointed:
• an Actuarial Function Holder who provides the PAC Board with all actuarial advice;• a With-Profits Actuary whose specific duty is to advise the PAC Board on the reasonableness and proportionality of the manner
in which its discretion has been exercised in applying the PPFM and the manner in which any conflicting interests have been addressed; and
• a With-Profits Committee of independent individuals, which assesses the degree of compliance with the PPFM and the manner in which conflicting rights have been addressed.
Smoothing of investment returnIn determining bonus rates for the UK with-profits policies, smoothing is applied to the allocation of the overall earnings of the UK with-profits fund of which the investment return is a significant element. The smoothing approach differs between accumulating and conventional with-profits policies to reflect the different contract features. In normal circumstances, Prudential does not expect most payout values on policies of the same duration to change by more than 10 per cent up or down from one year to the next, although some larger changes may occur to balance payout values between different policies. Greater flexibility may be required in certain circumstances, for example following a significant rise or fall in market values, and in such situations the PAC Board may decide to vary the standard bonus smoothing limits in order to protect the overall interests of policyholders.

235F
ina
ncia
l statem
en
tsD: L
ife assuran
ce busin
ess
The degree of smoothing is illustrated numerically by comparing in the following table the relatively ‘smoothed’ level of policyholder bonuses declared as part of the surplus for distribution with the more volatile movement in investment return and other items of income and expenditure of the UK component of the PAC with-profits fund for each year presented.
2011 £m 2010 £m
Net income of the fund: Investment return 4,094 8,815 Claims incurred (6,411) (6,390)Movement in policyholder liabilities (614) (4,301)Add back policyholder bonuses for the year (as shown below) 1,945 2,019Claims incurred and movement in policyholder liabilities (including charge for provision for asset shares and excluding policyholder bonuses) (5,080) (8,672)Earned premiums, net of reinsurance 3,404 3,148 Other income 17 9 Acquisition costs and other expenditure (696) (600)Tax charge (63) (528)
Net income of the fund before movement in unallocated surplus 1,676 2,172 Movement in unallocated surplus 485 70
Surplus for distribution 2,161 2,242
Surplus for distribution allocated as follows: – 90% policyholders’ bonus (as shown above) 1,945 2,019 – 10% shareholders’ transfers 216 223
2,161 2,242
ii AnnuitybusinessPrudential’s conventional annuities include level, fixed-increase and inflation-linked annuities, the link being to the Retail Price Index (RPI) in the majority of cases. They are mainly written within the subsidiaries PAL, PRIL, the PAC non-profit sub-fund and the PAC with-profits sub-fund, but there are some annuity liabilities in Prudential Pensions Limited and SAIF. Prudential’s fixed-increase annuities incorporate automatic increases in annuity payments by fixed amounts over the policyholder’s life. The RPI annuities that Prudential offers provide for a regular annuity payment to which an additional amount is added periodically based on the increase in the UK RPI. Prudential’s with-profits annuities, which are written in the WPSF, combine the income features of annuity products with the investment smoothing features of with-profits products and enable policyholders to obtain exposure to investment return on the WPSF’s equity shares, property and other investment categories over time. Policyholders select a ‘required smoothed return’ bonus from the specific range Prudential offers for the particular product. The amount of the annuity payment each year depends upon the relationship between the required smoothed return bonus rate selected by the policyholder when the product is purchased and the smoothed return bonus rates Prudential subsequently declares each year during the term of the product. If the total bonus rates fall below the anticipated rate, then the annuity income falls. At 31 December 2011, £38.3 billion (2010: £35.6 billion) of investments relate to annuity business of PAL (including the business recaptured by PAC WPSF in 2011) and PRIL. These investments are predominantly in debt securities (including retail price index-linked bonds to match retail price index-linked annuities), loans and deposits and are duration matched with the estimated duration of the liabilities they support.

236
Prudential plc Annual Report 2011
D: Life assurance business continued
Financial statements | Notes on the Group financial statements
D2: UK insurance operations continued
iii SAIFSAIF is a ring-fenced sub-fund of the PAC long-term fund formed following the acquisition of the mutually owned Scottish Amicable Life Assurance Society in 1997. No new business may be written in SAIF, although regular premiums are still being paid on policies in force at the time of the acquisition and incremental premiums are permitted on these policies. The fund is solely for the benefit of policyholders of SAIF. Shareholders have no interest in the profits of this fund although they are entitled to asset management fees on this business. The process for determining policyholder bonuses of SAIF with-profits policies, which constitute the vast majority of obligations of the funds, is similar to that for the with-profits policies of the WPSF. However, in addition, the surplus assets in SAIF are allocated to policies in an orderly and equitable distribution over time as enhancements to policyholder benefits ie in excess of those based on asset share. Provision is made for the risks attaching to some SAIF unitised with-profits policies that have MVR-free dates and for those SAIF products which have a guaranteed minimum benefit on death or maturity of premiums accumulated at 4 per cent per annum. The Group’s main exposure to guaranteed annuities in the UK is through SAIF and a provision of £370 million was held in SAIF at 31 December 2011 (2010: £336 million) to honour the guarantees. As SAIF is a separate sub-fund solely for the benefit of policyholders of SAIF this provision has no impact on the financial position of the Group’s shareholders’ equity.
iv Unit-linked(non-annuity)andothernon-profitbusinessPrudential UK insurance operations also have an extensive book of unit-linked policies of varying types and provide a range of other non-profit business such as credit life and protection contracts. These contracts do not contain significant financial guarantees. There are no guaranteed maturity values or guaranteed annuity options on unit-linked policies except for minor amounts for certain policies linked to cash units within SAIF.
f Exposuretomarketriski Non-linkedlifeandpensionbusinessFor with-profits business, the absence of guaranteed surrender values and the flexibility given by the operation of the bonus system means that a high proportion of the investments backing the with-profits business are in equities and real estate, with the balance in debt securities, deposits and loans. The investments supporting the protection business are small in value and tend to be assets of a fixed term duration, reflecting the guaranteed nature of the liabilities.
ii PensionannuitybusinessPrudential’s UK annuity business mainly employs fixed income investments (including UK retail price index-linked assets) because the liabilities consist of guaranteed payments for as long as each annuitant or surviving partner is alive. Retail price index-linked assets are used to back pension annuities where the payments are linked to the RPI.
iii Unit-linkedbusinessExcept through the second order effect on asset management fees, the unit-linked business of the UK insurance operations is not exposed to market risk. The lack of exposure arises from the contract nature whereby policyholder benefits reflect asset value movements of the unit-linked funds.
g Processforsettingassumptionsanddeterminingcontractliabilitiesi OverviewThe calculation of the contract liabilities involves the setting of assumptions for future experience. This is done following detailed review of the relevant experience including, in particular, mortality, expenses, tax, economic assumptions and, where applicable, persistency. For with-profits business written in the WPSF or SAIF, a market-consistent valuation is performed (as described in section (ii) below). Additional assumptions required are for persistency and the management actions under which the fund is managed. Assumptions used for a market-consistent valuation typically do not contain margins, whereas those used for the valuation of other classes of business do. Mortality assumptions are set based on the results of the most recent experience analysis looking at the experience over recent years of the relevant business. For non-profit business, a margin for adverse deviation is added. Different assumptions are applied for different product groups. For annuitant mortality, assumptions for current mortality rates are based on recent experience investigations and expected future improvements in mortality. The expected future improvements are based on recent experience and projections of the business and industry experience generally.

237F
ina
ncia
l statem
en
tsD: L
ife assuran
ce busin
ess
Maintenance and, for some classes of business, termination expense assumptions are expressed as per policy amounts. They are set based on the expenses incurred during the year, including an allowance for ongoing investment expenditure and allocated between entities and product groups in accordance with the operation’s internal cost allocation model. For non-profit business a margin for adverse deviation is added to this amount. Expense inflation assumptions are set consistent with the economic basis and based on the difference between yields on nominal gilts and index-linked gilts. The actual renewal expenses incurred on behalf of SAIF by other Group companies are recharged in full to SAIF. The assumptions for asset management expenses are based on the charges specified in agreements with the Group’s asset management operations, plus a margin for adverse deviation for non-profit business. Tax assumptions are set equal to current rates of taxation. For non-profit business excluding unit-linked business, the valuation interest rates used to discount the liabilities are based on the yields as at the valuation date on the assets backing the technical provisions. For fixed interest securities the gross redemption yield is used except for the PAL (including the business recaptured by PAC WPSF in 2011) and PRIL annuity business where the internal rate of return of the assets backing the liabilities is used. Properties are valued using the rental yield, and for equities it is the greater of the dividend yield and the average of the dividend yield and the earnings yield. An adjustment is made to the yield on non risk-free fixed interest securities and property to reflect credit risk. To calculate the non-unit reserves for linked business, assumptions have been set for the gross unit growth rate and the rate of inflation of maintenance expenses, as well as for the valuation interest rate as described above.
ii WPSFandSAIFThe policyholder liabilities reported for the WPSF are primarily for two broad types of business. These are accumulating and conventional with-profits contracts. The policyholder liabilities of the WPSF are accounted for under FRS 27. The provisions have been determined on a basis consistent with the detailed methodology included in regulations contained in the FSA’s rules for the determination of reserves on the FSA’s ‘realistic’ Peak 2 basis. In aggregate, the regime has the effect of placing a value on the liabilities of UK with-profits contracts, which reflects the amounts expected to be paid based on the current value of investments held by the with-profits funds and current circumstances. These contracts are a combination of insurance and investment contracts with discretionary participation features, as defined by IFRS 4. The FSA’s Peak 2 calculation under the realistic regime requires the value of liabilities to be calculated as:
• the with-profits benefits reserve (WPBR), plus• future policy related liabilities (FPRL), plus• the realistic current liabilities of the fund.
The WPBR is primarily based on the retrospective calculation of accumulated asset shares but is adjusted to reflect future expected policyholder benefits and other outgoings. Asset shares are calculated as the accumulation of all items of income and outgo that are relevant to each policy type. Income comprises credits for premiums, investment returns (including unrealised gains) and miscellaneous profits. Outgo comprises charges for tax (including an allowance for tax on unrealised gains), guarantees and smoothing, mortality and morbidity, shareholders’ profit transfers, miscellaneous losses, and expenses and commission (net of any tax relief). The FPRL must include a market-consistent valuation of costs of guarantees, options and smoothing, less any related charges, and this amount must be determined using either a stochastic approach, hedging costs or a series of deterministic projections with attributed probabilities. The assumptions used in the stochastic models are calibrated to produce risk-free returns on each asset class. Volatilities of, and correlations between, investment returns from different asset classes are as determined by the Group’s Portfolio Management Group and aim to be market-consistent. The cost of guarantees, options and smoothing is very sensitive to the bonus, market value reduction (MVR), and investment policy employed and therefore the stochastic modelling incorporates a range of management actions that would help to protect the fund in adverse investment scenarios. Substantial flexibility has been included in the modelled management actions in order to reflect the discretion that is retained in adverse investment conditions, thereby avoiding the creation of unreasonable minimum capital requirements. The management actions assumed are consistent with the Group’s management policy for with-profits funds and the Group’s disclosures in the publicly available PPFM. The contract liabilities for with-profits business also require assumptions for persistency. These are set based on the results of recent experience analysis.

238
Prudential plc Annual Report 2011
D: Life assurance business continued
Financial statements | Notes on the Group financial statements
D2: UK insurance operations continued
iii AnnuitybusinessCredit risk provisionsFor IFRS reporting, the results for UK shareholder-backed annuity business are particularly sensitive to the allowances made for credit risk. The allowance is reflected in the deduction from the valuation rate of interest for discounting projected future annuity payments to policyholders that would have otherwise applied. Since mid-2007 there has been a significant increase in the actual and perceived credit risk associated with corporate bonds as reflected in the significant widening that has occurred in corporate bond spreads. Although bond spreads over swap rates have narrowed from their peak in March 2009, they are still high compared with the levels seen in the years immediately preceding the start of the dislocated markets in 2007. The allowance that should therefore be made for credit risk remains a particular area of judgement. The additional yield received on corporate bonds relative to swaps can be broken into the following constituent parts:
(a) the expected level of future defaults,(b) the credit risk premium that is required to compensate for the potential volatility in default levels, (c) the liquidity premium that is required to compensate for the lower liquidity of corporate bonds relative to swaps, and(d) the mark to market risk premium that is required to compensate for the potential volatility in corporate bond spreads (and hence
market values) at the time of sale.
The sum of (c) and (d) is often referred to as ‘liquidity premium’. The allowance for credit risk comprises (i) an amount for long-term best estimate defaults, and (ii) additional provisions for credit risk premium, downgrade resilience and short-term defaults. The weighted components of the bond spread over swap rates for shareholder-backed fixed and linked annuity business for PRIL at 31 December 2011 and 31 December 2010, based on the asset mix at the relevant balance sheet date are shown below.
31December2011
Pillar1regulatory
basis (bps)
Adjustmentfrom
regulatorytoIFRSbasis
(bps)IFRS
(bps)
Bond spread over swap rates note (i) 201 – 201
Credit risk allowance: Long-term expected defaults note (ii) 15 – 15 Additional provisionsnote (iii) 51 (24) 27
Total credit risk allowance 66 (24) 42
Liquidity premium 135 24 159
31December2010
Pillar1regulatory
basis (bps)
Adjustmentfrom
regulatorytoIFRSbasis
(bps)IFRS
(bps)
Bond spread over swap rates note (i) 160 – 160
Credit risk allowance: Long-term expected defaults note (ii) 16 – 16 Additional provisionsnote (iii) 52 (26) 26
Total credit risk allowance 68 (26) 42
Liquidity premium 92 26 118
Notes(i) Bond spread over swap rates reflect market observed data.(ii) Long-term expected defaults are derived by applying Moody’s data from 1970 to 2009 and the definition of the credit rating used is the second
highest credit rating published by Moody’s, Standard and Poor’s and Fitch. (iii) Additional provisions comprise credit risk premium, which is derived from Moody’s data from 1970 to 2009, an allowance for a one notch
downgrade of the portfolio subject to credit risk and an additional allowance for short-term defaults.

239F
ina
ncia
l statem
en
tsD: L
ife assuran
ce busin
ess
The very prudent Pillar 1 regulatory basis reflects the overriding objective of maintaining sufficient provisions and capital to ensure payments to policyholders can be made. The approach for IFRS aims to establish liabilities that are closer to ‘best estimate’. Movement in the credit risk allowance for PRIL for the year ended 31 December 2011The movement during 2011 of the average basis points allowance for PRIL on Pillar 1 regulatory and IFRS bases are as follows:
Pillar1regulatory
basis(bps)
IFRS(bps)
Total Total
Total allowance for credit risk at 31 December 2010 68 42 Credit rating changes 2 2 Asset trading (1) (1)Asset mix (effect of market value movements) (2) (1)New business and other (1) –
Totalallowanceforcreditriskat31December2011 66 42
In prior periods, surplus from favourable default experience has been retained within short-term allowances for credit risk on both the Pillar 1 and IFRS bases. For full year 2011 the retention of such surpluses continues to be applied to IFRS but not for Pillar 1. Overall the movement has led to the credit allowance for Pillar 1 purposes to be 33 per cent (2010: 43 per cent) of the bond spread over swap rates. For IFRS purposes it represents 20 per cent (2010: 26 per cent) of the bond spread over swap rates. The reserves for credit risk allowance at 31 December 2011 for the UK shareholder annuity fund were as follows:
Pillar1regulatory
basis£bn
IFRS£bn
Total Total
PRIL 1.8 1.2 PAC non-profit sub-fund 0.2 0.1
Total 2.0 1.3

240
Prudential plc Annual Report 2011
D: Life assurance business continued
Financial statements | Notes on the Group financial statements
D2: UK insurance operations continued
MortalityThe mortality assumptions are set in light of recent population and internal experience. The assumptions used are percentages of standard actuarial mortality tables with an allowance for future mortality improvements. Where annuities have been sold on an enhanced basis to impaired lives an additional age adjustment is made. The percentages of the standard table used are selected according to the source of business. In 2009, Prudential’s annuity business liabilities were determined using the CMI medium cohort projections with a floor. In November 2009, a new mortality projection model was released by the CMI. The new model was applied since the 2010 results with calibration to reflect an appropriate view of future mortality improvement. Prior to 2010, in recognition of the trend in assumed mortality improvements the Company had in previous years included margins in its annuity liabilities. In determining the 2010 results, based on the new model, the appropriate level of these margins was reassessed. See note D2(i) below for the net effect in 2010 of applying the new model, releases of margin and changes to other related mortality assumptions. The tables and range of percentages used are set out in the following tables:
PAL(andannuitybusinesswiththeWPSF) PRIL
2011 Males Females Males Females
In payment
In deferment
92% to 98% PCMA00 with future improvements in line with Prudential’s own calibration of the CMI 2009 mortality model, with a long-term improvement rate of 2.25%.
AM92 minus 4 years
88% to 100% PCFA00 with future improvements in line with Prudential’s own calibration of the CMI 2009 mortality model, with a long-term improvement rate of 1.25%.
AF92 minus 4 years
93% to 94% PCMA00 with future improvements in line with Prudential’s own calibration of the CMI 2009 mortality model, with a long-term improvement rate of 2.25%.
AM92 minus 4 years
84% to 96% PCFA00 with future improvements in line with Prudential’s own calibration of the CMI 2009 mortality model, with a long-term improvement rate of 1.25%.
AF92 minus 4 years
PAL PRIL
2010 Males Females Males Females
In payment
In deferment
92% to 98% PCMA00 with future improvements in line with Prudential’s own calibration of the CMI 2009 mortality model, with a long-term improvement rate of 2.25%.
AM92 minus 4 years
88% to 100% PCFA00 with future improvements in line with Prudential’s own calibration of the CMI 2009 mortality model, with a long-term improvement rate of 1.25%.
AF92 minus 4 years
94% to 95% PCMA00 with future improvements in line with Prudential’s own calibration of the CMI 2009 mortality model, with a long-term improvement rate of 2.25%.
AM92 minus 4 years
86% to 97% PCFA00 with future improvements in line with Prudential’s own calibration of the CMI 2009 mortality model, with a long-term improvement rate of 1.25%.
AF92 minus 4 years
PAL PRIL
2009 Males Females Males Females
In payment
In deferment
102% to 126% PNMA00 (C = 2000) with medium cohort improvement table with a minimum annual improvement of 2.25% up to age 90, tapering to zero at age 120.
AM92 minus 4 years
84% to 117% PNFA00 (C = 2000) with 75% of medium cohort improvement table with a minimum annual improvement of 1.25% up to age 90, tapering to zero at age 120.
AF92 minus 4 years
96% to 102% PNMA00 (C = 2000) with medium cohort improvement table with a minimum annual improvement of 2.25% up to age 90, tapering to zero at age 120.
AM92 minus 4 years
87% to 98% PNFA00 (C = 2000) with 75% of medium cohort improvement table with a minimum annual improvement of 1.25% up to age 90, tapering to zero at age 120.
AF92 minus 4 years

241F
ina
ncia
l statem
en
tsD: L
ife assuran
ce busin
ess
iv Unit-linked(non-annuity)andothernon-profitbusinessThe majority of other long-term business written in the UK insurance operations is unit-linked business or other business with similar features. For these contracts the attaching liability reflects the unit value obligation and provision for expenses and mortality risk. The latter component is determined by applying mortality assumptions on a basis that is appropriate for the policyholder profile. For unit-linked business, the assets covering unit liabilities are exposed to market risk, but the residual risk when considering the unit-linked liabilities and assets together is limited to the effect on fund-based charges. For those contracts where the level of insurance risk is insignificant the assets and liabilities arising under the contracts are distinguished between those that relate to the financial instrument liability and acquisition costs and deferred income that relate to the component of the contract that relates to investment management. Acquisition costs and deferred income are recognised consistent with the level of service provision in line with the requirements of IAS 18.
h ReinsuranceThe Group’s UK insurance business cedes only minor amounts of business outside the Group. During 2011, reinsurance premiums for externally ceded business were £132 million (2010: £128 million) and reinsurance recoverable assets were £589 million (2010: £608 million) in aggregate. The gains and losses recognised in profit and loss for the 2011 and 2010 contracts were immaterial.
i Effectofchangesinassumptionsusedtomeasureinsuranceassetsandliabilities2011Credit riskThe approach to reserving for credit risk is set out in note D2(f)(iii).
Other operating assumption changesIn 2011, for the shareholder-backed business, the aggregate effect of assumption changes other than the allowance for credit risk described above was a net charge to the shareholder results of £9 million, comprising a number of individually small assumption changes. For the with-profits sub-fund, the aggregate effect of assumption changes in 2011 was a net charge to unallocated surplus of £59 million, relating to changes in mortality, expense, persistency and economic assumptions.
2010Credit riskThe approach to reserving for credit risk is set out in note D2(f)(iii). Other operating assumption changesNote D2(g)(iii) above explains the application of a new mortality projection model in 2010 to determine the Prudential’s annuity business. The net effect of applying the new model, releases of margins and changes to other related mortality assumptions for shareholder-backed business is a credit of £8 million. With a £38 million benefit from altered expense assumptions the overall credit for shareholder-backed business is £46 million. For the with-profits sub-fund, the aggregate effect of assumption changes in 2010 was a net charge to unallocated surplus of £62 million, relating to changes in mortality, expense, persistency and economic assumptions.

242
Prudential plc Annual Report 2011
D: Life assurance business continued
Financial statements | Notes on the Group financial statements
D2: UK insurance operations continued
j SensitivityofIFRSbasisprofitorlossandshareholders’equitytomarketandotherrisksThe risks to which the IFRS basis results of the UK insurance operations are sensitive are asset/liability matching, mortality experience and payment assumptions for shareholder-backed annuity business. Further details are described below.
i With-profitsbusiness(a) SAIFShareholders have no interest in the profits of SAIF but are entitled to the asset management fees paid on the assets of the fund.
(b) With-profits sub-fund businessFor with-profits business (including non-participating business of PAL which is owned by the WPSF) adjustments to liabilities and any related tax effects are recognised in the Group’s income statement. However, except for any impact on the annual declaration of bonuses, shareholders’ profit for with-profits business is unaffected. This is because IFRS basis profits for with-profits business, which are determined on the same basis as on the ‘grandfathered’ UK GAAP, solely reflect one-ninth of the cost of bonuses declared for the year. The main factors that influence the determination of bonus rates are the return on the investments of the fund, the effect of inflation, taxation, the expenses of the fund chargeable to policyholders and the degree to which investment returns are smoothed. Mortality and other insurance risk are relatively minor factors. Unallocated surplus represents the excess of assets over policyholder liabilities of the fund. As unallocated surplus of the WPSF is recorded as a liability, movements in its value do not affect shareholders’ profits or equity. The level of unallocated surplus is particularly sensitive to the level of investment returns on the portion of the life fund assets that represents the surplus. The effects for 2011 and 2010 are demonstrated in note D5.
ii Shareholder-backedannuitybusinessProfits from shareholder-backed annuity business are most sensitive to:
• The extent to which the duration of the assets held closely matches the expected duration of the liabilities under the contracts. Assuming close matching, the impact of short-term asset value movements as a result of interest rate movements will broadly offset changes in the value of liabilities caused by movements in valuation rates of interest;
• Actual versus expected default rates on assets held;• The difference between long-term rates of return on corporate bonds and risk-free rates;• The variance between actual and expected mortality experience;• The extent to which changes to the assumed rate of improvements in mortality give rise to changes in the measurement
of liabilities; and• Changes in renewal expense levels.
A decrease in assumed mortality rates of 1 per cent would decrease gross profits by approximately £64 million (2010: £53 million). A decrease in credit default assumptions of five basis points would increase gross profits by £137 million (2010: £119 million). A decrease in renewal expenses (excluding asset management expenses) of 5 per cent would increase gross profits by £25 million (2010: £23 million). The effect on profits would be approximately symmetrical for changes in assumptions that are directionally opposite to those explained above.
iii Unit-linkedandotherbusinessUnit-linked and other business represents a comparatively small proportion of the in-force business of the UK insurance operations. Profits from unit-linked and similar contracts primarily arise from the excess of charges to policyholders, for management of assets under the Company’s stewardship, over expenses incurred. The former is most sensitive to the net accretion of funds under management as a function of new business and lapse and timing of death. The accounting impact of the latter is dependent upon the amortisation of acquisition costs in line with the emergence of margins (for insurance contracts) and amortisation in line with service provision (for the investment management component of investment contracts). By virtue of the design features of most of the contracts which provide low levels of mortality cover, the profits are relatively insensitive to changes in mortality experience.
iv ShareholderexposuretointerestrateriskandothermarketriskBy virtue of the fund structure, product features and basis of accounting, the policyholder liabilities of the UK insurance operations are, except for pension annuity business, not generally exposed to interest rate risk. At 31 December 2011, pension annuity liabilities accounted for 98 per cent (2010: 98 per cent) of UK shareholder-backed business liabilities. For pension annuity business, liabilities are exposed to interest rate risk. However, the net exposure to the PAC WPSF (for PAL) and shareholders (for annuity liabilities of PRIL and the non-profit sub-fund) is very substantially ameliorated by virtue of the close matching of assets with appropriate duration. The level of matching from period to period can vary depending on management actions and economic factors so it is possible for a degree of mismatching profits or losses to arise.

243F
ina
ncia
l statem
en
tsD: L
ife assuran
ce busin
ess
The close matching by the Group of assets of appropriate duration to annuity liabilities is based on maintaining economic and regulatory capital. The measurement of liabilities under capital reporting requirements and IFRS is not the same with contingency reserves and some other margins for prudence within the assumptions required under the FSA regulatory solvency basis not included for IFRS reporting purposes. As a result IFRS equity is higher than regulatory capital and therefore more sensitive to interest rate and credit risk. The estimated sensitivity of the UK non-linked shareholder-backed business (principally pension annuities business) to a movement in interest rates is as follows:
2011 £m 2010 £m
Decreaseof2%
Decreaseof1%
Increaseof1%
Increaseof2%
Decreaseof2%
Decreaseof1%
Increaseof1%
Increaseof2%
Carrying value of debt securities and derivatives 7,676 3,426 (2,820) (5,178) 6,547 2,938 (2,434) (4,481)
Policyholder liabilities (6,842) (3,060) 2,510 4,593 (5,977) (2,723) 2,109 3,929 Related deferred tax effects (208) (91) 77 146 (154) (58) 88 149
Net sensitivity of profit after tax and shareholders’ equity 626 275 (233) (439) 416 157 (237) (403)
In addition, the shareholder-backed portfolio of UK non-linked insurance operations covering liabilities and shareholders’ equity includes equity securities and investment property. Excluding any second order effects on the measurement of the liabilities for future cash flows to the policyholder, a fall in their value would have given rise to the following effects on pre-tax profit, profit after tax, and shareholders’ equity.
2011 £m 2010 £m
Decreaseof20%
Decreaseof10%
Decreaseof20%
Decreaseof10%
Pre-tax profit (319) (160) (302) (151)Related deferred tax effects 80 40 82 41
Net sensitivity of profit after tax and shareholders’ equity (239) (120) (220) (110)
A 10 or 20 per cent increase in their value would have an approximately equal and opposite effect on profit and shareholders’ equity to the sensitivities shown above. The market risk sensitivities shown above reflect the impact of temporary market movements and, therefore, the primary effect of such movements would, in the Group’s segmental analysis of profits, be included within the short-term fluctuations in investment returns. In the equity risk sensitivity analysis shown above, the Group has considered the impact of an instantaneous 20 per cent fall in equity markets. If equity markets were to fall by more than 20 per cent, the Group believes that this would not be an instantaneous fall but rather this would be expected to occur over a period of time during which the Group would be able to put in place mitigating management actions.

244
Prudential plc Annual Report 2011
D: Life assurance business continued
Financial statements | Notes on the Group financial statements
D2: UK insurance operations continued
k DurationofliabilitiesWith the exception of most unitised with-profits bonds and other whole of life contracts the majority of the contracts of the UK insurance operations have a contract term. However, in effect, the maturity term of contracts reflects the earlier of death, maturity or lapsation. In addition, with-profits contract liabilities as noted in note D2(g) include projected future bonuses based on current investment values. The actual amounts payable will vary with future investment performance of SAIF and the WPSF. The tables above show the carrying value of the policyholder liabilities. Separately, the Group uses cash flow projections of expected benefit payments as part of the determination of the value of in-force business when preparing EEV basis results. The tables in the accompanying notes below show the maturity profile of the cash flows used for that purpose for insurance contracts, as defined by IFRS, ie those containing significant insurance risk, and investment contracts, which do not.
2011 £m
With-profitsbusinessAnnuitybusiness
(insurancecontracts) Other
Insurancecontracts
Investmentcontracts Total PAL PRIL Total
Insurancecontracts
Investmentcontracts Total TOTAL
Policyholder liabilities 46,288 29,365 75,653 5,323 18,236 23,559 12,885 14,927 27,812 127,024
2011 %
Expected maturity: 0 to 5 years 47 32 41 25 25 25 34 28 31 35 5 to 10 years 24 26 25 22 22 22 25 22 24 24 10 to 15 years 13 19 16 18 18 18 18 18 18 17 15 to 20 years 8 14 10 13 13 13 11 12 11 11 20 to 25 years 5 7 6 9 10 9 7 9 7 7 Over 25 years 3 2 2 13 12 13 5 11 9 6
2010 £m
With-profitsbusinessAnnuitybusiness
(insurancecontracts) Other
Insurancecontracts
Investmentcontracts Total PAL PRIL Total
Insurancecontracts
Investmentcontracts Total TOTAL
Policyholder liabilities 43,691 25,613 69,304 12,282 16,442 28,724 11,737 15,765 27,502 125,530
2010 %
Expected maturity: 0 to 5 years 46 31 40 32 29 30 35 29 32 36 5 to 10 years 25 25 25 25 23 24 26 21 23 24 10 to 15 years 13 19 16 18 17 18 18 20 19 17 15 to 20 years 7 14 10 12 13 12 10 11 11 11 20 to 25 years 4 8 6 7 8 8 6 8 7 7 Over 25 years 5 3 3 6 10 8 5 11 8 5
Notes(i) The cash flow projections of expected benefit payments used in the maturity profile table above are from value of in-force business and exclude
the value of future new business, including vesting of internal pension contracts.(ii) Benefit payments do not reflect the pattern of bonuses and shareholder transfers in respect of the with-profits business.(iii) Investment contracts under Other comprise certain unit-linked and similar contracts accounted for under IAS 39 and IAS 18.(iv) For business with no maturity term included within the contracts, for example with-profits investment bonds such as Prudence Bonds, an
assumption is made as to likely duration based on prior experience.(v) The maturity tables shown above have been prepared on a discounted basis. Details of undiscounted cash flow for investment contracts are
shown in note G2.

245F
ina
ncia
l statem
en
tsD: L
ife assuran
ce busin
ess
D3: US insurance operations
a Summaryresultsandstatementoffinancialpositioni Resultsandmovementsinshareholders’equity
2011 £m 2010 £m
Operating profit based on longer-term investment returns 694 833 Short-term fluctuations in investment returns (95) (378)
Profit before shareholder tax 599 455 Tax (167) (117)
Profit for the year 432 338
2011 £m 2010 £m
Profit for the year (as above) 432 338 Items recognised in other comprehensive income: Exchange movements 42 85 Unrealised valuation movements on securities classified as available-for sale: Unrealised holding gains arising during the year 912 1,170 Deduct net (gains)/add back net losses included in the income statement (101) 51
Total unrealised valuation movements 811 1,221 Related change in amortisation of deferred income and acquisition costs (331) (496) Related tax (168) (247)
Total other comprehensive income 354 563
Total comprehensive income for the year 786 901 Dividends, interest payments to central companies and other movements (330) (97)
Net increase in shareholders’ equity 456 804 Shareholders’ equity at beginning of year 3,815 3,011
Shareholders’ equity at end of year 4,271 3,815
Included within the movements in shareholders’ equity is a net increase in value of Jackson’s debt securities classified as ‘available-for-sale’ under IAS 39 of £811 million (2010: £1,221 million). With the exception of debt securities for US insurance operations classified as ‘available-for-sale’ under IAS 39, unrealised value movements on the Group’s investments are booked within the income statement. However, for debt securities classified as ‘available-for-sale’, unless impaired, fair value movements are recognised in other comprehensive income. Realised gains and losses, including impairments, are recorded in the income statement. This classification is applied for most of the debt securities of the Group’s US operations. In 2011, Jackson recorded £62 million (2010: £124 million) of impairment losses arising from:
2011 £m 2010 £m
Residential mortgage-backed securities 21 71 Public fixed income – 1 Other 41 52
62 124

246
Prudential plc Annual Report 2011
D: Life assurance business continued
Financial statements | Notes on the Group financial statements
D3: US insurance operations continued
Further details on the impairment losses recognised in the year are shown in note B1. Jackson’s portfolio of debt securities is managed proactively with credit analysts closely monitoring and reporting on the credit quality of its holdings. Jackson continues to review its investments on a case-by-case basis to determine whether any decline in fair value represents an impairment. In addition, investments in structured securities are subject to a rigorous review of their future estimated cash flows, including expected and stress case scenarios, to identify potential shortfalls in contractual payments (both interest and principal). Impairment charges are recorded on structured securities when the Company forecasts a contractual payment shortfall. Situations where such a shortfall would not lead to a recognition of a loss are rare. However, some structured securities do not have a single determined set of future cash flows and instead, there can be a reasonable range of estimates that could potentially emerge. With this variability, there could be instances where the projected cash flow shortfall under management’s base case set of assumptions is so minor that relatively small and justifiable changes to the base case assumptions would eliminate the need for an impairment loss to be recognised. The impairment loss reflects the difference between the fair value and book value. In 2011 there was a movement in the statement of financial position value for debt securities classified as available-for-sale from a net unrealised gain of £1,210 million to a net unrealised gain of £2,057 million. The gross unrealised gain in the statement of financial position increased from £1,580 million at 31 December 2010 to £2,303 million at 31 December 2011, while the gross unrealised loss decreased from £370 million at 31 December 2010 to £246 million at 31 December 2011.
Available-for-sale securities
2011 2010
Changesinunrealised
appreciation‡
Foreignexchange
translation
Reflectedaspartofmovementinothercomprehensiveincome
£m £m £m £m
Assets fair valued at below book value Book value* 2,455 4,372 Unrealised (loss)/gain (246) 122 2 (370)
Fair value (as included in statement of financial position) 2,209 4,002
Assets fair valued at or above book value Book value* 22,504 20,743 Unrealised gain 2,303 689 34 1,580
Fair value (as included in statement of financial position) 24,807 22,323
Total Book value* 24,959 25,115 Net unrealised gain 2,057 811 36 1,210
Fair value (as included in statement of financial position)‡ 27,016 26,325
* Book value represents cost/amortised cost of the debt securities.† Translated at the average rate of $1.6037: £1.‡ Debt securities for US operations included in the statement of financial position at 31 December 2011 comprise:
2011 £m 2010 £m
Available-for-sale 27,016 26,325 Consolidated investment funds classified as fair value through profit and loss 6 41
27,022 26,366
Included within the movement in gross unrealised losses for the debt securities of Jackson of £122 million (2010: £634 million) as shown above was a net decrease in value of £12 million (2010: £84 million increase) relating to the sub-prime and Alt-A securities as referred to in section B5.

247F
ina
ncia
l statem
en
tsD: L
ife assuran
ce busin
ess
ii Statementoffinancialposition
2011 £m 2010 £m
Variableannuityseparateaccount
assetsandliabilities
note (i)
Fixedannuity,GICandother
businessnote (i) Total Total
AssetsIntangible assets attributable to shareholders: Deferred acquisition costs and other intangibles – 3,900 3,900 3,559
Total – 3,900 3,900 3,559
Deferred tax assets – 1,392 1,392 1,391 Other non-investment and non-cash assets – 1,542 1,542 1,225 Investments of long-term business and other operations: Investment properties – 35 35 26 Financial investments: Loansnote (ii) – 4,110 4,110 4,201 Equity securities and portfolio holdings in unit trustsnote (v) 37,833 203 38,036 31,501 Debt securities – 27,022 27,022 26,366 Other investmentsnote (iii) – 2,376 2,376 1,199 Deposits – 167 167 212
Total investments 37,833 33,913 71,746 63,505
Properties held for sale – 3 3 3
Cash and cash equivalents – 271 271 232
Totalassets 37,833 41,021 78,854 69,915
Equityandliabilities EquityShareholders’ equity – 4,271 4,271 3,815
Total equity – 4,271 4,271 3,815
Liabilities Policyholder: Contract liabilities (including amounts in respect of contracts classified as investment contracts under IFRS 4) note (iv) 37,833 31,356 69,189 60,523
Total 37,833 31,356 69,189 60,523
Core structural borrowings of shareholder-financed operations – 160 160 159 Operational borrowings attributable to shareholder-financed operations – 127 127 90 Deferred tax liabilities – 2,093 2,093 1,776 Other non-insurance liabilities – 3,014 3,014 3,552
Total liabilities 37,833 36,750 74,583 66,100
Totalequityandliabilities 37,833 41,021 78,854 69,915

248
Prudential plc Annual Report 2011
D: Life assurance business continued
Financial statements | Notes on the Group financial statements
D3: US insurance operations continued
Notes(i) Assets and liabilities attaching to variable annuity business that are not held in the separate account are shown within other business.(ii) Loans The loans of the Group’s US insurance operations comprise:
2011 £m 2010 £m
Mortgage loans* 3,559 3,641 Policy loans† 551 548 Other loans – 12
Total US insurance operations loans 4,110 4,201
* All of the mortgage loans are commercial mortgage loans which are collateralised by properties. The property types are mainly industrial, multi-family residential, suburban office, retail and hotel. The breakdown by property type is as follows:
2011 % 2010 %
Industrial 28 31 Multi-family residential 23 18 Office 19 19 Retail 19 21 Hotels 11 10 Other – 1
100 100
The US insurance operations’ commercial mortgage loan portfolio does not include any single-family residential mortgage loans and is therefore not exposed to the risk of defaults associated with residential sub-prime mortgage loans. The average loan size is £6.6 million (2010: £6.6 million). The portfolio has a current estimated average loan to value of 68 per cent (2010: 73 per cent) which provides significant cushion to withstand substantial declines in value.
At 31 December 2011, Jackson had mortgage loans with a carrying value of £87 million where the contractual terms of the agreements had been restructured. In addition to the regular impairment review afforded all loans in the portfolio, restructured loans are also reviewed for impairment. An impairment will be recorded if the expected cash flows under the newly restructured terms discounted at the original yield (the pre-structured interest rate) are below the carrying value of the loan.
† The policy loans are fully secured by individual life insurance policies or annuity policies. These loans are accounted for at amortised cost, less any impairment.
(iii) Other investments comprise:2011 £m 2010 £m
Derivative assets* note G3 1,677 645 Partnerships in investment pools and other† 699 554
2,376 1,199
* In the US, Prudential uses derivatives to reduce interest rate risk, to facilitate efficient portfolio management to match liabilities under annuity policies, and for certain equity-based product management activities. After taking account of the derivative liability of £887 million (2010: £799 million), which is also included in the statement of financial position, the derivative position for US operations is a net asset of £790 million (2010: net liability of £154 million).
† Partnerships in investment pools and other comprise primarily investments in limited partnerships. These include interests in the PPM America Private Equity Fund and diversified investments in 167 (2010: 161) other partnerships by independent money managers that generally invest in various equities and fixed income loans and securities.
(iv) Summary policyholder liabilities (net of reinsurance) and reserves at 31 December 2011 The policyholder liabilities, net of reinsurers’ share of £907 million (2010: £694 million), reflect balances in respect of the following:
2011 £m 2010 £m
Policy reserves and liabilities on non-linked business: Reserves for future policyholder benefits and claims payable 518 1,567 Deposits on investment contracts (as defined under IFRS ‘grandfathered’ US GAAP) 28,314 25,494 Guaranteed investment contracts 1,617 1,565 Unit-linked (variable annuity) business 37,833 31,203
68,282 59,829
In addition to the policyholder liabilities above, Jackson has entered into a programme of funding arrangements under contracts which, in substance, are almost identical to GICs. The liabilities under these funding arrangements totalled £1,070 million (2010: £1,411 million) and are included in ‘other non-insurance liabilities’ in the statement of financial position above.
(v) Equity securities and portfolio holdings in unit trusts includes investments in mutual funds, the majority of which are equity based.

249F
ina
ncia
l statem
en
tsD: L
ife assuran
ce busin
ess
b ReconciliationofmovementininvestmentsA reconciliation of the total investments of US insurance operations from the beginning of the year to the end of the year is as follows:
Variableannuityseparateaccount
assetsandliabilities
£m
GICandotherbusiness
£m
USinsuranceoperations
Total £m
At1January2010 Total investments (including derivative assets) 20,639 28,937 49,576 Less: Derivative liabilities – (461) (461)
Directly held investments, net of derivative liabilities 20,639 28,476 49,115
Net cash inflow from operating activities 6,441 865 7,306 Realised gains in the year – 21 21 Unrealised gains and losses and exchange movements in the year 4,123 2,141 6,264
Movement in the year of directly held investments, net of derivative liabilities 10,564 3,027 13,591
At31December2010/1January2011 Total investments (including derivative assets) 31,203 32,302 63,505 Less: Derivative liabilities note G3 – (799) (799)
Directly held investments, net of derivative liabilities 31,203 31,503 62,706
Net cash inflow (outflow) from operating activities 7,294 (625) 6,669 Realised gains in the year – 102 102 Unrealised gains and losses and exchange movements in the year (664) 2,046 1,382
Movement in the year of directly held investments, net of derivative liabilities 6,630 1,523 8,153
At31December2011 Total investments (including derivative assets) 37,833 33,913 71,746 Less: Derivative liabilities note G3 – (887) (887)
Directly held investments, net of derivative liabilities 37,833 33,026 70,859

250
Prudential plc Annual Report 2011
D: Life assurance business continued
Financial statements | Notes on the Group financial statements
D3: US insurance operations continued
c ReconciliationofmovementinpolicyholderliabilitiesA reconciliation of the total policyholder liabilities of US insurance operations from the beginning of the year to the end of the year is as follows:
US insurance operations
Variableannuityseparateaccount
liabilities £m
Fixedannuity,GICandother
business £m
Total £m
At 1 January 2010 20,639 27,672 48,311 Premiums 7,420 4,315 11,735 Surrenders (1,403) (2,195) (3,598)Maturities/Deaths (259) (510) (769)
Net flows 5,758 1,610 7,368 Transfers from general to separate account 1,411 (1,411) – Investment-related items and other movements 2,875 589 3,464 Foreign exchange translation differencesnote (a) 520 860 1,380
At 31 December 2010/1 January 2011 31,203 29,320 60,523
Premiums 9,176 3,738 12,914 Surrenders (1,898) (2,372) (4,270)Maturities/Deaths (300) (520) (820)
Net flowsnote (b) 6,978 846 7,824 Transfers from general to separate account 957 (957) – Investment-related items and other movementsnote (c) (1,735) 1,871 136 Foreign exchange translation differences 430 276 706
At 31 December 2011 37,833 31,356 69,189 Average policyholder liability balances 2011 34,518 30,338 64,856 2010 25,921 28,496 54,417
Notes(a) Movements in the year have been translated at an average rate of 1.60 (2010: 1.55). The closing balance has been translated at closing rate of 1.55
(2010: 1.57). Differences upon retranslation are included in foreign exchange translation differences of £706 million (2010: £1,380 million).(b) Net flows for the year were £7,824 million compared with £7,368 million in 2010, driven largely by increased new business volumes for the
variable annuity business.(c) Negative investment-related items and other movements in variable annuity separate account liabilities of £1,735 million in 2011 principally
reflects the negative separate account return in the year including reductions to liabilities for fees levied, versus a significant increase in the equity market in 2010. This is offset by an increase in fixed annuity, GIC and other business investment and other movements primarily related to increase in the value of embedded derivatives and interest credited to policyholder accounts in the year.

251F
ina
ncia
l statem
en
tsD: L
ife assuran
ce busin
ess
d Informationoncreditrisksofdebtsecurities
Summary 2011 £m 2010 £m
Corporate and government security and commercial loans: Government 2,163 2,440 Publicly traded and SEC Rule 144A securities 16,281 14,747 Non-SEC Rule 144A securities 3,198 3,044
Total 21,642 20,231
Residential mortgage-backed securities (RMBS) 2,591 2,784 Commercial mortgage-backed securities (CMBS) 2,169 2,375 Other debt securities 620 976
TotalUSdebtsecurities 27,022 26,366
i CreditqualityFor statutory reporting in the US, debt securities are classified into six quality categories specified by the Securities Valuation Office of the National Association of Insurance Commissioners (NAIC). The categories range from Class 1 (the highest) to Class 6 (the lowest). Performing securities are designated as Classes 1 to 5. Securities in or near default are designated Class 6. Securities designated as Class 3, 4, 5 and 6 are non-investment grade securities. Generally, securities rated AAA to A by nationally recognised statistical ratings organisations are reflected in Class 1, BBB in Class 2, BB in Class 3 and B and below in Classes 4 to 6. If a designation is not currently available from the NAIC, Jackson’s investment adviser, PPM America, provides the designation for the purposes of disclosure below. The following table shows the quality of the publicly traded and SEC Rule 144A debt securities by NAIC classifications:
2011 2010
Carryingvalue Carryingvalue
£m % of total £m % of total
NAIC designation:1 6,338 39 5,338 36 2 9,002 55 8,550 58 3 723 5 644 5 4 204 1 201 1 5 10 – 11 –6 4 – 3 –
16,281 100 14,747 100
The following table shows the quality of the non-SEC Rule 144A private placement portfolio by NAIC classifications:
2011 2010
Carryingvalue Carryingvalue
£m % of total £m % of total
NAIC designation:1 1,262 39 1,125 37 2 1,835 58 1,772 58 3 81 3 114 4 4 8 – 18 1 5 12 – 13 – 6 – – 2 –
3,198 100 3,044 100

252
Prudential plc Annual Report 2011
D: Life assurance business continued
Financial statements | Notes on the Group financial statements
D3: US insurance operations continued
Other debt securities of £620 million (2010: £976 million) are made up as shown in the following table:
2011 £m 2010 £m
Asset-backed securities held by Jackson – NAIC designation 1 474 527 Asset-backed securities held by Jackson – NAIC designation 2 90 135 Securities held by Piedmont trust entity – 211 Investments managed by PPM America 6 42 Other 50 61
Total 620 976
In addition to the ratings disclosed above, the following table summarises by rating the debt securities, as at 31 December 2011 and 2010 using Standard and Poor’s (S&P), Moody’s, Fitch and implicit ratings of MBS based on NAIC valuations.
2011 £m 2010 £m
S&P – AAA 133 4,187 S&P – AA+ to AA- 4,476 801 S&P – A+ to A- 6,382 5,156 S&P – BBB+ to BBB- 8,446 8,202 S&P – Other 999 866
20,436 19,212
Moody’s – Aaa 62 34 Moody’s – Aa1 to Aa3 15 32 Moody’s – A1 to A3 29 36 Moody’s – Baa1 to Baa3 67 73 Moody’s – Other 17 135
190 310
Implicit ratings of MBS based on NAIC valuations (see below) NAIC 1 2,577 3,083 NAIC 2 147 181 NAIC 3-6 368 232
3,092 3,496
Fitch 184 176 Other* 3,120 3,172
Total US debt securities 27,022 26,366
* The amounts within Other which are not rated by S&P, Moody or Fitch, nor are MBS securities using the revised regulatory ratings, have the following NAIC classifications:
2011 £m 2010 £m
NAIC 1 1,258 1,193 NAIC 2 1,792 1,849 NAIC 3-6 70 130
3,120 3,172
In the table above, with the exception of some mortgage-backed securities, S&P ratings have been used where available. For securities where S&P ratings are not immediately available, those produced by Moody’s and then Fitch have been used as an alternative.

253F
ina
ncia
l statem
en
tsD: L
ife assuran
ce busin
ess
For some mortgage-backed securities within Jackson, the table above includes these securities using the regulatory ratings detail issued by the NAIC. These regulatory ratings levels were established by external third parties (PIMCO for residential mortgage-backed securities and BlackRock Solutions for commercial mortgage-backed securities).
ii Determining the fair value of debt securities when the markets are not activeUnder IAS 39, unless categorised as ‘held to maturity’ or ‘loans and receivables’ debt securities are required to be fair valued. Where available, quoted market prices are used. However, where securities do not have an externally quoted price based on regular trades or where markets for the securities are no longer active as a result of market conditions, IAS 39 requires that valuation techniques be applied. IFRS 7 requires classification of the fair values applied by the Group into a three level hierarchy. Note G1 sets out further details of the Group’s approach to determining fair value and classifies these fair values into a three level hierarchy as required by IFRS 7. At 31 December 2011, 0.1 per cent of Jackson’s debt securities were classified as level 3 (31 December 2010: 0.3 per cent) comprising of fair values where there are significant inputs which are not based on observable market data.
iii Asset-backed securities funds exposuresIncluded within the debt securities of Jackson at 31 December 2011 are exposures to asset-backed securities as follows:
2011 £m 2010 £m
RMBS Sub-prime (2011: 20% AAA, 4% AA) 207 224 Alt-A (2011: 12% AAA, 4% AA) 310 415 Prime including agency (2011: 3% AAA, 76% AA) 2,074 2,145 CMBS (2011: 35% AAA, 12% AA) 2,169 2,375 CDO funds (2011: 16% AAA, 0% AA)*, including £nil million exposure to sub-prime 44 162 Other ABS (2011: 23% AAA, 17% AA), including £6.6 million exposure to sub-prime 576 814
Total 5,380 6,135
* Including Group’s economic interest in Piedmont and other consolidated CDO funds.
Jackson defines its exposure to sub-prime mortgages as investments in residential mortgage-backed securities in which the underlying borrowers have a US Fair Isaac Credit Organisation (FICO) credit score of 680 or lower.
iv Debtsecuritiesclassifiedasavailable-for-saleinanunrealisedlosspositionThe following tables show some key attributes of those securities that are in an unrealised loss position at 31 December 2011.
a Fair value of available-for-sale securities as a percentage of book value The following table shows the fair value of the debt securities in a gross unrealised loss position for various percentages of book value at 31 December:
2011 £m 2010 £m
FairvalueUnrealised
loss FairvalueUnrealised
loss
Between 90% and 100% 1,829 (60) 3,390 (102)Between 80% and 90% 172 (28) 273 (44)Below 80% 208 (158) 339 (224)
Total 2,209 (246) 4,002 (370)
Included within the table above are amounts relating to sub-prime and Alt-A securities of:
2011 £m 2010 £m
FairvalueUnrealised
loss FairvalueUnrealised
loss
Between 90% and 100% 142 (7) 98 (6)Between 80% and 90% 58 (11) 55 (9)Below 80% note(d) 69 (35) 56 (25)
Total 269 (53) 209 (40)

254
Prudential plc Annual Report 2011
D: Life assurance business continued
Financial statements | Notes on the Group financial statements
D3: US insurance operations continued
b Unrealised losses by maturity of available-for-sale securities
2011 £m 2010 £m
Less than 1 year – – 1 year to 5 years (7) (6)5 years to 10 years (28) (47)More than 10 years (28) (49)Mortgage-backed and other debt securities (183) (268)
Total* (246) (370)
* These relate to assets with a fair market value and book value of £2,209 million (2010: £4,002 million) and £2,455 million (2010: £4,372 million) respectively.
c Age analysis of unrealised losses for the years indicated for available-for-sale securitiesThe following table shows the age analysis of all the unrealised losses in the portfolio by reference to the length of time the securities have been in an unrealised loss position:
2011 £m 2010 £m
Non-investment
gradeInvestment
grade Total
Non-investment
gradeInvestment
grade Total
Less than 6 months (11) (31) (42) (3) (67) (70)6 months to 1 year (7) (8) (15) (2) – (2)1 year to 2 years (5) (1) (6) (13) (20) (33)2 years to 3 years (7) (10) (17) (27) (55) (82)More than 3 years (61) (105) (166) (58) (125) (183)
Total (91) (155) (246) (103) (267) (370)
At 31 December 2011, the gross unrealised losses in the statement of financial position for the sub-prime and Alt-A securities in an unrealised loss position were £53 million (2010: £40 million). Of these losses £10 million (2010: £1 million) relate to securities that have been in an unrealised loss position for less than one year and £43 million (2010: £39 million) to securities that have been in an unrealised loss position for more than one year.

255F
ina
ncia
l statem
en
tsD: L
ife assuran
ce busin
ess
d Securities whose fair value were below 80 per cent of the book valueAs shown in the table (a) above, £158 million of the £246 million of gross unrealised losses at 31 December 2011 (2010: £224 million of the £370 million of gross unrealised losses) related to securities whose fair value was below 80 per cent of the book value. The analysis of the £158 million (2010: £224 million), by category of debt securities and by age analysis indicating the length of time for which their fair value was below 80 per cent of the book value, is as follows:
2011 £m 2010 £m
CategoryanalysisFair
valueUnrealised
lossFair
valueUnrealised
loss
Residential mortgage-backed securities Prime (including agency) 38 (16) 88 (39) Alt - A 12 (3) 15 (4) Sub-prime 58 (32) 41 (20)
108 (51) 144 (63)Commercial mortgage-backed securities 6 (29) 8 (29)Other asset-backed securities 65 (58) 123 (105)
Total structured securities 179 (138) 275 (197)Corporates 29 (20) 64 (27)
Total 208 (158) 339 (224)
Age analysis of fair value being below 80 per cent for the period indicated:
2011 £m 2010 £m
AgeanalysisFair
valueUnrealised
lossFair
valueUnrealised
loss
Less than 3 months 15 (5) – (1)3 months to 6 months 45 (15) – – More than 6 months 148 (138) 339 (223)
208 (158) 339 (224)

256
Prudential plc Annual Report 2011
D: Life assurance business continued
Financial statements | Notes on the Group financial statements
D3: US insurance operations continued
e ProductsandguaranteesJackson provides long-term savings and retirement products to retail and institutional customers throughout the US. Jackson offers fixed annuities (interest-sensitive, fixed indexed and immediate annuities), variable annuities (VA), life insurance and institutional products.
i FixedannuitiesInterest-sensitive annuitiesAt 31 December 2011, interest-sensitive fixed annuities accounted for 16 per cent (2010: 19 per cent) of policy and contract liabilities of Jackson. Interest-sensitive fixed annuities are primarily deferred annuity products that are used for asset accumulation in retirement planning and for providing income in retirement. They permit tax-deferred accumulation of funds and flexible payout options. The policyholder of an interest-sensitive fixed annuity pays Jackson a premium, which is credited to the policyholder’s account. Periodically, interest is credited to the policyholder’s account and in some cases administrative charges are deducted from the policyholder’s account. Jackson makes benefit payments at a future date as specified in the policy based on the value of the policyholder’s account at that date. The policy provides that at Jackson’s discretion it may reset the interest rate, subject to a guaranteed minimum. At 31 December 2011, Jackson had fixed interest rate annuities totalling £16.9 billion (US$26.2 billion) in account value with minimum guaranteed rates ranging from 1.0 per cent to 5.5 per cent and a 2.83 per cent average guaranteed rate. Approximately 48 per cent (2010: 45 per cent) of the interest-sensitive fixed annuities Jackson wrote in 2011 provide for a market value adjustment that could be positive or negative, on surrenders in the surrender period of the policy. This formula-based adjustment approximates the change in value that assets supporting the product would realise as interest rates move up or down. The minimum guaranteed rate is not affected by this adjustment.
Fixed indexed annuitiesFixed indexed annuities (FIA) accounted for 9 per cent (2010: 9 per cent) of Jackson’s policy and contract liabilities at 31 December 2011. Fixed indexed annuities vary in structure, but generally are deferred annuities that enable policyholders to obtain a portion of an equity-linked return (based on participation rates and caps) but provide a guaranteed minimum return. These guaranteed minimum rates are generally set at 1.0 to 3.0 per cent. Jackson hedges the equity return risk on fixed indexed products using futures and options linked to the relevant index as well as through offsetting equity exposure in the VA product. The cost of these hedges is taken into account in setting the index participation rates or caps. Jackson bears the investment and surrender risk on these products.
Immediate annuitiesAt 31 December 2011, immediate annuities accounted for 1 per cent (2010: 2 per cent) of Jackson’s policy and contract liabilities. Immediate annuities guarantee a series of payments beginning within a year of purchase and continuing over either a fixed period of years and/or the life of the policyholder. If the term is for the life of the policyholder, then Jackson’s primary risk is mortality risk. The implicit interest rate on these products is based on the market conditions that exist at the time the policy is issued and is guaranteed for the term of the annuity.
ii VariableannuitiesAt 31 December 2011, VAs accounted for 63 per cent (2010: 58 per cent) of Jackson’s policy and contract liabilities. VAs are deferred annuities that have the same tax advantages and payout options as interest-sensitive and fixed indexed annuities. The primary differences between VAs and interest-sensitive or fixed indexed annuities are investment risk and return. If a policyholder chooses a VA, the rate of return depends upon the performance of the selected fund portfolio. Policyholders may allocate their investment to either the fixed or a selection of variable accounts. Investment risk on the variable account is borne by the policyholder, while investment risk on the fixed account is borne by Jackson through guaranteed minimum fixed rates of return. At 31 December 2011, approximately 10 per cent (2010: approximately 12 per cent) of VA funds were in fixed accounts. Jackson issues VA contracts where it contractually guarantees to the contractholder either a) return of no less than total deposits made to the contract adjusted for any partial withdrawals, b) total deposits made to the contract adjusted for any partial withdrawals plus a minimum return, or c) the highest contract value on a specified anniversary date adjusted for any withdrawals following the contract anniversary. These guarantees include benefits that are payable in the event of death (GMDB), annuitisation (GMIB), or at specified dates during the accumulation period (GMWB and GMAB). Jackson hedges these risks using equity options and futures contracts as described in note D3(f). The GMAB was eliminated from Jackson’s product offerings in 2011. The GMIB is no longer offered, with existing coverage being reinsured.

257F
ina
ncia
l statem
en
tsD: L
ife assuran
ce busin
ess
iii LifeinsuranceJackson’s life insurance products accounted for 7 per cent (2010: 7 per cent) of Jackson’s policy and contract liabilities at 31 December 2011. The products offered include term life, universal life and variable universal life. Term life provides protection for a defined period and a benefit that is payable to a designated beneficiary upon death of the insured. Universal life provides permanent individual life insurance for the life of the insured and includes a savings element. Variable universal life is a type of life insurance policy that combines death benefit protection with the ability for the policyholder account to be invested in separate account funds. At 31 December 2011, Jackson had interest-sensitive life (universal life type) business in force with total account value of £2.9 billion (US$4.5 billion), with minimum guaranteed interest rates ranging from 3.0 per cent to 6.0 per cent with a 4.93 per cent average guaranteed rate.
iv InstitutionalproductsJackson’s institutional products consist of GICs, funding agreements (including agreements issued in conjunction with Jackson’s participation in the US Federal Home Loan Bank programme) and medium-term note funding agreements. At 31 December 2011, institutional products accounted for 4 per cent of policy and contract liabilities (2010: 5 per cent). Under a traditional GIC, the policyholder makes a lump sum deposit. The interest rate paid is fixed and established when the contract is issued. If deposited funds are withdrawn earlier than the specified term of the contract, an adjustment is made that approximates a market value adjustment. Under a funding agreement, the policyholder either makes a lump sum deposit or makes specified periodic deposits. Jackson agrees to pay a rate of interest, which may be fixed but which is usually a floating short-term interest rate linked to an external index. The average term of the funding arrangements is one to two years. In 2011 and 2010, there were no funding agreements terminable by the policyholder with less than 90 days’ notice. Medium-term note funding agreements are generally issued to support trust instruments issued on non-US exchanges or to qualified investors (as defined by SEC Rule 144A). Through the funding agreements, Jackson agrees to pay a rate of interest, which may be fixed or floating, to the holders of the trust instruments.
f ExposuretomarketriskandriskmanagementJackson’s main exposures are to market risk through its exposure to interest rate risk and equity risk. Approximately 92 per cent (2010: 91 per cent) of its general account investments support interest-sensitive and fixed indexed annuities, life business and surplus and 8 per cent (2010: 9 per cent) support institutional business. All of these types of business contain considerable interest rate guarantee features and, consequently, require that the assets that support them are primarily fixed income or fixed maturity. Jackson is exposed primarily to the following risks in the US arising from fluctuations in interest rates:
• the risk of loss related to meeting guaranteed rates of accumulation following a sharp and sustained fall in interest rates,• the risk of loss related to policyholder withdrawals following a sharp and sustained increase in interest rates, and• the risk of mismatch between the expected duration of certain annuity liabilities and prepayment risk and extension risk inherent in
mortgage-backed securities.
Jackson is also exposed to the following risks in the US arising from equity market movements:
• the risk of loss related to the incidence of benefits related to guarantees issued in connection with its VA contracts, and• the risk of loss related to meeting contractual accumulation requirements in FIA contracts.
Jackson enters into financial derivative transactions, including those noted below to reduce and manage business risks. These transactions manage the risk of a change in the value, yield, price, cash flows, or quantity of, or a degree of exposure with respect to assets, liabilities or future cash flows, which Jackson has acquired or incurred. Jackson uses free-standing derivative instruments for hedging purposes. Additionally, certain liabilities, primarily trust instruments supported by funding agreements, fixed indexed annuities, certain GMWB variable annuity features and reinsured GMIB variable annuity features contain embedded derivatives as defined by IAS 39, ‘Financial Instruments: Recognition and Measurement’. Jackson does not account for such derivatives as either fair value or cash flow hedges as might be permitted if the specific hedge documentation requirements of IAS 39 were followed. Financial derivatives, including derivatives embedded in certain host liabilities that have been separated for accounting and financial reporting purposes are carried at fair value. Value movements on the derivatives are reported within the income statement. In preparing Jackson’s segment profit as shown in note B1, value movements on Jackson’s derivative contracts, are included within short-term fluctuations in investment returns and excluded from operating results based on longer-term investment returns.

258
Prudential plc Annual Report 2011
D: Life assurance business continued
Financial statements | Notes on the Group financial statements
D3: US insurance operations continued
The types of derivatives used by Jackson and their purpose are as follows:
• Interest rate swaps generally involve the exchange of fixed and floating payments over the period for which Jackson holds the instrument without an exchange of the underlying principal amount. These agreements are used for hedging purposes;
• Put-swaption contracts provide the purchaser with the right, but not the obligation, to require the writer to pay the present value of a long-duration interest rate swap at future exercise dates. Jackson purchases and writes put-swaptions with maturities up to 10 years. Put-swaptions hedge against significant movements in interest rates;
• Equity index futures contracts and equity index options (including various call, put options and put spreads) are used to hedge Jackson’s obligations associated with its issuance of fixed indexed immediate and deferred annuities and certain VA guarantees. These annuities and guarantees contain embedded options which are fair valued for financial reporting purposes;
• Total return swaps in which Jackson receives equity returns or returns based on reference pools of assets in exchange for short-term floating rate payments based on notional amounts, are held for both hedging and investment purposes;
• Cross-currency swaps, which embody spot and forward currency swaps and additionally, in some cases, interest rate swaps and equity index swaps, are entered into for the purpose of hedging Jackson’s foreign currency denominated funding agreements supporting trust instrument obligations; and
• Credit default swaps, represent agreements under which Jackson has purchased default protection on certain underlying corporate bonds held in its portfolio. These contracts allow Jackson to sell the protected bonds at par value to the counterparty if a default event occurs in exchange for periodic payments made by Jackson for the life of the agreement. Jackson does not write default protection using credit derivatives.
Note D3(j) parts (iii) and (iv) show the sensitivities of Jackson’s results through its exposure to equity risk and interest rate risk.
g ProcessforsettingassumptionsanddeterminingcontractliabilitiesUnder the MSB of reporting applied under IFRS 4 for insurance contracts, providing the requirements of the Companies Act, UK GAAP standards and the ABI SORP are met, it is permissible to reflect the previously applied UK GAAP basis. Accordingly, and consistent with the basis explained in note A4, in the case of Jackson, the carrying values of insurance assets and liabilities are consolidated into the Group accounts based on US GAAP. Under US GAAP, investment contracts (as defined for US GAAP purposes) are accounted for by applying in the first instance a retrospective deposit method to determine the liability for policyholder benefits. This is then augmented by potentially three additional amounts. These amounts are for:
• any amounts that have been assessed to compensate the insurer for services to be performed over future periods (ie deferred income),
• any amounts previously assessed against policyholders that are refundable on termination of the contract, and• any probable future loss on the contract (ie premium deficiency).
Capitalised acquisition costs and deferred income for these contracts are amortised over the life of the book of contracts. The present value of the estimated gross profits is generally computed using the rate of interest that accrues to policyholder balances (sometimes referred to as the contract rate). Estimated gross profits include estimates of the following elements, each of which will be determined based on the best estimate of amounts of the following individual elements over the life of the book of contracts without provision for adverse deviation for:
• amounts expected to be assessed for mortality less benefit claims in excess of related policyholder balances,• amounts expected to be assessed for contract administration less costs incurred for contract administration,• amounts expected to be earned from the investment of policyholder balances less interest credited to policyholder balances, • amounts expected to be assessed against policyholder balances upon termination of contracts (sometimes referred to as surrender
charges), and• other expected assessments and credits.
VA contracts written by Jackson may, as described above, provide for GMDB, GMIB, GMWB and GMAB features. In general terms, liabilities for these benefits are accounted for under US GAAP by using estimates of future benefits and fees under best estimate persistency assumptions. In accordance with US GAAP, the ‘grandfathered’ basis for IFRS, which specifies how certain guarantee features should be accounted for, the GMDB and the ‘for life’ portion of GMWB liabilities are not fair valued but are instead determined each period end by estimating the expected value of benefits in excess of the projected account balance and recognising the excess ratably over the life of the contract based on total expected assessments. At 31 December 2011, these liabilities were valued using a series of deterministic investment performance scenarios, a mean investment return of 8.4 per cent (2010: 8.4 per cent) and assumptions for lapse, mortality and expense that are the same as those used in amortising the capitalised acquisition costs.

259F
ina
ncia
l statem
en
tsD: L
ife assuran
ce busin
ess
The direct GMIB liability is determined by estimating the expected value of the annuitisation benefits in excess of the projected account balance at the date of annuitisation and recognising the excess ratably over the accumulation period based on total expected assessments. GMIB benefits are essentially fully reinsured, subject to annual claim limits. As this reinsurance benefit is net settled, it is considered to be a derivative under IAS 39 and is, therefore, recognised at fair value with the change in fair value included as a component of short-term derivative fluctuations. The assumptions used for calculating the direct GMIB liability at 31 December 2011 and 2010 are consistent with those used for calculating the GMDB and ‘for life’ GMWB liabilities. The change in these reserves, along with claim payments and associated fees included in reserves are included along with the hedge results in short-term fluctuations, resulting in removal of the market impact from the operating profit based on longer-term investment returns. Jackson regularly evaluates estimates used and adjusts the additional GMDB, GMIB and GMWB ‘for life’ liability balances, with a related charge or credit to benefit expense, if actual experience or other evidence suggests that earlier assumptions should be revised. GMWB ‘not for life’ features, are considered to be embedded derivatives under IAS 39. Therefore, provisions for these benefits are recognised at fair value, with the change in fair value included in short-term fluctuations. For GMWB and GMIB reinsurance embedded derivatives that are fair valued under IAS 39, Jackson bases its volatility assumptions solely on implied market volatility with no reference to historical volatility levels and explicitly incorporates Jackson’s own credit risk in determining discount rates. Volatility assumptions are based on a weighting of available market data on implied volatility for durations up to ten years, at which point the projected volatility is held constant. Non-performance risk is incorporated into the calculation through the use of discount interest rates sourced from a AA corporate credit curve. Other risk margins, particularly for market illiquidity and policyholder behaviour are also incorporated into the model through the use of explicitly conservative assumptions. On a periodic basis, Jackson rationalises the resulting fair values based on comparisons to other models and market movements. With the exception of the GMDB, GMIB, GMWB and GMAB features of VA contracts, the financial guarantee features of Jackson’s contracts are in most circumstances not explicitly valued, but the impact of any interest guarantees would be reflected as they are earned in the current account value (ie the US GAAP liability). For traditional life insurance contracts, provisions for future policy benefits are determined under US GAAP using the net level premium method and assumptions as of the issue date as to mortality, interest, policy lapses and expenses plus provisions for adverse deviation. Institutional products are accounted for as investment contracts under IFRS with the liability classified as being in respect of financial instruments rather than insurance contracts, as defined by IFRS 4. In practice, there is no material difference between the IFRS and US GAAP basis of recognition and measurement for these contracts. Certain institutional products representing obligations issued in currencies other than US dollars have been hedged for changes in exchange rates using cross-currency swaps. The fair value of derivatives embedded in funding agreements, as well as foreign currency transaction gains and losses, are included in the carrying value of the trust instruments supported by funding agreements recorded in other non-insurance liabilities. DeferredacquisitioncostsUnder IFRS 4, the Group applies ‘grandfathered’ US GAAP for measuring the insurance assets and liabilities of Jackson. In the case of Jackson term business, acquisition costs are deferred and amortised in line with expected premiums. For annuity and interest-sensitive life business, acquisition costs are deferred and amortised in line with a combination of historical and future expected gross profits on the relevant contracts. For fixed and indexed annuity and interest-sensitive life business, the key assumption is the long-term spread between the earned rate on investments and the rate credited to policyholders, which is based on an annual spread analysis. Expected gross profits also depend on mortality assumptions, assumed unit costs and terminations other than deaths (including the related charges), all of which are based on a combination of actual experience of Jackson, industry experience and future expectations. A detailed analysis of actual mortality, lapse and expense experience is performed using internally developed experience studies. As with fixed and indexed annuity and interest-sensitive life business, acquisition costs for Jackson’s variable annuity products are amortised in line with the emergence of profits. The measurement of the amortisation in part reflects current period fees (including those for guaranteed minimum death, income, or withdrawal benefits) earned on assets covering liabilities to policyholders, and the historical and expected level of future gross profits which depends on the assumed level of future fees, as well as components related to mortality, lapse and expense.

260
Prudential plc Annual Report 2011
D: Life assurance business continued
Financial statements | Notes on the Group financial statements
D3: US insurance operations continued
Mean reversion techniqueUnder US GAAP (as ‘grandfathered’ under IFRS 4) the projected gross profits, against which acquisition costs are amortised, reflect an assumed long-term level of investment return from the separate accounts which, for Jackson, is 8.4 per cent after deduction of net external fund management fees. This is applied to the period end level of separate account assets after application of a mean reversion technique that removes a portion of the effect of levels of short-term variability in current market returns. Under the mean reversion technique applied by Jackson, the projected level of return for each of the next five years is adjusted from period to period so that in combination with the actual rates of return for the preceding two years and the current year, the 8.4 per cent annual return is realised on average over the entire eight-year period. Projected returns after the mean reversion period revert back to the 8.4 per cent assumption. However, to ensure that the methodology does not over anticipate a reversion to trend following adverse markets, the mean reversion technique has a cap and floor feature whereby the projected returns in each of the next five years can be no more than 15 per cent per annum and no less than 0 per cent per annum (both gross of asset management fees) in each year. The capping feature was relevant in late 2008, 2009 and 2010 due to the very sharp market falls in 2008. At 31 December 2011, the projected rate of return for the next five years is less than 8.4 per cent. If Jackson had not applied the mean reversion methodology and had instead applied a constant 8.4 per cent from asset values at 31 December 2011, the Jackson DAC balance would increase by approximately £38 million from £3,880 million to £3,918 million (31 December 2010 decrease of £80 million from £3,543 million to £3,463 million).
Sensitivity of amortisation chargeIn 2008, the application of the mean reversion technique benefited the results by £110 million. In 2009 and 2010, whilst the cap was in effect, the credit of £39 million for decelerated amortisation and the charge of £11 million for accelerated amortisation reflected the difference between market returns for the period and the assumed level of 15 per cent. For 2011, the separate account return (net of all fees) was approximately negative 4 per cent. The DAC amortisation charge included in operating profit includes £232 million of accelerated amortisation. This amount reflects the combined effect of:
(i) the separate account performance in the year as it compares with the assumed level for the year; and(ii) the reduction in the previously assumed future rates of return for the upcoming five years from 15 per cent, to a level somewhat
below the middle of the corridor (of 0 and 15 per cent), so that in combination with the historical returns, the 8-year average in the mean reversion calculation is the 8.4 per cent long-term assumption.
The reduction in assumed future rates reflects in large part the elimination from the calculation in 2011, of the negative 2008 returns. Setting aside other complications and the growth in the book, the 2011 accelerated amortisation can be broadly equated as ‘paying back’ the benefit experienced in 2008. Separately, as explained in note A5 it is the Company’s intention to adopt the US Financial Accounting Standards Board requirements in EITF Update No 2010 -26 on ‘Accounting for Costs Associated with Acquiring or Renewing Insurance Contracts’ from 1 January 2012 into Prudential’s Group IFRS reporting for the results of Jackson and those Asian operations that use US GAAP for measuring insurance assets and liabilities. Under the Update, insurers are required to capitalise only those incremental costs directly related to acquiring a contract from 1 January 2012. This change has two principal effects on the 2011 and 2010 results, which are to be retrospectively adjusted in the 2012 Group financial statements.
(i) Charging of acquisition costs for business written in the year that can no longer be deferred.
For 2011 and 2010, £156 million and £158 million of acquisition costs will be charged to the operating results of Jackson for these years. These charges are for the non-incremental acquisition costs for new business written in these years, as shown in note Y, representing 12 per cent of APE of £1,251 million and 14 per cent of £1,164 million, respectively.

261F
ina
ncia
l statem
en
tsD: L
ife assuran
ce busin
ess
(ii) Reduced amortisation charge for retrospectively adjusted deferred acquisition costs.
On application of the Update, Jackson’s:
(i) deferred acquisition costs balance for business in force at 31 December 2011 will be retrospectively reduced by 20 per cent, from £3,880 million to £3,095 million;
(ii) amortisation charge to the 2011 operating profit based on longer-term investment returns is retrospectively adjusted by 18 per cent from £619 million (comprising £387 million core charge and £232 million accelerated amortisation) to £506 million (comprising £316 million core charge and £190 million accelerated amortisation). The core charge alters from representing 29 per cent to:
– 24 per cent of operating profit, based on longer-term investment returns before DAC amortisation and the charge for acquisition costs for business written in the year that can no longer be deferred, and
– 27 per cent of operating profit, based on longer-term investment returns before DAC amortisation but after the charge for acquisition costs for business written in the year that can no longer be deferred; and
(iii) amortisation charge to the 2010 operating profit based on longer-term investment returns is retrospectively adjusted by 16 per cent from £334 million (comprising £323 million core charge and £11 million accelerated amortisation) to £280 million (comprising £271 million core charge and £9 million accelerated amortisation). The core charge alters from representing 28 per cent to:
– 23 per cent of operating profit based on longer-term investment returns before DAC amortisation and the charge for acquisition costs for business written in the year that can no longer be deferred, and
– 27 per cent of operating profit, based on longer-term investment returns before DAC amortisation but after the charge for acquisition costs for business written in the year that can no longer be deferred.
For 2012, the impact of application of the Update on the new business strain for non-incremental acquisition costs and amortisation charge to operating profits based on longer-term investment returns and the DAC balance in the statement of financial position is expected to follow a broadly similar pattern to those described above. On the assumption that market returns for 2012 are within the range of negative 15 per cent to positive 15 per cent, the estimated effect on the amortisation charge, under the new DAC basis described above, is a range from acceleration of £100 million to deceleration of £100 million.
Statementofchangesinequity–‘shadowDACadjustments’Consequent upon the positive unrealised valuation movement in 2011 of £811 million (2010: positive £1,221 million) there is a debit of £331 million (2010: £496 million debit) for altered ‘shadow’ DAC amortisation booked within other comprehensive income. These adjustments reflect movement from period to period, in the changes to the pattern of reported gross profits that would have happened if the assets reflected in the statement of financial position had been sold, crystallising the unrealised gains or losses, and the proceeds reinvested at the yields currently available in the market. At 31 December 2011, the cumulative ‘shadow DAC balance’ was negative £866 million (2010: negative £520 million).
h ReinsuranceThe principal reinsurance ceded by Jackson outside the Group is on term life insurance, direct and assumed accident and health business and GMIB variable annuity guarantees. In 2011, the premiums for such ceded business amounted to £72 million (2010: £83 million). Net commissions received on ceded business and claims incurred ceded to external reinsurers totalled £9 million and £84 million respectively during 2011 (2010: £12 million and £72 million respectively). There were no deferred gains or losses on reinsurance contracts in either 2011 or 2010. The reinsurance asset for business ceded outside the Group was £907 million (2010: £695 million).
i EffectofchangesinassumptionsusedtomeasureinsuranceassetsandliabilitiesIn 2011 and 2010, there were no changes of assumptions that had a material impact on the results of US insurance operations.

262
Prudential plc Annual Report 2011
D: Life assurance business continued
Financial statements | Notes on the Group financial statements
D3: US insurance operations continued
j SensitivityofIFRSbasisprofitandshareholders’equitytomarketandotherrisksThe estimated sensitivity of Jackson’s profit and shareholders’ equity to equity and interest rate risks provided below is net of the related changes in amortisation of DAC. The effect on the related changes in amortisation of DAC provided is based on the current ‘grandfathered’ US GAAP DAC basis but does not include any effect from an acceleration or deceleration of amortisation of DAC. Note A5 provides explanation of the new US GAAP DAC basis intended to be adopted by the Company from 1 January 2012. Note D3(g) above provides an explanation of the dynamics that affect the amortisation charge and an indicative sensitivity for the 2012 results on the new US GAAP DAC basis.
i ExposuretoequityriskVariable annuity contract relatedJackson issues variable contracts through its separate accounts for which investment income and investment gains and losses accrue to, and investment risk is borne by, the contract holder (traditional variable annuities). It also issues variable annuity and life contracts through separate accounts where it contractually guarantees to the contract holder (variable contracts with guarantees) either a) return of no less than deposits made to the contract adjusted for any partial withdrawals, b) total deposits made to the contract adjusted for any partial withdrawals plus a minimum return, or c) the highest contract value on a specified anniversary date adjusted for any withdrawals following the contract anniversary. These guarantees include benefits that are payable in the event of death (GMDB), annuitisation (GMIB), at specified dates during the accumulation period (GMWB) or at the end of a specified period (GMAB). At 31 December 2011 and 2010, Jackson had variable annuity contracts with guarantees, for which the net amount at risk (‘NAR’) is generally the amount of guaranteed benefit in excess of current account value, as follows:
31December2011Minimum
return
Accountvalue
£m
Netamountatrisk
£m
Weightedaverage
attainedage
Perioduntilexpected
annuitisation
Return of net deposits plus a minimum return GMDB 0-6% 31,571 2,914 64.2 years GMWB – Premium only 0% 2,325 195 GMWB* 0-5% 2,582 582* GMAB – Premium only 0% 54 2 Highest specified anniversary account value minus withdrawals post-anniversary GMDB 4,002 678 63.7 years GMWB – Highest anniversary only 1,855 423 GMWB* 735 217* Combination net deposits plus minimum return, highest specified anniversary account value minus withdrawals post-anniversary GMDB 0-6% 2,098 479 66.1 years GMIB 0-6% 1,661 575 4.2 years GMWB* 0-8%† 21,902 2,263*

263F
ina
ncia
l statem
en
tsD: L
ife assuran
ce busin
ess
31December2010Minimum
return
Accountvalue
£m
Netamountatrisk
£m
Weightedaverage
attainedage
Perioduntilexpected
annuitisation
Return of net deposits plus a minimum return GMDB 0-6% 25,540 2,106 64.0 years GMWB – Premium only 0% 2,742 149 GMWB* 0-5%† 1,996 415* GMAB – Premium only 0% 48 1 Highest specified anniversary account value minus withdrawals post-anniversary GMDB 3,742 466 63.3 years GMWB – Highest anniversary only 2,010 343 GMWB* 852 196* Combination net deposits plus minimum return, highest specified anniversary account value minus withdrawals post-anniversary GMDB 0-6% 1,768 311 65.7 years GMIB 0-6% 1,933 418 5.1 years GMWB* 0-8%† 15,025 672*
* Amounts shown for GMWB comprise sums for the ‘not for life’ portion (where the guaranteed withdrawal base less the account value equals to the net amount at risk (NAR)), and a ‘for life’ portion (where the NAR has been estimated as the present value of future expected benefit payment remaining after the amount of the ‘not for life’ guaranteed benefits is zero).
† Ranges shown based on simple interest. The upper limits of 5 per cent, or 8 per cent simple interest are approximately equal to 4.1 per cent and 6 per cent respectively, on a compound interest basis over a typical 10-year bonus period. For example 1 + 10 x 0.5 is similar to 1.041 growing at a compound rate of 4.01 per cent for a further nine years.
Account balances of contracts with guarantees were invested in variable separate accounts as follows:
2011 £m 2010 £m
Mutual fund type: Equity 28,902 23,841 Bond 4,251 3,417 Balanced 3,846 3,345 Money market 677 451
Total 37,676 31,054
As noted in note D3(f), Jackson is exposed to equity risk through the options embedded in the fixed indexed liabilities and GMDB and GMWB guarantees included in certain VA benefits as illustrated above. This risk is managed using an equity hedging programme to minimise the risk of a significant economic impact as a result of increases or decreases in equity market levels while taking advantage of naturally offsetting exposures in Jackson’s operations. Jackson purchases external futures and options that hedge the risks inherent in these products, while also considering the impact of rising and falling separate account fees. As a result of this hedging programme, if the equity markets were to increase further in the future, the net effect of Jackson’s free-standing derivatives would decrease in value. However, over time, this movement would be broadly offset by increased separate account fees and reserve decreases, net of the related changes to amortisation of deferred acquisition costs. Due to the nature of the free-standing and embedded derivatives, this hedge, while highly effective on an economic basis, may not completely mute in the financial reporting the immediate impact of equity market movements as the free-standing derivatives reset immediately while the hedged liabilities reset more slowly and fees are recognised prospectively. The net effect of opposite impacts would be observed if the equity markets were to decrease.

264
Prudential plc Annual Report 2011
D: Life assurance business continued
Financial statements | Notes on the Group financial statements
D3: US insurance operations continued
At 31 December 2011, based on the hedges in place at that time, the estimated sensitivity of Jackson’s pre-tax profit for VA business, net of related changes in amortisation of DAC (excluding the impact on future separate account fees), profit after tax and shareholders’ equity to immediate increases and decreases in equity markets is as follows:
2011 £m 2010 £m
Decreaseof20%
Decreaseof10%
Increaseof10%
Increaseof20%
Decreaseof20%
Decreaseof10%
Increaseof10%
Increaseof20%
Pre-tax profit, net of related changes in amortisation of DAC (excluding impact on future separate account fees) 267 149 (195) (447) 159 90 (98) (178)
Related deferred tax effects (93) (52) 68 156 (56) (31) 34 62
Net sensitivity of profit after tax and shareholders' equity 174 97 (127) (291) 103 59 (64) (116)
The above table provides sensitivity movements as at a point in time while the actual impact on financial results would vary contingent upon the volume of new product sales and lapses, changes to the derivative portfolio, correlation of market returns and various other factors including volatility, interest rates and elapsed time.
Other exposure to equity risk In addition to the exposure explained above, Jackson is also exposed to equity risk from its holding of equity securities, partnerships in investment pools and other financial derivatives. A range of reasonably possible movements in the value of equity securities, partnerships in investment pools and other financial derivatives have been applied to Jackson’s holdings at 31 December 2011 and 2010. The table below shows the sensitivity to a 10 and 20 per cent fall in value and the impact that this would have on pre-tax profit, net of related changes in amortisation of DAC, profit after tax and shareholders’ equity.
2011 £m 2010 £m
Decreaseof20%
Decreaseof10%
Decreaseof20%
Decreaseof10%
Pre-tax profit, net of related changes in amortisation of DAC (121) (61) (143) (72)Related deferred tax effects 42 21 50 25
Net sensitivity of profit after tax and shareholders’ equity (79) (40) (93) (47)
A 10 or 20 per cent increase in their value is estimated to have an approximately equal and opposite effect on profit and shareholders’ equity to the sensitivities shown above. In the equity risk sensitivity analysis shown above, the Group has considered the impact of an instantaneous 20 per cent fall in equity markets. If equity markets were to fall by more than 20 per cent, the Group believes that this would not be an instantaneous fall but rather this would be expected to occur over a period of time during which the Group would be able to put in place mitigating management actions.
ii ExposuretointerestrateriskNotwithstanding the market risk exposure previously described, except in the circumstances of interest rate scenarios where the guarantee rates included in contract terms are higher than crediting rates that can be supported from assets held to cover liabilities, the accounting measurement of fixed annuity liabilities of Jackson products is not generally sensitive to interest rate risk. This position derives from the nature of the products and the US GAAP basis of measurement. The GMWB features attaching to variable annuity business (other than ‘for-life’) represents embedded derivatives which are fair valued and so will be sensitive to changes in interest rate.

265F
ina
ncia
l statem
en
tsD: L
ife assuran
ce busin
ess
Debt securities and related derivatives are marked to fair value. Value movements on derivatives, again net of related changes to amortisation of DAC and deferred tax, are recorded within profit and loss. Fair value movements on debt securities, net of related changes to amortisation of DAC and deferred tax, are recorded within other comprehensive income. The estimated sensitivity of these items and policyholder liabilities to a 1 per cent and 2 per cent decrease and increase in interest rates at 31 December 2011 and 2010 is as follows:
2011 £m 2010 £m
A2%decrease
A1%decrease
A1%increase
A2%increase
A2%decrease
A1%decrease
A1%increase
A2%increase
Profit and lossDirect effect Derivatives value change 1,549 736 (592) (1,078) 842 363 (277) (529) Policyholder liabilities (925) (446) 395 753 (547) (243) 219 416 Related effect on amortisation of DAC (151) (69) 36 48 47 23 (34) (63)
Pre-tax profit effect 473 221 (161) (277) 342 143 (92) (176)Related effect on charge for deferred tax (166) (77) 56 97 (120) (50) 32 62
Net profit effect 307 144 (105) (180) 222 93 (60) (114)
Other comprehensive income Direct effect on carrying value of debt securities 2,679 1,513 (1,513) (2,679) 2,663 1,454 (1,454) (2,663)
Related effect on amortisation of DAC (1,144) (646) 646 1,144 (1,174) (641) 641 1,174
Related effect on movement in deferred tax (537) (303) 303 537 (521) (285) 285 521
Net effect 998 564 (564) (998) 968 528 (528) (968)
Total net effect on shareholders' equity 1,305 708 (669) (1,178) 1,190 621 (588) (1,082)
These sensitivities are shown only for interest rates in isolation and do not include other movements in credit risk that may affect credit spreads and valuations of debt securities.
iii CurrencytranslationConsistent with the Group’s accounting policies, the profits of the Group’s US operations are translated at average exchange rates and shareholders’ equity at the closing rate for the reporting period. For 2011, the rates were US$1.60 (2010: US$1.55) and US$1.55 (2010: $1.57) to £1 sterling, respectively. A 10 per cent increase or decrease in these rates would reduce or increase profit before tax attributable to shareholders, profit for the year and shareholders’ equity attributable to US insurance operations respectively as follows:
A10%increaseinexchangerates
A10%decreaseinexchangerates
2011 £m 2010 £m 2011 £m 2010 £m
Profit before tax attributable to shareholders note (i) (54) (41) 66 50 Profit for the year (39) (31) 48 37 Shareholders’ equity attributable to US insurance operations (388) (347) 475 424
Note(i) Sensitivity on profit before tax ie aggregate of the operating profit based on longer-term investment returns and short-term fluctuations in
investment returns.
In addition, the total profit (loss) for Jackson is affected by the level of impairment losses on the debt securities portfolio, net effect of market risk arising from the incidence and valuation of guarantee features, guaranteed benefit payments and equity index participation features, offset by variability of benefit related fees and equity derivative hedging performance, short-term value movements on derivatives held to manage the fixed annuity and other general account business, and other temporary value movements on portfolio investments classified as fair value through profit and loss.

266
Prudential plc Annual Report 2011
D: Life assurance business continued
Financial statements | Notes on the Group financial statements
D3: US insurance operations continued
iv OthersensitivitiesAs noted in section D1, total profit is very sensitive to market risk on the assets covering liabilities other than variable annuity business segregated in the separate accounts. As with other shareholder-backed business the profit or loss for Jackson is presented by distinguishing the result for the year between an operating result based on longer-term investment returns and short-term fluctuations in investment returns. In this way the most significant direct effect of market changes that have taken place to the Jackson result are separately identified. The principal determinants of variations in operating profit based on longer-term returns are:
• growth in the size of assets under management covering the liabilities for the contracts in force, • variations in fees and other income, offset by variations in market value adjustment payments and, where necessary, strengthening
of liabilities,• spread returns for the difference between investment returns and rates credited to policyholders, and• amortisation of deferred acquisition costs.
For term business, acquisition costs are deferred and amortised in line with expected premiums. For annuity business, acquisition costs are deferred and amortised in line with expected gross profits on the relevant contracts. For interest-sensitive business, the key assumption is the expected long-term spread between the earned rate and the rate credited to policyholders, which is based on an annual spread analysis. In addition, expected gross profits depend on mortality assumptions, assumed unit costs and terminations other than deaths (including the related charges) all of which are based on a combination of actual experience of Jackson, industry experience and future expectations. A detailed analysis of actual experience is measured by internally developed expense, mortality and persistency studies. Except to the extent of mortality experience, which primarily affects profits through variations in claim payments and GMDB reserves, the profits of Jackson are relatively insensitive to changes in insurance risk. For variable annuity business, the key assumption is the expected long-term level of separate account returns, which for 2011 and 2010 was 8.4 per cent. The impact of using this return is reflected in two principal ways, namely:
(i) Through the projected expected gross profits which are used to determine the amortisation of deferred acquisition costs. This is applied through the use of a mean reversion technique which is described in more detail in note D3(g) above; and
(ii) The required level of provision for guaranteed minimum death benefit claims.
k DurationofliabilitiesThe table below shows the carrying value of policyholder liabilities. Separately, the Group uses cash flow projections of expected benefit payments as part of the determination of the value of in-force business when preparing EEV basis results. The table below also shows the maturity profile of the cash flows used for that purpose for 2011 and 2010:
2011 £m 2010 £m
Fixedannuityand
otherbusiness(includingGICsandsimilar
contracts)Variableannuity Total
Fixedannuityand
otherbusiness(includingGICsandsimilar
contracts)Variableannuity Total
Policyholder liabilities 31,356 37,833 69,189 29,320 31,203 60,523
% % % % % %
Expected maturity: 0 to 5 years 47 47 47 50 50 50 5 to 10 years 27 30 29 27 29 28 10 to 15 years 11 13 12 11 12 12 15 to 20 years 6 6 6 5 6 5 20 to 25 years 5 2 3 3 2 3 Over 25 years 4 2 3 4 1 2
The maturity tables shown above have been prepared on a discounted basis. Details of undiscounted cash flows for investment contracts are shown in note G2.

267F
ina
ncia
l statem
en
tsD: L
ife assuran
ce busin
ess
D4: Asian insurance operations
a Summary statement of financial position
2011 £m 2010 £m
With-profitsbusiness
note (i)
Unit-linkedassetsandliabilities Other Total Total
AssetsIntangible assets attributable to shareholders: Goodwill – – 235 235 236 Deferred acquisition costs and other intangible assets – – 1,027 1,027 962
Total – – 1,262 1,262 1,198
Intangible assets attributable to with-profits funds: Deferred acquisition costs and other intangible assets 83 – – 83 97 Deferred tax assets – 2 113 115 98 Other non-investment and non-cash assets 303 93 628 1,024 788 Investments of long-term business and other operations: Investment properties – – 10 10 9 Investments accounted for using the equity method – – – – 2 Financial investments: Loans 774 – 459 1,233 1,340 Equity securities and portfolio holdings in unit trusts 2,744 8,663 590 11,997 14,464 Debt securities 9,554 2,746 5,381 17,681 14,108 Other investments 286 26 158 470 382 Deposits 123 578 464 1,165 638
Total investments 13,481 12,013 7,062 32,556 30,943
Cash and cash equivalents 625 579 773 1,977 1,601
Totalassets 14,492 12,687 9,838 37,017 34,725
Equityandliabilities Equity Shareholders’ equity – – 2,349 2,349 2,149 Non-controlling interests – – 5 5 5
Total equity – – 2,354 2,354 2,154
Liabilities Policyholder liabilities and unallocated surplus of
with-profits funds: Contract liabilities (including amounts in respect of contracts
classified as investment contracts under IFRS 4) 12,593 12,015 6,254 30,862 28,674 Unallocated surplus of with-profits fundsnote (ii) 50 – – 50 66
Total 12,643 12,015 6,254 30,912 28,740
Operational borrowings attributable to shareholders-financed operations – – 141 141 189
Deferred tax liabilities 348 33 132 513 495 Other non-insurance liabilities 1,501 639 957 3,097 3,147
Total liabilities 14,492 12,687 7,484 34,663 32,571
Totalequityandliabilities 14,492 12,687 9,838 37,017 34,725
Notes(i) The statement of financial position for with-profits business comprises the with-profits assets and liabilities of the Hong Kong, Malaysia and
Singapore with-profits operations. Assets and liabilities of other participating business are included in the column for ‘Other business’.(ii) For the purposes of the presentation of unallocated surplus of with-profits within the statement of financial position, the Hong Kong branch
balance is reported within the unallocated surplus of the PAC with-profits sub-fund of the UK insurance operations.

268
Prudential plc Annual Report 2011
D: Life assurance business continued
Financial statements | Notes on the Group financial statements
D4: Asian insurance operations continued
(iii) Asian insurance operations The loans of the Group’s Asian insurance operations comprise:
2011 £m 2010 £m
Mortgage loans* 31 25 Policy loans* 572 528 Other loans† 630 787
Total Asia insurance operations loans 1,233 1,340
* The mortgage and policy loans are secured by properties and life insurance policies respectively.† The majority of the other loans are commercial loans held by the Malaysian operation and which are all investment graded by two local
rating agencies.
Summary policyholder liabilities (net of reinsurance) and unallocated surplusAt 31 December 2011, the policyholder liabilities (net of reinsurance of £151 million (2010: £41 million)), and unallocated surplus for Asian operations of £30.8 billion (2010: £28.7 billion) comprised the following:
2011 £m 2010 £m
Singapore 9,323 9,731 Hong Kong 8,279 6,621 Malaysia 2,829 2,544 Indonesia 1,809 1,475 Korea 1,852 1,897 Taiwan 1,429 968 Other countries 5,240 5,463
Total Asian operations 30,761 28,699

269F
ina
ncia
l statem
en
tsD: L
ife assuran
ce busin
ess
b ReconciliationofmovementininvestmentsA reconciliation of the total investments of Asian insurance operations from the beginning of the year to the end of the year is as follows:
With-profitsbusiness
£m
Unit-linkedassetsandliabilities
£mOther
£m
Asianinsuranceoperations
Total £m
At1January2010 Total investments (including derivative assets) 9,547 9,953 3,890 23,390 Less: Investments held by consolidated investment funds (270) (218) (230) (718) Less: Derivative liabilities (63) – (83) (146)
Directly held investments, net of derivative liabilities 9,214 9,735 3,577 22,526
Net cash inflow from operating activities 278 838 1,051 2,167 Realised gains in the year 638 327 19 984 Unrealised gains and losses and exchange movements in the year 993 1,786 522 3,301 Acquisition of UOB Life Assurance Limited 527 3 474 1,004
Movement in the year of directly held investments, net of derivative liabilities 2,436 2,954 2,066 7,456
At31December2010/1January2011 Total investments (including derivative assets) 12,152 12,955 5,836 30,943 Less: Investments held by consolidated investment funds (382) (266) (91) (739) Less: Derivative liabilitiesnote G3 (120) – (102) (222)
Directly held investments, net of derivative liabilities 11,650 12,689 5,643 29,982
Net cash inflow from operating activities 381 659 1,247 2,287 Realised gains in the year 310 149 44 503 Unrealised gains and losses and exchange movements in the year 444 (1,767) (20) (1,343)
Movement in the year of directly held investments, net of derivative liabilities 1,135 (959) 1,271 1,447
At31December2011 Total investments (including derivative assets) 13,481 12,013 7,062 32,556 Less: Investments held by consolidated investment funds (366) (278) (3) (647) Less: Derivative liabilitiesnote G3 (330) (5) (145) (480)
Directly held investments, net of derivative liabilities 12,785 11,730 6,914 31,429

270
Prudential plc Annual Report 2011
D: Life assurance business continued
Financial statements | Notes on the Group financial statements
D4: Asian insurance operations continued
c Reconciliationofmovementinpolicyholderliabilitiesandunallocatedsurplusofwith-profitsfundsA reconciliation of the total policyholder liabilities and unallocated surplus of with-profits funds of Asian insurance operations from the beginning of the year to the end of the year is as follows:
With-profitsbusiness
£m
Unit-linkedassetsandliabilities
£mOther
£mTotal
£m
At1January2010 8,861 9,717 3,333 21,911 Comprising: – Policyholder liabilities 8,808 9,717 3,333 21,858 – Unallocated surplus of with-profits funds 53 – – 53
Premiums New business 141 1,072 452 1,665 In-force 897 1,130 616 2,643
1,038 2,202 1,068 4,308 Surrenders (441) (1,572) (228) (2,241)Maturities/Deaths (326) (40) (132) (498)
Net flows 271 590 708 1,569 Shareholders’ transfers post tax (24) – – (24)Investment-related items and other movements 693 1,405 137 2,235 Foreign exchange translation differences 719 1,009 353 2,081 Acquisition of UOB Life Assurance Limited note (e) 504 3 461 968
At31December2010/1January2011 11,024 12,724 4,992 28,740 Comprising: – Policyholder liabilities 10,958 12,724 4,992 28,674 – Unallocated surplus of with-profits funds 66 – – 66
Premiums New business 162 1,136 723 2,021 In-force 1,110 1,163 785 3,058
1,272 2,299 1,508 5,079 Surrenders (502) (1,490) (245) (2,237)Maturities/Deaths (431) (39) (194) (664)
Net flows 339 770 1,069 2,178 Shareholders’ transfers post tax (30) – – (30)Investment-related items and other movements note (d) 1,274 (1,154) 245 365 Foreign exchange translation differences note (a) 36 (325) (52) (341)
At31December2011 12,643 12,015 6,254 30,912
Comprising: – Policyholder liabilities 12,593 12,015 6,254 30,862 – Unallocated surplus of with-profits funds 50 – – 50
Average policyholder liability balances* 2011 11,775 12,370 5,623 29,768 2010 10,135 11,222 4,393 25,750
* Adjusted for transactions in the period and excluding the unallocated surplus of with-profits funds.

271F
ina
ncia
l statem
en
tsD: L
ife assuran
ce busin
ess
Notes(a) Movements in the period have been translated at the average exchange rate for the year ended 31 December 2011. The closing balance has been
translated at the closing spot rates as at 31 December 2011. Differences upon retranslation are included in foreign exchange translation differences.(b) Net flows have increased by £609 million from £1,569 million in 2010 to £2,178 million in 2011, primarily reflecting increased flows from new
business and the growth in the in-force book. (c) The rate of surrenders for unit-linked and other shareholder business (expressed as a percentage of opening liabilities) was 9.8 per cent
compared with 13.8 per cent in 2010. (d) The investment-related and other items and other movements for unit-linked business of negative £1,154 million in 2011 was mainly driven from
Asia equity market losses in the second half of 2011. (e) The acquisition of UOB Life Assurance Limited reflects the liabilities acquired at the date of acquisition.
d InformationoncreditrisksofdebtsecuritiesThe following table summarises the credit quality of the debt securities of the Asian insurance operations as at 31 December 2011 by rating agency ratings:
2011 £m 2010 £m
With-profitsbusiness
Unit-linkedassets Other Total Total
S&P – AAA 1,259 38 126 1,423 2,934 S&P – AA+ to AA- 2,161 83 1,599 3,843 2,138 S&P – A+ to A- 1,560 564 931 3,055 2,843 S&P – BBB+ to BBB- 1,032 104 315 1,451 913 S&P – Other 786 707 644 2,137 1,773
6,798 1,496 3,615 11,909 10,601
Moody’s – Aaa 818 222 449 1,489 65 Moody’s – Aa1 to Aa3 47 61 20 128 115 Moody’s – A1 to A3 191 17 96 304 130 Moody’s – Baa1 to Baa3 109 4 18 131 95 Moody’s – Other 34 9 16 59 49
1,199 313 599 2,111 454
Fitch 189 60 102 351 49 Other 1,368 877 1,065 3,310 3,004
Total Asia debt securities 9,554 2,746 5,381 17,681 14,108
The following table analyses debt securities of ‘Other business’ which are not externally rated:
2011 £m 2010 £m
Government bonds 244 350 Corporate bonds rated as investment grade by local external ratings agencies 776 666 Structured deposits issued by banks which are rated, but specific deposits are not – 5 Other 45 22
Total Asian operations 1,065 1,043

272
Prudential plc Annual Report 2011
D: Life assurance business continued
Financial statements | Notes on the Group financial statements
D4: Asian insurance operations continued
e ProductsandguaranteesThe life insurance products offered by the Group’s Asian operations include a range of with-profits and non-participating term, whole life, endowment and unit-linked policies. The Asian operations also offer health, disability, critical illness and accident coverage to supplement its core life products. The terms and conditions of the contracts written by the Asian operations and, in particular, the products’ options and guarantees, vary from territory to territory depending upon local market circumstances. In general terms, the Asian participating products provide savings and protection where the basic sum assured can be enhanced by a profit share (or bonus) from the underlying fund as determined at the discretion of the insurers. The Asian operations’ non-participating term, whole life and endowment products offer savings and/or protection where the benefits are guaranteed or determined by a set of defined market-related parameters. Unit-linked products combine savings with protection, the cash value of the policy depends on the value of the underlying unitised funds. Health and Protection (H&P) policies provide mortality or morbidity benefits and include health, disability, critical illness and accident coverage. H&P products are commonly offered as supplements to main life policies but can be sold separately. Subject to local market circumstances and regulatory requirements, the guarantee features described in note D2(e) in respect of UK business broadly apply to similar types of participating contracts written in the Hong Kong branch, Singapore and Malaysia. Participating products have both guaranteed and non-guaranteed elements. Non-participating long-term products are the only ones where the Group is contractually obliged to provide guarantees on all benefits. Investment-linked products have the lowest level of guarantee, if any. Product guarantees in Asia can be broadly classified into four main categories, namely premium rate, cash value and interest rate guarantees, policy renewability and convertibility options. The risks on death coverage through premium rate guarantees are low due to appropriate product pricing.
Cash value and interest rate guarantees are of three types:
• Maturity values Maturity values are guaranteed for non-participating products and on the guaranteed portion of participating products. Declared annual bonuses are also guaranteed once vested. Future bonus rates and cash dividends are not guaranteed on participating products.
• Surrender values Surrender values are guaranteed for non-participating products and on the guaranteed portion of participating products. The surrender value of declared reversionary bonuses are also guaranteed once vested. Market value adjustments and surrender penalties are used where the law permits such adjustments in cash values.
• Interest rate guarantees It is common in Asia for regulations or market-driven demand and competition to provide some form of capital value protection and minimum crediting interest rate guarantees. This would be reflected within the guaranteed maturity and surrender values. The guarantees are borne by shareholders for non-participating and investment-linked (non-investment guarantees only) products. Participating product guarantees are predominantly supported by the segregated life funds and their estates.
Whole of life contracts with floor levels of policyholder benefits that accrue at rates set at inception and do not vary subsequently with market conditions are written in the Korean life operations. This is to a much lesser extent than the policies written by the Taiwan agency business which was sold in the first half of 2009, as Korea has a much higher proportion of linked and health business. The Korean business has non-linked liabilities and linked liabilities at 31 December 2011 of £447 million and £1,407 million respectively (2010: £408 million and £1,491 million respectively). The other area of note in respect of guarantees is the Japanese business where pricing rates are higher than current bond yields. Lapse risk is a feature in that policyholders could potentially surrender their policies on guaranteed terms if interest rates significantly increased leaving the potential for losses if bond values had depreciated significantly. However, the business is matched to a relatively short realistic liability duration. The method for determining liabilities of insurance contracts for UK GAAP, and IFRS, purposes for some Asian operations is based on US GAAP principles and this method applies to contracts with cash value and interest rate guarantees. Following standard US GAAP procedure, premium deficiency reserve calculations are performed each year to establish whether the carrying values of the liabilities are sufficient. On the US GAAP basis the calculations are deterministic, that is to say based on a single set of projections, and expected long-term rates of return are applied.

273F
ina
ncia
l statem
en
tsD: L
ife assuran
ce busin
ess
f ExposuretomarketriskThe Asian operations sell with-profits and unit-linked policies and, although the with-profits business generally has a lower terminal bonus element than in the UK, the investment portfolio still contains a proportion of equities. Non-participating business is largely backed by debt securities or deposits. The exposure to market risk of the Group arising from its Asian operations is therefore at modest levels. This arises from the fact that the Asian operations have a balanced portfolio of with-profits, unit-linked and other types of business.
g ProcessforsettingassumptionsanddeterminingliabilitiesThe future policyholder benefit provisions for Asian businesses in the Group’s IFRS accounts and previously under the MSB, are determined in accordance with methods prescribed by local GAAP adjusted to comply, where necessary, with UK GAAP. For Asian operations in countries where local GAAP is not well established and in which the business written is primarily non-participating and linked business, US GAAP is used as the most appropriate reporting basis. This basis is applied in Japan, Vietnam, Taiwan and India. The future policyholder benefit provisions for non-linked business are determined using the net level premium method, with an allowance for surrenders, maintenance and claims expenses. Rates of interest used in establishing the policyholder benefit provisions vary by operation depending on the circumstances attaching to each block of business.
h ReinsuranceThe Asian businesses cede only minor amounts of business outside the Group with immaterial effects on reported profit. During 2011, reinsurance premiums for externally ceded business were £226 million (2010: £146 million) and the reinsurance assets were £151 million (2010: £41 million) in aggregate. i Effectofchangesinbases,estimatesandassumptionsusedtomeasureinsuranceassetsandliabilities2011In 2011, IFRS operating profit based on longer-term investment returns for Asian insurance operations included a net £38 million credit arising from a small number of items that are not anticipated to reoccur in future periods.
2010In 2010, one-off changes made to reserving assumptions resulted in a release from liabilities of £19 million.
j SensitivityofIFRSbasisprofitandshareholders’equitytomarketandotherrisksi Risksotherthancurrencytranslationa With-profits businessSimilar principles to those explained for UK with-profits business apply to profit emergence for the Asian with-profits business. Correspondingly, the profit emergence reflects bonus declaration and is relatively insensitive to period-by-period fluctuations in insurance risk or interest rate movements.
b Unit-linked businessAs for the UK insurance operations, the profits and shareholders’ equity related to the Asian operations is primarily driven by charges related to invested funds. The sensitivity of profits and shareholders’ equity to changes in insurance risk and to interest rate risk are not material.

274
Prudential plc Annual Report 2011
D: Life assurance business continued
Financial statements | Notes on the Group financial statements
D4: Asian insurance operations continued
c Other businessi Interest rate risk Asian operations offer a range of insurance and investment products, predominately with-profits and non-participating term, whole life endowment and unit-linked. Excluding with-profit and unit-linked business, the results of the Asian business are sensitive to the vagaries of routine movements in interest rates. For the purposes of analysing sensitivity to variations in interest rates, it has been determined for the majority of territories that a movement of 1 per cent in the 10-year government bond rate can be considered reasonably possible. At 31 December 2011, 10-year government bond rates vary from territory to territory and range from 0.99 per cent to 12.88 per cent (2010: 1.1 per cent to 12.25 per cent). Exception to this arises in Japan and Taiwan where reasonably possible interest rate movements have been determined as 0.5 per cent (2010: Japan and Taiwan 0.5 per cent). These reasonably possible changes would have the following impact:
2011 £m 2010 £m
Decreaseof1%
note (i)
Decreaseof1%
note (i)
Pre-tax profit 73 110 Related deferred tax (where applicable) (22) (41)
Net effect on profit and shareholders' equity 51 69
Note(i) One per cent sensitivity (except for Japan and Taiwan (0.5 per cent)) has been used in all territories (2010: one per cent except Japan and
Taiwan 0.5 per cent). The pre-tax impacts, if they arose, would mostly be recorded within the category short-term fluctuations in investments returns in the
Group’s segmental analysis of profit before tax. At 31 December 2011, an increase in the rates of 1 per cent (2010: 1 per cent except Japan and Taiwan 0.5 per cent) is estimated to have the
effect of decreasing pre-tax profit by £159 million (2010: £112 million). After adjusting these results for deferred tax the reasonable possible effect on shareholders’ equity is a decrease of £125 million (2010: £82 million).
ii Equity price riskThe non-linked shareholder business has limited exposure to equity and property investment (£600 million at 31 December 2011). Generally changes in equity and property investment values are not directly offset by movements in policyholder liabilities. However, for the Vietnam business, to the extent that equity investment appreciation is realised through sales of securities then policyholders’ liabilities are adjusted to the extent that policyholders participate. The estimated sensitivity to a 10 and 20 per cent change in equity and property prices for shareholder-backed Asian other business, which would be reflected in the short-term fluctuation component of the Group’s segmental analysis of profit before tax, at 31 December 2011 and 2010 would be as follows:
2011 £m 2010 £m
Decreaseof20%
Decreaseof10%
Decreaseof20%
Decreaseof10%
Pre-tax profit (120) (60) (103) (52)Related deferred tax (where applicable) 24 12 10 5
Net effect on profit and shareholders' equity (96) (48) (93) (47)
A 10 or 20 per cent increase in their value would have an approximately equal and opposite effect on profit and shareholders’ equity to the sensitivities shown above. The market risk sensitivities shown above reflect the impact of temporary market movements and, therefore, the primary effect of such movements would, in the Group’s segmental analysis of profits, be included within the short-term fluctuations in investment returns. In the equity risk sensitivity analysis shown above, the Group has considered the impact of an instantaneous 20 per cent fall in equity markets. If equity markets were to fall by more than 20 per cent, the Group believes that this would not be an instantaneous fall but rather this would be expected to occur over a period of time during which the Group would be able to put in place mitigating management actions.

275F
ina
ncia
l statem
en
tsD: L
ife assuran
ce busin
ess
iii Insurance riskMany of the territories in Asia are exposed to mortality/morbidity risk and provision is made within policyholder liabilities on a prudent regulatory basis to cover the potential exposure. If these prudent assumptions were strengthened by 5 per cent (estimated at one in ten year shock) then it is estimated that post-tax profit would be impacted by approximately £27 million (2010: £21 million). Mortality/morbidity has a symmetrical effect on portfolio and so a weakening of mortality/morbidity assumptions would have an approximately equal and opposite similar impact.
ii CurrencytranslationConsistent with the Group’s accounting policies, the profits of the Asian insurance operations are translated at average exchange rates and shareholders’ equity at the closing rate for the reporting period. For 2011, the results for the most significant operations are given in note B4. A 10 per cent increase or decrease in these rates would have reduced or increased profit before tax attributable to shareholders, profit for the year and shareholders’ equity, excluding goodwill, attributable to Asian operations respectively as follows:
10%increaseinexchangerates
10%decreaseinexchangerates
2011
£m2010
£m2011
£m2010
£m
Profit before tax attributable to shareholders note (i) (57) (65) 70 80 Profit for the year (46) (58) 56 71 Shareholders’ equity, excluding goodwill, attributable to Asian operations (228) (193) 278 236
Note(i) Sensitivity on profit (loss) before tax ie aggregate of the operating profit based on longer-term investment returns and short-term fluctuations
in investment returns.
k DurationofliabilitiesThe table below shows the carrying value of policyholder liabilities. Separately the Group uses cash flow projections of expected benefit payments as part of the determination of the value of in-force business when preparing EEV basis results. The table below also shows the maturity profile of the cash flows, taking account of expected future premiums and investment returns used for that purpose for 2011 and 2010:
2011 £m 2010 £m
Policyholder liabilities 30,862 28,674
% %
Expected maturity:0 to 5 years 22 24 5 to 10 years 19 20 10 to 15 years 15 15 15 to 20 years 13 12 20 to 25 years 10 10 Over 25 years 21 19

276
Prudential plc Annual Report 2011
D: Life assurance business continued
Financial statements | Notes on the Group financial statements
D5: Capital position statement for life assurance businesses
a SummarystatementThe Group’s estimated capital position for life assurance businesses with reconciliations to shareholders’ equity is shown below. Available capital for each fund or group of companies is determined by reference to local regulation at 31 December 2011 and 2010.
2011 £m
SAIF WPSF
TotalPAC
with-profitsfund
OtherUKlife
assurancesubsidi-
ariesandfunds
note (ii) Jackson
Asianlife
assurancesubsidi-
aries
Totallife
assuranceopera-tions
M&G(includingPrudential
Capital)
Parentcompanyandshare-
holders’equityof
othersubsidi-
ariesandfunds
GroupTotal
Groupshareholders'equityHeld outside long-term funds: Net assets – – – 930 4,271 2,114 7,315 229 (1,514) 6,030 Goodwill – – – – – 235 235 1,153 77 1,465
Total – – – 930 4,271 2,349 7,550 1,382 (1,437) 7,495 Held in long-term funds note (iii) – – – 1,622 – – 1,622 – – 1,622
Total Group shareholders' equity – – – 2,552 4,271 2,349 9,172 1,382 (1,437) 9,117
Adjustmentstoregulatory
basisUnallocated surplus of
with-profits funds note (i) – 9,165 9,165 – – 50 9,215 Shareholders' share of realistic
liabilities – (2,394) (2,394) – – – (2,394)Deferred acquisition costs of
non-participating business not recognised for regulatory reporting purposes and goodwill – (6) (6) (111) (3,880) (979) (4,976)
Jackson surplus notes note (iv) – – – – 160 – 160 Investment and policyholder
liabilities valuation differences between IFRS and regulatory basis for Jackson note (viii) – – – – 1,002 – 1,002
Adjustment from IAS 19 basis pension deficit attributable to WPSF to pension liability for regulatory purposes note (vii) – 16 16 – – – 16
Valuation difference on PAL between IFRS basis and regulatory basis – (640) (640) – – – (640)
Other adjustments to restate these amounts to a regulatory basis (with SAIF and the WPSF on a Peak 2 realistic basis) note (v) – (2) (2) (504) 974 73 541
Total adjustments – 6,139 6,139 (615) (1,744) (856) 2,924
Totalavailablecapitalresourcesoflifeassurancebusinessesonlocalregulatorybases – 6,139 6,139 1,937 2,527 1,493 12,096

277F
ina
ncia
l statem
en
tsD: L
ife assuran
ce busin
ess
2011 £m
SAIFWPSF
note (i)
TotalPACwith-profits
fund
OtherUKlifeassurance
subsidiariesandfunds
note (ii) Jackson
Asianlifeassurance
subsidiaries
Totallifeassuranceoperations
PolicyholderliabilitiesWith-profits liabilities of UK
regulated with-profits funds: Insurance contracts 7,934 28,256 36,190 – – 6,777 42,967 Investment contracts (with
discretionary participation features) 412 28,936 29,348 – – 397 29,745
Total 8,346 57,192 65,538 – – 7,174 72,712
Other liabilities: Insurance contracts: With-profits liabilities
of non-UK regulated funds – – – – – 5,419 5,419 Unit-linked, including variable
annuity – 1,847 1,847 6,387 37,833 12,015 58,082 Other life assurance business 209 13,365 13,574 24,734 29,445 6,142 73,895 Investment contracts without
discretionary participation features (principally unit-linked and similar contracts in the UK and GIC liabilities of Jackson)note (vi) – 17 17 14,927 1,911 112 16,967
Total 209 15,229 15,438 46,048 69,189 23,688 154,363
Totalpolicyholderliabilitiesshownintheconsolidatedstatementoffinancialposition 8,555 72,421 80,976 46,048 69,189 30,862 227,075

278
Prudential plc Annual Report 2011
D: Life assurance business continued
Financial statements | Notes on the Group financial statements
D5: Capital position statement for life assurance businesses continued
2010 £m
SAIF WPSF
TotalPAC
with-profitsfund
OtherUKlife
assurancesubsidi-
ariesandfunds
note (ii) Jackson
Asianlife
assurancesubsidi-
aries
Totallife
assuranceopera-tions
M&G(includingPrudential
Capital)
Parentcompanyandshare-
holders’equityof
othersubsidi-
ariesandfunds
GroupTotal
Groupshareholders'equityHeld outside long-term funds: Net assets – – – 716 3,815 1,913 6,444 254 (1,532) 5,166 Goodwill – – – – – 236 236 1,153 77 1,466
Total – – – 716 3,815 2,149 6,680 1,407 (1,455) 6,632 Held in long-term funds note (iii) – – – 1,399 – – 1,399 – – 1,399
Total Group shareholders' equity – – – 2,115 3,815 2,149 8,079 1,407 (1,455) 8,031
Adjustmentstoregulatory
basisUnallocated surplus of
with-profits funds note (i) – 10,187 10,187 – – 66 10,253 Shareholders' share of realistic
liabilities – (2,938) (2,938) – – – (2,938)Deferred acquisition costs of
non-participating business not recognised for regulatory reporting purposes and goodwill – (13) (13) (116) (3,543) (993) (4,665)
Jackson surplus notes note (iv) – – – – 159 – 159 Investment and policyholder
liabilities valuation differences between IFRS and regulatory basis for Jackson note (viii) – – – – 1,900 – 1,900
Adjustment from IAS 19 basis pension deficit attributable to WPSF to pension liability for regulatory purposes note (vii) – 60 60 – – – 60
Valuation difference on PAL between IFRS basis and regulatory basis – (1,202) (1,202) – – – (1,202)
Other adjustments to restate these amounts to a regulatory basis (with SAIF and the WPSF on a Peak 2 realistic basis) note (v) – 706 706 (292) 576 156 1,146
Total adjustments – 6,800 6,800 (408) (908) (771) 4,713
Totalavailablecapitalresourcesoflifeassurancebusinessesonlocalregulatorybases – 6,800 6,800 1,707 2,907 1,378 12,792

279F
ina
ncia
l statem
en
tsD: L
ife assuran
ce busin
ess
2010 £m
SAIFWPSF
note (i)
TotalPACwith-profits
fund
OtherUKlifeassurance
subsidiariesandfunds
note (ii) Jackson
Asianlifeassurance
subsidiaries
Totallifeassuranceoperations
PolicyholderliabilitiesWith-profits liabilities of UK
regulated with-profits funds: Insurance contracts 9,115 31,395 40,510 – – 5,284 45,794 Investment contracts (with
discretionary participation features) 376 25,237 25,613 – – 119 25,732
Total 9,491 56,632 66,123 – – 5,403 71,526
With-profits liabilities of non-UK regulated funds – – – – – 5,555 5,555
Unit-linked, including variable annuity – 2,128 2,128 8,882 31,203 12,724 54,937
Other life assurance business 268 13,067 13,335 19,297 27,438 4,935 65,005 Investment contracts without
discretionary participation features (principally unit-linked and similar contracts in the UK and GIC liabilities of Jackson)note (vi) – – – 15,765 1,882 57 17,704
Total 268 15,195 15,463 43,944 60,523 23,271 143,201
Totalpolicyholderliabilitiesshownintheconsolidatedstatementoffinancialposition 9,759 71,827 81,586 43,944 60,523 28,674 214,727
Notes(i) WPSF unallocated surplus includes amounts related to the Hong Kong branch. Policyholder liabilities of the Hong Kong branch are included
in the amounts of Asian life assurance subsidiaries.(ii) Excluding PAC shareholders’ equity that is included in ‘parent company and shareholders’ equity of other subsidiaries and funds’.(iii) The term shareholders’ equity held in long-term funds refers to the excess of assets over liabilities attributable to shareholders of funds which
are required by law to be maintained ring-fenced with segregated assets and liabilities.(iv) For regulatory purposes the Jackson surplus notes are accounted for as capital.(v) Other adjustments to shareholders’ equity and unallocated surplus include amounts for the value of non-participating business for UK
regulated with-profits funds, deferred tax, admissibility and other items measured differently on the regulatory basis. For Jackson the principal reconciling item is deferred tax related to the differences between IFRS and regulatory basis as shown in the table above and other methodology differences.
(vi) Insurance business accounted for as financial instruments under IAS 39.(vii) In determining the IAS 19 adjustment for the purposes of this table the deficit in the Group’s main pension scheme used for the calculation
includes amounts for investments in Prudential insurance policies which, on Group consolidation, are eliminated against equivalent liabilities in the statement of financial position of UK insurance operations (see note I3).
(viii) The investment and policyholder liabilities valuation difference between IFRS and regulatory bases for Jackson is mainly due to not all investments being carried at fair value under the regulatory basis and also due to the valuation difference on annuity reserves.

280
Prudential plc Annual Report 2011
D: Life assurance business continued
Financial statements | Notes on the Group financial statements
D5: Capital position statement for life assurance businesses continued
b Basisofpreparation,capitalrequirementsandmanagementEach of the Group’s long-term business operations is capitalised to a sufficiently strong level for its individual circumstances. Details of the Group’s major operations are shown below.
i UKinsuranceoperationsThe FSA rules which govern the Prudential regulation of insurance form part of the Prudential Sourcebook for Insurers, the General Prudential Sourcebook and Interim Prudential Sourcebook for Insurers. Overall, the net requirements of the General Prudential Sourcebook are intended to align the capital adequacy requirements for insurance business more closely with those of banking and investment firms and building societies, for example, by addressing tiers of capital, rather than looking at net admissible assets. An insurer must hold capital resources equal at least to the minimum capital requirement (MCR). The Prudential Sourcebook for Insurers also contains rules on Individual Capital Assessments. Under these rules and the rules of the General Prudential Sourcebook all insurers must assess for themselves the amount of capital needed to back their business. If the FSA views the results of this assessment as insufficient, it may draw up its own Individual Capital Guidance for a firm, which can be superimposed as a requirement.
PAC WPSF and SAIFUnder FSA rules, insurers with with-profits liabilities of more than £500 million must hold capital equal to the higher of the MCR and the enhanced capital requirement (ECR). The ECR is intended to provide a more risk responsive and ‘realistic’ measure of a with-profits insurer’s capital requirements, whereas the MCR is broadly speaking equivalent to the previous required minimum margin under the Interim Prudential Sourcebook and satisfies the minimum EU Standards. Determination of the ECR involves the comparison of two separate measurements of the firm’s resources requirement, which the FSA refers to as the ‘twin peaks’ approach.
The two separate peaks are:
i The requirement comprised by the mathematical reserves plus the ‘Long-Term Insurance Capital Requirement’ (LTICR), together known as the ‘regulatory peak’; and
ii A calculation of the ‘realistic’ present value of the insurer’s expected future contractual liabilities together with projected ‘fair’ discretionary bonuses to policyholders, plus a risk capital margin, together known as the ‘realistic peak’.
Available capital of the WPSF and SAIF of £6.1 billion (2010: £6.8 billion) represents the excess of assets over liabilities on the FSA realistic basis. Unlike the previously discussed FRS 27 basis, realistic liabilities on the regulatory basis include the shareholders’ share of future bonuses. These amounts are shown before deduction of the risk capital margin (RCM) which is estimated to be £2.0 billion at 31 December 2011 (2010: £1.5 billion). The FSA’s basis of setting the RCM is to target a level broadly equivalent to a Standard & Poor’s credit rating of BBB and to judge this by ensuring there are sufficient assets to absorb a one in 200 year event. The RCM calculation achieves this by setting rules for the determination of margins to cover defined stress changes in asset values and yields for market risk, credit risk and termination risk for with-profits policies. As noted in section D2(g)(ii), PAC has discretion in its management actions in the case of adverse investment conditions. Management actions encompass, but are not confined to, investment allocation decisions, levels of reversionary bonuses, crediting rates and total claim values. To illustrate the flexibility of management actions, rates of regular bonus are determined for each type of policy primarily by targeting them at a prudent proportion of the long-term expected future investment return on the underlying assets. The expected future investment return is reduced as appropriate for each type of policy to allow for items such as expenses, charges, tax and shareholders’ transfers. However, the rates declared may differ by product type or by date of payment of the premiums or date of issue of the policy, if the accumulated annual bonuses are particularly high or low relative to a prudent proportion of the achieved investment return. When target bonus levels change, the PAC Board has regard to the overall financial strength of the long-term fund when determining the length of time over which it will seek to achieve the amended product target bonus level. In normal investment conditions, PAC expects changes to regular bonus rates to be gradual over time and changes are not expected to exceed 1 per cent per annum over any year. However, discretion is retained as to whether or not a regular bonus is declared each year, and there is no limit on the amount by which regular bonus rates can be changed. As regards smoothing of maturity and death benefits, in normal circumstances PAC does not expect most payout values on policies of the same duration to change by more than 10 per cent up or down from one year to the next, although some larger changes may occur to balance payout values between different policies. Greater flexibility may be required in certain circumstances, for example, following a significant rise or fall in market values (either sudden or over a period of years) and in such situations the PAC Board may decide to vary the standard bonus smoothing limits to protect the overall interests of policyholders.

281F
ina
ncia
l statem
en
tsD: L
ife assuran
ce busin
ess
For surrender benefits, any substantial fall in the market value of the assets of the with-profits sub-fund would lead to changes in the application of MVRs for accumulating with-profits policies, firstly to increase the size of MVRs already being applied, and secondly, to extend the range of policies for which an MVR is applied.
Other UK life assurance subsidiaries and fundsThe available capital of £1,937 million (2010: £1,707 million) reflects the excess of regulatory basis assets over liabilities of the subsidiaries and funds, before deduction of the capital resources requirement of £1,194 million (2010: £1,086 million). The capital resources requirement for these companies broadly reflects a formula which, for active funds, equates to a percentage of regulatory reserves plus a percentage of death strains. Death strains represent the payments made to policyholders upon death in excess of amounts explicitly allocated to fund the provisions for policyholders’ claims and maturities.
ii JacksonThe regulatory framework for Jackson is governed by the requirements of the US NAIC approved risk-based capital standards. Under these requirements life insurance companies report using a formula-based capital standard that they calculate by applying factors to various asset, premium and reserve items and separate model-based calculations of risk associated primarily with variable annuity products. The risk-based capital formula takes into account the risk characteristics of a company, including asset risk, insurance risk, interest rate risk, market risk and business risk. The available capital of Jackson shown above of £2,527 million (2010: £2,907 million) reflects US regulatory basis assets less liabilities including asset valuation reserves. The asset valuation reserve is designed to provide for future credit-related losses on debt securities and losses on equity investments. Available capital includes a reduction for the effect of the interest maintenance reserve, which is designed by state regulators to defer recognition of non-credit related realised capital gains and losses and to recognise them rateably in the future. Jackson’s risk-based capital ratio is significantly in excess of regulatory requirements. At 31 December 2011, Jackson had a permitted practice in effect as granted by the local regulator allowing Jackson to carry certain interest rate swaps at book value, as if statutory hedge accounting were in place, instead of at fair value as would have been otherwise required. Jackson was also required to demonstrate the effectiveness of its interest rate swap programme pursuant to the Michigan Insurance Code. The total effect of this permitted practice net of tax was to decrease statutory surplus by £305 million at 31 December 2011.
iii AsianoperationsThe available capital shown above of £1,493 million (2010: £1,378 million) represents the excess of local regulatory basis assets over liabilities before deduction of required capital of £608 million (2010: £572 million). These amounts have been determined applying the local regulations in each of the operations. The businesses in Asia are subject to local capital requirements in the jurisdictions in which they operate. The Hong Kong business branch of PAC and its capital requirements are subsumed within those of the PAC long-term fund. For the other material Asian operations, the details of the basis of determining regulatory capital and regulatory capital requirements are as follows:
SingaporeIn Singapore a risk-based regulatory framework applies rather than one based on a net premium approach. For participating business, a gross premium reserve, determined using prudent best estimate assumptions and which makes allowance for future bonus, is held. The amount held is subject to a minimum of the higher of the assets attributed to participating business and a gross premium reserve calculated on specified assumptions, but without allowance for future bonus, that include prescribed provisions for adverse deviations (PADs). For non-participating business, gross premium reserves are held. For linked business the value of units is held together with a non-unit reserve calculated in accordance with standard actuarial methodology.
IndonesiaFor linked business the value of units is held together with a non-unit reserve calculated in accordance with standard actuarial methodology. Solvency capital is determined using a risk-based capital approach. Insurance companies in Indonesia are expected to maintain the level of net assets above 120 per cent of solvency capital. Due to the 2008 financial crisis, the local regulator provided relief in solvency capital and the measure continued until 1 January 2012 when it was withdrawn. The withdrawal of this temporary relief did not have a significant impact on the Group’s Indonesia business.
JapanMathematical reserves for traditional business are determined on a net premium basis using prescribed mortality and interest rates. Interest rates reflect the original pricing assumptions. For linked business the value of units is held together with a non-unit reserve calculated in accordance with standard actuarial methodology. With regard to solvency, the adjusted solvency capital assets of the Company must exceed 200 per cent of the risk related capital requirement value at risk. It is thus a risk-based capital approach.

282
Prudential plc Annual Report 2011
D: Life assurance business continued
Financial statements | Notes on the Group financial statements
D5: Capital position statement for life assurance businesses continued
MalaysiaA risk-based capital framework applies in Malaysia. For participating business, a gross premium reserve on the guaranteed and non-guaranteed benefits determined using best estimate assumptions is held. The amount held is subject to a minimum of a gross premium reserve on the guaranteed benefits, determined using best estimate assumptions along with provisions of risk margin for adverse deviations (PRADs) discounted at the risk-free rate. For non-participating business, gross premium reserves determined using best estimate assumptions along with provisions of risk margin for adverse deviations discounted at the risk-free rate are held. For linked business the value of units is held together with a non-unit reserve calculated in accordance with standard actuarial methodology. The risk-free rate is derived from a yield curve of zero-coupon spot yields of Malaysian Government Securities. Participating fund surplus is not allowed to be used to support a deficit (if any) and the capital requirement of the non-participating business. The capital requirement is calculated based on a prescribed series of risk charges with a multiplier of 175 per cent being applied to the total risk charges. The multiplier of 175 per cent is the capital target agreed between the regulator and the company.
VietnamMathematical reserves are calculated using a modified net premium approach, set of assumptions agreed with the regulator. The capital requirement is determined as 4 per cent of reserves plus a specified percentage of 0.1 per cent of sums at risk for policies with original term less than or equal to five years or 0.3 per cent of sums at risk for policies with original term of more than five years. An additional capital requirement of Vietnamese Dong 200 billion (£6 million) is also required for companies transacting unit-linked business.
KoreaPolicy reserves for traditional business are determined on net premium reserve basis using pricing mortality and prescribed standard interest rates. For linked business, the value of units is held together with the non-unit reserves calculated in accordance with regulatory standard actuarial methodology. In April 2009, the capital requirement in Korea moved to being based on a risk-based regulatory framework with a two-year transition period where insurers could choose between the prior and new framework. The risk-based regulatory framework was adopted in 2009 by the Company. Under the risk-based framework, insurance companies in Korea are expected to maintain a level of free surplus in excess of the capital requirements with the general target level of solvency margin being in excess of 150 per cent of the risk-based capital.
iv GroupcapitalrequirementsIn addition to the requirements at individual company level, FSA requirements under the IGD apply additional prudential requirements for the Group as a whole. Discussion of the Group’s estimated IGD position at 31 December 2011, together with market risk sensitivity disclosure provided to key management, is provided in the business review section of the Group’s 2011 Annual Report and in section C.
c MovementsintotalavailablecapitalTotal available capital for the Group’s life assurance operations has changed as follows:
2011 £m
WPSFnote (i)
OtherUKlife
assurancesubsidiaries
andfundsnote (iii)
Jacksonnote (ii)
Asianlifeassurance
subsidiariesnote (iv)
GroupTotal
Availablecapitalat31December2010 6,800 1,707 2,907 1,378 12,792 Changes in assumptions (60) 38 – (32) (54)Changes in management policy (15) – – – (15)Changes in regulatory requirements – – – 17 17 New business and other factorsnote (v) (586) 192 (380) 130 (644)
Availablecapitalat31December2011 6,139 1,937 2,527 1,493 12,096

283F
ina
ncia
l statem
en
tsD: L
ife assuran
ce busin
ess
2010 £m
WPSFnote (i)
OtherUKlife
assurancesubsidiaries
andfundsnote (iii)
Jacksonnote (ii)
Asianlifeassurance
subsidiariesnote (iv)
GroupTotal
Availablecapitalat31December2009 6,432 1,607 2,488 1,129 11,656 Changes in assumptions (83) 30 – (2) (55)Changes in management policy 364 – – – 364 Changes in regulatory requirements – – (60) – (60)New business and other factorsnote (v) 87 70 479 251 887
Availablecapitalat31December2010 6,800 1,707 2,907 1,378 12,792
Notes(i) WPSF The decrease in 2011 of £661 million reflects primarily the negative effect of the lower interest rate used to value projected policyholder benefit
payments, partially offset by the positive impact of investment returns earned on the opening available capital. The increase in 2010 reflects primarily the positive effect of changes in management policy of £364 million in respect of hedge strategy,
asset allocation and other risk alignment changes.(ii) Jackson The decrease of £380 million in 2011 reflects an underlying decrease of £402 million (applying the 2011 year end exchange rate of $1.55:£1) and
£22 million of exchange translation gain. The increase of £419 million in 2010 reflected an underlying increase of £340 million (applying the 2010 year end exchange rate of $1.57:£1)
and £79 million of exchange translation gain. The underlying movement of the available capital of Jackson included the effects of capital contributions, dividends paid to the parent
company, impairment losses and also the effects of hedging transactions.(iii) Other UK life assurance subsidiaries and funds The effect from the changes in assumptions of valuation interest rates on insurance liabilities is broadly matched by the corresponding effect
on assets leaving no significant impact on the available capital.(iv) Asian life assurance subsidiaries The increase of £115 million in 2011 reflects an underlying increase of £134 million (applying the relevant 2011 year end exchange rates) and
£19 million of exchange translation loss. The increase of £251 million in 2010 reflected an underlying increase of £127 million (applying the relevant 2010 year end exchange rates)
and £124 million of exchange translation gain. The underlying increase of available capital in 2010 included the effects of the acquisition of UOB Life Assurance Limited in Singapore in February 2010.
(v) New business and other factors comprise the effect of changes in new business, valuation interest rate, investment return, foreign exchange and other factors.
d TransferabilityofavailablecapitalFor PAC and all other UK long-term insurers, long-term business assets and liabilities must, by law, be maintained in funds separate from those for the assets and liabilities attributable to non-life insurance business or to shareholders. Only the ‘established surplus’, the excess of assets over liabilities in the long-term fund determined through a formal valuation, may be transferred so as to be available for other purposes. Distributions from the with-profits sub-fund to shareholders reflect the shareholders’ one-ninth share of the cost of declared policyholders’ bonuses. Accordingly, the excess of assets over liabilities of the PAC long-term fund is retained within that company. The retention of the capital enables it to support with-profits and other business of the fund by, for example, providing the benefits associated with smoothing and guarantees. It also provides investment flexibility for the fund’s assets by meeting the regulatory capital requirements that demonstrate solvency and by absorbing the costs of significant events or fundamental changes in its long-term business, without affecting the bonus and investment policies. For other UK long-term business subsidiaries, the amounts retained within the companies are at levels which provide an appropriate level of capital strength in excess of the regulatory minimum. For Jackson, capital retention is maintained at a level consistent with an appropriate rating by Standard & Poor’s. Currently Jackson is rated AA. Jackson can pay dividends on its capital stock only out of earned surplus unless prior regulatory approval is obtained. Furthermore, dividends which exceed the greater of statutory net gain from operations for the prior year or 10 per cent of Jackson’s statutory surplus require prior regulatory approval. For Asian subsidiaries, the amounts retained within the companies are at levels that provide an appropriate level of capital strength in excess of the local regulatory minimum. For ring-fenced with-profits funds, the excess of assets over liabilities is retained with distribution tied to the shareholders’ share of bonuses through declaration of actuarially determined surplus. The Singapore and Malaysian businesses may, in general, remit dividends to the UK, provided the statutory insurance fund meets the capital adequacy standard required under local statutory regulations.

284
Prudential plc Annual Report 2011
D: Life assurance business continued
Financial statements | Notes on the Group financial statements
D5: Capital position statement for life assurance businesses continued
Available capital of the non-insurance business units is transferable to the life assurance businesses after taking account of an appropriate level of operating capital, based on local regulatory solvency targets, over and above basis liabilities. The economic capital model described in section D1 (concentration of risks) takes into account restrictions on mobility of capital across the Group, with capital transfers to and from business units triggered at a solvency level consistent with these targets. The model takes into account restrictions on the availability to the Group of the estate of the various with-profits funds throughout the Group.
e SensitivityofliabilitiesandtotalcapitaltochangedmarketconditionsandcapitalmanagementpoliciesPrudential manages its assets, liabilities and capital locally, in accordance with local regulatory requirements and reflecting the different types of liabilities Prudential has in each business. As a result of the diversity of products offered by Prudential and the different regulatory requirements in which it operates, Prudential employs differing methods of asset/liability and capital management, depending on the business concerned. Stochastic modelling of assets and liabilities is undertaken in the UK, Jackson and Asia to assess the economic capital requirements under different confidence intervals and time horizons. In addition, reserve adequacy testing under a range of scenarios and dynamic solvency testing is carried out, including under certain scenarios mandated by the UK, US and Asian regulators. A stochastic approach models the inter-relationship between asset and liability movements, taking into account asset correlation, management actions and policyholder behaviour under a large number of alternative economic scenarios. These scenarios are projected forward over a period of time, typically 25 years or longer, and the liabilities and solvency position of the fund are calculated in each scenario in each future year. The fund’s policy on management actions, including bonus and investment policy, continue to be set in order that they are consistent with the available capital and the targeted risk of default. The sensitivity of liabilities and other components of total capital vary depending upon the type of business concerned and this conditions the approach to asset/liability management. For example, for businesses that are most sensitive to interest rate changes, such as immediate annuity business, Prudential uses cash flow analysis to create a portfolio of debt securities whose value changes in line with the value of liabilities when interest rates change. This type of analysis helps protect profits from changing interest rates. This type of analysis is used in the UK for annuity business and by Jackson for its interest-sensitive and fixed indexed annuities and stable value products. For businesses that are most sensitive to equity price changes, Prudential uses stochastic modelling and scenario testing to look at the future returns on its investments under different scenarios which best reflect the large diversity in returns that equities can produce. This allows Prudential to devise an investment and with-profits policyholder bonus strategy that, on the model assumptions, allows it to optimise returns to its policyholders and shareholders over time while maintaining appropriate financial strength. Prudential uses this methodology extensively in connection with its UK with-profits business.
f IntragrouparrangementsinrespectofSAIFShould the assets of SAIF be inadequate to meet the guaranteed benefit obligations to the policyholders of SAIF, the PAC long-term fund would be liable to cover any such deficiency. Due to the quality and diversity of the assets in SAIF and the ability of SAIF to revise guaranteed benefits in the event of an asset shortfall, the directors believe that the probability of either the PAC long-term fund or the Group’s shareholders’ funds, under their obligation to maintain the capital position of long-term funds generally, having to contribute to SAIF is remote.

285F
ina
ncia
l statem
en
ts
E: A
sset man
agemen
t (in
cluding U
S bro
ker-d
ealer) an
d oth
er operatio
ns
E: Asset management (including US broker-dealer) and other operations
E1: Income statement for asset management operations
The Group’s asset management operations are based in the UK, Asia and the US where they operate different models and under different brands tailored to their markets. Asset management in the UK is undertaken through M&G which is made up of three distinct businesses, being Retail, Wholesale and Finance, and whose operations include retail asset management, institutional fixed income, pooled life and pension funds, property and private finance. Asset management in Asia serves both the life companies in Asia by managing the life funds and funds underlying the investment linked products and third-party customers through mutual fund business. Asia offers mutual fund investment products in a number of countries within the region, allowing customers to participate in debt, equity and money market investments. Asset management in the US is undertaken through PPM America which manages assets for the Group’s US, UK and Asian affiliates plus also provides investment services to other affiliated and unaffiliated institutional clients including CDOs, private investment funds, institutional accounts and mutual funds. In addition, broker-dealer activities are undertaken in the US where trades in securities are carried out for both third-party customers and for its own account. Other operations covers unallocated corporate activities and includes the head office functions.
a The profit included in the income statement in respect of asset management operations for the year is as follows:
2011 £m 2010 £m
M&G US
EastspringInvestments
note (iii)Total
Total
Revenue, (excluding revenue of consolidated investment funds and NPH broker-dealer fees) 1,042 249 292 1,583 1,423
Revenue of consolidated investment fundsnote (i) 9 – – 9 11 NPH broker-dealer feesnote (i) – 405 – 405 369
Gross revenue 1,051 654 292 1,997 1,803
Charges, (excluding charges of consolidated investment funds and NPH broker-dealer fees) (710) (225) (212) (1,147) (1,003)
Charges of consolidated investment fundsnote (i) (9) – – (9) (11)NPH broker-dealer feesnote (i) – (405) – (405) (369)
Gross charges (719) (630) (212) (1,561) (1,383)
Profit before tax 332 24 80 436 420
Comprising: Operating profit based on longer-term investment returns 357 24 80 461 378 Short-term fluctuations in investment returnsnote (ii) (29) – – (29) 47 Shareholder’s share of actuarial gains and losses on defined
benefit pension schemes 4 – – 4 (5)
Profit before tax 332 24 80 436 420
Notes (i) Under IFRS 8, disclosure details are required of segment revenue. The segment revenue of the Group’s asset management operations is required
to include two items that are for amounts which, reflecting their commercial nature, are also wholly reflected as charges within the income statement. After allowing for these charges, there is no effect on profit from these two items which are:
(a) Investment funds which are managed on behalf of third parties and are consolidated under IFRS in recognition of the control arrangements for the funds. The gains and losses of these funds are non-recourse to M&G and the Group, and
(b) NPH broker-dealer fees which represent commissions received, which are then paid on to the writing brokers on sales of investment products. The presentation in the table above shows the amounts attributable to these two items so that the underlying revenue and charges can
be seen. (ii) Short-term fluctuations in investment returns for M&G are primarily in respect of unrealised value movements on Prudential Capital’s
bond portfolio.(iii) Included within Eastspring Investments revenue and charges are £44 million of commissions (2010: £60 million).

286
Prudential plc Annual Report 2011
Financial statements | Notes on the Group financial statements
E: Asset management (including US broker-dealer) and other operations continued
E1: Income statement for asset management operations continued
b M&G operating profit based on longer-term investment returns:
2011 £m 2010 £m
Asset management fee income 702 612 Other income 4 3 Staff costs (285) (263)Other costs (141) (123)
Underlying profit before performance-related fees 280 229 Performance-related fees 21 17
Operating profit from asset management operations 301 246 Operating profit from Prudential Capital 56 38
Total M&G operating profit based on longer-term investment returns 357 284
The difference between the fees and other income shown above in respect of asset management operations, and the revenue figure for M&G shown (excluding consolidated investment funds) in the main table primarily relates to total revenue of Prudential Capital (including short-term fluctuations) of £96 million (2010: £136 million) and commissions which have been netted off in arriving at the fee income of £702 million (2010: £612 million) in the table above. The difference in the presentation of commission is aligned with how management reviews the business.

287F
ina
ncia
l statem
en
ts
E2: Statement of financial position for asset management operations
Assets, liabilities and shareholders’ funds included in the Group consolidated statement of financial position in respect of asset management operations are as follows:
2011 £m 2010 £m
M&G
note (iii) US
EastspringInvestments Total Total
Assets Intangible assets: Goodwillnote (iii) 1,153 16 61 1,230 1,230 Deferred acquisition costs and other intangibles assets 12 1 3 16 13
Total 1,165 17 64 1,246 1,243
Other non-investment and non-cash assets 868 179 82 1,129 1,118 Financial investments: Loansnote (i) 1,256 – – 1,256 1,418 Equity securities and portfolio holdings in unit trusts 587 – 7 594 151 Debt securitiesnote (ii) 1,834 – 8 1,842 1,574 Other investments 72 1 5 78 59 Deposits 30 28 31 89 80
Total financial investmentsnote (iii) 3,779 29 51 3,859 3,282
Cash and cash equivalents 1,533 45 157 1,735 1,436
Total assets 7,345 270 354 7,969 7,079
Equity and liabilities Equity Shareholders’ equity 1,382 129 272 1,783 1,787 Non-controlling interests 5 – – 5 4
Total equity 1,387 129 272 1,788 1,791
Liabilities Core structural borrowing of shareholder-financed operations 250 – – 250 250 Intra-group debt represented by operational borrowings at
Group levelnote (iv) 2,956 – – 2,956 2,560 Net asset value attributable to external holders of consolidated
unit trusts and similar fundsnote (v) 678 – – 678 458 Other non-insurance liabilitiesnote (vi) 2,074 141 82 2,297 2,020
Total liabilities 5,958 141 82 6,181 5,288
Total equity and liabilities 7,345 270 354 7,969 7,079
Notes(i) Loans The M&G loans relate to loans and receivables managed by Prudential Capital. These assets are generally secured but have no external credit
ratings. Internal ratings prepared by the Group’s asset management operations, as part of the risk management process, are:
2011 £m 2010 £m
Loans and receivables internal ratings:A+ to A- 129 213 BBB+ to BBB- 1,000 873 BB+ to BB- 89 219 B+ to B- 38 113
Total M&G loans 1,256 1,418
All loans in the portfolio are currently paying interest on scheduled coupon dates and no interest has been capitalised or deferred. All loans are in compliance with their covenants at 31 December 2011. The loans in the portfolio generally have ratchet mechanisms included within the loan agreements at inception so that margins increase over time to encourage early repayment or have had margins increased to reflect revised commercial terms.
E: A
sset man
agemen
t (in
cluding U
S bro
ker-d
ealer) an
d oth
er operatio
ns

288
Prudential plc Annual Report 2011
Financial statements | Notes on the Group financial statements
E2: Statement of financial position for asset management operations continued
(ii) Debt securities Of the total debt securities at 31 December 2011 of £1,842 million, the following amounts were held by M&G.
2011 £m 2010 £m
M&G AAA to A- by Standard and Poor's or Aaa rated by Moody's 1,547 1,468 Other 287 92
Total M&G debt securities 1,834 1,560
(iii) The M&G statement of financial position includes the assets and liabilities in respect of Prudential Capital.(iv) Intragroup debt represented by operational borrowings at Group level Operational borrowings for M&G are in respect of Prudential Capital’s short-term fixed income security programme and comprise:
2011 £m 2010 £m
Commercial paper 2,706 2,311 Medium-term notes 250 249
Total intragroup debt represented by operational borrowings at Group level 2,956 2,560
(v) Consolidated investment funds The M&G statement of financial position shown above includes investment funds which are managed on behalf of third parties. In respect of these funds, the statement of financial position includes the following, which are non-recourse to M&G and the Group:
2011 £m 2010 £m
Cash and cash equivalents 348 304 Total investments 415 167 Other net assets and liabilities (85) (13)Net asset value attributable to external unit holders (678) (458)
Shareholders' equity – –
(vi) Other non-insurance liabilities consists primarily of intragroup balances, derivatives, liabilities and other creditors.
E: Asset management (including US broker-dealer) and other operations continued

289F
ina
ncia
l statem
en
ts
Reconciliation of movement in investmentsA reconciliation of the total investments of asset management operations from the beginning of the year to the end of the year is as follows:
M&G
£mUS
£m
EastspringInvestments
£mTotal
£m
At 1 January 2010 Total investments (including derivative assets) 2,835 15 40 2,890 Less: Derivative liabilitiesnote G3 (49) – – (49)
Directly held investments, net of derivative liabilities 2,786 15 40 2,841
Net cash inflow from operating activities 310 8 11 329 Realised gains in the year 11 – – 11 Unrealised gains and losses and exchange movements in the year 18 – 5 23
Movement in the year of directly held investments, net of derivative liabilities 339 8 16 363
At 31 December 2010/1 January 2011 Total investments (including derivative assets) 3,203 23 56 3,282 Less: Derivative liabilitiesnote G3 (78) – – (78)
Directly held investments, net of derivative liabilities 3,125 23 56 3,204
Net cash inflow (outflow) from operating activities 538 6 (4) 540 Realised gains in the year 17 – – 17 Unrealised gains and losses and exchange movements in the year (83) – (1) (84)
Movement in the year of directly held investments, net of derivative liabilities 472 6 (5) 473
At 31 December 2011 Total investments (including derivative assets) 3,779 29 51 3,859 Less: Derivative liabilities (182) – – (182)
Directly held investments, net of derivative liabilities 3,597 29 51 3,677
E3: Regulatory and other surplus
Certain asset management operations are subject to regulatory requirements. The movement in the year of the surplus regulatory capital position of these operations, combined with the movement in the IFRS basis shareholders’ funds for unregulated asset management operations, is as follows:
Asset management operations
2011 £m 2010 £m
M&G US Eastspring
Investments Total Total
Regulatory and other surplus Beginning of year 187 122 123 432 322 Gains during the year 252 12 62 326 312 Movement in capital requirement (3) – (11) (14) (23)Capital injection – – 8 8 1 Distributions made (280) (6) (56) (342) (194)Exchange movement – 1 1 2 14
End of year 156 129 127 412 432
The movement in the year reflects gains driven by profits generated during the year and also changes in regulatory requirements. Distributions consist of dividends paid up to the parent company. The M&G figures include those for Prudential Capital.
E: A
sset man
agemen
t (in
cluding U
S bro
ker-d
ealer) an
d oth
er operatio
ns

290
Prudential plc Annual Report 2011
Financial statements | Notes on the Group financial statements
E4: Sensitivity of profit and shareholders’ equity to market and other financial risk
i Currency translationConsistent with the Group’s accounting policies, the profits of Eastspring Investments and asset management operations are translated at average exchange rates and shareholders’ equity at the closing rate for the reporting period. The rates for the most significant operations are shown in note B4. A 10 per cent increase in the relevant exchange rates would have reduced reported profit before tax attributable to shareholders and shareholders’ equity, excluding goodwill attributable to Eastspring Investments and US asset management operations, by £9 million (2010: £9 million) and £30 million (2010: £28 million) respectively.
ii Sensitivities to other financial risks for asset management operationsThe principal sensitivities to other financial risk of the Group’s asset management operations are credit risk on the bridging loan portfolio as described in note E2 of the Prudential Capital operation and the indirect effect of changes to market values of funds under management. Due to the nature of the asset management operations there is limited direct sensitivity to movements in interest rates. Total debt securities held at 31 December 2011 by asset management operations were £1,842 million (2010: £1,574 million), the majority of which are held by the Prudential Capital operation. Debt securities held by M&G and Prudential Capital are in general variable rate bonds and so market value is limited in sensitivity to interest rate movements and consequently any change in interest rates would not have a material impact on profit or shareholder’s equity. The Group’s asset management operations do not hold significant investments in property or equities. E5: Other operations
Other operations consist of unallocated corporate activities relating to Group Head Office and the Asia regional head office, with net expenditure for the year of £483 million (2010: £450 million) as detailed in note B1. An analysis of the assets and liabilities of Other operations is shown in note B5. The Group holds certain derivatives that are used to manage foreign currency movements and macroeconomic exposures. The fair value of these derivatives is sensitive to the combined effect of movements in exchange rates, interest rate and inflation rate. The possible permutations cover a wide range of scenarios. For indicative purposes, a reasonably possible range of fair value movements could be plus or minus approximately £75 million.
E: Asset management (including US broker-dealer) and other operations continued

291F
ina
ncia
l statem
en
tsF: In
come statem
ent n
otes
F: Income statement notes
F1: Segmental information
Year ended 31 December 2011 £m
Insurance operations Asset management (note E1)
Totalsegments
Unallo-cated
corporateGroup
TotalUK US Asia M&G US
EastspringInvest-ments
Gross premiums earned 5,678 12,650 7,378 – – – 25,706 – 25,706 Outward reinsurance premiums (131) (72) (226) – – – (429) – (429)
Earned premiums, net of reinsurance 5,547 12,578 7,152 – – – 25,277 – 25,277 Investment return note (ii) 7,604 1,447 283 128 1 2 9,465 (105) 9,360 Other income 193 (62) 155 923 653 290 2,152 (283) 1,869
Total revenue, net of reinsurance 13,344 13,963 7,590 1,051 654 292 36,894 (388) 36,506
Benefits and claims (12,048) (12,931) (6,081) – – – (31,060) – (31,060)Outward reinsurers’ share of benefits
and claims note (iv) 290 280 176 – – – 746 – 746 Movement in unallocated surplus
of with-profits funds note (iii) 485 – 540 – – – 1,025 – 1,025
Benefits and claims and movements in unallocated surplus of with-profits funds, net of reinsurance (11,273) (12,651) (5,365) – – – (29,289) – (29,289)
Acquisition costs and other operating expenditure note F3 (1,239) (700) (1,562) (704) (630) (212) (5,047) 42 (5,005)
Finance costs: interest on core structural borrowings of shareholder-financed operations – (13) – (15) – – (28) (258) (286)
Total charges, net of reinsurance (12,512) (13,364) (6,927) (719) (630) (212) (34,364) (216) (34,580)
Profit (loss) before tax (being tax attributable to shareholders’ and policyholders’ returns)note (i) 832 599 663 332 24 80 2,530 (604) 1,926
Tax charge attributable to policyholders’ returns 68 – (51) – – – 17 – 17
Profit (loss) from continuing operations before tax attributable to shareholders 900 599 612 332 24 80 2,547 (604) 1,943
This is represented in the segmental analysis of profit from continuing operations before tax attributable to shareholders in note B1 as follows:
Year ended 31 December 2011 £m
Insurance operations Asset management
Totalsegments
Unallo-cated
corporateGroup
TotalUK US Asia M&G US
EastspringInvest-ments
Operating profit (loss) based on longer-term investment returns 723 694 704 357 24 80 2,582 (512) 2,070
Short-term fluctuations in investment returns on shareholder-backed business 159 (95) (92) (29) – – (57) (91) (148)
Shareholders’ share of actuarial and other gains and losses on defined benefit pension schemes 18 – – 4 – – 22 (1) 21
Profit (loss) from continuing operations before tax attributable to shareholders 900 599 612 332 24 80 2,547 (604) 1,943

292
Prudential plc Annual Report 2011
F: Income statement notes continued
Financial statements | Notes on the Group financial statements
F1: Segmental information continued
Year ended 31 December 2010 £m
Insurance operations Asset management (note E1)
Totalsegments
Unallo-cated
corporateGroup
TotalUK US Asia M&G US
EastspringInvest-ments
Gross premiums earned 6,371 11,817 6,380 – – – 24,568 – 24,568 Outward reinsurance premiums (128) (83) (146) – – – (357) – (357)
Earned premiums, net of reinsurance 6,243 11,734 6,234 – – – 24,211 – 24,211 Investment return note (ii) 14,374 4,576 2,744 186 1 3 21,884 (115) 21,769 Other income 233 (24) 139 768 597 248 1,961 (295) 1,666
Total revenue, net of reinsurance 20,850 16,286 9,117 954 598 251 48,056 (410) 47,646
Benefits and claims (18,674) (15,472) (6,462) – – – (40,608) – (40,608)Outward reinsurers’ share of benefits
and claims note (iv) 243 49 43 – – – 335 – 335 Movement in unallocated surplus
of with-profits funds note (iii) 70 – (315) – – – (245) – (245)
Benefits and claims and movements in unallocated surplus of with-profits funds, net of reinsurance (18,361) (15,423) (6,734) – – – (40,518) – (40,518)
Acquisition costs and other operating expenditure note F3 (1,093) (395) (1,662) (628) (576) (179) (4,533) (266) (4,799)
Finance costs: interest on core structural borrowings of shareholder-financed operations – (13) – – – – (13) (244) (257)
Total charges, net of reinsurance (19,454) (15,831) (8,396) (628) (576) (179) (45,064) (510) (45,574)
Profit (loss) before tax (being tax attributable to shareholders’ and policyholders’ returns)note (i) 1,396 455 721 326 22 72 2,992 (920) 2,072
Tax charge attributable to policyholders’ returns (536) – (75) – – – (611) – (611)
Profit (loss) from continuing operations before tax attributable to shareholders 860 455 646 326 22 72 2,381 (920) 1,461
This is represented in the segmental analysis of profit from continuing operations before tax attributable to shareholders in note B1 as follows:
Year ended 31 December 2010 £m
Insurance operations Asset management
Totalsegments
Unallo-cated
corporateGroup
TotalUK US Asia M&G US
EastspringInvest-ments
Operating profit (loss) based on longer-term investment returns 719 833 532 284 22 72 2,462 (521) 1,941
Short-term fluctuations in investment returns on shareholder-backed business 116 (378) 114 47 – – (101) (22) (123)
Shareholders’ share of actuarial and other gains and losses on defined benefit pension schemes (5) – – (5) – – (10) – (10)
Costs of terminated AIA transaction – – – – – – – (377) (377)Gain on dilution of Group’s holdings 30 – – – – – 30 – 30
Profit (loss) from continuing operations before tax attributable to shareholders 860 455 646 326 22 72 2,381 (920) 1,461

293F
ina
ncia
l statem
en
tsF: In
come statem
ent n
otes
Notes(i) The measure is the formal profit (loss) before tax measure under IFRS but is not the result attributable to shareholders.(ii) Investment return principally comprises:
– interest and dividends, – realised and unrealised gains and losses on securities and derivatives classified as fair value through profit and loss under IAS 39, and – realised gains and losses, including impairment losses, on securities classified as available-for-sale under IAS 39.(iii) The movement in unallocated surplus of with-profits funds for Asia above includes movement relating to the Hong Kong branch of PAC.
For the purpose of the presentation of unallocated surplus of with-profits funds within the statement of financial position, the Hong Kong branch balance is shown within the unallocated surplus of the PAC with-profits sub-fund.
(iv) The increase in the credit for outwards reinsurers’ share of benefits and claims for Jackson from 2010 to 2011 arises from the fair value movement on the GMIB reinsurance in 2011. As the GMIB reinsurance is net settled it is considered to be a derivative under IAS 39. The movement was particularly high in 2011 due to the reduction in US interest rates in 2011.
F2: Revenue
2011 £m 2010 £m
Long-term business premiums Insurance contract premiums 24,831 23,647 Investment contracts with discretionary participation feature premiums 735 750 Inwards reinsurance premiums 140 171 Less: reinsurance premiums ceded (429) (357)
Earned premiums, net of reinsurancenote (iv) 25,277 24,211
Investment return Realised and unrealised gains and losses on securities at fair value through profit and loss 866 14,728 Realised and unrealised losses and gains on derivatives at fair value through profit and loss 86 (891)Realised losses on available-for-sale securities, previously recognised in other comprehensive income 101 (51)Realised losses on loans (43) (12)Interest notes (i),(ii) 6,440 5,976 Dividends 1,304 1,394 Other investment return 606 625
Investment return 9,360 21,769
Fee income from investment contract business and asset managementnotes (iii),(iv) 1,869 1,666
Total revenue 36,506 47,646
Notes(i) The segmental analysis of interest income is as follows:
2011 £m 2010 £m
Insurance operations: UK 4,286 4,371 US 1,717 1,014 Asia 339 412
Asset management operations: M&G 110 127 US 1 – Eastspring Investments 3 2
Total segment 6,456 5,926
Unallocated corporate (16) 50
Total 6,440 5,976

294
Prudential plc Annual Report 2011
F: Income statement notes continued
Financial statements | Notes on the Group financial statements
F2: Revenue continued
(ii) Interest income includes £8 million (2010: £8 million) accrued in respect of impaired securities. (iii) Fee income includes £13 million (2010: £11 million) relating to financial instruments that are not held at fair value through profit and loss. These fees primarily related to prepayment fees, late fees and syndication fees.(iv) The following table provides additional segmental analysis of revenue from external customers:
2011 £m
Asia US UK Intragroup Total
Revenue from external customers:Insurance operations 7,307 12,516 5,740 – 25,563 Asset management 290 653 923 (323) 1,543 Unallocated corporate – – 40 – 40 Intragroup revenue eliminated on consolidation (93) (68) (162) 323 –
Total revenue from external customers 7,504 13,101 6,541 – 27,146
2010 £m
Asia US UK Intragroup Total
Revenue from external customers:Insurance operations 6,373 11,710 6,476 (10) 24,549 Asset management 248 597 768 (314) 1,299 Unallocated corporate – – 29 – 29 Intragroup revenue eliminated on consolidation (77) (72) (175) 324 –
Total revenue from external customers 6,544 12,235 7,098 – 25,877
Revenue from external customers is made up of the following:2011 £m 2010 £m
Earned premiums, net of reinsurance 25,277 24,211 Fee income from investment contract business and asset
management (presented as ‘Other income’) 1,869 1,666
Total revenue from external customers 27,146 25,877
In their capacity as fund managers to fellow Prudential Group subsidiaries, M&G, Eastspring Investments and US asset management businesses generate fees for investment management and related services. These services are charged at appropriate arm’s length prices, typically priced as a percentage of funds under management. Intragroup fees included within asset management revenue were earned by the following asset management segment:
2011 £m 2010 £m
Intragroup revenue generated by: M&G 162 165 Eastspring Investments 93 77 US broker-dealer and asset management (including Curian) 68 72
Total intragroup fees included within asset management segment 323 314
In 2010 a further £10 million of intragroup revenue was recorded between UK insurance operations for services, typically charged as a percentage of funds under management. Revenue from external customers of Asian, US and UK insurance operations shown above are net of outwards reinsurance premiums of £226 million, £72 million and £131 million respectively (2010: £146 million, £83 million and £128 million respectively). In Asia, revenue from external customers from no individual country exceeds 10 per cent of the Group total. The largest country is Singapore with a total revenue from external customers of £1,383 million (2010: Hong Kong £1,246 million). Due to the nature of the business of the Group, there is no reliance on any major customers.

295F
ina
ncia
l statem
en
tsF: In
come statem
ent n
otes
F3: Acquisition costs and other expenditure
2011 £m 2010 £m
Acquisition costs incurred 2,264 2,024 Acquisition costs deferred less amortisation of acquisition costs (635) (918) Administration costs and other expenditure 3,524 3,496 Movements in amounts attributable to external unit holders (148) 197
Total acquisition costs and other expenditure 5,005 4,799
Notes(i) The acquisition costs as shown in the table above relate to policy acquisition costs. Acquisition costs from business combinations are included
within other expenditure. Acquisition costs in 2011 comprise amounts related to insurance contracts of £1,564 million (2010: £941 million), and investment contracts and asset management contracts of £65 million (2010: £165 million).
(ii) There were no fee expenses relating to financial liabilities held at amortised cost included in acquisition costs in 2011 and 2010. (iii) The total depreciation and amortisation expense of £641 million (2010: £309 million) relates to amortisation of deferred acquisition costs of
insurance contracts and asset management contracts, which is primarily borne by the insurance operations. The segmental analysis of total depreciation and amortisation expense is as follows:
2011 £m 2010 £m
Insurance operations: UK 55 35 US 278 (6) Asia 286 258
Asset management operations: M&G 7 8 US 1 2 Eastspring Investments 4 4
Total segment 631 301
Unallocated corporate 10 8
Total 641 309
(iv) Interest expense, excluding interest on core structural borrowings of shareholder-financed operations, amounted to £123 million (2010: £113 million) and is included within total acquisition costs and other operating expenditure as part of investment management expenses. The segmental analysis of this interest expense is as follows:
2011 £m 2010 £m
Insurance operations: UK 49 28 US 31 33 Asia 10 13
Asset management operations: M&G 11 19
Total segment 101 93
Unallocated corporate 22 20
Total 123 113
(v) Movements in amounts attributable to external unit holders comprises £28 million (2010: £61 million) for UK insurance operations and £120 million (2010: £136 million) for Asian insurance operations.

296
Prudential plc Annual Report 2011
F: Income statement notes continued
Financial statements | Notes on the Group financial statements
F3: Acquisition costs and other expenditure continued
(vi) The total amounts for acquisition costs and other expenditure shown above includes Corporate Expenditure shown in note B1 (Segment disclosure – income statement). The charge for Corporate Expenditure comprises:
2011 £m 2010 £m
Group head office: Regular and project costs (156) (150) Provision for property leases and other non-recurrent items (12) (25)
(168) (175)
Asia regional office: Gross costs (86) (90) Recharges to Asia operations 35 42
(51) (48)
Total (219) (223)
F4: Finance costs: interest on core structural borrowings of shareholder-financed operations
Finance costs of £286 million (2010: £257 million) comprise £258 million (2010: £244 million) interest on core debt of the parent company, £13 million (2010: £13 million) on US insurance operations’ surplus notes and £15 million (2010: nil) on PruCap’s bank loan.
F5: Tax
a Total tax charge by nature of expenseAn analysis of the total tax benefit (expense) of continuing operations recognised in the income statement by nature of benefit (expense) is as follows:
2011 £m 2010 £m
Current tax expense: Corporation tax (775) (378) Adjustments in respect of prior years 33 287
Total current tax (742) (91)
Deferred tax arising from: Origination and reversal of temporary differences 253 (518) Credit (expense) in respect of a previously unrecognised tax loss, tax credit or temporary difference
from a prior period 57 (27)
Total deferred tax credit (charge) 310 (545)
Total tax charge (432) (636)

297F
ina
ncia
l statem
en
tsF: In
come statem
ent n
otes
The total tax expense arises as follows:
2011 £m 2010 £m
Current tax expense: UK (475) (61) Foreign (267) (30)
(742) (91)
Deferred tax credit (charge): UK 455 (252) Foreign (145) (293)
310 (545)
Total (432) (636)
The current tax charge of £742 million includes £16 million (2010: charge of £13 million) in respect of the tax charge for Hong Kong. The Hong Kong current tax charge is calculated as 16.5 per cent for all periods on either (i) 5 per cent of the net insurance premium or (ii) the estimated assessable profits, depending on the nature of the business written. The total tax charge comprises tax attributable to policyholders and unallocated surplus of with-profits funds, unit-linked policies and shareholders as shown below.
2011 £m 2010 £m
Tax chargeCurrent
taxDeferred
tax Total Total
Tax credit (charge) to policyholders' returns (410) 427 17 (611)Tax charge attributable to shareholders (332) (117) (449) (25)
Total tax charge (742) 310 (432) (636)
The principal reason for the reduction in the tax charge attributable to policyholders’ returns relates to a decrease in deferred tax on unrealised gains and losses on investments. The tax charge attributable to shareholders of £449 million for 2011 (2010: charge of £25 million) comprises:
2011 £m 2010 £m
Tax charge attributable to shareholdersCurrent
taxDeferred
tax Total Total
UK tax (135) 17 (118) 187 Overseas tax (197) (134) (331) (212)
Total tax charge (332) (117) (449) (25)
The total deferred tax credit/(charge) arises as follows:
2011 £m 2010 £m
Unrealised gains and losses on investments 129 (217)Balances relating to investment and insurance contracts 108 (28)Short-term timing differences 66 (431)Capital allowances 2 (8)Unused tax losses 5 139
Deferred tax charge 310 (545)
In 2011, a deferred tax charge of £187 million (2010: charge of £287 million) has been taken through other comprehensive income. Other movements in deferred tax totalling a £22 million charge is mainly comprised of foreign exchange movements. When these amounts are taken with the deferred tax charge shown above the result is a decrease of £0.1 billion in the Group’s net deferred tax liability (2010: increase of £0.9 billion).

298
Prudential plc Annual Report 2011
F: Income statement notes continued
Financial statements | Notes on the Group financial statements
F5: Tax continued
b Reconciliation of effective tax rateThe total tax charge is attributable to shareholders and policyholders as summarised in the income statement.
i Summary of pre-tax profit and tax chargeThe income statement includes the following items:
2011 £m 2010 £m
Profit before tax 1,926 2,072 Tax credit (charge) attributable to policyholders’ returns 17 (611)
Profit before tax attributable to shareholders 1,943 1,461 Tax attributable to shareholders’ profits: Tax charge (432) (636) Less: tax attributable to policyholders’ returns (17) 611
Tax charge attributable to shareholders’ returns (449) (25)
Profit for the year 1,494 1,436
ii OverviewFor the purposes of explaining the relationship between tax expense and accounting profit, it is appropriate to consider the sources of profit and tax by reference to those that are attributable to shareholders and policyholders, as follows:
2011 £m 2010 £m
Attributable toshareholders
Attributable topolicyholders* Total
Attributable toshareholders
Attributable topolicyholders* Total
Profit (loss) before tax 1,943 (17) 1,926 1,461 611 2,072 Taxation charge: Expected tax rate 29% 100% 28% 28% 100% 49% Expected tax (charge) credit (559) 17 (542) (406) (611) (1,017) Variance from expected tax chargenote v(ii) 110 – 110 381 – 381 Actual tax (charge) credit (449) 17 (432) (25) (611) (636)Average effective tax rate 23% 100% 22% 2% 100% 31%
* For the column entitled ‘Attributable to policyholders’, the profit before tax represents income, net of post-tax transfers to unallocated surplus of with-profits funds, before tax attributable to policyholders and unallocated surplus of with-profits funds and unit-linked policies.

299F
ina
ncia
l statem
en
tsF: In
come statem
ent n
otes
Due to the requirements of the financial reporting standards IAS 1 and IAS 12, the profit (loss) before tax and tax charge reflect the aggregate of amounts that are attributable to shareholders and policyholders. Profit (loss) before tax comprises profit attributable to shareholders and pre-tax profit attributable to policyholders of linked and with-profits funds and unallocated surplus of with-profits funds. The total tax charge for linked and with-profits business includes tax expense on unit-linked and with-profits funds attributable to policyholders, the unallocated surplus of with-profits funds and the shareholders’ profits. This feature arises from the basis of taxation applied to life and pension business, principally in the UK, but with similar bases applying in certain Asian operations, and is explained in note (iii) below. Furthermore, the basis of preparation of Prudential’s financial statements incorporates the additional feature that, as permitted under IFRS 4, the residual equity of the Group’s with-profits funds, ie unallocated surplus, is recorded as a liability with transfers to and from that liability reflected in pre-tax profits. This gives rise to anomalous effective tax rates for profits attributable to policyholders (as described in note (iv) below). In meeting the reconciliation requirements set out in paragraph 81(c) of IAS 12, the presentation shown in this disclosure note seeks to ensure that the explanation of the relationship between tax expense and accounting profit draw properly the distinction between the elements of the profit and tax charge that are attributable to policyholders and shareholders as explained below in notes (iv) and (v) respectively. Due to the nature of the basis of taxation of UK life and pension business (as described in note (iii) below), and the significance of the results of the business to the Group, it is inappropriate to seek to explain the effective tax rate on profit before tax by the traditional approach that would apply for other industries. The shareholder elements are the components of the profit and tax charge that are of most direct relevance to investors, and it is this aspect that the IAS 12 reconciliation requirement is seeking to explain for companies that do not need to account for both with-profits and unit-linked funds, where tax is borne by the Company on the policyholders’ behalf and which is not contemplated by the IFRS requirement.
iii Basis of taxation for UK life and pension businessDifferent rules apply under UK tax law for taxing pension business and life insurance business and there are detailed rules for apportioning the investment return and profits of the fund between the types of business. The investment return referable to pension business, and some other less significant classes of business, is exempt from taxation, but tax is charged on the profit that shareholders derive from writing such business at the corporate rate of tax. The rules for taxing life insurance business are more complex. Initially, the UK regime seeks to tax the regulatory basis investment return less management expenses (I-E) on this business as it arises. However, in determining the actual tax charge, a calculation of the shareholder profits for taxation purposes from writing life insurance business also has to be made and compared with the I-E profit. If the shareholder profit is higher than the I-E amount, extra income is attributable to the I-E calculation until the I-E profit equals the shareholder profit. If on the other hand, the I-E profit is the greater, then an amount equal to the shareholder profit is taxed at the corporate rate of tax, with the remainder of the I-E profit being taxed at the lower policyholder rate of tax. The purpose of this approach is to ensure that the Company is always at a minimum taxed on the profit, as defined for taxation purposes by reference to the Company’s regulatory returns (rather than IFRS basis results), that it has earned. The shareholders’ portion of the long-term business is taxed at the shareholders’ rate, with the remaining portion taxed at rates applicable to the policyholders. It is to be noted that the calculations described are determined using data from the regulatory basis returns rather than the IFRS basis results.

300
Prudential plc Annual Report 2011
F: Income statement notes continued
Financial statements | Notes on the Group financial statements
F5: Tax continued
iv Profits attributable to policyholders and related taxAs noted above, it is necessary under IFRS requirements to include the total tax charge of the Company (both policyholder and shareholder elements) in the tax charge disclosed in the income statement. The tax expense attributable to policyholders is a combination of current and deferred tax charges and reflects the nature of the income and expenditure of the with-profits and unit-linked funds. The current tax charge element reflects the element for the funds, determined on the I-E basis (as described in note (iii) above) that is attributable to policyholders. For policyholder deferred tax, normally the most significant element reflects the movement on unrealised appreciation on investments. These investments are accounted for under IAS 39 on a fair value through profit or loss basis with attaching deferred tax charges or credits. For with-profits business, total pre-tax profits reflect the aggregate of profits attributable to policyholders and shareholders. However, amounts attributable to the equity of with-profits funds are carried in the liability for unallocated surplus. Also, as described in note (iii), UK with-profits business is taxed on a basis that affects policyholders’ unallocated surplus of with-profits funds and shareholders. For the PAC with-profits sub-fund, transfers to and from unallocated surplus are recorded in the income statement, so that after charging the total tax borne by the fund, the net balance reflects the statutory transfer from the fund for the year. The statutory transfer represents 10 per cent of the actuarially determined surplus for the year that is attributable to shareholders. For SAIF, similar transfers are made. However, in the case of SAIF, a net nil balance is derived, reflecting the lack of shareholder interest in the financial performance of the fund (other than through asset management arrangements). The accounting anomaly that arises under IFRS is that due to the fact that the net of tax profit attributable to with-profits policyholders is zero, the Company’s presentation of pre-tax profit attributable to policyholders reflects an amount that is the mirror image of the tax charge attributable to policyholders. For unit-linked business, pre-tax profits also reflect the aggregate of profits attributable to policyholders and shareholders. The pre-tax profits attributable to policyholders represent fees earned that are used to pay tax borne by the Company on policyholders’ behalf. The net of tax profit attributable to policyholders for unit-linked business is thus zero. The combined effect of these features is such that providing a reconciliation of the tax charge attributable to policyholders to an expected charge based on the standard corporate rate of tax on IFRS basis profits attributable to policyholders is not relevant. In summary, for accounting purposes, in all cases and for all reporting periods, the apparent effective rate for profit attributable to policyholders and unallocated surplus is 100 per cent. However, it is to be noted that the 100 per cent rate does not reflect a rate paid on the profits attributable to policyholders. It instead reflects the basis of accounting for unallocated surplus coupled with the distinction made for performance reporting between sources of profit attributable to shareholders, policyholders and unallocated surplus and IFRS requirements in respect of reporting of all pre-tax profits and all tax charges irrespective of policyholder or shareholder economic interest.

301F
ina
ncia
l statem
en
tsF: In
come statem
ent n
otes
v Reconciliation of tax charge on profit attributable to shareholders for continuing operations:
2011 £m (except for tax rates)
Asianinsurance
operations
USinsurance
operations
UK insurance
operations Other
operations Total
Profit (loss) before tax attributable to shareholders: Operating profit based on longer-term investment
returnsnote (iii) 704 694 723 (51) 2,070 Short-term fluctuations in investment returns (92) (95) 159 (120) (148) Shareholders’ share of actuarial and other gains and losses on defined benefit pension schemes – – 18 3 21
Total 612 599 900 (168) 1,943
Expected tax rate:note (i) Operating profit based on longer-term investment
returnsnote (iii) 24% 35% 27% 27% 28% Short-term fluctuations in investment returns 20% 35% 27% 27% 28% Shareholders’ share of actuarial and other gains and losses on defined benefit pension schemes 0% 0% 27% 27% 27%
Expected tax (charge) credit based on expected tax rates: Operating profit based on longer-term investment returns (169) (243) (195) 14 (593) Short-term fluctuations in investment returnsnote (iii) 18 33 (43) 32 40 Shareholders’ share of actuarial and other gains and losses on defined benefit pension schemes – – (5) (1) (6)
Total (151) (210) (243) 45 (559)
Variance from expected tax charge:note (ii) Operating profit based on longer-term investment returns 47 43 5 50 145 Short-term fluctuations in investment returnsnote (iii) (20) – 8 (24) (36) Shareholders’ share of actuarial and other gains and losses on defined benefit pension schemes – – 1 – 1
Total 27 43 14 26 110
Actual tax (charge) credit: Operating profit based on longer-term investment returns (122) (200) (190) 64 (448) Short-term fluctuations in investment returnsnote (iii) (2) 33 (35) 8 4 Shareholders’ share of actuarial and other gains and losses on defined benefit pension schemes – – (4) (1) (5)
Total (124) (167) (229) 71 (449)
Actual tax rate: Operating profit based on longer-term investment returns 17% 29% 26% 125% 22% Total profit 20% 28% 25% 42% 23%

302
Prudential plc Annual Report 2011
F: Income statement notes continued
Financial statements | Notes on the Group financial statements
F5: Tax continued
2010 £m (except for tax rates)
Asianinsurance
operations
USinsurance
operations
UK insurance
operations Other
operations Total
Profit (loss) before tax attributable to shareholders: Operating profit based on longer-term investment
returnsnote (iii) 532 833 719 (143) 1,941 Short-term fluctuations in investment returns 114 (378) 116 25 (123) Shareholders’ share of actuarial and other gains and losses on defined benefit pension schemes – – (5) (5) (10) Costs of terminated AIA transaction – – – (377) (377) Gain on dilution of Group's holdings – – 30 – 30
Total 646 455 860 (500) 1,461
Expected tax rate:note (i) Operating profit based on longer-term investment returns 22% 35% 28% 28% 29% Short-term fluctuations in investment returnsnote (iii) 25% 35% 28% 28% 52% Shareholders’ share of actuarial and other gains and losses on defined benefit pension schemes – – 28% 28% 20% Costs of terminated AIA transaction – – – 28% 28% Gain on dilution of Group's holdings – – 28% – 28%
Expected tax (charge) credit based on expected tax rates: Operating profit based on longer-term investment returns (117) (292) (201) 40 (570) Short-term fluctuations in investment returnsnote (iii) (29) 132 (32) (7) 64 Shareholders’ share of actuarial and other gains and losses on defined benefit pension schemes – – 1 1 2 Costs of terminated AIA transaction – – – 106 106 Gain on dilution of Group's holdings – – (8) – (8)
Total (146) (160) (240) 140 (406)
Variance from expected tax charge:note (ii) Operating profit based on longer-term investment returns 59 43 18 237 357 Short-term fluctuations in investment returnsnote (iii) 21 – – 7 28 Shareholders’ share of actuarial and other gains and losses on defined benefit pension schemes – – – 1 1 Costs of terminated AIA transaction – – – (13) (13) Gain on dilution of Group's holdings – – 8 – 8
Total 80 43 26 232 381
Actual tax (charge) credit: Operating profit based on longer-term investment returns,
excluding exceptional tax credit (58) (249) (183) 119 (371) Exceptional tax credit* – – – 158 158
Operating profit based on longer-term investment returns (58) (249) (183) 277 (213) Short-term fluctuations in investment returns (8) 132 (32) – 92 Shareholders’ share of actuarial and other gains and losses on defined benefit pension schemes – – 1 2 3 Costs of terminated AIA transaction – – – 93 93 Gain on dilution of Group's holdings – – – – –
Total (66) (117) (214) 372 (25)
Actual tax rate: Operating profit based on longer-term investment returns 11% 30% 25% 194% 11% Total profit 10% 26% 25% 74% 2%
Actual tax rate (excluding exceptional tax credit*): Operating profit based on longer-term investment returns 11% 30% 25% 83% 19% Total profit 10% 26% 25% 43% 13%
* The tax charge attributable to shareholders’ return included an exceptional tax credit of £158 million which primarily related to the impact of a settlement agreed with the UK tax authorities.

303F
ina
ncia
l statem
en
tsF: In
come statem
ent n
otes
Notes(i) Expected tax rates for profit (loss) attributable to shareholders: • The expected tax rates shown in the table above reflect the corporation tax rates generally applied to taxable profits of the relevant country
jurisdictions. • For Asian operations the expected tax rates reflect the corporation tax rates weighted by reference to the source of profits of operations
contributing to the aggregate business result. • The expected tax rate for Other operations reflects the mix of business between UK and overseas operations, which are taxed at a variety
of rates. The rates will fluctuate from year to year dependent on the mix of profits.(ii) For 2011 and 2010, the principal variances arise from a number of factors, including: (a) Asian long-term operations For 2011 and 2010, profits in certain countries which are not taxable along with utilising brought forward tax losses on which no deferred
tax assets were previously recognised, partly offset by the inability to fully recognise deferred tax assets on losses being carried forward. The increase in the overall Asia tax rate from 2010 to 2011 primarily reflects recent fiscal developments in Indonesia affecting the life insurance industry.
(b) Jackson For 2011 and 2010, the benefit reflects the deduction from taxable income of a proportion of dividends received attributable to the variable
annuity business. (c) UK insurance operations For 2011 the benefit reflects the effect of the reduction in UK corporation tax rate on deferred tax liabilities and the different tax bases
of UK life business, partially offset by routine revisions to prior period tax returns. For 2010, the benefit arises from routine revisions to prior period tax returns and the different tax bases of UK life business.
(d) Other operations For 2011 the settlement of outstanding issues with HMRC at an amount below that previously provided, partly offset by prior year
adjustments arising from the revisions of prior period tax returns. For 2010, an exceptional tax credit which primarily related to the impact of the settlement agreed with the UK tax authorities and the ability to recognise a deferred tax credit on various tax losses which we were previously unable to recognise, partly offset by the inability to fully recognise a tax credit in respect of non deductible capital costs incurred in relation to the terminated AIA transaction.
(iii) Operating profit based on longer-term investment returns is net of attributable restructuring costs and development expenses. Related tax charges are determined on the basis of current taxation legislation.

304
Prudential plc Annual Report 2011
F: Income statement notes continued
Financial statements | Notes on the Group financial statements
F6: Allocation of investment return between policyholders and shareholders
Investment return is attributable to policyholders and shareholders. A key feature of the accounting policies under IFRS is that the investment return included in the income statement relates to all investment assets of the Group, irrespective of whether the return is attributable to shareholders, or to policyholders or the unallocated surplus of with-profits funds, the latter two of which have no net impact on shareholders’ profit. The table below provides a breakdown of the investment return for each regional operation attributable to each type of business.
2011 £m 2010 £m
Asian operations Policyholder returns Assets backing unit-linked liabilities (812) 1,279 With-profits business 756 1,039
(56) 2,318
Shareholder returns 341 429
Total 285 2,747
US operations Policyholder returns Assets held to back (separate account) unit-linked liabilities (869) 3,520
Shareholder returns Realised gains and losses (including impairment losses on available-for-sale bonds) (238) 21 Value movements on derivative hedging programme for general account business 841 20 I nterest/dividend income and value movements on other financial instruments for which
fair value movements are booked in the income statement 1,714 1,016
2,317 1,057
Total 1,448 4,577
UK operations Policyholder returns Scottish Amicable Insurance Fund (SAIF) 321 1,075 Assets held to back unit-linked liabilities 208 2,119 With-profits fund (excluding SAIF) 4,094 8,815
4,623 12,009
Shareholder returns Prudential Retirement Income Limited (PRIL) 2,153 1,717 Other business 956 834
3,109 2,551
Total 7,732 14,560
Unallocated corporate Shareholder returns (105) (115)
Group Total Policyholder returns 3,698 17,847 Shareholder returns 5,662 3,922
Total 9,360 21,769

305F
ina
ncia
l statem
en
tsF: In
come statem
ent n
otes
The returns as shown in the table above, are delineated between those returns allocated to policyholders and those allocated to shareholders. In making this distinction, returns allocated to policyholders are those from investments in which shareholders have no direct economic interest, namely:
• Unit-linked business in the UK, Asia and SAIF in the UK, for which the investment return is wholly attributable to policyholders;• Separate account business of US operations, the investment return of which is also wholly attributable to policyholders; and• With-profits business (excluding SAIF) in the UK and Asia (in which the shareholders’ economic interest, and the basis of recognising
IFRS basis profits, is restricted to a share of the actuarially determined surplus for distribution (in the UK 10 per cent)). Except for this surplus the investment return of the with-profit funds is attributable to policyholders (through the asset-share liabilities) or the unallocated surplus, which is accounted for as a liability under IFRS 4.
The investment return related to the types of business above does not impact shareholders’ profits directly. However, there is an indirect impact, for example, investment-related fees or the effect of investment return on the shareholders’ share of the cost of bonuses of with-profits funds. Investment returns for unit-linked and similar products have reciprocal impact on benefits and claims, with a decrease in market returns on the attached pool of assets affecting policyholder benefits on these products. Similarly for with-profits funds there is a close correlation between increases or decreases in investment returns and the level of combined charge for policyholder benefits and movement on unallocated surplus that arises from such returns.
Shareholder returnsFor shareholder-backed non-participating business of the UK (comprising PRIL and other non-linked non-participating business) and of the Asian operations, the investment return is not directly attributable to policyholders and therefore does impact shareholders’ profit directly. However, it should be noted that for UK shareholder-backed annuity business, principally PRIL, where the durations of asset and liability cash flows are closely matched, the discount rate applied to measure liabilities to policyholders (under ‘grandfathered’ UK GAAP and under IFRS 4) reflects movements in asset yields (after allowances for the future defaults) of the backing portfolios. Therefore, the net impact on the shareholders’ profits of the investment return of the assets backing liabilities of the UK shareholder-backed annuity business is after taking into account the consequential effect on the movement in policyholder liabilities. Changes in shareholder investment returns for US operations reflect primarily movements in the investment income, movements in the value of derivative instruments, and realised gains and losses. The derivatives are held to manage general account assets and liabilities, and variable annuity guarantees under a dynamic hedging programme. Separately reflecting Jackson’s types of business an allocation is made to policyholders through the application of crediting rates. The majority of the investments held to back the US general account business are debt securities for which the available-for-sale designation is applied for IFRS basis reporting. Under this designation the return included in the income statement reflects the aggregate of investment income and realised gains and losses (including impairment losses). However, movements in unrealised appreciation or depreciation are recognised in other comprehensive income. The return on these assets is attributable to shareholders.

306
Prudential plc Annual Report 2011
F: Income statement notes continued
Financial statements | Notes on the Group financial statements
F7: Benefits and claims and movements in unallocated surplus of with-profits funds, net of reinsurance
Benefits and claims represent payments, including final bonuses, to policyholders in respect of maturities, surrenders and deaths plus the change in technical provisions (which primarily represents the movement in amounts owed to policyholders). Benefits and claims are amounts attributable to policyholders. The movement in unallocated surplus of with-profits funds represents the transfer to (from) the unallocated surplus each year through a charge (credit) to the income statement of the annual excess (shortfall) of income over expenditure of the with-profits funds, after declaration and attribution of the cost of bonuses to policyholders and shareholders. Benefits and claims and movements in unallocated surplus of with-profits funds net of reinsurance can be further analysed as follows:
2011 £m
Asia US UK Total
Claims incurred (2,955) (4,678) (10,103) (17,736)Increase in policyholder liabilities (2,950) (7,973) (1,655) (12,578)Movement in unallocated surplus of with-profits funds(note) 540 – 485 1,025
(5,365) (12,651) (11,273) (29,289)
2010 £m
Asia US UK Total
Claims incurred (2,595) (4,348) (9,941) (16,884)Increase in policyholder liabilities (3,824) (11,075) (8,490) (23,389)Movement in unallocated surplus of with-profits funds(note) (315) – 70 (245)
(6,734) (15,423) (18,361) (40,518)
NoteThe unallocated surplus of with-profits funds represents the excess of assets of with-profits funds over policyholder and other liabilities of the funds. The surplus is therefore sensitive to the measurement basis of the assets and liabilities. The movements on unallocated surplus of with-profits funds also reflect the impact of market fluctuations of investment values backing the surplus. The Asia movement principally arises in the Hong Kong branch operation.

307F
ina
ncia
l statem
en
tsG: F
inan
cial assets an
d liab
ilities
G: Financial assets and liabilities
G1: Financial instruments – designation and fair values
The Group designates all financial assets as either fair value through profit and loss, available-for-sale, or as loans and receivables. Financial liabilities are designated as either fair value through profit and loss, amortised cost, or as investment contracts with discretionary participation features accounted for under IFRS 4 as described in note A4.
2011 £m
Fair value through
profit and loss
Available-for-sale
Loans andreceivables
Total carrying
value Fair value
Financial assets Cash and cash equivalents – – 7,257 7,257 7,257 Deposits – – 10,708 10,708 10,708 Equity securities and portfolio holdings in unit trusts 87,349 – – 87,349 87,349 Debt securitiesnote (i) 97,482 27,016 – 124,498 124,498 Loansnote (ii) 279 – 9,435 9,714 9,828 Other investmentsnote (iii) 7,509 – – 7,509 7,509 Accrued investment income – – 2,710 2,710 2,710 Other debtors – – 987 987 987
192,619 27,016 31,097 250,732
2011 £m
Fair value through
profit and loss
note (v)
Amortisedcost
IFRS 4basis value
Totalcarrying
value Fair value
Financial liabilities Core structural borrowings of shareholder-financed
operationsH13 and note (i) – 3,611 – 3,611 3,815 Operational borrowings attributable to
shareholder-financed operationsH13 – 3,340 – 3,340 3,340 Borrowings attributable to with-profits fundsH13 39 933 – 972 978 Obligations under funding, securities lending and sale
and repurchase agreements – 3,114 – 3,114 3,144 Net asset value attributable to unit holders of
consolidated unit trust and similar funds 3,840 – – 3,840 3,840 Investment contracts with discretionary
participation featuresnote (iv) – – 29,745 29,745 – Investment contracts without discretionary
participation features 15,056 1,911 – 16,967 17,008 Other creditors 281 2,263 – 2,544 2,544 Derivative liabilities 3,054 – – 3,054 3,054 Other liabilities – 1,249 – 1,249 1,249
22,270 16,421 29,745 68,436

308
Prudential plc Annual Report 2011
Financial statements | Notes on the Group financial statements
G: Financial assets and liabilities continued
G1: Financial instruments – designation and fair values continued
2010 £m
Fair value through
profit and loss
Available-for-sale
Loans andreceivables
Total carrying
value Fair value
Financial assets Cash and cash equivalents – – 6,631 6,631 6,631 Deposits – – 9,952 9,952 9,952 Equity securities and portfolio holdings in unit trusts 86,635 – – 86,635 86,635 Debt securitiesnote (i) 90,027 26,325 – 116,352 116,352 Loansnote (ii) 227 – 9,034 9,261 9,488 Other investmentsnote (iii) 5,779 – – 5,779 5,779 Accrued investment income – – 2,668 2,668 2,668 Other debtors – – 903 903 903
182,668 26,325 29,188 238,181
2010 £m
Fair valuethrough
profitand loss
note (v)
Amortisedcost
IFRS 4basis value
Totalcarrying
value Fair value
Financial liabilitiesCore structural borrowings of shareholder-financed
operationsH13 and note (i) – 3,676 – 3,676 3,866 Operational borrowings attributable to
shareholder-financed operationsH13 – 3,004 – 3,004 2,991 Borrowings attributable to with-profits fundsH13 82 1,440 – 1,522 1,524 Obligations under funding, securities lending and sale
and repurchase agreements – 4,199 – 4,199 4,236 Net asset value attributable to unit holders of
consolidated unit trust and similar funds 3,372 – – 3,372 3,372 Investment contracts with discretionary participation
featuresnote (iv) – – 25,732 25,732 –Investment contracts without discretionary
participation features 15,822 1,882 – 17,704 17,652 Other creditors – 2,321 – 2,321 2,321 Derivative liabilities 2,037 – – 2,037 2,037 Other liabilities – 1,129 – 1,129 1,129
21,313 17,651 25,732 64,696
Notes(i) As at 31 December 2011, £523 million (2010: £685 million) of convertible bonds were included in debt securities and £702 million
(2010: £352 million) were included in borrowings.(ii) Loans and receivables are reported net of allowance for loan losses of £89 million (2010: £52 million).(iii) See note G3 for details of the derivative assets included. The balance also contains the PAC with-profits fund’s participation in various
investment funds and limited liability property partnerships.(iv) It is impractical to determine the fair value of investment contracts with discretionary participation features due to the lack of a reliable basis
to measure such features.(v) For financial liabilities designated as fair value through profit and loss, the impact on profit from movements in credit risk during 2011 and 2010
was negligible.

309F
ina
ncia
l statem
en
ts
Determination of fair valueThe fair values of the financial assets and liabilities of the Group have been determined on the following bases. The fair values of the financial instruments for which fair valuation is required under IFRS are determined by the use of current market bid prices for exchange-quoted investments, or by using quotations from independent third parties, such as brokers and pricing services or by using appropriate valuation techniques. Investments valued using valuation techniques include financial investments which by their nature do not have an externally quoted price based on regular trades and financial investments for which markets are no longer active as a result of market conditions eg market illiquidity. The valuation techniques used include comparison to recent arm’s length transactions, reference to other instruments that are substantially the same, discounted cash flow analysis, option adjusted spread models and, if applicable, enterprise valuation. These techniques may include a number of assumptions relating to variables such as credit risk and interest rates. Changes in assumptions relating to these variables could positively or negatively impact the reported fair value of these instruments. When determining the inputs into the valuation techniques used priority is given to publicly available prices from independent sources when available, but overall the source of pricing is chosen with the objective of arriving at a fair value measurement which reflects the price at which an orderly transaction would take place between market participants on the measurement date. The fair value estimates are made at a specific point in time, based upon available market information and judgements about the financial instruments, including estimates of the timing and amount of expected future cash flows and the credit standing of counterparties. Such estimates do not reflect any premium or discount that could result from offering for sale at one time the Group’s entire holdings of a particular financial instrument, nor do they consider the tax impact of the realisation of unrealised gains or losses from selling the financial instrument being fair valued. In some cases the disclosed value cannot be realised in immediate settlement of the financial instrument. The loans and receivables have been shown net of provisions for impairment. The fair value of loans has been estimated from discounted cash flows expected to be received. The rate of discount used was the market rate of interest. The estimated fair value of derivative financial instruments reflects the estimated amount the Group would receive or pay in an arm’s length transaction. This amount is determined using quoted prices if exchange listed, quotations from independent third parties or valued internally using standard market practices. In accordance with the Group’s risk management framework, all internally generated valuations are subject to assessment against external counterparties’ valuations. For investment contracts in the US with fixed and guaranteed terms the fair value is determined based on the present value of future cash flows discounted at current interest rates. The fair value of other financial liabilities is determined using discounted cash flows of the amounts expected to be paid.
Level 1, 2 and 3 fair value measurement hierarchy of Group financial instrumentsThe table below includes financial instruments carried at fair value analysed by level of the IFRS 7 defined fair value hierarchy. This hierarchy is based on the inputs to the fair value measurement and reflects the lowest level input that is significant to that measurement.
The classification criteria and its application to Prudential can be summarised as follows:
Level 1 – quoted prices (unadjusted) in active markets for identical assets and liabilitiesLevel 1 includes financial instruments where there is clear evidence that the valuation is based on a quoted publicly traded price in an active market (eg exchange listed equities, mutual funds with quoted prices and exchange traded derivatives).
Level 2 – inputs other than quoted prices included within level 1 that are observable either directly (ie as prices) or indirectly (ie derived from prices)Level 2 includes investments where a direct link to an actively traded price is not readily apparent, but which are valued using inputs which are largely observable either directly (ie as prices) or indirectly (ie derived from prices). A significant proportion of the Group’s level 2 assets are corporate bonds, structured securities and other non-national government debt securities. These assets, in line with market practice, are generally valued using independent pricing services or third party broker quotes. These valuations are determined using independent external quotations from multiple sources and are subject to a number of monitoring controls, such as monthly price variances, stale price reviews and variance analysis on prices achieved on subsequent trades. Pricing services, where available, are used to obtain the third-party broker quotes. Where pricing services providers are used, a single valuation is obtained and applied. When prices are not available from pricing services, quotes are sourced directly from brokers. Prudential seeks to obtain a number of quotes from different brokers so as to obtain the most comprehensive information available on their executability. Where quotes are sourced directly from brokers, the price used in the valuation is normally selected from one of the quotes based on a number of factors, including the timeliness and regularity of the quotes and the accuracy of the quotes considering the spreads provided. The selected quote is the one which best represents an executable quote for the security at the measurement date.
G: F
inan
cial assets an
d liab
ilities

310
Prudential plc Annual Report 2011
Financial statements | Notes on the Group financial statements
G1: Financial instruments – designation and fair values continued
Generally, no adjustment is made to the prices obtained from independent third parties. Adjustment is made in only limited circumstances, where it is determined that the third-party valuations obtained do not reflect fair value (eg either because the value is stale and/or the values are extremely diverse in range). These are usually securities which are distressed or that could be subject to a debt restructure or where reliable market prices are no longer available due to an inactive market or market dislocation. In these instances, prices are derived using internal valuation techniques including those as described above in this note with the objective of arriving at a fair value measurement which reflects the price at which an orderly transaction would take place between market participants on the measurement date. The techniques used require a number of assumptions relating to variables such as credit risk and interest rates. Examples of such variables include an average credit spread based on the corporate bond universe and the relevant duration of the asset being valued. Prudential measures the input assumptions based on the best available information at the measurement dates. Securities valued in such manner are classified as level 3 where these significant inputs are not based on observable market data. Of the total level 2 debt securities of £94,378 million at 31 December 2011 (31 December 2010: £89,948 million), £6,847 million are valued internally (31 December 2010: £6,638 million). The majority of such securities are valued using matrix pricing, which is based on assessing the credit quality of the underlying borrower to derive a suitable discount rate relative to government securities of a comparable duration. Under matrix pricing, the debt securities are priced taking the credit spreads on comparable quoted public debt securities and applying these to the equivalent debt instruments factoring in a specified liquidity premium. The majority of the parameters used in this valuation technique are readily observable in the market and, therefore, are not subject to interpretation.
Level 3 – Significant inputs for the asset or liability that are not based on observable market data (unobservable inputs)Level 3 includes investments which are internally valued or subject to a significant number of unobservable assumptions (eg private equity funds and certain derivatives which are bespoke or long dated). At 31 December 2011, the Group held £4,565 million (2010: £4,573 million), 2 per cent of the fair valued financial investments, net of derivative liabilities (2010: 2 per cent), within level 3. Of these amounts £3,732 million (2010: £3,705 million) was held by the Group’s participating funds and therefore shareholders’ profit and equity are not impacted by movements in the valuation of these financial instruments. At 31 December 2011, the £3,732 million (2010: £3,705 million) represented 4.3 per cent (2010: 4.2 per cent) of the total level 3 fair valued financial instruments, net of derivative liabilities of the participating funds. Of the £800 million level 3 fair valued financial investments, net of derivative liabilities at 31 December 2011 (2010: £866 million), which support non-linked shareholder-backed business (representing 1.3 per cent of the total fair valued financial investments net of derivative liabilities backing this business (2010: 1.6 per cent)), £757 million of net assets are externally valued and £43 million of net liabilities are internally valued (2010: net assets of £728 million and £138 million respectively). Internal valuations, which represent 0.1 per cent of the total fair valued financial investments net of derivative liabilities supporting non-linked shareholder-backed business at 31 December 2011 (2010: 0.2 per cent), are inherently more subjective than external valuations. If the value of all internally valued level 3 investments backing non-linked shareholder-backed business was varied downwards by 10 per cent, the change in valuation would be £4 million (2010: £14 million), which would reduce shareholders’ equity by this amount before tax. Of this amount a £1 million decrease (2010: £7 million increase) would pass through the income statement substantially as part of short-term fluctuations in investment returns outside of operating profit and a £3 million decrease (2010: offset by a £7 million decrease) would be included as part of other comprehensive income, being unrealised movements on assets classified as available-for-sale.
G: Financial assets and liabilities continued

311F
ina
ncia
l statem
en
ts
31 December 2011 £m
Level 1 Level 2 Level 3 Total
Analysis of financial investments, net of derivative liabilities by business type
With-profits Equity securities and portfolio holdings in unit trusts 24,001 1,762 284 26,047 Debt securities 13,298 43,279 655 57,232 Other investments (including derivative assets) 252 1,378 2,793 4,423 Derivative liabilities (214) (1,127) – (1,341)
Total financial investments, net of derivative liabilities 37,337 45,292 3,732 86,361 Percentage of total 43% 53% 4% 100%
Unit-linked and variable annuity separate account Equity securities and portfolio holdings in unit trusts 59,662 198 30 59,890 Debt securities 4,160 4,698 3 8,861 Other investments (including derivative assets) 18 95 – 113 Derivative liabilities (2) (7) – (9)
Total financial investments, net of derivative liabilities 63,838 4,984 33 68,855 Percentage of total 93% 7% 0% 100%
Non-linked shareholder-backed Loans – 279 – 279 Equity securities and portfolio holdings in unit trusts 1,175 176 61 1,412 Debt securities 11,753 46,401 251 58,405 Other investments (including derivative assets) 30 2,237 706 2,973 Derivative liabilities (78) (1,408) (218) (1,704)
Total financial investments, net of derivative liabilities 12,880 47,685 800 61,365 Percentage of total 21% 78% 1% 100%
Group total analysis, including other financial liabilities held at fair value
Group TotalLoans – 279 – 279 Equity securities and portfolio holdings in unit trusts 84,838 2,136 375 87,349 Debt securities 29,211 94,378 909 124,498 Other investments (including derivative assets) 300 3,710 3,499 7,509 Derivative liabilities (294) (2,542) (218) (3,054)
Total financial investments, net of derivative liabilities 114,055 97,961 4,565 216,581 Borrowings attributable to the with-profits fund held at fair value – (39) – (39)Investment contract liabilities without discretionary participation features held
at fair value – (15,056) – (15,056)Net asset value attributable to unit holders of consolidated unit trusts and
similar funds (2,586) (805) (449) (3,840)Other financial liabilities held at fair value – (281) – (281)
Total financial instruments at fair value 111,469 81,780 4,116 197,365 Percentage of total 57% 41% 2% 100%
G: F
inan
cial assets an
d liab
ilities

312
Prudential plc Annual Report 2011
Financial statements | Notes on the Group financial statements
G1: Financial instruments – designation and fair values continued
31 December 2010 £m
Level 1 Level 2 Level 3 Total
Analysis of financial investment, net of derivative liabilities by business type
With-profits Equity securities and portfolio holdings in unit trusts 29,675 1,281 415 31,371 Debt securities 11,114 41,375 772 53,261 Other investments (including derivative assets) 137 1,207 2,543 3,887 Derivative liabilities (56) (626) (25) (707)
Total financial investments, net of derivative liabilities 40,870 43,237 3,705 87,812 Percentage of total 47% 49% 4% 100%
Unit-linked and variable annuity separate account Equity securities and portfolio holdings in unit trusts 54,272 2 – 54,274 Debt securities 3,784 5,268 2 9,054 Other investments (including derivative assets) 43 88 – 131
Total financial investments, net of derivative liabilities 58,099 5,358 2 63,459 Percentage of total 92% 8% 0% 100%
Non-linked shareholder-backed Loans – 227 – 227 Equity securities and portfolio holdings in unit trusts 808 21 161 990 Debt securities 10,389 43,305 343 54,037 Other investments (including derivative assets) 52 1,146 563 1,761 Derivative liabilities (80) (1,049) (201) (1,330)
Total financial investments, net of derivative liabilities 11,169 43,650 866 55,685 Percentage of total 20% 78% 2% 100%
Group total analysis, including other financial liabilities held at fair value
Group Total Loans – 227 – 227 Equity securities and portfolio holdings in unit trusts 84,755 1,304 576 86,635 Debt securities 25,287 89,948 1,117 116,352 Other investments (including derivative assets) 232 2,441 3,106 5,779 Derivative liabilities (136) (1,675) (226) (2,037)
Total financial investments, net of derivative liabilities 110,138 92,245 4,573 206,956 Borrowings attributable to the with-profits fund held at fair value – (82) – (82)Investment contract liabilities without discretionary participation features held
at fair value – (15,822) – (15,822)Net asset value attributable to unit holders of consolidated unit trusts and
similar funds (2,099) (894) (379) (3,372)
Total financial instruments at fair value 108,039 75,447 4,194 187,680 Percentage of total 58% 40% 2% 100%
G: Financial assets and liabilities continued

313F
ina
ncia
l statem
en
ts
Reconciliation of movements in level 3 financial instruments measured at fair valueThe following tables reconcile the value of level 3 financial instruments at 1 January 2011 to that presented at 31 December 2011 and at 1 January 2010 to that presented at 31 December 2010. Total ’investment return’ in the income statement represents interest and dividend income, realised gains and losses, unrealised gains and losses on financial instruments classified at fair value through profit and loss and foreign exchange movements on an individual entity’s overseas investments. Total gains and losses recorded in other comprehensive income includes unrealised gains and losses on debt securities held as available-for-sale within Jackson and foreign exchange movements arising from the retranslation of the Group’s overseas subsidiaries and branches. The transfers in and out of level 3 during 2011 represent sundry individual financial investments, none of which are materially significant as highlighted in the table below. The transfers out from level 3 during 2010 comprise mainly transfers within the Jackson portfolio. Certain broker-priced assets of Jackson were previously classified as level 3 holdings as a result of illiquidity in the market and the resultant lack of observability into the assumptions used to produce those fair values. During 2010, as a result of ongoing consideration regarding the use of assumptions by pricing sources and the changes in the level of observability of these inputs over recent periods, Jackson determined that these assets would be more appropriately categorised as level 2. As a result, Jackson transferred debt securities of £606 million and derivative assets of £101 million from level 3 to level 2. The remaining transfers out of level 3 of the Group are primarily debt securities reclassifications from level 3 to level 2, which reflected improving liquidity during the period.
G: F
inan
cial assets an
d liab
ilities

314
Prudential plc Annual Report 2011
Financial statements | Notes on the Group financial statements
G1: Financial instruments – designation and fair values continued
At 1 Jan 2011
£m
Totalgains/
losses inincome
statement£m
Totalgains/losses
recordedin othercompre-hensiveincome
£mPurchases
£mSales
£mSettled
£m
Transfers into
level 3£m
Transfers out of level 3
£m
At 31 Dec 2011
£m
Reconciliation of movements in level 3 financial investments, net of derivative liabilities by business type
With-profits Equity securities and portfolio holdings in
unit trusts 415 42 – 21 (160) – – (34) 284 Debt securities 772 50 (1) 263 (371) (19) 1 (40) 655 Other investments (including derivative
assets) 2,543 177 (59) 530 (343) – – (55) 2,793 Derivative liabilities (25) – – – – – – 25 –
Total financial investments, net of derivative liabilities 3,705 269 (60) 814 (874) (19) 1 (104) 3,732
Unit-linked and variable annuity separate account
Equity securities and portfolio holdings in unit trusts – – – 30 – – – – 30
Debt securities 2 1 – 1 – – 1 (2) 3
Total financial investments, net of derivative liabilities 2 1 – 31 – – 1 (2) 33
Non-linked shareholder-backed Equity securities and portfolio holdings in
unit trusts 161 8 (1) 11 (118) – – – 61 Debt securities 343 (5) 6 10 (119) (2) 49 (31) 251 Other investments (including derivative
assets) 563 47 9 161 (74) – – – 706 Derivative liabilities (201) (17) – – – – – – (218)
Total financial investments, net of derivative liabilities 866 33 14 182 (311) (2) 49 (31) 800
Group total reconciliation of movements in level 3, including other financial liabilities held at fair value
Group Total Equity securities and portfolio holdings in
unit trusts 576 50 (1) 62 (278) – – (34) 375 Debt securities 1,117 46 5 274 (490) (21) 51 (73) 909 Other investments (including derivative
assets) 3,106 224 (50) 691 (417) – – (55) 3,499 Derivative liabilities (226) (17) – – – – – 25 (218)
Total financial investments, net of derivative liabilities 4,573 303 (46) 1,027 (1,185) (21) 51 (137) 4,565
Net asset value attributable to unit holders of consolidated unit trusts and similar funds (379) (78) – (10) 18 – – – (449)
Total 4,194 225 (46) 1,017 (1,167) (21) 51 (137) 4,116
G: Financial assets and liabilities continued

315F
ina
ncia
l statem
en
ts
At 1 Jan 2010
£m
Totalgains/
losses inincome
statement£m
Totalgains/losses
recordedin othercompre-hensiveincome
£mPurchases
£mSales
£mSettled
£m
Transfers into
level 3£m
Transfers out of level 3
£m
At 31 Dec 2010
£m
Reconciliation of movements in level 3 financial investments, net of derivative liabilities by business type
With-profits Equity securities and portfolio holdings in
unit trusts 475 (6) – 48 (59) – – (43) 415 Debt securities 1,213 (113) 18 15 (158) (34) 11 (180) 772 Other investments (including derivative
assets) 2,170 309 5 372 (312) – – (1) 2,543 Derivative liabilities (25) – – – – – – – (25)
Total financial investments, net of derivative liabilities 3,833 190 23 435 (529) (34) 11 (224) 3,705
Unit-linked and variable annuity separate account
Debt securities 40 – 3 2 (4) (18) – (21) 2
Total financial investments, net of derivative liabilities 40 – 3 2 (4) (18) – (21) 2
Non-linked shareholder-backed Equity securities and portfolio holdings in
unit trusts 179 43 5 30 (95) – 2 (3) 161 Debt securities 1,068 49 72 46 (213) (27) 61 (713) 343 Other investments (including derivative
assets) 632 15 32 129 (144) – – (101) 563 Derivative liabilities (195) (5) (1) – – – – – (201)
Total financial investments, net of derivative liabilities 1,684 102 108 205 (452) (27) 63 (817) 866
Group total reconciliation of movements in level 3, including other financial liabilities held at fair value
Group Total Equity securities and portfolio holdings in
unit trusts 654 37 5 78 (154) – 2 (46) 576 Debt securities 2,321 (64) 93 63 (375) (79) 72 (914) 1,117 Other investments (including derivative
assets) 2,802 324 37 501 (456) – – (102) 3,106 Derivative liabilities (220) (5) (1) – – – – – (226)
Total financial investments, net of derivative liabilities 5,557 292 134 642 (985) (79) 74 (1,062) 4,573
Net asset value attributable to unit holders of consolidated unit trusts and similar funds (367) (49) (1) (7) 43 – – 2 (379)
Total 5,190 243 133 635 (942) (79) 74 (1,060) 4,194
G: F
inan
cial assets an
d liab
ilities

316
Prudential plc Annual Report 2011
Financial statements | Notes on the Group financial statements
G1: Financial instruments – designation and fair values continued
Of the total gains and losses in the income statement of £225 million gains (2010: £243 million gains), £99 million (2010: £315 million) relates to financial instruments still held at the end of the year, which can be analysed into gains (losses) as follows:
2011 £m 2010 £m
Equity securities 49 18 Debt securities 20 110 Other investments 176 243 Derivative liabilities (68) (6)Net asset value attributable to unit holders of consolidated unit trusts and similar funds (78) (50)
Total 99 315
Transfers between level 1 and level 2During 2011, transfers from level 1 to level 2 amounted to £335 million (2010: £354 million) primarily in respect of certain investment funds held by the Group’s participating funds due to the change in the observability of the inputs used in valuing these funds. Interest income and expenseThe interest income on financial assets not at fair value through profit and loss for the year ended 31 December 2011 from continuing operations was £1,814 million (2010: £1,994 million). The interest expense on financial liabilities not at fair value through profit and loss for the year ended 31 December 2011 from continuing operations was £456 million (2010: £427 million).
G2: Market risk
Interest rate riskThe following table shows an analysis of the classes of financial assets and liabilities except for cash and cash equivalents and their direct exposure to interest rate risk. Each applicable class of the Group’s financial assets or liabilities is analysed between those exposed to fair value interest rate risk, cash flow interest rate risk and those with no direct interest rate risk exposure.
2011 £m
Fair valueinterestrate risk
Cash flowinterestrate risk
Not directlyexposed to
interestrate risk Total
Financial assetsDeposits 790 9,439 479 10,708 Debt securities 117,988 5,788 722 124,498 Loans 6,424 3,091 199 9,714 Other investments (including derivatives) 1,912 1,077 4,520 7,509
127,114 19,395 5,920 152,429
Financial liabilities Core structural borrowings of shareholder-financed operations 3,362 249 – 3,611 Operational borrowings attributable to shareholder-financed operations 3,114 213 13 3,340 Borrowings attributable to with-profits funds 120 743 109 972 Obligations under funding, securities lending and sale
and repurchase agreements 580 2,534 – 3,114 Investment contracts without discretionary participation features 1,011 903 15,053 16,967 Derivative liabilities 1,426 615 1,013 3,054 Other liabilities 158 142 949 1,249
9,771 5,399 17,137 32,307
G: Financial assets and liabilities continued

317F
ina
ncia
l statem
en
ts
2010 £m
Fair valueinterestrate risk
Cash flowinterestrate risk
Not directlyexposed to
interestrate risk Total
Financial assetsDeposits 887 8,941 124 9,952 Debt securities 110,168 5,824 360 116,352 Loans 6,238 3,001 22 9,261 Other investments (including derivatives) 1,616 448 3,715 5,779
118,909 18,214 4,221 141,344
Financial liabilities Core structural borrowings of shareholder-financed operations 3,676 – – 3,676 Operational borrowings attributable to shareholder-financed operations 2,624 377 3 3,004 Borrowings attributable to with-profits funds 679 710 133 1,522 Obligations under funding, securities lending and sale
and repurchase agreements 631 3,568 – 4,199 Investment contracts without discretionary participation features 988 894 15,822 17,704 Derivative liabilities 705 431 901 2,037 Other liabilities 121 129 879 1,129
9,424 6,109 17,738 33,271
Liquidity analysisi Contractual maturities of financial liabilitiesThe following table sets out the contractual maturities for applicable classes of financial liabilities, excluding derivative liabilities and investment contracts that are separately presented. The financial liabilities are included in the column relating to the contractual maturities at the undiscounted cash flows (including contractual interest payments) due to be paid assuming conditions are consistent with those of year end.
2011 £m
Total carrying
value1 yearor less
After 1year to5 years
After 5years to10 years
After 10years to15 years
After 15years to20 years
Over20 years
No statedmaturity Total
Financial liabilities Core structural borrowings of
shareholder-financed operationsH13 3,611 245 624 606 840 1,243 737 1,834 6,129 Operational borrowings attributable
to shareholder-financed operationsH13 3,340 2,971 394 – – – – – 3,365
Borrowings attributable to with-profits fundsH13 972 199 418 158 100 5 97 139 1,116
Obligations under funding, securities lending and sale and repurchase agreements 3,114 3,114 – – – – – – 3,114
Other liabilities 1,249 842 106 5 – – – 296 1,249 Net asset value attributable to unit
holders of consolidated unit trusts and similar funds 3,840 3,840 – – – – – – 3,840
Other creditors 2,544 2,268 20 27 36 45 148 – 2,544
18,670 13,479 1,562 796 976 1,293 982 2,269 21,357
G: F
inan
cial assets an
d liab
ilities

318
Prudential plc Annual Report 2011
Financial statements | Notes on the Group financial statements
G2: Market risk continued
2010 £m
Total carrying
value1 yearor less
After 1year to5 years
After 5years to10 years
After 10years to15 years
After 15years to20 years
Over20 years
No statedmaturity Total
Financial liabilities Core structural borrowings of
shareholder-financed operationsH13 3,676 164 861 731 1,314 835 1,244 1,469 6,618 Operational borrowings attributable
to shareholder-financed operationsH13 3,004 2,510 561 3 3 3 10 – 3,090
Borrowings attributable to with-profits fundsH13 1,522 155 1,051 161 2 2 121 182 1,674
Obligations under funding, securities lending and sale and repurchase agreements 4,199 4,199 – – – – – – 4,199
Other liabilities 1,129 867 16 50 – – – 196 1,129 Net asset value attributable to unit
holders of consolidated unit trusts and similar funds 3,372 3,372 – – – – – – 3,372
Other creditors 2,321 2,321 – – – – – – 2,321
19,223 13,588 2,489 945 1,319 840 1,375 1,847 22,403
ii Maturity analysis of derivativesThe following table provides a maturity analysis of derivative assets and liabilities:
2011 £m
Total carrying
value1 yearor less
After 1year to3 years
After 3years to5 years
After 5years Total
Net derivative position 601 731 (18) (11) (31) 671
2010 £m
Total carrying
value1 yearor less
After 1year to3 years
After 3years to5 years
After 5years Total
Net derivative position 2 1 1 – – 2
The net derivative positions as shown in the table above comprise the following derivative assets and liabilities:
2011 £m 2010 £m
Derivative assets 3,655 2,039 Derivative liabilities (3,054) (2,037)
Net derivative position 601 2
G: Financial assets and liabilities continued

319F
ina
ncia
l statem
en
ts
The majority of derivative assets and liabilities have been included at fair value within the one year or less column, representing the basis on which they are managed (ie to manage principally asset or liability value exposures). Contractual maturities are not considered essential for an understanding of the timing of the cash flows for these instruments and, in particular, the Group has no cash flow hedges. The only exception is certain identified interest rate swaps which are fully expected to be held until maturity solely for the purposes of matching cash flows on separately held assets and liabilities. For these instruments the undiscounted cash flows (including contractual interest amounts) due to be paid under the swap contract assuming conditions are consistent with those at year end are included in the column relating to the contractual maturity of the derivative. The table below shows the maturity profile for investment contracts on an undiscounted basis to the nearest billion. This maturity profile has been based on the cash flow projections of expected benefit payments as part of the determination of the value of in-force business when preparing EEV basis results.
2011 £bn
1 yearor less
After 1year to5 years
After 5years to10 years
After 10years to15 years
After 15years to20 years
Over20 years
Total undis-
countedvalue
Totalcarrying
value
Life assurance investment contracts 3 12 13 11 9 10 58 47
2010 £bn
1 yearor less
After 1year to5 years
After 5years to10 years
After 10years to15 years
After 15years to20 years
Over20 years
Total undis-
countedvalue
Totalcarrying
value
Life assurance investment contracts 3 12 15 14 12 15 71 43
Most investment contracts have options to surrender early, albeit these are often subject to surrender or other penalties. It is therefore the case that most contracts could be said to have a contractual maturity of less than one year, but in reality the additional charges and term of the contracts means these are unlikely to be exercised in practice and the more useful information is to present information on expected payment. The maturity profile above excludes certain corporate unit-linked business with gross policyholder liabilities of £11 billion (2010: £11 billion) which has no stated maturity but which is repayable on demand. This table has been prepared on an undiscounted basis and accordingly the amounts shown for life assurance investment contracts differ from those disclosed on the statement of financial position. Durations of long-term business contracts, covering insurance and investment contracts, on a discounted basis are included in section D. The vast majority of the Group’s financial assets are held to back the Group’s policyholder liabilities. Although asset/liability matching is an important component of managing policyholder liabilities (both those classified as insurance and those classified as investments), this profile is mainly relevant for managing market risk rather than liquidity risk. Within each business unit this asset/liability matching is performed on a portfolio by portfolio basis. In terms of liquidity risk a large proportion of the policyholder liabilities contain discretionary surrender values or surrender charges, meaning that many of the Group’s liabilities are expected to be held for the long-term. Much of the Group’s investment portfolios are in marketable securities, which can therefore be converted quickly to liquid assets. For the reasons above an analysis of the Group’s assets by contractual maturity is not considered necessary to evaluate the nature and extent of the Group’s liquidity risk.
G: F
inan
cial assets an
d liab
ilities

320
Prudential plc Annual Report 2011
Financial statements | Notes on the Group financial statements
G2: Market risk continued
Credit riskThe Group’s maximum exposure to credit risk of financial instruments before any allowance for collateral or allocation of losses to policyholders is represented by the carrying value of financial instruments on the balance sheet that have exposures to credit risk. These assets comprise cash and cash equivalents, deposits, debt securities, loans and derivative assets, and other debtors, the carrying value of which are disclosed at the start of this note and note G3 for derivative assets. The collateral in place in relation to derivatives is described in G4. Notes D2(a)(v), D3(a)(ii)(ii) and D4(a)(iii), describe the security for these loans held by the Group, as disclosed at the start of this note. Of the total loans and receivables held, £39 million (2010: £74 million) are past their due date but have not been impaired. Of the total past due but not impaired, £3 million is less than one year past their due date and no loans or receivables are more than six months but less than one year past their due date (2010: £26 million and £9 million respectively). The Group expects full recovery of these loans and receivables. No further analysis has been provided of the age of financial assets that are past due at the end of the reporting period but not impaired as the amounts are immaterial. No further analysis has been provided of the element of loans and receivables that was neither past due nor impaired for the total portfolio. This is on the grounds of immateriality of the difference between the neither past due nor impaired elements and the total portfolio. Financial assets that would have been past due or impaired had the terms not been renegotiated amounted to £90 million (2010: £97 million). In addition, during the year the Group took possession of £13 million (2010: £22 million) of other collateral held as security, which mainly consists of assets that could be readily convertible into cash. Further details of collateral and pledges are provided in note G4.
Currency riskAs at 31 December 2011, the Group held 21 per cent (2010: 18 per cent) and 9 per cent (2010: 14 per cent) of its financial assets and financial liabilities respectively, in currencies, mainly US dollar and Euro, other than the functional currency of the relevant business unit. The financial assets, of which 55 per cent (2010: 70 per cent) are held by the PAC with-profits fund, allow the PAC with-profits fund to obtain exposure to foreign equity markets. The financial liabilities, of which 28 per cent (2010: 28 per cent) are held by the PAC with-profits fund, mainly relate to foreign currency borrowings. The exchange risks inherent in these exposures are mitigated through the use of derivatives, mainly forward currency contracts (note G3 below). The amount of exchange gains recognised in the income statement in 2011, except for those arising on financial instruments measured at fair value through profit and loss, is £1 million (2010: £82 million losses). This constitutes £11 million losses (2010: £16 million losses) on medium-term notes (MTN) liabilities and £12 million of net gains (2010: £98 million net losses), mainly arising on investments of the PAC with-profits fund. The gains/losses on MTN liabilities are fully offset by value movements on cross-currency swaps, which are measured at fair value through profit and loss.
G: Financial assets and liabilities continued

321F
ina
ncia
l statem
en
ts
G3: Derivatives and hedging
DerivativesThe Group enters into a variety of exchange traded and over-the-counter derivative financial instruments, including futures, options, forward currency contracts and swaps such as interest rate swaps, cross-currency swaps, swaptions and credit default swaps. All over-the-counter derivative transactions, with the exception of some Asian transactions, are conducted under standardised ISDA (International Swaps and Derivatives Association Inc) master agreements and the Group has collateral agreements between the individual Group entities and relevant counterparties in place under each of these market master agreements. The total fair value balances of derivative assets and liabilities as at 31 December 2011 were as follows:
2011 £m
UK insuranceoperations
US insuranceoperations
Asian insuranceoperations
Assetmanagement
Unallocatedto a segment
GroupTotal
Derivative assets 1,461 1,677 444 71 2 3,655 Derivative liabilities (1,298) (887) (480) (182) (207) (3,054)
163 790 (36) (111) (205) 601
2010 £m
UK insuranceoperations
US insuranceoperations
Asian insuranceoperations
Assetmanagement
Unallocatedto a segment
GroupTotal
Derivative assets 926 645 310 44 114 2,039 Derivative liabilities (792) (799) (222) (78) (146) (2,037)
134 (154) 88 (34) (32) 2
The above derivative assets are included in ‘other investments’ in the primary statements. These derivatives are used for efficient portfolio management to obtain cost-effective and efficient exposure to various markets in accordance with the Group’s investment strategies and to manage exposure to interest rate, currency, credit and other business risks. See also note D3 for use of derivatives by the Group’s US operations. The Group uses various interest rate derivative instruments such as interest rate swaps to reduce exposure to interest rate volatility. The UK insurance operations use various currency derivatives in order to limit volatility due to foreign currency exchange rate fluctuations arising on securities denominated in currencies other than sterling. See also note G2 above. In addition, total return swaps and interest rate swaps are held for efficient portfolio management. Some of the Group’s products, especially those sold in the US, have certain guarantee features linked to equity indexes. A mismatch between guaranteed product liabilities and the performance of the underlying assets backing them, exposes the Group to equity index risk. In order to mitigate this risk, the relevant business units purchase swaptions, equity options and futures to match asset performance with liabilities under equity-indexed products. The US operations and some of the UK operations hold large amounts of interest rate sensitive investments that contain credit risks on which a certain level of defaults is expected. These entities have purchased some swaptions in order to manage the default risk on certain underlying assets and hence reduce the amount of regulatory capital held to support the assets.
G: F
inan
cial assets an
d liab
ilities

322
Prudential plc Annual Report 2011
Financial statements | Notes on the Group financial statements
G3: Derivatives and hedging continued
HedgingThe Group has formally assessed and documented the effectiveness of the following hedges under IAS 39.
Fair value hedgesThe Group used interest rate derivatives to hedge the interest rate exposures on its US$300 million, 6.5 per cent perpetual subordinated capital securities until September 2010. The hedge terminated at this point. The impact on the Group’s 2010 income statement was immaterial. The Group has chosen to designate as a fair value hedge certain fixed to floating rate swaps which hedge the fair value exposure to interest rate movements of certain of the Group’s operational borrowings. The fair value of the derivatives designated as fair value hedges above at 31 December 2011, was an asset of £3 million (2010: asset of £5 million). Movements in the fair value of the hedging instruments of a net loss of £2 million (2010: net loss of £1 million) and the hedged items of a net gain of £2 million (2010: net gain of £1 million) are recorded in the income statement in respect of the fair value hedges above.
Cash flow hedgesThe Group has no cash flow hedges in place.
Net investment hedgesThe Group has designated perpetual subordinated capital securities totalling US$2.85 billion (2010: US$2.3 billion) as a net investment hedge to hedge the currency risks related to the net investment in Jackson. The carrying value of the subordinated capital securities was £1,834 million as at 31 December 2011 (2010: £1,462 million). The foreign exchange loss of £18 million (2010: loss of £45 million) on translation of the borrowings to pounds sterling at the statement of financial position date is recognised in the translation reserve in shareholders’ equity. This net investment hedge was 100 per cent effective.
G4: Derecognition and collateral
Securities lending and reverse repurchase agreementsThe Group has entered into securities lending (including repurchase agreements) whereby blocks of securities are loaned to third parties, primarily major brokerage firms. The amounts above the fair value of the loaned securities required to be held as collateral by the agreements depend on the quality of the collateral, calculated on a daily basis. The loaned securities are not removed from the Group’s consolidated statement of financial position, rather they are retained within the appropriate investment classification. Collateral typically consists of cash, debt securities, equity securities and letters of credit. At 31 December 2011, the Group had lent £7,843 million (2010: £8,708 million), of which £5,820 million (2010: £6,488 million) was lent by the PAC with-profits fund of securities and held collateral under such agreements of £8,160 million (2010: £9,334 million) of which £6,108 million (2010: £6,910 million) was held by the PAC with-profits fund. At 31 December 2011, the Group had entered into reverse repurchase transactions under which it purchased securities and had taken on the obligation to resell the securities for the purchase price of £1,607 million (2010: £1,208 million), together with accrued interest.
Collateral and pledges under derivative transactionsAt 31 December 2011, the Group had pledged £840 million (2010: £800 million) for liabilities and held collateral of £1,953 million (2010: £804 million) in respect of over-the-counter derivative transactions. These transactions are conducted under terms that are usual and customary to collateralised transactions including, where relevant, standard securities lending and repurchase agreement.
G: Financial assets and liabilities continued

323F
ina
ncia
l statem
en
ts
G5: Impairment of financial assets
In accordance with the Group’s accounting policy set out in note A4, impairment reviews were performed for available-for-sale securities and loans and receivables. In addition, impairment reviews were undertaken for the reinsurers’ share of insurance contract liabilities. During the year ended 31 December 2011, impairment losses of £126 million (2010: £145 million) were recognised for available-for-sale securities and loans and receivables analysed as shown in the attached table.
2011 £m 2010 £m
Available-for-sale securities held by Jackson 62 124 Loans and receivables* 64 21
126 145
* Relates to loans held by the UK with-profits fund and mortgage loans held by Jackson
Impairment losses recognised on available-for-sale securities amounted to £62 million (2010: £124 million). Of this amount, 34 per cent (2010: 90 per cent) has been recorded on structured asset-backed securities, primarily due to reduced cash flow expectations on such securities that are collateralised by diversified pools of primarily below investment grade securities. Of the losses related to the impairment of fixed maturity securities, the top five individual corporate issuers made up 75 per cent (2010: 32 per cent), reflecting a deteriorating business outlook of the companies concerned. The impairment losses have been recorded in ‘investment return’ in the income statement. In 2011, the Group realised gross losses on sales of available-for-sale securities of £43 million (2010: £160 million) with 64 per cent (2010: 45 per cent) of these losses related to the disposal of fixed maturity securities of 10 (2010: 15) individual issuers, which were disposed of as part of risk reduction programmes intended to limit future credit loss exposure. Of the £43 million (2010: £160 million), £32 million (2010: £99 million) relates to losses on sales of impaired and deteriorating securities. The effect of those reasonably likely changes in the key assumptions underlying the estimates that underpin the assessment of whether impairment has taken place depends on the factors described in note A3. A key indicator of whether such impairment may arise in future and the potential amounts at risk, is the profile of gross unrealised losses for fixed maturity securities accounted for on an available-for-sale basis by reference to the time periods by which the securities have been held continuously in an unrealised loss position and by reference to the maturity date of the securities concerned. For 2011, the amount of gross unrealised losses for fixed maturity securities classified as available-for-sale under IFRS in an unrealised loss position was £246 million (2010: £370 million). Notes B1 and D3 provide further details on the impairment charges and unrealised losses of Jackson’s available-for-sale securities.
G: F
inan
cial assets an
d liab
ilities

324
Prudential plc Annual Report 2011
Financial Statements | Notes on the Group Financial Statements
H: Other information on statement of financial position items
H1: Intangible assets attributable to shareholders
a Goodwill
2011 £m 2010 £m
CostAt 1 January 1,586 1,430 Acquisition of UOB Life Assurance Limited in Singapore – 141 Exchange differences (1) 15
At31December 1,585 1,586
Aggregateimpairment (120) (120)
Netbookamountat31December 1,465 1,466
Goodwill attributable to shareholders comprises:
2011 £m 2010 £m
M&G 1,153 1,153 Other 312 313
1,465 1,466
Other represents goodwill amounts allocated across cash generating units (CGUs) in Asia and US operations. Other goodwill amounts are not individually material. During 2010, £141 million (SGD313 million) of goodwill was recognised upon the acquisition of UOB Life Assurance Limited. Upon translation at the year end exchange rate, the carrying value of this UOB Life Assurance goodwill at 31 December 2011 was £155 million (31 December 2010: £156 million).
ImpairmenttestingGoodwill does not generate cash flows independently of other groups of assets and thus is assigned to CGUs for the purposes of impairment testing. These CGUs are based upon how management monitors the business and represent the lowest level to which goodwill can be allocated on a reasonable basis.
AssessmentofwhethergoodwillmaybeimpairedGoodwill is tested for impairment by comparing the CGUs carrying amount, including any goodwill, with its recoverable amount. With the exception of M&G, the goodwill attributable to shareholders in the statement of financial position mainly relates to acquired life businesses. The Company routinely compares the aggregate of net asset value and acquired goodwill on an IFRS basis of acquired life business with the value of the business as determined using the EEV methodology, as described in note D1. Any excess of IFRS over EEV carrying value is then compared with EEV basis value of current and projected future new business to determine whether there is any indication that the goodwill in the IFRS statement of financial position may be impaired. The assumptions underpinning the Group’s EEV basis of reporting are included in the EEV basis supplementary information in this Annual Report. In particular at 31 December 2011, the EEV of the CGU containing the UOB Life Assurance goodwill (being the Singapore insurance operations) materially exceeded its IFRS net asset value and so no impairment was deemed to arise.

325F
ina
ncia
l statem
en
ts
H:O
therin
form
ation
onstatem
ento
ffinan
cialpositio
nitem
s
M>he recoverable amount for the M&G CGU has been determined by calculating its value in use. This has been calculated by aggregating the present value of future cash flows expected to be derived from the M&G operating segment (based upon management projections). The discounted cash flow valuation has been based on a three-year plan prepared by M&G, and approved by management, and cash flow projections for later years. The value in use is particularly sensitive to a number of key assumptions as follows:
i The set of economic, market and business assumptions used to derive the three-year plan. The direct and secondary effects of recent developments, eg changes in global equity markets, are considered by management in arriving at the expectations for the financial projections for the plan;
ii The assumed growth rate on forecast cash flows beyond the terminal year of the plan. A growth rate of 2.5 per cent (2010: 2.5 per cent) has been used to extrapolate beyond the plan period representing management’s best estimate view of the long-term growth rate of the business after considering the future and past growth rates and external sources of data;
iii The risk discount rate. Differing discount rates have been applied in accordance with the nature of the individual component businesses. For retail and institutional business a risk discount rate of 12 per cent (2010: 12 per cent) has been applied to post-tax cash flows. The pre-tax risk discount rate was 15 per cent (2010: 16 per cent). Management have determined the risk discount rate by reference to an average implied discount rate for comparable UK listed asset managers calculated by reference to risk-free rates, equity risk premiums of five per cent and an average ‘beta’ factor for relative market risk of comparable UK listed asset managers. A similar approach has been applied for the other component businesses of M&G; and
iv That asset management contracts continue on similar terms.
Management believes that any reasonable change in the key assumptions would not cause the recoverable amount of M&G to fall below its carrying amount.
JapaneselifecompanyThe aggregate goodwill impairment of £120 million at 31 December 2011 and 2010 relates to the goodwill held in relation to the Japanese life operation which was impaired in 2005.
b DeferredacquisitioncostsandotherintangibleassetsattributabletoshareholdersThe deferred acquisition costs and other intangible assets in the Group consolidated statement of financial position attributable to shareholders comprise:
2011 £m 2010 £m
Deferred acquisition costs related to insurance contracts as classified under IFRS 4 4,640 4,316 Deferred acquisition costs related to investment management contracts, including life
assurance contracts classified as financial instruments and investment management contracts under IFRS 4 107 110
4,747 4,426
Present value of acquired in-force policies for insurance contracts as classified under IFRS 4 (PVIF) 64 70 Other intangibles* 258 171
322 241
Total of deferred acquisition costs and other intangible assets 5,069 4,667*
*At31December2010aspreviouslypublished,tangibleassetsincludedcomputersoftwarewithanetbookvalueof£58million,whichinthesefinancialstatementshavebeenmoreappropriatelyclassifiedasotherintangibleassets.Theseamountshavebeentransferredtootherintangibleassetsandthecomparativebalanceshavebeenadjustedaccordingly.ThisisonlyapresentationaladjustmentwithnoimpactontheGroup’sresultsorshareholders’equity.

326
Prudential plc Annual Report 2011
Financial statements | Notes on the Group financial statements
H1: Intangible assets attributable to shareholders continued
Deferredacquisitioncosts
UK
£m
USnote(i)
£m
Asia
£m
Assetmanagement
£m
PVIFandother
intangibles
£m
2011 Total
£m
2010 Total
£m
Balanceat1January 116 3,543 758 9 241 4,667 4,097 Additions 16 890 256 7 120 1,289 1,162 Acquisitions of subsidiaries – – – – – – 12 Amortisation to the income statement:
Operating profit (21) (619) (242) (4) (35) (921) (595)Amortisation related to short-term
fluctuations in investment returns – 359 – – – 359 358 (21) (260) (242) (4) (35) (562) (237)
Exchange differences – 38 (28) – (2) 8 141 Change in shadow DAC related to
movement in unrealised appreciation of Jackson's securities classified as available-for-sale* – (331) – – – (331) (496)
Disposals – – – – (2) (2) (5)Dilution of Group's holdings – – – – – – (7)
Balanceat31December 111 3,880 744 12 322 5,069 4,667
*SeenoteD3(g)forexplanation
Note(i) TheDACamountinrespectofUSinsuranceoperationsincludes:
2011 £m 2010 £m
Variable annuity business 3,860 2,834 Other business 886 1,229 Cumulative shadow DAC (866) (520)
Total DAC for US operations 3,880 3,543
DeferredacquisitioncostsrelatedtoinsurancecontractsattributabletoshareholdersThe movement in deferred acquisition costs relating to insurance contracts attributable to shareholders is as follows:
2011 £m 2010 £m
Deferredacquisitioncostsat1January 4,316 3,823 Additions 1,152 1,064 Amortisation (507) (190)Exchange differences 10 122 Change in shadow DAC related to movement in unrealised appreciation of Jackson’s securities classified as
available-for-sale (331) (496)Dilution of Group's holdings – (7)
Deferredacquisitioncostsat31December 4,640 4,316
H: Other information on statement of financial position items continued

327F
ina
ncia
l statem
en
ts
DeferredacquisitioncostsrelatedtoinvestmentmanagementcontractsattributabletoshareholdersIncremental costs associated with the origination of investment management contracts written by the Group’s insurance and asset management businesses are capitalised and amortised as the related revenue is recognised.
2011 £m 2010 £m
At1JanuaryGross amount 183 162 Accumulated amortisation (73) (55)
Netbookamount 110 107
Additions (through internal development) 17 21 Amortisation (20) (18)
At31December 107 110
Comprising: Gross amount 200 183 Accumulated amortisation (93) (73)
Netbookamount 107 110
Presentvalueofacquiredin-forcebusinessoflong-termbusinesscontractsattributabletoshareholdersThe present value of acquired in-force business (PVAIF) relating to investment contracts without discretionary participation features represents the contractual right to benefit from providing these investment management services in the future. The fair value is measured as the present value of the future profits of the investment management component of these contracts. These contracts are accounted for under the provisions of IAS 18. The PVAIF balance relating to insurance contracts is accounted for under UK GAAP as permitted by IFRS 4. The present value of future profits of acquired investment management contracts which was fully amortised during 2010 related to unit-linked contracts acquired as part of the M&G acquisition in 1999. Amortisation is charged to the ‘acquisition costs and other operating expenditure’ line in the income statement over the period of provision of asset management services as those profits emerge.
2011 £m 2010 £m
Insurancebusiness
Investmentmanagement
Insurancebusiness
Investmentmanagement
At1January Cost 203 – 175 12 Accumulated amortisation (133) – (123) (11)
Netbookamount 70 – 52 1
Acquisition of UOB Life Assurance Ltd noteI1 – – 12 –Amortisation charge (5) – (4) (1)Exchange differences (1) – 10 –
At31December 64 – 70 –
Comprising: Cost 200 – 203 –Accumulated amortisation (136) – (133) –
Netbookamount 64 – 70 –
H:O
therin
form
ation
onstatem
ento
ffinan
cialpositio
nitem
s

328
Prudential plc Annual Report 2011
Financial statements | Notes on the Group financial statements
H1: Intangible assets attributable to shareholders continued
OtherintangiblesOther intangibles comprise distribution and software rights. Distribution rights relate to facilitation fees paid in respect of the bancassurance partnership arrangements in Asia for the bank distribution of Prudential’s insurance products for a fixed period of time. The distribution rights amounts are amortised over the term of the distribution contracts. Software is amortised over its useful economic life, which generally represents the licence period of the software acquired. Amortisation is charged to the ‘acquisition costs and other expenditure’ line in the income statement.
Distributionrights Software
Total
2011 £m 2010 £m 2011 £m 2010 £m 2011 £m 2010 £m
At1January Cost 136 79 144 155 280 234 Accumulated amortisation (23) (13) (86) (107) (109) (120)
113 66 58 48 171 114
Additions (including amounts arising on acquisition of subsidiaries) 96 50 24 27 120 77
Amortisation charge (9) (8) (21) (16) (30) (24)Disposals – – (2) (5) (2) (5)Exchange differences (1) 5 – 4 (1) 9
At31December 199 113 59 58 258 171
Comprising: Cost 235 136 163 144 398 280 Accumulated amortisation (36) (23) (104) (86) (140) (109)
199 113 59 58 258 171
H2: Intangible assets attributable to with-profits funds
a Goodwillinrespectofacquiredinvestmentsubsidiariesforventurefundandotherinvestmentpurposes
2011 £m 2010 £m
At1January 166 124 Additions in the yearnoteI8(iii) 12 42
At31December 178 166
All the goodwill relates to the UK insurance operations segment. The venture fund investments consolidated by the Group relates to investments by PAC with-profits fund managed by M&G. The goodwill shown in the table above relates to these venture fund investments. Goodwill is tested for impairment for these investments by comparing the investment’s carrying value including goodwill with its recoverable amount. The recoverable amount of the investments is determined by calculating their fair value less costs to sell. The fair value is determined by using a discounted cash flow valuation. The valuations are based on cash flow projections to 2015 prepared by management after considering the historical experience and future growth rates of the business. The key assumption applied in the calculations is the risk discount rate ranging from 10 to 14 per cent derived by reference to risk-free rates and an equity premium risk. In 2011, no goodwill was deemed to be impaired following the impairment testing carried out.
b DeferredacquisitioncostsandotherintangibleassetsOther intangible assets in the Group consolidated statement of financial position attributable to with-profits funds consist of:
2011 £m 2010 £m
Deferred acquisition costs related to insurance contracts attributable to the PAC with-profits fundnoteI8(iii) 6 13 Distribution rights attributable to with-profits funds of the Asian insurance operations 83 97
89 110
H: Other information on statement of financial position items continued

329F
ina
ncia
l statem
en
ts
DeferredacquisitioncostsrelatedtoinsurancecontractsattributabletothePACwith-profitsfundThe movement in deferred acquisition costs relating to insurance contracts attributable to the PAC with-profits fund is as follows:
2011 £m 2010 £m
At1January 13 9 Additions – 9 Amortisation charge (7) (5)
At31December 6 13
The above costs relate to non-participating business written by the PAC with-profits sub-fund. No deferred acquisition costs are established for the participating business.
Distributionrightsattributabletowith-profitfundsoftheAsianinsuranceoperationsDistribution rights relate to facilitation fees paid in relation to the bancassurance partnership arrangements in Asia for the bank distribution of Prudential’s insurance products for a fixed period of time. The distribution rights amounts are amortised over the term of the distribution contracts.
2011 £m 2010 £m
At1January Gross amount 108 103 Accumulated amortisation (11) (6)
97 97
Amortisation charge (5) (4)Exchange differences 1 4 Reclassification (10) –
At31December 83 97
Comprising: Gross amount 96 108 Accumulated amortisation (13) (11)
83 97
H3: Reinsurer’ share of insurance contract liabilities
2011 £m 2010 £m
Insurance contract liabilities 1,486 1,167 Claims outstanding 161 177
1,647 1,344
Comprising amounts in respect of: UK insurance operationsnoteD2(h) 589 608 US insurance operationsnoteD3(h) 907 695 Asian insurance operationsnoteD4(h) 151 41
1,647 1,344
The movement on reinsurers’ share of insurance contract liabilities is as follows:
2011 £m 2010 £m
At1January 1,167 1,114 Movement in the year 303 31 Foreign exchange translation differences 16 22
At31December 1,486 1,167
H:O
therin
form
ation
onstatem
ento
ffinan
cialpositio
nitem
s

330
Prudential plc Annual Report 2011
Financial statements | Notes on the Group financial statements
H4: Tax assets and liabilities
AssetsOf the £546 million (2010: £555 million) current tax recoverable, the majority is expected to be recovered in one year or less.
Deferredtaxasset
2011 £m 2010 £m
Unrealised losses on investments 297 449 Balances relating to investment and insurance contracts 13 11 Short-term timing differences 1,513 1,152 Capital allowances 15 16 Unused deferred tax losses 438 560
Total 2,276 2,188
The deferred tax asset at 31 December 2011 and 2010 arises in the following parts of the Group:
2011 £m 2010 £m
UK insurance operations SAIF 1 2 PAC with-profits fund (including PAL) 78 108 Other 153 104 US insurance operations 1,392 1,391 Asian insurance operations 114 98 Other operations 538 485
Total 2,276 2,188
The increase in the deferred tax asset primarily relates to additional short-term timing differences on US insurance reserves partially offset by the reduction in unrealised losses together with the utilisation of unused tax losses across the group. Deferred tax assets are recognised to the extent that they are regarded as recoverable, that is to the extent that, on the basis of all available evidence, it can be regarded as more likely than not that there will be suitable taxable profits from which the future reversal of the underlying temporary differences can be deducted. The taxation regimes applicable across the Group often apply separate rules to trading and capital profits and losses. The distinction between temporary differences that arise from items of either a trading or capital nature may affect the recognition of deferred tax assets. Accordingly, for the 2011 results and financial position at 31 December 2011 the possible tax benefit of approximately £158 million (31 December 2010: £143 million), which may arise from capital losses valued at approximately £0.7 billion (31 December 2010: £0.5 billion), is sufficiently uncertain that it has not been recognised. In addition, a potential deferred tax asset of £147 million (31 December 2010: £298 million), which may arise from trading tax losses and other potential temporary differences totalling £0.6 billion (31 December 2010: £1.2 billion), is sufficiently uncertain that it has not been recognised. Of these, losses of £142 million will expire within the next nine years. The remaining losses have no expiry date. In the two tables that follow the Group has provided a further breakdown of the recognised deferred tax assets for both the short-term timing differences and unused tax losses split by business unit set out in the table at (ii) above. In addition we have detailed the period of estimated recoverability for each respective business unit. For these and each category of deferred tax asset recognised, their recoverability against forecast taxable profits is not significantly impacted by any current proposed changes to future accounting standards.
Short-termtimingdifferences 2011 £m Expectedperiodofrecoverability
Asia 65 3 to 5 yearsJNL 1,206 70% to 90% within 10 years*UK long-term business 141 1 to 7 yearsOther 101 3 to 10 years
Total 1,513
*Theremainderisexpectedtoberecoveredwithin20years
H: Other information on statement of financial position items continued

331F
ina
ncia
l statem
en
ts
Unusedtaxlosses 2011 £m Expectedperiodofrecoverability
Asia 28 3 to 5 yearsUK long-term business 11 1 to 3 yearsOther 399 1 to 3 years
Total 438
LiabilitiesThe current tax liability increased to £930 million (2010: £831 million) reflecting both an increase in taxable profits in the UK insurance business, and the recent fiscal developments affecting the Indonesia life insurance industry.
Deferredtaxliability
2011 £m 2010 £m
Unrealised gains on investments 1,566 1,678 Balances relating to investment and insurance contracts 949 1,057 Short-term timing differences 1,687 1,477 Capital allowances 9 12
Total 4,211 4,224
The UK government’s tax rate change to 25 per cent (from the current 26 per cent which was effective from 1 April 2011) has had the effect of reducing the UK with-profits and shareholder-backed business element of the net deferred tax balances as at 31 December 2011 by £26 million. The tax change to 25 per cent is effective from 1 April 2012 but has been enacted at 31 December 2011. The subsequent proposed phased rate changes to 23 per cent are expected to have the effect of reducing the UK with-profits and shareholder-backed business elements of the net deferred tax balances at 31 December 2011 by £45 million.
H5: Accrued investment income and other debtors
2011 £m 2010 £m
AccruedinvestmentincomeInterest receivable 1,919 1,844 Other 791 824
Total 2,710 2,668
Otherdebtors Amounts due from: Policyholders 227 141 Intermediaries 27 28 Reinsurers 11 27 Other 722 707
Total 987 903
Totalaccruedinvestmentincomeandotherdebtors 3,697 3,571
Of the £3,697 million (2010: £3,571 million) of accrued investment income and other debtors, £162 million (2010: £151 million) is expected to be settled after one year or more.
H:O
therin
form
ation
onstatem
ento
ffinan
cialpositio
nitem
s

332
Prudential plc Annual Report 2011
Financial statements | Notes on the Group financial statements
H6: Property, plant and equipment
Property, plant and equipment comprise Group occupied properties and tangible assets. A reconciliation of the carrying amount of these items from the beginning of the year to the end of the year is as follows:
GroupoccupiedProperty
£m
Tangible*Assets
£mTotal£m
At1January2010Cost 173 506 679 Accumulated depreciation (20) (340) (360)
Netbookamount 153 166 319
Yearended31December2010noteI1 Opening net book amount 153 166 319 Exchange differences 5 5 10 Depreciation charge (4) (52) (56)Additions 19 48 67 Arising on acquisitions of subsidiaries – 219 219 Disposals and transfers – (5) (5)
Closingnetbookamount 173 381 554
At1January2011 Cost 197 764 961 Accumulated depreciation (24) (383) (407)
Net book amount 173 381 554
Yearended31December2011 Opening net book amount 173 381 554 Exchange differences (2) (7) (9)Depreciation charge (5) (69) (74)Additions 5 119 124 Arising on acquisitions of subsidiaries 69 99 168 Disposals and transfers (7) (8) (15)
Closingnetbookamount 233 515 748
At31December2011 Cost 262 915 1,177 Accumulated depreciation (29) (400) (429)
Netbookamount 233 515 748
*At31December2010aspreviouslypublished,tangibleassetsincludedcomputersoftwarewithanetbookvalueof£58million,whichinthesefinancialstatementshavebeenmoreappropriatelyclassifiedasotherintangibleassets.Theseamountshavebeentransferredtootherintangibleassetsandthecomparativebalanceshavebeenadjustedaccordingly.ThisisonlyapresentationaladjustmentwithnoimpactontheGroup’sresultsorshareholders’equity.
H: Other information on statement of financial position items continued

333F
ina
ncia
l statem
en
ts
Capitalexpenditure:property,plantandequipmentbysegment
2011 £m 2010 £m
Insurance operations: UK 69 23 US 20 18 Asia 21 18 Asset management operations: M&G 1 1 US 1 1 Asia 5 3
Totalsegment 117 64
Unallocated corporate 7 3
Total 124 67
H7: Investment properties
Investment properties principally relate to the PAC with-profits fund and are carried at fair value. A reconciliation of the carrying amount of investment properties at the beginning and end of the year is set out below:
2011 £m 2010 £m
At1January 11,247 10,905
Additions: Resulting from acquisitions 393 267 Resulting from expenditure capitalised 45 44 Disposals (1,439) (390)Net gain from fair value adjustments 522 636 Net foreign exchange differences (41) 38 Transfers from/(to) held for sale assets 25 (254)Transfers from owner occupied properties 5 1
At31December 10,757 11,247
The income statement includes the following items in respect of investment properties:
2011 £m 2010 £m
Rental income from investment properties 606 625 Direct operating expenses (including repairs and maintenance expenses) arising from investment
properties that generated rental income during the year 128 125
FurtherinformationontheinvestmentpropertyheldbytheUKinsuranceoperationsisincludedinnoteD2(a).
H:O
therin
form
ation
onstatem
ento
ffinan
cialpositio
nitem
s

334
Prudential plc Annual Report 2011
Financial statements | Notes on the Group financial statements
H7: Investment properties continued
Investment properties of £3,439 million (2010: £3,435 million) are held under finance leases. A reconciliation between the total of future minimum lease payments at the statement of financial position date, and their present value is shown below:
2011 £m 2010 £m
Future minimum lease payments at 31 December 1,071 1,107 Future finance charges on finance leases (944) (972)
Present value of minimum lease payments 127 135
Future minimum lease payments are due as follows: Less than 1 year 7 7 1 to 5 years 26 28 Over 5 years 1,038 1,072
Total 1,071 1,107
The present values of these minimum lease payments are: Less than 1 year 6 7 1 to 5 years 23 24 Over 5 years 98 104
Total 127 135
Contingent rent is that portion of the lease payments that is not fixed in amount but is based on the future value of a factor that changes other than with the passage of time. There was no contingent rent recognised as income or expense in 2011 and 2010. The Group’s policy is to rent investment properties to tenants through operating leases. Minimum future rentals to be received on non-cancellable operating leases are receivable in the following periods:
2011 £m 2010 £m
Less than 1 year 430 601 1 to 5 years 1,407 2,121 Over 5 years 3,304 5,616
Total 5,141 8,338
The total minimum future rentals to be received on non-cancellable sub-leases for land and buildings at 31 December 2011 are £2,553 million (2010: £3,366million).
H8: Investments in associates and joint ventures
InvestmentsinassociatesThe Group had one associate at 31 December 2011 (31 December 2010: three) that was accounted for under the equity method, which is for a 25 per cent interest in PruHealth Holdings Limited. During 2011 the Group disposed of a 30 per cent interest in The Nam Khang, a Vietnamese property developer and a 30 per cent interest in Apollo Education and Training Organisation Vietnam. The Group also has investments in associates which meet the IAS 28 criteria for measurement at fair value through profit and loss in accordance with IAS 39.
H: Other information on statement of financial position items continued

335F
ina
ncia
l statem
en
ts
AssociatesaccountedforusingtheequitymethodA summary of the movements in investments in associates accounted for using the equity method in 2011 and 2010 is set out below:
Shareofcapital£m
Shareofreserves
£m
Shareofnetassets
£mGoodwill
£m
Totalcarrying
value£m
Balanceat31December2009 5 – 5 1 6 Transfer of PruHealth to associatesnoteI2 1 65 66 – 66 Acquisition/capital injection in PruHealth 9 – 9 – 9 Exchange translation and other movements (3) (1) (4) – (4)Share of loss for the year after tax – (6) (6) – (6)
Balanceat31December2010 12 58 70 1 71 Capital injection 4 – 4 – 4 Exchange translation and other movements (1) 1 – – – Disposals (1) – (1) – (1)Goodwill write-off – – – (1) (1)Share of loss for the year after tax – (3) (3) – (3)
Balanceat31December2011 14 56 70 – 70
There have been no changes recognised in the other comprehensive income of associates that would also be recognised in the other comprehensive income by the Group. The Group’s share of the assets, liabilities, revenues and profit and loss of associates accounted for using the equity method at 31 December 2011 and 2010 is as follows:
2011 £m 2010 £m
FinancialpositionTotal assets (excluding goodwill) 109 70 Total liabilities (39) –
Net assets 70 70
Resultsofoperations Revenue* 81 39 Loss in the year* (3) (6)
*The2010amountsincludetheGroup’sshareofPruHealth’srevenueandprofitandlossforthefivemonthsendedfrom1Augustto31December2010.PriortoAugust2010,PruHealthwasaccountedforasajointventure.
AssociatescarriedatfairvaluethroughprofitandlossIn addition to the above the Group has associates that are carried at fair value through profit and loss, as allowed under IAS 28, that comprise investments in OEICs, unit trusts, funds holding collateralised debt obligations, property unit trusts, and venture capital investments of the PAC with-profits funds where the Group has significant influence. These investments are incorporated both in the UK and overseas, and some have year ends which are non-coterminous with that of the Group. In these instances, the investments are recorded at fair value at 31 December 2011 based on valuations or pricing information at that specific date. The aggregate fair value of associates carried at fair value through profit and loss where there are published price quotations is approximately £4.8 billion (2010: £5 billion) at 31 December 2011. The aggregate assets of these associates are approximately £3.4 billion (2010: £6 billion). Aggregate liabilities, excluding liabilities to unit holders and shareholders for unit trusts and OEICs, are approximately £1.1 billion (2010: £1 billion). Fund revenues, with revenue arising in unit trusts and OEICs deemed to constitute the investment return for these vehicles, were approximately £0.3 billion (2010: £0.4 billion) and net profit in the year, excluding unit trusts and OEICs where all investment returns accrue to unit holders or shareholders respectively, was approximately £0.2 billion (2010: profit of £0.1 billion).
H:O
therin
form
ation
onstatem
ento
ffinan
cialpositio
nitem
s

336
Prudential plc Annual Report 2011
Financial statements | Notes on the Group financial statements
H8: Investments in associates and joint ventures continued
InvestmentsinjointventuresJoint ventures represent activities over which the Group exercises joint control through contractual agreement with one or more parties. The Group’s significant joint ventures, which are accounted for using proportionate consolidation, comprise the following interests:
Investment %held Principalactivity Country
CITIC Prudential Life Insurance Company Limited 50 Life assurance ChinaCITIC-Prudential Fund Management Company Limited 49 Asset management ChinaICICI Prudential Asset Management Company Limited 49 Asset management IndiaPrudential BSN Takaful Berhad 49 General and life insurance MalaysiaBOCI-Prudential Asset Management Limited 36 Asset management China (Hong Kong)ICICI Prudential Life Insurance Company Limited 26 Life assurance India
The investments noted in the table above have the same accounting year end as the Group, except for ICICI Prudential Life Insurance Company Limited and Prudential ICICI Asset Management Company Limited. Although these investments have reporting periods ending 31 March, 12 months of financial information up to 31 December is recorded. Accordingly, the information covers the same period as that of the Group. The summarised financial data for the Group’s share of investments in joint ventures is as follows:
2011 £m 2010 £m
FinancialpositionCurrent assets 706 327 Non-current assets 2,757 3,386
Total assets 3,463 3,713
Current liabilities (301) (329)Non-current liabilities (2,799) (3,093)
Total Liabilities (3,100) (3,422)
Net equity 363 291
2011 £m 2010 £m
ResultsofoperationsRevenue* 1,056 1,195 Expenses* (1,002) (1,135)
Net profit (loss) 54 60
*The2010amountsincludetheGroup’sshareofPruHealth’sresultsforthesevenmonthsended31July2010.On1August2010,theGroup’sinterestinPruHealthwasdilutedandtheGroup’sinvestmentwasreclassifiedasanassociate.
There are several minor service agreements in place between the joint ventures and the Group. During 2011, the aggregate amount of the transactions was £33 million (2010: £29.7 million) and the balance outstanding as at 31 December 2011 was £74.2 million (2010: £69.5 million). The joint ventures have no significant contingent liabilities or capital commitments to which the Group is exposed nor does the Group have any significant contingent liabilities or capital commitments in relation to its interest in the joint ventures. H9: Properties held for sale
Investment properties are classified as held for sale when contracts have been exchanged but the sale has not been completed at the period end. At 31 December 2011 the value of assets held for sale was £3 million (2010: £257 million). Gains on disposal of held for sale assets are recorded in ‘investment return’ within the income statement.
H: Other information on statement of financial position items continued

337F
ina
ncia
l statem
en
ts
H10: Cash and cash equivalents
Cash and cash equivalents consist of cash at bank and in hand, deposits held at call with banks, treasury bills and other short-term highly liquid investments with less than 90 days maturity from the date of acquisition. Cash and cash equivalents included in the cash flow statement comprise the following statement of financial position amounts:
2011 £m 2010 £m
Cash 6,338 6,167 Cash equivalents 919 464
Totalcashandcashequivalents 7,257 6,631
Cash and cash equivalents held centrally are considered to be available for general use by the Group. These funds amount to £309 million and £523 million at 31 December 2011 and 2010, respectively. The remaining funds are considered not to be available for general use by the Group, and include funds held for the benefit of policyholders. H11: Shareholders’ equity: share capital, share premium and reserves
2011 £m 2010 £m
SharecapitalandsharepremiumShare capital 127 127 Share premium 1,873 1,856 Reserves Retained earnings 5,839 4,982 Translation reserve 354 454 Available-for-sale reserve 924 612
Totalshareholders’equity 9,117 8,031
A summary of the ordinary shares in issue is set out below:
Sharecapitalandsharepremium
Numberofordinary
shares
Sharecapital
£m
Sharepremium
£m
Issued shares of 5p each fully paid: At1January2010 2,532,227,471 127 1,843 Shares issued under share option schemes 2,455,227 – 13 Shares issued in lieu of cash dividends 10,911,808 – 62 Reserve movements in respect of shares issued in lieu of cash dividends – – (62)
At31December2010 2,545,594,506 127 1,856 Shares issued under share option schemes 2,444,824 – 17
At31December2011 2,548,039,330 127 1,873
Amounts recorded in share capital represent the nominal value of the shares issued. The difference between the proceeds received on issue of shares, net of issue costs, and the nominal value of shares issued is credited to the share premium account. Shares issued in lieu of cash dividends in 2010 were considered to take the legal form of bonus issue shares and were accounted for as such. At 31 December 2011, there were options outstanding under SAYE schemes to subscribe for shares as follows:
Sharepricerange
Numberofsharestosubscribefor from to
Exercisablebyyear
31 December 2011 13,329,709 288p 572p 2017 31 December 2010 12,802,482 288p 572p 2016
H:O
therin
form
ation
onstatem
ento
ffinan
cialpositio
nitem
s

338
Prudential plc Annual Report 2011
Financial statements | Notes on the Group financial statements
H: Other information on statement of financial position items continued
H11: Shareholders’ equity: share capital, share premium and reserves continued
TransactionsbyPrudentialplcanditssubsidiariesinPrudentialplcsharesThe Group buys and sells Prudential plc (‘own shares’) either in relation to its employee share schemes or via transactions undertaken by authorised investment funds that the Group is deemed to control. Further information about these transactions is set out below. The cost of own shares of £109 million as at 31 December 2011 (2010: £75 million) is deducted from retained earnings. The Company has established trusts to facilitate the delivery of shares under employee incentive plans and savings-related share option schemes. At 31 December 2011, 8.1 million (2010: 4.5 million) Prudential plc shares with a market value of £52 million (2010: £30 million) were held in such trusts. Of this total, 8.0 million (2010: 4.4 million) shares were held in trusts under employee incentive plans. In 2011, the Company purchased the following number of shares in respect of employee incentive plans.
Numberofshares
purchased(inmillions)*
Cost£m
2011 8.2 54.7 2010 5.7 32.2
*Themaximumnumberofsharesheldin2011was8.1millionwhichwasattheendoftheperiod.
Of the total shares held in trust, 0.1 million (2010: 0.1 million) shares were held by a qualifying employee share ownership trust. These shares are expected to be fully distributed in the future on maturity of savings-related share option schemes. The shares purchased each month are as follows:
Shareprice
2011 Numberof
sharesLow
£High
£Cost
£
January 12,723 6.83 6.83 86,834 February 11,688 7.13 7.13 83,376 March 2,106,702 7.04 7.14 15,253,240 April 263,361 7.40 7.49 1,960,300 May 174,614 7.46 7.53 1,307,410 June 1,418,209 7.07 7.18 10,141,069 July 98,334 6.89 7.34 683,084 August 1,520,620 5.77 6.32 9,051,804 September 19,273 5.85 6.00 115,022 October 15,385 6.07 6.07 93,310 November 110,951 6.15 6.33 692,501 December 2,456,692 6.07 6.55 15,226,106
2011Total 8,208,552 54,694,056

339F
ina
ncia
l statem
en
ts
H: O
ther in
form
ation
on statem
ent o
f finan
cial positio
n item
s
The shares purchased each month are as follows:
SharePrice
2010 Numberof
sharesLow
£High
£Cost
£
January 9,338 6.38 6.38 59,530 February 11,638 5.68 5.68 66,046 March 3,908,274 5.16 6.09 20,884,460 April 11,129 5.63 5.63 62,601 May 14,638 5.59 5.59 81,753 June 190,991 5.26 5.66 1,075,712 July 13,457 5.14 5.14 69,102 August 10,016 5.86 5.86 58,644 September 13,727 5.25 5.84 78,539 October 11,634 6.37 6.37 74,108 November 385,321 5.74 6.49 2,244,770 December 1,153,611 6.04 6.65 7,445,358
2010Total 5,733,774 32,200,623
The Group has consolidated a number of authorised investment funds where it is deemed to control these funds under IFRS. Some of these funds hold shares in Prudential plc. The total number of shares held by these funds at 31 December 2011 was 8.6 million (2010: 9.8 million) and the cost of acquiring these shares of £52 million (2010: £47 million) is included in the cost of own shares. The market value of these shares as at 31 December 2011 was £54 million (2010: £65 million). During 2011, these funds made net disposals of 1,171,635 Prudential shares (2010: net disposals of 833,618) for a net increase of £4.8 million to book cost (2010: net decrease of £3 million). All share transactions were made on an exchange other than the Stock Exchange of Hong Kong. Other than set out above the Group did not purchase, sell or redeem any Prudential plc listed securities during 2011 or 2010.
ReservesThe translation reserve represents cumulative foreign exchange translation differences taken directly to equity in accordance with IFRS, net of related tax. In accordance with IFRS 1, cumulative translation differences are deemed to be zero at 1 January 2004, the date of transition to IFRS. The available-for-sale reserve represents gains or losses arising from changes in the fair value of available-for-sale securities of Jackson, net of the related change in amortisation of deferred income and acquisition costs and of the related tax.
H12: Insurance contract liabilities and unallocated surplus of with-profits funds
Movementinyear
Insurancecontractliabilities
£m
Unallocatedsurplusof
with-profitsfunds
£m
At 1 January 2010 145,713 10,019 Income and expense included in the income statement 22,412 245 Foreign exchange translation differences 3,193 (11)Dilution of Group's holdings (27) –
At1January2011 171,291 10,253 Income and expense included in the income statement 8,748 (1,025)Foreign exchange translation differences 324 (13)
At31December2011 180,363 9,215
Notes B5, D2c, D3c and D4c provide further analysis of the movement in the year of the Group’s policyholder liabilities and unallocated surplus of the with-profits funds.

340
Prudential plc Annual Report 2011
Financial statements | Notes on the Group financial statements
H: Other information on statement of financial position items continued
H13: Borrowings
Corestructuralborrowingsofshareholder-financedoperations
2011 £m 2010 £m
InnovativeTier1*
InnovativeTier2* Senior† Total Total
Centraloperations Subordinated debt: ¤500m 5.75% Subordinated Notes 2021note(i) – – 428 ¤20m Medium-Term Subordinated Notes 2023note(ii) 17 17 17 £435m 6.125% Subordinated Notes 2031 428 428 428 £400m 11.375% Subordinated Notes 2039 384 384 382 US$1,000m 6.5% Perpetual Subordinated Capital Securities 644 644 639 US$250m 6.75% Perpetual Subordinated Capital
Securitiesnote(iii) 161 161 160 US$300m 6.5% Perpetual Subordinated Capital
Securitiesnote(iii) 193 193 192 US$750m 11.75% Perpetual Subordinated Capital Securities 477 477 472 US$550m 7.75% Perpetual Subordinated Capital
Securitiesnote(iii) 348 348 –
1,823 829 – 2,652 2,718 Senior debt: £300m 6.875% Bonds 2023 300 300 300 £250m 5.875% Bonds 2029 249 249 249
– – 549 549 549
Totalcentraloperations 1,823 829 549 3,201 3,267 PruCap £250m bank loannote(iv) 250 250 250 Jackson US$250m 8.15% Surplus Notes 2027 note(v) 160 160 159
Totalnotes(vi),(vii) 1,823 989 799 3,611 3,676
*Thesedebtclassificationsareconsistentwiththetreatmentofcapitalforregulatorypurposes,asdefinedintheFSAhandbook.InJanuary2011,theCompanyissuedUS$550million7.75percentTier1subordinateddebt,primarilytoretailinvestors.Theproceeds,netofcosts,wereUS$539million(£340million)andhavebeenusedtofinancetherepaymentsofthe€500millionTier2subordinateddebtinDecember2011.
TheGrouphasdesignatedUS$2.85billion(2010:US$2.3billion)ofitsTier1subordinateddebtasanetinvestmenthedgeunderIAS39tohedgethecurrencyrisksrelatedtothenetinvestmentinJackson.
†Theseniordebtranksabovesubordinateddebtintheeventofliquidation.
Notes(i) The€500million5.75percentborrowingshadbeenswappedintoborrowingsof£333millionwithinterestpayableatsixmonth£LIBORplus
0.962percent.TheborrowingswererepaidinDecember2011.(ii) The€20millionborrowingswereissuedat20-yearEuroConstantMaturitySwap(cappedat6.5percent).Thesehavebeenswappedinto
borrowingsof£14millionwithinterestpayableatthreemonth£LIBORplus1.2percent.(iii) TheUS$250million6.75percentborrowings,theUS$300million6.5percentborrowingsandtheUS$550million7.75percentborrowingscan
beconverted,inwholeorinpart,attheCompany’soptionandsubjecttocertainconditions,onanyinterestpaymentdateintooneormoreseriesofPrudentialpreferenceshares.
(iv) The£250millionPruCapbankloanwasmadeinDecember2010intwotranches:£135millionmaturinginJune2014,currentlydrawnatacostoftwelvemonth£LIBORplus1.2percentand£115millionmaturingon20December2012,currentlydrawnatacostoftwelvemonth£LIBORplus0.99percent.
(v) TheJacksonborrowingsareunsecuredandsubordinatedtoallpresentandfutureindebtedness,policyclaimsandothercreditorclaimsofJackson.

341F
ina
ncia
l statem
en
ts
H: O
ther in
form
ation
on statem
ent o
f finan
cial positio
n item
s
(vi) Maturityanalysis ThefollowingtablesetsoutthecontractualmaturityanalysisoftheGroup’scorestructuralborrowings:
2011 £m 2010 £m
Less than 1 year 115 – 1 to 2 years – 115 2 to 3 years 135 – 3 to 4 years – 135 4 to 5 years – – Over 5 years 3,361 3,426
Total 3,611 3,676
(vii) Managementanalysesthenetcorestructuralborrowingspositionasfollows:
2011 £m 2010 £m
Total core structural borrowings (as above) 3,611 3,676 Less: Holding company cash and short-term investments
(recorded within the consolidated statement of financial position) (1,200) (1,232)
Net core structural borrowings of shareholder-financed operations 2,411 2,444
Operationalborrowingsattributabletoshareholder-financedoperations
2011 £m 2010 £m
Borrowingsinrespectofshort-termfixedincomesecuritiesprogrammes Commercial paper 2,706 2,311 Bank Notes 2013 250 249
2,956 2,560
Non-recourseborrowingsofUSoperations Investment subsidiariesnote(i) 20 20 Piedmont and CDO fundsnote(i),(ii) 1 60
21 80
Otherborrowings Bank loans and overdrafts 13 5 Obligations under finance leases 1 2 Other borrowingsnote(iii) 349 357
363 364
Total 3,340 3,004
Notes(i) Inallinstancestheholdersofthedebtinstrumentsissuedbythesesubsidiariesandfundsdonothaverecoursebeyondtheassetsofthose
subsidiariesandfunds.(ii) Piedmontisaninvestmenttrustinvestingincertainasset-backedandmortgage-backedsecuritiesintheUS.Theseborrowingspertaintodebt
instrumentsissuedtoexternalparties.(iii) Otherborrowingsincludemainlyamountswhoserepaymenttothelenderiscontingentuponfuturesurplusesemergingfromcertaincontracts
specifiedunderthearrangement.Ifinsufficientsurplusemergesonthecontracts,thereisnorecoursetootherassetsoftheGroupandtheliabilityisnotpayabletothedegreeofshortfall.Further,theGrouphaschosentodesignateasafairvaluehedgeunderIAS39certainfixedtofloatingrateswapswhichhedgethefairvalueexposurestointerestratemovementsoftheseborrowings.
Inaddition,otherborrowingsincludeseniordebtissuedthroughtheFederalHomeLoanBankofIndianapolisandwassecuredoncollateralpostedwithFHLBbyJackson.
(iv) Inadditiontothedebtlistedabove,£200millionFloatingRateNoteswereissuedbyPrudentialplcinOctober2011whichmatureinApril2012.TheseNoteshavebeenwhollysubscribedbyaGroupsubsidiaryandaccordinglyhavebeeneliminatedonconsolidationintheGroupfinancialstatements.ThesenoteswereoriginallyissuedinOctober2008andhavebeenreissuedupontheirmaturity.

342
Prudential plc Annual Report 2011
Financial statements | Notes on the Group financial statements
H: Other information on statement of financial position items continued
H13: Borrowings continued
(v) Maturityanalysis ThefollowingtablesetsoutthecontractualmaturityanalysisoftheGroup’soperationalborrowingsattributabletoshareholder-financed
operations:
2011 £m 2010 £m
Less than 1 year 3,169 2,496 1 to 2 years 140 98 2 to 3 years 10 401 3 to 4 years 10 – 4 to 5 years 11 – Over 5 years – 9
Total 3,340 3,004
Borrowingsattributabletowith-profitsoperations
2011 £m 2010 £m
Non-recourse borrowings of consolidated investment fundsnote(i) 747 1,287 £100m 8.5% undated subordinated guaranteed bonds of the Scottish Amicable Insurance Fundnote(ii) 100 100 Other borrowings (predominantly obligations under finance leases) 125 135
Totalnote(iii) 972 1,522
Notes(i) Inallinstancestheholdersofthedebtinstrumentsissuedbythesefundsdonothaverecoursebeyondtheassetsofthosefunds.(ii) TheinterestsoftheholdersofthebondsissuedbyScottishAmicableFinanceplc,asubsidiaryoftheScottishAmicableInsuranceFund,are
subordinatetotheentitlementsofthepolicyholdersofthatfund.(iii) Maturityanalysis ThefollowingtablesetsoutthecontractualmaturityanalysisoftheGroup’sborrowingsattributabletowith-profitsoperations:
2011 £m 2010 £m
Less than 1 year 297 96 1 to 2 years 75 635 2 to 3 years 30 99 3 to 4 years 110 74 4 to 5 years 31 1 Over 5 years 429 617
Total 972 1,522
H14: Provisions and contingencies
Provisions
2011 £m 2010 £m
Provision in respect of defined benefit pension schemes:I3 Deficit, gross of deferred tax, based on scheme assets held, including investments in Prudential insurance policies: Attributable to PAC with-profits fund (ie absorbed by the liability for unallocated surplus) 41 106 Attributable to shareholder-financed operations (ie to shareholders’ equity) 23 114
64 220 Add back: Investments in Prudential insurance policies 165 227
Provision after elimination of investments in Prudential insurance policies and matching policyholder liability from Group statement of financial position 229 447 Other provisions (see below) 300 282
Totalprovisions 529 729

343F
ina
ncia
l statem
en
ts
H: O
ther in
form
ation
on statem
ent o
f finan
cial positio
n item
s
Analysis of other provisions:
2011 £m 2010 £m
At 1 JanuaryI3 282 206 Charged to income statement: Additional provisions 144 182 Unused amounts released (29) (10)Used during the year (97) (106)Exchange differences – 10
At 31 December 300 282
Comprising: Legal provisions 14 20 Restructuring provisions 23 26 Other provisions 263 236
Total 300 282
Of the other provisions balance of £300 million (2010: £282 million), £159 million (2010 £141 million) is expected to be settled within one year. Employer contributions expected to be paid into defined benefit pension schemes within one year are shown in note I3.
LegalprovisionsThe movement in legal provisions is summarised in the table below:
Jackson* £m
Other £m
Total £m
At1January2010 11 4 15 Charged to income statement: Additional provisions 9 – 9 Used during the year (1) (3) (4)
Totalat31December2010 19 1 20 Charged to income statement: Used during the year (6) – (6)
Totalat31December2011 13 1 14
*Jacksonhasbeennamedincivilproceedings,whichappeartobesubstantiallysimilartootherclassactionlitigationbroughtagainstmanylifeinsurersintheUS,allegingmisconductinthesaleofinsuranceproducts.Theprovisionhasbeenestablishedtocoverpotentiallitigationandisexpectedtobeutilisedoverthenextfiveyears.

344
Prudential plc Annual Report 2011
Financial statements | Notes on the Group financial statements
H: Other information on statement of financial position items continued
H14: Provisions and contingencies continued
RestructuringprovisionsThese primarily relate to restructuring activities of UK insurance operations. The provisions pertain to property liabilities resulting from the closure of regional sales centres and branches, staff terminations and other transformation costs to enable streamlining of operations. The movement is summarised in the table below:
2011 £m 2010 £m
At1January 26 17 Charge to income statement: Additional provisions 5 14 Unused amounts released (5) (2)Used during the year (3) (3)
Totalat31December 23 26
Theprovisionbalanceisexpectedtobepaidoutwithinthenextfiveyears.
OtherprovisionsThe movement in other provisions is shown in the table below:
StaffBenefits* £m
Onerouscontracts
£m
Regulatoryandother
£mTotal £m
At1January2010 143 27 4 174 Charge to income statement: Additional provisions 148 10 4 162 Unused amounts released (6) – – (6)Used during the year (92) (8) – (100)Exchange differences 7 (1) – 6
Totalat31December2010 200 28 8 236 Charge to income statement: Additional provisions 120 19 – 139 Unused amounts released (15) (6) (3) (24)Used during the year (88) – – (88)
Totalat31December2011 217 41 5 263
*Benefitswillgenerallybepaidoutwithinthenextthreeyears.

345F
ina
ncia
l statem
en
ts
H: O
ther in
form
ation
on statem
ent o
f finan
cial positio
n item
s
ContingenciesandrelatedobligationsIn addition to the legal proceedings relating to Jackson mentioned under the legal provisions section above, the Group is involved in other litigation and regulatory issues. Whilst the outcome of such litigation and regulatory issues cannot be predicted with certainty, the Company believes that their ultimate outcome will not have a material adverse effect on the Group’s financial condition, results of operations, or cash flows.
Pensionmis-sellingreviewThe pensions review by the UK insurance regulator of past sales of personal pension policies required all UK life insurance companies to review their cases of potential mis-selling and record a provision for the estimated costs. The Group met the requirement of the FSA to issue offers to all cases by 30 June 2002. The table below summarises the change in the pension mis-selling provision for the years ended 31 December 2011 and 2010. The change in the provision is included in benefits and claims in the income statement and the movement in unallocated surplus of with-profits funds has been determined accordingly.
2011 £m 2010 £m
At 1 January 314 322 Changes to actuarial assumptions and method of calculation 97 37 Discount unwind 1 2 Redress to policyholders (49) (46)Payment of administrative costs (1) (1)
At 31 December* 362 314
*Thepensionmis-sellingprovisionisincludedwithintheliabilitiesinrespectofinvestmentcontractswithdiscretionaryparticipationfeaturesunderIFRS4.
The pension mis-selling provision at 31 December 2011 set out above of £362 million is stochastically determined on a discounted basis. The average discount rate implied in the movement in the year is 2.6 per cent. The undiscounted amounts at 31 December 2011 expected to be paid in each of the years ending 31 December are as follows:
2011 £m
Year ended 31 December 2012 60 2013 15 2014 13 2015 10 2016 13 Thereafter 370
Total undiscounted amount 481 Aggregate discount (119)
Discounted pension mis-selling provision at 31 December 2011 362
The directors believe that, based on current information, the provision, together with future investment return on the assets backing the provision, will be adequate to cover the costs of pension mis-selling including administration costs. Such provision represents the best estimate of probable costs and expenses. However, there can be no assurance that the current provision level will not need to be increased. The costs associated with the pension mis-selling review have been met from the inherited estate (see below). Accordingly, these costs have not been charged to the asset shares used in the determination of policyholder bonus rates. Hence policyholders’ payout values have been unaffected by pension mis-selling. In 1998, Prudential stated that deducting mis-selling costs from the inherited estate would not impact its bonus or investment policy and it gave an assurance that if this unlikely event were to occur, it would make available support to the fund from shareholder resources for as long as the situation continued, so as to ensure that policyholders were not disadvantaged. The assurance was designed to protect both existing policyholders at the date it was announced, and policyholders who subsequently purchased policies while the pension mis-selling review was continuing.

346
Prudential plc Annual Report 2011
Financial statements | Notes on the Group financial statements
H: Other information on statement of financial position items continued
H14: Provisions and contingencies continued
This review was completed on 30 June 2002. The assurance will continue to apply to any policy in force at 31 December 2003, both for premiums paid before 1 January 2004, and for subsequent regular premiums (including future fixed, RPI or salary related increases and Department of Work and Pensions rebate business). The assurance has not applied to new business since 1 January 2004. New business in this context consists of new policies, new members to existing pension schemes plus regular and single premium top-ups, transfers and switches to existing arrangements. The maximum amount of capital support available under the terms of the assurance will reduce over time. The bonus and investment policy for each type of with-profits policy is the same irrespective of whether or not the assurance applies and this is expected to continue for the foreseeable future. Hence removal of the assurance for new business has had no impact on policyholder returns.
MortgageendowmentproductsreviewIn common with several other UK insurance companies, the Group used to sell low-cost endowment products related to repayment of residential mortgages. At sale, the initial sum assured is set at a level such that the projected benefits, including an estimate of the annual bonus receivable over the life of the policy, will equal or exceed the mortgage debt. Because of a decrease in expected future investment returns since these products were sold, the FSA is concerned that the maturity value of some of these products will be less than the mortgage debt. The FSA has worked with insurance companies to devise a programme whereby the companies write to customers indicating whether they may have a possible shortfall and outline the actions that the customers can take to prevent this possibility. The Group is exposed to mortgage endowment products in respect of policies issued by Scottish Amicable Life plc (SAL) and the Scottish Amicable Life Assurance Society (SALAS) which were transferred into SAIF. At 31 December 2011, provisions of £2 million (2010: £2 million) in respect of the SAL policies and £15 million (2010: £20 million) in SAIF were held within policyholder liabilities to cover potential compensation in respect of mortgage endowment product mis-selling claims. As SAIF is a separate sub-fund of the Prudential Assurance long-term business fund, wholly attributable to the policyholders of the fund, this provision has no impact on shareholders. In addition, in the year ended 31 December 2010 Prudential Assurance’s main with-profits fund paid compensation of £1 million (2010: £2 million) in respect of mortgage endowment products mis-selling claims and at 31 December 2011 held a provision of £26 million (2010: £32 million) in respect of further compensation. The movement in this provision has no impact on the Group’s profit before tax. In May 2006, the Group introduced a deadline for both Prudential and Scottish Amicable mortgage endowment complaints. Impacted customers have three years to lodge a mis-selling complaint in line with the time limit prescribed by the FSA and the ABI.
GuaranteedannuitiesPrudential Assurance used to sell guaranteed annuity products in the UK and at 31 December 2011 held a provision of £90 million (2010: £24 million) within the main with-profits fund within policyholder liabilities to honour guarantees on these products. The Group’s main exposure to guaranteed annuities in the UK is through SAIF and at 31 December 2011 a provision of £370 million (2010: £336 million) was held in SAIF to honour the guarantees. As SAIF is a separate sub-fund of the Prudential Assurance long-term business fund, wholly attributable to the policyholders of the fund, the movement in this provision has no impact on shareholders.

347F
ina
ncia
l statem
en
ts
H: O
ther in
form
ation
on statem
ent o
f finan
cial positio
n item
s
OthermattersInherited estate of the PAC long-term fundThe assets of the with-profits sub-fund (WPSF) within the long-term insurance fund of The Prudential Assurance Company Limited (PAC) comprise the amounts that it expects to pay out to meet its obligations to existing policyholders and an additional amount used as working capital. The amount payable over time to policyholders from the WPSF is equal to the policyholders’ accumulated asset shares plus any additional payments that may be required by way of smoothing or to meet guarantees. The balance of the assets of the WPSF is called the ‘inherited estate’ and has accumulated over many years from various sources. The inherited estate, as working capital, enables PAC to support with-profits business by providing the benefits associated with smoothing and guarantees, by providing investment flexibility for the fund’s assets, by meeting the regulatory capital requirements that demonstrate solvency and by absorbing the costs of certain significant events or fundamental changes in its long-term business without affecting the bonus and investment policies. The size of the inherited estate fluctuates from year to year depending on the investment return and the extent to which it has been required to meet smoothing costs, guarantees and other events.
Support for long-term business funds by shareholders’ fundsAs a proprietary insurance company, PAC is liable to meet its obligations to policyholders even if the assets of the long-term funds are insufficient to do so. The assets, represented by the unallocated surplus of with-profits funds, in excess of amounts expected to be paid for future terminal bonuses and related shareholder transfers (‘the excess assets’) in the long-term funds could be materially depleted over time by, for example, a significant or sustained equity market downturn, costs of significant fundamental strategic change or a material increase in the pension mis-selling provision. In the unlikely circumstance that the depletion of the excess assets within the long-term fund was such that the Group’s ability to satisfy policyholders’ reasonable expectations was adversely affected, it might become necessary to restrict the annual distribution to shareholders or to contribute shareholders’ funds to the long-term funds to provide financial support. In 1997, the business of SALAS, a mutual society, was transferred to PAC. In effecting the transfer, a separate sub-fund, SAIF, was established within PAC’s long-term business fund. This sub-fund contains all the with-profits business and all other pension business that was transferred. No new business has been or will be written in the sub-fund and the sub-fund is managed to ensure that all the invested assets are distributed to SAIF policyholders over the lifetime of SAIF policies. With the exception of certain amounts in respect of the unitised with-profits life business, all future earnings arising in SAIF are retained for SAIF policyholders. Any excess (deficiency) of revenue over expense within SAIF during a period is attributable to the policyholders of the fund. Shareholders have no interest in the profits of SAIF but are entitled to the asset management fees paid on this business. With the exception of certain guaranteed annuity products mentioned earlier in this note, and certain products which include a minimum guaranteed rate of accumulation, the majority of SAIF with-profits policies do not guarantee minimum rates of return to policyholders. Should the assets of SAIF be inadequate to meet the guaranteed benefit obligations to the policyholders of SAIF, the PAC long-term fund would be liable to cover any such deficiency. Due to the quality and diversity of the assets in SAIF and the ability of SAIF to revise guaranteed benefits in the event of an asset shortfall, the directors believe that the probability of either the PAC long-term fund or the Group’s shareholders’ funds having to contribute to SAIF is remote.
Unclaimed property provisionJackson has received industry-wide regulatory enquiries with respect to claims settlement practices and compliance with unclaimed property laws. To date, only one state (New York) has requested a formal search for potential unreported claims. Any regulatory audits, related examination activity and internal reviews may result in additional payments to beneficiaries, escheatment of funds (ie reversion of funds to the state) deemed abandoned under state laws, administrative penalties and changes in Jackson’s procedures for the identification of unreported claims and handling of escheatable property. Based on its current analysis, at 31 December 2011, Jackson accrued £16 million for these unreported claims. Additionally, regulators and state legislators are considering proposals that would require life insurance companies to take additional steps to identify unreported deceased policy and contract holders. Currently, there does not appear to be a consensus among state insurance regulators and state unclaimed property administrators regarding a life insurer’s obligations in connection with identifying unreported deaths of its policy and contract holders.

348
Prudential plc Annual Report 2011
Financial statements | Notes on the Group financial statements
H: Other information on statement of financial position items continued
H14: Provisions and contingencies continued
Guarantees and commitmentsGuarantee funds in both the UK and the US provide for payments to be made to policyholders on behalf of insolvent life insurance companies. These guarantee funds are financed by payments assessed on solvent insurance companies based on location, volume and types of business. The Group estimated its reserve for future guarantee fund assessments for Jackson, included within other liabilities to be £17 million at 31 December 2011 (2010: £16 million). Similar assessments for the UK businesses were not significant. The directors believe that the reserve is adequate for all anticipated payments for known insolvencies. At 31 December 2011, Jackson has unfunded commitments of £341 million (2010: £363 million) related to its investments in limited partnerships and of £77 million (2010: £88 million) related to commercial mortgage loans. These commitments were entered into in the normal course of business and the directors do not expect a material adverse impact on the operations to arise from them. Jackson owns debt instruments issued by securitisation trusts managed by PPM America. At 31 December 2011, the support provided by certain forbearance agreements Jackson entered into with the counterparty to certain of these trusts could potentially expose Jackson to maximum losses of £71 million (2010: £332 million), if circumstances allowed the forbearance period to cease. Jackson believes that, so long as the forbearance period continues, the risk of loss under the agreements is remote. The Group has provided other guarantees and commitments to third-parties entered into in the normal course of business but the Company does not consider that the amounts involved are significant.
H15: Other liabilities
2011 £m 2010 £m
Creditors arising from direct insurance and reinsurance operations 970 821 Interest payable 67 66 Other items 212 242
Total 1,249 1,129

349F
ina
ncia
l statem
en
tsI: O
ther n
otes
I1: Acquisition of United Overseas Bank Life Assurance Limited in 2010
On 1 February 2010, the Group acquired from United Overseas Bank (UOB) its 100 per cent interest in UOB Life Assurance Limited in Singapore for total cash consideration, after post-completion adjustments of SGD67 million (£32 million), of SGD495 million (£220 million). As part of the transaction the Group also entered into a long-term strategic partnership to develop a major regional bancassurance business with UOB.
In addition to the amounts above, the Group incurred £2 million of acquisition-related costs (excluding integration costs). These have been excluded from the consideration transferred and were recognised as an expense during 2010, in the consolidated income statement.
Goodwill arising on acquisition
£m
Cash consideration 220 Less: fair value of identifiable net assets acquired (79)
Goodwill arising on acquisition 141
Goodwill arose on the acquisition of UOB Life Assurance Limited in Singapore because the acquisition included revenue and cost synergies. These synergies could not be recognised as assets separately from goodwill because they are not capable of being separated from the Group and sold, transferred, licensed, rented or exchanged, either individually or together with any related contracts, and did not arise from contractual or other legal rights.
None of the goodwill arising on this transaction is expected to be deductible for tax purposes.
Assets acquired and liabilities assumed at the date of acquisition
£m
Assets: Intangible assets attributable to shareholders: present value of acquired in-force business 12 Other non-investment and non-cash assets 16 Investments of long-term business and other operations 1,004 Cash and cash equivalents 89
Total assets 1,121
Liabilities: Policyholder liabilities 968 Other non-insurance liabilities 74
Total liabilities 1,042
Fair value of identifiable net assets acquired 79
Total assets include loans and receivables with a fair value of £15 million. This value represents the gross contractual amount and all amounts have been collected.
The consolidated statement of cash flows contains a £133 million net cash outflow in respect of this acquisition representing cash consideration of £220 million, acquisition related costs paid of £2 million less cash and cash equivalents acquired of £89 million.
Impact of acquisition on the results of the Group Included in the Group’s consolidated profit before tax for 2010 is £8 million attributable to UOB Life Assurance Limited in Singapore. Consolidated revenue, including investment returns, for 2010 includes £125 million in respect of UOB Life Assurance Limited in Singapore.
Had the acquisition been effected at 1 January 2010, the revenue and profit of the Group from continuing operations for the year ended 31 December 2010 would not have been materially different.
I: Other notes

350
Prudential plc Annual Report 2011
I: Other notes continued
Financial statements | Notes on the Group financial statements
I2: Changes to Group’s holdings
2010On 1 August 2010, Discovery Holdings of South Africa, the Group’s joint venture partner in its investment in PruHealth, completed the acquisition of the entire share capital of Standard Life Healthcare, a wholly-owned subsidiary of the Standard Life Group, for £138 million. Discovery funded the purchase of the Standard Life Healthcare transaction, and contributed Standard Life Healthcare to PruHealth as a capital investment on completion. As a result of the transaction, Discovery increased their shareholding in PruHealth from the previous level of 50 per cent to 75 per cent, and Prudential’s shareholding was reduced from 50 per cent of the previous joint venture structure to 25 per cent of the new structure with the much enlarged business.
As a result of this dilution in holding and the consequential loss of control, PruHealth was reclassified from a joint venture to an associate, and the entity was no longer proportionally consolidated from the date of the transaction. In accordance with IAS 31 ‘Interests in joint ventures’, a gain of £30 million arose in 2010 upon the dilution, representing the difference between the fair value of the enlarged 25 per cent investment still held and the book value of the original 50 per cent investment holding.
I3: Staff and pension plans
a Staff and employment costsThe average number of staff employed by the Group during the year was:
2011 2010
Business operations: Asian operations 17,001 17,988 US operations 3,785 3,545 UK operations 4,628 4,459
Total 25,414 25,992
The costs of employment were:
2011 £m 2010 £m
Business operations: Wages and salaries 1,101 1,052 Social security costs 75 69 Other pension costs Defined benefit schemes* Defined benefit schemes – PSPS† 22 27 Defined benefit schemes – Other schemes* (34) 31 Defined contribution schemes Defined contribution schemes – Domestic 12 11 Defined contribution schemes – Overseas 29 26 Pension actuarial and other (gains) losses charged to income statement* (37) 26
(8) 121
Total 1,168 1,242
*Thederivationoftheseamountsisshowninnote(b)(i)7.†ConsistentwiththederecognitionoftheCompany’sinterestintheunderlyingIAS19surplusofPSPSasdescribedinnote(b)(i)1below,theotherpensioncostsforPSPSrepresentsthecashcostofcontributionsforongoingserviceofactivemembersandtheunwindofdiscountontheopeningprovisionfordeficitfundingforPSPS.
b Pension plans i Defined benefit plans 1 Summary
The Group business operations operate a number of pension schemes. The specific features of these plans vary in accordance with the regulations of the country in which the employees are located, although they are, in general, funded by the Group and based either on a cash balance formula or on years of service and salary earned in the last year or years of employment. The largest defined benefit scheme is the principal UK scheme, namely the PSPS; 86 per cent (2010: 86 per cent) of the underlying scheme liabilities of the Group defined benefit schemes are accounted for within PSPS.

351F
ina
ncia
l statem
en
tsI: O
ther n
otes
The Group also operates two smaller defined benefit schemes for UK employees in respect of Scottish Amicable and M&G. For all three schemes the projected unit method was used for the most recent full actuarial valuations. There is also a small defined benefit scheme in Taiwan, but as part of the sale of the Taiwan agency business completed in June 2009, the Group settled the majority of the obligations under the scheme as a significant number of employees transferred out. Defined benefit schemes in the UK are generally required to be subject to full actuarial valuation every three years in order to assess the appropriate level of funding for schemes in relation to their commitments. These valuations include assessments of the likely rate of return on the assets held within the separate trustee administered funds. The last completed actuarial valuation of PSPS was as at 5 April 2008 by C G Singer, Fellow of the Institute of Actuaries, of Towers Watson Limited (previously Watson Wyatt Limited). This valuation demonstrated the scheme to be 106 per cent funded by reference to the Scheme Solvency Target that forms the basis of the scheme’s statutory funding objective. No formal deficit plan was required. However, in recognition of the fall in value of the Scheme’s investments between 5 April 2008 and the completion of the actuarial valuation in 2009, an additional funding akin to deficit funding was agreed by the Trustees. The total contributions being currently made by the Group into the scheme, representing the annual accrual cost and additional funding, are £50 million per annum. Deficit funding for PSPS is apportioned in the ratio of 70/30 between the PAC with-profits fund and shareholder-backed operations following detailed consideration in 2005 of the sourcing of previous contributions. Employer contributions for ongoing service of current employees are apportioned in the ratio relevant to current activity. The current contributions will continue to be made until the next valuation as at 5 April 2011 is finalised later in 2012. In 2011, total contributions paid in the year including expenses and augmentations were £54 million (2010: £55 million). The market value of PSPS scheme assets as at the 5 April 2008 valuation was £4,759 million. The actuarial assumptions used in determining benefit obligations and the net periodic benefit costs for the purposes of the 2008 valuation were as follows:
Rate of increase in salaries NilRate of inflation 3.5%Rate of increase of pensions in payment for inflation: Guaranteed (maximum 5%) 3.5% Guaranteed (maximum 2.5%) 2.5% Discretionary NilExpected returns on plan assets 4.55%
Mortality assumptionsThe tables used for PSPS pensions in payment at 5 April 2008 were:
Base post retirement mortalityFor current male (female) pensioners 108.6 per cent (103.4 per cent) of the mortality rates of the 2000 series mortality tables, published by the Continuous Mortality Investigation Bureau. For male (female) non-pensioners 113.4 per cent (97.4 per cent) of the 2000 series rates.
Allowance for future improvements to post retirement mortalityFor males (females) 100 per cent (75 per cent) of Medium Cohort subject to a minimum rate of improvement of 1.75 per cent (1 per cent) up to the age of 90, decreasing linearly to zero by age of 120. The last completed actuarial valuation of the Scottish Amicable Pension Scheme as at 31 March 2008 by Jonathan Seed, Fellow of the Faculty of Actuaries, of Xafinity Consulting, demonstrated the scheme to be 91 per cent funded. Based on this valuation, deficit funding amounts designed to eliminate the actuarial deficit over a seven year period were made from July 2009 of £7.3 million per annum. During 2010, the Group agreed to pay additional funding of £5.8 million per annum from October 2010 until the conclusion of the next formal valuation, or until the funding level reaches 90 per cent, whichever is the earlier. The actuarial valuation as at 31 March 2011 will be finalised later in 2012. The IAS 19 deficit of the Scottish Amicable Pension Scheme at 31 December 2011 of £55 million (2010: £146 million) has been allocated approximately 50 per cent to the PAC with-profits fund and 50 per cent to the shareholders’ fund. The last completed actuarial valuation of the M&G pension scheme as at 31 December 2008 by Paul Belok, Fellow of the Institute of Actuaries, of AON Hewitt Limited (previously AON Consulting Limited), was finalised in January 2010, and demonstrated the scheme to be 76 per cent funded. Based on this valuation, deficit funding amounts designed to eliminate the actuarial deficit over a five year period have been made from January 2010 of £14.1 million per annum for the first two years and £9.3 million per annum for the subsequent three years. During 2011, the Group agreed to pay an additional funding of £1.2 million per annum from January 2012, until the conclusion of the next formal valuation as at 31 December 2011, which is currently in progress. The IAS 19 surplus of the M&G pension scheme on an economic basis at 31 December 2011 was £10 million (2010: deficit of £27 million). As described above, as at 31 December 2011, the M&G pension scheme has invested £165 million in Prudential policies (2010: £227 million). After excluding these investments that are offset against liabilities to policyholders, the IAS 19 basis position of the scheme is a deficit of £155 million (2010: £254 million).

352
Prudential plc Annual Report 2011
I: Other notes continued
Financial statements | Notes on the Group financial statements
I3: Staff and pension plans continued
Under the IAS 19 valuation basis, the Group applies IFRIC 14, ‘IAS 19 – The Limit on a Defined Benefit Asset, Minimum Funding Requirements and their Interaction’ Under IFRIC 14, for PSPS, where the Group does not have unconditional right of refund to any surplus in the scheme, the surplus is not recognised. Additionally, the Group has to recognise a liability for committed deficit funding obligation to PSPS. Accordingly, at 31 December 2011, the Group has not recognised the underlying PSPS surplus of £1,588 million gross of deferred tax (2010: £485 million) and has recognised a liability for deficit funding to 30 June 2012 for PSPS of £19 million, gross of deferred tax (2010: £47 million). The asset and liabilities of PSPS are unaffected by the impact of the application of IFRIC 14. PSPS is managed on an economic basis for the longer-term benefit of its current and deferred pensioners and active members. The surplus in PSPS is available to absorb future adverse asset value movements and, if required, strengthening in mortality assumptions. As at 31 December 2011, after the effect of the application of IFRIC 14, the shareholders’ share of the pension liability for PSPS deficit funding obligation and the deficits of the defined benefit pension schemes amounted to a £17 million liability net of related tax relief (2010: £83 million). These amounts are determined after including amounts invested by the M&G scheme in Prudential policies as explained later in this note. On the economic basis (including investments of the M&G scheme in Prudential policies as assets), for 2011, a £18 million pre-tax shareholder credit (2010: £27 million charge) to operating results based on longer-term returns arises. The £18 million credit in 2011 included a £42 million credit for the RPI to CPI inflation measure change as described later. In addition, outside the operating result but included in total profits is a pre-tax shareholder gain of £21 million (2010: £10 million loss) for shareholders’ share of actuarial and other gains and losses. In addition, also on the economic basis, the PAC with-profits sub-fund was credited £9 million (2010: charge of £18 million) for its share of the pension credit/charge of PSPS and Scottish Amicable, and credited with £15 million (2010: charge of £5 million) for its share of net actuarial and other losses on the scheme assets and liabilities. The £9 million credit in 2011 included a £24 million credit for the PAC with-profit funds share of accounting benefit from the RPI to CPI inflation-measure charge as described later. As shareholder profits for the PAC with-profits sub-fund reflects the surplus for distribution, these amounts are effectively absorbed by an increased credit in the income statement for the transfer to the liability for unallocated surplus. At 31 December 2011, after the effect of the application of IFRIC 14, the total share of the liability for deficit funding on PSPS and the deficit on the smaller Scottish Amicable Scheme attributable to the PAC with-profits fund amounted to a liability of £38 million (2010: £99 million) net of related tax relief.
2 CorporategovernanceThe rules of the Group’s largest pension arrangement, the defined benefit section of PSPS, a final salary scheme, specify that, in exercising its investment powers, the Trustee’s objective is to achieve the best overall investment return consistent with the security of the assets of the scheme. In doing this, consideration is given to the nature and duration of the scheme’s liabilities. The Trustee sets the benchmark for the asset mix, following analysis of the liabilities by the Scheme’s Actuary and, having taken advice from the Investment Managers, then selects benchmark indices for each asset type in order to measure investment performance against a benchmark return. The Trustee reviews strategy, the asset mix benchmark and the Investment Managers’ objectives every three years, to coincide with the Actuarial Valuation, or earlier if the Scheme Actuary recommends. Interim reviews are conducted annually based on changing economic circumstances and financial market levels. The Trustee sets the general investment policy and specifies any restrictions on types of investment and the degrees of divergence permitted from the benchmark, but delegates the responsibility for selection and realisation of specific investments to the Investment Managers. In carrying out this responsibility, the Investment Managers are required by the Pensions Act 1995 to have regard to the need for diversification and suitability of investments. Subject to a number of restrictions contained within the relevant asset management agreements, the Investment Managers are authorised to invest in any class of investment asset. However, the Investment Managers will not invest in any new class of investment asset without prior consultation with the Trustee. The Trustee consults the Principal Employer, the Prudential Assurance Company, on these investment principles, but the ultimate responsibility for the investment of the assets of the scheme lies with the Trustee. The investment policies and strategies for the other two UK defined benefit schemes, the M&G Group Pension Scheme and the Scottish Amicable Staff Pension Scheme, which are both final salary schemes, follow similar principles, but have different target allocations reflecting the particular requirements of the schemes.

353F
ina
ncia
l statem
en
tsI: O
ther n
otes
3 AssumptionsThe actuarial assumptions used in determining benefit obligations and the net periodic benefit costs for the years ended 31 December were as follows:
2011 % 2010 %
Discount rate* 4.7 5.45 Rate of increase in salaries 2.9 5.55 Rate of inflation:† Retail price index (RPI) 2.9 3.55 Consumer price index (CPI) 1.9 n/aRate of increase of pensions in payment for inflation: Guaranteed (maximum 5%)‡ 2.5 3.55 Guaranteed (maximum 2.5%)‡ 2.5 2.5 Discretionary‡ 2.5 2.5 Expected returns on plan assets 5.1 5.9
*Thediscountratehasbeendeterminedbyreferencetoan‘AA’corporatebondindexadjusted,whereapplicable,toallowforthedifferenceindurationbetweentheindexandthepensionliabilities.
†Therateofinflationfortheyearended31December2011reflectsthelong-termassumptionfortheUKRPIorCPI,dependingonthetrancheoftheschemes.Forpriorperiodsitreflectsthelong-termassumptionfortheUKRPI.Seeexplanationbelow.
‡Theratesof2.5percentarethoseforPSPS.Assumedratesofincreaseofpensionsinpaymentsforinflationforallotherschemesare2.9percentin2011(2010:3.55percent).
The calculations are based on current actuarially calculated mortality estimates with a specific allowance made for future improvements in mortality. The specific allowance for 2011 and 2010 is in line with a custom calibration of the 2009 mortality model from the CMI bureau of the Institute and Faculty of Actuaries.
The tables used for PSPS immediate annuities in payment at 31 December 2011 and 2010 were:
Male: 108.6 per cent PNMA00 with improvements in line with a custom calibration of the CMI’s 2009 mortality model, with a long-term mortality improvement rate of 1.75 per cent per annum; andFemale: 103.4 per cent PNFA00 with improvements in line with a custom calibration of the CMI’s 2009 mortality model, with a long-term mortality improvement rate of 1.00 per cent per annum.
The assumed life expectancies on retirement at age 60, based on the mortality table used were:
2011 years 2010 years
Male Female Male Female
Retiring today 27.8 29.0 27.7 29.0 Retiring in 20 years’ time 30.5 31.1 30.3 31.1
The mean term of the current PSPS liabilities is around 17 years. Using external actuarial advice provided by the scheme actuaries, being Towers Watson for the valuation of PSPS, Xafinity Consulting for the Scottish Amicable scheme and Aon Hewitt Limited for the M&G scheme, the most recent full valuations have been updated to 31 December 2011, applying the principles prescribed by IAS 19. In July 2010, the UK government announced plans to use the CPI in place of the RPI in its determination of the statutory minimum pension increases for private sector occupational pension schemes. In December 2010, the government published the statutory revaluation order for 2011 which confirms the change to use CPI. Further, in December 2010, the government consulted on the impact of the switch from RPI to CPI on the private sector occupational pension schemes. In its response following the consultation published in June 2011, the government confirmed that it would not introduce legislation to override scheme rules that provide for pension increases/revaluation on a basis that is higher than the statutory minimum. For the Group’s UK defined benefit schemes, the pensions in deferment and/or pensions in payment for certain tranches of these schemes are subject to statutory increases in accordance with the schemes’ rules and were therefore affected by the government’s decision to change the indexation from RPI to CPI. Other tranches, where RPI is specified in the scheme rules, were unaffected. During 2011, the pension schemes communicated to their members the changes in basis from RPI to CPI in light of the government announcement. The impact of this change in 2011 was an accounting benefit of £42 million to the Group’s operating profit based on longer-term investment returns and profit attributable to shareholders before tax and £31 million to shareholders’ equity. There was no impact on the results for the year ended 31 December 2010.

354
Prudential plc Annual Report 2011
I: Other notes continued
Financial statements | Notes on the Group financial statements
I3: Staff and pension plans continued
4 SummaryfinancialpositionThe Group liability in respect of defined benefit pension schemes is as follows:
2011 £m 2010 £m
Economic position: Deficit, gross of deferred tax, based on scheme assets held, including investments in
Prudential insurance policies: Attributable to the PAC with-profits fund (ie absorbed by the liability for unallocated surplus) (41) (106) Attributable to shareholder-backed operations (ie shareholders’ equity) (23) (114)
Economic deficit (64) (220)Exclude: investments in Prudential insurance liabilities (offset on consolidation in the Group financial
statements against insurance liabilities) (165) (227)
Deficit under IAS 19 included in Provisions in the statement of financial position – as explained in note 7 below (229) (447)
The following disclosures explain the economic position and IAS 19 basis of accounting after eliminating investment in Prudential insurance policies on consolidation. 5 GroupeconomicfinancialpositionThe following tables illustrate the movement on the financial position of the Group’s defined benefit pension schemes on an economic basis. The underlying position on an economic basis reflects the assets (including investments in Prudential policies that are offset against liabilities to policyholders on the Group consolidation) and the liabilities of the schemes. At 31 December 2011, the investments in Prudential policies comprise £112 million (2010: £118 million) for PSPS and £165 million (2010: £227 million) for the M&G scheme. Separately, the economic financial position also includes the effect of the application of IFRIC 14, ‘IAS 19 – The Limit on a Defined Benefit Asset, Minimum Funding Requirements and their Interaction’. For PSPS, where there are constraints in the trust deed to prevent the company access, the surplus is not recognised and a liability to additional funding is established (as previously described).

355F
ina
ncia
l statem
en
tsI: O
ther n
otes
Estimated pension scheme deficit – economic basisMovements on the pension scheme deficit (determined on the economic basis) are as follows, with the effect of the application of IFRIC 14 being shown separately:
2011 £m
Surplus
(deficit) in scheme at
1 January 2011
(Charge) credit to income statement
Operating results
(based on longer-term investment
returns) note(a)
Actuarial and
other gains and losses
note(b)
Contributions paid
Surplus (deficit) in scheme at
31 Dec 2011 note(c)
All schemes Underlying position (without the effect of IFRIC 14) Surplus 312 256 882 93 1,543 Less: amount attributable to PAC with-profits fund (264) (171) (607) (41) (1,083)
Shareholders’ share: Gross of tax surplus 48 85 275 52 460 Related tax (13) (22) (68) (14) (117)
Net of shareholders’ tax 35 63 207 38 343
Effect of IFRIC 14 Derecognition of surplus and set-up of additional funding
obligation (532) (229) (846) – (1,607) Less: amount attributable to PAC with-profits fund 370 162 592 – 1,124
Shareholders’ share: Gross of tax (deficit) (162) (67) (254) – (483) Related tax 44 16 63 – 123
Net of shareholders’ tax (118) (51) (191) – (360)
With the effect of IFRIC 14 (Deficit) surplus (220) 27 36 93 (64) Less: amount attributable to PAC with-profits fund 106 (9) (15) (41) 41
Shareholders’ share: Gross of tax (deficit) surplus (114) 18 21 52 (23) Related tax 31 (6) (5) (14) 6
Net of shareholders’ tax (83) 12 16 38 (17)

356
Prudential plc Annual Report 2011
I: Other notes continued
Financial statements | Notes on the Group financial statements
I3: Staff and pension plans continued
2010 £m
Surplus
(deficit) in scheme at
1 January 2010
(Charge) credit to income statement
Operating results
(based on longer-term investment
returns) note(a)
Actuarial and
other gains and losses
note(b)
Contributions paid
Surplus (deficit) inscheme at
31 Dec 2010note(c)
All schemes Underlying position (without the effect of IFRIC 14) Surplus (deficit) 338 (7) (109) 90 312 Less: amount attributable to PAC with-profits fund (285) (11) 71 (39) (264)
Shareholders’ share: Gross of tax surplus (deficit) 53 (18) (38) 51 48 Related tax (15) 5 11 (14) (13)
Net of shareholders’ tax 38 (13) (27) 37 35
Effect of IFRIC 14 Derecognition of surplus and set-up of additional funding
obligation (588) (38) 94 – (532) Less: amount attributable to PAC with-profits fund 407 29 (66) – 370
Shareholders’ share: Gross of tax surplus (deficit) (181) (9) 28 – (162) Related tax 51 2 (9) – 44
Net of shareholders’ tax (130) (7) 19 – (118)
With the effect of IFRIC 14 Surplus (deficit) (250) (45) (15) 90 (220) Less: amount attributable to PAC with-profits fund 122 18 5 (39) 106
Shareholders’ share: Gross of tax surplus (deficit) (128) (27) (10) 51 (114) Related tax 36 7 2 (14) 31
Net of shareholders’ tax (92) (20) (8) 37 (83)
Notes(a) Thecomponentsofthecredit(charge)tooperatingresults(comprisingamountsattributabletothePACwith-profitsfundand
shareholder-backedoperations)areasfollows:
2011 £m 2010 £m
Current service cost (35) (38)Negative past service cost – RPI to CPI inflation measure changenote(i) 282 – Finance (expense) income: Interest on pension scheme liabilities (299) (294) Expected return on assets 308 325
Total credit (charge) without the effect of IFRIC 14 256 (7)Effect of IFRIC 14 for pension schemes (229) (38)
Total credit (charge) after the effect of IFRIC 14 as shown above, reflected in the Group’s operating profit based on longer-term investment returnsnote(ii) 27 (45)
Notes (i) RPItoCPIinflationmeasurechange The£282millioncreditshownabovecomprises£216millionforPSPSand£66millionforotherschemes.Asnotedearlier,thePSPS
schemesurplusisnotrecognisedforaccountingpurposesduetotheapplicationofIFRIC14.The£66millionforotherschemes(asshowninthetablebelow)isallocatedas£24milliontoPACwith-profitsfundand£42milliontoshareholdersreferredtoinnoteB1.

357F
ina
ncia
l statem
en
tsI: O
ther n
otes
(ii) Thenetcredit(charge)tooperatingprofit(comprisingamountsattributabletothePACwith-profitsfundandshareholder-backedoperations)of£27million(2010:(£45million))ismadeupofthefollowing:
2011 £m 2010 £m
Underlying IAS 19 charge for other pension schemes (17) (18)Cash costs for PSPS (20) (23)Unwind of discount on opening provision for deficit funding for PSPS (2) (4)Negative past service cost – RPI to CPI inflation measure change (note (i) to table above) 66 –
27 (45)
ConsistentwiththederecognitionoftheCompany’sinterestintheunderlyingIAS19surplusofPSPS,thechargetooperatingprofitbasedonlonger-terminvestmentreturnsforPSPSreflectsthecashcostofcontributionsforongoingserviceofactivemembers.Inaddition,thechargetotheoperatingresultsalsoincludesachargefortheunwindofdiscountontheopeningprovisionfordeficitfundingforPSPS.
(b) Thecomponentsofthecredit(charge)foractuarialandothergainsandlosses(comprisingamountsattributabletothePACwith-profitsfundandshareholder-backedoperations)areasfollows:
2011 £m 2010 £m
Actual less expected return on assets 982 306 Losses on changes of assumptions for plan liabilities (414) (411)Experience gains (losses) on liabilities 314 (4)
Total credit (charge) without the effect of IFRIC 14 882 (109)Effect of IFRIC 14 for pension schemes (846) 94
Actuarial and other gains and losses after the effect of IFRIC 14 36 (15)
Thenetchargeforactuarialandothergainsandlossesisrecordedwithintheincomestatementbut,withinthesegmentalanalysisofprofit,theshareholders’shareofactuarialandothergainsandlosses(ienetofallocationofthesharetothePACwith-profitsfunds)isexcludedfromoperatingprofitbasedonlonger-terminvestmentreturns.
The2011actuarialgainsof£882million(grossofallocationofsharetothePACwith-profitsfundsandbeforetheapplicationofIFRIC14)primarilyreflectstheeffectoftheexcessofmarketreturnsoverlong-termassumptionsandexperiencegainsonliabilitieswhicharepartiallyoffsetbytheeffectofchangesineconomicassumptions.
ConsistentwiththederecognitionoftheCompany’sinterestintheunderlyingIAS19surplusofPSPS,theactuarialgainsandlossesdonotincludethoseofPSPS.Inaddition,asaresultofapplyingIFRIC14,theGrouphasrecognisedaprovisionfordeficitfundinginrespectofPSPS.Thechangein2011inrelationtothisprovisionwas£(4)million(2010:£nil),andisrecognisedasothergainsandlosseswithinthe£36millionofactuarialandothergainsandlossesshownabove.
(c) Onthe‘economicbasis’,afterincludingtheunderlyingassetsrepresentedbytheinvestmentsinPrudentialinsurancepoliciesasschemeassets,theunderlyingstatementsoffinancialpositionoftheschemesat31Decemberwere:
2011 2010
PSPS
£m
Otherschemesnote(iii)
£m
Total
£m %
PSPS
£m
Otherschemesnote(iii)
£m
Total
£m %
Equities 210 273 483 7 548 277 825 14 Bonds 5,547 407 5,954 83 3,864 339 4,203 70 Properties 297 20 317 4 199 29 228 4 Cash-like investmentsnote(i) 378 31 409 6 740 8 748 12
Total value of assets 6,432 731 7,163 100 5,351 653 6,004 100 Present value of benefit obligations (4,844) (776) (5,620)
(4,866) (826) (5,692)
1,588 (45) 1,543 485 (173) 312 Effect of the application of IFRIC 14 for pension
schemes: Derecognition of PSPS surplus (1,588) – (1,588) (485) – (485) Adjust for additional funding for PSPS (19) – (19)
(47) – (47)
Pre-tax deficitnote(ii) (19) (45) (64) (47) (173) (220)
Notes (i) ThePSPShasenteredintoaderivatives-basedstrategytomatchthedurationandinflationprofileofitsliabilities.Thisinvolveda
reallocationfromotherinvestmentstocash-likeinvestmentswithaninterestandinflationswapoverlay.Inbroadterms,theschemeiscommittedtomakingaseriesofpaymentsrelatedtoLIBORonanominalamountandinreturntheschemereceivesaseriesoffixedandinflation-linkedpaymentsthatmatchaproportionofitsliabilities.Asat31December2011,thenominalvalueoftheinterestandinflation-linkedswapsamountedto£0.9billion(2010:£1.1billion)and£2.0billion(2010:£1.8billion)respectively.

358
Prudential plc Annual Report 2011
I: Other notes continued
Financial statements | Notes on the Group financial statements
I3: Staff and pension plans continued
(ii) Theresultingschemedeficitsarisingfromtheexcessofliabilitiesoverassetsat31December2011,afterapplicationofIFRIC14of£64million(2010:£220million),comprisedadeficitof£41million(2010:£106million)attributabletothePACwith-profitsfundanddeficitof£23million(2010:£114million)attributabletoshareholderoperations.
(iii) InadditiontoPSPS,therearetwosmallerschemesintheUK,theScottishAmicablePensionSchemeandtheM&GPensionScheme,withacombineddeficitat31December2011of£45million(2010:£173million),grossoftax.ThereisalsoasmallschemeinTaiwan,withanegligibleamountofdeficitat31December2011and2010.
Themovementsinthedeficitonthe‘economicbasis’betweenschemeassetsandliabilitieswere:
2011 £m 2010 £m
Current service cost (13) (13)Negative past service cost (RPI to CPI inflation measure change) 66 – Other finance income (4) (5)Cash costs and unwind of discount on opening provision for deficit funding for PSPS (22) (27)Contributions 93 90 Actuarial and other gains and losses 36 (15)
Net decrease in deficit 156 30
6 MovementinIAS19basisfinancialpositionThe change in the present value of the benefit obligation and the change in fair value of the assets for the total of the PSPS, Scottish Amicable, M&G and Taiwan schemes, and the provision for deficit funding of PSPS over the period, were as follows:
2011 £m
PSPS Other schemes Total
Provisionfor deficit
funding
IAS 19 basis:change in
fair value
of planassets
Investmentsin Prudential
insurancepolicies
Economic basis:
totalassets
IAS 19 basis: change in
present value
of benefitobligations
Economicbasis:
netobligations
Fair value of plan assets, beginning of year 426 227 653 653 Present value of benefit obligation,
beginning of year (826) (826)Provision for deficit funding for PSPS (47) (47)
(47) 426 227 653 (826) (220)Service cost – current charge only (13) (13)Negative past service cost – RPI to CPI inflation
measure change 66 66 Interest cost (45) (45)Expected return on plan assets 26 15 41 41Employee contributions – 1 1 (1) –Employer contributions 54 19 20 39 93 Actuarial gains (losses) 13 (1) 12 28 40 Benefit payments (10) (5) (15) 15 – Movement in the provision for deficit funding
for PSPS (4) (4)Transfer out of investment in Prudential
insurance policies 92 (92) – – Cash costs and unwind of discount on the
opening provision for deficit funding for PSPS (22) (22)
Fair value of plan assets, end of year 566 165 731 731 Present value of benefit obligation, end of year (776) (776)Provision for deficit funding of PSPS (19) (19)
Economic basis deficit (64)

359F
ina
ncia
l statem
en
tsI: O
ther n
otes
2010 £m
PSPS Other schemes Total
Provisionfor deficit
funding
IAS 19 basis:change in
fair value
of planassets
Investmentsin Prudential
insurancepolicies
Economic basis:
totalassets
IAS 19 basis: change in
present value
of benefitobligations
Economicbasis:
netobligations
Fair value of plan assets, beginning of year 376 187 563 563 Present value of benefit obligation,
beginning of year
(738) (738)Provision for deficit funding for PSPS (75) (75)
(75) 376 187 563 (738) (250)Service cost – current charge only (13) (13)Interest cost (43) (43)Expected return on plan assets 25 13 38 38 Employee contributions 1 1 (1) – Employer contributions 55 15 20 35 90 Actuarial gains (losses) 20 11 31 (46) (15)Benefit payments (10) (5) (15) 15 –Cash costs and unwind of discount on the
opening provision for deficit funding for PSPS (27) (27)
Fair value of plan assets, end of year 426 227 653 653 Present value of benefit obligation, end of year (826) (826)Provision for deficit funding of PSPS (47) (47)
Economic basis deficit (220)
7 IAS19basisfinancialpositionasconsolidatedThe IAS 19 basis pensions deficit can be summarised as follows:
2011 £m 2010 £m 2009 £m 2008 £m 2007 £m
Fair value of plan assets, end of year (excluding investments in Prudential policies) 6,886 5,659 5,224 5,057 5,150
Present value of benefit obligation (5,620) (5,438) (4,951) (4,493) (4,826)
Funded status (wholly or partly funded) 1,266 221 273 564 324 Present value of unfunded obligations on Group
consolidated basis (M&G scheme)* – (254) (223) (180) (189)
1,266 (33) 50 384 135
Effect of the application of IFRIC 14 for pension schemes Derecognition of PSPS’ surplus (1,588) (485) (513) (728) (528)Set up obligation for deficit funding for PSPS (19) (47) (75) (65) (102)Adjustment in respect of investment of PSPS in
Prudential policies 112 118 101 103 140
Deficit recognised in the statement of financial position (229) (447) (437) (306) (355)
*TheM&GpensionschemeinvestsinPrudentialinsurancepolicies.OnPrudentialGroupconsolidation,theseassetsareeliminatedagainstliabilitiesinthestatementoffinancialpositionofUKInsuranceOperations.Upuntil2011,alloftheM&Gschemeassetswereinvestedinthisway,thusgivingrisetoanunfundedstatusonaPrudentialGroupconsolidatedbasis.At31December2011,only£165millionoutoftheM&Gschemeassetsof£257millionwasinvestedinPrudentialinsurancepolicies,therebyswitchingitsstatustoapartlyfundedscheme.

360
Prudential plc Annual Report 2011
I: Other notes continued
Financial statements | Notes on the Group financial statements
I3: Staff and pension plans continued
2011 £m 2010 £m
Components of net periodic pension cost Current service cost (35) (38)Negative past service cost (RPI to CPI inflation measure change) 282 – Interest cost (299) (294)Expected return on assets – economic basis 308 325 Less: expected return on investments of scheme assets in Prudential insurance policies (25) (21)Expected return on assets – IAS 19 basis† 283 304
231 (28)Effect of the application of IFRIC 14 (219) (30)
Pension cost (as referred to in note I3a) 12 (58)
Actuarial gains and losses – economic basis 882 (109)Less: actuarial gains on investments of scheme assets in Prudential insurance policies 17 (20) 899 (129)Effect of the application of IFRIC 14 (862) 103
Actuarial gains and losses – IAS 19 basis* (as referred to in note I3a) 37 (26)
Net periodic pension cost (included within acquisition and other operating expenditure in the income statement) 49 (84)
*ConsistentwiththederecognitionoftheCompany’sinterestintheunderlyingIAS19surplusofPSPS,theeffectonthenetperiodicpensioncostforPSPSwastoreplacetheusualIAS19pensionchargesandcreditswiththecashcostofcontributionforongoingservicesofactivemembers,andalsonottoreporttheactuarialgainsandlosses.
†Indeterminingtheexpectedreturnonschemeassetsfor2011,the5.1percent(2010:5.9percent)rateshownbelowhasbeenappliedtotheopeningassets.
The long-term expected rate of return has been taken to be the weighted average (by market value) of the long-term expected rates of return on each major asset class shown below:
2011 2010 2009 2008 2007
£m % £m % £m % £m % £m %
Scheme assets (IAS 19 basis before effect of IFRIC 14)
Equities 336 5 610 11 917 18 875 17 1,332 26 Bonds 5,826 85 4,095 72 3,587 69 2,619 52 1,299 25 Properties 317 4 206 4 278 5 290 6 583 11 Cash-like investments 407 6 748 13 442 8 1,273 25 1,936 38
Total 6,886 100 5,659 100 5,224 100 5,057 100 5,150 100

361F
ina
ncia
l statem
en
tsI: O
ther n
otes
Prospectivelyfor 2012 % 2011 % 2010 %
Long-term expected rates of return Equities 6.8 8.2 8.5 Bonds 3.0 4.6 5.3 Properties 5.55 6.9 6.75 Cash-like investments 2.0 4.75 4.75
Weighted average long-term expected rate of return 3.1 5.1 5.9
The expected rates of return have been determined by reference to long-term expectations, the carrying value of the assets and equity, and other market conditions at the statement of financial position date. The actual return on scheme assets was a gain of £1,290 million (2010: £631 million) on an IAS 19 basis. None of the scheme assets included shares in Prudential plc or property occupied by the Prudential Group.
2011 £m 2010 £m 2009 £m 2008 £m 2007 £m
Fair value of scheme assets, end of year (IAS 19 basis) 6,886 5,659 5,224 5,057 5,150 Present value of the benefit obligation, end of year (5,620) (5,692) (5,174) (4,673) (5,015)
Underlying scheme assets in surplus (deficit) of benefit obligation, before the effect of IFRIC 14 1,266 (33) 50 384 135
Experience adjustments on scheme liabilities 314 (4) 76 145 (14)Percentage of scheme liabilities at 31 December (5.59%) (0.07%) 1.47% 3.10% 0.28%Experience adjustments on scheme assets (IAS 19 basis) 998 287 100 (277) (7)Percentage of scheme assets at 31 December 14.49% 5.07% 1.91% (5.48%) (0.14%)
The experience adjustments on scheme liabilities in 2011 of £314 million related mainly to the ‘true up’ reflecting improvements in data consequent upon the ongoing 2011 triennial valuations of PSPS and the Scottish Amicable pension scheme. The experience adjustments on scheme liabilities in 2008 of a gain of £145 million related mainly to the ‘true up’ reflecting improvements in data consequent upon the 2008 triennial valuation of PSPS. Total employer contributions expected to be paid into the Group defined benefit schemes for the year ending 31 December 2012 amounts to £89 million (2011: £94 million). However, this is subject to a reassessment when the 2011 valuations of the schemes are completed. 8 SensitivityofthepensionschemeliabilitiestokeyvariablesThe total underlying Group pension scheme liabilities of £5,620 million (2010: £5,692 million) comprise £4,844 million (2010: £4,866 million) for PSPS and £776 million (2010: £826 million) for the other schemes. The table below shows the sensitivity of the underlying PSPS and the other scheme liabilities at 31 December 2011 and 2010 to changes in discount rates, inflation rates and mortality rates.
2011
Assumption Change in assumption Impact on scheme liabilities in IAS 19 basis
Discount rate Decrease by 0.2% from 4.7% to 4.5% Increase in scheme liabilities by: PSPS 3.3% Other schemes 4.8%Discount rate Increase by 0.2% from 4.7% to 4.9% Decrease in scheme liabilities by: PSPS 3.1% Other schemes 4.5%Rate of inflation RPI: Decrease by 0.2% from 2.9% to 2.7%
CPI: Decrease by 0.2% from 1.9% to 1.7% with consequent reduction in salary increases
Decrease in scheme liabilities by: PSPS 0.6% Other schemes 4.1%Mortality rate Increase life expectancy by 1 year Increase in scheme liabilities by: PSPS 2.7% Other schemes 2.4%

362
Prudential plc Annual Report 2011
I: Other notes continued
Financial statements | Notes on the Group financial statements
I3: Staff and pension plans continued
2010
Assumption Change in assumption Impact on scheme liabilities in IAS 19 basis
Discount rate Decrease by 0.2% from 5.45% to 5.25% Increase in scheme liabilities by: PSPS 3.6% Other schemes 5.2%Discount rate Increase by 0.2% from 5.45% to 5.65% Decrease in scheme liabilities by: PSPS 3.5% Other schemes 4.8%Rate of inflation RPI: Decrease by 0.2% from 3.55% to 3.35%
with consequent reduction in salary increasesDecrease in scheme liabilities by:
PSPS 1.0% Other schemes 4.9%Mortality rate Increase life expectancy by 1 year Increase in scheme liabilities by: PSPS 2.1% Other schemes 2.6%
The sensitivity of the underlying pension scheme liabilities to changes in discount, inflation and mortality rates as shown above does not directly equate to the impact on the profit or loss attributable to shareholders or shareholders’ equity due to the effect of the application of IFRIC 14 on PSPS and the allocation of a share of the interest in financial position of the PSPS and Scottish Amicable schemes to the PAC with-profits fund as described above. The sensitivity to the changes in the key variables as shown in the table above has no significant impact on the pension costs included in the Group’s operating results. This is due to the pension costs charged in each of the periods presented being derived largely from market conditions at the beginning of the period. After applying IFRIC 14 and to the extent attributable to shareholders, any residual impact from the changes to these variables is reflected as actuarial gains and losses on defined benefit pension schemes within the supplementary analysis of profits. The relevance of this is described further below. For PSPS, the underlying surplus of the scheme of £1,588 million (2010: £485 million) has not been recognised under IFRIC 14. Any change in the underlying scheme liabilities to the extent that it is not sufficient to alter PSPS into a liability in excess of the deficit funding provision will not have an impact on the Group’s results and financial position. Based on the underlying financial position of PSPS as at 31 December 2011, none of the changes to the underlying scheme liabilities for the changes in the variables shown in the table above have had an impact on the Group’s 2011 results and financial position. In the event that a change in the PSPS scheme liabilities results in a deficit position for the scheme which is recognisable, the deficit recognised affects the Group’s results and financial position only to the extent of the amounts attributable to shareholder operations. The amounts attributable to the PAC with-profits fund are absorbed by the liability for unallocated surplus and have no direct effect on the profit or loss attributable to shareholders or shareholders’ equity. The deficit of the Scottish Amicable pension scheme has been allocated approximately 50 per cent to the PAC with-profits fund and 50 per cent to the shareholders. Accordingly, half of the changes to its scheme liabilities, which at 31 December 2011 were £527 million (2010: £572 million), due to the changes in the variables shown in the table above would have had an impact on the Group’s shareholder results and financial position.
9 TransfervalueofPSPSschemeAt 31 December 2011, it is estimated that the assets of the scheme are broadly sufficient to cover the liabilities of PSPS on a ‘buyout’ basis, including an allowance for expenses. The ‘buyout’ basis refers to a basis that might apply in the circumstance of a transfer to another appropriate financial institution. In making this assessment, it has been assumed that a more conservative investment strategy applies together with a more prudent allowance for future mortality improvements and no allowance for discretionary pension increases.
ii Other pension plansThe Group operates various defined contribution pension schemes including schemes in Jackson and Asia. The cost of the Group’s contributions for continuing operations to these schemes in 2011 was £40 million (2010: £37 million).

363F
ina
ncia
l statem
en
tsI: O
ther n
otes
I4: Share-based payments
The Group maintains 10 main share award and share option plans relating to Prudential plc shares, which are described below. The Group Performance Share Plan (GPSP) is the incentive plan in which all executive directors and other senior executives within the Group can participate. This scheme was established as a replacement for the Restricted Share Plan (RSP) under which no further awards could be made after March 2006. Awards are granted either in the form of a nil cost option, conditional right over shares, or such other form that shall confer to the participant an equivalent economic benefit, with a vesting period of three years. The performance measure for the awards is that Prudential’s Total Shareholder Return (TSR) outperforms an index comprising of peer companies. Vesting of the awards between each performance point is on a straight-line sliding-scale basis. Participants are entitled to the value of reinvested dividends that would have accrued on the shares that vest. Beginning in 2010, newly issued shares have been used in settling the awards that vest and are released. The RSP was, until March 2006, the Group’s long-term incentive plan for executive directors and other senior executives designed to provide rewards linked to shareholder return. Each year participants were granted a conditional option to receive a number of shares. There was a deferment period of three years, at the end of which the award vested to an extent that depended on the performance of the Group’s shares including notional reinvested dividends and on the Group’s underlying financial performance. After vesting, the option may be exercised at zero cost at any time, subject to closed period rules, in the balance of a 10-year period. Shares are purchased in the open market by a trust for the benefit of qualifying employees. The Business Unit Performance Plan (BUPP) is an incentive plan created to provide a common framework under which awards would be made to senior employees in the UK, Jackson and Asia, including the chief executive officers. Awards under this plan were based on growth in shareholder capital value on the European Embedded Value (EEV) basis with performance measured over three years. Upon vesting of awards made up to 2008, half of the awards were released as shares and the other half released in cash. Since the year ended 31 December 2009, all awards made will be settled in shares after vesting. Participants are entitled to receive the value of reinvested dividends over the performance period for those shares that vest. The growth parameters for the awards are relevant to each region, and vesting of the awards between each performance point is on a straight-line sliding-scale basis. Beginning in 2010, newly issued shares will be used in settling the awards that vest and are released. During 2009, the Remuneration Committee decided that future BUPP awards for the UK business unit would be based on the same relative TSR measure applied to GPSP awards. As a result, awards made under the UK BUPP reflect those TSR conditions applied to GPSP awards. In 2011, the Remuneration Committee decided to cancel two-thirds of the number of shares comprising the 2008 share awards and one-third of the 2009 share awards to most UK BUPP participants with the vesting of the remaining one-third and two-thirds, respectively, of awards then being dependent on the achievement of the TSR condition. The change in awards was not applicable to executive directors. Upon the cancellation, Prudential recognised as expense the full amount of the one-third and two-thirds awards that would have been accrued for the remainder of the respective vesting periods in accordance with IFRS 2, ‘Share-based Payment’. The Group maintains four share option schemes satisfied by the issue of new shares. UK-based executive directors and eligible employees are eligible to participate in the Prudential HM Revenue & Customs (HMRC)-approved UK Savings Related Share Option Scheme (SAYE scheme) and the Asia-based executive directors and eligible employees can participate in the equivalent International SAYE scheme. Dublin-based employees are eligible to participate in the Prudential International Assurance Sharesave Plan, and Hong Kong-based agents can participate in the Non-employee Savings Related Share Option Scheme. The schemes allow participants to save towards the exercise of options over Prudential plc shares, at an option price set at the beginning of the savings period as determined by reference to the average market price of the ordinary shares on the three business days immediately preceding the invitation, at a discount of 20 per cent. Participants may save up to £250 per month for three or five years. On maturity at the end of the set term, participants may exercise their options within six months of the end of the savings period and purchase Prudential plc shares. If an option is not exercised within six months, participants are entitled to a refund of their cash contributions plus interest if applicable under the rules. The exercise period of the options granted may be advanced to an earlier date in certain circumstances, for example on retirement, and may be extended in certain circumstances, for example on the death of the participant the personal representative may exercise the options beyond the normal exercise period. Shares are issued to satisfy options that are exercised. No options may be granted under the schemes if the grant would cause the number of shares which have been issued, or which remain issuable pursuant to options granted in the preceding 10 years under the scheme and other share option schemes operated by the Company, or which have been issued under any other share incentive scheme of the Company, to exceed 10 per cent of the Company’s ordinary share capital at the proposed date of grant. UK-based executive directors and employees are also eligible to participate in the Company’s HMRC-approved Share Incentive Plan, which allows all UK-based employees to purchase shares of Prudential plc (partnership shares) on a monthly basis out of gross salary. For every four partnership shares bought, an additional matching share is awarded, purchased on the open market. Dividend shares accumulate while the employee participates in the plan. Partnership shares may be withdrawn from the scheme at any time. If the employee withdraws from the plan within five years, the matching shares are forfeit, and if within three years, dividend shares are forfeit. Jackson operates a performance-related share award which, subject to the prior approval of the Jackson Remuneration Committee, may grant share awards to eligible Jackson employees in the form of a contingent right to receive shares or a conditional allocation of shares. These share awards have vesting periods of four years and are at nil cost to the employee. Award holders do not have any right to dividends or voting rights attaching to the shares. The shares are held in the employee share trust in the form of American Depository Receipts which are tradable on the New York Stock Exchange.

364
Prudential plc Annual Report 2011
I: Other notes continued
Financial statements | Notes on the Group financial statements
I4: Share-based payments continued
The Prudential Corporation Asia Long-Term Incentive Plan (PCA LTIP) is an incentive plan created in 2008 for senior employees and chief executive officers. Awards under the PCA LTIP will vest after three years subject to the employee being in employment at the time of vesting without any performance conditions. Awards will be discretionary and on a year-by-year basis determined by Prudential’s full year financial results and the employee’s contribution to the business. All awards will be in Prudential shares except for countries where share awards are not feasible due to securities and/or tax reasons, where awards will be replaced by the cash value of the shares that would otherwise have been transferred. Certain senior executives have annual incentive plans with awards paid in cash up to the target level of their plan. The portion of any award for above-target performance is made in the form of awards of shares deferred for three years, with the release of shares subject to close periods. The shares are held in the employee share trust and shares equivalent to dividends otherwise payable will accumulate for the benefit of award holders during the deferral period up to the release date. In addition, there are other share awards, including the Prudential Corporation Asia Deferred Bonus Plan (PCA DBP), Prudential Capital Deferred Bonus Plan (PruCap DBP) and other arrangements. There are no performance conditions attaching to these deferred bonus plans, and awards vest in full subject to the individual being employed by Prudential at the end of the vesting period. The other arrangements relate to various awards that have been made without performance conditions to individual employees, typically in order to secure their appointment or ensure retention.
Options outstanding under SAYE schemes
2011 2010
Numberof optionsmillions
Weightedaverage
exerciseprice
£
Numberof optionsmillions
Weightedaverage
exerciseprice
£
Beginning of year: 12.8 3.4 12.2 3.2 Granted 2.1 4.66 2.2 4.61 Exercised (0.6) 3.98 (0.6) 3.15 Forfeited (0.2) 3.17 (0.2) 3.44 Cancelled (0.4) 3.56 (0.5) 3.37 Lapsed (0.4) 3.94 (0.3) 3.89
End of year 13.3 3.55 12.8 3.4
Options immediately exercisable, end of year 0.4 4.54 0.2 5.52
The weighted average share price of Prudential plc for the year ended 31 December 2011 was £6.86 compared to £5.68 for the year ended 31 December 2010. Movements in share awards outstanding under the Group’s share-based compensation plans relating to Prudential plc shares at 31 December 2011 and 2010 were as follows:
Awards outstanding under incentive plans including conditional options
2011 2010
Numberof awardsmillions
Numberof awardsmillions
Beginning of year: 23.9 19.2 Granted 10.3 11.2 Exercised (4.2) (4.7) Forfeited (0.1) (1.2) Expired (3.2) (0.6)
End of year 26.7 23.9

365F
ina
ncia
l statem
en
tsI: O
ther n
otes
The following table provides a summary of the range of exercise prices for Prudential plc options outstanding at 31 December 2011.
Range of exercise prices
Outstanding Exercisable
NumberOutstanding
millions
Weighted average
remaining contractual
lifeyears
Weighted average
exercise prices
£
Numberexercisable
millions
Weighted average
exercise prices
£
Between £2 and £3 8.2 1.6 2.88 – – Between £3 and £4 – 0.8 3.73 – 3.43 Between £4 and £5 5.0 3.1 4.58 0.3 4.40 Between £5 and £6 0.1 0.9 5.58 0.1 5.53
13.3 2.2 3.55 0.4 4.54
The following table provides a summary of the range of exercise prices for Prudential plc options outstanding at 31 December 2010.
Range of exercise prices
Outstanding Exercisable
NumberOutstanding
millions
Weighted average
remaining contractual
lifeyears
Weighted average
exercise prices
£
Numberexercisable
millions
Weighted average
exercise prices
£
Between £2 and £3 9.0 2.6 2.88 – – Between £3 and £4 0.1 1.3 3.59 – 3.67 Between £4 and £5 3.3 3.3 4.51 – 4.07 Between £5 and £6 0.4 1.0 5.59 0.2 5.63
12.8 2.8 3.4 0.2 5.52
The years shown above for weighted average remaining contractual life include the time period from end of vesting period to expiration of contract. The weighted average fair values of Prudential plc options and awards granted during the period are as follows:
2011 £ 2010 £
Weighted average fair value Weighted average fair value
GPSPSAYE
Options Awards GPSPSAYE
Options Awards
3.88 2.63 6.28 2.74 2.91 5.14
The fair value amounts relating to all options including conditional nil cost options above were determined using the Black-Scholes and the Monte Carlo option-pricing models using the following assumptions:
2011 2010
GPSPSAYE
Options GPSPSAYE
Options
Dividend yield (%) 3.33 3.33 3.43 3.43 Expected volatility (%) 28.90 62.67 42.69 64.65 Risk-free interest rate (%) 1.32 0.89 1.70 1.07 Expected option life (years) – 3.48 – 3.49 Weighted average exercise price (£) – 4.66 – 4.61 Weighted average share price (£) 7.32 6.06 5.70 6.38

366
Prudential plc Annual Report 2011
I: Other notes continued
Financial statements | Notes on the Group financial statements
I4: Share-based payments continued
Compensation costs for all share-based compensation plans are determined using either the Black-Scholes model or the Monte Carlo model. Share options and awards are valued using the share price at the date of grant. The compensation costs for all awards and options are recognised in net income over the plans’ respective vesting periods. The Group uses the Black-Scholes model to value all options and awards other than the GPSP and UK BUPP, for which the Group uses a Monte Carlo model in order to allow for the impact of the TSR performance conditions. These models are used to calculate fair values for share options and awards at the grant date based on the quoted market price of the stock at the measurement date, the amount, if any, that the employees are required to pay, the dividend yield, expected volatility, risk-free interest rates and exercise prices. For SAYE options, the expected volatility is measured as the standard deviation of expected share price returns based on statistical analysis of daily share prices over a period up to the grant date equal to the expected life of options. In recent years, this calculation has been influenced by the extreme market volatility experienced in 2008/2009. Risk-free interest rates are UK gilt rates with projections for three- and five-year terms to match corresponding vesting periods. Dividend yield is determined as the average yield over the year of grant. For the GPSP, volatility and correlation between Prudential and an index constructed from a simple average of the TSR growth of 10 companies is required. For grants in 2011, an average index volatility and correlation of 32 per cent and 78 per cent respectively, were used. For the GPSP, market implied volatilities are used for both Prudential and the components of the index. Changes to the subjective input assumptions could materially affect the fair value estimate. When options are granted or awards made to employees, an estimate is made of what percentage is more than likely to vest, be forfeited, lapse or cancelled based on historical information. Based on these estimates, compensation expense to be accrued at that date is calculated and amortised over the vesting period. For early exercises of options or release of awards due to redundancy, death or resignation, the compensation expense is immediately recognised, and for forfeitures due to employees leaving the Group, any previously recognised expense is reversed. However, if an employee loses their award because of the Group’s failure to meet the performance criteria, previously recognised expense is not reversed. During the year, the Group granted share options to certain non-employee independent financial advisors. Those options were measured using the Black-Scholes option pricing model with assumptions consistent with those of other share options. These transactions were measured using an option model because the Group does not receive a separate and measurable benefit from those non-employees in exchange for the options granted. As such, the fair value of the options themselves is more readily determinable than the services received in return.
Total share-based payment expenseTotal expense recognised in the year in the consolidated financial statements related to share-based compensation is as follows:
2011 £m 2010 £m
Share-based compensation expense 48 47 Amount accounted for as equity-settled 44 37 Carrying value at 31 December of liabilities arising from share-based payment transactions 15 17 Intrinsic value of above liabilities for which rights had vested at 31 December 6 6
I5: Key management remuneration
Key management constitutes the directors of Prudential plc as they have authority and responsibility for planning, directing and controlling the activities of the Group. Total key management remuneration can be broken down in the following table:
2011 £ 2010 £
Salaries and short-term benefits 12,192,000 9,594,000 Post-employment benefits 1,189,000 926,000 Share-based payments 9,734,000 11,157,000
23,115,000 21,677,000
Post-employment benefits comprise the change in the transfer value of the accrued benefit relating to directors’ defined benefit pension schemes in the year and the total contributions made to directors’ other pension arrangements. The share-based payments charge is the sum of £6,571,000 (2010: £7,320,000), which is determined in accordance with IFRS 2, ‘Share-Based Payments’ (see note I4) and £3,163,000 (2010: £3,837,000) of deferred share awards. Total key management remuneration includes total directors’ emoluments of £16,212,000 (2010: £14,225,000) as shown in the directors’ remuneration table and related footnotes in the directors’ remuneration report, and additional amounts in respect of pensions and share-based payments. Further information on directors’ remuneration is given in the directors’ remuneration report.

367F
ina
ncia
l statem
en
tsI: O
ther n
otes
I6: Fees payable to auditor
2011 £m 2010 £m
Fees payable to the Company’s auditor for the audit of the Company’s annual accounts 2.1 1.9 Fees payable to the Company’s auditor and its associates for other services: Audit of subsidiaries pursuant to legislation 6.1 6.1 Audit-related assurance services 2.6 2.5 Tax compliance services 0.6 0.4 Other assurance services 0.5 0.6 Services relating to corporate finance transactions excluding the AIA transaction 0.5 0.1 All other services 0.3 0.4 Services relating to the AIA transaction – 5.5
Total 12.7 17.5
In addition, there were fees incurred of £0.1 million (2010: £0.1 million) for the audit of pension schemes. The above audit fees for 2011 and 2010 reflect the new disclosure requirements of SI2011/2198 – The Companies (Disclosure of Auditor Remuneration and Liability Limitation Agreements) (Amendment) Regulations 2011. The fees for services relating to the AIA transaction in 2010 of £5.5 million were primarily comprised of the following services:
• accountants’ report on historical financial information on Prudential Group,• consulting actuaries’ report on AIA EEV information,• technical accounting advice,• financial due diligence,• working capital review,• synergies review, and• extraction comfort
All services were specifically approved by the Prudential Group Audit Committee. The Audit Committee regularly monitors the non-audit services provided to the Group by its auditor and has developed a formal Auditor Independence Policy, which sets out the types of services that the auditor may provide, consistent with the guidance in Sir Robert Smith’s report ‘Audit Committees – Combined Code Guidance’ and with the provisions of the US Sarbanes-Oxley Act. The Audit Committee annually reviews the auditor’s objectivity and independence. More information on these issues is given in the corporate governance report within this Annual Report. I7: Related party transactions
Transactions between the Company and its subsidiaries are eliminated on consolidation. In addition, the Company has transactions and outstanding balances with certain unit trusts, OEICs, collateralised debt obligations and similar entities which are not consolidated and where a Group company acts as manager. These entities are regarded as related parties for the purposes of IAS 24. The balances are included in the Group’s statement of financial position sheet at fair value or amortised cost in accordance with their IAS 39 classifications. The transactions are included in the income statement and include amounts paid on issue of shares or units, amounts received on cancellation of shares or units and paid in respect of the periodic charge and administration fee. Further details of the aggregate assets, liabilities, revenues, profits or losses and reporting dates of entities considered to be associates under IFRS are disclosed in note H8. Executive officers and directors of the Company may from time to time purchase insurance, asset management or annuity products marketed by Group companies in the ordinary course of business on substantially the same terms as those prevailing at the time for comparable transactions with other persons. Apart from the transactions with directors referred to below, no director had interests in shares, transactions or arrangements that require disclosure, other than those given in the directors’ remuneration report. Key management remuneration is disclosed in note I5. In 2011 and 2010, other transactions with directors were not deemed to be significant both by virtue of their size and in the context of the directors’ financial positions. As indicated above, all of these transactions are on terms broadly equivalent to those that prevail in arm’s length transactions.

368
Prudential plc Annual Report 2011
I: Other notes continued
Financial statements | Notes on the Group financial statements
I8: Subsidiary undertakings
i PrincipalsubsidiariesThe principal subsidiary undertakings of the Company at 31 December 2011, all wholly owned were:
MainactivityCountryof
incorporation
The Prudential Assurance Company Limited Insurance England and WalesPrudential Annuities Limited* Insurance England and WalesPrudential Retirement Income Limited (PRIL)* Insurance ScotlandM&G Investment Management Limited* Asset management England and WalesJackson National Life Insurance Company* Insurance USPrudential Assurance Company Singapore (Pte) Limited* Insurance Singapore
*OwnedbyasubsidiaryundertakingoftheCompany.
Each subsidiary has one class of ordinary shares and operates mainly in its country of incorporation, except for PRIL, which operates mainly in England and Wales. Details of all Prudential subsidiaries, joint ventures and associates will be annexed to the next Annual Returns of Prudential plc filed with the UK Registrar of Companies.
ii DividendrestrictionsandminimumcapitalrequirementsCertain Group subsidiaries are subject to restrictions on the amount of funds they may transfer in the form of cash dividends or otherwise to the parent company. UK insurance companies are required to maintain solvency margins, which must be supported by capital reserves and other resources, including unrealised gains on investments. Jackson can pay dividends on its capital stock only out of earned surplus unless prior regulatory approval is obtained. Furthermore, without the prior regulatory approval, dividends cannot be distributed if all dividends made within the preceding 12 months exceed the greater of Jackson’s statutory net gain from operations or 10 per cent of Jackson’s statutory surplus for the prior year. In 2012, the maximum amount of dividends that could be paid by Jackson, subject to the availability of earned surplus, without prior regulatory approval is US$411 million (£264 million) (in 2011: US$770 million (£495 million)). The Group’s subsidiaries in Asia may remit dividends to the Group, in general, provided the statutory insurance fund meets the capital adequacy standard required under local statutory regulations. The Group capital position statement for life assurance businesses is set out in note D5, showing the available capital reflecting the excess of regulatory basis over liabilities for each fund or group of companies determined by reference to the local regulation of the subsidiaries. In addition, disclosure is also provided in note D5 of the local capital requirement of each of the fund or group of companies.
iiiAcquisitionofsubsidiaries2011The PAC with-profits fund, via its venture fund holdings and as part of its investment portfolio, made acquisitions during the period. These were acquisitions for a 100 per cent interest of Earth & Wind Energias Renovables SL, a company which invests in solar panel parks, in March 2011 and a 100 per cent interest of Alticom Holdings BV, a company investing in telecommunication towers, in June 2011. The Earth & Wind portfolio of solar panel parks was further expanded with the acquisition of a 100 per cent interest in Promociones Fotovoltaicas Betula SL, Promociones Fotovoltaicas Castanea SL, Promociones Fotovoltaicas Corylus SL and Promociones Fotovoltaicas Fagus SL in July 2011, and a 50 per cent controlling interest in Sarinena Solar SL in October 2011. As these transactions are within the with-profits fund, they have no impact on shareholders’ profit or equity for the year ended 31 December 2011. The impact on the Group’s consolidated revenue, including investment returns, is not material. Had the acquisitions been effected at 1 January 2011, the revenue and profit of the Group for the year ended 31 December 2011 would not have been materially different.

369F
ina
ncia
l statem
en
tsI: O
ther n
otes
A summary of the consideration, goodwill and net assets acquired relating to these four acquisitions is provided in the table below:
2011Total £m
Cash consideration paid 67
Net assets acquired: Property, plant and equipment 190 Other non-investment and non-cash assets 16 Cash and cash equivalents 14 Borrowings attributable to with-profits funds (114) Derivative liabilities (2) Other non-insurance liabilities (49)
Fair value of net assets acquired 55
Total goodwill arising on acquisition attributable to the with-profits fund 12
The acquisition costs associated with these transactions were expensed as incurred and totalled less than £1.7 million. Goodwill represents management’s expectation of future income streams and is not allowable for tax.
2010During 2010, the Group acquired a 100 per cent interest in United Overseas Bank Life Assurance Limited (UOB) in Singapore. Further details are set out in note I1. On 1 October 2010, the PAC with-profits fund, via its venture fund holdings and as part of its investment portfolio, acquired control of Meterserve (North West) Limited and Meterserve (North East) Limited (together referred to as ‘Meterserve’), increasing its 50 per cent stake to 100 per cent. As this transaction is within the with-profits fund, it has no impact on shareholders’ profit or equity for the period ended 31 December 2010. The impact on the Group’s consolidated revenue, including investment returns, is not material. Had the acquisition been effected at 1 January 2010, the revenue and profit of the Group from continuing operations for the year ended 31 December 2010 would not have been materially different. A summary of the consideration, goodwill and net assets acquired relating to Meterserve is provided in the table below:
2010 £m
Cash consideration paid 22 Fair value of existing stake 25
Total consideration 47
Net assets acquired: Property, plant and equipment 219 Derivative assets (35) Other non-investment and non-cash assets 11 Cash and cash equivalents 10 Borrowings attributable to with-profits funds (194) Other non-insurance liabilities (6)
Fair value of net assets acquired 5
Total goodwill arising on acquisition attributable to the with-profits fund 42
The acquisition costs associated with this transaction were expensed as incurred and totalled less than £1 million. Goodwill represents management’s expectation of future income streams and is not allowable for tax. As noted above, the transaction increased the previously held stake from 50 per cent to 100 per cent. The fair value of the existing stake at the date of the transaction was £25 million. As the investment was held in the Group’s balance sheet as a financial instrument classified as at fair value through profit and loss, no gain or loss arises as a result of the transaction. Other than the above, there were no other material acquisitions or disposals of subsidiaries during 2011 or 2010.

370
Prudential plc Annual Report 2011
I: Other notes continued
Financial statements | Notes on the Group financial statements
I9: Commitments
i Operating leasesThe Group leases various offices to conduct its business. Leases in which a significant portion of the risks and rewards of ownership are retained by the lessor are classified as operating leases. Payments made under operating leases (net of any incentives received from the lessor) are charged to the income statement on a straight-line basis over the period of the lease.
2011 £m 2010 £m
Future minimum lease payments for non-cancellable operating leases fall due during the following periods: Not later than 1 year 66 70 Later than 1 year and not later than 5 years 173 236 Later than 5 years 72 120
The total minimum future sublease rentals to be received on non-cancellable operating leases for land and buildings for the year ended 31 December 2011 were £nil (2010: £nil). Minimum lease rental payments for the year ended 31 December 2011 of £74 million (2010: £92 million) are included in the consolidated income statement.
ii Capital commitmentsThe Group has provided, from time to time, certain guarantees and commitments to third parties including funding the purchase or development of land and buildings and other related matters. The contractual obligations to purchase or develop investment properties at 31 December 2011 were £9 million (2010: £28 million). I10: Cash flows
Structural borrowings of shareholder-financed operations comprise of core debt of the parent company, the PruCap bank loan and Jackson surplus notes. Core debt excludes borrowings to support short-term fixed income securities programmes, non-recourse borrowings of investment subsidiaries of shareholder-financed operations and other borrowings of shareholder-financed operations. Cash flows in respect of these borrowings are included within cash flows from operating activities. Structural borrowings of with-profits operations relate solely to the £100 million 8.5 per cent undated subordinated guaranteed bonds which contribute to the solvency base of the Scottish Amicable Insurance fund (SAIF), a ring-fenced sub-fund of the PAC with-profits fund. Cash flows in respect of other borrowings of with-profits funds, which principally relate to consolidated investment funds, are included within cash flows from operating activities. I11: Post balance sheet events
On 22 February 2012, M&G completed transactions to (i) exchange bonus share rights for equity holdings with the employees of PPM South Africa and (ii) the sale of a 10 per cent holding in the majority of the business to Thesele Group, a minority shareholder, for cash. Following these transactions M&G’s holding in the majority of the business reduced from 75 per cent to 47 per cent. Under IFRS requirements, the divestment is accounted for as the disposal of the 75 per cent holding and an acquisition of a 47 per cent holding at fair value. As a consequence of the IFRS application, the transactions give rise to a gain on dilution of approximately £40 million. This amount will be accounted for in the Group 2012 supplementary analysis of profit as a gain on dilution excluded from the Group’s IFRS operating profit based on longer-term investment returns.

371F
ina
ncia
l statem
en
tsP
arent co
mp
any
31 December 2011 Note 2011 £m 2010 £m
Fixed assets Investments: Shares in subsidiary undertakings 5 10,902 9,410 Loans to subsidiary undertakings 5 1,200 849
12,102 10,259
Current assets Debtors: Amounts owed by subsidiary undertakings 6,122 4,244 Deferred tax 6 364 345 Other debtors 11 6 Derivative assets 8 3 112 Cash at bank and in hand 152 162
6,652 4,869
Less liabilities: amounts falling due within one year Commercial paper 7 (2,706) (2,311)Other borrowings 7 (200) (200)Derivative liabilities 8 (207) (146)Amounts owed to subsidiary undertakings (1,049) (1,084)Tax payable (198) (169)Sundry creditors (19) (19)Accruals and deferred income (46) (59)
(4,425) (3,988)
Net current assets 2,227 881
Total assets less current liabilities 14,329 11,140
Less liabilities: amounts falling due after more than one year Subordinated liabilities 7 (2,652) (2,718)Debenture loans 7 (549) (549)Other borrowings 7 (250) (249)Amounts owed to subsidiary undertakings (3,560) (3,398)
(7,011) (6,914)
Total net assets (excluding pension) 7,318 4,226 Pension asset (net of related deferred tax) 9 39 41
Total net assets (including pension) 7,357 4,267
Capital and reserves Share capital 10 127 127 Share premium 10 1,873 1,856 Profit and loss account 11 5,357 2,284
Shareholders’ funds 11 7,357 4,267
The financial statements of the parent company on pages 371 to 382 were approved by the Board of directors on 12 March 2012 and signed on its behalf.
Harvey McGrath Tidjane Thiam Nic NicandrouChairman Group Chief Executive Chief Financial Officer
Balance sheet of the parent company

372
Prudential plc Annual Report 2011
Financial statements | Notes on the parent company financial statements
Notes on the parent company financial statements
1 Nature of operations
Prudential plc (the Company) is a parent holding company. The Company together with its subsidiaries (collectively, the Group) is an international financial services group with its principal operations in Asia, the US and the UK. In Asia, the Group has operations in Hong Kong, Malaysia, Singapore, Indonesia and other Asian countries. In the US, the Group’s principal subsidiary is Jackson National Life Insurance Company (Jackson). In the UK, the Group operates through its subsidiaries, primarily The Prudential Assurance Company Limited (PAC), Prudential Annuities Limited (PAL), Prudential Retirement Income Limited (PRIL) and M&G Investment Management Limited. The Company is responsible for the financing of each of its subsidiaries.
2 Basis of preparation
The financial statements of the Company, which comprise the balance sheet and related notes, are prepared in accordance with Part 15 of the Companies Act 2006, which applies to companies generally. The Company has taken advantage of the exemption under Section 408 of the Companies Act 2006 from presenting its own profit and loss account. The financial statements are prepared in accordance with applicable accounting standards under UK Generally Accepted Accounting Practice (UK GAAP), including Financial Reporting Standards (FRS) and Statements of Standard Accounting Practice (SSAP). The Company has not prepared a cash flow statement on the basis that its cash flow is included within the cash flow statement in the consolidated financial statements. The Company has also taken advantage of the exemption within FRS 29, ‘Financial Instruments: Disclosures’, from the requirements of this standard on the basis that the Company’s results are included in the publicly available consolidated financial statements of the Group that include disclosures that comply with IFRS 7, ‘Financial Instruments: Disclosures’, which is equivalent to FRS 29. The Company adopted the ‘Improvements to Financial Reporting Standards 2010’ in 2011 which included minor changes to FRS 29 ‘Financial Instruments: Disclosures’ and FRS 8 ‘Related Party Disclosures’. These changes closely reflect the requirements of International Financial Reporting Standards (IFRS) and form part of the continuing convergence of UK GAAP to IFRS requirements in the UK. Their adoption did not have an impact on the financial statements of the Company. 3 Significant accounting policies
Shares in subsidiary undertakingsShares in subsidiary undertakings are shown at the lower of cost and estimated realisable value.
Loans to subsidiary undertakingsLoans to subsidiary undertakings are shown at cost, less provisions.
DerivativesDerivative financial instruments are held to manage interest rate and currency profiles. Derivative financial instruments are carried at fair value with changes in fair value included in the profit and loss account. Under FRS 26, ‘Financial Instruments: Recognition and Measurement’, hedge accounting is permissible only if certain criteria are met regarding the establishment of documentation and continued measurement of hedge effectiveness. For derivative financial instruments designated as fair value hedges, the movements in the fair value are recorded in the profit and loss account with the accompanying change in fair value of the hedged item attributable to the hedged risk.
BorrowingsBorrowings are initially recognised at fair value, net of transaction costs, and subsequently accounted for on an amortised cost basis using the effective interest method. Under the effective interest method, the difference between the redemption value of the borrowing and the initial proceeds, net of transaction costs, is amortised through the profit and loss account to the date of maturity, or, for hybrid debt, over the expected life of the instrument.
DividendsInterim dividends are recorded in the period in which they are paid. Final dividends are recorded in the period in which they are approved by shareholders.
Share premiumThe difference between the proceeds received on issue of shares and the nominal value of the shares issued is credited to the share premium account.

373F
ina
ncia
l statem
en
tsP
arent co
mp
any
Foreign currency translationForeign currency borrowings that have been used to finance or provide a hedge against Group equity investments in overseas subsidiaries are translated at year-end exchange rates. The impact of these currency translations is recorded within the profit and loss account for the year. Other assets and liabilities denominated in foreign currencies are also converted at year end exchange rates with the related foreign currency exchange gains or losses reflected in the profit and loss account for the year.
TaxCurrent tax expense is charged or credited to operations based upon amounts estimated to be payable or recoverable as a result of taxable operations for the current year. To the extent that losses of an individual UK company are not offset in any one year, they can be carried back for one year or carried forward indefinitely to be offset against profits arising from the same company. Deferred tax assets and liabilities are recognised in accordance with the provisions of FRS 19, ‘Deferred Tax’. The Company has chosen not to apply the option available of recognising such assets and liabilities on a discounted basis to reflect the time value of money. Except as set out in FRS 19, deferred tax is recognised in respect of all timing differences that have originated but not reversed by the balance sheet date. Deferred tax assets are recognised to the extent that it is regarded as more likely than not that they will be recovered. The Group’s UK subsidiaries each file separate tax returns. In accordance with UK tax legislation, where one domestic UK company is a 75 per cent owned subsidiary of another UK company or both are 75 per cent owned subsidiaries of a common parent, the companies are considered to be within the same UK tax group. For companies within the same tax group, trading profits and losses arising in the same accounting period may be offset for the purposes of determining current and deferred taxes.
PensionsThe Company assumes a portion of the pension surplus or deficit of the Group’s main pension scheme, the Prudential Staff Pension Scheme (PSPS) and applied the requirements of FRS 17, ‘Retirement Benefits’ (as amended in December 2006) to its interest in the PSPS surplus or deficit. Further details are disclosed in note 9. A pension surplus or deficit is recorded as the difference between the present value of the scheme liabilities and the fair value of the scheme assets. The Company’s share of pension surplus is recognised to the extent that the Company is able to recover a surplus either through reduced contributions in the future or through refunds from the scheme. The assets and liabilities of the defined benefit pension schemes of the Prudential Group are subject to a full triennial actuarial valuation using the projected unit method. Estimated future cash flows are then discounted at a high quality corporate bond rate, adjusted to allow for the difference in duration between the bond index and the pension liabilities where appropriate, to determine its present value. These calculations are performed by independent actuaries. The aggregate of the actuarially determined service costs of the currently employed personnel and the unwind of the discount on liabilities at the start of the period, gains and losses on settlements and curtailments, less the expected investment return on the scheme assets at the start of the period, is recognised in the profit and loss account. To the extent that part or all of the Company’s interest in the pension surplus is not recognised as an asset, the unrecognised surplus is initially applied to extinguish any past service costs, losses on settlements or curtailments that would otherwise be included in the profit and loss account. Next, the expected investment return on the scheme’s assets is restricted so that it does not exceed the total of the current service cost, interest cost and any increase in the recoverable surplus. Any further adjustment for the unrecognised surplus is treated as an actuarial gain or loss. Actuarial gains and losses as a result of the changes in assumptions, the difference between actual and expected investment return on scheme assets and experience variances are recorded in the statement of total recognised gains and losses. Actuarial gains and losses also include adjustment for unrecognised pension surplus as described above.
Share-based paymentsThe Group offers share award and option plans for certain key employees and a SAYE plan for all UK and certain overseas employees. The share-based payment plans operated by the Group are mainly equity-settled plans with a few cash-settled plans. Under FRS 20, where the Company, as the parent company, has the obligation to settle the options or awards of its equity instruments to employees of its subsidiary undertakings, and such share-based payments are accounted for as equity-settled in the Group financial statements, the Company records an increase in the investment in the subsidiary undertakings for the value of the share options and awards granted with a corresponding credit entry recognised directly in equity. The value of the share options and awards granted is based upon the fair value of the options and awards at the grant date, the vesting period and the vesting conditions.

374
Prudential plc Annual Report 2011
Financial statements | Notes on the parent company financial statements
Notes on the parent company financial statementscontinued
4 Reconciliation from UK GAAP to IFRS
The Company financial statements are prepared in accordance with UK GAAP and the consolidated financial statements are prepared in accordance with IFRS as issued by the IASB and endorsed by the EU. The tables below provide a reconciliation between UK GAAP and IFRS.
2011 £m 2010 £m
Profit after tax Profit for the financial year of the Company in accordance with UK GAAP 3,720 881 IFRS adjustment (5) (8)
Profit for the financial year of the Company (including dividends from subsidiaries) in accordance with IFRS 3,715 873 Share in the IFRS result of the Group, net of distributions to the Company (2,225) 558
Profit after tax of the Group attributable to shareholders in accordance with IFRS 1,490 1,431
2011 £m 2010 £m
Net equity Shareholders’ equity of the company in accordance with UK GAAP 7,357 4,267 IFRS adjustment (44) (51)
Shareholders’ equity of the Company in accordance with IFRS 7,313 4,216 Share in the IFRS net equity of the Group 1,804 3,815
Shareholders’ equity of the Group in accordance with IFRS 9,117 8,031
The profit for the financial year of the Company in accordance with UK GAAP and IFRS includes dividends declared in the year from subsidiary undertakings of £4,002 million, and £1,318 million for the years ended 31 December 2011 and 2010, respectively. The ‘IFRS adjustment’ lines in the above tables represent the difference in the accounting treatment for pension schemes between UK GAAP and IFRS. Under UK GAAP, the parent company’s interest in the surplus of the Group’s main pension scheme recognised on the balance sheet represents the element which is recoverable through reduced future contributions. Under IFRS, as the terms of the relevant trust deed restrict shareholders’ access to any underlying surplus, not only is the underlying IAS 19 basis surplus not recognised, but the Company’s share of the obligation for deficit funding has also to be recognised on the balance sheet. The shares in the IFRS result and net equity of the Group represent the Company’s equity in the earnings and net assets of its subsidiaries and associates. As stated in note 1, under UK GAAP, the Company accounts for its investments in subsidiary undertakings at the lower of cost and estimated realisable value. For the purpose of this reconciliation, no adjustment is made to the Company in respect of any valuation adjustments to shares in subsidiary undertakings which would be eliminated on consolidation.
5 Investments of the Company
2011 £m
Shares in subsidiary
undertakings
Loans to subsidiary
undertakings
At 1 January 9,410 849 Transfer of investment in subsidiary undertaking (115) – Additional investment in subsidiary undertakings 1,607 – Loan advance – 339 Foreign exchange movement – 12
At 31 December 10,902 1,200
The transfer of investment in subsidiary undertaking relates to the sale of shares in a central subsidiary to another such company. The additional investment in subsidiary undertakings consists of £1,600 million in respect of a new central subsidiary, created as part of an internal restructuring, and £7 million in respect of share-based payments reflecting the value of payments settled by the Company for employees of its subsidiary undertakings in 2011.

375F
ina
ncia
l statem
en
tsP
arent co
mp
any
The principal subsidiary undertakings of the Company at 31 December 2011, all wholly-owned, were:
Main activity Country of incorporation
The Prudential Assurance Company Limited Insurance England and WalesPrudential Annuities Limited* Insurance England and WalesPrudential Retirement Income Limited (PRIL)* Insurance ScotlandM&G Investment Management Limited* Asset management England and WalesJackson National Life Insurance Company* Insurance USPrudential Assurance Company Singapore (Pte) Limited* Insurance Singapore
* Owned by a subsidiary undertaking of the Company.
Each subsidiary has one class of ordinary shares and operates mainly in its country of incorporation, except for PRIL which operates mainly in England and Wales. Details of all Prudential subsidiaries, joint ventures and associates will be annexed to the Company’s next Annual Returns filed with the UK Registrar of Companies and the Registrar of Companies in Hong Kong. 6 Deferred tax asset
2011 £m 2010 £m
Short-term timing differences 6 10Unused deferred tax losses 358 335
Total 364 345
For each category of deferred tax asset recognised, its recoverability against forecast taxable profits is not significantly impacted by expected changes to accounting standards. The UK government’s tax rate change to 25 per cent has had the effect of reducing the Company’s net deferred tax balance at 31 December 2011 by £29 million. The change to 25 per cent is effective from 1 April 2012 but is substantively enacted as at 31 December 2011. The subsequent proposed rate change to 23 per cent by 1 April 2014 is not expected to have a material effect on the deferred tax balance recognised at 31 December 2011.

376
Prudential plc Annual Report 2011
Financial statements | Notes on the parent company financial statements
Notes on the parent company financial statementscontinued
7 Borrowings
Core structural borrowings Other borrowings Total
2011 £m 2010 £m 2011 £m 2010 £m 2011 £m 2010 £m
Core structural borrowings: ¤500m 5.75% Subordinated Notes 2021note (i) – 428 – – – 428 £300m 6.875% Bonds 2023 300 300 – – 300 300 ¤20m Medium-Term Subordinated
Notes 2023note (ii) 17 17 – – 17 17 £250m 5.875% Bonds 2029 249 249 – – 249 249 £435m 6.125% Subordinated Notes 2031 428 428 – – 428 428 £400m 11.375% Subordinated Notes 2039 384 382 – – 384 382 US$1,000m 6.5% Perpetual Subordinated
Capital Securities 644 639 – – 644 639 US$250m 6.75% Perpetual Subordinated
Capital Securitiesnote (iii) 161 160 – – 161 160 US$300m 6.5% Perpetual Subordinated
Capital Securitiesnote (iii) 193 192 – – 193 192 US$750m 11.75% Perpetual Subordinated
Capital Securities 477 472 – – 477 472 US$550m 7.75% Perpetual Subordinated
Capital Securitiesnote (iii) 348 – – – 348 –
Total core structural borrowings 3,201 3,267 – – 3,201 3,267 Other borrowings: Commercial paper note (iv) – – 2,706 2,311 2,706 2,311 Floating Rate Notes 2012note (v) – – 200 200 200 200 Medium-Term Notes 2013note (iv) – – 250 249 250 249
Total borrowings 3,201 3,267 3,156 2,760 6,357 6,027
Borrowings are repayable as follows: Within 1 year or on demand – – 2,906 2,511 2,906 2,511 Between 1 and 5 years – – 250 249 250 249 After 5 years 3,201 3,267 – – 3,201 3,267
3,201 3,267 3,156 2,760 6,357 6,027
Recorded in the balance sheet as: Subordinated liabilitiesnote (vi) 2,652 2,718 Debenture loans 549 549
3,201 3,267
Notes(i) The €500 million 5.75 per cent borrowings were swapped into borrowings of £333 million with interest payable at six month £LIBOR plus
0.962 per cent. The borrowings were repaid in December 2011.(ii) The €20 million borrowings were issued at 20-year Euro Constant Maturity Swap (capped at 6.5 per cent). These borrowings have been swapped
into borrowings of £14 million with interest payable at three month £LIBOR plus 1.2 per cent.(iii) The US$250 million 6.75 per cent borrowings, the US$300 million 6.5 per cent borrowings and the US$550 million 7.75 per cent borrowings can
be converted, in whole or in part, at the Company’s option and subject to certain conditions, on any interest payment date into one or more series of Prudential preference shares.
(iv) These borrowings support a short-term fixed income securities programme.(v) The Company issued £200 million Floating Rate Notes in 2011 which mature in April 2012. All Notes have been subscribed to by a Group
subsidiary and accordingly have been eliminated on consolidation in the Group financial statements. These Notes were originally issued in October 2008 and have been reissued upon their maturity.
(vi) The interests of the holders of the Subordinated Notes and the Subordinated Capital Securities are subordinate to the entitlements of other creditors of the Company.

377F
ina
ncia
l statem
en
tsP
arent co
mp
any
8 Derivative financial instruments
2011 £m 2010 £m
Fair value
assetsFair value liabilities
Fair value assets
Fair value liabilities
Interest rate swaps – – 13 –Cross-currency swaps 3 – 99 –Inflation-linked swap – 207 – 146
Total 3 207 112 146
Derivative financial instruments are held to manage interest rate and currency profiles. The change in fair value of the derivative financial instruments of the Company was a loss before tax of £75 million (2010: loss before tax of £33 million). The Company’s derivative which swapped the interest rate and the currency profile of the ¤500 million subordinated notes settled in December 2011. The derivative financial instruments are valued internally using standard market practices. In accordance with the Company’s risk management framework, all internally generated valuations are subject to independent assessment against external counterparties’ valuations. 9 Pension scheme financial position
The majority of UK Prudential staff are members of the Group’s pension schemes. The largest scheme is the Prudential Staff Pension Scheme (the ‘Scheme’) which is primarily a closed defined benefit scheme. At 31 December 2011, on the FRS 17, ‘Retirement Benefits’ basis of valuation, the underlying pension liabilities of the Scheme accounted for 86 per cent (2010: 86 per cent) of the liabilities of the Group’s defined benefit schemes. For the purpose of preparing consolidated financial statements, the Group applies IFRS basis accounting including IAS 19, ‘Employee Benefits’. However, the individual accounts of the Company continue to follow UK GAAP including FRS 17. The FRS 17 disclosures are aligned with IAS 19. Under IFRS, the Group applies IFRIC 14, interpretation guidance to IAS 19 with the effect of derecognising the Group’s interest in the Scheme’s surplus and recognising an additional liability for the deficit funding obligation for the Scheme in the Group financial statements. Further details are described in note I3 ‘Staff and pension plans’ of the Group financial statements. At 31 December 2005, the allocation of surpluses and deficits attaching to the Scheme between the Company and the unallocated surplus of the PAC with-profits funds was apportioned in the ratio 30/70 between the Company and the PAC with-profits fund following detailed consideration of the sourcing of previous contributions. This ratio was applied to the base deficit position at 1 January 2006 and for the purpose of determining the allocation of the movements in that position up to 31 December 2011. The FRS 17 service charge and ongoing employer contributions are allocated by reference to the cost allocation for current activity. Defined benefit schemes are generally required to be subject to full actuarial valuation every three years to assess the appropriate level of funding for schemes having regard to their commitments. These valuations include assessments of the likely rate of return on the assets held within the separate trustee administered funds. The last completed actuarial valuation of the Scheme was as at 5 April 2008. This valuation demonstrated the Scheme to be 106 per cent funded by reference to the Scheme Solvency Target that forms the basis of the Scheme’s statutory funding objective. Accordingly, no formal deficit plan was required. However, in recognition of the fall in value of the Scheme’s investments between 5 April 2008 and the completion of the actuarial valuation in 2009, an additional funding akin to deficit funding was agreed by the Trustees. The total contributions currently being made by the Group into the Scheme, representing the annual accrual cost and deficit funding, are £50 million per annum. The current contributions will continue to be made until the next valuation as at 5 April 2011 is finalised later in 2012. In 2011, total employer contributions for the year, including expenses and augmentations, were £54 million (2010: £55 million). Using external actuarial advice provided by the professionally qualified actuaries, Towers Watson, for the valuation of the Scheme, the most recent full valuations have been updated to 31 December 2011 applying the principles prescribed by FRS 17.

378
Prudential plc Annual Report 2011
Financial statements | Notes on the parent company financial statements
Notes on the parent company financial statementscontinued
9 Pension scheme financial position continued
The key assumptions adopted were:
2011 % 2010 %
Rate of inflation: Retail price index (RPI) 2.9 3.55 Consumer price index (CPI) 1.9 n/aRate of increase in salaries 2.9 5.55 Rate of increase in pension payments for inflation: Guaranteed (maximum 5%) 2.5 3.55 Guaranteed (maximum 2.5%) 2.5 2.5 Discretionary 2.5 2.5 Rate used to discount Scheme liabilities 4.7 5.45
Long-term expected rate of return:
Prospectivelyfor 2012 % 2011 % 2010 %
Equities 6.8 8.2 8.5 Bonds 3.0 4.6 5.3 Properties 5.55 6.9 6.75 Other assets 2.0 4.75 4.75
Weighted average long-term expected rate of return 3.1 5.1 5.9
The long-term expected rates of return have been determined after applying due consideration to the requirements of paragraph 54 of FRS 17, in particular, taking account of the values of the assets. In July 2010, the UK government announced plans to use the CPI in place of the RPI in its determination of the statutory minimum pension increases for private sector occupational pension schemes. In December 2010, the government published the statutory revaluation order for 2011 which confirms the change to use CPI. Further, in December 2010, the government consulted on the impact of the switch from RPI to CPI on the private sector occupational pension schemes. In its response following the consultation published in June 2011, the government confirmed that it would not introduce legislation to override scheme rules which provide for pension increases/revaluation on a basis that is higher than the statutory minimum. Only those tranches of the Scheme which are subject to statutory increases in accordance with the Scheme rules were affected by the government’s decision to change the indexation from RPI to CPI. Other tranches of the Scheme were unaffected. During 2011, the Scheme communicated to its members the changes in basis from RPI to CPI in light of the government announcement. The change has the impact of reducing the Scheme liabilities by £216 million, of which £65 million is attributable to the Company. However, as the Company is only able to recognise a restricted FRS 17 surplus for the Scheme, this reduction in the Scheme liabilities has no effect on the profit or shareholders’ funds of the Company. Further details of the Scheme, including mortality assumptions, are shown in note I3 ‘Staff and pension plans’ of the Group financial statements.

379F
ina
ncia
l statem
en
tsP
arent co
mp
any
The assets and liabilities of the Scheme were:
31 Dec 2011 31 Dec 2010 31 Dec 2009 31 Dec 2008 31 Dec 2007
£m % £m % £m % £m % £m %
Equities 210 3.3 548 10.3 830 16.8 823 17.1 1,278 26.1 Bonds 5,547 86.2 3,864 72.2 3,406 68.8 2,430 50.6 1,134 23.2 Properties 297 4.6 199 3.7 272 5.5 283 5.9 545 11.2 Cash-like investments 378 5.9 740 13.8 441 8.9 1,267 26.4 1,932 39.5
Total value of assets 6,432 100.0 5,351 100.0 4,949 100.0 4,803 100.0 4,889 100.0 Present value of Scheme
liabilities (4,844) (4,866) (4,436) (4,075) (4,361)
Underlying surplus in the Scheme 1,588 485 513 728 528
Surplus in the Scheme recognised by the Company 52 56 52 50 163
Amounts reflected in the balance sheet of the Company, net of deferred tax 39 41 37 36 117
The surplus in the Scheme recognised in the balance sheet of the Company represents the element of the amount which is recoverable through reduced future contributions and is net of the apportionment to the PAC with-profits fund. Underlying Scheme liabilities and assetsThe change in the present value of the underlying Scheme liabilities and the change in the fair value of the underlying Scheme assets are as follows:
2011 £m 2010 £m
Present value of Scheme liabilities, at 1 January 4,866 4,436 Current service costs 22 25 Negative past service cost – RPI to CPI inflation measure change (216) – Interest costs 254 251 Employee contributions 1 1 Actuarial losses 131 369 Benefit payments (214) (216)
Present value of Scheme liabilities, at 31 December 4,844 4,866
2011 £m 2010 £m
Fair value of Scheme assets, at 1 January 5,351 4,949 Expected return on Scheme assets 267 287 Employee contributions 1 1 Employer contributions* 54 55 Actuarial gains 973 275 Benefit payments (214) (216)
Fair value of Scheme assets, at 31 December 6,432 5,351
* The contributions include deficit funding, ongoing service contributions, expenses and augmentations.

380
Prudential plc Annual Report 2011
Financial statements | Notes on the parent company financial statements
Notes on the parent company financial statementscontinued
9 Pension scheme financial position continued
Pension credit (charge) and actuarial (losses) gains of the SchemeThe pension credit (charge) recognised in the Company’s profit and loss account is as follows:
Pension credit (charge): 2011 £m 2010 £m
Operating charge: Current service costs (22) (25) Negative past service cost – RPI to CPI inflation measure change 216 – Finance income (expense): Interest on Scheme liabilities (254) (251) Expected return on Scheme assets 267 287 13 36
Total pension credit of the Scheme 207 11
Pension charge attributable to the Company (10) (6)
The pension charge attributable to the Company is net of the apportionment to the PAC with-profits fund and is related to the surplus recognised on the balance sheet of the Company. In 2011, an amount of £65 million was applied to extinguish the negative past service cost attributable to the Company from the unrecognised portion of the pension surplus at 31 December 2011.
Actuarial gains (losses): 2011 £m 2010 £m 2009 £m 2008 £m 2007 £m
Actual less expected return on Scheme assets (15% (2010: 5%) (2009: 2%) (2008: 5%) (2007: 0%) of assets) 973 275 85 (259) (12)
Experience gains (losses) on Scheme liabilities (6% (2010: 0%) (2009: 1%) (2008: 3%) (2007: 0%) of liabilities) 295 1 59 127 (10)
Changes in assumptions underlying the present value of
Scheme liabilities (426) (370) (374) 200 324
Total actuarial gains (losses) (17% (2010: 2%) (2009: 5%) (2008: 2%) (2007: 7%) of the present value of Scheme liabilities) 842 (94) (230) 68 302
Actuarial (losses) gains attributable to the Company before tax (16) (14) (3) (143) 91
The total actual return on Scheme assets was a gain of £1,240 million (2010: £562 million). The experience gains on Scheme liabilities in 2011 of £295 million related mainly to the ‘true-up’ reflecting improvements in data consequent upon the ongoing 2011 triennial valuation of the Scheme. Similarly, the experience gains of £127 million in 2008 were related mainly to the improvements in the data consequent to the 2008 triennial valuation. The actuarial gains (losses) attributable to the Company are net of the apportionment to the PAC with-profits fund and are related to the surplus recognised in the balance sheet of the Company. In 2011, the actuarial losses attributable to the Company included an amount charged of £268 million (2010: amount credited of £14 million) for the adjustment to the unrecognised portion of surplus which has not been deducted from the pension charge. The actuarial losses before tax of £16 million (2010: £14 million) attributable to the Company are recorded in the statement of total recognised gains and losses. Cumulative actuarial gains as at 31 December 2011 amount to £58 million (2010: £74 million). Total employer contributions expected to be paid into the Scheme for the year ending 31 December 2012 amount to £54 million, reflecting the annual accrual cost and deficit funding, and expenses. However, this is subject to a reassessment when the valuation as at 5 April 2011 is completed later in 2012.

381F
ina
ncia
l statem
en
tsP
arent co
mp
any
10 Share capital and share premium
A summary of the ordinary shares in issue is set out below:
Issued shares of 5 pence each fully paid
2011
Number of ordinary
shares
Share capital
£m
Share premium
£m
At 1 January 2,545,594,506 127 1,856 Shares issued under share option schemes 2,444,824 – 17
At 31 December 2,548,039,330 127 1,873
At 31 December 2011, there were options to subscribe for 13,329,709 (2010: 12,802,482) shares at prices ranging from 288 pence to 572 pence (2010: 288 pence to 572 pence) and exercisable by the year 2017 (2010: 2016). Further information on the Group’s employee share options is given in note I4 ‘Share-based payments’ of the Group financial statements. 11 Profit of the Company and reconciliation of the movement in shareholders’ funds
The profit after tax of the Company for the year was £3,720 million (2010: £881 million). After dividends of £642 million (2010: £511 million), actuarial losses net of tax in respect of the pension scheme of £12 million (2010: £10 million), share-based payment credits of £7 million (2010: £6 million) and scrip dividends of £nil (2010: £62 million), retained profit at 31 December 2011 amounted to £5,357 million (2010: £2,284 million). During the year, the Company received dividends from its subsidiary undertakings of £4,002 million. Included within this amount was £2,734 million relating to gains made by an intermediate holding company following the transfer at fair value of certain of its subsidiaries to other parts of the Group as part of an internal restructuring exercise. Because the gains relate to intragroup transactions, the amount of £2,734 million is not able to be regarded as part of the distributable reserves of the parent company. Under English company law, Prudential may pay dividends only if sufficient distributable reserves of the Company are available for the purpose and if the amount of its net assets is greater than the aggregate of its called up share capital and undistributable reserves (such as for example the share premium account) and the payment of the dividend does not reduce the amount of its net assets to less than that aggregate. At 31 December 2011, the UK GAAP retained earnings of the holding company from which distributable reserves may be derived were £5,357 million. A reconciliation of the movement in shareholders’ funds of the Company for the years ended 31 December 2011 and 2010 is given below:
2011 £m 2010 £m
Profit for the yearnote 4 3,720 881 Dividends (642) (511)
3,078 370 Actuarial losses recognised in respect of the pension scheme net of related taxnote 9 (12) (10)Share-based paymentsnote 5 7 6 New share capital subscribednote 10 17 75
Net increase in shareholders’ funds 3,090 441 Shareholders’ funds at beginning of year 4,267 3,826
Shareholders’ funds at end of year note 4 7,357 4,267

382
Prudential plc Annual Report 2011
Financial statements | Notes on the parent company financial statements
Notes on the parent company financial statementscontinued
12 Other information
a Information on directors’ remuneration is given in the directors’ remuneration report section of this Annual Report and note I5 ‘Key management remuneration’ of the Group financial statements.
b Information on transactions of the directors with the Group is given in note I7 ‘Related party transactions’ of the Group financial statements.
c The Company employs no staff.d Fees payable to the Company’s auditor for the audit of the Company’s annual accounts were £0.1 million (2010: £0.1 million).
The Company paid no fees for other services (2010: £6.0 million). e In certain instances the Company has guaranteed that its subsidiaries will meet their obligations when they fall due for payment. 13 Post balance sheet events
In January 2012, as part of an internal restructuring, the Company transferred at fair value interests of £3,889 million in shares in a central subsidiary and £2,007 million in loans to a second such subsidiary to another central subsidiary in exchange for shares issued by that subsidiary. No profit or loss arose on the transfers. Subject to shareholders’ approval, a final dividend for 2011 of 17.24 pence per ordinary share will be paid on 24 May 2012 in sterling to shareholders on the principal and Irish branch registers at 6.00pm BST on Friday, 30 March 2012 (the ‘Record Date’), and in Hong Kong dollars to shareholders on the Hong Kong branch register at 4.30pm Hong Kong time on the Record Date (‘HK Shareholders’). Holders of US American Depositary Receipts will be paid their dividend in US dollars on or about five days after the payment date of the dividend to shareholders on the principal register. The dividend will be paid on or about 31 May 2012 in Singapore dollars to shareholders with shares standing to the credit of their securities accounts with The Central Depository (Pte) Limited (CDP) at 5.00pm Singapore time on the Record Date (‘SG Shareholders’). The dividend payable to the HK Shareholders will be translated at the exchange rate ruling at the close of business on 12 March 2012. The exchange rate at which the dividend payable to the SG Shareholders will be translated will be determined by the CDP. The dividend will distribute an estimated £439 million of shareholders’ funds. In line with 2010, shareholders on the principal register and Irish branch register will be able to participate in a Dividend Reinvestment Plan.

383F
ina
ncia
l statem
en
tsFinancial statements | Statement of directors’ responsibilities
Directo
rs’ respo
nsib
ilities/au
dito
r’s repo
rt
Statement of directors’ responsibilities in respect of the annual report and the financial statements
The directors are responsible for preparing the Annual Report and the Group and parent company financial statements in accordance with applicable law and regulations.
Company law requires the directors to prepare Group and parent company financial statements for each financial year. Under that law the directors are required to prepare the Group financial statements in accordance with International Financial Reporting Standards (IFRS) as adopted by the European Union (EU) and applicable law and have elected to prepare the parent company financial statements in accordance with UK Accounting Standards and applicable law (UK Generally Accepted Accounting Practice).
Under company law the directors must not approve the financial statements unless they are satisfied that they give a true and fair view of the state of affairs of the Group and parent company and of their profit or loss for that period. In preparing each of the Group and parent company financial statements, the directors are required to:
• Select suitable accounting policies and then apply them consistently;
• make judgements and estimates that are reasonable and prudent;
• for the Group financial statements, state whether they have been prepared in accordance with IFRS as adopted by the EU;
• for the parent company financial statements, state whether applicable UK Accounting Standards have been followed, subject to any material departures disclosed and explained in the parent company financial statements; and
• prepare the financial statements on the going concern basis unless it is inappropriate to presume that the Group and the parent company will continue in business.
The directors are responsible for keeping adequate accounting records that are sufficient to show and explain the parent company’s transactions and disclose with reasonable accuracy at any time the financial position of the parent company and enable them to ensure that its financial statements comply with the Companies Act 2006. They have general responsibility for taking such steps as are reasonably open to them to safeguard the assets of the Group and to prevent and detect fraud and other irregularities.
Under applicable law and regulations, the directors are also responsible for preparing a directors’ report, directors’ remuneration report and corporate governance statement that comply with that law and those regulations.
The directors are responsible for the maintenance and integrity of the corporate and financial information included on the Company’s website. Legislation in the UK governing the preparation and dissemination of financial statements may differ from legislation in other jurisdictions.
The directors of Prudential plc, whose names and positions are set out on pages 108 to 112 confirm that to the best of their knowledge:
• The financial statements, prepared in accordance with the applicable set of accounting standards, give a true and fair view of the assets, liabilities, financial position and profit or loss of the Company and the undertakings included in the consolidation taken as a whole; and
• the directors’ report includes a fair review of the development and performance of the business and the position of the Company and the undertakings included in the consolidation taken as a whole, together with a description of the principal risks and uncertainties that they face.

384
Prudential plc Annual Report 2011
Financial statements | Independent auditor’s report
Independent auditor’s report to the members of Prudential plc
We have audited the financial statements of Prudential plc for the year ended 31 December 2011 set out on pages 163 to 382 . The financial reporting framework that has been applied in the preparation of the Group financial statements is applicable law and International Financial Reporting Standards (IFRSs) as adopted by the EU. The financial reporting framework that has been applied in the preparation of the parent company financial statements is applicable law and UK Accounting Standards (UK Generally Accepted Accounting Practice).
This report is made solely to the Company’s members, as a body, in accordance with Chapter 3 of Part 16 of the Companies Act 2006. Our audit work has been undertaken so that we might state to the Company’s members those matters we are required to state to them in an auditor’s report and for no other purpose. To the fullest extent permitted by law, we do not accept or assume responsibility to anyone other than the Company and the Company’s members, as a body, for our audit work, for this report, or for the opinions we have formed.
Respective responsibilities of directors and auditorAs explained more fully in the Directors’ Responsibilities Statement set out on page 383, the directors are responsible for the preparation of the financial statements and for being satisfied that they give a true and fair view. Our responsibility is to audit, and express an opinion on, the financial statements in accordance with applicable law and International Standards on Auditing (UK and Ireland). Those standards require us to comply with the Auditing Practices Board’s (APB’s) Ethical Standards for Auditors.
Scope of the audit of the financial statementsA description of the scope of an audit of financial statements is provided on the APB’s website at www.frc.org.uk/apb/scope/private.cfm
Opinion on financial statementsIn our opinion:
• the financial statements give a true and fair view of the state of the Group’s and of the parent company’s affairs as at 31 December 2011 and of the Group’s profit for the year then ended;
• the Group financial statements have been properly prepared in accordance with IFRSs as adopted by the EU;
• the parent company financial statements have been properly prepared in accordance with UK Generally Accepted Accounting Practice;
• the financial statements have been prepared in accordance with the requirements of the Companies Act 2006; and, as regards the Group financial statements, Article 4 of the IAS Regulation.
Opinion on other matters prescribed by the Companies Act 2006In our opinion:
• the part of the Directors’ Remuneration Report to be audited has been properly prepared in accordance with the Companies Act 2006; and
• the information given in the Directors’ Report for the financial year for which the financial statements are prepared is consistent with the financial statements.
Matters on which we are required to report by exceptionWe have nothing to report in respect of the following:
Under the Companies Act 2006 we are required to report to you if, in our opinion:
• adequate accounting records have not been kept by the parent company, or returns adequate for our audit have not been received from branches not visited by us; or
• the parent company financial statements and the part of the Directors’ Remuneration Report to be audited are not in agreement with the accounting records and returns; or
• certain disclosures of directors’ remuneration specified by law are not made; or
• we have not received all the information and explanations we require for our audit.
Under the Listing Rules we are required to review:
• the directors’ statement, set out on page 130, in relation to going concern;
• the part of the Corporate Governance Statement set out in the Governance report relating to the Company’s compliance with the nine provisions of the UK Corporate Governance Code specified for our review; and
• certain elements of the report to shareholders by the Board on directors’ remuneration.
G BainbridgeSenior Statutory Auditor
for and on behalf of KPMG Audit Plc, Statutory Auditor Chartered Accountants London
12 March 2012

385F
ina
ncia
l statem
en
tsE
EV
basis su
pp
lemen
tary
info
rmatio
nFinancial statements | European Embedded Value (EEV) basis supplementary information
Operating profit based on longer-term investment returnsnote (i)
Results analysis by business area
Note
2011 £m 2010 £m note (vi)
Asian operations New business: Excluding Japan 2 1,076 902 Japannote (v) – (1)
Total 1,076 901 Business in force 3 688 549
Long-term business 1,764 1,450 Eastspring Investments 80 72 Development expenses (5) (4)
Total 1,839 1,518
US operations New business 2 815 761 Business in force 3 616 697
Long-term business 1,431 1,458 Broker-dealer and asset management 24 22
Total 1,455 1,480
UK operations New business 2 260 365 Business in force 3 593 571
Long-term business 853 936 General insurance commission 40 46
Total UK insurance operations 893 982 M&G 357 284
Total 1,250 1,266
Other income and expenditure Investment return and other income 22 30 Interest payable on core structural borrowings (286) (257) Corporate expenditure (219) (223) Unwind of expected asset management marginnote (ii) (53) (44)
Total (536) (494)
RPI to CPI inflation measure change on defined benefit pension schemesnote (iii) 45 – Solvency II implementation costsnote (iv) (56) (46) Restructuring costsnote (iv) (19) (28)
Operating profit based on longer-term investment returnsnote (i) 3,978 3,696
Analysed as profits (losses) from: New business: Excluding Japan 2 2,151 2,028 Japannote (v) – (1)
Total 2,151 2,027 Business in force 3 1,897 1,817
Long-term business 4,048 3,844 Asset management 461 378 Other results (531) (526)
Total 3,978 3,696
European Embedded Value (EEV) basis results

386
Prudential plc Annual Report 2011
Financial statements | European Embedded Value (EEV) basis supplementary information
European Embedded Value (EEV) basis resultscontinued
Notes(i) EEV basis operating profit based on longer-term investment returns excludes the recurrent items of short-term fluctuations in investment
returns, the mark to market value movements on core borrowings, the shareholders’ share of actuarial and other gains and losses on defined benefit pension schemes, and the effect of changes in economic assumptions. In addition for 2010, operating profit excluded costs associated with the terminated AIA transaction and the gain arising upon the dilution of the Group’s holding in PruHealth. The amounts for these items are included in total EEV profit attributable to shareholders. The Company believes that operating profit, as adjusted for these items, better reflects underlying performance. Profit before tax and basic earnings per share include these items together with actual investment returns. This basis of presentation has been adopted consistently throughout this supplementary information.
(ii) The value of future profits or losses from asset management and service companies that support the Group’s covered businesses are included in the profits for new business and the in-force value of the Group’s long-term business. The results of the Group’s asset management operations include the profits from the management of internal and external funds. For EEV basis reporting, Group shareholders’ other income is adjusted to deduct the unwind of the expected margin for the year arising from the management of the assets of the covered business (as defined in note 1(a)). The deduction is on a basis consistent with that used for projecting the results for covered business. Group operating profit accordingly includes the variance between actual and expected profit in respect of covered business.
(iii) In 2011 the Group altered its inflation measure basis for future statutory increases to pension payments for certain tranches of its UK defined benefit pension schemes. This reflects the UK Government’s decision to replace the basis of indexation from RPI with CPI. This resulted in a credit to operating profit for 2011 on an IFRS basis of £42 million and an additional £3 million recognised on the EEV basis.
(iv) Restructuring costs comprise the charge of £(16) million recognised on an IFRS basis and an additional £(3) million recognised on the EEV basis for the shareholders’ share of restructuring costs incurred by the PAC with-profits fund. Solvency II implementation costs comprise the charge of £(55) million recognised on an IFRS basis and an additional £(1) million recognised on the EEV basis.
(v) For 2010, new business profits for the Group’s Japanese insurance subsidiary, which ceased writing new business with effect from 15 February 2010, have been presented separately from those of the remainder of the Group.
(vi) The comparative results have been prepared using previously reported average exchange rates for the year.

387F
ina
ncia
l statem
en
tsE
EV
basis su
pp
lemen
tary
info
rmatio
n
Summarised consolidated income statement
Note 2011 £m 2010 £m
Operating profit based on longer-term investment returns Asian operations 1,839 1,518 US operations 1,455 1,480 UK operations: UK insurance operations 893 982 M&G 357 284 1,250 1,266 Other income and expenditure (536) (494)RPI to CPI inflation measure change on defined benefit pension schemes 45 – Solvency II implementation costs (56) (46)Restructuring costs (19) (28)
Operating profit based on longer-term investment returns 3,978 3,696 Short-term fluctuations in investment returns 5 (907) (30)Mark to market value movements on core borrowings 9 (14) (164)Shareholders’ share of actuarial and other gains and losses on defined benefit
pension schemes 23 (11)Effect of changes in economic assumptions 6 (158) (10)Costs of terminated AIA transaction 4 – (377)Gain on dilution of Group holdings 13 – 3
Profit before tax attributable to shareholders (including actual investment returns) 2,922 3,107 Tax attributable to shareholders’ profit 11 (776) (530)
Profit for the year 2,146 2,577
Attributable to: Equity holders of the Company 2,142 2,573 Non-controlling interests 4 4
Profit for the year 2,146 2,577

388
Prudential plc Annual Report 2011
Financial statements | European Embedded Value (EEV) basis supplementary information
European Embedded Value (EEV) basis resultscontinued
Earnings per share (in pence)
Note 2011 2010
Based on operating profit based on longer-term investment returns, after related tax and non-controlling interests of £2,930 million (2010: £2,700 million*) 12 115.7p 106.9p
Based on profit after tax and non-controlling interests of £2,142 million (2010: £2,573 million) 12 84.6p 101.9p
* Operating earnings per share for 2010 has been determined after excluding an exceptional tax credit of £158 million which primarily related to the impact of a settlement agreed with the UK tax authorities – see note 11.
Dividends per share (in pence)
2011 2010
Dividends relating to reporting year: Interim dividend 7.95p 6.61p Final dividend 17.24p 17.24p
Total 25.19p 23.85p
Dividends declared and paid in reporting year: Current year interim dividend 7.95p 6.61p Final/second interim dividend for prior year 17.24p 13.56p
Total 25.19p 20.17p
Movement in shareholders’ equity (excluding non-controlling interests)
Note 2011 £m 2010 £m
Profit for the year attributable to equity shareholders 2,142 2,573 Items taken directly to equity: Exchange movements on foreign operations and net investment hedges: Exchange movements arising during the year (90) 659 Related tax (68) 34 Dividends (642) (511) New share capital subscribed (including shares issued in lieu of cash dividends) 17 75 Reserve movements in respect of share-based payments 44 37 Treasury shares: Movement in own shares in respect of share-based payment plans (30) (4) Movement in Prudential plc shares purchased by unit trusts consolidated under IFRS (5) 3 Mark to market value movements on Jackson assets backing surplus and required capital: Mark to market value movements arising during the year 96 105 Related tax (34) (37)
Net increase in shareholders’ equity 10 1,430 2,934 Shareholders’ equity at beginning of year (excluding non-controlling interests) 7,10 18,207 15,273
Shareholders’ equity at end of year (excluding non-controlling interests) 7,10 19,637 18,207

389F
ina
ncia
l statem
en
tsE
EV
basis su
pp
lemen
tary
info
rmatio
n
2011 £m 2010 £m
Comprising: Note
Long-term business
operations
Asset management
and other operations Total
Long-term business
operations
Asset management
and other operations Total
Asian operations: Net assets of operations 8,510 211 8,721 7,445 197 7,642 Acquired goodwill 235 61 296 236 61 297
7 8,745 272 9,017 7,681 258 7,939
US operations: Net assets of operations 5,082 113 5,195 4,799 106 4,905 Acquired goodwill – 16 16 – 16 16
7 5,082 129 5,211 4,799 122 4,921
UK insurance operations: Net assets of operations 7 6,058 29 6,087 5,970 33 6,003 M&G: Net assets of operations – 229 229 – 254 254 Acquired goodwill – 1,153 1,153 – 1,153 1,153
7 – 1,382 1,382 – 1,407 1,407
6,058 1,411 7,469 5,970 1,440 7,410
Other operations: Holding company net borrowings at market value 9 – (2,188) (2,188) – (2,212) (2,212) Other net assets – 128 128 – 149 149
7 – (2,060) (2,060) – (2,063) (2,063)
Shareholders’ equity at end of year (excluding non-controlling interests) 7 19,885 (248) 19,637 18,450 (243) 18,207
Representing: Net assets 19,650 (1,478) 18,172 18,214 (1,473) 16,741 Acquired goodwill 235 1,230 1,465 236 1,230 1,466
19,885 (248) 19,637 18,450 (243) 18,207

390
Prudential plc Annual Report 2011
Financial statements | European Embedded Value (EEV) basis supplementary information
European Embedded Value (EEV) basis resultscontinued
Net asset value per share (in pence)
2011 2010
Based on EEV basis shareholders’ equity of £19,637 million (2010: £18,207 million) 771p 715pNumber of issued shares at year end (millions) 2,548 2,546
Return on embedded value* 16% 18%
* Return on embedded value is based on EEV operating profit after related tax and non-controlling interests as a percentage of opening EEV basis shareholders’ equity. The 2010 return has been determined after excluding an exceptional tax credit of £158 million, which primarily related to the impact of a settlement agreed with the UK tax authorities.
Summary statement of financial position
Note 2011 £m 2010 £m
Total assets less liabilities, before deduction for insurance funds 243,760 231,667 Less insurance funds:* Policyholder liabilities (net of reinsurers’ share) and unallocated
surplus of with-profits funds (234,643) (223,636) Less shareholders’ accrued interest in the long-term business 10,520 10,176
(224,123) (213,460)
Total net assets 7,10 19,637 18,207
Share capital 127 127 Share premium 1,873 1,856 IFRS basis shareholders’ reserves 7,117 6,048
Total IFRS basis shareholders’ equity 7 9,117 8,031 Additional EEV basis retained profit 7 10,520 10,176
Total EEV basis shareholders’ equity (excluding non-controlling interests) 7,10 19,637 18,207
* Including liabilities in respect of insurance products classified as investment contracts under IFRS 4.
The supplementary information on pages 385 to 432 was approved by the Board of directors on 12 March 2012 and signed on its behalf.
Harvey McGrath Tidjane Thiam Nic NicandrouChairman Group Chief Executive Chief Financial Officer

391F
ina
ncia
l statem
en
tsE
EV
basis su
pp
lemen
tary
info
rmatio
n
Notes on the EEV basis results
1 Basis of preparation, methodology and accounting presentation
The EEV basis results have been prepared in accordance with the EEV Principles issued by the European Insurance CFO Forum in May 2004 and expanded by the Additional Guidance on EEV disclosures published in October 2005. Where appropriate, the EEV basis results include the effects of adoption of International Financial Reporting Standards (IFRS). The directors are responsible for the preparation of the supplementary information in accordance with the EEV Principles.
a Covered businessThe EEV results for the Group are prepared for ‘covered business’, as defined by the EEV Principles. Covered business represents the Group’s long-term insurance business for which the value of new and in-force contracts is attributable to shareholders. The EEV basis results for the Group’s covered business are then combined with the IFRS basis results of the Group’s other operations. The definition of long-term business operations is consistent with previous practice and comprises those contracts falling under the definition of long-term insurance business for regulatory purposes together with, for US operations, contracts that are in substance the same as guaranteed investment contracts (GICs) but do not fall within the technical definition. Under the EEV Principles, the results for covered business incorporate the projected margins of attaching internal asset management. With two principal exceptions, covered business comprises the Group’s long-term business operations. The principal exceptions are for the closed Scottish Amicable Insurance Fund (SAIF) and for the presentational treatment of the financial position of the Group’s principal defined benefit pension scheme, the Prudential Staff Pension Scheme (PSPS). A small amount of UK group pensions business is also not modelled for EEV reporting purposes. SAIF is a ring-fenced sub-fund of the Prudential Assurance Company (PAC) long-term fund, established by a Court approved Scheme of Arrangement in October 1997. SAIF is closed to new business and the assets and liabilities of the fund are wholly attributable to the policyholders of the fund. The PSPS deficit funding liability attaching to the shareholder-backed business is included in the total for Other operations, reflecting the fact that the deficit funding is being paid for by the parent company, Prudential plc. The changes in financial position of the Scottish Amicable and M&G pension scheme are reflected in the EEV results for UK insurance operations and Other operations respectively.
b Methodology(i) Embedded valueOverviewThe embedded value is the present value of the shareholders’ interest in the earnings distributable from assets allocated to covered business after sufficient allowance has been made for the aggregate risks in that business. The shareholders’ interest in the Group’s long-term business comprises:
• present value of future shareholder cash flows from in-force covered business (value of in-force business), less deductions for: – the cost of locked-in required capital, – the time value of cost of options and guarantees,
• locked-in required capital, and• shareholders’ net worth in excess of required capital (free surplus).
The value of future new business is excluded from the embedded value. Notwithstanding the basis of presentation of results (as explained in note 1(c)(iv)) no smoothing of market or account balance values, unrealised gains or investment return is applied in determining the embedded value or profit before tax. Separately, the analysis of profit is delineated between operating profit based on longer-term investment returns and other constituent items, as explained in note 1(c)(i).
Valuation of in-force and new businessThe embedded value results are prepared incorporating best estimate assumptions about all relevant factors including levels of future investment returns, expenses, persistency and mortality. These assumptions are used to project future cash flows. The present value of the future cash flows is then calculated using a discount rate which reflects both the time value of money and the non-diversifiable risks associated with the cash flows that are not otherwise allowed for.
Best estimate assumptionsBest estimate assumptions are used for the cash flow projections, where best estimate is defined as the mean of the distribution of future possible outcomes. The assumptions are reviewed actively and changes are made when evidence exists that material changes in future experience are reasonably certain. Assumptions required in the calculation of the value of options and guarantees, for example relating to volatilities and correlations, or dynamic algorithms linking liabilities to assets, have been set equal to the best estimates and, wherever material and practical, reflect any dynamic relationships between the assumptions and the stochastic variables.

392
Prudential plc Annual Report 2011
Financial statements | European Embedded Value (EEV) basis supplementary information
1 Basis of preparation, methodology and accounting presentation continued
Principal economic assumptionsThe EEV basis results for the Group’s operations have been determined using economic assumptions where the long-term expected rates of return on investments and risk discount rates are set by reference to year end rates of return on government bonds (the ‘active’ basis). Expected returns on equity and property asset classes are derived by adding a risk premium, based on the long-term view of Prudential’s economists, to the risk-free rate. The total profit that emerges over the lifetime of an individual contract as calculated using the embedded value basis is the same as that calculated under the IFRS basis. Since the embedded value basis reflects discounted future cash flows, under this methodology the profit emergence is advanced, thus more closely aligning the timing of the recognition of profits with the efforts and risks of current management actions, particularly with regard to business sold during the year.
New businessThe contribution from new business represents profits determined by applying operating assumptions as at the end of the year. In determining the new business contribution for UK immediate annuity business, which is interest rate sensitive, it is appropriate to use assumptions reflecting point of sale market conditions, consistent with how the business is priced. For other business within the Group, end of period economic assumptions are used.
Valuation movements on investmentsWith the exception of debt securities held by Jackson, investment gains and losses during the year (to the extent that changes in capital values do not directly match changes in liabilities) are included directly in the profit for the year and shareholders’ equity as they arise. The results for any covered business conceptually reflects the aggregate of the IFRS results and the movements on the additional shareholders’ interest recognised on the EEV basis. Thus the start point for the calculation of the EEV results for Jackson, as for other businesses, reflects the market value movements recognised on the IFRS basis. However, in determining the movements on the additional shareholders’ interest, the basis for calculating the Jackson EEV result acknowledges that for debt securities backing liabilities the aggregate EEV results reflect the fact that the value of in-force business instead incorporates the discounted value of future spread earnings. This value is not affected generally by short-term market movements on securities that are, broadly speaking, held for the longer-term. Fixed income securities backing the free surplus and required capital for Jackson are accounted for at fair value. However, consistent with the treatment applied under IFRS for Jackson securities classified as available-for-sale, movements in unrealised appreciation on these securities are accounted for in equity rather than in the income statement, as shown in the movement in shareholders’ equity.
Cost of capitalA charge is deducted from the embedded value for the cost of capital supporting the Group’s long-term business. This capital is referred to as required capital. The cost is the difference between the nominal value of the capital and the discounted value of the projected releases of this capital allowing for investment earnings (net of tax) on the capital. The annual result is affected by the movement in this cost from year-to-year which comprises a charge against new business profit and generally a release in respect of the reduction in capital requirements for business in force as this runs off. Where required capital is held within a with-profits long-term fund, the value placed on surplus assets in the fund is already discounted to reflect its release over time and no further adjustment is necessary in respect of required capital. Financial options and guaranteesNature of options and guarantees in Prudential’s long-term businessAsian operationsSubject to local market circumstances and regulatory requirements, the guarantee features described below in respect of UK business broadly apply to similar types of participating contracts principally written in the PAC Hong Kong branch, Singapore and Malaysia. Participating products have both guaranteed and non-guaranteed elements. There are also various non-participating long-term products with guarantees. The principal guarantees are those for whole of life contracts with floor levels of policyholder benefits that accrue at rates set at inception and do not vary subsequently with market conditions.
Notes on the EEV basis resultscontinued

393F
ina
ncia
l statem
en
tsE
EV
basis su
pp
lemen
tary
info
rmatio
n
US operations (Jackson)The principal options and guarantees in Jackson are associated with the fixed annuity and variable annuity (VA) lines of business. Fixed annuities provide that, at Jackson’s discretion, it may reset the interest rate credited to policyholders’ accounts, subject to a guaranteed minimum. The guaranteed minimum return varies from 1.0 per cent to 5.5 per cent (2010: 1.5 per cent to 5.5 per cent), depending on the particular product, jurisdiction where issued, and date of issue. At 31 December 2011, 85 per cent (2010: 83 per cent) of the account values on fixed annuities relates to policies with guarantees of 3 per cent or less. The average guarantee rate is 2.8 per cent for 2011 (2010: 2.9 per cent). Fixed annuities also present a risk that policyholders will exercise their option to surrender their contracts in periods of rapidly rising interest rates, possibly requiring Jackson to liquidate assets at an inopportune time. Jackson issues VA contracts where it contractually guarantees to the contract holder either: a) return of no less than total deposits made to the contract adjusted for any partial withdrawals, b) total deposits made to the contract adjusted for any partial withdrawals plus a minimum return, or c) the highest contract value on a specified anniversary date adjusted for any withdrawals following the specified contract anniversary. These guarantees include benefits that are payable at specified dates during the accumulation period (Guaranteed Minimum Withdrawal Benefit (GMWB)), as death benefits (Guaranteed Minimum Death Benefits (GMDB)) or as income benefits (Guaranteed Minimum Income Benefits (GMIB)). Jackson reinsures and hedges these risks using equity options and futures contracts. These guarantees generally protect the policyholder’s value in the event of poor equity market performance. Jackson also issues fixed index annuities that enable policyholders to obtain a portion of an equity-linked return while providing a guaranteed minimum return. The guaranteed minimum returns would be of a similar nature to those described above for fixed annuities.
UK insurance operationsThe only significant financial options and guarantees in the UK insurance operations arise in the with-profits fund and SAIF. With-profits products provide returns to policyholders through bonuses that are smoothed. There are two types of bonuses: annual and final. Annual bonuses are declared once a year and, once credited, are guaranteed in accordance with the terms of the particular product. Unlike annual bonuses, final bonuses are guaranteed only until the next bonus declaration. The with-profits fund also held a provision on the Pillar I Peak 2 basis of £90 million at 31 December 2011 (2010: £24 million) to honour guarantees on a small amount of guaranteed annuity option products. Beyond the generic features and the provisions held in respect of guaranteed annuities described above, there are very few explicit options or guarantees of the with-profits fund such as minimum investment returns, surrender values, or annuity values at retirement and any granted have generally been at very low levels. At 31 December 2011, guarantees on certain with-profits deferred annuity business were in the money as a result of the low level of interest rates at that date. The Group’s main exposure to guaranteed annuity options in the UK is through SAIF and a provision on the Pillar I Peak 2 basis of £370 million (2010: £336 million) was held in SAIF at 31 December 2011 to honour the guarantees. As SAIF is a separate sub-fund of the PAC long-term fund which is attributable to policyholders of the fund, the movement in the provision has no direct impact on shareholders.
Time valueThe value of financial options and guarantees comprises two parts. One is given by a deterministic valuation on best estimate assumptions (the intrinsic value). The other part arises from the variability of economic outcomes in the future (the time value). Where appropriate, a full stochastic valuation has been undertaken to determine the time value of the financial options and guarantees. The economic assumptions used for the stochastic calculations are consistent with those used for the deterministic calculations. Assumptions specific to the stochastic calculations reflect local market conditions and are based on a combination of actual market data, historic market data and an assessment of long-term economic conditions. Common principles have been adopted across the Group for the stochastic asset models, for example, separate modelling of individual asset classes but with an allowance for correlation between the various asset classes. Details of the key characteristics of each model are given in note 17(a).
(ii) Level of required capitalIn adopting the EEV Principles, Prudential has based required capital on its internal targets for economic capital subject to it being at least the local statutory minimum requirements. Economic capital is assessed using internal models but, when applying the EEV Principles, Prudential does not take credit for the significant diversification benefits that exist within the Group. For with-profits business written in a segregated life fund, as is the case in Asia and the UK, the capital available in the fund is sufficient to meet the required capital requirements. For shareholder-backed business the following capital requirements apply:
• Asian operations: the level of required capital has been set at the higher of local statutory requirements and the economic capital requirement;
• US operations: the level of required capital has been set to an amount at least equal to 235 per cent of the risk-based capital required by the National Association of Insurance Commissioners (NAIC) at the Company Action Level (CAL); and
• UK insurance operations: the capital requirements are set at the higher of Pillar I and Pillar II requirements for shareholder-backed business of UK insurance operations as a whole, which for 2011 and 2010 was Pillar I.

394
Prudential plc Annual Report 2011
Financial statements | European Embedded Value (EEV) basis supplementary information
1 Basis of preparation, methodology and accounting presentation continued
(iii) Allowance for risk and risk discount ratesOverviewUnder the EEV Principles, discount rates used to determine the present value of future cash flows are set equal to risk-free rates plus a risk margin. The risk margin should reflect any non-diversifiable risk associated with the emergence of distributable earnings that is not allowed for elsewhere in the valuation. Prudential has selected a granular approach to better reflect differences in market risk inherent in each product group. The risk discount rate so derived does not reflect an overall Group market beta but instead reflects the expected volatility associated with the cash flows for each product category in the embedded value model. Since financial options and guarantees are explicitly valued under the EEV methodology, discount rates under EEV are set excluding the effect of these product features. The risk margin represents the aggregate of the allowance for market risk, additional allowance for credit risk where appropriate, and allowance for non-diversifiable non-market risk. No allowance is required for non-market risks where these are assumed to be fully diversifiable. The majority of non-market and non-credit risks are considered to be diversifiable.
Market risk allowanceThe allowance for market risk represents the beta multiplied by an equity risk premium. Except for UK shareholder-backed annuity business (as explained below) such an approach has been used for all of the Group’s businesses. The beta of a portfolio or product measures its relative market risk. The risk discount rates reflect the market risk inherent in each product group and hence the volatility of product cash flows. These are determined by considering how the profits from each product are affected by changes in expected returns on various asset classes. By converting this into a relative rate of return it is possible to derive a product specific beta. Product level betas reflect the most recent product mix to produce appropriate betas and risk discount rates for each major product grouping.
Additional credit risk allowanceThe Group’s methodology is to allow appropriately for credit risk. The allowance for total credit risk is to cover:
• expected long-term defaults,• credit risk premium (to reflect the volatility in downgrade and default levels), and• short-term downgrades and defaults.
These allowances are initially reflected in determining best-estimate returns and through the market risk allowance described above. However, for those businesses which are largely backed by holdings of debt securities, these allowances in the projected returns and market risk allowances may not be sufficient and an additional allowance may be appropriate. The practical application of the allowance for credit risk varies depending upon the type of business as described below.
Asian operations For Asian operations, the allowance for credit risk incorporated in the projected rates of return and the market risk allowance are sufficient. Accordingly, no additional allowance for credit risk is required.
US business (Jackson)For Jackson business, the allowance for long-term defaults is reflected in the Risk Margin Reserve (RMR) charge which is deducted in determining the projected spread margin between the earned rate on the investments and the policyholder crediting rate. The risk discount rate incorporates an additional allowance for credit risk premium and short-term downgrades and defaults. In determining this allowance a number of factors have been considered. These factors, in particular, include:
• How much of the credit spread on debt securities represents an increased credit risk not reflected in the RMR long-term default assumptions, and how much is liquidity premium. In assessing this effect, consideration has been given to a number of approaches to estimating the liquidity premium by considering recent statistical data; and
• Policyholder benefits for Jackson fixed annuity business are not fixed. It is possible in adverse economic scenarios to pass on a component of credit losses to policyholders (subject to guarantee features) through lower crediting rates. Consequently, it is only necessary to allow for the balance of the credit risk in the risk discount rate.
After taking these and related factors into account and, based on market conditions from 2009 to 2011, the risk discount rate for general account business includes an additional allowance of 200 basis points (2010: 150 basis points) for credit risk. For VA business, the additional allowance has been set at one-fifth (equivalent to 40 basis points (2010: 30 basis points)) of the non-VA business to reflect the proportion of the VA business that is allocated to holdings of general account debt securities. The level of the additional allowance is assessed at each reporting period to take account of prevailing credit conditions and as the business in force alters over time.
Notes on the EEV basis resultscontinued

395F
ina
ncia
l statem
en
tsE
EV
basis su
pp
lemen
tary
info
rmatio
n
The level of allowance differs from that for UK annuity business for investment portfolio differences and to take account of the management actions available in adverse economic scenarios to reduce crediting rates to policyholders, subject to guarantee features of the products.
UK business(1) Shareholder-backed annuity businessFor Prudential’s UK shareholder-backed annuity business, Prudential has used a market consistent embedded value (MCEV) approach to derive an implied risk discount rate which is then applied to the projected best estimate cash flows. In the annuity MCEV calculations, the future cash flows are discounted using the swap yield curve plus an allowance for liquidity premium based on Prudential’s assessment of the expected return on the assets backing the annuity liabilities after allowing for expected long-term defaults, a credit risk premium, an allowance for a 1 notch downgrade of the portfolio subject to credit risk and an allowance for short-term defaults. For the purposes of presentation in the EEV results, the results on this basis are reconfigured. Under this approach the projected earned rate of return on the debt securities held is determined after allowing for expected long-term defaults and, where necessary, an additional allowance for an element of short-term downgrades and defaults to bring the allowance in the earned rate up to best estimate levels. The allowances for credit risk premium and the remaining element of short-term downgrade and default allowances are incorporated into the risk margin included in the discount rate, as shown in note 17(a).
(2) With-profit fund non-profit annuity business For UK non-profit annuity business including that written by Prudential Annuities Limited (PAL) the basis for determining the aggregate allowance for credit risk is consistent with that applied for UK shareholder-backed annuity business (as described above). The allowance for credit risk in PAL is taken into account in determining the projected cash flows to the with-profits fund, which are in turn discounted at the risk discount rate applicable to all of the projected cash flows of the fund.
(3) With-profit fund holdings of debt securitiesThe UK with-profits fund holds debt securities as part of its investment portfolio backing policyholder liabilities and unallocated surplus. The assumed earned rate for with-profit holdings of corporate bonds is defined as the risk-free rate plus an assessment of the long-term spread over gilts, net of expected long-term defaults. This approach is similar to that applied for equities and properties for which the projected earned rate is defined as the risk-free rate plus a long-term risk premium.
Allowance for non-diversifiable non-market risks Finance theory cannot be used to determine the appropriate component of beta for non-diversifiable non-market risks since there is no observable risk premium associated with it that is akin to the equity risk premium. Recognising this, a pragmatic approach has been applied. A base level allowance of 50 basis points is applied to cover the non-diversifiable non-market risks associated with the Group’s businesses. For the Group’s US business and UK business other than shareholder-backed annuity, no additional allowance is necessary. For UK shareholder-backed annuity business a further allowance of 50 basis points is used to reflect the longevity risk which is of particular relevance. For the Group’s Asian operations in China, India, Indonesia, Philippines, Taiwan, Thailand and Vietnam, additional allowances are applied for emerging market risk ranging from 100 to 250 basis points.
(iv) Management actionsIn deriving the time value of financial options and guarantees, management actions in response to emerging investment and fund solvency conditions have been modelled. Management actions encompass, but are not confined to investment allocation decisions, levels of reversionary and terminal bonuses and credited rates. Bonus rates are projected from current levels and varied in accordance with assumed management actions applying in the emerging investment and fund solvency conditions. In all instances, the modelled actions are in accordance with approved local practice and therefore reflect the options actually available to management. For the PAC with-profits fund, the actions assumed are consistent with those set out in the Principles and Practices of Financial Management.
(v) With-profits business and the treatment of the estateThe proportion of surplus allocated to shareholders from the PAC with-profits fund has been based on the present level of 10 per cent. The value attributed to the shareholders’ interest in the estate is derived by increasing final bonus rates (and related shareholder transfers) so as to exhaust the estate over the lifetime of the in-force with-profits business. In any scenarios where the total assets of the life fund are insufficient to meet policyholder claims in full, the excess cost is fully attributed to shareholders. Similar principles apply, where appropriate, for other with-profit funds of the Group’s Asian operations.

396
Prudential plc Annual Report 2011
Financial statements | European Embedded Value (EEV) basis supplementary information
1 Basis of preparation, methodology and accounting presentation continued
(vi) Pension costsThe Group operates three defined benefit schemes in the UK. The largest scheme is the PSPS. The other two, smaller schemes are the Scottish Amicable and M&G scheme. Under IFRS the surpluses or deficits attaching to these schemes are accounted for in accordance with the provisions of IAS 19 that apply the principles of IFRIC 14, providing guidance on assessing the limit in IAS 19 on the amount of surplus in a defined benefit pension scheme that can be recognised as an asset. Under the EEV basis the IAS 19 basis surpluses (to the extent not restricted under IFRIC 14) or deficits are initially allocated in the same manner. The shareholders’ 10 per cent interest in the PAC with-profits fund estate is determined after inclusion of the portion of the IAS 19 basis surpluses or deficits attributable to the fund. Adjustments under EEV in respect of accounting for surpluses or deficits on the Scottish Amicable Pension Scheme are reflected as part of UK long-term business operations and for other defined benefit schemes the adjustments are reflected as part of Other operations, as shown in note 7. Separately, the projected cash flows of in-force covered business include the cost of contributions to the defined benefit schemes for future service based on the contribution basis applying to the schemes at the time of the preparation of the results.
(vii) Debt capitalCore structural debt liabilities are carried at market value. As the liabilities are generally held to maturity or for the long-term, no deferred tax asset or liability has been established on the difference, compared to the IFRS carrying value. Accordingly, no deferred tax credit or charge is recorded in the results for the reporting period in respect of the mark to market value adjustment.
(viii) Foreign currency translationForeign currency profits and losses have been translated at average exchange rates for the year. Foreign currency assets and liabilities have been translated at year end rates of exchange. The purpose of translating the profits and losses at average exchange rates, notwithstanding the fact that EEV profit represents the incremental value added on a discounted cash flow basis, is to maintain consistency with the methodology applied for IFRS basis reporting.
c Accounting presentation(i) Analysis of profit before taxTo the extent applicable, the presentation of the EEV profit for the year is consistent with the basis that the Group applies for analysis of IFRS basis profits before shareholder taxes between operating and non-operating results. Operating results reflect the underlying results including longer-term investment returns (which are determined as described in note 1(c)(ii) below) and incorporate the following:
• new business contribution, as defined in note 1(b)(i),• unwind of discount on the value of in-force business and other expected returns, as described in note 1(c)(iv) below,• the impact of routine changes of estimates relating to non-economic assumptions, as described in note 1(c)(iii) below, and • non-economic experience variances, as described in note 1(c)(v) below.
Non-operating results comprise the recurrent items of short-term fluctuations in investment returns, the shareholders’ share of actuarial and other gains and losses on defined benefit pension schemes, the mark to market value movements on core borrowings and the effect of changes in economic assumptions. In addition, for 2010 the Company incurred costs associated with the terminated AIA transaction and the Group’s holding in PruHealth was diluted. The effect of both of these items has been shown separately from operating profits based on longer-term investment returns.
(ii) Operating profitFor the investment element of the assets covering the net worth of long-term insurance business, investment returns are recognised in operating results at the expected long-term rate of return. These expected returns are calculated by reference to the asset mix of the portfolio. For the purpose of calculating the longer-term investment return to be included in the operating result of the PAC with-profits fund of UK operations, where assets backing the liabilities and unallocated surplus are subject to market volatility, asset values at the beginning of the reporting period are adjusted to remove the effects of short-term market movements as explained in note 1(c)(iv) below. For the purpose of determining the long-term returns for debt securities of US operations for fixed annuity and other general account business, a risk margin charge is included which reflects the expected long-term rate of default based on the credit quality of the portfolio. For Jackson, interest-related realised gains and losses are amortised to the operating results over the maturity period of the sold bonds and for equity-related investments, a long-term rate of return is assumed, which reflects the aggregation of end of year risk-free rates and equity risk premium. For US variable annuity separate account business, operating profit includes the unwind of discount on the opening value of in-force adjusted to reflect end of year projected rates of return with the excess or deficit of the actual return recognised within non-operating profit, together with the related hedging activity.
Notes on the EEV basis resultscontinued

397F
ina
ncia
l statem
en
tsE
EV
basis su
pp
lemen
tary
info
rmatio
n
For UK annuity business, rebalancing of the asset portfolio backing the liabilities to policyholders may, from time to time, take place to align it more closely with the internal benchmark of credit quality that management applies. Such rebalancing will result in a change in the projected yield on the asset portfolio and the allowance for default risk. The net effect of these changes is reflected in the result for the year. In general, the effect is booked in operating results.
(iii) Effect of changes in operating assumptionsOperating profit includes the effect of changes to operating assumptions on the value of in-force at the end of the period. For presentational purposes, the effect of change is delineated to show the effect on the opening value of in force with the experience variance being determined by reference to the end of period assumptions.
(iv) Unwind of discount and other expected returnsThe unwind of discount and other expected returns is determined by reference to the value of in-force business, required capital and surplus assets at the start of the period as adjusted for the effect of changes in economic and operating assumptions reflected in the current period. For UK insurance operations the amount included within operating results based on longer-term investment returns represents the unwind of discount on the value of in-force business at the beginning of the period (adjusted for the effect of current period assumption changes), the unwind of discount on additional value representing the shareholders’ share of smoothed surplus assets retained within the PAC with-profits fund (as explained in note 1(b)(v) above), and the expected return on shareholders’ assets held in other UK long-term business operations. Surplus assets retained within the PAC with-profits fund are smoothed for this purpose to remove the effects of short-term investment volatility from operating results. In the summary statement of financial position and for total profit reporting, asset values and investment returns are not smoothed.
(v) Operating experience variancesOperating profits include the effect of experience variances on non-economic assumptions, which are calculated with reference to the embedded value assumptions at the end of the reporting year, such as persistency, mortality and morbidity, expenses and other factors. Further details are shown in note 17(b).
(vi) Pension costsProfit before taxMovements on the shareholders’ share of surpluses (to the extent not restricted by IFRIC 14) and deficits of the Group’s defined benefit pension schemes adjusted for contributions paid in the year are recorded within the income statement. Consistent with the basis of distribution of bonuses and the treatment of the estate described in note 1(b)(iv) and (v), the shareholders’ share incorporates 10 per cent of the proportion of the financial position attributable to the PAC with-profits fund. The financial position is determined by applying the requirements of IAS 19.
Actuarial and other gains and lossesFor pension schemes in which the IAS 19 position reflects the difference between the assets and liabilities of the scheme, actuarial and other gains and losses comprise:
• the difference between actual and expected return on the scheme assets,• experience gains and losses on scheme liabilities,• the impact of altered economic and other assumptions on the discounted value of scheme liabilities, and• for pension schemes where the IAS 19 position reflects a deficit funding obligation, actuarial and other gains and losses includes the
movement in estimates of deficit funding requirements.
These items are recorded in the income statement but, consistent with the IFRS basis of presentation, are excluded from operating results based on longer-term investment returns.
(vii) Effect of changes in economic assumptionsMovements in the value of in-force business at the beginning of the period caused by changes in economic assumptions, net of the related change in the time value of cost of option and guarantees, are recorded in non-operating results.
(viii) TaxationThe profit for the year for covered business is in most cases calculated initially at the post-tax level. The post-tax profit for covered business is then grossed up for presentation purposes at the rates of tax applicable to the countries and periods concerned. In the UK the rate applied for 2011 is 25 per cent (2010: 27 per cent). For Jackson, the US federal tax rate of 35 per cent is applied to gross up movements on the value of in-force business. The overall tax rate includes the impact of tax effects determined on a local regulatory basis. For Asia, similar principles apply subject to the availability of taxable profits. Tax payments and receipts included in the projected cash flows to determine the value of in-force business are calculated using rates that have been substantively enacted by the end of the reporting period. Possible future changes of rate are not anticipated.

398
Prudential plc Annual Report 2011
Financial statements | European Embedded Value (EEV) basis supplementary information
1 Basis of preparation, methodology and accounting presentation continued
(ix) Inter-company arrangementsThe EEV results for covered business incorporate the effect of the reinsurance arrangement of non-profit immediate pension annuity liabilities of SAIF (which is not covered business) to PRIL. In addition, the analysis of free surplus and value of in-force business takes account of the impact of contingent loan arrangements between Group companies.
(x) Foreign exchange ratesForeign currency results have been translated as discussed in note 1(b)(viii), for which the principal exchange rates are as follows:
Local currency: £Closing rate at
31 Dec 2011Average rate
for 2011Closing rate at
31 Dec 2010Average rate
for 2010Opening rate at
1 Jan 2010
China 9.78 10.37 10.32 10.46 11.02 Hong Kong 12.07 12.48 12.17 12.01 12.52 India 82.53 74.80 70.01 70.66 75.15 Indonesia 14,091.80 14,049.41 14,106.51 14,033.41 15,171.52 Korea 1,790.32 1,775.98 1,776.86 1,786.23 1,880.45 Malaysia 4.93 4.90 4.83 4.97 5.53 Singapore 2.02 2.02 2.01 2.11 2.27 Taiwan 47.06 47.12 45.65 48.65 51.65 Vietnam 32,688.16 33,139.22 30,526.26 29,587.63 29,832.74 US 1.55 1.60 1.57 1.55 1.61
2 Analysis of new business contributionnote (iv)
2011
New business premiumsAnnual
premium and contribution
equivalents (APE)
note (i) £m
Present value of new
business premiums
(PVNBP)note (i)
£m
Pre-tax new business
contributionnotes (ii), (iii)
£m
New business marginnote (i)
Single
£m
Regular
£m
(APE)
%
(PVNBP)
%
Asian operations 1,456 1,514 1,660 8,910 1,076 65 12.1 US operations 12,562 19 1,275 12,720 815 64 6.4 UK insurance operationsnote (vii) 4,871 259 746 6,111 260 35 4.3
Total 18,889 1,792 3,681 27,741 2,151 58 7.8
2010
New business premiumsAnnual
premium and contribution
equivalents (APE)
note (i)£m
Present value of new
business premiums
(PVNBP)note (i)
£m
Pre-tax new business
contributionnotes (ii), (iii)
£m
New business marginnote (i)
Single
£m
Regular
£m
(APE)
%
(PVNBP)
%
Asian operationsnotes (v), (vi) 1,104 1,391 1,501 7,493 902 60 12.0 US operations 11,417 22 1,164 11,572 761 65 6.6 UK insurance operationsnote (vii) 5,656 254 820 6,842 365 45 5.3
Total 18,177 1,667 3,485 25,907 2,028 58 7.8
Notes on the EEV basis resultscontinued

399F
ina
ncia
l statem
en
tsE
EV
basis su
pp
lemen
tary
info
rmatio
n
New business margin (APE %)
2011 2010
Asian operations:note (v) China 46 47 Hong Kong 66 74 India 20 20 Indonesia 87 75 Korea 43 31 Taiwan 19 13 Other 76 79 Weighted average for all Asian operations 65 60
Notes(i) New business margins are shown on two bases, namely the margins by reference to Annual Premium Equivalents (APE) and the Present Value
of New Business Premiums (PVNBP) and are calculated as the ratio of the value of new business profit to APE and PVNBP. APE are calculated as the aggregate of regular new business amounts and one-tenth of single new business amounts. PVNBP are calculated as equalling single premiums plus the present value of expected premiums of new regular premium business, allowing for lapses and other assumptions made in determining the EEV new business contribution.
(ii) In determining the EEV basis value of new business, premiums are included in projected cash flows on the same basis of distinguishing annual and single premium business as set out for statutory basis reporting.
(iii) New business contributions represent profits determined by applying operating assumptions as at the end of the year. In general, the use of point of sale or end of period economic assumptions is not significant in determining the new business contribution for different types of business and across financial reporting periods. However, to obtain proper measurement of the new business contribution for business which is interest rate sensitive, it is appropriate to use assumptions reflecting point of sale market conditions, consistent with how the business was priced. In practice, the only area within the Group where this has a material effect is for UK shareholder-backed annuity business. For other business within the Group end of period economic assumptions are used.
(iv) The amounts shown in the tables are translated at average exchange rates for the year.(v) The tables for 2010 exclude new business sales and contributions for Japanese insurance operations in which the Company ceased selling new
business from 15 February 2010.(vi) The new business contribution in 2010 of £902 million for Asian operations includes a benefit of around £5 million arising from the application
of the ‘active’ basis of economic assumption setting rather than the previously applied basis of an assessment of longer-term economic conditions, as described in note 17a(v).
(vii) The new business margin for UK operations for 2010 of 45 per cent reflects the signing of bulk annuity buy-in insurance agreements with an APE of £93 million and new business profit of £106 million. In 2011 the new business margin of 35 per cent includes bulk annuity agreements with an APE of £33 million and new business profit of £28 million.

400
Prudential plc Annual Report 2011
Financial statements | European Embedded Value (EEV) basis supplementary information
3 Operating profit from business in force
Group summary
2011 £m
Asian operations
note (i)
USoperations
note (ii)
UKinsurance
operations note (iii)
Total
Unwind of discount and other expected returns 613 349 485 1,447 Effect of change in operating assumptions 10 14 79 103 Experience variances and other items 65 253 29 347
Total 688 616 593 1,897
2010 £m
Asian operations
note (i)
USoperations
note (ii)
UKinsurance
operations note (iii)
Total
Unwind of discount and other expected returns 573 369 550 1,492 Effect of change in operating assumptions (23) 3 (3) (23)Experience variances and other items (1) 325 24 348
Total 549 697 571 1,817
NotesAnalysis by business unit(i) Asian operations
2011
£m
2010 note (j)
£m
Unwind of discount and other expected returnsnote (a) 613 573 Effect of change in operating assumptions: Mortality and morbiditynote (b) 126 89 Expensenote (c) 11 (62) Persistency and withdrawalsnote (d) (140) (75) Other note (e) 13 25 10 (23)Experience variance and other items: Mortality and morbiditynote (f) 58 45 Expensenote (g) (31) (39) Persistency and withdrawalsnote (h) 10 (48) Othernote (i) 28 41
65 (1)
Total Asian operations 688 549
Notes(a) The increase in unwind of discount and other expected returns to £613 million in 2011 from £573 million in 2010 mainly arises from the
growth in the opening value of the in-force book, partially offset by the effect of the reduction in interest rates.(b) The credit of £126 million in 2011 for mortality and morbidity assumption changes arises as follows:
2011 £m
Malaysianote (1) 69 Indonesianote (2) 33 Singapore 19 Other 5
126
(1) The credit in Malaysia of £69 million relates to revised mortality and morbidity assumptions, reflecting recent experience. (2) The credit in Indonesia of £33 million represents the effect of revised morbidity assumptions of £48 million, the revision of reinsurance
rates of £8 million, offset by modelling enhancements for the cost of reinsurance of £(23) million.
Notes on the EEV basis resultscontinued

401F
ina
ncia
l statem
en
tsE
EV
basis su
pp
lemen
tary
info
rmatio
n
The credit of £89 million in 2010 for mortality and morbidity assumption changes mainly arose in Indonesia of £72 million comprising £36 million for relaxation of morbidity assumptions and £36 million to reflect recent experience in relation to protection benefits provided by unit-linked policies.
(c) The credit of £11 million in 2011 for expense assumption changes mainly arises from altered assumptions for maintenance expenses, reflecting recent experience, principally in Singapore of £34 million and Indonesia of £11 million, partly offset by a charge in India of £(30) million.
The charge of £(62) million in 2010 for expense assumption changes includes a charge in Korea of £(40) million to reflect higher policy maintenance costs and a charge of £(16) million in Malaysia relating to altered maintenance expense assumptions.
(d) The charge of £(140) million in 2011 for persistency and withdrawals assumption changes arises as follows:
2011 £m
Malaysianote (1) (106) Indianote (2) (21)Indonesia (13) Singapore (4) Other 4
(140)
(1) The charge of £(106) million in Malaysia includes £(108) million for the effect of strengthening partial withdrawal assumptions on PruSaver product riders to reflect recent experience. Policyholders’ pattern and frequency of withdrawals from this savings rider is different from that of the underlying ‘host’ contract, where both persistency and premium payment experience remains in line with assumptions.
(2) The charge in India of £(21) million reflects lower persistency assumptions for paid-up policies for unit-linked business. The charge of £(75) million for 2010 for the effect of changes in persistency and withdrawals assumptions mainly arises in Indonesia of
£(33) million, Malaysia of £(26) million and India of £(24) million partly offset by a credit in Hong Kong of £16 million. The charge in Indonesia of £(33) million primarily relates to Shariah and single premium policies for which lower renewal rates had been experienced. The charge in Malaysia of £(26) million reflects altered premium holiday and other lapse assumptions and the charge in India of £(24) million represents changes in persistency assumptions on linked business.
(e) The credit of £13 million in 2011 for other operating assumptions principally represents the combined effect of a favourable change in assumed asset management margins, a reduction in investment expenses for Indonesia resulting from a growth in the asset portfolio, a decrease in policyholder bonuses in the Philippines, partly offset by the effect of altered profit sharing arrangements in relation to participating business in Vietnam.
(f) The favourable effect of mortality and morbidity experience in 2011 of £58 million and in 2010 of £45 million reflects better than expected experience, principally arising in Hong Kong, Indonesia, Singapore and Malaysia.
(g) The negative expense experience variance of £(31) million in 2011 (2010: £(39) million) comprises a charge of £(26) million (2010: £(18) million) for expense overruns for operations which are at a relatively early stage of development, for which actual expenses are in excess of those factored into the product pricing, together with £(6) million (2010: £(9) million) in Taiwan and £1 million (2010: £(12) million) of variance for other operations.
(h) The positive persistency and withdrawals experience variance of £10 million in 2011 reflects a combination of favourable experience in Hong Kong and Indonesia, partially offset by individually small negative variances in other territories.
The negative persistency and withdrawals experience variance of £(48) million in 2010 mainly arises in India of £(27) million relating to higher paid-ups and surrenders on unit-linked business and in Malaysia of £(26) million for higher partial withdrawals on unit-linked business as customers sought to monetise a proportion of their funds following two years of exceptional returns.
(i) The credit of £28 million in 2011 for other experience and other items primarily arises in Indonesia of £24 million. The credit of £41 million in 2010 includes a credit of £24 million arising in Indonesia for the impact of additional riders being added to in-force policies during the year, funded from the policyholder unit-linked account balances.
(j) The in-force operating profit for 2010 of £549 million reflects the effect of setting economic assumptions on an ‘active’ basis rather than the previously applied ‘passive’ basis as described in note 17a(v), the impact of which was to lower in-force operating profits in 2010 by £(58) million, principally for altered unwind of discount.

402
Prudential plc Annual Report 2011
Financial statements | European Embedded Value (EEV) basis supplementary information
Notes on the EEV basis resultscontinued
3 Operating profit from business in force continued
(ii) US operations 2011 £m 2010 £m
Unwind of discount and other expected returnsnote (a) 349 369 Effect of changes in operating assumptions: Persistencynote (b) 29 4 Variable Annuity (VA) feesnote (c) 24 27 Mortalitynote (d) (36) 10 Othernote (e) (3) (38)
14 3 Experience variances and other items: Spread experience variancenote (f) 152 158 Amortisation of interest-related realised gains and lossesnote (g) 84 82 Othernote (h) 17 85
253 325
Total US operations 616 697
Notes(a) The decrease in unwind of discount and other expected returns from £369 million for 2010 to £349 million for 2011 mainly reflects lower
unwind of discount driven by the reduction in the 10-year US treasury rate, partly offset by an increase in opening value of in-force business.(b) The credit of £29 million for the effect of changes in persistency assumptions in 2011 arises on variable annuity business of a credit of
£15 million and £14 million on other business. The credit of £15 million for VA business represents a credit of £32 million to reflect a decrease in lapse rates for selected product and policy duration combinations, partially offset by a charge of £(17) million to increase partial withdrawal rates in line with experience. The credit of £14 million for other business reflects updated persistency assumptions for life and fixed annuity business.
(c) The effect of the change of assumption for VA fees represents the capitalised value of the change in the projected level of policyholder advisory fees, which vary according to the size and mix of VA funds. The credit of £24 million for 2011 (2010: £27 million) reflects an increase in the projected level of fees paid by policyholders, according to the current fund size and mix.
(d) The charge of £(36) million for 2011 for updated mortality assumptions primarily arises on variable annuity business to reflect recent mortality experience. The credit of £10 million for 2010 represents a credit of £29 million for business other than variable annuity, reflecting recent experience, partially offset by a negative effect on variable annuity business of £(19) million for a change in the modelling of mortality rates.
(e) The charge of £(38) million for other operating assumption changes in 2010 includes the net effect of a number of items including a charge of £(19) million for the altered projection of life reserves run-off.
(f) The spread assumption for Jackson is determined on a longer-term basis, net of provision for defaults. The spread experience variance in 2011 of £152 million (2010: £158 million) includes the positive effect of transactions undertaken in 2010 and 2011 to more closely match the overall asset and liability duration.
(g) The amortisation of interest-related gains and losses reflects the same treatment applied to the supplementary analysis of IFRS profit. When bonds that are neither impaired nor deteriorating are sold and reinvested there will be a consequent change in the investment yield. The realised gain or loss is amortised into the result over the period when the bonds would have otherwise matured to better reflect the long-term returns included in operating profits.
(h) Other experience variances and other items arise as follows:
2011 £m 2010 £m
Mortality experience variancenote (1) (6) 21 Expense experience variancenote (2) 12 32 Persistency experience variancenote (3) 21 23 Other (10) 9
17 85
(1) The negative mortality experience variance of £(6) million in 2011 includes a provision of £(16) million in respect of unclaimed property for deceased policyholders. The positive mortality experience variance of £21 million in 2010 primarily relates to life products.
(2) The positive expense experience variances of £12 million in 2011 and £32 million in 2010 primarily represents favourable experience variance relating to marketing expenses.
(3) The positive persistency experience variance of £21 million in 2011 mainly arises on annuity business and in 2010, the favourable experience variance of £23 million primarily arises on annuity and institutional business.

403F
ina
ncia
l statem
en
tsE
EV
basis su
pp
lemen
tary
info
rmatio
n
(iii) UK insurance operations 2011 £m 2010 £m
Unwind of discount and other expected returnsnote (a) 485 550 Effect of change in UK corporate tax ratenote (b) 79 41 Updated mortality assumptions, net of release of marginsnote (c) – (40)Other itemsnote (d) 29 20
Total UK insurance operations 593 571
Notes(a) The decrease in unwind of discount and other expected returns from £550 million for 2010 to £485 million for 2011 mainly arises from lower
unwind on with-profits business, reflecting a decrease in both the risk discount rate and opening in-force value (as adjusted for the effects of changes in operating and economic assumptions).
(b) In 2011 a change to reduce the UK corporate tax rate to 25 per cent with effect from 1 April 2012 was enacted. The effect of the change in tax rate of £79 million in 2011 represents the pre-tax benefit of the reduction in tax rate from 27 per cent to 25 per cent, arising from the increase in the present value of the post-tax projected cash flows of the in-force business, grossed up for notional tax. The effect of the change in tax rate of £41 million for 2010 represents the pre-tax benefit of the reduction in the tax rate from 28 per cent to 27 per cent.
(c) In 2010 the Continuous Mortality Investigation (CMI) model and Core Projection parameters were reviewed and a custom parameterisation of the CMI model was made where some aspects of the pattern of convergence from current rates of improvements to long-term rates of improvement were altered. The assumption change shown above for 2010 of a charge of £(40) million represents the effect of the implementation of the custom parameterisation on the opening value of in-force business at 1 January 2010, offset by the effects of other mortality assumption changes and the release of margins on the base mortality assumptions.
(d) Other items of £29 million for 2011 includes £45 million for the effects of annuity portfolio rebalancing. In 2010, other items of £20 million includes a credit of £37 million for changes in operating expense assumptions relating to renewal expense assumptions on shareholder-backed annuity business.
4 Costs of terminated AIA transaction in 2010
In 2010, pre-tax costs of £377 million (post tax £284 million) were incurred in relation to the proposed, and subsequently terminated transaction, to purchase AIA Group Limited and related rights issue.
5 Short-term fluctuations in investment returns
Short-term fluctuations in investment returns, net of the related change in the time value of cost of options and guarantees, arise as follows:
Group summary
2011 £m 2010 £m
Insurance operations: Asianote (i) (155) 287 USnote (ii) (491) (678) UKnote (iii) (141) 336 (787) (55)Other operationsnote (iv) (120) 25
Total (907) (30)
NotesAnalysis by business unit(i) Asian operations For 2011, short-term fluctuations in investment returns in Asian operations of £(155) million are driven by lower equity markets reducing future
expected fee income, mainly arising in Singapore £(105) million and Korea £(22) million. The 2011 short-term fluctuations in investment returns also include £(28) million of adverse variance arising in other territories. This principally comprises fluctuations arising in India of £(53) million reflecting lower equity market returns, in Vietnam of £(33) million for unrealised losses on bonds and equities and Taiwan of £(30) million for losses on bonds and CDOs, partially offset by a credit in Hong Kong of £96 million primarily relating to positive returns on bonds backing participating business.
For 2010, short-term fluctuations in investment returns in Asian operations of £287 million primarily reflect the favourable performance in equity markets across the territories, primarily arising in Indonesia £55 million, Hong Kong £51 million, Taiwan £40 million, Malaysia £37 million and Singapore £16 million. Also included for 2010 is an unrealised gain of £30 million on the Group’s 8.66 per cent stake in China Life Insurance Company of Taiwan, which at 31 December 2010 was valued at £100 million.

404
Prudential plc Annual Report 2011
Financial statements | European Embedded Value (EEV) basis supplementary information
Notes on the EEV basis resultscontinued
5 Short-term fluctuations in investment returns continued
(ii) US operations The short-term fluctuations in investment returns for US operations comprise the following items:
2011 £m 2010 £m
Debt securities investment return related experiencenote (a) (74) (351)Investment return related impact due primarily to changed expectation of profits on in-force variable annuity
business in future periods based on current period equity returns, net of related hedging activity for equity related productsnote (b) (418) (332)
Actual less long-term return on equity based investments and other items 1 5
Total Jackson (491) (678)
Notes (a) The charge relating to fixed income securities comprises the following elements: – the excess of actual realised losses over the amortisation of interest related realised losses recorded in the profit and loss account, – credit loss experience (versus the longer-term assumption), and – the impact of de-risking activities within the portfolio, which accounts for the majority of the 2010 charge. (b) This item reflects the net impact of:
(1) variances in projected future fees arising from the effect of market fluctuations on the growth in separate account asset values in the current reporting period, and
(2) related hedging activity. In 2011 there was a negative 0.5 per cent rate of return for the variable annuity separate account assets. This compared with an assumed
longer-term rate of return of 5.4 per cent. Consequently the asset values, and therefore projected future fees at 31 December 2011, were lower than assumed. As a consequence of this lower level of return, net of the impact of relating hedging effects, there was a short-term fluctuation of £(418) million.
In 2010 there was a 14.5 per cent return which compared with an assumed longer-term rate of return of 6.8 per cent. However, despite this excess return, there was an overall charge of £(332) million which arose from the effects of related hedging activity.
(iii) UK insurance operations The short-term fluctuations in investment returns for UK insurance operations represents:
2011 £m 2010 £m
With-profitsnote (a) (201) 218 Shareholder-backed annuitynote (b) 56 84 Unit-linked and other note (c) 4 34
(141) 336
Notes (a) For with-profits business the amounts reflect the excess (deficit) of the actual investment return on the investments of the PAC with-profits
fund (covering policyholder liabilities and unallocated surplus) against the assumed long-term rate for the year. For 2011 the charge of £(201) million reflects the actual investment return of 3.2 per cent against the assumed long-term rate of 5.1 per cent, primarily reflecting the fall in equity markets and widening of corporate bond credit spreads, partially offset by the increase in asset values as a result of the reduction in bond yields. For 2010 the credit of £218 million reflects the actual investment return of 12.0 per cent against the assumed long-term rate of 6.7 per cent.
(b) Short-term fluctuations in investment returns for shareholder-backed annuity business comprise: (1) gains on surplus assets reflecting reductions in corporate bond and gilt yields in 2011 and 2010, and (2) the effect of mismatching for assets and liabilities of different durations and other short-term fluctuations in investment returns.
(c) The short-term fluctuations in investment returns for unit-linked business represents the increase in capitalised value of future fees arising from the positive movements in market values experienced during the year.
(iv) Other operations Short-term fluctuations in investment returns for other operations in 2011 of £(120) million (2010: £25 million) represent unrealised value
movements on investments, principally on centrally held swaps to manage foreign exchange and certain macro-economic exposures of the Group.

405F
ina
ncia
l statem
en
tsE
EV
basis su
pp
lemen
tary
info
rmatio
n
6 Effect of changes in economic assumptions
The effects of changes in economic assumptions for in-force business, net of the related change in the time value of cost of options and guarantees, included within profit before tax (including actual investment returns) arise as follows:
Group summary
2011 £m 2010 £m
Asian operationsnote (i) 279 (71) US operationsnote (ii) (144) (1) UK insurance operationsnote (iii) (293) 62
Total (158) (10)
NotesAnalysis by business unit(i) Asian operations The effect of changes in economic assumptions for Asian operations in 2011 of a credit of £279 million principally arises in Singapore
£160 million, Malaysia £97 million and Indonesia £94 million, primarily reflecting the positive impact of discounting health and protection profits at lower rates, driven by the decrease in risk-free rates as shown in note 17a. There is a partial offset arising in Hong Kong of £(57) million, primarily reflecting the reduction in fund earned rates for participating business.
For 2010, the effect of changes in economic assumptions in Asian operations of £(71) million primarily represents the effect of derisking certain asset portfolios in Hong Kong and Singapore totalling £(73) million, together with the effects of routine adjustments for changes in economic factors and the effect of altering the basis of setting economic assumptions to the ‘active’ basis as described in note 17a(v).
(ii) US operations The effect of changes in economic assumptions for US operations reflects the following:
2011 £m 2010 £m
Effect of changes in 10-year treasury rates, beta and equity risk premium:note (a) Fixed annuity and other general account business 282 111 Variable Annuity (VA) business (333) (112)Increase in risk margin allowance for credit risknote (b) (93) –
(144) (1)
Notes (a) For Jackson, the charge for the effect of changes in economic assumptions represents the aggregate of the effects of changes to projected
returns and the risk discount rate. The risk discount rate, as discussed in note 1(b)(iii), represents the aggregate of the risk-free rate and margin for market risk, credit risk and non-diversifiable non-market risk.
For fixed annuity and other general account business the effect of changes to the risk-free rate, which is defined as the 10-year treasury rate, is reflected in the risk discount rate. This discount rate is in turn applied to projected cash flows which principally reflect projected spread, which is largely insensitive to changes in the risk-free rate. Secondary effects on the cash flows also result from changes to assumed future yield and resulting policyholder behaviour. For VA business, changes to the risk-free rate are also reflected in determining the risk discount rate. However, the projected cash flows are also reassessed for altered investment returns on the underlying separate account assets from which fees are charged. For 2011, the effect of these changes resulted in an overall credit for fixed annuity and other general account business of £282 million (2010: £111 million) and a charge for VA business of £(333) million (2010: £(112) million) reflecting the reduction of 1.4 per cent (2010: a reduction of 0.6 per cent) in the risk-free rate (as shown in note 17a).
(b) For 2011 the effect of £(93) million for the increase in the risk margin allowance within the risk discount rate for credit risk represents 50 basis points increase in the risk discount rate for spread business (from 150 basis points in 2010 to 200 basis points in 2011), and 10 basis points for VA business (from 30 basis points in 2010 to 40 basis points in 2011), representing the proportion of business invested in the general account, as described in note 1b(iii).

406
Prudential plc Annual Report 2011
Financial statements | European Embedded Value (EEV) basis supplementary information
Notes on the EEV basis resultscontinued
6 Effect of changes in economic assumptions continued
(iii) UK insurance operations The effect of changes in economic assumptions of a charge of £(293) million for UK insurance operations for 2011 comprises the effect of:
2011 £m 2010 £m
Shareholder-backed
annuity business
note (a)
With-profits and other
businessnote (b) Total
Shareholder-backed
annuity business
note (a)
With-profits and other
businessnote (b) Total
Effect of changes in expected long-term rates of return 58 (1,113) (1,055) (102) (80) (182)
Effect of changes in risk discount rates 240 627 867 55 183 238 Other changes (20) (85) (105) (6) 12 6
278 (571) (293) (53) 115 62
Notes (a) For shareholder-backed annuity business the overall effect of changes in expected long-term rates of return and risk discount rates for the
years shown above reflect the combined effects of the changes in assumptions which incorporate a default allowance for both best estimate defaults and in respect of the additional credit risk provisions, as shown in note 17a.
(b) For with-profits and other business the charge in 2011 of £(1,113) million for the effect of changes in expected long-term rates of return arises from the reduction in fund earned rates as shown in note 17a, driven by the (1.5) per cent decrease in gilt rates and reduction in additional returns assumed on corporate bonds, reflecting changes in asset mix. The credit in 2011 of £627 million for the effect of changes in risk discount rates reflects the (1.35) per cent reduction in the risk discount rate as shown in note 17(a), driven by the (1.5) per cent decrease in gilt rates, partly offset by the impact of an increase in beta for with-profits business.

407F
ina
ncia
l statem
en
tsE
EV
basis su
pp
lemen
tary
info
rmatio
n
7 Shareholders’ equity (excluding non-controlling interests) – segmental analysis
Note 2011 £m 2010 £m
Asian operations Long-term business: Net assets of operations – EEV basis shareholders’ equitynote (iii) 8,510 7,445 Acquired goodwillnote (i) 235 236
8,745 7,681 Eastspring Investments:note (i) Net assets of operations 211 197 Acquired goodwill 61 61
272 258
9,017 7,939
US operations Jackson – EEV basis shareholders’ equity (net of surplus note borrowings
of £177 million (2010: £172 million) 5,082 4,799 Broker-dealer and asset management operations:note (i) Net assets of operations 113 106 Acquired goodwill 16 16
129 122
5,211 4,921
UK operations Insurance operations: Long-term business operations: Smoothed shareholders’ equity 6,097 5,911 Actual shareholders’ equity less smoothed shareholders’ equity (39) 59 EEV basis shareholders’ equity 6,058 5,970 Othernote (i) 29 33
6,087 6,003
M&G:note (i) Net assets of operations 229 254 Acquired goodwill 1,153 1,153
1,382 1,407
7,469 7,410
Other operations Holding company net borrowings at market value 9 (2,188) (2,212)Other net assetsnote (i) 128 149
(2,060) (2,063)
Total 19,637 18,207

408
Prudential plc Annual Report 2011
Financial statements | European Embedded Value (EEV) basis supplementary information
Notes on the EEV basis resultscontinued
7 Shareholders’ equity (excluding non-controlling interests) – segmental analysis continued
2011 £m 2010 £m
Representing:
StatutoryIFRS basis
shareholders’ equity
Additional retained profit
on an EEV basis
EEV basis share-
holders’ equity
StatutoryIFRS basis
shareholders’ equity
Additional retained profit
on an EEV basis
EEV basis share-
holders’ equity
Asian operations 2,349 6,396 8,745 2,149 5,532 7,681 US operations 4,271 811 5,082 3,815 984 4,799 UK insurance operations 2,552 3,506 6,058 2,115 3,855 5,970
Total long-term business operations 9,172 10,713 19,885 8,079 10,371 18,450 Other operationsnote (ii) (55) (193) (248) (48) (195) (243)
Group total 9,117 10,520 19,637 8,031 10,176 18,207
Notes(i) With the exception of the share of the Prudential Staff Pension Scheme (PSPS) deficit (as explained below), the amounts shown for net assets
of non-covered business, together with acquired goodwill, have been determined on the statutory IFRS basis. The share of the PSPS deficit attributable to the PAC with-profits fund is included in ‘other operations’ net assets. The overall pension scheme deficit, net of tax, attributable to shareholders relating to PSPS is determined as shown below:
2011 £m 2010 £m
IFRS basis deficit (relating to shareholder-backed operations) (5) (10)Additional EEV deficit (relating to shareholders’ 10 per cent share of the IFRS basis deficit attributable to the PAC
with-profits fund) (1) (3)
EEV basis (6) (13)
(ii) The additional retained profit on an EEV basis for Other operations primarily represents the mark to market value difference on holding company net borrowings of a charge of £(187) million (2010: £(177) million), as shown in note 9.
(iii) The EEV basis shareholders’ equity for Asian long-term business for 2010 of £7,445 million includes the £(39) million effect of moving from a passive to an active basis of economic assumption setting as described in note 17a(v).

409F
ina
ncia
l statem
en
tsE
EV
basis su
pp
lemen
tary
info
rmatio
n
8 Analysis of movement in free surplus
Free surplus is the excess of the net worth over the capital required to support the covered business. Where appropriate, adjustments are made to the regulatory basis net worth from the local regulatory basis so as to include backing assets movements at fair value rather than cost, so as to comply with the EEV Principles. Prudential has based required capital on its internal targets for economic capital subject to it being at least the local statutory minimum requirements, as described in note 1(b)(ii).
2011 £m
Long-term business and asset management operationsnote (i)
Long-term business
note 14
Asset management
and UK general
insurance commission
note (ii)
Free surplus of long-term
business, asset management
and UK general insurance
commission
Underlying movement: New business (553) – (553) Business in force: Expected in-force cash flows (including expected return on net assets) 1,972 363 2,335 Effects of changes in operating assumptions, operating experience variances and other operating items 168 – 168 RPI to CPI inflation measure change on defined benefit pension schemes 20 13 33
1,607 376 1,983 Changes in non-operating itemsnote (iii) (507) (24) (531)
1,100 352 1,452 Net cash flows to parent companynote (iv) (829) (276) (1,105)Exchange movements, timing differences and other itemsnote (v) (180) (84) (264)
Net movement in free surplus 91 (8) 83 Balance at 1 January 2011 2,748 590 3,338
Balance at 31 December 2011 2,839 582 3,421
Representing: Asian operations 1,067 211 1,278 US operations 1,220 113 1,333 UK operations 552 258 810
2,839 582 3,421
Balance at 1 January 2011 Representing: Asian operations 1,045 197 1,242 US operations 1,163 106 1,269 UK operations 540 287 827
2,748 590 3,338
Notes(i) All figures are shown net of tax.(ii) For the purposes of this analysis, free surplus for asset management operations and the UK general insurance commission is taken to be IFRS
basis shareholders’ equity as shown in note 7.(iii) Changes in non-operating items This represents short-term fluctuations in investment returns, the shareholders’ share of actuarial and other gains and losses on defined benefit
pension schemes and the effect of changes in economic assumptions for long-term business operations. Short-term fluctuations in investment returns primarily reflect temporary market movements on the portfolio of investments held by the
Group’s shareholder-backed operations.(iv) Net cash flows to parent company for long-term business operations reflect the flows as included in the holding company cash flow at
transaction rates.

410
Prudential plc Annual Report 2011
Financial statements | European Embedded Value (EEV) basis supplementary information
Notes on the EEV basis resultscontinued
8 Analysis of movement in free surplus continued
(v) Exchange movements, timing differences and other items represent:
2011 £m
Long-term business
Asset management
and UK general
insurance commission Total
Exchange movementsnote 14 (15) (2) (17)Mark to market value movements on Jackson assets backing surplus and required capitalnote 14 62 – 62 Othernote (vi) (227) (82) (309)
(180) (84) (264)
(vi) Other primarily reflects the effect of repayment of contingent loan funding, as shown in note 14(ii), together with timing differences, intragroup loans and other non-cash items.
9 Net core structural borrowings of shareholder-financed operations
2011 £m 2010 £m
IFRS basis
Mark to market
value adjustment
note (ii)
EEVbasis at market
value IFRS basis
Mark to market
value adjustment
note (ii)
EEVbasis at market
value
Holding company* cash and short-term investments (1,200) – (1,200) (1,232) – (1,232)
Core structural borrowings – central fundsnote (i) 3,201 187 3,388 3,267 177 3,444
Holding company net borrowings 2,001 187 2,188 2,035 177 2,212 Core structural borrowings –
Prudential Capitalnote (iii) 250 – 250 250 – 250 Core structural borrowings – Jackson 160 17 177 159 13 172
Net core structural borrowings of shareholder-financed operations 2,411 204 2,615 2,444 190 2,634
* Including central finance subsidiaries.
Notes(i) EEV basis holding company borrowings comprise:
2011 £m 2010 £m
Perpetual subordinated capital securities (Innovative Tier 1) 1,813 1,491 Subordinated debt (Lower Tier 2) 949 1,372 Senior debt 626 581
3,388 3,444
In January 2011, the Company issued US$550 million perpetual subordinated capital securities which has been used to finance the repayment of the €500 million subordinated debt in December 2011.
In accordance with the EEV Principles, core borrowings are carried at market value. As the liabilities are generally held to maturity or for the long-term, no deferred tax asset or liability has been established on the market value adjustment above.

411F
ina
ncia
l statem
en
tsE
EV
basis su
pp
lemen
tary
info
rmatio
n
(ii) The movement in the mark to market value adjustment represents:
Mark to market movement in balance sheet: 2011 £m 2010 £m
Beginning of year 190 30 Change: Income statement 14 164 Foreign exchange effects – (4)
End of year 204 190
(iii) The core structural borrowing by Prudential Capital of £250 million represents a bank loan taken out in 2010 which was made in two tranches: £135 million maturing in June 2014, and £115 million maturing in December 2012.

412
Prudential plc Annual Report 2011
Financial statements | European Embedded Value (EEV) basis supplementary information
10 Reconciliation of movement in shareholders’ equity (excluding non-controlling interests)
2011 £m
Long-term business operations
Other operations
GroupTotal
Asian operations
USoperations
UK insurance
operations
Totallong-term
business
Operating profit (based on longer-term investment returns)
Long-term business: New businessnote 2 1,076 815 260 2,151 – 2,151 Business in forcenote 3 688 616 593 1,897 – 1,897
1,764 1,431 853 4,048 – 4,048 Asia development expenses (5) – – (5) – (5)UK general insurance commission – – – – 40 40 M&G – – – – 357 357 Eastspring Investments – – – – 80 80 US broker-dealer and asset management – – – – 24 24 Other income and expenditure – – – – (536) (536)RPI to CPI inflation measure change on defined
benefit pension schemes – – 27 27 18 45 Solvency II implementation costs – (4) (8) (12) (44) (56)Restructuring costs – – (19) (19) – (19)
Operating profit based on longer-term investment returns 1,759 1,427 853 4,039 (61) 3,978
Short-term fluctuations in investment returnsnote 5 (155) (491) (141) (787) (120) (907)Mark to market value movements on core
borrowingsnote 9 – (4) – (4) (10) (14)Shareholders’ share of actuarial and other gains
and losses on defined benefit pension schemes – – 20 20 3 23
Effect of changes in economic assumptionsnote 6 279 (144) (293) (158) – (158)
Profit (loss) before tax (including actual investment returns) 1,883 788 439 3,110 (188) 2,922
Tax (charge) credit attributable to shareholders’ profit (loss):note 11
Tax on operating profit (402) (487) (221) (1,110) 66 (1,044) Tax on short-term fluctuations in investment returns 10 157 35 202 8 210 Tax on shareholders’ share of actuarial and
other gains and losses on defined benefit pension schemes – – (5) (5) (1) (6)
Tax on effect of changes in economic assumptions (58) 50 72 64 – 64
Total tax (charge) credit (450) (280) (119) (849) 73 (776)
Non-controlling interests – – – – (4) (4)
Profit (loss) for the year 1,433 508 320 2,261 (119) 2,142
Notes on the EEV basis resultscontinued

413F
ina
ncia
l statem
en
tsE
EV
basis su
pp
lemen
tary
info
rmatio
n
2011 £m
Long-term business operations
Other operations
Grouptotal
Asian operations
US operations
UK insurance
operations
Totallong-term
business
Other movements Exchange movements on foreign operations and
net investment hedgesnote (i) (87) 42 – (45) (45) (90)Related tax – – – – (68) (68)
Intragroup dividends (including statutory transfers)note (iii) (302) (330) (218) (850) 850 –
External dividends – – – – (642) (642)Reserve movements in respect of share-based
payments – – – – 44 44 Investment in operationsnote (iii) 32 – 4 36 (36) – Other transfersnote (iv) (11) 1 (18) (28) 28 – Movement in own shares held in respect of
share-based payment plans – – – – (30) (30)Movement in Prudential plc shares purchased by
unit trusts consolidated under IFRS – – – – (5) (5)New share capital subscribed – – – – 17 17 Mark to market value movements on Jackson
assets backing surplus and required capital: Mark to market value movements arising
during the year – 96 – 96 – 96 Related tax – (34) – (34) – (34)
Net increase (decrease) in shareholders’ equity 1,065 283 88 1,436 (6) 1,430 Shareholders’ equity at 1 January 2011notes (ii) and 7 7,445 4,799 5,970 18,214 (7) 18,207
Shareholders’ equity at 31 December 2011notes (ii) and 7 8,510 5,082 6,058 19,650 (13) 19,637
Notes(i) Profits are translated at average exchange rates, consistent with the method applied for statutory IFRS basis results. The amounts recorded
above for exchange rate movements reflect the difference between 2011 and 2010 exchange rates as applied to shareholders’ equity at 1 January 2011 and the difference between 31 December 2011 and average rates for the year ended 31 December 2011.
(ii) For the purposes of the table above, goodwill related to Asia long-term operations (as shown in note 7) is included in Other operations.(iii) Total intragroup dividends and investment in operations represent:
Asian operations
£m
US operations
£m
UK insurance
operations£m
Totallong-term
business operations
£m
Other operations
£mTotal
£m
Intragroup dividends (including statutory transfers)note (a) (302) (330) (218) (850) 850 –
Investment in operationsnote (b) 32 – 4 36 (36) –
Totalnote (c) (270) (330) (214) (814) 814 –
Notes(a) Intragroup dividends (including statutory transfers) represent dividends that have been declared in the year and amounts accrued
in respect of statutory transfers.(b) Investment in operations reflects increases in share capital. (c) For long-term business operations, the difference between the total above of £814 million for intragroup dividends (including statutory
transfers) and investment in operations and the net cash flows to parent company of £829 million (as shown in note 8) primarily relates to timing differences arising on statutory transfers, intragroup loans and other non-cash items.

414
Prudential plc Annual Report 2011
Financial statements | European Embedded Value (EEV) basis supplementary information
10 Reconciliation of movement in shareholders’ equity (excluding non-controlling interests) continued
(iv) Other transfers from long-term business operations to Other operations in 2011 represent:
Asian operations
£m
US operations
£m
UK insurance
operations£m
Totallong-term
business operations
£m
Adjustment for net of tax asset management projected profits of covered business (15) (3) (22) (40)Other adjustments 4 4 4 12
(11) 1 (18) (28)
11 Tax attributable to shareholders’ profit
The tax charge comprises:
2011 £m 2010 £m
Tax charge on operating profit based on longer-term investment returns: Long-term business: Asian operationsnote (i) 402 329 US operations 487 509 UK insurance operationsnote (i) 221 260
1,110 1,098 Other operations (66) (106)
Total tax charge on operating profit based on longer-term investment returns, excluding exceptional tax credit 1,044 992
Exceptional tax creditnote (ii) – (158)
Total tax charge on operating profit based on longer-term investment returns, including exceptional tax credit 1,044 834
Tax credit on items not included in operating profit: Tax credit on short-term fluctuations in investment returnsnote (iii) (210) (222)Tax charge (credit) on shareholders’ share of actuarial and other gains and losses on defined
benefit pension schemes 6 (2)Tax (credit) charge on effect of changes in economic assumptions (64) 13 Tax credit on costs of terminated AIA transaction – (93)
Total tax credit on items not included in operating profit (268) (304)
Tax charge on profit attributable to shareholders (including tax on actual investment returns) 776 530
Notes(i) Including tax relief on Asia development expenses and restructuring costs borne by UK insurance operations.(ii) The 2010 tax charge on operating profit based on longer-term investment returns of £834 million included an exceptional tax credit
of £158 million which primarily related to the impact of a settlement agreed with the UK tax authorities.(iii) In 2010, the tax charge on short-term fluctuations in investment returns of £(222) million included a credit of £52 million for a net present value
reduction in US deferred tax liabilities following changes to variable annuity reserving in accordance with revised statutory guidance.
Notes on the EEV basis resultscontinued

415F
ina
ncia
l statem
en
tsE
EV
basis su
pp
lemen
tary
info
rmatio
n
12 Earnings per share (EPS)
2011 £m 2010 £m
Operating EPS: Operating profit before tax 3,978 3,696 Tax excluding exceptional tax credit (1,044) (992) Non-controlling interests (4) (4)
Operating profit after tax and non-controlling interests excluding exceptional tax credit 2,930 2,700 Exceptional tax credit* – 158
Operating profit after tax and non-controlling interests including exceptional tax credit 2,930 2,858 Operating EPS (pence) excluding exceptional tax credit 115.7p 106.9pExceptional tax credit (pence) – 6.3pOperating EPS (pence) including exceptional tax credit 115.7p 113.2p
Total EPS: Profit before tax 2,922 3,107 Tax (776) (530) Non-controlling interests (4) (4)
Total profit after tax and non-controlling interests 2,142 2,573 Total EPS (pence) including exceptional tax credit 84.6p 101.9p
Average number of shares (millions) 2,533 2,524
* The 2010 tax charge attributable to shareholders’ profit included an exceptional tax credit of £158 million which primarily related to the impact of a settlement agreed with the UK tax authorities.
The average number of shares reflects the average number in issue adjusted for shares held by employee trusts and consolidated unit trusts and OEICs which are treated as cancelled.
13 Changes to Group’s holdings
2010On 1 August 2010, Discovery Holdings of South Africa, the Group’s joint venture partner in its investment in PruHealth, completed the acquisition of the entire share capital of Standard Life Healthcare, a wholly-owned subsidiary of the Standard Life Group, for £138 million. Discovery funded the purchase of the Standard Life Healthcare transaction, and contributed Standard Life Healthcare to PruHealth as a capital investment on completion. As a result of the transaction, Discovery increased their shareholding in PruHealth from the previous level of 50 per cent to 75 per cent, and Prudential’s shareholding was reduced from 50 per cent of the previous joint venture structure to 25 per cent of the new structure with the much enlarged business. A gain of £3 million arose in 2010 upon the dilution, representing the difference between the fair value of the enlarged 25 per cent investment still held and the book value of the original 50 per cent investment holding.

416
Prudential plc Annual Report 2011
Financial statements | European Embedded Value (EEV) basis supplementary information
14 Reconciliation of net worth and value of in-force businessnote(i)
2011 £m
Free surplus
note 8
Required capital
Total net worth
Value ofin-force
businessnote (vii)
Totallong-term
business
GroupShareholders’ equity at 1 January 2011 2,748 3,415 6,163 12,051 18,214 New business contributionnotes (iv), (v) (553) 406 (147) 1,683 1,536 Existing business – transfer to net worth 1,862 (339) 1,523 (1,523) –Expected return on existing business 110 84 194 880 1,074 Changes in operating assumptions and experience variances 168 (42) 126 173 299 RPI to CPI inflation measure change on defined benefit
pension schemes 20 – 20 – 20 Changes in non-operating assumptions and
experience variances (507) (78) (585) (83) (668)
Profit after tax from long-term business 1,100 31 1,131 1,130 2,261 Exchange movements on foreign operations and
net investment hedges (15) 1 (14) (31) (45)Intragroup dividends (including statutory transfers) and
investment in operationsnote (ii) (1,028) – (1,028) 214 (814)Mark to market value movements on Jackson assets backing
surplus and required capital 62 – 62 – 62 Other transfers from net worth (28) – (28) – (28)
Shareholders’ equity at 31 December 2011 2,839 3,447 6,286 13,364 19,650
Representing:
Asian operations Shareholders’ equity at 1 January 2011 1,045 790 1,835 5,610 7,445 New business contributionnote (v) (297) 97 (200) 1,011 811 Existing business – transfer to net worth 597 21 618 (618) – Expected return on existing business 58 – 58 424 482 Changes in operating assumptions and experience variances 52 (40) 12 52 64 Changes in non-operating assumptions and
experience variances (49) (3) (52) 128 76
Profit after tax from long-term business 361 75 436 997 1,433 Exchange movements on foreign operations and
net investment hedges (23) (5) (28) (59) (87)Intragroup dividends (including statutory transfers) and
investment in operationsnote (ii) (305) – (305) 35 (270)Other transfers from net worth (11) – (11) – (11)
Shareholders’ equity at 31 December 2011 1,067 860 1,927 6,583 8,510
Notes on the EEV basis resultscontinued

417F
ina
ncia
l statem
en
tsE
EV
basis su
pp
lemen
tary
info
rmatio
n
2011 £m
Free surplus
note 8
Required capital
Total net worth
Value ofin-force
businessnote (vii)
Totallong-term
business
US operations Shareholders’ equity at 1 January 2011 1,163 1,505 2,668 2,131 4,799 New business contributionnote (v) (202) 232 30 500 530 Existing business – transfer to net worth 754 (288) 466 (466) – Expected return on existing business 42 46 88 139 227 Changes in operating assumptions and experience variances 154 2 156 27 183 Changes in non-operating assumptions and
experience variancesnote (iii) (432) (132) (564) 132 (432)
Profit after tax from long-term business 316 (140) 176 332 508 Exchange movements on foreign operations and
net investment hedges 8 6 14 28 42 Intragroup dividends (including statutory transfers) and
investment in operations (330) – (330) – (330)Mark to market value movements on Jackson assets backing
surplus and required capital 62 – 62 – 62 Other transfers to net worth 1 – 1 – 1
Shareholders’ equity at 31 December 2011 1,220 1,371 2,591 2,491 5,082
UK insurance operations Shareholders’ equity at 1 January 2011 540 1,120 1,660 4,310 5,970 New business contributionnote (v) (54) 77 23 172 195 Existing business – transfer to net worth 511 (72) 439 (439) – Expected return on existing business 10 38 48 317 365 Changes in operating assumptions and experience variances (38) (4) (42) 94 52 RPI to CPI inflation measure change on defined benefit
pension schemes 20 – 20 – 20 Changes in non-operating assumptions and
experience variances (26) 57 31 (343) (312)
Profit after tax from long-term business 423 96 519 (199) 320 Intragroup dividends (including statutory transfers) and
investment in operationsnote (ii) (393) – (393) 179 (214)Other transfers from net worth (18) – (18) – (18)
Shareholders’ equity at 31 December 2011 552 1,216 1,768 4,290 6,058
Notes(i) All figures are shown net of tax.(ii) The amounts shown in respect of free surplus and the value of in-force business for Asian and UK insurance operations for intragroup dividends
(including statutory transfers) and investment in operations include the repayment of contingent loan funding. Contingent loan funding represents amounts whose repayment to the lender is contingent upon future surpluses emerging from certain contracts specified under the arrangement. If insufficient surplus emerges on those contracts, there is no recourse to other assets of the Group and the liability is not payable to the degree of shortfall.
(iii) For US operations, changes in non-operating assumptions and experience variances for required capital reflects a release to free surplus following a reduction in the required asset risk charges arising from improvements to quality of the investment portfolio.

418
Prudential plc Annual Report 2011
Financial statements | European Embedded Value (EEV) basis supplementary information
14 Reconciliation of net worth and value of in-force businessnote(i) continued
(iv) The movements arising from new business contribution are as follows:
2011 £m 2010 £m
Free surplus invested in new business: Excluding Japan (553) (643) Japannote (vi) – (2) Totalnote (vi) (553) (645)Required capital 406 461
Total net worth (147) (184)Value of in-force business 1,683 1,616
Total post-tax new business contribution 1,536 1,432
(v) Free surplus invested in new business is as follows:
2011 £m
Asian operations (excluding
Japan)note (vi)
USoperations
UKinsurance
operations
Totallong-term
business operations(excluding
Japan)note (vi)
Japan note (vi)
Totallong-term
business operations
Pre-tax new business contributionnote 2 1,076 815 260 2,151 – 2,151 Tax (265) (285) (65) (615) – (615)
Post-tax new business contribution 811 530 195 1,536 – 1,536
Free surplus invested in new business (297) (202) (54) (553) – (553)
Post-tax new business contribution per £1 million free surplus invested 2.7 2.6 3.6 2.8 – 2.8
2010 £m
Asian operations (excluding
Japan)note (vi)
USoperations
UKinsurance
operations
Totallong-term
business operations(excluding
Japan)note (vi)
Japan note (vi)
Totallong-term
business operations
Pre-tax new business contributionnote 2 902 761 365 2,028 (1) 2,027 Tax (230) (266) (99) (595) – (595)
Post-tax new business contribution 672 495 266 1,433 (1) 1,432
Free surplus invested in new business (278) (300) (65) (643) (2) (645)
Post-tax new business contribution per £1 million free surplus invested 2.4 1.7 4.1 2.2 (0.5) 2.2
(vi) New business contribution and free surplus invested in new business for the Group’s Japanese insurance subsidiary, which ceased selling new business with effect from 15 February 2010, have been presented separately from those of the remainder of the Group.
Notes on the EEV basis resultscontinued

419F
ina
ncia
l statem
en
tsE
EV
basis su
pp
lemen
tary
info
rmatio
n
(vii) The value of in-force business includes the value of future margins from current in-force business less the cost of holding required capital and represents:
2011 £m
Asian operations
USoperations
UKinsurance
operations Group
Value of in-force business before deduction of cost of capital and of guarantees 6,922 3,222 4,598 14,742 Cost of capital (317) (135) (241) (693)Cost of time value of guaranteesnote (viii) (22) (596) (67) (685)
Net value of in-force business 6,583 2,491 4,290 13,364
2010 £m
Asian operations
USoperations
UKinsurance
operations Group
Value of in-force business before deduction of cost of capital and of guarantees 5,941 2,584 4,635 13,160 Cost of capital (321) (183) (236) (740)Cost of time value of guaranteesnote (viii) (10) (270) (89) (369)
Net value of in-force business 5,610 2,131 4,310 12,051
(viii) The change in the cost of time value of guarantees for US operations from £(270) million in 2010 to £(596) million in 2011 primarily relates to VA business, mainly arising from the new business written in the year, reflecting the increase in VA sales, and the reduction in the expected long-term rate of return for US equities of 1.4 per cent, driven by the reduction in US 10-year treasury bond rate, as shown in note 17a.
15 Expected transfer of value of in-force business to free surplus
The discounted value of in-force business and required capital can be reconciled to the 2011 and 2010 totals in the tables below for the emergence of free surplus as follows:
2011 £m 2010 £m
Required capitalnote 14 3,447 3,415 Value of in-force (VIF)note 14 13,364 12,051 Add back: deduction for cost of time value of guaranteesnote 14 685 369 Other itemsnote (1,214) (845)
16,282 14,990
NoteOther items represent amounts incorporated into VIF where there is no definitive timeframe for when the payments will be made or receipts received. In particular, other items includes the deduction of the value of the shareholders’ interest in the estate, the value of which is derived by increasing final bonus rates so as to exhaust the estate over the lifetime of the in-force with-profits business. This is an assumption to give an appropriate valuation. To be conservative this item is excluded from the expected free surplus generation profile below.

420
Prudential plc Annual Report 2011
Financial statements | European Embedded Value (EEV) basis supplementary information
15 Expected transfer of value of in-force business to free surplus continued
Cash flows are projected on a deterministic basis and are discounted at the appropriate risk discount rate. The modelled cash flows use the same methodology underpinning the Group’s embedded value reporting and so is subject to the same assumptions and sensitivities. The table below shows how the VIF generated by the in-force business and the associated required capital is modelled as emerging into free surplus over future years.
2011 £m
Expected period of conversion of future post-tax distributable earnings and required capital flows to free surplus
2011 total as shown above 1-5 years 6-10 years 11-15 years 16-20 years 21-40 years 40+ years
Asian operations 7,387 2,582 1,596 1,012 732 1,262 203 US operations 4,267 2,241 1,287 490 173 76 – UK insurance operations 4,628 1,864 1,166 743 453 394 8
Total 16,282 6,687 4,049 2,245 1,358 1,732 211
100% 41% 25% 14% 8% 11% 1%
2010 £m
Expected period of conversion of future post-tax distributable earnings and required capital flows to free surplus
2010 total as shown above 1-5 years 6-10 years 11-15 years 16-20 years 21-40 years 40+ years
Asian operations 6,329 2,304 1,407 866 591 1,009 152 US operations 4,078 2,358 1,007 421 173 119 – UK insurance operations 4,583 1,792 1,173 755 468 389 6
Total 14,990 6,454 3,587 2,042 1,232 1,517 158
100% 43% 24% 14% 8% 10% 1%
Notes on the EEV basis resultscontinued

421F
ina
ncia
l statem
en
tsE
EV
basis su
pp
lemen
tary
info
rmatio
n
16 Sensitivity of results to alternative assumptions
a Sensitivity analysis – economic assumptionsThe tables below show the sensitivity of the embedded value as at 31 December 2011 (31 December 2010) and the new business contribution after the effect of required capital for 2011 and 2010 to:
• 1 per cent increase in the discount rates,• 1 per cent increase and decrease in interest rates, including all consequential changes (assumed investment returns for all asset
classes, market values of fixed interest assets, risk discount rates),• 1 per cent rise in equity and property yields,• 10 per cent fall in market value of equity and property assets (embedded value only), • holding company statutory minimum capital (by contrast to required capital), (embedded value only),• 5 basis point increase in UK long-term expected defaults, and• 10 basis point increase in the liquidity premium for UK shareholder-backed annuities.
In each sensitivity calculation, all other assumptions remain unchanged except where they are directly affected by the revised economic conditions.
New business profit per operating profit summary
2011 £m
Asianoperations
USoperations
UKinsurance
operations
Totallong-term
businessoperations
New business profit for 2011note 10 1,076 815 260 2,151
Discount rates – 1% increase (139) (45) (36) (220)Interest rates – 1% increase 2 81 5 88 Interest rates – 1% decrease (72) (117) (6) (195)Equity/property yields – 1% rise 50 92 11 153 Long-term expected defaults – 5 bps increase – – (8) (8)Liquidity premium – 10 bps increase – – 16 16
2010 £m
Asianoperations
USoperations
UKinsurance
operations
Totallong-term
businessoperations
New business profit for 2010 901 761 365 2,027
Discount rates – 1% increase (111) (51) (53) (215)Interest rates – 1% increase (7) 34 (8) 19 Interest rates – 1% decrease (20) (40) 8 (52)Equity/property yields – 1% rise 41 63 12 116 Long-term expected defaults – 5 bps increase – – (13) (13)Liquidity premium – 10 bps increase – – 26 26

422
Prudential plc Annual Report 2011
Financial statements | European Embedded Value (EEV) basis supplementary information
Notes on the EEV basis resultscontinued
16 Sensitivity of results to alternative assumptions continued
Embedded value of long-term business operations
2011 £m
Asianoperations
USoperations
UKinsurance
operations
Totallong-term
businessoperations
31 December 2011note 10 8,510 5,082 6,058 19,650
Discount rates – 1% increase (771) (147) (443) (1,361)Interest rates – 1% increase (376) (106) (343) (825)Interest rates – 1% decrease 253 58 400 711 Equity/property yields – 1% rise 329 185 205 719 Equity/property market values – 10% fall (159) 16 (326) (469)Statutory minimum capital 114 92 4 210 Long-term expected defaults – 5 bps increase – – (98) (98)Liquidity premium – 10 bps increase – – 196 196
2010 £m
Asianoperations
USoperations
UKinsurance
operations
Totallong-term
businessoperations
31 December 2010note 10 7,445 4,799 5,970 18,214
Discount rates – 1% increase (643) (164) (437) (1,244)Interest rates – 1% increase (220) (148) (254) (622)Interest rates – 1% decrease 176 103 336 615 Equity/property yields – 1% rise 308 120 227 655 Equity/property market values – 10% fall (174) (5) (339) (518)Statutory minimum capital 104 127 5 236 Long-term expected defaults – 5 bps increase – – (87) (87)Liquidity premium – 10 bps increase – – 174 174
The sensitivities shown above are for the impact of instantaneous changes on the embedded value of long-term business operations and include the combined effect on the value of in-force business and net assets at the balance sheet dates indicated. If the change in assumption shown in the sensitivities were to occur, then the effect shown above would be recorded within two components of the profit analysis for the following year. These are for the effect of economic assumption changes and, to the extent that asset value changes are included in the sensitivities, within short-term fluctuations in investment returns. In addition to the sensitivity effects shown above, the other components of the profit for the following year would be calculated by reference to the altered assumptions, for example, new business contribution and unwind of discount, together with the effect of other changes such as altered corporate bond spreads.

423F
ina
ncia
l statem
en
tsE
EV
basis su
pp
lemen
tary
info
rmatio
n
b Sensitivity analysis – non-economic assumptionsThe tables below show the sensitivity of the embedded value as at 31 December 2011 (31 December 2010) and the new business contribution after the effect of required capital for 2011 and 2010 to:
• 10 per cent proportionate decrease in maintenance expenses (a 10 per cent sensitivity on a base assumption of £10 per annum would represent an expense assumption of £9 per annum),
• 10 per cent proportionate decrease in lapse rates (a 10 per cent sensitivity on a base assumption of 5 per cent would represent a lapse rate of 4.5 per cent per annum), and
• 5 per cent proportionate decrease in base mortality and morbidity rates (ie increased longevity).
New business profit per operating profit summary
2011 £m
Asianoperations
USoperations
UKinsurance
operations
Totallong-term
businessoperations
New business profit for 2011note 10 1,076 815 260 2,151
Maintenance expenses – 10% decrease 26 11 7 44 Lapse rates – 10% decrease 92 24 10 126 Mortality and morbidity – 5% decrease 60 9 (9) 60 Change representing effect on: Life business 60 9 3 72 UK annuities – – (12) (12)
2010 £m
Asianoperations
USoperations
UKinsurance
operations
Totallong-term
businessoperations
New business profit for 2010 901 761 365 2,027
Maintenance expenses – 10% decrease 27 9 5 41 Lapse rates – 10% decrease 81 31 8 120 Mortality and morbidity – 5% decrease 50 7 (20) 37 Change representing effect on: Life business 50 7 1 58 UK annuities – – (21) (21)

424
Prudential plc Annual Report 2011
Financial statements | European Embedded Value (EEV) basis supplementary information
Notes on the EEV basis resultscontinued
16 Sensitivity of results to alternative assumptions continued
Embedded value of long-term business operations
2011 £m
Asianoperations
USoperations
UKinsurance
operations
Totallong-term
businessoperations
31 December 2011note 10 8,510 5,082 6,058 19,650
Maintenance expenses – 10% decrease 117 44 52 213 Lapse rates – 10% decrease 342 157 65 564 Mortality and morbidity – 5% decrease 289 92 (227) 154 Change representing effect on: Life business 289 92 12 393 UK annuities – – (239) (239)
2010 £m
Asianoperations
USoperations
UKinsurance
operations
Totallong-term
businessoperations
31 December 2010note 10 7,445 4,799 5,970 18,214
Maintenance expenses – 10% decrease 104 39 48 191 Lapse rates – 10% decrease 293 158 67 518 Mortality and morbidity – 5% decrease 233 81 (181) 133 Change representing effect on: Life business 233 81 12 326 UK annuities – – (193) (193)
Effect of proposed changes in UK corporation tax rateThe 2011 results include the effect of the change in the UK corporate tax rate that has been enacted to revise the rate to 25 per cent from 1 April 2012. The impact of further reductions in the UK corporate tax rate of 1 per cent per annum to 23 per cent in 2014 would be an increase in the net of tax value of in-force business of UK insurance operations at 31 December 2011 of around £60 million.

425F
ina
ncia
l statem
en
tsE
EV
basis su
pp
lemen
tary
info
rmatio
n
17 Assumptions
a PrincipaleconomicassumptionsDeterministicassumptionsThe tables below summarise the principal financial assumptions: Assumed investment returns reflect the expected future returns on the assets held and allocated to the covered business at the valuation date. Equity risk premiums in Asia range from 3.25 per cent to 8.7 per cent for both years. In the US and the UK, the equity risk premium is 4.0 per cent for both years.
Asianoperationsnotes (i), (ii), (v)
31 December 2011 %
China HongKongnotes
(ii), (iv)
India
Indonesia Japan Korea
Malaysianotes
(iii), (iv)
Philippines Singapore
note (iv)
Taiwan
Thailand
Vietnam
Risk discount rate: New business 10.0 3.85 13.75 11.15 – 7.1 6.4 12.2 3.9 5.0 10.1 19.6 In-force 10.0 3.7 13.75 11.15 4.7 7.1 6.5 12.2 4.65 5.0 10.1 19.6 Expected long-term
rate of inflation 2.5 2.25 4.0 5.0 0.0 3.0 2.5 4.0 2.0 1.0 3.0 6.5 Government
bond yield 3.5 1.9 8.75 6.1 1.0 3.8 3.7 5.4 1.6 1.3 3.3 12.9
31 December 2010 %
China HongKongnotes
(ii), (iv)
India
Indonesia Japan Korea
Malaysianotes
(iii), (iv)
Philippines Singapore
note (iv)
Taiwan
Thailand
Vietnam
Risk discount rate: New business 10.45 5.1 13.1 13.0 4.9 7.9 7.0 13.2 5.4 5.0 10.5 18.85 In-force 10.45 5.1 13.1 13.0 4.9 8.1 7.1 13.2 6.1 5.2 10.5 18.85 Expected long-term
rate of inflation 2.5 2.25 4.0 5.0 0.0 3.0 2.5 4.0 2.0 1.0 3.0 5.5 Government
bond yield 3.95 3.3 8.1 7.75 1.1 4.6 4.0 6.4 2.7 1.6 3.8 12.1
Asiatotal %
2011 2010
Weighted risk discount rate:note (i) New business (excluding Japan) 7.4 8.4 In-force 6.9 8.1
Notes(i) The weighted risk discount rates for Asian operations shown above have been determined by weighting each country’s risk discount rates by
reference to the EEV basis new business result and the closing value of in-force business. The risk discount rates for individual Asian territories reflect the movement in government bond yields, together with the effects of movements in the allowance for market risk and changes in product mix.
(ii) For Hong Kong the assumptions shown are for US dollar denominated business which comprises the largest proportion of the in-force business. For other territories, the assumptions are for local currency denominated business which reflects the largest proportion of the in-force business.
(iii) The risk discount rate for Malaysia reflects both the Malaysia life and Takaful operations.

426
Prudential plc Annual Report 2011
Financial statements | European Embedded Value (EEV) basis supplementary information
Notes on the EEV basis resultscontinued
17 Assumptions continued
(iv) The mean equity return assumptions for the most significant equity holdings in the Asian operations were:
2011 % 2010 %
Hong Kong 5.9 7.3 Malaysia 9.7 10.0 Singapore 7.7 8.7
To obtain the mean, an average over all simulations of the accumulated return at the end of the projection period is calculated. The annual average return is then calculated by taking the root of the average accumulated return minus one.
(v) In preparing the EEV basis results for 2011 and 2010 the ‘active’ basis of economic assumption setting has been applied for all Asian operations. Previously, the EEV basis results for Japan, Korea and US dollar denominated business written in Hong Kong were determined on the
‘active’ basis. For other Asian countries the investment return assumptions and risk discount rates were based on an assessment of longer-term economic conditions (the ‘passive’ basis). The altered approach with effect from full year 2010 to determine the EEV basis results for all Asian territories on an ‘active basis’ of economic assumption setting is in line with the Group’s other operations, and reflects the fact that markets in a number of Asian countries are becoming increasingly developed.
The effect of the change in 2010 to move to an ‘active’ basis for Asia operations was as follows:
Effect on: 2010 £m
Pre-tax operating profits from: New businessnote 2 5 Business in forcenote 3 (58)
Total (53)Short-term fluctuations in investment returns and changes in economic assumptions 16
Total profit before tax (37)
Shareholders’ equity as at 31 December 2010 (39)
US operations
2011 % 2010 %
Assumed new business spread margins:note (iii)
Fixed Annuity business*note (i) 1.75 to 2.0 2.0 Fixed Index Annuity business 2.25 2.5 Institutional business 1.0 – Risk discount rate:note (iv) Variable annuity 6.7 7.8 Non-variable annuity 4.6 5.6 Weighted average total:note (ii)
New business 6.5 7.6 In-force 6.0 6.9 US 10-year treasury bond rate at end of year 1.9 3.3 Pre-tax expected long-term nominal rate of return for US equities 5.9 7.3 Expected long-term rate of inflation 2.0 2.3
* including the proportion of variable annuity business invested in the general account.

427F
ina
ncia
l statem
en
tsE
EV
basis su
pp
lemen
tary
info
rmatio
n
Notes(i) For new business issuances in 2011, the assumed spread margin for fixed annuity business and for the proportion of variable annuity business
invested in the general account is assumed to grade from 1.75 per cent to 2.0 per cent over five years. For new business issuances in 2010, the assumed spread margin for fixed annuity business and for the proportion of variable annuity business invested in the general account applies from inception.
(ii) The weighted average risk discount rates reflect the mix of business between variable annuity and non-variable annuity business. The decrease in the weighted average risk discount rates from 2010 to 2011 primarily reflects the decrease in the US 10-year Treasury bond rate of 140 basis points, partly offset by the effect of the increase in additional allowance for credit risk (as described in note (iii) below) and the impact of the increase in allowance for market risk.
(iii) Credit risk treatment The projected cash flows incorporate the expected long-term spread between the earned rate and the rate credited to policyholders. The
projected earned rates reflect book value yields which are adjusted over time to reflect projected reinvestment rates. Positive net cash flows are assumed to be reinvested in a mix of corporate bonds, commercial mortgages and limited partnerships. The yield on those assets is assumed to grade from the current level to a yield that allows for a long-term assumed credit spread on the reinvested assets of 1.25 per cent over 10 years. The yield also reflects an allowance for a RMR, which for 2011 is 27 basis points (2010: 26 basis points) for longer-term defaults as described in note 1b(iii), which represents the allowance as at the valuation date applied in the cash flow projections of the value of the in-force business.
In the event that longer-term default levels are higher, then, unlike for UK annuity business where policyholder benefits are not changeable, Jackson has some discretion to adjust crediting rates, subject to contract guarantee levels and general market competition considerations.
(iv) For US operations, the risk discount rates shown above include an additional allowance for a combination of credit risk premium and short-term downgrade and default allowance for general account business of 200 basis points (2010: 150 basis points) and for variable annuity business of 40 basis points (2010: 30 basis points) to reflect the fact that a proportion of the variable annuity business is allocated to the general account (as described in note 1b(iii)).
UK insurance operations
2011 % 2010 %
Shareholder-backed annuity business:note (iv)
Risk discount rate: New businessnote (i) 7.7 7.3 In-forcenote (ii) 8.6 9.9 Pre-tax expected long-term nominal rate of return for shareholder-backed annuity business: New business: Fixed annuities 4.95 4.9 Inflation-linked annuities 4.4 5.1 In-force:note (ii) Fixed annuities 4.5 5.1 Inflation-linked annuities 4.1 5.2 Other business:note (iv) Risk discount rate:note (iii) New business 5.3 6.9 In-force 5.65 7.0 Pre-tax expected long-term nominal rates of investment return: UK equities 6.5 8.0 Overseas equities 5.9 to 9.9 7.3 to 10.2 Property 5.2 6.7 Gilts 2.5 4.0 Corporate bonds 4.0 5.7 Expected long-term rate of inflation 3.0 3.55 Post-tax expected long-term nominal rate of return for the PAC with-profits fund: Pension business (where no tax applies) 5.1 6.7 Life business 4.4 5.9
Notes(i) The new business risk discount rate for shareholder-backed annuity business incorporates a default allowance for best estimate defaults in
respect of assets purchased with new business monies received in 2011. The increase in the risk discount rate from 2010 to 2011 reflects the profile of the release of additional credit risk provisions, appropriate to the new business assets, over the projected lifetime of this business. These additional provisions comprise of a credit risk premium, which is derived from Moody’s data from 1970 to 2009, an allowance for a 1 notch downgrade of the portfolio subject to credit risk and an allowance for short-term defaults.

428
Prudential plc Annual Report 2011
Financial statements | European Embedded Value (EEV) basis supplementary information
Notes on the EEV basis resultscontinued
17 Assumptions continued
(ii) For shareholder-backed annuity business, the movement in the pre-tax long-term nominal rates of return and the risk discount rates for in-force business reflect the combined effect of changes in asset yields and changes to the aggregate credit risk allowances as shown in note (iv) below.
(iii) The risk discount rates for new business and business in force for UK insurance operations other than shareholder-backed annuities reflect weighted rates based on the type of business.
(iv) Credit spread treatment For with-profits business, the embedded value reflects the discounted value of future shareholder transfers. These transfers are directly
affected by the level of projected rates of return on investments, including debt securities. The assumed earned rate for with-profit holdings of corporate bonds is defined as the risk-free rate plus an assessment of the long-term spread over gilts, net of expected long-term defaults. This approach is similar to that applied for equities and properties for which the projected earned rate is defined as the risk-free rate plus a long-term risk premium.
For UK shareholder-backed annuity business, different dynamics apply both in terms of the nature of the business and the EEV methodology applied. For this type of business the assets are generally held to maturity to match long duration liabilities. It is therefore appropriate under EEV methodology to include a liquidity premium in the economic basis used. The appropriate EEV risk discount rate is set in order to equate the EEV with a ‘market consistent embedded value’ including liquidity premium. The liquidity premium in the ‘market consistent embedded value’ is derived from the yield on the assets held after deducting an appropriate allowance for credit risk. For PRIL, which has approximately 90 per cent of UK shareholder-backed annuity business, the allowance for credit risk for the in-force business at 31 December 2011 is made up of:(a) 15 basis points for fixed annuities and 14 basis points for inflation-linked annuities in respect of long-term expected defaults. This is derived
by applying Moody’s data from 1970 to 2009 and the definition of the credit rating used is the second highest credit rating published by Moody’s, Standard and Poor’s and Fitch; and
(b) 52 basis points for fixed annuities and 47 basis points for inflation-linked annuities in respect of additional provisions which comprise a credit risk premium, which is derived from Moody’s data from 1970 to 2009, an allowance for a 1 notch downgrade of the portfolio subject to credit risk and an allowance for short-term defaults.
The credit assumptions used and the residual liquidity premium element of the bond spread over swap rates is as follows:
New businessnote (1) 2011 (bps) 2010 (bps)
Bond spread over swap rates 139 117 Total credit risk allowancenote (2) 35 38
Liquidity premium 104 79
In-force business 2011 (bps) 2010 (bps)
Bond spread over swap rates 201 160
Credit risk allowance: Long-term expected defaults 15 16 Additional provisions 51 52
Total credit risk allowancenote (2) 66 68
Liquidity premium 135 92
Notes (1) The new business liquidity premium is based on the weighted average of the point of sale liquidity premium. (2) Specific assets are allocated to the new business for the year with the appropriate allowance for credit risk which was 35 basis points
(2010: 38 basis points). The reduced allowance for new business in comparison to that for the in-force book reflects the assets held and other factors that influence the necessary level of provision.
The overall allowance for credit risk is prudent by comparison with historic rates of default and would be sufficient to withstand a wide range of extreme credit events over the expected lifetime of the annuity business.

429F
ina
ncia
l statem
en
tsE
EV
basis su
pp
lemen
tary
info
rmatio
n
Stochastic assumptionsThe economic assumptions used for the stochastic calculations are consistent with those used for the deterministic calculations described above. Assumptions specific to the stochastic calculations, such as the volatilities of asset returns, reflect local market conditions and are based on a combination of actual market data, historic market data and an assessment of longer-term economic conditions. Common principles have been adopted across the Group for the stochastic asset models, for example, separate modelling of individual asset classes but with allowance for correlation between the various asset classes. Details are given below of the key characteristics and calibrations of each model.
Asian operations• The same asset return models as described for UK insurance operations below, appropriately calibrated, have been used for Asian
operations. The principal asset classes are government and corporate bonds. Equity holdings are much lower than in the UK while property holdings do not represent a significant investment asset;
• The stochastic cost of guarantees is primarily only of significance for the Hong Kong, Korea, Malaysia and Singapore operations; and• The mean stochastic returns are consistent with the mean deterministic returns for each country. The expected volatility of equity
returns ranges from 18 per cent to 35 per cent, and the volatility of government bond yields ranges from 0.9 per cent to 2.4 per cent for both years.
US operations (Jackson)• Interest rates are projected using a log-normal generator calibrated to historical US Treasury yield curves;• Corporate bond returns are based on Treasury securities plus a spread that has been calibrated to current market conditions and
varies by credit quality; and• Variable annuity equity returns and bond interest rates have been stochastically generated using a log-normal model with parameters
determined by reference to historical data. The volatility of equity fund returns for 2011 and 2010 ranges from 19 per cent to 32 per cent, depending on the risk class and the class of equity, and the standard deviation of interest rates ranges from 2.1 per cent to 2.4 per cent (2010: 2.0 per cent to 2.4 per cent).
UK insurance operations• Interest rates are projected using a two-factor model calibrated to the initial market yield curve;• The risk premium on equity assets is assumed to follow a log-normal distribution;• The corporate bond return is calculated as the return on a zero-coupon bond plus a spread. The spread process is a mean reverting
stochastic process; and• Property returns are modelled in a similar fashion to corporate bonds, namely as the return on a risk-free bond, plus a risk premium,
plus a process representative of the change in residual values and the change in value of the call option on rents.
Mean returns have been derived as the annualised arithmetic average return across all simulations and durations. For each projection year, standard deviations have been calculated by taking the square root of the annualised variance of the returns over all the simulations. These have been averaged over all durations in the projection. For equity and property, the standard deviations relate to the total return on these assets. The standard deviations applied for all years are as follows:
2011 % 2010 %
Equities: UK 20 18 Overseas 18 18 Property 15 15

430
Prudential plc Annual Report 2011
Financial statements | European Embedded Value (EEV) basis supplementary information
Notes on the EEV basis resultscontinued
17 Assumptions continued
b Demographic assumptionsPersistency, mortality and morbidity assumptions are based on an analysis of recent experience but also reflect expected future experience. Where relevant, when calculating the time value of financial options and guarantees, policyholder withdrawal rates vary in line with the emerging investment conditions according to management’s expectations.
c Expense assumptionsExpense levels, including those of service companies that support the Group’s long-term business operations, are based on internal expense analysis investigations and are appropriately allocated to acquisition of new business and renewal of in-force business. Exceptional expenses are identified and reported separately. It is Prudential’s policy not to take credit for future cost reduction programmes until the savings have been delivered. For Asian life operations, the expenses comprise costs borne directly and recharged costs from the Asian regional head office, that are attributable to covered business. The assumed future expenses for these operations also include projections of these future recharges. Development expenses are charged as incurred.
Corporate expenditure comprises:
• Expenditure for group head office, to the extent not allocated to the PAC with-profits funds, together with Solvency II implementation and restructuring costs, which are charged to the EEV basis results as incurred; and
• Expenditure of the Asian regional head office that is not allocated to the covered business or asset management operations, and is charged as incurred. These costs are primarily for corporate related activities and included within corporate expenditure.
d Taxation and other legislationCurrent taxation and other legislation have been assumed to continue unaltered except where changes have been announced and substantively enacted in the year.

431Fin
ancia
l statem
ents
EE
V b
asis sup
plem
entary
in
form
ation
18 New business premiums and contributionsnotes (i), (ii)
Single Regular
Annual premium and contribution
equivalents (APE)
Present value of new business premiums
(PVNBP)
2011 £m 2010 £m 2011 £m 2010 £m 2011 £m 2010 £m 2011 £m 2010 £m
Group insurance operations Asia – excluding Indianote (iii) 1,321 1,019 1,426 1,211 1,559 1,313 8,444 6,911 India 135 85 88 180 101 188 466 582
Asia 1,456 1,104 1,514 1,391 1,660 1,501 8,910 7,493 US 12,562 11,417 19 22 1,275 1,164 12,720 11,572 UK 4,871 5,656 259 254 746 820 6,111 6,842
Group total 18,889 18,177 1,792 1,667 3,681 3,485 27,741 25,907 Group total – excluding India 18,754 18,092 1,704 1,487 3,580 3,297 27,275 25,325
Asian insurance operations Hong Kong 180 107 313 276 331 287 2,023 1,693 Indonesia 250 141 338 269 363 283 1,435 1,011 Malaysia 79 58 215 198 223 204 1,225 1,153 Philippines 95 64 20 17 30 23 153 108 Singapore 371 318 198 143 235 175 1,855 1,357 Thailand 11 15 26 25 27 26 102 100 Vietnam 1 1 42 41 42 41 143 148
SE Asian operations including Hong Kong 987 704 1,152 969 1,251 1,039 6,936 5,570 Chinanote (iv) 46 103 54 48 59 58 294 336 Korea 71 66 94 89 101 96 542 486 Taiwan 217 146 126 105 148 120 672 519
Total Asian operations – excluding Indianote (iii) 1,321 1,019 1,426 1,211 1,559 1,313 8,444 6,911 India 135 85 88 180 101 188 466 582
Total Asian operations 1,456 1,104 1,514 1,391 1,660 1,501 8,910 7,493
US insurance operations Fixed annuities 472 836 – – 47 84 472 836 Fixed index annuities 934 1,089 – – 93 109 934 1,089 Life 10 11 19 22 20 23 168 166 Variable annuities 10,909 9,481 – – 1,091 948 10,909 9,481 Wholesale 237 – – – 24 – 237 –
Total US insurance operations 12,562 11,417 19 22 1,275 1,164 12,720 11,572
UK and Europe insurance operations Direct and partnership annuities 328 593 – – 33 59 328 593 Intermediated annuities 241 221 – – 24 22 241 221 Internal vesting annuities 1,223 1,235 – – 122 124 1,223 1,235
Total individual annuities 1,792 2,049 – – 179 205 1,792 2,049
Corporate pensions 184 228 215 198 233 221 1,224 1,099 Onshore bonds 1,779 1,660 – – 178 166 1,781 1,660 Other products 780 774 44 56 122 133 978 1,089 Wholesale 336 945 – – 34 95 336 945
Total UK and Europe insurance operationsnote (v) 4,871 5,656 259 254 746 820 6,111 6,842
Group Total 18,889 18,177 1,792 1,667 3,681 3,485 27,741 25,907
Group Total – excluding India 18,754 18,092 1,704 1,487 3,580 3,297 27,275 25,325

432
Prudential plc Annual Report 2011
18 New business premiums and contributionsnotes (i), (ii) continued
Notes(i) The tables shown above are provided as an indicative volume measure of transactions undertaken in the reporting period that have the
potential to generate profits for shareholders. The amounts shown are not, and not intended to be, reflective of premium income recorded in the IFRS income statement.
APE are calculated as the aggregate of regular new business amounts and one-tenth of single new business amounts and are subject to roundings. The PVNBP are calculated as equalling single premiums plus the present value of expected premiums of new regular premium business, allowing for lapses and other assumptions made in determining the EEV new business contribution.
New business premiums reflect those premiums attaching to covered business, including premiums for contracts classified as investment products for IFRS basis reporting. New business premiums for regular premium products are shown on an annualised basis. Internal vesting business is classified as new business where the contracts include an open market option.
(ii) For 2010, the table above excludes new business sales for the Group’s Japanese insurance subsidiary, which ceased selling new business with effect from 15 February 2010.
(iii) New business in India is included at Prudential’s 26 per cent interest in the India life operation.(iv) New business in China is included at Prudential’s 50 per cent in the China life operation.(v) UK wholesale sales for 2010 and 2011 include amounts for a small number of bulk annuity buy-in insurance agreements with an APE of
£93 million and £33 million respectively.
19 Post balance sheet events
On 22 February 2012, M&G completed transactions to: (i) exchange bonus share rights for equity holdings with the employees of PPM South Africa, and (ii) the sale of a 10 per cent holding in the majority of the business to Thesele Group, a minority shareholder, for cash. Following these transactions M&G’s holding in the majority of the business reduced from 75 per cent to 47 per cent. Under IFRS requirements the divestment is accounted for as the disposal of the 75 per cent holding and an acquisition of a 47 per cent holding at fair value. As a consequence of the IFRS application, the transactions give rise to a gain on dilution of approximately £40 million. On an EEV basis, consistent with IFRS, this amount will be accounted for in the Group 2012 summarised consolidated income statement as a gain on dilution, excluded from the Group’s EEV operating profit based on longer-term investment returns.
Financial statements | European Embedded Value (EEV) basis supplementary information
Notes on the EEV basis resultscontinued

433Fin
ancia
l statem
ents
Prudential plc Annual Report 2011Prudential plc Annual Report 2011Prudential plc Annual Report 2011
Statemen
t of d
irectors’
respo
nsib
ilities Financial statements | Statement of directors’ responsibilities
The directors have chosen to prepare supplementary information in accordance with the EEV Principles issued in May 2004 by the European CFO Forum as supplemented by the Additional Guidance on EEV Disclosures issued in October 2005.
When compliance with the EEV Principles is stated, those principles require the directors to prepare supplementary information in accordance with the Embedded Value Methodology (EVM) contained in the EEV Principles and to disclose and explain any non-compliance with the EEV guidance included in the EEV Principles.
In preparing the EEV supplementary information, the directors have:
• prepared the supplementary information in accordance with the EEV Principles,
• identified and described the business covered by the EVM,• applied the EVM consistently to the covered business,• determined assumptions on a realistic basis, having regard to
past, current and expected future experience and to any relevant external data, and then applied them consistently,
• made estimates that are reasonable and consistent, and• described the basis on which business that is not covered
business has been included in the supplementary information, including any material departures from the accounting framework applicable to the Group’s financial statements.
Statement of directors’ responsibilities in respect of the European Embedded Value (EEV) basis supplementary information

434
Prudential plc Annual Report 2011
Independent auditor’s report to Prudential plc on the European Embedded Value (EEV) basis supplementary information
We have audited the EEV basis supplementary information (‘the supplementary information’) of Prudential plc (‘the Company’) for the year ended 31 December 2011 set out on pages 385 to 432. The financial reporting framework that has been applied in the preparation of the supplementary information is the European Embedded Value Principles issued in May 2004 by the European CFO Forum as supplemented by the Additional Guidance on European Embedded Value Disclosures issued in October 2005 (together ‘the EEV Principles’) using the methodology and assumptions set out on pages 391 to 396 and 425 to 430 respectively. The supplementary information should be read in conjunction with the Group financial statements which are on pages 163 to 370.
This report is made solely to the Company in accordance with the terms of our engagement. Our audit work has been undertaken so that we might state to the Company those matters we have been engaged to state in this report and for no other purpose. To the fullest extent permitted by law, we do not accept or assume responsibility to anyone other than the Company for our audit work, for this report, or for the opinions we have formed.
Respective responsibilities of directors and auditorAs explained more fully in the Directors’ Responsibilities Statement set out on page 433, the directors have accepted responsibility for the preparation of the supplementary information on the EEV basis in accordance with the EEV Principles.
Our responsibility is to audit, and express an opinion on, the supplementary information in accordance with the terms of our engagement and having regard to International Standards on Auditing (UK and Ireland). Those standards require us to comply with the Auditing Practices Board’s Ethical Standards for Auditors.
Scope of the audit of the supplementary informationAn audit involves obtaining evidence about the amounts and disclosures in the supplementary information sufficient to give reasonable assurance that the supplementary information is free from material misstatement, whether caused by fraud or error. This includes an assessment of: whether the accounting policies are appropriate to the Group’s circumstances and have been consistently applied and adequately disclosed; and the reasonableness of significant accounting estimates made by the directors. In view of the purpose for which the supplementary information has been prepared, however, we did not assess the overall presentation of the supplementary information which would have been required if we were to express an audit opinion under International Standards on Auditing (UK and Ireland). Opinion on supplementary informationIn our opinion, the EEV basis supplementary information of the Company for the year ended 31 December 2011 has been properly prepared, in all material respects, in accordance with the EEV Principles using the methodology and assumptions set out on pages 391 to 396 and 425 to 430 respectively.
G Bainbridge
for and on behalf of KPMG Audit Plc Chartered Accountants London
12 March 2012
Financial statements | Independent auditor’s report

435F
ina
ncia
l statem
en
tsA
dd
ition
al un
aud
ited
finan
cial info
rmatio
n
Index to the additional unaudited financial information
I. SelectedhistoricalfinancialinformationofPrudential436 Selected historical financial information of PrudentialII. IFRSprofitandlossinformation439 (a) Analysis of long-term insurance business pre-tax IFRS
operating profit based on longer term investment returns by driver
444 (b) Asian operations – analysis of IFRS operating profit by territory
445 (c) Analysis of asset management operating profit based on longer-term investment return
III. IFRSbalancesheetinformation446 (a) Adoption of altered US GAAP requirements to Group
IFRS reporting in 2012451 (b) IFRS shareholders’ fund summary by business unit and
net asset value per share
IV. Otherinformation452 (a) Reconciliation of expected transfer of fair value of
in-force (VIF) and required capital business of free surplus
457 (b) Funds under management457 (c) Effect of foreign currency rate movements on results460 (d) Option schemes

436
Prudential plc Annual Report 2011
Financial statements | Additional unaudited financial information
Additional unaudited financial information
I: Selected historical financial information of Prudential
The following table sets forth Prudential’s selected consolidated financial data for the periods indicated. Certain data is derived from Prudential’s audited consolidated financial statements prepared in accordance with International Financial Reporting Standards (IFRS) as issued by the International Accounting Standards Board (IASB) and as adopted by the European Union (EU) and European Embedded Value (EEV). This table is only a summary and should be read in conjunction with Prudential’s consolidated financial statements and the related notes included elsewhere in this document.
Incomestatementdata
Yearended31December
2011 £m 2010 £m 2009 £m 2008 £m 2007 £m
IFRS basis results Gross premium earned 25,706 24,568 20,299 18,993 18,359 Outward reinsurance premiums (429) (357) (323) (204) (171)
Earned premiums, net of reinsurance 25,277 24,211 19,976 18,789 18,188 Investment return 9,360 21,769 26,889 (30,202) 12,225 Other income 1,869 1,666 1,234 1,146 2,457
Total revenue, net of reinsurance 36,506 47,646 48,099 (10,267) 32,870
Benefits and claims and movement in unallocated surplus of with-profits funds, net of reinsurance (29,289) (40,518) (41,195) 10,824 (26,785)
Acquisition costs and other expenditure (5,005) (4,799) (4,572) (2,459) (4,859) Finance costs: interest on core structural borrowings of
shareholder-financed operations (286) (257) (209) (172) (168) Loss on sale of Taiwan agency business – – (559) – –
Total charges, net of reinsurance (34,580) (45,574) (46,535) 8,193 (31,812)
Profit (loss) before tax (being tax attributable to shareholders’ and policyholders’ returns) (1) 1,926 2,072 1,564 (2,074) 1,058
Tax credit (charge) attributable to policyholders’ returns 17 (611) (818) 1,624 5
Profit (loss) before tax attributable to shareholders 1,943 1,461 746 (450) 1,063 Tax (charge) credit attributable to shareholders’ returns (449) (25) (55) 59 (354)
Profit (loss) from continuing operations after tax 1,494 1,436 691 (391) 709 Discontinued operations (net of tax) – – (14) – 241
Profit (loss) for the year 1,494 1,436 677 (391) 950
Based on profit (loss) for the year attributable to the equity
holders of the Company: Basic earnings per share (in pence) 58.8p 56.7p 27.0p (16.0)p 38.7p Diluted earnings per share (in pence) 58.7p 56.6p 27.0p (16.0)p 38.6p Dividend per share declared and paid in reporting period
(in pence) 25.19p 20.17p 19.20p 18.29p 17.42p

437F
ina
ncia
l statem
en
tsA
dd
ition
al un
aud
ited
finan
cial info
rmatio
n
SupplementaryIFRSincomestatementdata
Yearended31December
2011 £m 2010 £m 2009 £m 2008 £m 2007 £m
Operating profit based on longer-term investment returns(note 2) 2,070 1,941 1,564 1,212 1,152 Short-term fluctuations in investment returns on
shareholder- backed business (148) (123) (123) (1,650) (51) Shareholders’ share of actuarial and other gains and losses on
defined benefit pension schemes 21 (10) (74) (13) (1) Costs of terminated AIA transaction – (377) – – – Gain on dilution of Group's holdings – 30 – – – Loss on sale and results of Taiwan agency business – – (621) 1 (37)
Profit (loss) from continuing operations before tax attributable to shareholders(note 2) 1,943 1,461 746 (450) 1,063
Operating earnings per share (reflecting operating profit based on longer-term investment returns after related tax and non-controlling interests and excluding 2010 exceptional tax credit) (in pence) 63.9p 62.0p 47.5p 38.1p 31.3p
Operating earnings per share (reflecting operating profit based on longer-term investment returns after related tax and non-controlling interests and including 2010 exceptional tax credit) (in pence) 63.9p 68.3p 47.5p 38.1p 31.3p
SupplementaryEEVincomestatementdata
Yearended31December
2011 £m 2010 £m 2009 £m 2008 £m 2007 £m
Operating profit based on longer-term investment returns(note 2) 3,978 3,696 3,090 2,865 2,353 Short-term fluctuations in investment returns on
shareholder- backed business (907) (30) 351 (4,967) 200 Mark to market value movements on core borrowings (14) (164) (795) 656 223 Shareholders’ share of actuarial and other gains and losses on
defined benefit pension schemes 23 (11) (84) (14) (5) Effect of changes in economic assumptions (158) (10) (910) (398) 632 Costs of terminated AIA transaction – (377) – – – Gain on dilution of Group's holdings 3 – – – Profit on sale and results of Taiwan agency business – – 91 (248) 267
Profit (loss) from continuing operations before tax attributable to shareholders 2,922 3,107 1,743 (2,106) 3,670
Operating earnings per share (reflecting operating profit based on longer-term investment returns after related tax and non-controlling interests and excluding 2010 exceptional tax credit) (in pence) 115.7p 106.9p 88.8p 85.1p 69.2p
Operating earnings per share (reflecting operating profit based on longer-term investment returns after related tax and non-controlling interests and including 2010 exceptional tax credit) (in pence) 115.7p 113.2p 88.8p 85.1p 69.2p

438
Prudential plc Annual Report 2011
Additional unaudited financial informationcontinued
Financial statements | Additional unaudited financial information
I: Selected historical financial information of Prudential continued
NewbusinessdataNew business excluding Japan(note 3)
Yearended31December
AER
2011 £m 2010 £m 2009 £m 2008 £m 2007 £m
Annual premium equivalent (APE) sales: – Asia 1,660 1,501 1,209 1,174 1,044 – US 1,275 1,164 912 716 671 – UK 746 820 723 947 910
– Total APE sales 3,681 3,485 2,844 2,837 2,625
EEV new business profit (NBP) 2,151 2,028 1,619 1,205 1,103
NBP margin (% APE) 58% 58% 57% 42% 42%
Statementoffinancialpositiondata
AsofandfortheYearEnded31December 2011 £m 2010 £m 2009 £m 2008 £m 2007 £m
IFRS basis results: Total assets 273,580 260,806 227,754 215,542 219,382 Total policyholder liabilities and unallocated surplus of
with-profits funds 236,290 224,980 196,417 182,391 190,317 Core structural borrowings of
shareholder-financed operations 3,611 3,676 3,394 2,958 2,492 Total liabilities 264,420 252,731 221,451 210,429 213,218 Total equity 9,160 8,075 6,303 5,113 6,164
Otherdata
AsofandfortheYearEnded31December 2011 £bn 2010 £bn 2009 £bn 2008 £bn 2007 £bn
Funds under management(note 4) 351 340 290 249 267 EEV shareholders’ equity, excluding non-controlling interests 19.6 18.2 15.3 15.0 14.6 Insurance Groups Directive capital surplus (as adjusted)(note 5) 4.0 4.3 3.4 1.5 1.9
Notes(1) This measure is the formal profit (loss) before tax measure under IFRS but is not the result attributable to shareholders. (2) Operating profits are determined on the basis of including longer-term investment returns. EEV and IFRS operating profits are stated after
excluding the effect of short-term fluctuations in investment returns against long-term assumptions, the shareholders’ share of actuarial and other gains and losses on defined benefit pension schemes, transaction costs arising from business combinations in the period and costs associated with the terminated AIA transaction. In addition, for EEV basis results, operating profit excludes the effect of changes in economic assumptions and the market value movements on core borrowings.
(3) Asia comparative APE new business sales prior to 2011 exclude the Japanese insurance operations, which ceased writing new business from 15 February 2010.
(4) Funds under management comprise funds of the Group held in the statement of financial position and external funds that are managed by Prudential asset management operations.
(5) The surpluses shown are before allowing for the final dividends for each year, which are paid in the following year. The 2011 surplus is estimated. Since 2007, following the sale of Egg Banking, Prudential has been subject to the capital adequacy requirements of the Insurance Groups Directive (IGD) which applies to groups whose activities are mainly in the insurance sector. Prior to the sale of Egg Banking, Prudential was subject to the capital adequacy requirements of the Financial Conglomerates Directive (FCD) which applies to groups with significant cross-sector activities in insurance and banking/investment services. Prudential was classified as an insurance conglomerate under the FCD. As the requirements for insurance conglomerates under the FCD are closely aligned to the requirements for insurance groups under the IGD, the move for Prudential from FCD to IGD did not result in a significant impact.

439F
ina
ncia
l statem
en
tsA
dd
ition
al un
aud
ited
finan
cial info
rmatio
n
II(a): Analysis of long-term insurance business pre-tax IFRS operating profit based on longer-term investment returns by driver
This classifies the Group’s pre-tax operating earnings from long-term insurance operations into the underlying drivers of those profits, using the following categories:
i Spread income represents the difference between net investment income (or premium income in the case of the UK annuities new business) and amounts credited to policyholder accounts. It excludes the longer-term investment return on assets in excess of those covering shareholder-backed policyholder liabilities, which has been separately disclosed as expected return on shareholder assets.
ii Fee income represents profits driven by net investment performance, being asset management fees that vary with the size of the underlying policyholder funds net of investment management expenses.
iii With-profits business represents the shareholders’ transfer from the with-profits fund in the period.
iv Insurance margin primarily represents profits derived from the insurance risks of mortality, morbidity and persistency.
v Margin on revenues primarily represents amounts deducted from premiums to cover acquisition costs and administration expenses.
vi Acquisition costs and administration expenses represent expenses incurred in the period attributable to shareholders. It excludes items such as restructuring costs and Solvency II costs, which are not included in the segment profit for insurance, as well as items that are more appropriately included in other source of earnings lines (eg investment expenses are netted off investment income as part of spread income or fee income as appropriate).
vii DAC adjustments comprises DAC amortisation for the period, excluding amounts related to short-term fluctuations, net of costs deferred in respect of new business.
Analysisofpre-taxIFRSoperatingprofitbysource
2011 £m
Asia US UK Unallocated Total
Spread income 88 730 247 – 1,065 Fee income 131 680 59 – 870 With-profits 38 – 293 – 331 Insurance margin 477 232 27 – 736 Margin on revenues 1,199 – 226 – 1,425 Expenses: Acquisition costs (766) (890) (127) – (1,783) Administration expenses (503) (412) (128) – (1,043) DAC adjustments 14 271 (5) – 280 Expected return on shareholder assets 26 83 91 – 200
Long-term business operating profit 704 694 683 – 2,081 Asset management operating profit 80 24 357 – 461 GI commission – – 40 – 40 RPI to CPI inflation measure change on defined benefit
pension schemes – – – 42 42 Other income and expenditure* – – – (554) (554)
Total operating profit based on longer-term investment returns 784 718 1,080 (512) 2,070
* Including restructuring and Solvency II implementation costs.

440
Prudential plc Annual Report 2011
Additional unaudited financial informationcontinued
Financial statements | Additional unaudited financial information
II(a): Analysis of long-term insurance business pre-tax IFRS operating profit based on longer-term investment returns by driver continued
2010† £m
Asia US UK Unallocated Total
Spread income 70 692 251 – 1,013 Fee income 122 506 60 – 688 With-profits 32 – 310 – 342 Insurance margin 392 188 12 – 592 Margin on revenues 1,018 – 194 – 1,212 Expenses: Acquisition costs (656) (851) (138) – (1,645) Administration expenses (467) (344) (113) – (924) DAC adjustments 2 517 (1) – 518 Expected return on shareholder assets 19 125 98 – 242
Long-term business operating profit 532 833 673 – 2,038 Asset management operating profit 72 22 284 – 378 GI commission – – 46 – 46 Other income and expenditure* – – – (521) (521)
Total operating profit based on longer-term investment returns 604 855 1,003 (521) 1,941
* Including restructuring and Solvency II implementation costs.† Following the reduction in 2010 of the Group’s interest in the PruHealth and PruProtect businesses from 50 per cent to 25 per cent, the profits of these
businesses have been shown as a single line in the insurance margin line in 2011, consistent with associate accounting principles. 2010 has been amended in light of this change.
Marginanalysisoflong-terminsurancebusinessThe following analysis expresses certain of the Group’s sources of operating profit as a margin of policyholder liabilities or other suitable driver. Details of the Group’s average policyholder liability balances are given in D2(c), D3(c) and D4(c).
Total
2011 2010‡
Long-termbusinessProfit
£m
AverageLiability*
£mMargin
bps Profit
£m
AverageLiability*
£mMargin
bps
Spread income 1,065 57,417 185 1,013 53,894 188 Fee income 870 68,298 127 688 56,822 121 With-profits 331 93,056 36 342 89,693 38 Insurance margin 736 592 Margin on revenues 1,425 1,212 Expenses: Acquisition costs† (1,783) 3,681 (48)% (1,645) 3,492 (47)% Administration expenses (1,043) 125,715 (83) (924) 110,716 (83) DAC adjustments 280 518 Expected return on shareholder assets 200 242
Operating profit 2,081 2,038
* The average liability balance is generally calculated as the average of the opening and closing liability balances as this is seen as a good proxy for average balances throughout the year. Given the volatility in the year, the calculation of average liabilities has been refined for Jackson in two ways: (i) the average for both the general and the separate account balances is now derived from month-end balances throughout the year as opposed to opening and closing balances only, and (ii) liabilities held in the general account for variable annuity living and death guaranteed benefits have been excluded from the calculation of the average as no spread income is earned on these balances. The 2010 balances for Jackson have been amended for consistency albeit impacts are minimal.
† The ratio for acquisition costs is calculated as a percentage of APE including with-profits sales and Japan (2011: £nil; 2010: £7 million). Acquisition costs include only those relating to shareholders.
‡ Following the reduction in 2010 of the Group’s interest in the PruHealth and PruProtect businesses from 50 per cent to 25 per cent, the profits of these businesses have been shown as a single line in the insurance margin line consistent with associate accounting principles. The UK's 2010 analysis has been amended in light of this change.

441F
ina
ncia
l statem
en
tsA
dd
ition
al un
aud
ited
finan
cial info
rmatio
n
Asia
2011 2010
Long-termbusinessProfit
£m
AverageLiability
£mMargin
bps Profit
£m
AverageLiability
£mMargin
bps
Spread income 88 5,623 157 70 4,393 159 Fee income 131 12,370 106 122 11,222 109 With-profits 38 11,775 32 32 10,135 32 Insurance margin 477 392 Margin on revenues 1,199 1,018 Expenses: Acquisition costs* (766) 1,660 (46)% (656) 1,508 (44)% Administration expenses (503) 17,993 (280) (467) 15,615 (299) DAC adjustments 14 2 Expected return on shareholder assets 26 19
Operating profit 704 532
* The ratio for acquisition costs is calculated as a percentage of APE, including with-profits sales and Japan (2011: £nil; 2010: £7 million). Acquisition costs include only those relating to shareholders.
AnalysisofAsianIFRSoperatingprofitdrivers
• Spread income has increased by £18 million from £70 million in 2010 to £88 million in 2011, an increase of 26 per cent that predominantly reflects the growth of the Asian non-linked policyholder liabilities;
• Fee income has increased by £9 million from £122 million in 2010 to £131 million in 2011, broadly in line with the movement in unit-linked liabilities following continued positive net flows into unit-linked business;
• Insurance margin has increased by £85 million from £392 million in 2010 to £477 million in 2011, predominantly reflecting the continued growth of the in-force book, which contains a relatively high proportion of risk-based products. 2011 includes £38 million (2010: £19 million) of non-recurring items, reflecting assumption changes and other items that are not expected to reoccur in future periods;
• Margin on revenues has increased by £181 million to £1,199 million in 2011, reflecting the ongoing growth in the size of the portfolio. During the year the new business mix has moved towards those countries that levy higher premium charges (eg Indonesia);
• Acquisition costs have increased by 17 per cent from £656 million in 2010 to £766 million in 2011, ahead of the 10 per cent increase in sales. This trend is distorted by the changes in country mix, particularly by the reduction of sales in India. Excluding India, acquisition costs were 21 per cent higher compared to a 18 per cent increase in sales. The analysis above uses shareholder acquisition costs as a proportion of total APE. If with-profits sales were excluded from the denominators, the acquisition cost ratio would become 59 per cent (2010: 53 per cent). (Excluding India 2011: 61 per cent, 2010: 58 per cent);
• Administration expenses have increased from £467 million in 2010 to £503 million in 2011. The administration expense ratio has improved from 299 bps in 2010 to 280 bps in 2011 as we continue to see the benefits of operational leverage; and
• Expected return on shareholder assets has increased by £7 million to £26 million, principally reflecting higher shareholder assets and lower investment expenses in the period.

442
Prudential plc Annual Report 2011
Additional unaudited financial informationcontinued
Financial statements | Additional unaudited financial information
II(a): Analysis of long-term insurance business pre-tax IFRS operating profit based on longer-term investment returns by driver continued
US
2011 2010
Long-termbusinessProfit
£m
AverageLiability*
£mMargin
bps Profit
£m
AverageLiability*
£mMargin
bps
Spread income 730 28,274 258 692 28,532 243 Fee income 680 34,452 197 506 25,247 200 With-profits – – Insurance margin 232 188 Margin on revenues – – Expenses: Acquisition costs† (890) 1,275 (70)% (851) 1,164 (73)% Administration expenses (412) 62,726 (66) (344) 53,779 (64) DAC adjustments 271 517 Expected return on shareholder assets 83 125
Operating profit 694 833
* The average liability balance is generally calculated as the average of the opening and closing liability balances as this is seen as a good proxy for average balances throughout the year. Given the volatility in the year, the calculation of average liabilities has been refined for Jackson in two ways: (i) the average for both the general and the separate account balances is now derived from month-end balances throughout the year as opposed to opening and closing balances only, and (ii) liabilities held in the general account for variable annuity living and death guaranteed benefits have been excluded from the calculation of the average as no spread income is earned on these balances. The 2010 balances have been amended for consistency, albeit impacts are minimal.
† The ratio for acquisition costs is calculated as a percentage of total APE.
AnalysisofUSIFRSoperatingprofitdrivers
• Spread income benefited by £113 million in 2011 from the effect of transactions entered into in 2011 and 2010 to more closely match the overall asset and liability duration (2010: £108 million). Excluding this effect, the spread margin would have been 218 bps (2010: 205 bps). The reported spread margin increased from 243 bps in 2010 to 258 bps in 2011. This is despite the downward pressure on yields caused by the low interest rate environment, the effect of which continues to be mitigated by reductions in crediting rates;
• Fee income has increased by 34 per cent to £680 million in 2011, broadly in line with the growth in separate account balances. The growth in account balances during 2011 reflected the strong net flows from variable annuity business;
• Insurance margin represents operating profits from insurance risks, including variable annuity guarantees and other sundry items. Positive net flows into variable annuity business with life contingent and other guarantee fees have primarily resulted in an improvement in the margin from £188 million in 2010 to £232 million in 2011;
• Acquisition costs have increased in absolute terms compared to 2010, due largely to the significant increase in sales volumes. However, acquisition costs as a percentage of total APE is slightly lower at 70 per cent in 2011, with the decrease attributable to a reduced rate of marketing costs and lower average commissions;
• Administration expenses increased to £412 million in 2011, compared to £344 million in 2010, primarily as a result of higher asset based commission paid on the larger 2011 separate account balance. These asset based commissions paid upon policy anniversary dates are treated as an administration expense in this analysis as opposed to a cost of acquisition, and are offset by higher fees. The administration cost was marginally higher at 66 bps (2010: 64 bps). Excluding trail commission amounts, the resulting administration expense ratio would be 46 bps (2010: 48 bps); and
• DAC adjustments decreased by £246 million to £271 million in 2011 compared to £517 million in 2010. This mainly reflects additional DAC amortisation of approximately £166 million related to the reversal of the benefit received in 2008 from the mean reversion formula, as well as accelerated DAC amortisation of £66 million as separate account returns, were lower than 2010.

443F
ina
ncia
l statem
en
tsA
dd
ition
al un
aud
ited
finan
cial info
rmatio
n
UK
2011 2010†
Long-termbusinessProfit
£m
AverageLiability
£mMargin
bps Profit
£m
AverageLiability
£mMargin
bps
Spread income 247 23,520 105 251 20,969 120 Fee income 59 21,476 27 60 20,353 29 With-profits 293 81,281 36 310 79,558 39 Insurance margin 27 12 Margin on revenues 226 194 Expenses: Acquisition costs* (127) 746 (17)% (138) 820 (17)% Administration expenses (128) 44,996 (28) (113) 41,322 (27) DAC adjustments (5) (1) Expected return on shareholder assets 91 98
Operating profit 683 673
* The ratio for acquisition costs is calculated as a percentage of APE including with-profits sales. Acquisition costs include only those relating to shareholders.
† Following the reduction in 2010 of the Group’s interest in the PruHealth and PruProtect businesses from 50 per cent to 25 per cent, the profits of these businesses have been shown as a single line in the insurance margin line in 2011, consistent with associate accounting priciples. 2010 has been amended in light of this change.
AnalysisofUKIFRSoperatingprofitdrivers
• Spread income remains broadly unchanged from 2010 at £247 million (2010: £251 million). The margin has fallen from 120 bps to 105 bps principally due to 2010 benefiting from higher bulk annuity sales, partly offset by the benefit of portfolio restructuring undertaken in the year and higher yields being achieved on new individual annuity business;
• Insurance margin has increased from £12 million in 2010 to £27 million in 2011, principally driven by an improvement in the profitability of PruHealth and PruProtect;
• Margin on revenues represents premiums charges for expenses and other sundry net income received by the UK. Higher amounts were recorded in 2011 (£226 million) compared to 2010 (£194 million), reflecting higher sundry income and an increase in premiums from shareholder-backed retail business in 2011 as compared to 2010;
• Acquisition costs as a percentage of new business sales has remained constant with 2010 at 17 per cent;
The ratio above expresses the percentage of shareholder acquisition costs as a percentage of total APE sales. It is therefore impacted by the level of with-profit sales in the year. Acquisition costs as a percentage of shareholder-backed new business sales were 33 per cent in 2011 (30 per cent in 2010), due in part to the beneficial effect in 2010 of the higher level of bulk annuity transactions, which had a relatively modest level of acquisition costs;
• Administration expenses have increased by £15 million to £128 million in 2011 primarily as a result of increased project expenditure, resulting in a marginally higher administration expense ratio of 28 bps in 2011 (2010: 27 bps); and
• Expected return on shareholder asset has fallen from £98 million in 2010 to £91 million in 2011 following a reduction in assumed longer-term yields on assets backing shareholder capital.

444
Prudential plc Annual Report 2011
Additional unaudited financial informationcontinued
Financial statements | Additional unaudited financial information
II(b): Asian operations – analysis of IFRS operating profit by territory
2011 £m 2010 £m
China 11 5 Hong Kong 69 51 India 43 24 Indonesia 212 157 Japan 2 (6)Korea 17 12 Malaysia 104 97 Philippines 5 2 Singapore 167 129 Taiwan bancassurance business 1 (4)Thailand 4 2 Vietnam 35 43 Other 1 5 Non-recurrent itemsnote (ii) 38 19
Totalinsuranceoperationsnote (i) 709 536
Development expenses (5) (4)
Totallong-termbusinessoperatingprofit 704 532 Eastspring Investments 80 72
TotalAsianoperations 784 604
Notes(i) Analysis of operating profit between new and in-force business The result for insurance operations comprises amounts in respect of new business and business in-force as follows:
2011 £m 2010 £m
New business strain (excluding Japan) (54) (56)Japan – (1)
New business strain (including Japan) (54) (57)Business in force 763 593
Total 709 536
The IFRS new business strain corresponds to approximately 3 per cent of new business APE premiums for 2011 (2010: approximately 4 per cent of new business APE).
The strain reflects the aggregate of the pre-tax regulatory basis strain to net worth after IFRS adjustments for deferral of acquisition costs and deferred income where appropriate.
(ii) Non-recurrent items of £38 million in 2011 (2010: £19 million) represents a small number of items that are not anticipated to reoccur in subsequent periods.

445F
ina
ncia
l statem
en
tsA
dd
ition
al un
aud
ited
finan
cial info
rmatio
n
II(c): Analysis of asset management operating profit based on longer-term investment returns
2011 £m
M&Gnote (i)
EastspringInvestments
note (i) PruCap US Total
Operating income before performance-related fees 706 196 122 249 1,273 Performance-related fees 21 6 – – 27
Operating income* 727 202 122 249 1,300 Operating expense (426) (122) (66) (225) (839)
Operating profit based on longer-term investment returns 301 80 56 24 461
Average funds under management (FUM)† 199.8 bn 51.1 bn Margin based on operating income† 36 bps 40 bps Cost/income ratio‡ 60% 62%
2010 £m
M&Gnote (i)
EastspringInvestments
note (i)PruCap US Total
Operating income before performance-related fees 615 185 88 229 1,117 Performance-related fees 17 6 – – 23
Operating income* 632 191 88 229 1,140 Operating expense (386) (119) (50) (207) (762)
Operating profit based on longer-term investment returns 246 72 38 22 378
Average funds under management (FUM)† 186.5 bn 47.2 bn Margin based on operating income† 34 bps 40 bps Cost/income ratio‡ 63% 64%
Note(i) M&G and Eastspring Investments can be further analysed as follows:
M&G
Operatingincome*
Retail£m
MarginofFUM†§
bpsInstitutional¶
£m
MarginofFUM†
bpsTotal
£m
MarginofFUM†
bps
2011 416 96 311 20 727 36 2010 345 93 287 19 632 34
Eastspring Investments
Operatingincome*
Retail£m
MarginofFUM†
bpsInstitutional¶
£m
MarginofFUM†
bpsTotal
£m
MarginofFUM†
bps
2011 120 64 82 25 202 40 2010 120 62 71 26 191 40
* Operating income is net of commissions and includes performance-related fees, and for M&G carried interest on private equity investments.† Margin represents operating income as a proportion of the related funds under management (FUM). Opening and closing internal and external
funds managed by the respective entity have been used to derive the average. Any funds held by the Group’s insurance operations which are managed by third parties outside of the Prudential Group are excluded from these amounts.
‡ Cost/income ratio is calculated as cost as a percentage of income excluding performance-related fees.§ As noted above, the margins on operating income are based on the average of the opening and closing FUM balances. For M&G, if a monthly
average FUM had been used, the retail margins would have been 95 bps for 2011 and 2010.¶ Institutional includes internal funds.

446
Prudential plc Annual Report 2011
Additional unaudited financial informationcontinued
Financial statements | Additional unaudited financial information
III(a): Adoption of altered US GAAP requirements to Group IFRS reporting in 2012
ChangetoaccountingpolicyfordeferralofacquisitioncostsforoperationsapplyingUSGAAPmeasurementprinciplestoinsuranceassetsandliabilitiesfrom1January2012BackgroundUnder the Group’s accounting policies the measurement of insurance assets and liabilities reflects the application of UK GAAP under the Modified Statutory Basis (MSB). This has been applied from when the Company first adopted IFRS in 2005, subject to subsequent policy improvements under IFRS 4. The MSB in turn is based on the codification in the 2003 ABI Statement of Recommended Practice which, subject to various restrictions, permits the use of local bases for overseas operations. Accordingly, since 2005, the insurance assets and liabilities of the Group’s US operations have been measured using US GAAP. This basis has also been explicitly applied to those Asian operations (namely India, Japan, Taiwan and Vietnam) where the local regulatory basis is not appropriate as a starting point for deriving MSB compliant results. In October 2010, the Emerging Issues Task Force of the US Financial Accounting Standards Board issued Update No 2010-26 on ‘Accounting for Costs Associated with Acquiring or Renewing Insurance Contracts’. The update was issued to address perceived diversity by companies preparing financial statements in accordance with US GAAP as regards the types of acquisition costs being deferred. Under US GAAP, costs that can be deferred and amortised are those that ‘vary with and are primarily related to the acquisition of insurance contracts’. The Update requires insurers to capitalise only those incremental costs directly related to acquiring a contract for financial statements for reporting periods starting after 15 December 2011. All other indirect acquisition expenses are required to be charged to the income statement as incurred expenses. Accordingly, the main impact of the Update is to disallow insurers from deferring costs that are not directly related to successful sales. Under the Update, US insurers preparing financial statements under US GAAP can choose to make a prospective or a retrospective application. Under the prospective basis, the change is confined to the income statement from the date of adoption to incorporate the additional charge for non-deferrable expenses for the activity of the reporting period. No changes are made to the results of comparative periods. By contrast, under retrospective application, the deferred acquisition costs balances in the statement of financial position for comparative periods are reset so as to only defer those costs permitted by the Update. In the income statement, the net effect of the Update reflects:
(i) as for the prospective basis, the additional charge for non deferrable expenses for the activity of the reporting period, offset by (ii) a reduced charge for DAC amortisation reflecting the lower level of expenses that could be deferred on prior period activity.
Under the Group’s IFRS reporting, Prudential has the option to either continue with its current basis of measurement or improve its accounting policy under IFRS 4 to acknowledge the issuance of the Update. Prudential has chosen to continue with its current basis of measurement for reporting of its 2011 results and improve its policy in 2012 to apply the US GAAP update on the retrospective basis to the results of its US insurance operation, Jackson. The reason and timing for the change is to achieve consistency with the basis expected to be applied by peer competitor companies in the US market in their US GAAP financial statements. To ensure consistency, it is also intended to make the change on the retrospective basis in 2012 for the Asian operations that historically have effectively applied US GAAP for measuring insurance assets and liabilities.

447F
ina
ncia
l statem
en
tsA
dd
ition
al un
aud
ited
finan
cial info
rmatio
n
Effectofchangeofpolicyin2012The results impact of the policy improvement to adopt the Update in 2012 is summarised in the tables shown below.
Effectofpolicyimprovementin2012oncomparativeresultsfor2011andfull-year2010
Year ended 31 December 2011 £m 6 months ended 30 June 2011 £m Year ended 31 December 2010 £m
Analysisofprofitandearningspershare
Asreported
undercurrentpolicy
Effectofchange
Undernew
policyfrom
1Jan2012
Asreported
undercurrentpolicy
Effectofchange
Undernew
policyfrom
1Jan2012
Asreported
undercurrentpolicy
Effectofchange
Undernew
policyfrom
1Jan2012
Analysisofprofit
Operatingprofitbasedonlonger-terminvestmentreturns
Asian insurance operations(note (a)) 704 – 704 324 (2) 322 532 (10) 522 US insurance operations(note (b)) 694 (43) 651 368 (28) 340 833 (105) 728 Other operations 672 – 672 366 – 366 576 – 576
Total 2,070 (43) 2,027 1,058 (30) 1,028 1,941 (115) 1,826 Short-term fluctuations in investment
returns (148) (72) (220) 113 (20) 93 (123) (75) (198)Shareholders’ share of actuarial and other
gains and losses on defined benefit pension schemes 21 – 21 (7) – (7) (10) – (10)
Costs of terminated AIA transaction – – – – – – (377) – (377)Gain on dilution of Group holdings – – – – – – 30 – 30
Profitbeforetaxattributabletoshareholders(includingactualinvestmentreturns) 1,943 (115) 1,828 1,164 (50) 1,114 1,461 (190) 1,271
Tax attributable to shareholders – operating profit excluding, for 2010, exceptional tax credit:
Asian insurance operations (122) – (122) (39) 1 (38) (58) 2 (56) US insurance operations (200) 15 (185) (110) 10 (100) (249) 37 (212) Other operations (126) – (126) (91) – (91) (64) – (64)
(448) 15 (433) (240) 11 (229) (371) 39 (332) Exceptional 2010 tax credit related
primarily to the impact of settlement agreed with the UK tax authorities – – – – – – 158 – 158
Total (448) 15 (433) (240) 11 (229) (213) 39 (174)Tax attributable to shareholders –
non-operating profit (1) 25 24 (61) 7 (54) 188 26 214 Non-controlling interests – operating profit (4) – (4) (2) – (2) (5) – (5)
Profitaftertaxandnon-controllinginterests 1,490 (75) 1,415 861 (32) 829 1,431 (125) 1,306

448
Prudential plc Annual Report 2011
Additional unaudited financial informationcontinued
Financial statements | Additional unaudited financial information
III(a): Adoption of altered US GAAP requirements to Group IFRS reporting in 2012 continued
Year ended 31 December 2011 £m 6 months ended 30 June 2011 £m Year ended 31 December 2010 £m
Analysisofprofitandearningspershare
Asreported
undercurrentpolicy
Effectofchange
Undernew
policyfrom
1Jan2012
Asreported
undercurrentpolicy
Effectofchange
Undernew
policyfrom
1Jan2012
Asreported
undercurrentpolicy
Effectofchange
Undernew
policyfrom
1Jan2012
Operatingprofitaftertaxandnon-controllinginterests
Excluding, for 2010, exceptional tax credit 1,618 (28) 1,590 816 (19) 797 1,565 (76) 1,489
Exceptional 2010 tax credit – – – – 158 – 158
Total 1,618 (28) 1,590 816 (19) 797 1,723 (76) 1,647
EarningsperShare(pence)
Operating (basic) – excluding, for 2010, exceptional tax credit (pence) 63.9p (1.1)p 62.8p 32.2p (0.8)p 31.4p 62.0p (3.0)p 59.0p
Operating (diluted) – excluding, for 2010, exceptional tax credit (pence) 63.8p (1.1)p 62.7p 32.1p (0.8)p 31.3p 61.9p (3.0)p 58.9p
Total (diluted) (pence) 58.7p (3.0)p 55.7p 33.9p (1.3)p 32.6p 56.6p (4.9)p 51.7p
Notesoneffectofchangeonoperatingprofitbasedonlonger-terminvestmentreturns(a) Asian insurance operations
Year ended 31 December 2011 £m 6 months ended 30 June 2011 £m Year ended 31 December 2010 £m
Asreported
undercurrentpolicy
Effectofchange
Undernew
policyfrom
1Jan2012
Asreported
undercurrentpolicy
Effectofchange
Undernew
policyfrom
1Jan2012
Asreported
undercurrentpolicy
Effectofchange
Undernew
policyfrom
1Jan2012
New business Acquisition costs on new contracts
not able to be deferred (16) (10) (20) Business in force at beginning of period Reduction in amortisation on reduced DAC balance 16 8 10
Total – (2) (10)
Arising in the following insurance operations:
India 4 2 1 Japan – – – Taiwan 1 (1) (3) Vietnam (5) (3) (8)
Total – (2) (10)
(b) US insurance operationsYear ended 31 December 2011 £m 6 months ended 30 June 2011 £m Year ended 31 December 2010 £m
Asreported
undercurrentpolicy
Effectofchange
Undernew
policyfrom
1Jan2012
Asreported
undercurrentpolicy
Effectofchange
Undernew
policyfrom
1Jan2012
Asreported
undercurrentpolicy
Effectofchange
Undernew
policyfrom
1Jan2012
New business Acquisition costs on new contracts
not able to be deferred (156) (80) (159) Business in force at beginning of period Reduction in amortisation on reduced DAC balance 113 52 54
Total (43) (28) (105)

449F
ina
ncia
l statem
en
tsA
dd
ition
al un
aud
ited
finan
cial info
rmatio
n
Year ended 31 December 2011 £m 6 months ended 30 June 2011 £m Year ended 31 December 2010 £m
Changesinequityandbalancesheet
Asreported
undercurrentpolicy
Effectofchange
Undernew
policyfrom
1Jan2012
Asreported
undercurrentpolicy
Effectofchange
Undernew
policyfrom
1Jan2012
Asreported
undercurrentpolicy
Effectofchange
Undernew
policyfrom
1Jan2012
Changesinequity
Profit for the year net of non-controlling interests 1,490 (75) 1,415 861 (32) 829 1,431 (125) 1,306
Exchange movements on foreign operations and net investment hedges, net of related tax (32) (5) (37) (75) 13 (62) 251 (14) 237
Available-for-sale securities US operations classified as
available-for-sale 811 – 811 237 – 237 1,221 – 1,221 Related change in amortisation
of deferred income and acquisition costs (331) 56 (275) (97) 26 (71) (496) 86 (410)
Related tax (168) (19) (187) (49) (8) (57) (247) (31) (278)
Total comprehensive income for the year net of non-controlling interests 1,770 (43) 1,727 877 (1) 876 2,160 (84) 2,076
Dividends (642) – (642) (439) – (439) (511) – (511)New share capital and other movements (42) – (42) 32 – 32 111 – 111
Net increase in equity 1,086 (43) 1,043 470 (1) 469 1,760 (84) 1,676 At beginning of year 8,031 (510) 7,521 8,031 (510) 7,521 6,271 (426) 5,845
At end of year 9,117 (553) 8,564 8,501 (511) 7,990 8,031 (510) 7,521

450
Prudential plc Annual Report 2011
Additional unaudited financial informationcontinued
Financial statements | Additional unaudited financial information
III(a): Adoption of altered US GAAP requirements to Group IFRS reporting in 2012 continued
Year ended 31 December 2011 £m 6 months ended 30 June 2011 £m Year ended 31 December 2010 £m
Changesinequityandbalancesheet
Asreported
undercurrentpolicy
Effectofchange
Undernew
policyfrom
1Jan2012
Asreported
undercurrentpolicy
Effectofchange
Undernew
policyfrom
1Jan2012
Asreported
undercurrentpolicy
Effectofchange
Undernew
policyfrom
1Jan2012
Balancesheet
AssetsDeferred acquisition costs attributable
to shareholders: Insurance operations Asia 744 (50) 694 741 (52) 689 758 (52) 706 US 3,880 (785) 3,095 3,639 (717) 2,922 3,543 (714) 2,829 UK 111 – 111 115 – 115 116 – 116 Asset management 12 – 12 9 – 9 9 – 9
4,747 (835) 3,912 4,504 (769) 3,735 4,426 (766) 3,660 Investments and other assets 268,833 – 268,833 264,962 – 264,962 256,380 – 256,380
Total assets 273,580 (835) 272,745 269,466 (769) 268,697 260,806 (766) 260,040
Liabilities Policyholder liabilities and
unallocated surplus of with-profits funds 236,290 – 236,290 232,304 – 232,304 224,980 – 224,980 Core structural borrowings of
shareholder-financed operations 3,611 – 3,611 3,998 – 3,998 3,676 – 3,676 Deferred tax liabilities 4,211 (282) 3,929 4,194 (258) 3,936 4,224 (256) 3,968 Other liabilities 20,308 – 20,308 20,423 – 20,423 19,851 – 19,851
Total liabilities 264,420 (282) 264,138 260,919 (258) 260,661 252,731 (256) 252,475
Equity Shareholders’ equity Asian insurance operations 2,349 (43) 2,306 2,269 (45) 2,224 2,149 (45) 2,104 US insurance operations 4,271 (510) 3,761 3,764 (466) 3,298 3,815 (465) 3,350 Rest of Group 2,497 – 2,497 2,468 – 2,468 2,067 – 2,067
9,117 (553) 8,564 8,501 (511) 7,990 8,031 (510) 7,521 Non-controlling interests 43 – 43 46 – 46 44 – 44
Total equity 9,160 (553) 8,607 8,547 (511) 8,036 8,075 (510) 7,565
Total liabilities and equity 273,580 (835) 272,745 269,466 (769) 268,697 260,806 (766) 260,040


452
Prudential plc Annual Report 2011
Additional unaudited financial informationcontinued
Financial statements | Additional unaudited financial information
IV(a): Reconciliation of expected transfer of fair value of in-force (VIF) and required capital business of free surplus
Expectedtransferofvalueofin-force(VIF)andrequiredcapitalbusinesstofreesurplusThe tables below show how the VIF generated by the in-force long-term business and the associated required capital is modelled as emerging into free surplus over the next 40 years. Although a small amount (1 per cent) of the Group’s embedded value emerges after this date, analysis of cash flows emerging in the early years is considered most meaningful. The modelled cash flows use the same methodology underpinning the Group’s embedded-value reporting, and so are subject to the same assumptions and sensitivities. In addition to showing the amounts, both discounted and undiscounted, expected to be generated from all in-force business at 31 December 2011, the tables also present the expected future free surplus to be generated from the investment made in new business during 2011 over the same 40-year period.
2011 £m
Undiscountedexpectedgenerationfromallin-forcebusinessat31December*
Undiscountedexpectedgenerationfrom2011long-termnewbusinesswritten*
Expectedperiodofemergence Asia US UK Total Asia US UK Total
2012 674 680 423 1,777 104 245 20 369 2013 647 485 502 1,634 123 103 21 247 2014 634 450 472 1,556 120 96 23 239 2015 595 480 437 1,512 92 16 18 126 2016 590 484 428 1,502 91 102 20 213 2017 564 438 412 1,414 84 61 20 165 2018 556 425 400 1,381 86 52 17 155 2019 541 425 389 1,355 87 103 17 207 2020 523 369 380 1,272 81 87 17 185 2021 512 318 372 1,202 83 73 17 173 2022 491 274 364 1,129 78 67 16 161 2023 482 226 360 1,068 74 51 16 141 2024 472 169 353 994 73 42 16 131 2025 465 156 345 966 69 38 16 123 2026 464 135 332 931 88 33 17 138 2027 463 112 327 902 66 27 16 109 2028 460 97 316 873 68 22 16 106 2029 449 85 306 840 62 18 16 96 2030 445 67 297 809 65 15 16 96 2031 437 57 283 777 70 10 17 97 2032 to 2036 2,035 177 1,185 3,397 294 27 79 400 2037 to 2041 1,869 (96) 894 2,667 260 (35) 81 306 2042 to 2046 1,737 – 488 2,225 242 – 54 296 2047 to 2051 1,597 – 282 1,879 242 – 36 278
Total free surplus expected to emerge in the next 40 years 17,702 6,013 10,347 34,062 2,702 1,253 602 4,557
* The analysis excludes amounts incorporated into VIF at 31 December 2011 where there is no definitive timeframe for when the payments will be made or receipts received. In particular, it excludes the value of the shareholders’ interest in the estate. It also excludes any free surplus emerging after 2051.

453F
ina
ncia
l statem
en
tsA
dd
ition
al un
aud
ited
finan
cial info
rmatio
n
The above amounts can be reconciled to the new business amounts as follows:
2011 £m
Newbusiness Asia US UK Total
Undiscounted expected free surplus generation for years 2012 to 2051 2,702 1,253 602 4,557 Less: discount effect (1,611) (377) (355) (2,343)
Discounted expected free surplus generation for years 2012 to 2051 1,091 876 247 2,214 Discounted expected free surplus generation for years 2051+ 32 – 2 34 Less: Free surplus investment in new business (297) (202) (54) (553)Other items* (15) (144) – (159)
Post-tax EEV new business profit 811 530 195 1,536 Tax 265 285 65 615
Pre-taxEEVnewbusinessprofit 1,076 815 260 2,151
* Other items represent the impact of the time value of options and guarantees on new business, foreign exchange effects and other non-modelled items. Foreign exchange effects arise as EEV new business profit amounts are translated at average exchange rates and expected free surplus generation uses year end closing rates.
The undiscounted expected free surplus generation from all in-force business at 31 December 2011 shown below can be reconciled to the amount that was expected to be generated as at 31 December 2010 as follows.
Group2011
£m2012
£m2013
£m2014
£m2015
£m2016
£mOther
£mTotal
£m
2010 expected free surplus generation for years 2011 to 2050 1,923 1,551 1,579 1,449 1,446 1,367 26,538 35,853
Less: Amounts expected to be realised in the current year (1,923) – – – – – – (1,923)
Add: Expected free surplus to be generated in year 2051* – – – – – – 230 230
Foreign exchange differences – (11) (13) (11) (9) (8) (64) (116)New business – 369 247 239 126 213 3,363 4,557 Operating movements – 16 19 18 – 3 Non-operating and other movements – (148) (198) (139) (51) (73) (3,986) (4,539)
2011 expected free surplus generation for years 2012 to 2051 – 1,777 1,634 1,556 1,512 1,502 26,081 34,062
Asia2011
£m2012
£m2013
£m2014
£m2015
£m2016
£mOther
£mTotal
£m
2010 expected free surplus generation for years 2011 to 2050 635 598 573 558 554 554 14,472 17,944
Less: Amounts expected to be realised in the current year (635) – – – – – – (635)
Add: Expected free surplus to be generated in year 2051* – – – – – – 192 192
Foreign exchange differences – (15) (17) (14) (13) (11) (87) (157)New business – 104 123 120 92 91 2,172 2,702 Operating movements – 1 3 (4) (18) (21)Non-operating and other movements – (14) (35) (26) (20) (23) (2,187) (2,344)
2011 expected free surplus generation for years 2012 to 2051 – 674 647 634 595 590 14,562 17,702
* Excluding 2011 new business.

454
Prudential plc Annual Report 2011
Additional unaudited financial informationcontinued
Financial statements | Additional unaudited financial information
IV(a): Reconciliation of expected transfer of fair value of in-force (VIF) and required capital business of free surplus continued
US2011
£m2012
£m2013
£m2014
£m2015
£m2016
£mOther
£mTotal
£m
2010 expected free surplus generation for years 2011 to 2050 852 546 490 440 449 380 3,219 6,376
Less: Amounts expected to be realised in the current year (852) – – – – – – (852)
Add: Expected free surplus to be generated in year 2051* – – – – – – – –
Foreign exchange differences – 4 4 3 4 3 23 41 New business – 245 103 96 16 102 691 1,253 Operating movements – (8) (2) 7 4 16 Non-operating and other movements – (107) (110) (96) 7 (17) (499) (805)
2011 expected free surplus generation for years 2012 to 2051 – 680 485 450 480 484 3,434 6,013
UK2011
£m2012
£m2013
£m2014
£m2015
£m2016
£mOther
£mTotal
£m
2010 expected free surplus generation for years 2011 to 2050 436 407 516 451 443 433 8,847 11,533
Less: Amounts expected to be realised in the current year (436) – – – – – – (436)
Add: Expected free surplus to be generated in year 2051* – – – – – – 38 38
New business – 20 21 23 18 20 500 602 Operating movements – 23 18 15 14 8 Non-operating and other movements – (27) (53) (17) (38) (33) (1,300) (1,390)
2011 expected free surplus generation for years 2012 to 2051 – 423 502 472 437 428 8,085 10,347
* Excluding 2011 new business.

455F
ina
ncia
l statem
en
tsA
dd
ition
al un
aud
ited
finan
cial info
rmatio
n
At 31 December 2011, the total free surplus expected to be generated over the next five years (years 2012-2016 inclusive), using the same assumptions and methodology as underpin our embedded-value reporting was £8.0 billion, an increase of £0.6 billion from the £7.4 billion expected over the same period at the end of 2010. This increase reflected the new business written in 2011, which is expected to generate £1,194 million of free surplus over the next five years. Operating movements were positive £56 million, less than 1 per cent of our 2012 to 2016 free surplus expectation at the end of 2010. Market effects and foreign exchange movements reduced expected free surplus generation for the next five years by £609 million and £52 million respectively. Market movements in Asia include the effect of lower fund-earned rates in Indonesia, Singapore and Hong Kong where government yields have fallen by 165 bps, 110 bps and 140 bps respectively. In the US, lower US treasury bond yields have led to a reduction in the assumed variable annuity separate return, which has had a consequential negative impact on the level of projected future fees. Market movements in the UK primarily reflect the adverse effect on with-profits bonus rates of lower assumed investment returns. At 31 December 2011, the total free surplus expected to be generated on an undiscounted basis in the next 40 years is £34 billion. Notwithstanding the drag on future earnings caused by the market effects on fee and with-profits business referred to above, the expected free surplus generation over the next 40 years has increased. This reflects both our ability to write new business on very attractive economics and the robust management of the in-force book. Actual underlying free surplus generated in 2011 from life business in-force at the end of 2010 was £2.2 billion, inclusive of £0.2 billion of changes in operating assumption and experience variances. This compares with the expected 2011 realisation at the end of 2010 of £1.9 billion. This can be analysed further as follows:
Asia£m
US£m
UK£m
Total£m
Transfer to free surplus in 2011 597 754 511 1,862 Expected return on free assets 58 42 10 110 Operating variances 52 154 (38) 168 RPI to CPI inflation measure change on defined benefit pension schemes – – 20 20
Underlyingfreesurplusgeneratedfromin-forcelifebusinessin2011 707 950 503 2,160
2011 free surplus expected to be generated at 31 December 2010 635 852 436 1,923

456
Prudential plc Annual Report 2011
Additional unaudited financial informationcontinued
Financial statements | Additional unaudited financial information
IV(a): Reconciliation of expected transfer of fair value of in-force (VIF) and required capital business of free surplus continued
The equivalent discounted amounts of the undiscounted totals shown previously are outlined below:
2011 £m
Discountedexpectedgenerationfromallin-forcebusinessat31December
Discountedexpectedgenerationfromlong-term2011newbusinesswritten
Expectedperiodofemergence Asia US UK Total Asia US UK Total
2012 639 656 397 1,692 99 237 19 355 2013 565 441 438 1,444 107 94 19 220 2014 512 385 381 1,278 96 82 19 197 2015 448 388 338 1,174 68 13 14 95 2016 418 371 310 1,099 61 75 15 151 2017 375 317 279 971 53 43 14 110 2018 348 287 254 889 51 35 11 97 2019 317 269 231 817 48 64 10 122 2020 289 228 210 727 41 51 10 102 2021 267 186 192 645 40 40 9 89 2022 238 153 176 567 35 34 8 77 2023 220 117 162 499 32 24 8 64 2024 200 85 149 434 28 19 7 54 2025 184 74 136 394 25 16 7 48 2026 170 61 120 351 29 13 7 49 2027 169 49 111 329 24 10 6 40 2028 158 41 100 299 22 8 6 36 2029 145 34 90 269 20 6 5 31 2030 135 27 81 243 18 5 5 28 2031 125 22 71 218 19 3 5 27 2032 to 2036 498 69 232 799 68 7 18 93 2037 to 2041 347 7 115 469 47 (3) 14 58 2042 to 2046 246 – 35 281 34 – 7 41 2047 to 2051 171 – 12 183 26 – 4 30
Totaldiscountedfreesurplusexpectedtoemergeinthenext40years 7,184 4,267 4,620 16,071 1,091 876 247 2,214
The above amounts can be reconciled to the Group’s financial statements as follows:
Total £m
Discounted expected generation from all in-force business for years 2012 to 2051 16,071 Discounted expected generation from all in-force business for years after 2051 211
Discounted expected generation from all in-force business at 31 December 2011 16,282 Add: Free surplus of life operations held at 31 December 2011 2,839 Less: Time value of guarantees (685)Other non-modelled items* 1,214
Total EEV of life operations 19,650
* These relate to items where there is no definitive timeframe for when the payments will be made or receipts received and are, consequently, excluded from the amounts incorporated into the tables above showing the expected generation of free surplus from in-force business at 31 December 2011. In particular, it excludes the value of the shareholders’ interest in the estate.

457F
ina
ncia
l statem
en
tsA
dd
ition
al un
aud
ited
finan
cial info
rmatio
n
IV(b): Funds under management
i Summary
2011 £bn 2010 £bn
Business area: Asian operations 32.6 30.9 US operations 71.9 63.6 UK operations 146.3 145.2
Internal funds under management 250.8 239.7 External fundsnote (i) 99.8 100.4
Total funds under management 350.6 340.1
Note(i) External funds shown above for 2011 of £99.8 billion (2010: £100.4 billion) comprise £111.2 billion (2011: £111.4 billion) in respect of investment
products, as published in the New Business schedules (see schedule 7) less £11.4 billion (2010: £11.0 billion) that are classified within internal funds.
ii Internalfundsundermanagement–analysisbybusinessarea
Asianoperations USoperations UKoperations Total
2011£bn
2010£bn
2011£bn
2010£bn
2011£bn
2010£bn
2011£bn
2010£bn
Investment propertiesnote (i) – – – 0.1 10.7 11.5 10.7 11.6 Equity securities 12.0 14.5 38.1 31.5 37.3 40.7 87.4 86.7 Debt securities 17.7 14.1 27.1 26.4 79.8 75.9 124.6 116.4 Loans and receivables 2.4 1.3 4.3 4.2 13.7 3.8 20.4 9.3 Other investments 0.5 1.0 2.4 1.4 4.8 13.3 7.7 15.7
Total 32.6 30.9 71.9 63.6 146.3 145.2 250.8 239.7
Note(i) As included in the investments section of the consolidated statement of financial position at 31 December 2011, except for £0.2 billion
(2010: £0.4 billion) investment properties which are held-for-sale or occupied by the Group and, accordingly under IFRS, are included in other statement of financial position captions.
IV(c): Effect of foreign currency rate movements on results
i RatesofexchangeThe profit and loss accounts of foreign subsidiaries are translated at average exchange rates for the year. Assets and liabilities of foreign subsidiaries are translated at closing exchange rates. Foreign currency borrowings that have been used to provide a hedge against Group equity investments in overseas subsidiaries are also translated at closing exchange rates. The impact of these translations is recorded as a component of the movement in shareholders’ equity.
Closing Average Closing Average
Localcurrency:£ 2011 2011 2010 2010
Hong Kong 12.07 12.48 12.17 12.01 Indonesia 14,091.80 14,049.41 14,106.51 14,033.41 Malaysia 4.93 4.90 4.83 4.97 Singapore 2.02 2.02 2.01 2.11 India 82.53 74.80 70.01 70.66 Vietnam 32,688.16 33,139.22 30,526.26 29,587.63 USA 1.55 1.60 1.57 1.55

458
Prudential plc Annual Report 2011
Additional unaudited financial informationcontinued
Financial statements | Additional unaudited financial information
IV(c): Effect of foreign currency rate movements on results continued
ii EffectofratemovementonresultsIFRSbasisresults
Aspublished2011
note (i)£m
Memorandum2010
note (i)£m
Asian operations: Long-term operations 709 533 Development expenses (5) (4)
Total Asian insurance operations after development costs 704 529 Eastspring Investments 80 73
Total Asia operations 784 602
US operations: Jackson 694 803 Broker-dealer, asset management and Curian operations 24 21
Total US operations 718 824
UK operations: Long-term business 683 673 General insurance commission 40 46
Total UK insurance operations 723 719 M&G 357 284
Total UK operations 1,080 1,003
Total segment profit 2,582 2,429
Other income and expenditure (483) (449) RPI to CPI inflation measure change on defined benefit pension schemes 42 –Solvency II implementation costs (55) (45) Restructuring costs (16) (26)
Operating profit based on longer-term investment returns 2,070 1,909
Shareholders’ funds 9,117 8,007
Note(i) The ‘as published’ operating profit for 2011 and ‘memorandum’ operating profit for 2010 have been calculated by applying average 2011
exchange rates (CER). The ‘as published’ shareholders’ funds for 2011 and memorandum’ shareholders’ funds for 2010 have been calculated by applying closing
period end 2011 exchange rates.

459F
ina
ncia
l statem
en
tsA
dd
ition
al un
aud
ited
finan
cial info
rmatio
n
EEVbasisresults
Aspublished2011
note (i)£m
Memorandum2010
note (i)£m
Asian operations: New business: Excluding Japan 1,076 900 Japan – (1)
Total 1,076 899 Business in force 688 539
Long-term operations 1,764 1,438
Eastspring Investments 80 73 Development expenses (5) (4)
Total Asia operations 1,839 1,507
US operations: New business 815 734 Business in force 616 672
Jackson 1,431 1,406 Broker-dealer, asset management and Curian operations 24 21
Total US operations 1,455 1,427
UK operations: New business 260 365 Business in force 593 571
Long-term business 853 936 General insurance commission 40 46
Total insurance 893 982 M&G 357 284
Total UK operations 1,250 1,266
Other income and expenditure (536) (493) RPI to CPI inflation measure change on defined benefit pension schemes 45 – Solvency II implementation costs (56) (46) Restructuring costs (19) (28)
Operating profit based on longer-term investment returns 3,978 3,633
Shareholders’ funds 19,637 18,135
Note(i) The ‘as published’ operating profit for 2011 and ‘memorandum’ operating profit for 2010 have been calculated by applying average 2011
exchange rates (CER). The ‘as published’ shareholders’ funds for 2011 and memorandum’ shareholders’ funds for 2010 have been calculated by applying closing
period end 2011 exchange rates.

460
Prudential plc Annual Report 2011
Additional unaudited financial informationcontinued
Financial statements | Additional unaudited financial information
IV(d): Option schemes
The Group maintains four share option schemes satisfied by the issue of new shares. UK-based executive directors are eligible to participate in the UK Savings Related Share Option Scheme, and Asia-based executives can participate in the International Savings Related Share Option Scheme. Dublin-based employees are eligible to participate in the Prudential International Assurance Sharesave Plan, and Hong Kong-based agents can participate in the Non-employee Savings Related Share Option Scheme. Further details of the schemes and accounting policies are detailed in Note I4 of the IFRS basis condensed consolidated financial statements. All options were granted at £nil consideration. No options have been granted to substantial shareholders, suppliers of goods or services (excluding options granted to agents under the Non-employee Savings Related Share Option Scheme) or in excess of the individual limit for the relevant scheme.
The options schemes will terminate as follows, unless the directors resolve to terminate the plans at an earlier date:
• UK Savings Related Share Option Scheme: 8 May 2013,• International Savings Related Share Option Scheme: 31 May 2021,• Prudential International Assurance Sharesave Plan: 3 August 2019, and• Non-employee Savings Related Share Option Scheme: 9 May 2012.
The weighted average share price of Prudential plc for the year ended 31 December 2011 was £6.86 (2010: £5.68). Particulars of options granted to directors are included in the Directors’ Remuneration Report on page 134. The closing price of the shares immediately before the date on which the options were granted during the current period was £5.99. The following analyses show the movement in options for each of the option schemes for the year ended 31 December 2011.

461F
ina
ncia
l statem
en
tsA
dd
ition
al un
aud
ited
finan
cial info
rmatio
n
UKSavingsRelatedShareOptionScheme
Exerciseperiod Numberofoptions
DateofgrantExerciseprice£ Beginning End
Beginningofperiod Granted Exercised Cancelled Forfeited Lapsed
Endofperiod
01 Oct 2003 3.62 01 Dec 2010 31 May 2011 2,775 – 1,850 – – 925 – 15 Apr 2004 3.46 01 Jun 2011 30 Nov 2011 17,946 – 17,946 – – – – 30 Sep 2004 3.43 01 Dec 2011 31 May 2012 8,430 – 4,522 – – 56 3,852 12 Apr 2005 3.87 01 Jun 2012 30 Nov 2012 12,222 – 3,321 – – 373 8,528 29 Sep 2005 4.07 01 Dec 2010 31 May 2011 10,597 – 10,597 – – – – 29 Sep 2005 4.07 01 Dec 2012 31 May 2013 9,492 – 237 – – 183 9,072 20 Apr 2006 5.65 01 Jun 2011 30 Nov 2011 13,884 – 13,771 – – 113 – 20 Apr 2006 5.65 01 Jun 2013 30 Nov 2013 7,564 – 114 – – 128 7,322 28 Sep 2006 4.75 01 Dec 2011 31 May 2012 48,003 – 35,810 – – 1,164 11,029 28 Sep 2006 4.75 01 Dec 2013 31 May 2014 13,325 – – – – – 13,325 26 Apr 2007 5.72 01 Jun 2010 30 Nov 2010 3,558 – 495 – – 198 2,865 26 Apr 2007 5.72 01 Jun 2012 30 Nov 2012 8,337 – – – – 1,146 7,191 26 Apr 2007 5.72 01 Jun 2014 30 Nov 2014 503 – – – – – 503 27 Sep 2007 5.52 01 Dec 2010 31 May 2011 25,033 – 21,910 – – 3,123 – 27 Sep 2007 5.52 01 Dec 2012 31 May 2013 17,870 – 86 121 – 399 17,264 27 Sep 2007 5.52 01 Dec 2014 31 May 2015 1,668 – – – – – 1,668 25 Apr 2008 5.51 01 Jun 2011 30 Nov 2011 50,952 – 45,633 682 – 4,637 – 25 Apr 2008 5.51 01 Jun 2013 30 Nov 2013 28,220 – 168 – – 953 27,099 25 Apr 2008 5.51 01 Jun 2015 30 Nov 2015 1,670 – 73 – – 53 1,544 25 Sep 2008 4.38 01 Dec 2011 31 May 2012 153,998 – 103,089 2,628 5,525 2,139 40,617 25 Sep 2008 4.38 01 Dec 2013 31 May 2014 49,036 – 401 – 765 517 47,353 25 Sep 2008 4.38 01 Dec 2015 31 May 2016 14,857 – 709 1,660 – 1,117 11,371 27 Apr 2009 2.88 01 Jun 2012 30 Nov 2012 3,138,322 – 185,439 24,356 60,965 99,908 2,767,654 27 Apr 2009 2.88 01 Jun 2014 30 Nov 2014 1,993,530 – 61,175 17,362 26,585 98,560 1,789,848 27 Apr 2009 2.88 01 Jun 2016 30 Nov 2016 202,734 – 4,560 7,960 1,137 10,109 178,968 25 Sep 2009 4.25 01 Dec 2012 31 May 2013 264,812 – 13,167 14,601 2,348 10,401 224,295 25 Sep 2009 4.25 01 Dec 2014 31 May 2015 101,327 – 955 5,928 731 2,848 90,865 28 Sep 2010 4.61 01 Dec 2013 31 May 2014 314,557 – 2,996 12,636 11,310 15,646 271,969 28 Sep 2010 4.61 01 Dec 2015 31 May 2016 134,638 – – 334 – – 134,304 16 Sep 2011 4.66 01 Dec 2014 31 May 2015 – 491,329 – 4,828 1,081 – 485,420 16 Sep 2011 4.66 01 Dec 2016 31 May 2017 – 202,210 – 4,573 – – 197,637
6,649,860 693,539 529,024 97,669 110,447 254,696 6,351,563
The total number of securities available for issue under the scheme is 6,351,563, which represents 0.249 per cent of the issued share capital at 31 December 2011. The weighted average closing price of the shares immediately before the dates on which the options were exercised during the current period was £6.65. The fair value of options granted under the Plan in the period was £2.63.

462
Prudential plc Annual Report 2011
Additional unaudited financial informationcontinued
Financial statements | Additional unaudited financial information
IV(d): Option schemes continued
InternationalSavingsRelatedShareOptionScheme
Exerciseperiod Numberofoptions
DateofgrantExerciseprice£ Beginning End
Beginningofperiod Granted Exercised Cancelled Forfeited Lapsed
Endofperiod
12 Apr 2005 3.87 01 Jun 2010 30 Nov 2010 758 – – – – 758 –20 Apr 2006 5.65 01 Jun 2011 30 Nov 2011 820 – – – – – 820 28 Sep 2006 4.75 01 Dec 2011 31 May 2012 709 – – – – – 709 26 Apr 2007 5.72 01 Jun 2010 30 Nov 2010 88,610 – – – 854 87,756 –26 Apr 2007 5.72 01 Jun 2012 30 Nov 2012 17,847 – – – – – 17,847 27 Sep 2007 5.52 01 Dec 2010 31 May 2011 40,465 – 9,891 4,185 – 4,204 22,185 25 Apr 2008 5.51 01 Jun 2011 30 Nov 2011 27,068 – 16,323 822 256 739 8,928 25 Apr 2008 5.51 01 Jun 2013 30 Nov 2013 4,192 – – – – – 4,192 25 Sep 2008 4.38 01 Dec 2011 31 May 2012 236,700 – 24,571 15,989 251 – 195,889 25 Sep 2008 4.38 01 Dec 2013 31 May 2014 6,951 – – – – – 6,951 27 Apr 2009 2.88 01 Jun 2012 30 Nov 2012 1,906,105 – 8,966 111,432 44,927 – 1,740,780 27 Apr 2009 2.88 01 Jun 2014 30 Nov 2014 90,029 – – – 8,811 – 81,218 25 Sep 2009 4.25 01 Dec 2012 31 May 2013 132,837 – 979 16,508 4,928 – 110,422 25 Sep 2009 4.25 01 Dec 2014 31 May 2015 2,682 – – – – – 2,682 28 Sep 2010 4.61 01 Dec 2013 31 May 2014 175,050 – – 16,735 1,208 – 157,107 28 Sep 2010 4.61 01 Dec 2015 31 May 2016 6,501 – – 371 – – 6,130 16 Sep 2011 4.66 01 Dec 2014 31 May 2015 – 422,073 – 9,386 1,931 – 410,756 16 Sep 2011 4.66 01 Dec 2016 31 May 2017 – 25,739 – – – – 25,739
2,737,324 447,812 60,730 175,428 63,166 93,457 2,792,355
The total number of securities available for issue under the scheme is 2,792,355, which represents 0.110 per cent of the issued share capital at 31 December 2011. The weighted average closing price of the shares immediately before the dates on which the options were exercised during the current period was £6.61. The fair value of options granted under the Plan in the period was £2.63.
PrudentialInternationalAssuranceSharesavePlan
Exerciseperiod Numberofoptions
DateofgrantExerciseprice£ Beginning End
Beginningofperiod Granted Exercised Cancelled Forfeited Lapsed
Endofperiod
27 Sep 2007 5.52 01 Dec 2010 31 May 2011 618 – 618 – – – –25 Sep 2008 4.38 01 Dec 2011 31 May 2012 1,520 – – – – 829 691 27 Apr 2009 2.88 01 Jun 2012 30 Nov 2012 30,320 – – – – – 30,320 27 Apr 2009 2.88 01 Jun 2014 30 Nov 2014 6,567 – – – – – 6,567 25 Sep 2009 4.25 01 Dec 2012 31 May 2013 2,426 – – – – – 2,426
41,451 – 618 – – 829 40,004
The total number of securities available for issue under the scheme is 40,004, which represents 0.002 per cent of the issued share capital at 31 December 2011. The weighted average closing price of the shares immediately before the dates on which the options were exercised during the current period was £7.10.

463F
ina
ncia
l statem
en
tsA
dd
ition
al un
aud
ited
finan
cial info
rmatio
n
Non-employeeSavingsRelatedShareOptionScheme
Exerciseperiod Numberofoptions
DateofgrantExerciseprice£ Beginning End
Beginningofperiod Granted Exercised Cancelled Forfeited Lapsed
Endofperiod
28 Sep 2006 4.75 01 Dec 2011 31 May 2012 8,577 – 3,191 – – – 5,386 26 Apr 2007 5.72 01 Jun 2010 30 Nov 2010 13,533 – – – – 13,533 –26 Apr 2007 5.72 01 Jun 2012 30 Nov 2012 15,557 – – – – – 15,557 27 Sep 2007 5.52 01 Dec 2010 31 May 2011 19,595 – 11,988 – – – 7,607 27 Sep 2007 5.52 01 Dec 2012 31 May 2013 5,748 – – 2,778 – – 2,970 25 Apr 2008 5.51 01 Jun 2011 30 Nov 2011 20,951 – 14,723 1,639 – – 4,589 25 Apr 2008 5.51 01 Jun 2013 30 Nov 2013 4,195 – – 361 – – 3,834 25 Sep 2008 4.38 01 Dec 2011 31 May 2012 42,741 – 666 1,587 – – 40,488 25 Sep 2008 4.38 01 Dec 2013 31 May 2014 17,135 – – 3,427 – – 13,708 27 Apr 2009 2.88 01 Jun 2012 30 Nov 2012 897,848 – – 23,647 – – 874,201 27 Apr 2009 2.88 01 Jun 2014 30 Nov 2014 749,908 – – 35,582 – – 714,326 25 Sep 2009 4.25 01 Dec 2012 31 May 2013 50,612 – – 4,166 – – 46,446 25 Sep 2009 4.25 01 Dec 2014 31 May 2015 11,717 – – – – – 11,717 28 Sep 2010 4.61 01 Dec 2013 31 May 2014 1,136,477 – – 17,902 – – 1,118,575 28 Sep 2010 4.61 01 Dec 2015 31 May 2016 379,253 – – 3,901 – – 375,352 16 Sep 2011 4.66 01 Dec 2014 31 May 2015 – 649,598 – 5,191 – – 644,407 16 Sep 2011 4.66 01 Dec 2016 31 May 2017 – 266,624 – – – – 266,624
3,373,847 916,222 30,568 100,181 – 13,533 4,145,787
The total number of securities available for issue under the scheme is 4,145,787, which represents 0.163 per cent of the issued share capital at 31 December 2011. The weighted average closing price of the shares immediately before the dates on which the options were exercised during the current period was £6.58. The fair values of options granted under the Plan in the period was £2.63.

464
Prudential plc Annual Report 2011

465A
dd
ition
al in
form
ation
466 Risk factors471 Glossary476 Shareholder information478 How to contact us
Section 6
Additional information

466
Prudential plc Annual Report 2011
Additional information | Risk factors
A number of factors (risk factors) affect Prudential’s operating results and financial condition and, accordingly, the trading price of its shares. The risk factors mentioned below should not be regarded as a complete and comprehensive statement of all potential risks and uncertainties. The information given is as of the date of this document, is not updated, and any forward looking statements are made subject to the reservations specified below under ‘Forward Looking Statements’.
Prudential’s approaches to managing risks are explained in the ‘Business review’ section under ‘Risk and capital management’.
Risks relating to Prudential’s businessPrudential’s businesses are inherently subject to market fluctuations and general economic conditionsPrudential’s businesses are inherently subject to market fluctuations and general economic conditions. Uncertainty or negative trends in international economic and investment climates could adversely affect Prudential’s business and profitability. Since 2008 Prudential has had to operate against a challenging background of periods of unprecedented volatility in global capital and equity markets, interest rates and liquidity, and widespread economic uncertainty. Government interest rates have also fallen to historic lows in the US and UK. These factors have, at times during this period, had a material adverse effect on Prudential’s business and profitability.
In the future, the adverse effects of such factors would be felt principally through the following items:
• Investment impairments or reduced investment returns, which could impair Prudential’s ability to write significant volumes of new business and would have a negative impact on its assets under management and profit;
• Higher credit defaults and wider credit and liquidity spreads resulting in realised and unrealised credit losses;
• Prudential in the normal course of business enters into a variety of transactions with counterparties, including derivative transactions. Failure of any of these counterparties to discharge their obligations, or where adequate collateral is not in place, could have an adverse impact on Prudential’s results; and
• Estimates of the value of financial instruments being difficult because in certain illiquid or closed markets, determining the value at which financial instruments can be realised is highly subjective. Processes to ascertain value and estimates of value require substantial elements of judgement, assumptions and estimates (which may change over time). Increased illiquidity also adds to uncertainty over the accessibility of financial resources and may reduce capital resources as valuations decline.
Global financial markets have experienced, and continue to experience, significant volatility brought on, in particular, by concerns over European and US sovereign debt, as well as concerns about a general slowing of global demand reflecting an increasing lack of confidence among consumers, companies and governments. Upheavals in the financial markets may affect general levels of economic activity, employment and customer behaviour. For example, insurers may experience an elevated incidence of claims, lapses, or surrenders of policies, and some policyholders may choose to defer or stop paying insurance premiums. The demand for insurance products may also be adversely affected. If sustained, this environment is likely to have a negative impact on the insurance sector over time and may consequently have a negative impact on Prudential’s business and profitability. New challenges related to market fluctuations and general economic conditions may continue to emerge.
For some non-unit-linked investment products, in particular those written in some of the Group’s Asian operations, it may not be possible to hold assets which will provide cash flows to match exactly those relating to policyholder liabilities. This is particularly true in those countries where bond markets are not developed and in certain markets where regulated surrender values are set with reference to the interest rate environment prevailing at the time of policy issue. This results in a mismatch due to the duration and uncertainty of the liability cash flows and the lack of sufficient assets of a suitable duration. While this residual asset/liability mismatch risk can be managed, it cannot be eliminated. Where interest rates in these markets remain lower than interest rates used to calculate surrender values over a sustained period, this could have an adverse impact on Prudential’s reported profit.
In the US, fluctuations in prevailing interest rates can affect results from Jackson, which has a significant spread-based business, with the majority of its assets invested in fixed income securities. In particular, fixed annuities and stable value products written by Jackson expose Prudential to the risk that changes in interest rates, which are not fully reflected in the interest rates credited to customers, will reduce spread. The spread is the difference between the rate of return Jackson is able to earn on the assets backing the policyholders’ liabilities and the amounts that are credited to policyholders in the form of benefit increases, subject to minimum crediting rates.
Declines in spread from these products or other spread businesses that Jackson conducts could have a material impact on its businesses or results of operations. Jackson also writes a significant amount of variable annuities that offer capital or income protection guarantees. There could be market circumstances where the derivatives that it enters into to hedge its market risks may not fully offset its losses, and any cost of the guarantees that remain unhedged will also affect Prudential’s results.
A significant part of the profit from Prudential’s UK insurance operations is related to bonuses for policyholders declared on with-profits products, which are broadly based on historical and current rates of return on equity, real estate and fixed income securities, as well as Prudential’s expectations of future investment returns.
Risk factors

467A
dd
ition
al in
form
ation
Prudential is subject to the risk of potential sovereign debt credit deterioration owing to the amounts of sovereign debt obligations held in its investment portfolioPrudential is subject to the risk of potential sovereign debt credit deterioration and default. During 2011 and 2012, this risk has heightened, particularly in relation to European and US sovereign debt. Investing in such instruments creates exposure to the direct or indirect consequences of political, social or economic changes (including changes in governments, heads of states or monarchs) in the countries in which the issuers are located and the creditworthiness of the sovereign. Investment in sovereign debt obligations involves risks not present in debt obligations of corporate issuers. In addition, the issuer of the debt or the governmental authorities that control the repayment of the debt may be unable or unwilling to repay principal or pay interest when due in accordance with the terms of such debt, and Prudential may have limited recourse to compel payment in the event of a default. A sovereign debtor’s willingness or ability to repay principal and to pay interest in a timely manner may be affected by, among other factors, its cash flow situation, its relations with its central bank, the extent of its foreign currency reserves, the availability of sufficient foreign exchange on the date a payment is due, the relative size of the debt service burden to the economy as a whole, the sovereign debtor’s policy toward local and international lenders, and the political constraints to which the sovereign debtor may be subject. Periods of economic uncertainty may affect the volatility of market prices of sovereign debt to a greater extent than the volatility inherent in debt obligations of other types of issues. If a sovereign were to default on its obligations, this could have a material adverse effect on Prudential’s financial condition and results of operations.
Prudential is subject to the risk of exchange rate fluctuations owing to the geographical diversity of its businessesDue to their geographical diversity, Prudential’s businesses are subject to the risk of exchange rate fluctuations. Prudential’s operations in the US and Asia, which represent a significant proportion of operating profit and shareholders’ funds, generally write policies and invest in assets denominated in local currency. Although this practice limits the effect of exchange rate fluctuations on local operating results, it can lead to significant fluctuations in Prudential’s consolidated financial statements upon translation of results into pounds sterling. The currency exposure relating to the translation of reported earnings is not currently separately managed. The impact of gains or losses on currency translations is recorded as a component of shareholders’ funds within other comprehensive income. Consequently, this could impact on Prudential’s gearing ratios (defined as debt over debt plus shareholders’ funds).
Prudential conducts its businesses subject to regulation and associated regulatory risks, including the effects of changes in the laws, regulations, policies and interpretations and any accounting standards in the markets in which it operatesChanges in government policy, legislation (including tax) or regulatory interpretation applying to companies in the financial services and insurance industries in any of the markets in which Prudential operates, which in some circumstances may be applied retrospectively, may adversely affect Prudential’s product range, distribution channels, capital requirements and, consequently, reported results and financing requirements. Also, regulators in jurisdictions in which Prudential operates may change the level of capital required to be held by individual businesses or could introduce possible changes in the regulatory framework for pension arrangements and policies, the regulation of selling practices and solvency requirements. Furthermore, as a result of the recent interventions by governments in response to global economic conditions, it is widely expected that there will be a substantial increase in government regulation and supervision of the financial services industry, including the possibility of higher capital requirements, restrictions on certain types of transaction structure and enhanced supervisory powers.
Current EU directives, including the EU Insurance Groups Directive (‘IGD’), require European financial services groups to demonstrate net aggregate surplus capital in excess of solvency requirements at the group level in respect of shareholder-owned entities. The test is a continuous requirement, so that Prudential needs to maintain a somewhat higher amount of regulatory capital at the group level than otherwise necessary in respect of some of its individual businesses to accommodate, for example, short-term movements in global foreign exchange rates, interest rates, deterioration in credit quality and equity markets. The EU is also developing a new solvency framework for insurance companies, referred to as ‘Solvency II’. The new approach will be based on the concept of three pillars – minimum capital requirements, supervisory review of firms’ assessment of risk, and enhanced disclosure requirements – and will cover valuations, the treatment of insurance groups, the definition of capital and the overall level of capital requirements. A key aspect of Solvency II is that the assessment of risks and capital requirements will be aligned more closely with economic capital methodologies, and may allow Prudential to make use of its internal economic capital models, if approved by the Financial Services Authority (FSA) or other relevant supervisory authority. The Solvency II Directive was formally approved by the Economic and Financial Affairs Council in November 2009. The European Parliament is currently discussing the Omnibus II Directive which, once approved, will amend the Solvency II Directive. In addition, the European Commission is continuing to develop the detailed rules that will complement the high-level principles of the Directive, referred to as ‘implementing measures’. The Omnibus II Directive is expected to be finalised during 2012, with the implementing measures expected to be finalised later in 2012. There is significant uncertainty regarding the final outcome of this process. As a result there is a risk that the effect of the measures finally adopted could be adverse for Prudential, including potentially a significant increase in capital required to support its business and that Prudential may be placed at a competitive disadvantage to other European and non-European financial services groups.

468
Prudential plc Annual Report 2011
Risk factors
Additional information | Risk factors | continued
Various jurisdictions in which Prudential operates have created investor compensation schemes that require mandatory contributions from market participants in some instances in the event of a failure of a market participant. As a major participant in the majority of its chosen markets, circumstances could arise where Prudential, along with other companies, may be required to make such contributions.
The Group’s accounts are prepared in accordance with current International Financial Reporting Standards (‘IFRS’) applicable to the insurance industry. The International Accounting Standards Board (‘IASB’) introduced a framework that it described as Phase I, which permitted insurers to continue to use the statutory basis of accounting for insurance assets and liabilities that existed in their jurisdictions prior to January 2005. In July 2010, the IASB published an Exposure Draft for its Phase II on insurance accounting, which would introduce significant changes to the statutory reporting of insurance entities that prepare accounts according to IFRS. The IASB continues its deliberation on the exposure draft principles but it remains uncertain whether the proposals in the Exposure Draft will become the final IASB standard and when changes might take effect.
Any changes or modification of IFRS accounting policies may require a change in the future results or a restatement of reported results.
European Embedded Value (‘EEV’) basis results are published as supplementary information by Prudential using principles issued by the European CFO (Chief Financial Officers) Forum. The EEV basis is a value-based reporting method for Prudential’s long-term business which is used by market analysts, and which underpins a significant part of the key performance indicators used by Prudential’s management for both internal and external reporting purposes.
The resolution of several issues affecting the financial services industry could have a negative impact on Prudential’s reported results or on its relations with current and potential customersPrudential is, and in the future may be, subject to legal and regulatory actions in the ordinary course of its business, both in the UK and internationally. These actions could involve a review of business sold in the past under acceptable market practices at the time, such as the requirement in the UK to provide redress to certain past purchasers of pension and mortgage endowment policies, changes to the tax regime affecting products and regulatory reviews on products sold and industry practices, including, in the latter case, businesses it has closed.
Regulators particularly, but not exclusively, in the US and the UK are moving towards a regime based on principles-based regulation which brings an element of uncertainty. These regulators are increasingly interested in the approach that product providers use to select third party distributors and to monitor the appropriateness of sales made by them. In some cases, product providers can be held responsible for the deficiencies of third-party distributors.
In the US, federal and state regulators have focused on, and continue to devote substantial attention to, the mutual fund, fixed index annuity and insurance product industries. This focus includes new regulations in respect of the suitability of sales of certain products. As a result of publicity relating to widespread perceptions of industry abuses, there have been numerous regulatory inquiries and proposals for legislative and regulatory reforms.
In Asia, regulatory regimes are developing at different speeds, driven by a combination of global factors and local considerations. There is a risk that new requirements are introduced that challenge current practices, or are retrospectively applied to sales made prior to their introduction.
Litigation, disputes and regulatory investigations may adversely affect Prudential’s profitability and financial conditionPrudential is, and may be in the future, subject to legal actions, disputes and regulatory investigations in the ordinary course of its insurance, investment management and other business operations. These legal actions, disputes and investigations may relate to aspects of Prudential’s businesses and operations that are specific to Prudential, or that are common to companies that operate in Prudential’s markets. Legal actions and disputes may arise under contracts, regulations (including tax) or from a course of conduct taken by Prudential, and may be class actions. Although Prudential believes that it has adequately provided in all material aspects for the costs of litigation and regulatory matters, no assurance can be provided that such provisions are sufficient. Given the large or indeterminate amounts of damages sometimes sought, and the inherent unpredictability of litigation and disputes, it is possible that an adverse outcome could, from time to time, have an adverse effect on Prudential’s results of operations or cash flows.
Prudential’s businesses are conducted in highly competitive environments with developing demographic trends and continued profitability depends on management’s ability to respond to these pressures and trendsThe markets for financial services in the UK, US and Asia are highly competitive, with several factors affecting Prudential’s ability to sell its products and continued profitability, including price and yields offered, financial strength and ratings, range of product lines and product quality, brand strength and name recognition, investment management performance, historical bonus levels, developing demographic trends and customer appetite for certain savings products. In some of its markets, Prudential faces competitors that are larger, have greater financial resources or a greater market share, offer a broader range of products or have higher bonus rates or claims-paying ratios. Further, heightened competition for talented and skilled employees and agents with local experience, particularly in Asia, may limit Prudential’s potential to grow its business as quickly as planned.
In Asia, the Group’s principal regional competitors are international financial companies, including Allianz, AXA, ING, AIA and Manulife. In a number of markets, local companies have a very significant market presence.

469A
dd
ition
al in
form
ation
Within the UK, Prudential’s principal competitors in the life market include many of the major retail financial services companies including, in particular, Aviva, Legal & General, Lloyds Banking Group and Standard Life.
Jackson’s competitors in the US include major stock and mutual insurance companies, mutual fund organisations, banks and other financial services companies such as AIG, AXA Financial Inc., Hartford Life Inc., Prudential Financial, Lincoln National, MetLife and TIAA-CREF.
Prudential believes competition will intensify across all regions in response to consumer demand, technological advances, the impact of consolidation, regulatory actions and other factors. Prudential’s ability to generate an appropriate return depends significantly upon its capacity to anticipate and respond appropriately to these competitive pressures.
Downgrades in Prudential’s financial strength and credit ratings could significantly impact its competitive position and hurt its relationships with creditors or trading counterpartiesPrudential’s financial strength and credit ratings, which are used by the market to measure its ability to meet policyholder obligations, are an important factor affecting public confidence in most of Prudential’s products, and as a result its competitiveness. Downgrades in Prudential’s ratings, as a result of, for example, decreased profitability, increased costs, increased indebtedness or other concerns, could have an adverse effect on its ability to market products; retain current policyholders; and on the Group’s financial flexibility. In addition, the interest rates Prudential pays on its borrowings are affected by its debt credit ratings, which are in place to measure the Group’s ability to meet its contractual obligations.
Prudential’s long-term senior debt is rated as A2 by Moody’s, A+ by Standard & Poor’s and A by Fitch. These ratings have a stable outlook.
Prudential’s short-term debt is rated as P-1 by Moody’s, A-1 by Standard & Poor’s and F1 by Fitch.
The Prudential Assurance Company Limited’s financial strength is rated Aa2 by Moody’s, AA by Standard & Poor’s and AA by Fitch. These ratings have a stable outlook.
Jackson’s financial strength is rated AA by Standard & Poor’s and Fitch, A1 by Moody’s, and A+ by AM Best. These ratings have a stable outlook.
In addition, changes in methodologies and criteria used by rating agencies could result in downgrades that do not reflect changes in the general economic conditions, or Prudential’s financial condition.
Adverse experience in the operational risks inherent in Prudential’s business could have a negative impact on its results of operationsOperational risks are present in all of Prudential’s businesses, including the risk of direct or indirect loss resulting from inadequate or failed internal and external processes, systems and human error or from external events. Prudential’s business is dependent on processing a large number of complex transactions across numerous and diverse products, and is subject to a number of different legal and regulatory regimes. In addition, Prudential outsources several operations, including a significant part of its UK back office and customer-facing functions as well as a number of IT functions, resulting in reliance upon the operational processing performance of its outsourcing partners.
Further, because of the long-term nature of much of the Group’s business, accurate records have to be maintained for significant periods. Prudential’s systems and processes incorporate controls which are designed to manage and mitigate the operational risks associated with its activities. For example, any weakness in the administration systems or actuarial reserving processes could have an impact on its results of operations during the effective period. Prudential has not experienced or identified any operational risks in its systems or processes during 2011, which have subsequently caused, or are expected to cause, a significant negative impact on its results of operations.
Adverse experience against the assumptions used in pricing products and reporting business results could significantly affect Prudential’s results of operationsPrudential needs to make assumptions about a number of factors in determining the pricing of its products and setting reserves, and for reporting its capital levels and the results of its long-term business operations. For example, the assumption that Prudential makes about future expected levels of mortality is particularly relevant for its UK annuity business. In exchange for a premium equal to the capital value of their accumulated pension fund, pension annuity policyholders receive a guaranteed payment, usually monthly, for as long as they are alive. Prudential conducts rigorous research into longevity risk, using data from its substantial annuitant portfolio. As part of its pension annuity pricing and reserving policy, Prudential’s UK business assumes that current rates of mortality continuously improve over time at levels based on adjusted data from the Continuous Mortality Investigations (CMI), as published by the Institute and Faculty of Actuaries. If mortality improvement rates significantly exceed the improvement assumed, Prudential’s results of operations could be adversely affected.

470
Prudential plc Annual Report 2011
Risk factors
Additional information | Risk factors | continued
A further example is the assumption that Prudential makes about future expected levels of the rates of early termination of products by its customers (persistency). This is particularly relevant to its lines of business other than its UK annuity business. Prudential’s persistency assumptions reflect recent past experience for each relevant line of business. Any expected deterioration in future persistency is also reflected in the assumption. If actual levels of future persistency are significantly lower than assumed (that is, policy termination rates are significantly higher than assumed), the Group’s results of operations could be adversely affected.
Another example is the impact of epidemics and other effects that cause a large number of deaths. Significant influenza epidemics have occurred three times in the last century, but the likelihood, timing, or the severity of future epidemics cannot be predicted. The effectiveness of external parties, including governmental and non-governmental organisations, in combating the spread and severity of any epidemics could have a material impact on the Group’s loss experience.
In common with other industry participants, the profitability of the Group’s businesses depends on a mix of factors including mortality and morbidity trends, policy surrender rates, investment performance and impairments, unit cost of administration and new business acquisition expense.
As a holding company, Prudential is dependent upon its subsidiaries to cover operating expenses and dividend payments.The Group’s insurance and investment management operations are generally conducted through direct and indirect subsidiaries.
As a holding company, Prudential’s principal sources of funds are remittances from subsidiaries, shareholder-backed funds, the shareholder transfer from long-term funds and any amounts that may be raised through the issuance of equity, debt and commercial paper. Certain of the subsidiaries are restricted by applicable insurance, foreign exchange and tax laws, rules and regulations that can limit the payment of dividends, which in some circumstances could limit the ability to pay dividends to shareholders, or to make available funds held in certain subsidiaries to cover operating expenses of other members of the Group.
Prudential operates in a number of markets through joint ventures and other arrangements with third parties (including in China and India), involving certain risks that Prudential does not face with respect to its consolidated subsidiariesPrudential operates, and in certain markets is required by local regulation to operate, through joint ventures (including in China and India). For the Group’s joint venture operations, management control is exercised jointly with the venture participants. The level of control exercisable by the Group depends on the terms of the joint venture agreements, in particular, the allocation of control among, and continued co-operation between, the joint venture participants. Prudential may also face financial or other exposure in the event that any of its joint venture partners fails to meet its obligations under the joint venture, or encounters financial difficulty. In addition, a significant proportion of the Group’s product distribution is carried out through arrangements with third parties not controlled by Prudential and is dependent upon continuation of these relationships. A temporary or permanent disruption to these distribution arrangements could adversely affect the results of operations of Prudential.
Prudential’s Articles of Association contain an exclusive jurisdiction provisionUnder Prudential’s Articles of Association, certain legal proceedings may only be brought in the courts of England and Wales. This applies to legal proceedings by a shareholder (in its capacity as such) against Prudential and/or its directors and/or its professional service providers. It also applies to legal proceedings between Prudential and its directors and/or Prudential and Prudential’s professional service providers that arise in connection with legal proceedings between the shareholder and such professional service provider. This provision could make it difficult for US and other non-UK shareholders to enforce their shareholder rights.
Changes in tax legislation may result in adverse tax consequencesTax rules, including those relating to the insurance industry, and their interpretation, may change, possibly with retrospective effect, in any of the jurisdictions in which Prudential operates. Significant tax disputes with tax authorities, and any change in the tax status of any member of the Group or in taxation legislation or its scope or interpretation could affect Prudential’s financial condition and results of operations.

471A
dd
ition
al in
form
ation
Glossary
Actual exchange rate (AER) Actual exchange rates are actual historical exchange rates for the specific accounting period, being the average rates over the period for the income statement and the closing rates for the balance sheet at the balance sheet date.
Annual premium equivalent or APE A measure of new business activity that is calculated as the sum of annualised regular premiums from new business plus 10 per cent of single premiums on new business written during the period.
Annuity A contract providing for periodic payments to an annuitant for a specified period of time, often until the annuitant’s death.
Asset backed security (ABS)A security whose value and income payments are derived from and collateralised (or ‘backed’) by a specified pool of underlying assets. The pool of assets is typically a group of small and illiquid assets that are unable to be sold individually.
Available-for-sale (AFS) Securities that have been acquired neither for short-term sale nor to be held to maturity. Shown at fair value on the statement of financial position and changes in value are taken straight to equity instead of the income statement.
Bancassurance The distribution of insurance products through bank branches and/or joint ventures with banks.
Bonuses Bonuses refer to the non-guaranteed benefit added to participating life insurance policies and are the way in which policyholders receive their share of the profits of the policies. There are normally two types of bonus:
• Regular bonus – expected to be added every year during the term of the policy. It is not guaranteed that a regular bonus will be added each year, but once it is added, it cannot be reversed, also known as annual or reversionary bonus; and
• Final bonus – an additional bonus expected to be paid when policyholders take money from the policies. If investment return has been low over the lifetime of the policy, a final bonus may not be paid. Final bonuses may vary and are not guaranteed.
Cash surrender value The amount of cash available to a policyholder on the surrender of or withdrawal from a life insurance policy or annuity contract.
Cede When an insurer reinsures its risk with another insurer, it ‘cedes’ business.
Claim An occurrence that is the basis for submission and/or payment of a benefit under an insurance policy. Depending on the terms of the insurance policy, a claim may be covered, limited or excluded from coverage.
Collateralised debt obligation fund (CDO fund) An asset backed security and structured credit product. CDOs gain exposure to the credit of a portfolio of assets and divide the credit risk among different tranches, with any losses initially applied to the most junior tranches and moving up to the more senior tranches should these be exhausted.
Commission A fee paid to an agent or broker by an insurance company for services rendered in connection with the sale or maintenance of an insurance product.
Constant exchange rate (CER) Constant exchange rate – Prudential plc reports its results at both actual exchange rates (AER) to reflect actual results and also constant exchange rates, so as to eliminate the impact from exchange translation.
Core structural borrowings Borrowings which Prudential considers to form part of its core capital structure and exclude operational borrowings.
Credit risk The risk of loss if another party fails to meet its obligations, or fails to do so in a timely fashion.
Currency risk The risk that asset or liability values, cash flows, income or expenses will be affected by changes in exchange rates. Also referred to as foreign exchange risk.
Deferred acquisition costs or DAC Acquisition costs are expenses of an insurer which are incurred in connection with the acquisition of new insurance contracts, or the renewal of existing insurance policies. They include commissions and other variable sales inducements and the direct costs of issuing the policy, such as underwriting and other policy issue expenses. Typically, under IFRS, an element of acquisition costs is deferred ie not expensed in the year incurred, and instead, amortised in the income statement in line with the emergence of surpluses on the related contracts.
Deferred annuities Annuities or pensions due to be paid from a future date or when the policyholder reaches a specified age.
Defined benefit pension schemeAn occupational scheme where the benefits paid to the annuitant depend on the number of years in service and the salary at the time of retirement. Also known as a final salary scheme in the UK.
Discretionary participation features or DPF A contractual right to receive, as a supplement to guaranteed benefits, additional benefits:
• that are likely to be a significant portion of the total contractual benefits,
• whose amount or timing is contractually at the discretion of the issuer, and
• that are contractually based on asset, fund, company or other entity performance as discussed in IFRS 4.

472
Prudential plc Annual Report 2011
Additional information | Glossary | continued
Glossary
Dividend cover Dividend cover is calculated as operating profit after tax on an IFRS basis, divided by the current year interim dividend plus the proposed final dividend.
Duration The number of years required to receive the present value of a stream of future cash flow, which is often used as an indicator of a bond’s price volatility resulting from changes in interest rates.
Earnings per share (EPS)Total earnings divided by the number of shares outstanding. Basic EPS uses a weighted average number of shares outstanding during the year. For diluted earnings per share, the weighted average number of shares in issue is adjusted to assume conversion of all dilutive potential ordinary shares.
Economic assumptions Assumptions about economic variables such as interest rates, economic growth and inflation.
Endowment product An ordinary individual life insurance product that provides the insured party with various guaranteed benefits if it survives specific maturity dates or periods stated in the policy. Upon the death of the insured party within the coverage period, a designated beneficiary receives the face value of the policy.
European Embedded Value or EEV Financial results prepared in accordance with a set of Principles issued by the Chief Financial Officers Forum of European Insurance Companies in May 2004 and expanded by the Additional Guidance of EEV Disclosures published in October 2005.
Fair value The price that a reasonable buyer would be willing to pay and a reasonable seller would be willing to accept for a product on the open market.
First year premiums These are premiums received in the first year of a recurring premium policy.
Fixed annuitiesFixed annuity contracts written in the US which allow for tax-deferred accumulation of funds, are used for asset accumulation in retirement planning and for providing income in retirement and offer flexible payout options. The contract holder pays the insurer a premium, which is credited to the contract holders account. Periodically, interest is credited to the contract holders account and administrative charges are deducted, as appropriate.
Fixed indexed annuities These are similar to fixed annuities, in that the contract holder pays the insurer a premium, which is credited to the contract holder’s account, and periodically, interest is credited to the contract holders account and administrative charges are deducted, as appropriate. An annual minimum interest rate may be guaranteed, although actual interest credited may be higher and is linked to an equity index over its indexed option period.
Funds under management These comprise funds of the Group held in the statement of financial position and external funds that are managed by Prudential asset management operations.
Generally accepted accounting principles (GAAP) A widely accepted set of rules, conventions, standards and procedures for reporting financial information of a national standard setter.
Guaranteed annuities Policies that pay out a fixed amount of benefit for a defined period.
Guaranteed investment contract (GIC) (US) An investment contract between an insurance company and an institutional investor, which provides a stated rate of return on deposits over a specified period of time. They typically provide for partial or total withdrawals at book value if needed for certain liquidity needs of the plan.
Guaranteed minimum accumulation benefit (GMAB) (US) A guarantee that ensures that the contract value of a variable annuity contract will be at least equal to a certain minimum amount after a specified number of years.
Guaranteed minimum death benefit (GMDB) (US) The basic death benefit offered under variable annuity contracts, which specifies that if the owner dies before annuity income payments begin, the beneficiary will receive a payment equal to the greater of the contract value or purchase payments less withdrawals.
Guaranteed minimum income benefit (GMIB) (US) A guarantee that ensures, under certain conditions, that the owner may annuitise the variable annuity contract based on the greater of (a) the actual account value or (b) a payout base equal to premiums credited with some interest rate, or the maximum anniversary value of the account prior to annuitisation.
Guaranteed minimum withdrawal benefit (GMWB) (US) A guarantee in a variable annuity that promises that the owner may make annual withdrawals of a defined amount for the life of the owner or until the total guaranteed amount is recovered, regardless of market performance or the actual account balance.

473A
dd
ition
al in
form
ation
Group free surplus Group free surplus at the end of the period comprises free surplus for the insurance businesses, representing the excess of the net worth over the required capital included in the EEV results, and IFRS net assets for the asset management businesses excluding goodwill. The free surplus generated during the period comprises the movement in this balance excluding foreign exchange, capital movements and other reserve movements. Specifically, it includes amounts maturing from the in-force operations during the period less the investment in new business, the effect of market movements and other one-off items.
Health and protection These comprise health and personal accident insurance products, which provide morbidity or sickness benefits and include health, disability, critical illness and accident coverage. Health and protection products are sold both as standalone policies and as riders that can be attached to life insurance products. Health and Protection riders are presented together with ordinary individual life insurance products for purposes of disclosure of financial information.
Holding company cash flow The cash flow of Prudential plc, the ultimate parent company, and its central finance subsidiaries.
IGD surplus The Prudential Group’s solvency surplus, measured in accordance with the EU Insurance Groups Directive.
Immediate annuity An annuity in which payments to the annuitant or beneficiary start at once upon establishment of the annuity plan or scheme. Such annuities are almost always purchased with a single (lump sum) payment.
In-force An insurance policy or contract reflected on records that has not expired, matured or otherwise been surrendered or terminated.
Inherited estate For life insurance proprietary companies, surplus capital available on top of what is necessary to cover policyholders reasonable expectations. An inherited (orphan) estate is effectively surplus capital on a realistic basis built over time and not allocated to policyholders or shareholders.
Internal rate of return (IRR) The IRR is equivalent to the discount rate at which the present EEV value of the post-tax cash flows expected to be earned over the life time of the business written in shareholder-backed life funds is equal to the total invested capital to support the writing of the business. The capital included in the calculation of the IRR is equal to the amount required to pay acquisition costs and set up reserves less premiums received, plus encumbered capital. The impact of the time value of options and guarantees is included in the calculation.
International Financial Reporting Standards (IFRS)Accounting standards that all publicly listed groups in the European Union are required to apply in preparing consolidated financial statements.
Investment funds Pools of funds held for collective investment purposes.
Investment grade Investments rated BBB- or above for S&P or Baa3 or above for Moodys. Generally they are bonds that are judged by the rating agency as likely enough to meet payment obligations that banks are allowed to invest in them.
Investment-linked products or contracts Insurance products where the surrender value of the policy is linked to the value of underlying investments (such as collective investment schemes, internal investment pools or other property) or fluctuations in the value of underlying investment or indices. Investment risk associated with the product is usually borne by the policyholder. Insurance coverage, investment and administration services are provided for which the charges are deducted from the investment fund assets. Benefits payable will depend on the price of the units prevailing at the time of surrender, death or the maturity of the product, subject to surrender charges. These are also referred to as unit-linked products or unit linked contracts.
Investment property Property (land and/or a building or part of a building) held to earn rentals or for capital appreciation or both, rather than for use by the Prudential Group’s operations.
Loans Policy loans, mortgage loans on residential and commercial real estate and other loans outside of Prudential Group.
Market value reduction (MVR) A reduction applied to the payment on with-profits bonds when policyholders surrender in adverse market conditions.
Medium term note (MTN) A general obligation of a company, sold through investment banks, with maturities generally in the three to 10-year range.
Money Market Fund (MMF)A MMF is an open-ended mutual fund that invests in short-term debt securities such as US treasury bills and commercial paper. The purpose of an MMF is to provide investors with a safe place to invest easily accessible cash-equivalent assets characterised as a low-risk, low-return investment.
Mortality rate Rate of death, varying by such parameters as age, gender and health, used in pricing and computing liabilities for future policyholders of life and annuity products, which contain mortality risks.

474
Prudential plc Annual Report 2011
Glossary
Additional information | Glossary | continued
Net asset value per share Shareholders equity divided by the number of ordinary shares in issue.
Net premiums Life insurance premiums net of reinsurance premiums ceded to third party reinsurers.
Net worthRegulatory basis net assets for EEV reporting purposes. These net assets are sometimes subject to minor adjustment to achieve consistency with the IFRS treatment of certain items.
New business contribution The profits, calculated in accordance with European Embedded Value Principles, from business sold in the financial reporting period under consideration.
New business margin The value of new business on an EEV basis, expressed as a percentage of the present value of new business premiums expected to be received from the new business.
Non-participating business A life insurance policy where the policyholder is not entitled to a share of the company’s profits and surplus, but receives certain guaranteed benefits. Also known as non-profit in the UK. Examples include pure risk policies (eg fixed annuities, term insurance, critical illness) and unit-linked insurance contracts.
Open ended investment company (OEIC)A collective investment fund structured as a limited company in which investors can buy and sell shares.
Operating profits based on longer-term investment returns• IFRS basis – operating profits based on longer-term investment
returns are IFRS profit before tax attributable to shareholders, which, inter alia, excludes short-term fluctuations in investment returns, the shareholders’ share of actuarial gains and losses on defined benefit pension schemes, profits and losses on the sale or dilution of the Group’s businesses and other significant non-operational items included in the total profit.
• EEV basis – similar to as described under IFRS but under EEV basis, where additional profit and loss effects arise, operating profit based on longer-term investment returns also excludes the mark to market value movements on core structural borrowings and the effect in changes in economic assumptions and changes in the time value of cost of options and guarantees arising from changes in economic factors.
Operational borrowings Borrowings which arise in the normal course of the business.
Participating funds Distinct portfolios where the policyholders have a contractual right to receive, at the discretion of the insurer, additional benefits based on factors such as the performance of a pool of assets held within the fund, as a supplement to any guaranteed benefits. The insurer may either have discretion as to the timing of the allocation of those benefits to participating policyholders, or may have discretion as to the timing and the amount of the additional benefits. For Prudential the most significant participating funds are with-profits funds for business written in the UK, Hong Kong, Malaysia and Singapore.
Participating policies or participating business Contracts of insurance where the policyholders have a contractual right to receive, at the discretion of the insurer, additional benefits based on factors such as investment performance, as a supplement to any guaranteed benefits. This is also referred to as with-profits business.
Present value of new business premiums or PVNBP The present value of new business premiums is calculated as equalling single premiums plus the present value of expected premiums of new regular premium business, allowing for lapses and other assumptions made in determining the EEV new business contribution.
Regular premium product A life insurance product with regular periodic premium payments.
Reinsurance The practice whereby an insurer, in consideration of a premium paid to it, agrees to indemnify another party for part or all of the liabilities assumed by the reinsured party under an insurance contract, which the reinsured party has issued.
Renewal premiums Premiums receivable in subsequent years of a multi-year insurance policy.
Rider A supplemental plan that can be attached to a basic insurance policy, with payment of additional premium.
Risk margin reserve (RMR) chargeAn RMR is included within operating profit based on longer-term investment returns and represents a charge for long-term expected defaults of debt securities, determined by reference to the credit quality of the portfolio.
Sarbanes-Oxley The Sarbanes-Oxley Act, officially named the Public Company Accounting Reform and Investor Protection Act of 2002, became law on 30 July 2002 in response to high-profile business failures, in order to reinforce investor confidence and protect investors by improving the accuracy and reliability of corporate disclosure. All companies (both foreign and domestic in the US), including Prudential, that have registered equity or debt securities under the Securities Exchange Act of 1934 are subject to the Sarbanes-Oxley Act.

475A
dd
ition
al in
form
ation
Scottish Amicable Insurance Fund (SAIF) SAIF is a ring-fenced sub-fund of the Prudential Assurance Company’s long-term fund following the acquisition of the mutually owned Scottish Amicable Life Assurance Society in 1997. The fund is solely for the benefit of policyholders of SAIF. Shareholders of Prudential plc have no interest in the profits of this fund, although they are entitled to asset management fees on this business.
Separate account A separate account is a pool of investments held by an insurance company not in or ‘separate’ from its general account. The returns from the separate account generally accrue to the policyholder. A separate account allows an investor to choose an investment category according to his individual risk tolerance, and desire for performance.
Single premiums Single premium policies of insurance are those that require only a single lump sum payment from the policyholder.
Stochastic techniques Stochastic techniques incorporate results from repeated simulations using key financial parameters which are subject to random variations and are projected into the future.
Subordinated debt A fixed interest issue or debt that ranks below other debt in order of priority for repayment if the issuer is liquidated. Holders are compensated for the added risk through higher rates of interest. Under EU insurance regulation, subordinated debt is not treated as a liability and counts towards the coverage of the required minimum margin of solvency, with limitations.
Surrender The termination of a life insurance policy or annuity contract at the request of the policyholder, after which the policyholder receives the cash surrender value, if any, of the contract.
Surrender charge or surrender fee The fee charged to a policyholder when a life insurance policy or annuity contract is surrendered for its cash surrender value prior to the end of the surrender charge period.
Takaful Insurance that is compliant with Islamic principles.
Time value of options and guarantees The value of financial options and guarantees comprises two parts, the intrinsic value and the time value. The intrinsic value is given by a deterministic valuation on best estimate assumptions. The time value is the additional value arising from the variability of economic outcomes in the future.
Total shareholder return (TSR) TSR represents the growth in the value of a share, plus the value of dividends paid, assuming that the dividends are reinvested in the Company’s shares on the ex-divided date.
Unallocated surplus Unallocated surplus is recorded wholly as a liability and represents the excess of assets over policyholder liabilities for Prudential’s with-profits funds. The balance retained in the unallocated surplus represents cumulative income arising on the with-profits business that has not been allocated to policyholders or shareholders.
Underwriting The process of examining, accepting or rejecting insurance risks, and classifying those accepted, in order to charge an appropriate premium for each accepted risk.
Unit-linked products or unit-linked contracts See ‘investment-linked products or investment-linked contracts’ above.
Universal life An insurance product where the customer pays flexible premiums, subject to specified limits, that are accumulated in an account and are credited with interest (at a rate either set by the insurer or reflecting returns on a pool of matching assets). The customer may vary the death benefit and the contract may permit the customer to withdraw the account balance, typically subject to a surrender charge.
Value of new business (VNB) Embedded value of new insurance contracts written in the year.
Variable annuity (VA) (US) An annuity whose value is determined by the performance of underlying investment options that frequently includes securities. A variable annuity’s value is not guaranteed and will fluctuate, depending on the value of its underlying investments. The holder of a variable annuity assumes the investment risk and the funds backing a variable annuity are held in the insurance company’s separate account. VAs are similar to unit-linked annuities in the UK.
Whole of life A type of life insurance policy that provides lifetime protection, premiums must usually be paid for life. The sum assured is paid out whenever death occurs. Commonly used for estate planning purposes.
With-profits funds See ‘participating funds’ above.
Yield A measure of the income received from an investment compared to the price paid for the investment. Normally expressed as a percentage.

476
Prudential plc Annual Report 2011
Additional information | Shareholder information
Shareholder information
Analysis of shareholder accounts as at 31 December 2011
Size of shareholding
Number of shareholder
accounts
% of total number of
shareholder accounts
Number of shares
% of total number of
shares
1,000,001 upwards 282 0.45 2,209,881,736 86.73500,001–1,000,000 155 0.24 110,330,352 4.33100,001–500,000 471 0.74 111,354,376 4.3710,001–100,000 1,885 2.98 49,422,291 1.945,001–10,000 2,595 4.10 18,055,227 0.711,001–5,000 16,817 26.55 37,357,769 1.471–1,000 41,133 64.94 11,637,579 0.45
Total 63,338 100.00 2,548,039,330 100.00
Dividend information
2011 final dividend
Shareholders registered on
the UK register and Irish
branch register
Shareholders registered on
the Hong Kong branch register
Holders of US American
Depository Receipts
Shareholders with ordinary
shares standing to the credit of
their CDP securities
accounts
Ex dividend date 28 March 2012 29 March 2012 28 March 2012 28 March 2012Record date 30 March 2012 30 March 2012 30 March 2012 30 March 2012
Payment date 24 May 2012 24 May 2012On or about1 June 2012
On or about 31 May 2012
Annual General MeetingThe 2012 Annual General Meeting (AGM) will be held on 17 May 2012 at 11.00am in the Churchill Auditorium at The Queen Elizabeth II Conference Centre, Broad Sanctuary, Westminster, London SW1P 3EE. The directors believe the AGM is an important opportunity to communicate directly with shareholders. The Notice of Meeting and all other details for the AGM are available on our website at www.prudential.co.uk/prudential-plc/investors/AGMinfo/2012
Dividend mandatesShareholders may have their dividends paid directly to their bank or building society account. If you wish to take advantage of this facility, please call Equiniti and request a Cash Dividend Mandate form. Alternatively, shareholders may download the form from www.prudential.co.uk/prudential-plc/investors/shareholder_services/forms
Cash dividend alternativeThe Company operates a Dividend Re-investment Plan (DRIP). Shareholders who have elected for the DRIP will automatically receive shares for all future dividends in respect of which a DRIP alternative is offered. The election may be cancelled at any time by the shareholder. Further details of the DRIP and the timetable are available on the Company’s website at www.prudential.co.uk/prudential-plc/investors
Shareholder enquiries
For enquiries about shareholdings, including dividends and lost share certificates, please contact the Company’s registrars:
By postEquiniti LimitedAspect HouseSpencer RoadLancingWest Sussex BN99 6DA
By telephoneTel: 0871 384 2035Fax: 0871 384 2100Textel: 0871 384 2255
(for hard of hearing)
Calls to 0871 numbers are charged at 8 pence per minute from a BT landline. Lines are open from 8.30 am to 5.30 pm (UK), Monday to Friday. Other telephone providers’ costs may vary.
International shareholders tel: +44 (0) 121 415 7026

477A
dd
ition
al in
form
ation
Electronic communicationsShareholders are encouraged to elect to receive shareholder documents electronically by registering with Shareview at www.shareview.co.uk This will save on printing and distribution costs, and create environmental benefits. Shareholders who have registered will be sent an email notification whenever shareholder documents are available on the Company’s website, and a link will be provided to that information. When registering, shareholders will need their shareholder reference number which can be found on their share certificate or proxy form. The option to receive shareholder documents electronically is not available to shareholders holding shares through The Central Depository (Pte) Limited (CDP). Please contact Equiniti if you require any assistance or further information.
Share dealing servicesThe Company’s Registrar, Equiniti, offer a postal dealing facility for buying and selling Prudential plc ordinary shares, please see the Equiniti address on page 476 or telephone 0871 384 2248. They also offer a telephone and internet dealing service, Shareview, which provides a simple and convenient way of selling Prudential plc shares. For telephone sales call 0871 384 2020 between 8.30am and 4.30pm, Monday to Friday, and for internet sales log on to www.shareview.co.uk/dealing
ShareGiftShareholders who have a small number of shares the value of which makes them uneconomic to sell them may wish to consider donating them to ShareGift (Registered Charity 1052686). The relevant share transfer form may be downloaded from our website www.prudential.co.uk/prudential-plc/investors/shareholder_services/forms or from Equiniti. Further information about ShareGift may be obtained on +44 (0)20 7930 3737 or from www.ShareGift.org. There are no implications for capital gains tax purposes (no gain or loss) on gifts of shares to charity and it is also possible to obtain income tax relief.
Irish branch registerThe Company operates a branch register for shareholders in Ireland. All enquiries regarding Irish branch register accounts should be directed to Capita Registrars (Ireland) Limited, Unit 5, Manor Street Business Park, Manor Street, Dublin 7. Telephone: +353 1 810 2400
Hong Kong branch registerThe Company operates a branch register for shareholders in Hong Kong. All enquiries regarding Hong Kong branch register accounts should be directed to Computershare Hong Kong Investor Services Limited, 17M Floor, Hopewell Centre, 183 Queen’s Road East, Wan Chai, Hong Kong. Telephone: +852 2862 8555
American Depositary Receipts (ADRs)The Company’s ordinary shares are listed on the New York Stock Exchange in the form of American Depositary Shares, evidenced by ADRs and traded under the symbol PUK. Each American Depositary Share represents two ordinary shares. All enquiries regarding ADR holder accounts should be directed to JP Morgan, the authorised depositary bank, at JP Morgan Chase & Co, PO Box 64504, St. Paul, MN 55164-0504, USA. Telephone +1 800 990 1135 or from outside the US +1 651 453 2128 or log on to www.adr.com
Singapore shareholder enquiriesShareholders who have shares standing to the credit of their securities accounts with CDP in Singapore, may refer queries to CDP at 4 Shenton Way, #02-01, SGX Centre 2, Singapore 068807. Telephone +65 6535 7511. Enquiries regarding shares held in Depository Agent Sub-accounts should be directed to your Depository Agent or broker.

478
Prudential plc Annual Report 2011
Additional information | How to contact us
How to contact us
Prudential plcLaurence Pountney HillLondon EC4R 0HHTel +44 (0)20 7220 7588www.prudential.co.uk
Harvey McGrathChairman
Tidjane ThiamGroup Chief Executive
Nic NicandrouChief Financial Officer
Margaret ColtmanGroup General Counsel & Company Secretary
John FoleyGroup Chief Risk Officer
Peter GoerkeGroup Human Resources Director
John MurrayGroup Communications Director
Prudential UK & Europe3 Sheldon SquareLondon W2 6PRTel +44 (0)20 7334 9000www.pru.co.uk
Rob DeveyChief Executive
M&GLaurence Pountney HillLondon EC4R 0HHTel +44 (0)20 7626 4588www.mandg.co.uk
Michael McLintockChief Executive
Prudential Corporation Asia13th FloorOne International Finance Centre1 Harbour View StreetCentralHong KongTel +852 2918 6300www.prudentialcorporation-asia.com
Barry StoweChief Executive
Jackson National Life Insurance Company1 Corporate WayLansingMichigan 48951USATel +1 517 381 5500www.jackson.com
Mike WellsPresident & Chief Executive Officer
Institutional Analyst and Investor EnquiriesTel +44 (0)20 7548 3300E-mail: [email protected]
UK Register Private Shareholder EnquiriesTel: 0871 384 2035International shareholders Tel +44 (0) 121 415 7047
Irish Branch Register Private Shareholder EnquiriesTel +353 1 810 2400
Hong Kong Branch Register Private Shareholder EnquiriesTel +852 2862 8555
US American Depository Receipts Holder EnquiriesTel +1 651 453 2128
The Central Depository (Pte) Limited Shareholder EnquiriesTel +65 6535 7511
Media EnquiriesTel +44 (0)20 7548 3559E-mail: [email protected]

479A
dd
ition
al in
form
ation
Prudential public limited companyIncorporated and registered in England and Wales
Registered officeLaurence Pountney HillLondon EC4R 0HHRegistered number 1397169
www.prudential.co.uk
Prudential plc is a company incorporated, some of whose subsidiaries are authorised and regulated by the Financial Services Authority (FSA).
Forward-looking statementsThis document may contain ‘forward-looking statements’ with respect to certain of Prudential’s plans and its goals and expectations relating to its future financial condition, performance, results, strategy and objectives. Statements that are not historical facts, including statements about Prudential’s beliefs and expectations, are forward-looking statements. These statements are based on plans, estimates and projections as at the time they are made, and therefore undue reliance should not be placed on them. By their nature, all forward-looking statements involve risk and uncertainty. A number of important factors could cause Prudential’s actual future financial condition or performance or other indicated results to differ materially from those indicated in any forward-looking statement. Such factors include, but are not limited to, future market conditions, fluctuations in interest rates and exchange rates, and the performance of financial markets generally; the policies and actions of regulatory authorities, including, for example, new government initiatives related to the financial crisis and the effect of the European Union’s ‘Solvency II’
requirements on Prudential’s capital maintenance requirements; the impact of competition, inflation, and deflation; experience in particular with regard to mortality and morbidity trends, lapse rates and policy renewal rates; the timing, impact and other uncertainties of future acquisitions or combinations within relevant industries; the impact of changes in capital, solvency standards or accounting standards, and tax and other legislation and regulations in the jurisdictions in which Prudential and its affiliates operate; and the impact of legal actions and disputes. These and other important factors may, for example, result in changes to assumptions used for determining results of operations or re-estimations of reserves for future policy benefits. Further discussion of these and other important factors that could cause Prudential’s actual future financial condition or performance or other indicated results to differ, possibly materially, from those anticipated in Prudential’s forward-looking statements can be found under the ‘Risk factors’ heading of this document and the ‘Risk factors’ heading of Prudential’s most recent annual report on Form 20-F filed with the US Securities and Exchange Commission, as well as under the ‘Risk factors’ heading of any subsequent Prudential Half Year Financial Report. Prudential’s most recent Annual Report, Form 20-F and any subsequent Half Year Financial Report are/will be available on the Company’s website at www.prudential.co.uk
Any forward-looking statements contained in this document speak only as of the date on which they are made. Prudential expressly disclaims any obligation to update the forward-looking statements contained in this report or any other forward-Iooking statements it may make, whether as a result of future events, new information or otherwise except as required pursuant to the UK Prospectus Rules, the UK Listing Rules, the UK Disclosure and Transparency Rules, the Hong Kong listing Rules, the SGX-ST listing rules or other applicable laws and regulations.

480
Prudential plc Annual Report 2011

Printed on Think 4 Bright, a Carbon Balanced paper made from 50 per cent recovered fibre and 50 per cent fibre sourced from fully sustainable forests, and Amadeus 100 White Offset, which is made from 100% FSC® certified recycled fibre sourced from de-inked post-consumer waste.
All material used in this report has been independently certified according to the rules of the Forest Stewardship Council (FSC). All pulps used are elemental chlorine free, and the inks used are vegetable oil based. The manufacturing mills and the printer are registered to the Environmental Management System ISO14001 and are FSC chain-of-custody certified.
Designed by Further™ Printed by Royle Print

Prudential public limited company Incorporated and registered in England and Wales
Registered officeLaurence Pountney HillLondon EC4R 0HHRegistered number 1397169
www.prudential.co.uk
Prudential plc is a holding company, some of whose subsidiaries are authorised and regulated by the Financial Services Authority (FSA).
An
nu
al Rep
ort 20
11