public expenditure tracking on infrastructure in uganda: the
TRANSCRIPT

PUBLIC EXPENDITURE TRACKING ON ROADINFRASTRUCTURE IN UGANDA: A CASE STUDY OF
PALLISA AND SOROTI DISTRICTS
RESEARCH REPORT No. 3
NYENDE MAGIDU JEFF GODFREY ALUMAI
WINNIE NABIDDO
ECONOMIC POLICY RESEARCH CENTRE
DECEMBER, 2010

RESEARCH REPORT No. 3
PUBLIC EXPENDITURE TRACKING ON ROAD
INFRASTRUCTURE IN UGANDA: A CASE STUDY OF
PALLISA AND SOROTI DISTRICTS
BY
NYENDE MAGIDU
JEFF GEOFFREY ALUMAI
WINNIE NABIDDO
ECONOMIC POLICY RESEARCH CENTRE
DECEMBER 2010

i
Acknowledgements
This report synthesizes findings from a study to review the infrastructure public
expenditures in two selected districts in Uganda under the central government transfers.
The research was conducted by the Economic Policy Research Centre (EPRC). The team
gratefully acknowledges the support received during the study particularly the local
government staff more especially from the engineering department, finance as well as the
assistant secretaries at the lower local governments. The team appreciated especially the
strong support and encouragement by the Chief Administrative Officers (CAOs) who made
access to information easy.
The core study team was supported by interns from Makerere University who included
Kisame Keith and Alikwani Abbey whose valuable inputs made the preparation of the report
easy. This research report was prepared by Nyende Magidu (team leader), Jeff G. Alumai
and Winnie Nabiddo. Dr. Sarah Ssewanyana provided valuable comments throughout the
preparation of the report.

2
List of Acronyms/Abbreviations
AfDB African Development Bank
BOQs Bill of Quantities
CAIIP Community Agriculture Infrastructure Improvement Programme
CDO Community Development Officer
DANIDA Danish International Development Agency
FGD Focus Group Discussions
GDP Gross Domestic Product
GoU Government of Uganda
IFAD International Fund for Agricultural Development
LGDP Local Government Development Programme
Local Governments Local Governments
MoFPED Ministry of Finance Planning and Economic Development
MoW Ministry of Works
PAF Poverty Action Fund
PDU Procurement Department Unit
PETS Public Expenditure Tracking Study
PPDA Public Procurement and Disposal Act
RoU Republic of Uganda
RRP Rural Road Programme
RSDP Rural Sector Development Programme
RSPS Road Sector Programme Support
UNRA Uganda National Roads Authority

3
Abstract
The main message of this study is that public action by making the choice to invest in
infrastructure, has to be taken to alleviate the plight of Uganda’s economy which is
endowed with adverse, natural or geographical aspects like tropical climate. Drawing from
the existing literature of the various channels or means through which infrastructure affects
growth, this study argues for strengthening structures and implementation in the promotion
of infrastructure particularly rural roads. In order to identify the sector constraints, the
study utilized public expenditure tracking and Focus Group Discussion (FGD) in the two
selected districts of Pallisa and Soroti. The findings indicate that not all resources reach the
beneficiary levels; capacity challenges exist both among the staff and service providers. This
situation is worsened by inadequate funding for rural roads provision. First, apart from
increasing public investment, the most important role to be played by the government in
this changing scenario will include: strengthening capacity among the local government
staff; carrying out performance audit on various firms that execute the works; and maintain
road machinery in sound working conditions for provision of better and efficient roads
network.
Key words: Resource tracking, infrastructure provision, local governments, service provision

4
Table of Contents
Acknowledgements .................................................................................................................................. i
List of Acronyms/Abbreviations .............................................................................................................. 2
Abstract ................................................................................................................................................... 3
1.0 INTRODUCTION .......................................................................................................................... 6
1.1 Background ............................................................................................................................. 6
1.2 Review of related studies ........................................................................................................ 9
1.3 Rationale of the Study ........................................................................................................... 10
1.4 Objectives of the Study ......................................................................................................... 10
1.5 Scope of the Study ................................................................................................................ 11
1.6 Organization of the Study ..................................................................................................... 11
2.0 METHODS AND DATA ................................................................................................................ 12
2.1 Methods ................................................................................................................................ 12
2.2 Data ....................................................................................................................................... 13
2.3 Economic Potentials of the Sampled Districts ...................................................................... 14
3.0 DEVELOPMENT PROGRAMMES IN THE ROAD SUB-SECTOR ..................................................... 15
3.1 Financing of Roads in Local Governments ............................................................................ 15
4.0 MAIN FINDINGS......................................................................................................................... 17
4.1 Analysis of Resource Flow ..................................................................................................... 17
4.2 Analysis of the Implementation of Activities ........................................................................ 27
4.3 Analysis of policies, regulations and structures used in implementation of Government
activities ............................................................................................................................................ 29
4.4 Level of Resource Utilization ................................................................................................. 33
5.0 EMERGING CHALLENGES AND POLICY OUTCOMES .................................................................. 37
5.1 Emerging Challenges ............................................................................................................. 37
5.2 Policy Outcomes.................................................................................................................... 38
References ............................................................................................................................................ 40

5
List of Tables
Table 1: District funding sources and share to road maintenance, 2005/06-2008/09 (%) .................. 16
Table 2: Allocation of funds by district and department, 2005/06-2008/09 (%) ................................. 17
Table 3: National Sectoral Allocations Excluding Arrears and Amortisation, 2008/09-2009/10 .......... 18
Table 4: Conditional transfers from Government to districts, 2005/6-2008/9 (Ushs’000) .................. 19
Table 5: Summary of expenditure of funds under Works department ................................................ 22
Table 6: PAF funds transfer from CG an receipted by district, 2005/6-2008/9 .................................... 23
Table 7: LGDP transfers from district to sub-counties, 2005/6-2008/9 (Ushs) .................................... 24
Table 8: Status of key equipment by districts ....................................................................................... 26
Table 9: Allocation of time to Central Government funded programme, 2005/6-2008/9 (%) ............ 26
Table 10: Road sector programme performance.................................................................................. 28
Table 11: Summary of road contractor’s profile ................................................................................... 31
Table 12: Road sub-sector fund balance, 2005/6-2008/9 .................................................................... 34
List of Figures
Figure 1: The General Framework of Resource Flow (GFRF) in the Sector ........................................... 13
Figure 2: Labour-Based Activities in Apapai-Ogera Road in Serere County, Soroti District.................. 21
Figure 3: Unspread and Overstayed Murram - Kachocha Road being Under Rehabilitation ............... 32
Figure 4: Broken culverts along Opedura-Akisimu road, Angule Sub-county, Pallisa District .............. 36
Figure 5: Kabiyayi-Ikiki Road-Petete County, Pallisa District being worked on under CAAIP ............... 36

6
1.0 INTRODUCTION
1.1 Background
The provision of an efficient road network has been an important focus and a key ingredient
in the development efforts for African governments and the donor community in the recent
years. Whereas the first and second generations of economic reforms emphasised
macroeconomic stability in order for the private sector to play a significant role in the
economies, the current emphasis on infrastructure is an admission that the road network in
particular also matters for positive outcomes.
Since 2007/08, the National Resistance Movement (NRM) Government has therefore
accorded significant importance to the provision of a sound and well-coordinated
transportation system. Thus infrastructure has been considered as a pre-requisite for
ensuring sustainable socio-economic development and consolidation of both national unity
and security of the country. The linkages of transport to poverty reduction and to long term
economic growth are significant and need not to be emphasised. Their absence or
inadequate provision of them stands out as a stark barrier to economic growth.
Infrastructure has been a priority in the government’s comprehensive development strategy
and its benefits were anticipated to be reflected in better incomes and higher economic
growth.
Uganda’s transport network grossly deteriorated along with the rest of the country’s
infrastructure during the 1970s and early 1980s. The attributive factors included civil strife,
low prioritisation and the country’s multiple needs at the time. When the NRM Government
took over, the major reforms in this sector have therefore been part and parcel of the
overall recovery and public sector reform programmes. However, earlier and recent
initiatives were undertaken in piecemeal and translated into fragmented and often short
term achievements. It was then realized that the drive towards a sustainable improved
transport system required not only financial resources but also development of appropriate
institutions, political commitment and a strategy for responsibility and capacity building.
Accountability and transparency in planning and budgeting were also acknowledged as
equally important. These, in turn, needed to be built on a foundation of strong private
7
sector oversight and action in order to be responsive to the needs. During the period 1990
to 2005, the national roads improved from six percent to 75 percent and district roads from
15 percent to 65 percent (Uganda Agriculture and Rural Sector Review of 2005). However,
the rural areas, where the majority of the country’s agricultural production takes place are
still-under served with only 10 percent of community access roads noted to be in good and
fair conditions.
To comprehensively address the road network needs, government developed a 10-year
road sector development programme (RSDP 1) in 1996, initially for the national (trunk) road
network. The objectives of the RSDP 1 were: (i) to provide an efficient, safe and sustainable
road network; (ii) Improve managerial and operational efficiency of roads administration;
and (iii) develop the domestic construction industry as part of the key measures to promote
growth and eradicate poverty. The RSDP 1 was costed at US$1.5billion and has been a
comprehensive tool for the institutional reforms and investment programme in the roads
sub- sector. Over the past five years of the RSDP 1 implementation, government with the
assistance of development partners including the African Development Bank (AfDB), Danish
International Development Agency (DANIDA), and International Fund for Agricultural
Development (IFAD) among others have invested substantially in the national road network.
However, the results have been mixed with an increasing infrastructure backlog.
Besides, the physical infrastructure needs of the Ugandan economy are growing
tremendously and threaten to outstrip the current availability. The government has,
therefore, in the recent past focused on infrastructure development and more particularly
on rural roads. With road transport accounting for over 82 percent of the volume of freight
and human movement, road infrastructure is a critical component of economic
development strategy. Because the road network is critical to production, competitiveness
and trade, its maintenance is a key strategic priority. Consequently the government has
increased resource allocation to the road sector and created the Uganda National Road
Authority (UNRA) to coordinate the implementation of road projects (Background to the
Budget, 2008). Similarly, the government in FY2007/08 established a road fund to
specifically earmark resources to address infrastructure backlog. This is in addition to
existing and various funding mechanisms under Poverty Action Fund (PAF) which has been
operational for some years in Local Governments (Local Governments).

8
Furthermore, additional resources have been allocated to infrastructure development under
different financing arrangements that included both donor funds like Local Government
Development Programme (LGDP), Community Agriculture Infrastructure Improvement
Programme (CAIIP) and GoU locally raised resources. The FY2008/09 budget increased
resource allocation to eliminate the backlog of the road sector. For instance, Ushs240 billion
was allocated to road maintenance at national, district and urban levels; and an additional
Ushs35 billion to clear the road maintenance backlog. The overall allocation to the sector
was Ushs1.1 trillion in FY2008/09 including development partner project assistance
equivalent to shs347 billion, making the sector the largest single allocated in the budget
(Budget Speech, 2008/09).
Despite this attempt, the road network has developed a huge backlog in maintenance with
approximately 20 percent of the entire road network currently classified as in poor or in bad
condition (MoFPED, 2009). The efforts made since 1996 more particularly in the road sub-
sector especially in the districts and access roads, still leaves much to be desired (Rijcken,
2002). Attribution problems like efficiency gaps in the road subsector have been identified
as the main cause to inadequate implementation capacity, high unit cost, and low
absorption capacity of allocated resources. For example, at the recent mid-term budget
review of FY2008/09, the MoFPED emphasized that the transport sector had absorbed only
53 percent of the funds that were allocated for the first half of the financial year. Similarly
great concern by various leaders about the less attention on roads particularly the rural
roads add to the un-answered questions in the sector. While empirical studies such as
Rijcken (2002) and RoU (2002) have provided insights on the major constraints affecting the
performance of the sub-sector, these studies do not adequately address the flow of funds
and how public spending is done and on which items. Similarly, challenges in the sector are
not adequately addressed as there are new regulations and Acts in place like Public
Procurement and Disposal of Assets (PPDA).

9
1.2 Review of related studies
Having broadly reviewed the challenges of infrastructure provision in Uganda, in this
section, focus is made to improve infrastructure as an important factor in the welfare of the
rural communities. There are six strands of empirical studies which assess the contribution
of infrastructure to improved social service provision as well as indicators.
Hanan (2002) developed a method for estimating household level benefits from road
projects using the relationship between the value of farmland and its distance to agricultural
markets. The empirical analysis, using data from Nepal, suggests that providing extensive
road access to markets would confer substantial benefits on average, much of these going
to poor households.
Calderon and Chong (2004) investigated the impact of infrastructure development on
economic growth and income distribution using a large panel data set encompassing over
100 countries and spanning the years 1960-2000. The authors used a variety of generalised
method of moments (GMM). It was found out that growth is positively affected by the stock
of infrastructure assets. Furthermore, income inequality declines with higher infrastructure
quantity and quality.
Ndulu (2006) draws from the existing literature of the various channels or means through
which infrastructure affects growth. In his study, he argues for the big push in promoting
infrastructure that is necessary not only to break out of under development but, more
importantly, to be on the path to sustainable growth. Focusing on infrastructure is now seen
in the purview of complementing public investment in social services, which are geared
towards attainment of the Millennium Development Goals (MDGs) rather than competing
for the government’s scarce resources.
Prabia De (2006) used recent literature to examine the importance of transaction costs in
explaining trade, access to markets, and regional cooperation under globalization. In his
study, he argues that most Asian countries, transaction costs are a greater barrier to trade
integration than import tariffs. By estimating a structural model of economic geography
using cross-country data on income, infrastructure, transaction costs and trade of selected

10
Asian economies, this study shows that the transaction costs are statistically significant and
important determinants in explaining variation in trade in Asia.
The World Development Report (2005) presents several examples of outcomes from
infrastructure provision. For example, building rural roads in Morocco increased primary
school enrolment from 28 percent to 68 percent; access to clean water reduced the
probability of child mortality by 55 percent, the presence of a paved road in the community
more than doubled girls’ school attendance. In Zambia, access to passable road was
associated with a decrease in the possibility of child labour by 7.4 percent and with higher
educational achievement.
Calderon and Serven (2004) showed that in Peru, for instance, improving infrastructure to
the level of Costa Rica would increase the income share of the poorest quartile of the
population from 5.6 percent to 7.5 percent.
1.3 Rationale of the Study
The rationale for carrying out the Public Expenditure Tracking Surveys (PETS) on road
infrastructure particularly rural roads, was to enable stakeholders prioritise expenditure to
sustain aggregate and rural development. More specifically, the study sought to contribute
to improved policy formulation so as to better align future expenditure to the priorities in
infrastructure and also to make a case for the appropriate level of funding for the sub-
sector. The study also sought to contribute to a larger public expenditure review to
ascertain the absorption capacity at district level.
1.4 Objectives of the Study
The overall objective of this study was to conduct PETS on resources that were planned for
the road sub-sector and how much really reached the different beneficiaries. More
specifically, the study sought to:
Assess how much of the financial and non-financial resources reach the beneficiary;
Identify and describe the types of resources that reach all intended beneficiaries;
Analyse regulations, policy and structure under financial and non-financial resources
that are transferred to local levels for implementation of government activities;

11
Analyse the time and duration taken to utilize resources when transferred to district
and lower local levels; and
Outline possible policy outcomes in the road sector.
1.5 Scope of the Study
This study focussed on assessing the financial and non-financial flows from 2005/6-2008/09
FY to the road sub-sector in two districts of Pallisa and Soroti. The study examined how
much resources reached the intended beneficiaries. In order to obtain results, the study
focussed on the types of resources received at the district and their respective programmes.
The utilisation of resources was examined to ascertain the level of competence in the
planning, procurement and whether they are in line with the key policy guidelines. The
districts of Soroti and Pallisa were randomly selected as case studies. At district level,
emphasis was placed on establishing planned and actual expenditure, and how much was
finally spent under each programme.
1.6 Organization of the Study
The rest of the study is organised as follows: the study approaches and methods are
presented in the next section. This is followed by a brief discussion on programme
implementation of central government transfers and donor funding. The subsequent
sections focus on discussions of resource flows and detailed implementation of activities
with a specific focus on expenditure items and processes involved in the delivery
mechanism of a decentralisation framework.

12
2.0 METHODS AND DATA
2.1 Methods
Sampling: The districts of Pallisa and Soroti were randomly selected among the districts in
Eastern Uganda. In each district, sub-counties were selected at random. In Pallisa district,
the sub-counties of Agule, Kagumu Kibuku, and Petete were selected, and Asuret, Gweri and
Kateta sub-counties in Soroti district. The sub-counties were selected by stratifying them
according to good and poor performance as well as evidence on resource transfer and road
improvement.
Approaches: The study approaches included PETS and Focus Group Discussions (FGD).
Through these approaches, observations on the resource flows, outputs, processes and
actions of service providers at various intended beneficiary levels were made. The
approaches are briefly outlined below:
a) PETS. This is one of the tools used to determine how much of the resources planned and
released reached the intended levels. This involved tracking of resources through various
strata of government (i.e. districts, sub-counties). Data were collected at several levels: from
MoFPED and donors, districts and sub-counties. By comparing data at these different levels,
one is able to determine and assess where funds reach, in what amounts, absorption and
perhaps where they do not reach.
b) FGDs. In this approach, the beneficiaries, political leaders and service providers were
asked about the programmes being implemented in the sub-sector. It was adopted because
of its effective feedback mechanism which is immediate and its suitability to the community.
In order to track the resource flows from the central government to the district as well as
sub-counties, the study team utilised the general framework of resource flows (GFRFs) in
Uganda as shown in Figure 1. In the decentralised framework of service delivery in Uganda,
resources flow from MoFPED as well as donors to various ministries. The ministries transfer
resources to districts and to sub-counties under some particular programmes like Local
Government Development Programme (LGDP). However, resources are also transferred
directly from MoFPED to districts but with the advice of line ministries. The donor resources

13
are as well transferred to MoFPED and subsequent disbursements are made to various
ministries or donor to government institutions and to service providers. In this particular
study, the focus was more on the central governments transfers through MoFPED as well as
donors to various ministries/institutions.
Figure 1: The General Framework of Resource Flow (GFRF) in the Sector
2.2 Data
The resources tracked included: i) the conditional funds under the Poverty Action Fund
(PAF) to the road sub-sector released by MoFPED to the districts; ii) Local Government
Development Funds (LGDP) given the discretionary power that Local Governments have are
allocated to the country’s priority areas; iii) Donor funds to districts. Overall, the analysis
considered funds released, human resources, and equipments plus other support provided
in kind between FY2005/06-2008/09.
MoFPED Donor
UNRA MoLG
MOW
Districts
Sub counties
Service
providers
14
2.3 Economic Potentials of the Sampled Districts
The districts selected under this study are endowed with resources both human and natural
that can be tapped to improve the wellbeing of farmers if supported with road
improvement. The analysis focussed on two districts to inform this study namely: Pallisa and
Soroti. Both districts cover a large expanse of land which is a potential resource for
agricultural related activities. For instance, Pallisa District that was curved out of Iganga
District is composed of three Counties and 21 sub-counties including one town council. It
covers an area of 1584.8 square kilometres and has a road network with a motorable length
of 478.8 kilometres which is now a challenge to maintain. The population that has been
estimated at 487,100 people with a 3.2 percent growth rate has been productive
particularly in agricultural production. The majority of the people derive their livelihood by
growing rice, cotton and millet, among others. These crops have been the source of food as
well as income through the selling of what could be considered as surplus. This attracts
heavy trucks and frequent traffic hence resulting into collapsing of bridges. There is also
livestock rearing and poultry keeping including fowls like turkeys, and chicken. This makes
Pallisa a market of various items for the neighbouring districts as well as the central region.
Equally, Soroti District with a total area of approximately of 2,662.5 square kilometres is not
different from Pallisa as regards economic activities. The area that is covered by
water/swamps is only 406 square kilometres leaving the rest to support agricultural related
activities. While the population actively participates in the growing of various crops as well
as keeping animals, the accessibility to markets and inter-connection within the district is
limited due to poor roads. There are many bridges which normally get destroyed due to
heavy trucks that ply the routes to the various traditional markets. This has made it quite
difficult to maintain the road network with a motorable length of 517.5 kilometres. With a
total population of 523,809 and 5.1 percent growth rate, there is high potential of provision
of productive labour force in agricultural related activities if supported with improved
infrastructure.

15
3.0 DEVELOPMENT PROGRAMMES IN THE ROAD SUB-SECTOR During the period between FY2005/06-2008/09, the districts received PAF resources and
donor funds for routine maintenance, rehabilitation and periodic maintenance plus removal
of structural bottlenecks. Road maintenance consists of routine and periodic maintenance.
The routine maintenance involves keeping roads clear of debris, pothole filling and clearing
roadside drains. Periodic maintenance is done once in a while and it involves surface
reshaping by light grading, re-gravelling, minor culvert and bridge repairs and replacement.
Rehabilitation of roads involves the full restoration of the road way inclusive of the
pavement and the drainage system. It involves road way shaping, placement of gravel
wearing course layer, roadside drainage construction, rising of swamp crossing,
culvert/structure repairs and new installations and provision of basic information,
regulatory and warning road furniture.
In the above mentioned programmes, the sub-sector intends to achieve the following policy
targets:
Ensuring the maintenance of the rural feeder road network in good condition;
Developing capacities for the local construction industry;
Build capacity of district and urban Local Governments to plan, finance and
supervise works on their road networks; and
Promoting labour intensive works, especially involving women, to improve their
livelihoods.
In order to achieve the above, the government adopted a budget strategy with a focus on
efficient infrastructure including all weather feeder roads, national trunk roads, and rail and
water ways together with a provision of reliable and affordable energy.
3.1 Financing of Roads in Local Governments
Official records indicate that districts receive funding for various programmes in the road
sub-sector from both central government and development partners. Through central
government transfers, districts benefit from PAF 1 and PAF 2 which are directed to routine
maintenance and periodic maintenance respectively. For the sampled districts, in Pallisa for

16
instance, funding under PAF 3 stopped in FY2002/03 and this may partially offer an
explanation for the poor road status. Pallisa District also receives funding from development
partners such as the AfDB and IFAD that fund the CAIIP Phase I – this covers the sub-
counties of Agule, Kagumu, and Petete. This, therefore, has mainly focused on community
access roads to link farmers to markets. At this point, one can observe that while the
objectives of the programme are good, it covers only few sub-counties and its
implementation is only for three years. This still creates a challenge to sustain the status of
the roads worked on as they easily become impassable during the rainy season.
Both districts receive funding from DANIDA under its Road Sector Programme Support
(RSPS) that started in FY 2005/06. Funding to Pallisa District under this support, however,
ended in FY2007/08. On the contrary, Soroti district still receives funding from DANIDA
under a new phased programme, Rural Road Programme (RRP). This funding is directed
towards full rehabilitation of roads. The distribution of source of funding and percentage
contribution to road maintenance and rehabilitation in the sampled districts are presented
in Table 1.
Table 1: District funding sources and share to road maintenance, 2005/06-2008/09 (%)
Source of
funding
2005/06 2006/07 2007/08 2008/09
Pallisa Soroti Pallisa Soroti Pallisa Soroti Pallisa Soroti
PAF-1 25.5 42.5 16.5 67.4 16.7 31.8 45.0 15.1
PAF-2 6.9 0.0 3.8 0.0 8.9 17.1 55.0 5.0
DANIDA 67.6 57.5 79.7 32.6 74.3 51.1 0.0 79.9
Total in UGX 100 100
100 100
100 100
100 100
Source: District Quarterly Progress Reports for FY 2005/06 – 2008/09

17
4.0 MAIN FINDINGS
This section presents and discusses resource flows to two selected Local Governments over
four financial years. It concentrates on conditional transfers as well as donor funded
programmes but with emphasis on resources that are spent on road rehabilitation and
maintenance on rural roads. This section begins by discussing the funds allocation to the
various departments in the two districts and trends in amounts of funds allocated are
compared across the four years.
4.1 Analysis of Resource Flow
Table 2 presents the allocation of funds to different departments in the sampled districts. It
is evident that allocations to Local Governments have been increasing over time. The most
notable increase was during the period 2006/07 to 2007/08. A closer look at the Works
Department reveals that, on average, the department received a share of the overall budget
varying from 7.5 to 8.8 percent in Pallisa and from 4 to 9.7 percent in Soroti. This
transforms into much less funds allocated to the sector that is bogged down with increased
infrastructure backlog as well as increased demand for its role in poverty reduction.
Table 2: Allocation of funds by district and department, 2005/06-2008/09 (%)
Department
2005/06 2006/07 2007/08 2008/09
Pallisa Soroti Pallisa Soroti Pallisa Soroti Pallisa Soroti
Administration 7.1 11.5 4.6 7.1 9.8 6.8 3.8 6.0
Finance and planning 9.5 5.3 9.6 7.7 3.4 6.7 2.0 2.1
Statutory bodies 1.2 2.3 1.3 2.3 1.8 2.0 2.3 1.6
Production 3.0 11.6 5.0 10.4 4.2 6.5 11.5 10.2
Health 18.1 9.1 17.4 13.7 15.0 10.9 17.8 13.8
Education 52.7 46.3 51.4 52.7 50.5 54.4 44.8 44.1
Works 7.5 11.7 8.8 4.0 9.0 9.7 7.3 15.3
Natural resources 0.3 1.1 0.2 0.6 0.1 0.8 2.0 0.9
Community bases services 0.6 1.1 0.9 1.0 0.3 1.3 1.1 1.4
Planning 0.0 0.0 0.5 0.4 5.9 0.5 7.0 0.7
Internal Audit 0.0 0.0 0.2 0.3 0.1 0.3 0.3 0.3
Transfers to local councils 0.0 0.0 0.0 0.0 0.0 0.0 0.0 3.6
Total in UGX 18.1 13.2
14.9 9.4
16.0 13.1
18.2 17.9 Note: The FY2008/09 is budget estimates as the actual amounts of funds allocated were not yet prepared and totals are provided in billions.
Source: Annual District Budgets and Work Plans 2005/06-2008/09.

18
Consistent with the national picture, education sector has had the biggest share of the
budget allocations followed by health. The works sector was considered the third
expenditure priority. This, however, is contrary to the CG allocations, which prioritises
Works and Transport sectors (Table 3). In the recent prioritisation of activities, the sector
allocation varied between 17.2 to 18.5 percent of the overall budget. This is much higher
than the district percentage allocation but still insufficient to improve the road network in
the country that witnessed a total neglect, destruction and ageing.
Table 3: National Sectoral Allocations Excluding Arrears and Amortisation, 2008/09-2009/10
SECTOR
2008/09 2009/10
Ushs. Bn % Ushs. Bn %
Works and Transport 1,083.7 18.5 1,214.8 17.2
Education 899.3 15.4 1,079.7 15.3
Health 628.5 10.7 732.7 10.4
Public Sector Management 535.3 9.1 706.0 10.0
Energy and Mineral Development 461.2 7.9 698.9 9.9
Security 477.2 8.1 487.7 6.9
Accountability 417.6 7.1 459.8 6.5
Interest Payments Due 379.1 6.5 368.2 5.2
Justice/ Law and Order 280.4 4.8 359.6 5.1
Agriculture 223.2 3.8 310.7 4.4
Public Administration 136.3 2.3 217.4 3.1
Water and Environment 150.3 2.6 172.2 2.4
Legislature 112.6 1.9 121.8 1.7
Tourism, Trade and Industry 31.0 0.5 47.7 0.7
Social Development 24.1 0.4 32.4 0.5
Lands, Housing and Urban Development 12.3 0.2 20.3 0.3
ICT 6.5 0.1 9.5 0.1
TOTAL 5,858.60 100.0 7,045.3 100.0
Source: Uganda Budget FY2009/10
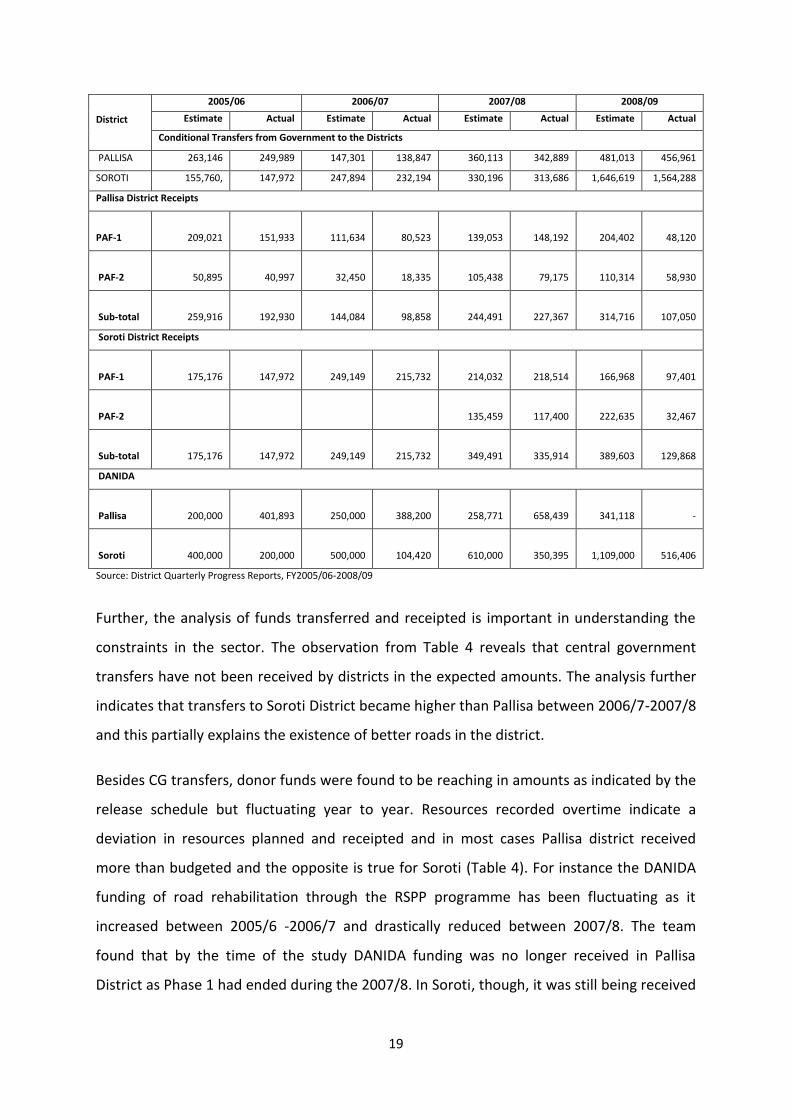
Table 4 provides evidence on how budgets have performed over the last four years. The
analysis of the budget performance indicates that there has been an increasing variation
between the estimated amounts (budgeted amounts) and the actual amounts received and
spent. This failure to realise the budgeted funds affects the overall implementation of
planned activities and leads to continuous roll overall of uncompleted projects. This reduces
the rate of progress towards service provision at the lower levels.
Table 4: Conditional transfers from Government to districts, 2005/6-2008/9 (Ushs’000)
19
District
2005/06 2006/07 2007/08 2008/09
Estimate Actual Estimate Actual Estimate Actual Estimate Actual
Conditional Transfers from Government to the Districts
PALLISA 263,146 249,989 147,301 138,847 360,113 342,889 481,013 456,961
SOROTI 155,760, 147,972 247,894 232,194 330,196 313,686 1,646,619 1,564,288
Pallisa District Receipts
PAF-1 209,021 151,933 111,634 80,523 139,053 148,192 204,402
48,120
PAF-2 50,895 40,997 32,450 18,335 105,438 79,175 110,314
58,930
Sub-total 259,916 192,930 144,084 98,858 244,491 227,367 314,716
107,050
Soroti District Receipts
PAF-1 175,176 147,972 249,149 215,732 214,032 218,514 166,968
97,401
PAF-2 135,459 117,400 222,635
32,467
Sub-total 175,176 147,972 249,149 215,732 349,491 335,914 389,603
129,868
DANIDA
Pallisa 200,000 401,893 250,000 388,200 258,771 658,439 341,118
-
Soroti 400,000 200,000 500,000 104,420 610,000 350,395 1,109,000
516,406
Source: District Quarterly Progress Reports, FY2005/06-2008/09
Further, the analysis of funds transferred and receipted is important in understanding the
constraints in the sector. The observation from Table 4 reveals that central government
transfers have not been received by districts in the expected amounts. The analysis further
indicates that transfers to Soroti District became higher than Pallisa between 2006/7-2007/8
and this partially explains the existence of better roads in the district.
Besides CG transfers, donor funds were found to be reaching in amounts as indicated by the
release schedule but fluctuating year to year. Resources recorded overtime indicate a
deviation in resources planned and receipted and in most cases Pallisa district received
more than budgeted and the opposite is true for Soroti (Table 4). For instance the DANIDA
funding of road rehabilitation through the RSPP programme has been fluctuating as it
increased between 2005/6 -2006/7 and drastically reduced between 2007/8. The team
found that by the time of the study DANIDA funding was no longer received in Pallisa
District as Phase 1 had ended during the 2007/8. In Soroti, though, it was still being received

20
under the former Road Sector Programme Support (RSPS) project that is currently known as
Rural Road Programme (RRP).
The interviews conducted revealed that funding of RSPS and RRP programmes by DANIDA
has been directed towards road rehabilitation in both districts. The two programmes have
emphasised labour-based works, which has enabled the communities improve on their
incomes as well as promoting the concept of ownership and sustainability. Some of the
labour-based works were observed along the Kadama - Kibuku – Buseta road and Kadoto –
Kalapata - Butebo road. In Soroti, the labour based works were observed along Apapai –
Ogera road in Serere County (Figure 2). The team observed that labour based activities on
roads encourage communities to participate actively as well as offering land at no cost. The
case in point is construction of Apapai-Ogera road. The communities along this road offered
land and the willingness to participate in such labour based programmes was high.
Figure 2: Labour-Based Activities on Apapai-Ogera Road in Serere County, Soroti District
Unlike PAFs, funds under CAIIP were found to be reaching the intended levels in Pallisa
district and were spent according to the agreed activities (Table 5). However, further
scrutiny of these donor funds flow revealed variations being experienced between the
budgeted amounts and the actual funds receipted. This affects the earlier planned amount

21
of work and the anticipated impact on the income of communities who actively participates
in this programme. Further to this, the communities appreciated the labour based method
because it enables them earn income and take their children to school, buy basic needs and
support their husbands as well.
Besides the flow of funds, allocation to the sector looks to be efficient as there was a
balance between expenditure on road maintenance and operational expenses such as
salaries and fuel among others. The expenditure on general salaries in both districts
provides a mixed performance as it was increasing in Soroti as compared to Pallisa (Annex 2
and 3). Surprisingly, it was observed that allocation to maintenance of machinery was quite
low and this remains a challenge as some valuable machines are abandoned in the works
park yard. In Pallisa the cost of maintenance of machinery varied between Ushs. 5 million to
15 million while in Soroti from Ushs.7 million to 16 million, which is really too low.
Table 5: Summary of expenditure of funds under Works department
Major items
2005/06 2006/07 2007/08 2008/09
Amount % Amount % Amount % Amount %
Soroti
Employee Costs 14.527019 0 157,025,000 9.7 169,160,296 8.9 194,599,149 7
Use of goods and services 1,344,588,267 99.9 1,465,915,724 90.3 1,723,687,622 91.1 2,561,325,813 92.3
Other expenses 1,200,000 0.1 19,600,000 0.7
Total 1,345,788,282 100 1,622,940,724 100 1,892,847,918 100 2,775,524,962 100
Pallisa
Employee costs 0 180,981,916 9.1 55,902,400 4 97,257,748 7.3
Use of goods and services 689,407,000 100 1,814,158,117 90.9 1,252,102,910 90.5 1,237,673,560 92.7
Other expenses 0 76,800,000 5.5
Total 689,407,000 100 1,995,140,033 100 1,384,005,310 100 1,334,931,308 100
Source: Estimates and Actual Expenditure Booklets (2005/06-2008/09) for Pallisa and Soroti
Overall, it can be concluded from Table 5 that over the four years a greater percentage of
the funds in Works Department was expended on goods and services in both districts. For
instance, the expenditure on goods and services varied between 90.3 to 99 percent in Soroti
while in Pallisa varied between 90.5-100 percent. It is evident from Table 5 that districts
have tried to allocate funds to the priority areas particularly in the goods and services but

22
the technocrats have argued that the needs identified the infrastructure across Local
Governments outweigh the funds currently expended under the sector.
Table 6 shows that PAF funds reaching district level varied between districts and across
financial year. Soroti recorded a higher percentage of PAF funds reaching compared to
Pallisa and this may be attributed to differences in capacity utilisation of funds. Nearly
between 66.3 to 71.2 percent for Pallisa district while Soroti receipts recorded varied
between 71.3 to 92.9 percent. For both districts recorded a significant reduction in the
proportion of funds reaching in 2007/8 and this was attributed to reducing or failure to
release funds to districts under PAF 3. Generally, the sampled districts receipted less PAF
funds than what was released by the central government. It was also evident that PAF 3
funding had not been received for some years and yet it is critical in the achievement of
efficient road network.
Table 6: PAF funds transfer from CG an receipted by district, 2005/6-2008/9
2005/6 2006/7 2007/8 2008/9
Pallisa district
Transfers from CG 249,989,000 138,847,603 342,889,000 456,961,000
Receipted at district 192,930,000 98,898,000 227,367,998 346,201,040
% reached 77.2 71.2 66.3 75.8
Soroti District
Transfers from CG 147,972,000 232,194,027 313,686,000 156,428,800
Receipted at district 105,570,000 215,732,000 259,844,000 129,868,000
% reached 71.3 92.9 82.8 83.0
Source: District Financial Records
Further deviations or leakages are observed in the transfers of funds particularly LGDP from
district level to the sub-counties (Table 7). This is also true between the estimated amounts
and the actual amounts in both revenues and respective expenditure. These findings seem
to suggest that deviations were experienced at all levels of government from the CG to the
district. For instance, Table 7 reveals that Pallisa transferred UShs22,919,289 to Agule Sub-
county in 2005/6 but only UShs20,997,500 was receipted while in Soroti a total of
Sh.38,404,000 was indicated to have been transferred to Asuret but only UShs35,896,000

23
was receipted. Similarly, Petete sub-county indicated to have received UShs14,922,922 over
2006/7 against UShs17,436,100. It is not therefore, surprising that these deviations were
cited as a major constraint in service delivery and realization of set targets by the various
lower local governments. In most cases the difference is utilised at the district level or not
received at all by the district because of penalties imposed on poor performing local
governments under programme conditions requirement.

24
Table 7: LGDP transfers from district to sub-counties, 2005/6-2008/9 (Ushs)
District
2005/6
2006/7
2007/8
2008/9
Estimate Actual Percent Estimate Actual Percent Estimate Actual Percent Estimate Actual Percent
Pallisa Transfers to Sub-counties
Agule 23,887,950 22,919,289 95.9 23,450,263 22,354,194 95.3 19,885,000 16,339,068 82.2 29,914,000 28,515,341 95.3
Kagumu 15,391,930 11,319,848 73.5 19,984,764 18,582,180 93.0 13,954,000 11,478,753 82.3 21,026,000 20,042,908 95.3
Kibuku 13,728,620 11,623,000 84.7 16,409,257 16,459,500 100.3 15,566,000 12,606,501 81.0 19,547,000 18,633,060 95.3
Petete 15,586,303 11,062,213 71.0 17,886,100 17,436,100 97.5 13,690,000 11,262,472 82.3 20,629,000 19,664,470 95.3
Sub-Total 68,594,803 56,924,350 83.0 77,730,384 74,831,974 96.3 63,095,000 51,686,794 81.9 91,116,000 86,855,779 95.3
Soroti Transfers to Sub-counties
Asuret 35,896,000 35,896,000 100.0 24,800,000 28,363,616 114.4 35,280,000 35,280,000 100.0 33,693,220 32,274,000 95.8
Gweri 38,404,000 38,404,000 100.0 28,087,750 30,257,697 107.7 34,281,000 34,281,000 100.0 34,482,581 32,960,737 95.6
Kateta 41,912,000 41,912,000 100.0 69,296,532 69,296,532 100.0 55,130,000 55,129,000 100.0 58,163,389 56,030,905 96.3
Sub-Total 116,212,000 116,212,000 100.0 122,184,282 127,917,845 104.7 124,691,000 124,690,000 100.0 126,339,190 121,265,642 96.0
Estimates and Actual Receipts at Sub-counties by districts
Pallisa sub-counties
Agule 22,808,000 20,997,500 23,578,800 26,172,282 31,422,886 18,924,000 36,516,911
Kagumu 13,956,000 12,876,253 21,060,000
Kibuku 17,704,260 17,323,054 18,556,000 15,532,223
Petete 21,469,020 12,000,000 15,520,203 14,922,992 13,700,000 12,600,000 20,000,000
Soroti sub-counties
Kateta 41,912,000 34,486,453 50,294,400 60,057,419 61,729,800 55,119,800 63,979,728
Gweri 104,628,539 43,151,849 62,262,523 34,281,000 34,281,000
Asuret 34,040,749 35,896,000 36,220,600 35,247,300 37,280,000 37,062,543 35,125,201
Source: Financial Summary Sheets (2005/05-2008/09) in Planning Units of Pallisa and Soroti Districts

25
On the non-financial resources, Local Governments have been provided with road
equipments to improve their capacity to maintain the roads. The policy shift towards
contracting out all works to private contractors has also rendered the district equipment
redundant. It is only put in use in execution of sub-county works mainly because they are
not attractive to the private contractors. It was observed that the approach of executing
works, level of funding and nature of interventions in the roads has led to underutilization of
engineers.
Table 8 presents some of the key equipment provided by government to the sampled
districts. It was observed that equipments provided by the government reached the district.
However, a closer scrutiny of the available equipment reveals that many of the important
equipments are obsolete and are in a non-functional state or in the need of repair. While
the government regional workshops for maintenance and repair of the machines are still
operational, it takes a longer time to have the machines taken there to get them repaired.
For instance, it is now two years since the wheel loader for Soroti District was taken for
repair. This, to a great extent, has paralysed district works at the lower levels. Further
discussions with the Acting District Engineers revealed that once the machines were taken
for repair, it was equally important not to consider them during the planning of activities.
The cost of transporting the equipment to the central government mechanical workshop is
too prohibitive. Having the equipment worked upon from the district would be a better and
less costly alternative as well as time saving.

26
Table 8: Status of key equipment by districts
Equipment Reg. No Condition Remarks
Soroti
Wheel Loader Komatsu WA180
UG 378W Fair In Bugembe for engine Overhaul
Vibro Roller Caterpillar C34318 UG 0379W
Poor Needs major repairs
2 Pedestrian Rollers Dynapac LP750 Poor Needs major repairs
Tipper lorry FVR Isuzu UG 0373W Poor Needs major repairs
Pallisa
Chain loader (Traxcavator)
Dynapac CA151 5TON
Requires partial engine overhaul and replacement of undercarriage parts.
Repairable
Mitsubishi Tipper LG0011-40 Requires engine overhaul and tyres
Repairable
Jeifang Tipper LG0004-40 Requires repairs and tyres Repairable
Motor Grader Kumatsu GD512 A
LG0021-40 Requires repairs and tyres Repairable
Tractor UC1626 Fair Unsustainable
Yamaha M/cycle DT125 LG0017-40 Grounded Board off
Yamaha M/cycle DT125
LG0018-40 Grounded Board off
Hero Puch M/cycle LG0047-40 Poor Unsustainable
Hero Puch M/cycle LG0048-40 Poor Unsustainable
Hero Puch M/cycle LG0049-40 Poor Unsustainable
Hero Puch M/cycle LG0050-40 Poor Unsustainable
Water Bowser Dead Axel Needs tyres
Nissan Hard body Double cabin ADNJ84
LG0055-40 Needs tyres and one Tyres hub
Unsustainable
Source: Annual District Work Plans FY2008/09
Most engineers claim that they cannot supervise activities of routine maintenance that takes approximately 25 percent of sectoral work plan activities in Pallisa and 39 percent in Soroti District (Table 9). This means that in absence of donor funded programmes, the engineers will have most of time schedules to supervise routine maintenance activities which has rendered most of them underutilised or seek for alternative employment. This trend in districts has created a gap in the staffing levels in the sampled districts as most of the offices have been occupied by officers in acting capacities.
Table 9: Allocation of time to Central Government funded programme, 2005/6-2008/9 (%)
Funding
Source
2005/6 2006/7 2007/8 2008/9
Pallisa Soroti Pallisa Soroti Pallisa Soroti Pallisa Soroti
PAF-1 78.8 100.0 81.5 100.0 65.2 65.1 45.0 75.0
PAF-2 21.2 0.0 18.5 0.0 34.8 34.9 55.0 25.0
Total 100.0 100.0 100.0 100.0 100.0 100.0 100.0 100.0
Note: These funds exclude those from DANIDA.
Source: District Annual Work Plans and Budget Performance Reports (2005/06-2008/09)

27
4.2 Analysis of the Implementation of Activities
The funds were found to be utilized as planned but less in amounts estimated and actual
released by CG at the various levels of government. The expenditures are guided by the
work plans and policies in place. It was observed that besides leakage in the funds released
to districts and sub-counties, there were key emerging issues in the implementation that
need to be addressed. First, as observed in Table 1 the programme contribution to roads
sub-sector, routine maintenance of roads, takes the biggest proportion varying between
16.5 to 45.0 percent for Pallisa while 15.5 to 67.0 percent for Soroti. Surprisingly, periodic
maintenance and removal of structural bottlenecks varied between 3.8 to 55.0 percent in
Pallisa while 5.0 to 17.1 percent in Soroti District. During the period 2005/6 to 2008/9, only
107.9 km were rehabilitated in Pallisa while 63.9 km in Soroti District (Table 10). This would
mean that either resources to be increased or implementation to go on for several years in
order to cover the increasing road network.
This kind of financing arrangement and intervention is not adequate if consideration of the
rural roads status is taken into account. In the sampled districts, full road rehabilitation was
found to be solely financed from donor funds especially DANIDA, and AfDB/IFAD as key
financing agencies or institutions. This kind of funding which is unsustainable has been
implemented through RSPS and in Soroti it is now under a newly phased programme, RRP.
It was observed that part of the CG transfers also cover recurrent expenditures like
wages/salaries, administrative expenses, among many others. Besides the use of funds, the
team analysed the unit costs. It was observed that the unit cost of road rehabilitation of one
kilometre of community access road ranged between Ushs.14,101,625-Ushs.15,565,713
which is much lower than in other programmes centrally controlled e.g. North-west
Agricultural Development Programme (NWADP) in West Nile Region.

28
Table 10: Road sector programme performance
Road Activity
2005/6 2006/7 2007/8 2008/9
Km Ushs Ushs/Km Km Ushs Ushs/Km Km Ushs Ushs/Km Km Ushs Ushs/Km
Pallisa
Routine 369.8 30,382,000 82,158 229.7 55,736,000 242,647 289.9 110,986,000 382,842 302.0 81,482,000 269,808
Periodic 12.5 55,286,000 4,422,880 30.3 84,869,000 2,800,957 13.9 121,593,000 8,747,698
Rehabilitation 20.6 190,628,000 9,253,786 55.6 349,144,000 6,279,568 10.6 237,247,000 22,381,792 21.1 341,882,000 16,202,938
Soroti
Routine 263.1 105,570,000 401,254 216.5 209,967,000 969,824 336.8 180,010,000 534,471 271.9 89,764,000 330,136
Periodic 38.5 79,874,000 2,074,649 631,600
Rehabilitation 9.0 79,713,000 8,857,000 19.2 104,420,000 5,438,542 23.2 350,395,000 15,135,853 12.6 85,566,000 6,790,952
Source: Annual Progress Reports
With regard to the planning, the analysis of the various work plans revealed a wide variation
in the identification and prioritization of the needs of the people by CG and districts.
However, many of the districts have not harmonized their expenditure priorities to fit into
the national focus. To this effect, the works departments have been characterised by
insufficient budgets and some sub-counties have not made fund allocations to the roads
since 2005/6. The most immediate examples are Gweri Sub-county in Soroti District and
Kagumu Sub-county in Pallisa. This illustrates a disconnection in the planning and budgeting.
It was further observed that in the sub-counties under CAIIP and DANIDA programmes,
there was no budget for the sustainability of the projects. This further explains the current
poor state of most of the formerly donor funded roads.
Further and related to implementation, the identification of roads under CAIIP reveals that
the programme is poorly coordinated at the district level. It was observed that the road user
committees were not adequately sensitized about their oversight roles. This has brought
about problems of contractors being paid for substandard work since the road committee
does not fully execute its responsibilities. For instance, on one of the roads rehabilitated
(Kagumu - Bulangira),the contractor had spread murram on it but it was about 2 inches
thick of un-compacted soil, a direct contrast to the required standard of compacted 4
inches (CAIIP Project 1 Appraisal Report Nov 2006). This, therefore, left the road on the
verge of deteriorating.

29
Surprisingly, the selection of some roads lacked proper guidance as they have no direct
economic benefits to the communities. For instance in Agule sub-county, two of the chosen
roads were found in Odusai parish and yet there are eight parishes which are equally with
very poor road status. In a similar instance, Outa junction – Ebirigwanga road was selected
with no consideration of economic benefits as it crosses areas with no population
settlement. It was noted that beneficiary sub-counties were not provided with project
background information to enable them adequately internalise the implementation
arrangement.
Project coordination was found to be a major challenge in the CAIIP projects and
interactions with the District Community Development Officer (CDO) who doubles as the
coordinator lacked reports on the status of the project. It was observed that monitoring and
supervision was hardly carried out as the project office was not aware of developments in
the project implementation. The coordinator raised many attributive factors that included
limited facilitation and lack of transport.
4.3 Analysis of policies, regulations and structures used in implementation of
Government activities
It was noted that districts have been prohibited from the use of the force account and the
team observed that districts under study are no exceptions as the same directive has been
upheld. This has led to low optimum use of machinery. This indicates that most of the work
is contracted out to private contractors save for the few sub-county road works. This is
attributed to the fact that they are not attractive to private contractors and the district
inevitably works on due to lack of alternatives.
In line with the implementation of activities, private service providers are sought through
the public procurement process. This process follows the procurement plans submitted to
the procurement unit and approved by the district council. Much as the procurement
procedure follows the Public Procurement and Disposable Act (PPDA), the study revealed
that there was low compliance to evaluation guidelines. The key issues seemed to be
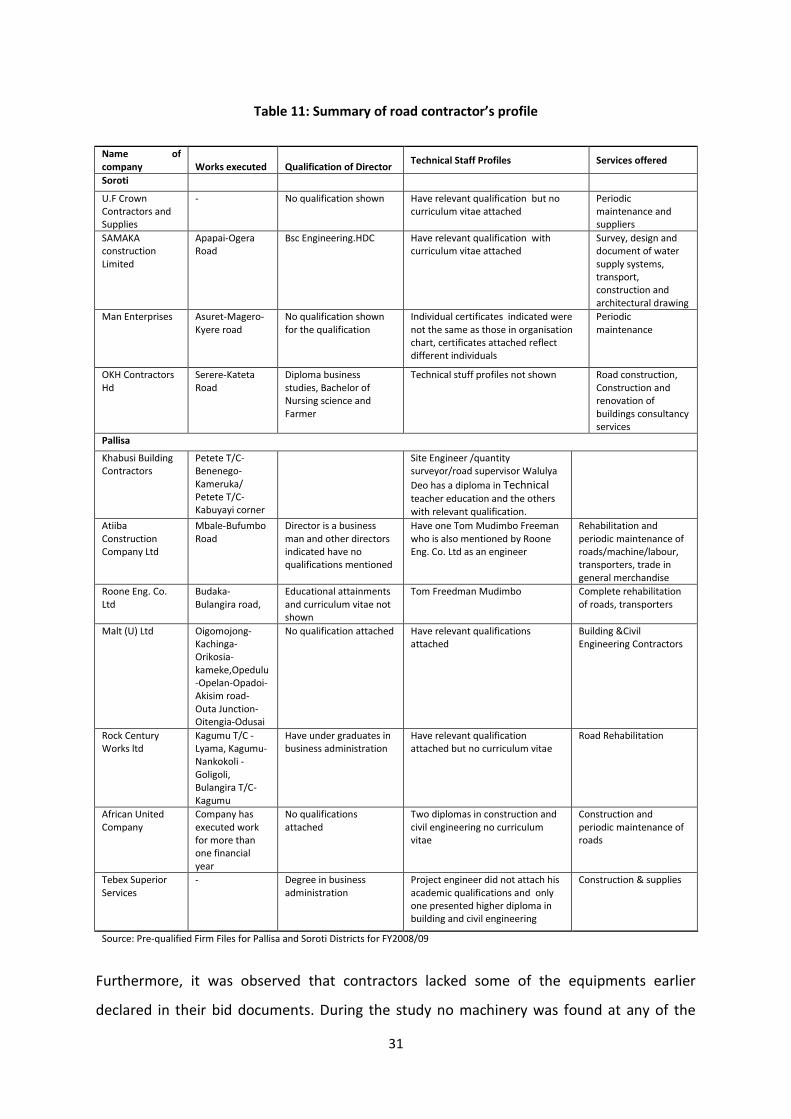
overlooked. Further to this, some of the contractors procured were found lacking
competent staff, not meant to execute works of big financial magnitude and companies with

30
staff who forged qualifications as indicated in Table 11. For instance, Pallisa District
procured Roone Engineering Co. ltd to rehabilitate Budaka – Bulangira Road. The company
employed an individual that was believed to have qualified as an assistant foreman in
labour-based road construction and maintenance at Mt. Elgon Labour Based Training
Centre, Mbale, between October 18, 1995 and March 01, 1996. However, the certificate
was dated July 05, 1999. The company also had inadequate technical staff with only one
engineer with a diploma in civil engineering and no past experience shown whatsoever.
Similarly a LoG engineer in the same region was indicated to be employed by Roone
Engineering Co. Limited but also happened to be with Khabusi Building contractors. This
inadequate assessment of the requirements led to offer awards to firms that had limited
capacity and thus poor execution of works.
31
Table 11: Summary of road contractor’s profile
Name of company Works executed Qualification of Director
Technical Staff Profiles Services offered
Soroti
U.F Crown Contractors and Supplies
- No qualification shown Have relevant qualification but no curriculum vitae attached
Periodic maintenance and suppliers
SAMAKA construction Limited
Apapai-Ogera Road
Bsc Engineering.HDC Have relevant qualification with curriculum vitae attached
Survey, design and document of water supply systems, transport, construction and architectural drawing
Man Enterprises Asuret-Magero-Kyere road
No qualification shown for the qualification
Individual certificates indicated were not the same as those in organisation chart, certificates attached reflect different individuals
Periodic maintenance
OKH Contractors Hd
Serere-Kateta Road
Diploma business studies, Bachelor of Nursing science and Farmer
Technical stuff profiles not shown Road construction, Construction and renovation of buildings consultancy services
Pallisa
Khabusi Building Contractors
Petete T/C-Benenego-Kameruka/ Petete T/C-Kabuyayi corner
Site Engineer /quantity surveyor/road supervisor Walulya
Deo has a diploma in Technical teacher education and the others with relevant qualification.
Atiiba Construction Company Ltd
Mbale-Bufumbo Road
Director is a business man and other directors indicated have no qualifications mentioned
Have one Tom Mudimbo Freeman who is also mentioned by Roone Eng. Co. Ltd as an engineer
Rehabilitation and periodic maintenance of roads/machine/labour, transporters, trade in general merchandise
Roone Eng. Co. Ltd
Budaka-Bulangira road,
Educational attainments and curriculum vitae not shown
Tom Freedman Mudimbo Complete rehabilitation of roads, transporters
Malt (U) Ltd Oigomojong-Kachinga-Orikosia-kameke,Opedulu-Opelan-Opadoi-Akisim road-Outa Junction-Oitengia-Odusai
No qualification attached Have relevant qualifications attached
Building &Civil Engineering Contractors
Rock Century Works ltd
Kagumu T/C -Lyama, Kagumu- Nankokoli -Goligoli, Bulangira T/C-Kagumu
Have under graduates in business administration
Have relevant qualification attached but no curriculum vitae
Road Rehabilitation
African United Company
Company has executed work for more than one financial year
No qualifications attached
Two diplomas in construction and civil engineering no curriculum vitae
Construction and periodic maintenance of roads
Tebex Superior Services
- Degree in business administration
Project engineer did not attach his academic qualifications and only one presented higher diploma in building and civil engineering
Construction & supplies
Source: Pre-qualified Firm Files for Pallisa and Soroti Districts for FY2008/09
Furthermore, it was observed that contractors lacked some of the equipments earlier
declared in their bid documents. During the study no machinery was found at any of the

32
sites, an indication of limited capacity to execute the works in time. The companies were
also found to have multiple contracts running at the same time in spite of their limited
capacity. For instance, Khabusi Building Contractors and Furniture Centre Limited which was
at the time working in Petete sub-county (Pallisa) was also working in Budaka District. This
awarding of multiple contracts to one firm has resulted into a lot of the shoddy work done
as observed along Kachocho road where murram piles had stayed for over two weeks
without being spread in Figure 3. This was expressed by the community members as a big
challenge for them to utilize the road as observed in the picture below where an individual
tries to pass through murram piles.
Figure 4: Unspread and Overstayed Murram - Kachocha Road being Under Rehabilitation
Lack of equipment at the site can still be linked with the poor grading of the roads being
worked upon as seen along Opedulu-Akisimu road (Pallisa) worked on by Malt (U) Ltd.
Existing broken culverts had not been reinforced along the swampy barriers to allow
vehicles transport products cross these areas to the trading centres.
It was further observed that the procurement units were at the time understaffed in both
districts. Unlike Pallisa that recruited a senior procurement officer in June 2008, Soroti was
still relying on one senior officer to oversee the activities of the unit. This is further
Figure 3: Unspread and Overstayed Murram on Kachocha Road being Under Rehabilitation

33
exacerbated by the understaffing of other departments - such as the works department-
leading to delayed submission of requests from the procurement unit.
The procurement units are also faced with limited funds, making it difficult for district to
execute their activities. These activities were only financed under PAF (monitoring and
accountability grant). In 2008/9 Pallisa District received only UShs 8.4 million. The Shs15
million expected from local revenue was not provided, which limited the unit from meeting
the time lines as indicated in the procurement plans. Similarly, Soroti District allocated only
UShs.8.4 million from PAF to facilitate the procurement activities over 2008/9 and Ushs19
million from local revenue was earmarked for 2009/10 to supplement on the PAF
facilitation. This funding from local revenue has not been forthcoming as the taxable base is
narrow and graduated tax compensation releases to districts are inadequate and irregular.
The increasing demand for funds by heads of department worsened the situation, hence
reducing chances to facilitate procurement activities. The bidding fee surprisingly is treated
as a source of revenue and yet it is supposed to facilitate the PDU activities. This, however,
is not adequate to sustain procurement activities throughout 2008/9 since the fees got from
the bidding process goes directly into the district office and the procurement have no share
at all.
4.4 Level of Resource Utilization
The results in Table 12 suggest persistent inability to absorb all the funds transferred to the
districts for the road sub-sector. Both districts have balances at the end of each financial
year and it varies among them greatly. This is largely attributed to the delayed transfer of
funds, under staffing, as well as delayed procurement processes. The low staffing levels in
both works department and procurement units have undoubtedly emerged as constraints in
the use of funds.
The study also considered the time and duration taken to utilize resources when transferred
to both district and sub-county levels. While the transfer of funds was carried out within one
month, delays in the procurement led to low utilization of funds.

34
Table 12: Road sub-sector fund balance, 2005/6-2008/9
Source of funding Central Government transfers DANIDA Sub-Total
UShs % UShs % Ushs
2005/6 Pallisa 0.0 59,498,410 100.0 59,498,410
Soroti 38,982,481 80.0 9,749,076 20.0 48,731,557
2006/7 Pallisa 3,623,878 8.9 37,062,820 91.1 40,686,698
Soroti 1,647,000 1.6 104,420,00 98.5 106,067,000
2007/8 Pallisa 80,490 0.0 342,100,950 100.0 342,181,440
Soroti 61,929,149 17.9 283,521,000 82.1 345,450,149
2008/9 Pallisa 179,759,999 99.9 218,314 0.1 179,978,313
Soroti 430,840 57.7 586,476,199 42.4 586,907,039
Cumulative balances
Pallisa 183,464,367 438,880,494 622,344,861
Soroti 102,989,470 984,166,275 1,087,155,745
Source: District Annual Reports (2005/6-2008/9)
It was observed that many of the contractors were behind schedule despite having been
provided with most of the required logistics to complete their works in time. This was a
major problem in Pallisa under the CAIIP projects where some of the roads being
rehabilitated had soil piles that were not spread making the roads impassable like on Petete
trading centre – Kabuyayi corner road in Petete Sub-county in Pallisa District. To ascertain
the performance of the contractors, the team interviewed the sub-county monitoring staff
under the district security office but lacked adequate information as they thought that the
works was to be carried out in phases. This implementation arrangement weakens the
monitoring systems put in place by the government and leads to poor execution of
activities.
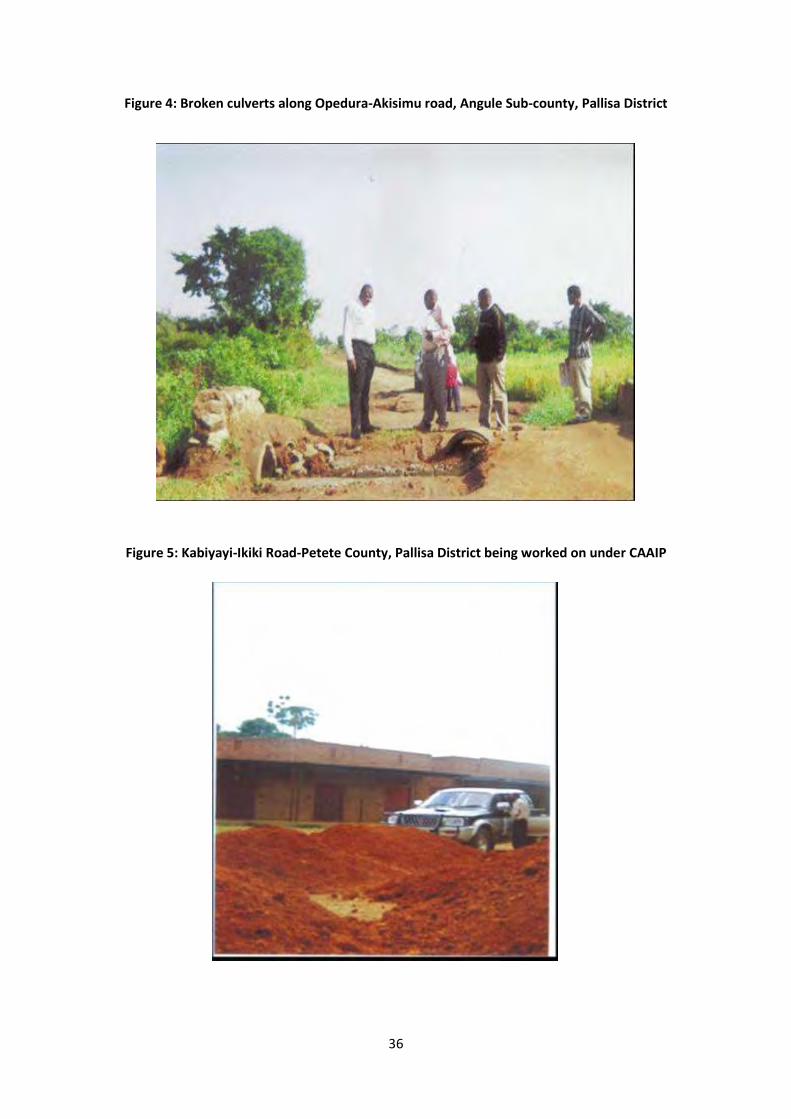
In other cases, road openings were done and no further works had taken place, leaving the
roads in worse conditions and increasing the impassability during rainy seasons. In places
where culverts had to be fixed, the roads are simply impassable due to the road opening
works making it impossible for to cross over those particular points like along Opedura-
Akisimu road in Agule sub-county (Figure 4).
Further investigations revealed that such slowness in responding to emergency works like
fixing culverts was mainly attributed to contractors having multiple contracts and some of
which were in other districts. None of the contractors was found on site and it was also

35
clear that they lacked capacity to manage contracts of such magnitude as no machinery was
found on any site. Equally, the contractors failed to establish site offices and the community
allegedly stated that they come around but stay away from the district. This was revealed
by the community as one of the factors attributed to poor performance and limited
information among the beneficiaries.
Furthermore, the roads with on-going works under CAIIP had no sign posts whatsoever to
indicate the project specifications like who the contractors were, the duration of the
project, the sponsors/funders of the project among other details displayed. Interactions
with the sub-county officials in Kagumu Sub-county revealed that they had no copies of the
BOQs and only word of mouth had got to them in regard to the details of the project. It,
therefore, explains the general public’s lack of knowledge about ongoing projects in their
communities and hence explains community members’ thinking that the contractors were
to work in phases when interviewed about the un-spread soil piles in some of the roads.
The interviews conducted at the sub-county revealed lack of adequate information on all
project components. The proposed market constructions had not yet commenced in any of
the sub-counties implementing activities under CAIIP. In the proposed areas for market
construction, the land had not yet been surveyed though some of it had been gazetted. The
time span for the completion of these markets was actually not known to most of the sub-
county officials and even the community members.
36
Figure 4: Broken culverts along Opedura-Akisimu road, Angule Sub-county, Pallisa District
Figure 5: Kabiyayi-Ikiki Road-Petete County, Pallisa District being worked on under CAAIP

37
5.0 EMERGING CHALLENGES AND POLICY OUTCOMES
5.1 Emerging Challenges
The study revealed a total lack of understanding of the role of the recently formed Uganda
National Roads Authority (UNRA). The works offices do not have a clear understanding of
what UNRA is and what its role is in the development of the road sector. It was observed in
Pallisa that though the funding of the road sector has increased in 2009/10, the district
works budget can only accommodate 300km of the prioritised 407.2km of motorable length
of the road network. This is so because the district still has roads that are not yet gazetted
for development due to financial constraints and are therefore not part of the officially
declared motorable length of the road network. This implies that UNRA taking up 68.6km
(excludes the 407.2km) serves less in alleviating the budgetary constraints of the road sector
and its accrued problems.
The study also revealed a major challenge in project sustainability and maintenance
especially for the donor funded roads works/programmes. Most donor funds only covered
the capital element of the total budget of the programmes. Some of the road works that
were completed are already in poor state hardly six months after completion.
It was also observed that there were low levels of absorption capacity of the available funds.
This was because there were few available qualified staff to for instance to prepare the
required Bills of Quantities (BOQ) and other necessary study work required before funds can
be released for a particular project and thus causing work to be delayed. This is largely due
to problems of understaffing of the responsible offices where many of the available staff are
in acting capacity with some of the positions vacant despite constant public advertising for
the vacant positions. The district faces challenges in attracting qualified personnel and high
levels of turnover due to poor terms and conditions of services. Furthermore some of the
central government transfers are received late which delays the absorption of the available
funds.
The current working state/condition of the road equipment, in addition to its obsolete
nature, was sighted as one of the major constraints to infrastructure development in the
local governments. The road machinery/equipment was found to be obsolete and in a very

38
poor functional state as most of it was either in dire need of repair or grounded. This
grounded machinery constrains the entire works department of Pallisa and Soroti districts.
Discussions with the acting district engineers revealed a major challenge in the repair of this
equipment and machinery which is attributed to limited funding. Furthermore, the cost of
transporting the machinery to Bugembe is so high leaving the district with no option but to
ground some of its machinery. According to the acting engineers, when spare parts are
procured and mechanics are requested to come to the district to carry out repairs, they are
not only slow to respond but costly to meet their allowances. Therefore the impact of the
increasing funding is marginally felt as the equipment meant to be used in bringing about
infrastructure development is in poor mechanical condition.
It is, therefore, proposed that the financing of infrastructure be dramatically reviewed with
a view to improving access to the rural markets and interconnection within the districts to
offer better services. The following are proposed actions in this regard.
5.2 Policy Outcomes
There is need to recruit qualified engineers and review their remuneration as well as
facilitation in order to attract them to stay for longer periods. This will make the job
more attractive and competitive as compared to the private sector.
The use of labour based method should be encouraged on community access roads
especially for the sub-counties while machines should be utilized on major feeder
roads. This is because the labour based method is more cost effective and better
roads are made although in a slower process as compared to machine based.
The PPDA should clearly provide adequate guidelines for evaluation of companies
that bid for local contracts at the local government level and there should be
punitive measures for those who violet them.
The heads of departments should be provided with adequate training in the
evaluation of bids as they are constituted when necessary. This will improve on the
selection of firms with required capacity to execute works at the local government
level.
The capacity of regional workshops should be strengthened to be able to respond
adequately to the maintenance and service requirement of district machines.

39
The PPDA should carry out performance audit to ascertain the capacity of firms that
execute district works. This will reduce on wasteful expenditure that has become a
characteristic of some of the implemented government programmes.
The districts which have no fully functioning units should be advised to recruit
procurement officers to fill the staffing gap in the public and procurement unit. This
will improve on the timely awarding of contracts as well as the scrutiny of the key
documents requested and submitted by firms.
The districts should be requested to publish in the news papers a list of firms with
running contracts to reduce on awarding multiple contracts to firms with low
capacity.
The planning of roads should factor in the economic potential of areas as the current
system under MoW only considers roads in bad situation. This will improve on
accessibility to areas that have identified themselves as economically productive.
The level of funding for roads should be increased both under machine based as well
as labour based methods. The latter method was seen to be effective in contributing
to income earning opportunities of the local communities which helps government
achieve twin objectives of poverty reduction and road provision.
The procurement unit should be adequately supported both financially and
materially for them to do work professionally and on time.
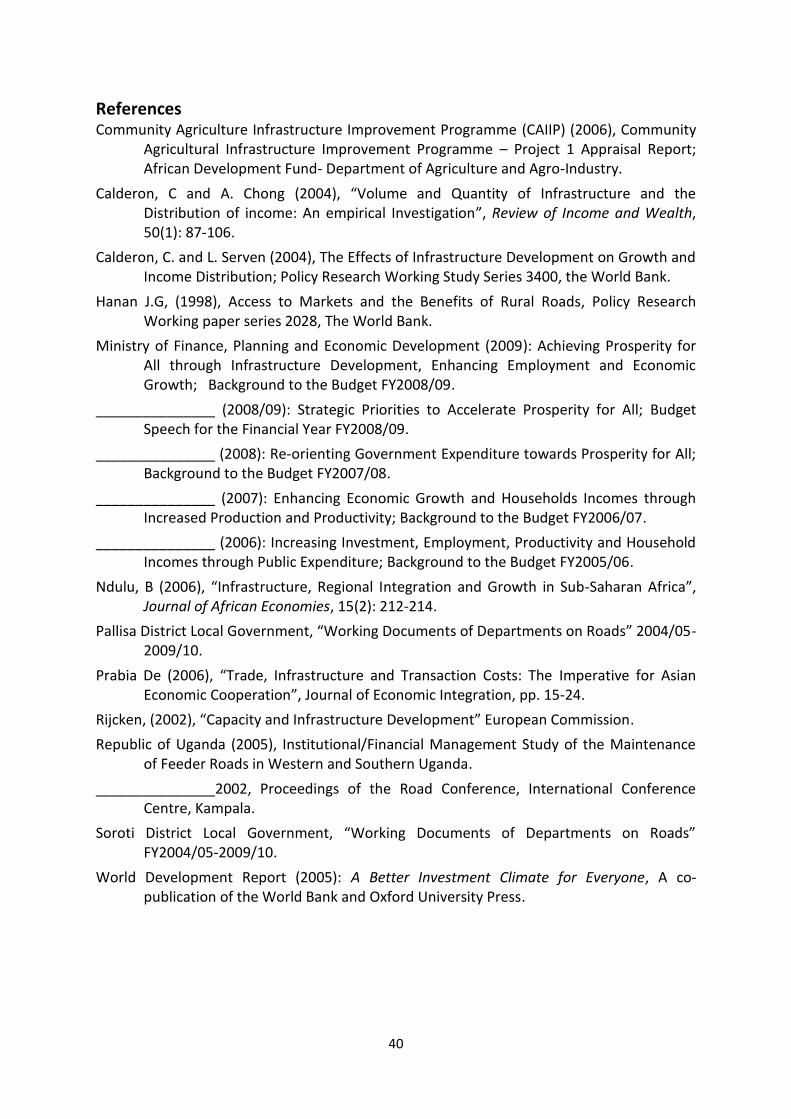
40
References Community Agriculture Infrastructure Improvement Programme (CAIIP) (2006), Community
Agricultural Infrastructure Improvement Programme – Project 1 Appraisal Report; African Development Fund- Department of Agriculture and Agro-Industry.
Calderon, C and A. Chong (2004), “Volume and Quantity of Infrastructure and the Distribution of income: An empirical Investigation”, Review of Income and Wealth, 50(1): 87-106.
Calderon, C. and L. Serven (2004), The Effects of Infrastructure Development on Growth and Income Distribution; Policy Research Working Study Series 3400, the World Bank.
Hanan J.G, (1998), Access to Markets and the Benefits of Rural Roads, Policy Research Working paper series 2028, The World Bank.
Ministry of Finance, Planning and Economic Development (2009): Achieving Prosperity for All through Infrastructure Development, Enhancing Employment and Economic Growth; Background to the Budget FY2008/09.
_______________ (2008/09): Strategic Priorities to Accelerate Prosperity for All; Budget Speech for the Financial Year FY2008/09.
_______________ (2008): Re-orienting Government Expenditure towards Prosperity for All; Background to the Budget FY2007/08.
_______________ (2007): Enhancing Economic Growth and Households Incomes through Increased Production and Productivity; Background to the Budget FY2006/07.
_______________ (2006): Increasing Investment, Employment, Productivity and Household Incomes through Public Expenditure; Background to the Budget FY2005/06.
Ndulu, B (2006), “Infrastructure, Regional Integration and Growth in Sub-Saharan Africa”, Journal of African Economies, 15(2): 212-214.
Pallisa District Local Government, “Working Documents of Departments on Roads” 2004/05-2009/10.
Prabia De (2006), “Trade, Infrastructure and Transaction Costs: The Imperative for Asian Economic Cooperation”, Journal of Economic Integration, pp. 15-24.
Rijcken, (2002), “Capacity and Infrastructure Development” European Commission.
Republic of Uganda (2005), Institutional/Financial Management Study of the Maintenance of Feeder Roads in Western and Southern Uganda.
_______________2002, Proceedings of the Road Conference, International Conference Centre, Kampala.
Soroti District Local Government, “Working Documents of Departments on Roads” FY2004/05-2009/10.
World Development Report (2005): A Better Investment Climate for Everyone, A co-publication of the World Bank and Oxford University Press.

41
Annex 1: Respondents in Public Expenditure Tracking Study on roads in Pallisa district
Name Position Administrative unit
Moses Bukenya Sseguya Chief Administrative officer Pallisa District
Michael Ongwara Ag. Senior civil engineer Works Office
Paul Mulomi Secretary for Works and Technical Services Works Office
Samuel Atrico .O Senior Procurement Officer Procurement Office
Rose Akello Procurement Officer Procurement Office
Dr. Otodo Roem Sub county chief Agule Subcounty
Fenakansi Mweru Magino Sub county chief Petete Subcounty
Zubairi Mugoda Community member Petete Subcounty
Abdu Kirya GISO Petete Subcounty
Leo Kiriwo Sub county accountant Kagumu Subcounty
Joseph Nabulele Chair person LC II Kagumu Subcounty
Ketty Kaidu Subcounty CDO Kagumu Subcounty
George Onyait CDO in-charge of CAIIP District headquarters
Jackson Gondya Senior Assistant Secretary Kagumu Subcounty
Christopher Owono Vice Chairperson Pallisa district
Mr. Omoro Councillor Butebo Subcounty
David Malinga Accountant Agule Subcounty
Richard Owuro Magoro Agriculture officer Agule Subcounty
Samson Okurut Akwamor Parish chief Agule Subcounty
Emmanuel Ochom Kalemen parish chief Agule Subcounty
Joseph Okiring Chelekura parish chief Agule Subcounty
Lawrence Apuru Assistant inspector of police Agule Subcounty
David Senda Community Development Officer Petete Sub county
Mr. Zungu Senior office supervisor CAO’s office
Paul Mukhesi District planner Planners office
Mr. Kiko Sub county chief Kibuku Sub county

42
Annex 2: Allocation of funds to the sector’s activities in Pallisa district, 2005/6-2008/9 (Ushs)
Item 2005/6 2006/7 2007/8 2008/9
a) Employee costs
General staff salaries 0 114,242,316 4,200,000 85,446,748
Allowances 0 66,739,000 50,902,400 11,811,000
Sub - Total 0 180,981,916 55,902,400 97,257,748
b) Use of goods & services
General expenses 10,353,000 0 5,134,900 114,797,000
Workshops and seminars 0 9,200,000 2,120,000 410,000
Staff training 0 5,940,000 1,200,000 2,900,000
Computer supplies and information technology(IT) 0 4,350,000 1,800,000 8,200,000
Printing, stationery, photocopying and binding 0 13,340,000 5,152,646 900,000
Bank charges and other bank related costs 0 1,116,000 1,500,000 2,120,000
Telecommunications 0 4,800,000 2,400,000 420,000
Sub-total
c) Utility & property expenses 0 2,600,000 1,800,000
Property expenses 0 62,400,000 663,790,000
Electricity 0 4,000,005 1,632,000
Water 0 200,000
General supply of goods and services 0 825,602,000 11,450,000
Sub-total
PROFESSIONAL SERVICES
Consultancy services 1,006,402,000 85,750,000 26,000,000 697,018,000
Fuel, lubricants, and oils 0 80,192,600 41,310,004 31,570,000
Sub-total
MAINTENANCE
Maintenance- Civil 150,000,000 696,134,512 465,894,160 321,288,500
Maintenance – Vehicles 0 16,133,000 16,569,200 40,760,000
Maintenance –Machinery, Equipment and Furniture 0 5,000,000 15,000,000 2,040,000
Sub-total
Sub - total 1,166,755,000 1,814,158,117 1,252,102,910 2,000,000
Other expenses 0 76,800,000 1,237,673,560
Overall total 1,166,755,000 1,995,140,033 1,384,005,310 1,334,931,308
Source: Summary financial sheets (2005/6 – 2008/9)

43
Annex 3: Allocation of funds to sectoral activities in Soroti district, 2005/6-2008/9 (Ushs)
ITEM 2005/06 2006/07 2007/08 2008/09
EMPLOYEE COSTS
General Staff Salaries 99,052,086 102,045,000 99,319,296 115,102,549
Contract Staff Salaries (Incl. Casuals, Temporary) 0 0 - 720,000
Allowances 48,474,933 53,944,000 69,091,000 77,334,600
Medical expenses (To employees) 0 200,000 100,000 392,000
Incapacity, death benefits and funeral expenses 0 836,000 650,000 1,050,000
Sub-Total 147,527,019 157,025,000 169,160,296 194,599,149
USE OF GOODS AND SERVICES
Advertising and Public Relations 0 200,000 - 1,985,000
Workshops and Seminars 151,651,000 5,500,000 1,620,000 0
Staff Training 20,000,000 2,000,000 800,000 1,000,000
Hire of Venue (chairs, projector, etc) 120,000 400,000 2,450,000 590,000
Books, Periodicals & Newsstudys 346,050 432,000 - 0
Computer supplies and Information Technology (IT) 350,000 8,500,000 6,792,000 6,724,000
Welfare and Entertainment 0 0 3,500,000 6,778,194
Special Meals and Drinks 3,288,302 4,061,000 13,860,000 986,000
Printing, Stationery, Photocopying and Binding 29,439,979 15,560,600 26,310,024 17,847,200
Small Office Equipment 683,000 3,230,000 8,150,000 960,000
Bank Charges and other Bank related costs - 1,100,000 240,000 0
Financial and related costs (e.g. shortages, pilferages, etc.) 0 0 - 300,000
Telecommunications 0 970,000 2,285,000 0
Postage and Courier 0 158,000 512,000 330,000
ICT - 500,000 - 15,000
Utility and Property Expenses
Property Expenses 50,000,000 2,400,000 29,855,980 0
Electricity 600,000 1,560,000 1,776,000 1,416,000
Water - 2,060,000 1,764,000 1,030,024
General Supply of Goods and Services 524,985 1,164,575,200 1,448,887,318 0
Classified Expenditure - 0 - 2,423,150,095
Consultancy Services- Short term 422,633,000 0 - 0
Consultancy Services- Long-term 59,524,648 123,000,000 61,200,000 38,085,000
Taxes on (Professional) Services - 70,000,000 - 0
Travel inland 3,171,000 3,180,000 4,330,000 0
Travel abroad 0 0 - 1,500,000
Fuel, Lubricants and Oils 26,572,303 42,428,924 48,997,800 0
Maintenance 0 0 - 36,318,600
Maintenance - Civil 425,000,000 0 1,200,000 5,000,000
Maintenance - Vehicles 0 13,400,000 18,157,500 0
Maintenance – Machinery, Equipment & Furniture 1,200,000 700,000 16,000,000 13,560,700
Maintenance – Other 150,000,000 0 25,000,000 3,750,000
Sub-Total 1,344,588,267 1,465,915,724 1,723,687,622 2,561,325,813
Transfers to other Government Units 15,576,000 0 - 19,600,000
Overall total 1,508,891,286 1,622,940,724 1,892,847,918 2,775,524,962
Source: Estimates and Actual Expenditure Booklets (2005/06-2008/09)

44
Annex 4: Sub-county revenues and expenditures breakdowns by financial year, (‘000UShs)
Source of funding Estimate Actual
Name of Sub county: Agule
FY 2005/6
Source Estimate Actual
LOCAL REVENUE
G-tax compensation 12,000.000 3,656.252
Land fees 3,000.000 3,475.000
Business licenses 800.000 544.000
Fees from animal slaughters 200.000 24.000
Animal and crop levies 50.000 -
Birth registration 500.000 160.000
Market dues 710.000 325.800
Chair person emoluments 4,000.000 3,275.000
Sub-total 21,260.000 11,460.052
Government Grants:
PMA 4,043.220 3,833.559
LGDP II 22,802.000 20,997.500
Sub-total 26,845.220 24,831.059
Overall total 48,105.220 36,291.111
FY 2006/7
LOCAL REVENUE
G-tax compensation 8,671.064 8,376.081
Land fees 4,200 3,400
Business licenses 425 405
Liquor licenses 0 0
Fees from animal slaughters 0 0
Animal and crop levies 100 0
Birth registration 1,000 923
Market dues 500 384
Chair person's emoluments 1,200 1,190
Sub-total 16,096.064 14,678.081
Government Grants:
PMA 5,645 5,123
LGDP II 23,578.80 26,172.28
Sub-total 29,223.8 31,295.282
Overall total 45,319.864 45,973.363
FY 2007/8
LOCAL REVENUE
G-tax compensation 4,803.093 4,353.093
Land fees 3,400.00 4,645.00
Business licenses 600 531
Liquor licenses 185 45
Fees from animal slaughters 200 68
Animal and crop levies 100 0
Birth registration 1,200 324
Market dues 400 219.2
Farmers' contribution for NAADS 864 1,489

45
Source of funding Estimate Actual
Sub-total 11,752.093 11,674.293
Government Grants:
PMA 6,380.306 4,841.409
LGDP II 31,442.886 18,924
NAADS 43,200 28,624
Sub-total 81,023.192 52,389.409
Overall total 92,775.285 64,063.702
FY2008/9
LOCAL REVENUE
G-tax compensation 15,000 12,541.433
Land fees 1,500 520
Business licenses 1,000 629
Liquor licenses 100 60
Fees from animal slaughter 300 79
Birth registration 900 267
Local services' tax 1,000 532.126
Market Dues 900 204.7
Farmers' contribution for NAADS 1,500 1,350
Miscellaneous incomes (phone charging) 1,000 692.207
Sub-total 23,200 16,875.466
Government Grants:
LGMSDP 36,516.911 31,501.74
NAADS 90,835.06 74,367.10
Sub-total 127,351.971 105,868.842
Overall total 150,551.971 122,744.308
AGULE SUB COUNTY
FY2005/6
ACTIVITY UNIT COST TOTAL
Mechanized opening of 11.2km of road 1,712.359 per km 19,178.42
network from OGIROI-ALELES
(in Chelekura and Akwamoru parish)
FY2006/7
Procurement and installation of 27 - 600mm
culverts on 11.2 km community road from 998.041 6,287.66
OGIROI-ALELES; and 21 - 600mm culverts
on 6.3km community road of KACHINGA -
MIDOD.
FY2007/8
Spot improvement and gravelling of 4.3 km
community road from ODUSAI – CHELEKURA 1285.064 5,525.78
in 0dusai and Chelekura parishes.
Mechanised opening of 7.2 km of community
road from ACOWA - CORNER KAMIA in 1515 10,908.00
Chelekura parish.
FY2008/9

46
Community works on mechanized opening of
7.2km community road from ACOWA – CORNER 748.783 5,391.24
KAMIA in Chelekura parish
Name of Sub county: Kagumu
FY2007/8
Source of funding: Estimate Actual
LOCAL REVENUE
Trading licenses 1,540 210
Market dues 1,260 240
Animal slaughter fees 65 45
Birth certificates 500 113
G-tax compensation 5,600 3,574.46
Sub-total 8,965 4182.46
Government Grants:
LGDP II / LGMSDP 13,954 12,876.253
NAADS 0 0
PMA 17,034 4,214.731
Sub-total 30,988 17,090.984
Overall total 39,953 21,273.44
FY2008/9
LOCAL REVENUE
Trading license 1,540 290
Market dues 1,260 190
Animal slaughter fees 170 114
Birth certificates 500 110
G-tax compensations 5,600 5,280
Sub-total 9,070 5984
GOVERNMENT GRANTS:
LGDP II 21,060 19,600
NAADS 50,000 50,000
Sub-total 71,060 69,600
Overall total 80,130 75,584
Name of sub county: KAGUMU Sub county
FY2007/8
Activity Unit cost Total
LOCAL REVENUE
19 improved goats 400 7,600
400 improved orange seedlings 3 1,200
Construction of new Sub-county 4,120
head quarters phase 1
LOCAL REVENUE
Construction of pit latrine 560
Maintenance of office block 480 480
NAADS 0 0
PMA

47
Procurement of upland rice seedlings 2000kg 2000 4,000
Sub-total 17,960
FY2008/9
LGDP
Construction of Sub-county office 4,120
16 Billy Boer goats 340 5,440
63 cocks 20 1,260
Construction of Pit latrine 5,700
LOCAL REVENUE
Monitoring 200
Council allowances 600
Stationery 300
NAADS
Technologies/Enterprises 22,000
Sensitisation 2,407
CBF 1,444.717
Provision of Advisory services 9,631
Operating costs 1,500
Support to model farmers(6 per parish) 4,500
Sub-total 59,103
Name of sub county: Kibuku
FY2005/6
Source of funding: Estimate Actual
Local revenue - -
LGDP II - -
PMA - -
Overall total - -
Financial year: 2006/2007
Local revenue: 4,880 4,720
PMA 4,289 3,235.900
LGDP II 17,704.26 17,323.054
Government Grants: 4,836.000 3,377.638
Overall total 31,709 28,657
FY2007/8
Local revenue 5,900 6,300
LGDP II 18,556 15,532.223
PMA 3,638.52 3,807.334
Overall total 28,095 25,640
KIBUKU SUBCOUNTY
FY2006/7
ACTIVITY UNIT COST TOTAL COST
Management 7,892.33
Finance 3,385.69
Council allowances 2,676.50

48
Production 6,598.30
Health 0.00
Education 110.00
Works and technical services 7,000
Natural resources 100.00
Community based services 580.00
FY2006/7
Management 6,235.37
Finance 3,035.408
Council 1,655.75
Production 1,400
Health 10,849.34
Works and technical services 2,506.486
Natural resources 3,724.00
Community based services 160.00
Name of sub county : Petete
FY2005/6
Source Estimate Actual
Local Revenue 1,600 4,900
Government Grants:
LGDP 21,469.02 12,000
PMA 3,352.501 3,177.375
NAADS
Sub-total 24,821.521 15,177.375
Overall total 26,421.521 20,077.375
FY 2006/7
Source
Local Revenue 4,830 10,699.281
Government Grants:
LGDP 15,520.203 14,922.992
PMA 4,600 11,448,600
NAADS
Subtotal 20,120.203 11,463,522.99
Overall total 24,950.203 11,474,222.27
FY2007/8
Source
Local Revenue 8,000 3,509.94
Government Grants:
LGDP 13,700 12,600
PMA 4,805.026
NAADS
Sub-total 13,700 17,405.026
Overall total 21,700 20,914.966
FY 2008/9

49
Source
Local Revenue 4,000 10,000
Government Grants:
LGDP 20,000 11,259.972
NAADS 50,000 50,000
Sub-total 70,000 61,259.972
Overall total 74,000 71,259.972
Name of sub county PETETE
FY2005/6
Item Unit Cost Total
Expenditures towards roads
Opening Namwala -Nabwali road 8km 14,000,000
FY2006/7
Expenditures towards roads
Opening Petete T/C -Kayaga road 3.85km 13,500,000
From Local Revenue
Operation & Maintenance of Roads
Petete T/C to Radio Uganda 10km 400,000
Source: Department Work Plan

50
FY 2005-2006 ROADS, BUILDING BUDGET
Code AWP No
Details Recurrent Development Total
2-2 USE OF GOODS AND SERVICES
2-2-5-0-01 WOR/RB2 Consultancy services – short term 316,995,000 0 316,995,000
3-1-2-1-03 WOR/RB1 Roads and Bridges 0 150,000,000 150,000,000
Sub - Total 316,995,000 150,000,000 466,995,000
2-6 GRANTS
Sub - Total 0 0 0
2-8 OTHER EXPENSES
Overall total 316,995,000 150,000,000 466,995,000 Source: Department Work Plan
SUMMARY OF REVENUE AND EXPENDITURE STATEMENT
Actual revenue / Expenditure 2003/2004
Estimated Actual Revenue/ Expenditure 2004/2005
Code Revenue Sources / departments
Budget 2005 /2006
Projected 2006/2007
Projected 2007 / 2008
REVENUE 488,066,814 782,043,309 Local Revenue 716,846,000 738,351,380 760,501,921
13,833,416,519 14,364,765,080 Government Grants
15,697,835,000 16,168,770,050 16,653,833,152
1,145,621,324 2,584,448,868 Donor / NGOs 539,150,000 555,324,500 571,984,235 15,467,194,657 17,731,257,257 Overall total 16,953,831,000 17,462,445,930 17,986,319,308
EXPENDITURE
145,325,468 1,1651,400,675 01 Administration 12,000,942,695 12,360,970,976 12,731,800,105 435,508,903 256,818,595 02 Finance and
Planning 188,523,546 194,179,252 200,004,629
322,094,970 240,463,000 03 Statutory Bodies 247,676,890 255,107,197 262,760,413 1,181,268,795 494,558,200 04 Production 509,394,946 524,676,794 540,417,098
34,122,681 1,202,105,370 05 Health 1,238,168,531 1,2275,313,587 1,313,572,995 234,570,000 2,466,619,750 06 Education 1,713,119,433 1,764,513,015 1,817,448,405
2,272,613,277 1,260,639,693 07 Works 1,298,458,884 1,337,412,650 1,377,535,030 0 42,759,000 08 Natural
Resources 44,041,770 45,363,023 46,723,914
296,366,667 115,893,000 09 Community Bases services
120,169,790 123,750,884 127,463,411
4,921,870,761 17,731,257,283 Overall total 17,360,496,465 17,881,287,378 18,417,726,000 Of
which Wages and salaries
Non-wage (recurrent)
Development Expenditure
Total
Source: Department Work Plan
FY 2005 – 2006 WORKS AND SECTOR BUDGET Code Department FY 2005-2006
Recurrent Development Total
07 0 Works
07 1 Works office 10,353,000 0 10,353,000
07 2 Roads, Building 316,995,000 150,000,000 466,995,000
07 3 Water and Sanitation 0 689,407,000 689,407,000
07 4 Mechanical 0 0 0
Total 327,348,000 839,407,000 1,166,755,000

51
FY 2005- 2006 WATER AND SANITATION BUDGET
Code
AWP No
Details Recurrent Development Total
EMPLOYEE COSTS
Sub-Total 0 0 0
USE OF GOODS AND SERVICES
2-2-5-0-01 WOR/WS1 Consultancy services- Short term 0 689,407,000 689,407,000
Sub-Total 0 689,407,000 689,407,000
2-6 GRANTS
Sub-Total 0 0 0
2-8 OTHER EXPENSES
Overall total 0 689,407,000 689,407,000
FY 2005 – 2006 WORKS OFFICE BUDGET
Code
AWP No
Details
Recurrent
Development
Total
2-1 EMPLOYEE COSTS
Sub-total 0 0 0
2-2 USE OF GOODS AND SERVICES
2-2-1 WOR/OFF1 General Expenses 10,353,000 0 10,353,000
Sub-total 10,353,000 0 10,353,000
2-6 GRANTS
Sub-total 0 0 0
2-8 OTHER EXPENSES
Overall total 10,353,000 0 10,353,000
WORKS CENTRAL BUDGET
Code Details Recurrent Development Total
2-2 USE OF GOODS AND SERVICES
2-2-1 General Expenses 10,353,000 0 10,353,000
2-2-5-0-01 Consultancy services-short-term 316,995,000 689,407,000 1,006,402,000
3-1-2-1-03 Roads and Bridges 0 150,000,000 150,000,000
Sub- Total 327,348,000 839,407,000 1,166,755,000
Overall total 327,348,000 839,407,000 1,166,755,000

52
WORKS DEPARTMENT (ROADS) PROGRAMME SUMMARY WORK PLAN
Key performance indicators to be Reported in Annual Performance Report
2004 / 2005 Provisional 0utturn
2005 / 2006 Work plan Target
Planned for 2006 / 2007
Total Length of motorable road network (km) 317.1 350.0 380.0
Percentage of road network in good motorable condition (50 kph)
49 52 55
Percentage of road network n fair motorable condition (30 – 50 kph)
28.3 28.0 26.0
Percentage of road network in poor motorable condition (<50 kph)
23.0 20.0 19.0
Key activities and services delivery levels to be reported in quarterly performance reports.
Approved Annual Work plan Targets Details of planned activities
Quarter 1 Quarter 2 Quarter 3 Quarter 4 Total Location/ description Cost
RECURRENT
Length of road routinely maintained
350.0 350.0 350.0 350.0 Feeder roads
DEVELOPMENT
Length of Road Rehabilitated
70.7 17.4 18.1 17.8 Feeder roads
Length of roads built
21.1 9.3 6.8 16.2 Feeder roads
Length of road periodically maintained
2 2 2 2
No. of structural bottlenecks repaired
No. of road bottlenecks repaired
WORKS DEPARTMENT (WATER) PROGRAMME SUMMARY WORK PLAN Key performance indicators to be Reported in Annual Performance Report
2004/2005 Provisional Outturn
2005/2006 Work plan target
Planned for 2006/2007
Planned for 2007/2008
Average no. of water sources per 1000 people in rural areas
1.25 1.4 1.46 1.6
Average no. of water sources per 1000 people in urban areas
Percentage of rural water sources functional at time of spot check
95 95 96 97
Average cost per beneficiary of new water points
57,000 58,000 59,000 60,000
Percentage of households with access to safe sanitation
Percentage of water samples taken that comply with national standards
459 293 200 100
Storage capacity available for water for production
Average deviation in people per water point 30 50 50 50

53
across parishes.
Key Activities and services delivery levels to report in quarterly performance reports.
Approved Annual Work Plan
Details of planned activities
Quarter 1 Quarter 2 Quarter 3 Quarter 4 Total Location/description Cost
RURAL – Recurrent
Number of water points not functioning
40 40 32 32 VARIOUS
RURAL – Development
Number of new point sources constructed
35 28 20 10 VARIOUS
Number of New connections to new and existing piped schemes
Number of existing point sources rehabilitated.
8 8 VARIOUS LOCATIONS
No. of public lavatories constructed
7 VARIOUS LOCATIONS
No. of water user committees
15 15 15 15
WORKS OFFICE WORK PLAN
ACTIVITY DESCRIPTION ACTIVITY ID
TARGET TIMING RESPONSIBLE OFFICER
BUDGET EXPENDITURE TYPE
Use of goods and services
General office running
WOR/OFF1 10 12 months
District Engineer
10,353,000 Recurrent
Use of goods and services
Maintenance of roads in the district
WOR/RB1 12km 12 months
District Engineer
150,000,000 Development
Use of goods and services.
Maintenance of district roads
WOR/RB2 314km 12 months
District Engineer
316,995,000 Recurrent
Use of goods and services
Provision of safe water to communities.
WOR/WS1 7 12 months
District works officer
689,407,000 Development

54
WATER BUDGET
Code AWP Code Details Recurrent Development Total
21 EMPLOYEE COST
211101 wrk/wat14 General staff salaries 24,409,680 0 24,409,680
211103 Wrk/wat1,wrk/wat4 Allowances 57,582,000 4,800,000 62,382,000
Sub –total 81,991,680 4,800,000 86,791,680
22 USE OF GOODS AND SERVICES
221002 Wrk/wat3,wrk/wat15 Workshops and seminars 9,200,000 0 9,200,000
221003 Wrk/wat7 Staff training 5,940,000 0 5,940,000
221008 Wrk/wat15 Computer supplies and information technology(IT)
3,600,000
0
3,600,000
221011 Wrk/wat6,wrk/wat15 Wrk/wat18 Wrk/wat19
Printing , Stationery, Photocopying, and Binding
10,550,000
0
10,550,000
221014 Wrk/wat15 Bank charges and other bank related costs
1,116,000 0 1,116,000
222 COMMUNICATIONS
222001 Wrk/wat15 Telecommunications 4,800,000 0 4,800,000
223 UTILITY AND PROPERTY EXPENSES
223001 Wrk/wat24 Property Expenses 2,400,000 0 2,400,000
223005 Wrk/wat15 Electricity 4,000,005 0 4,000,005
224 Supplies and services
224002 Wrk/wat1,wrk/wat4 Wrk/wat5,wrk/wat10
General supply of goods and services
8,400,000 817,202,000 825,602,000
225 PROFESSIONAL SERVICES
225001 Wrk/wat1,wrk/wat8 Consultancy services – short term
0 85,750,000 85,750,000
227 TRAVEL AND TRANSPORT
227004 Wrk/wat1,wrk/wat4 Fuel , Lubricants and Oils 33,831,000 23,050,000 56,881,000
228 Maintenance
228001 Wrk/wat2 Maintenance- Civil 1,200,000 0 1,200,000
228002 Wrk/wat2 Maintenance – Vehicles 10,133,000 0 10,133,000
228003 Wrk/wat2 Maintenance –Machinery, Equipment And Furniture
5,000,000 0 5,000,000
Sub – Total 100,170,005 926,002,000 1,026,172,005
Overall total 182,161,685 930,802,000 1,112,963,685
MEHANICAL EGINEERING BUDGET Code AWP
Code Details Recurrent Development Total
21 EMPLOYEE COSTS
211 Wrk/me1 General staff salaries 22,134,180 0 22,134,180
Sub – Total 22,134,180 0 22,134,180
223 UTILTIY AND PROPERTY EXPENSES
223001 Wrk/me2 Property expenses 0 60,000,000 60,000,000
Sub – Total 0 60,000,000 60,000,000
Overall total 22,134,180 60,000,000 82,134,180

55
SUMMARY OF REVENUE AND EXPENDITURE STATEMENT
Actual Revenue/ expenditure 2005/2006
Estimated Actual revenue/ expenditure 2006/2007
Code Revenue sources/Departments
Budget 2007/2008
Projected 2008/2009
Projected 2009/2010
REVENUE
441,718,894 687,217,891 Local revenue 162,929,208 167,816,928 172,851,490
16,137,276,936 14,247,461,730 Government grants 15,439,691,391 15,880,200,433 16,365,606,457
1,128,209,351 522,579,400 Donor /NGOs 838,365,026 863,515,977 889,421,457
17,707,294,781 15,457,259,021 Overall total 16,440,985,625 16,911,533,392 17,418,879,404
EXPENDITURE
1,282,516,511 687,333,856 01 Administration 1,479,156,000 1,523,530,680 1,569,236,601
1,719,976,053 1,291,825,429 02 Finance and planning 741,722,246 763,973,914 786,893,132
215,995,475 198,618,800 03 Statutory bodies 247,774,117 255,207,340 265,863,560
541,387,571 752,839,053 04 Production 818,728,200 843,290,046 868,588,747
3,262,932,160 2,552,871,937 05 Health 3,084,967,950 3,177,516,988 3,272,842,497
9,511,837,182 7,853,340,137 06 Education 7,670,775,818 7,900,899,093 8,137,926,066
1,349,052,476 1,272,109,534 07 Works 1,384,005,310 1,425,525,469 1,468,291,233
55,566,710 35,031,173 08 Natural resources 87,261,200 89,879,036 92,575,407
117,355,943 134,516,276 09 Community Bases services
80,296,000 82,704,880 85,186,026
74,703,457 10 Planning 837,298,784 862,417,748 888,290,281
29,568,034 11 Internal audit 7,000,000 7,210,000 7,426,300
18,056,620,081 14,882,752,786 Overall total 16,440,985,625 16,911,533,392 17,418,879,404
Of which
Wages and salaries 9,944,642,640 10,242,981,919 10,550,271,376
Non–wage (recurrent) 3,805,519,985 3,919,685,585 4,037,276,153
Development expenditure
2,690,823,000 2,711,547,690 2,854,694,121
Total 16,440,985,625 16,911,533,392 17,418,897,404
WORKS DEPARTMENT CENTRAL BUDGET
Code Department Amounts
Recurrent Development Total
7 2 Civil 522,262,310 0 522,262,310
7 3 Water 2,000,000 859,743,000 2,000,000
Total 524,262,310 859,743,000 524,262,310

56
WORKS DEPARTMENT CENTRAL BUDGET
Code Details Recurrent Development Total
211102 Contract staff salaries (Incl,casuals,temporary) 0 4,200,000 4,200,000
211103 Allowances 9,460,000 41,442,400 50,902,400
Sub –total 9,460,000 45,642,400 55,902,400
22 USE OF GOODS AND SERVICES 0 0 0
221 General expenses 2,460,000 2,674,900 5,134,900
221001 Advertising and public relations 0 0 0
221002 Workshops and seminars 0 2,120,000 2,120,000
221003 Staff training 0 1,200,000 1,200,000
221008 Computer supplies and information technology(IT) 0 1,800,000 1,800,000
221011 Printing ,stationery, photocopying and binding 1,690,150 3,462,496 5,152,646
221014 Bank charges and other bank related costs 500,000 1,000,000 1,500,000
222001 Telecommunications 0 2,400,000 2,400,000
223 UTILITY AND PROPERTY EXPENSES 600,000 2,000,000 2,600,000
223001 Property expenses 0 663,790,000 663,790,000
224002 General supply of goods and services 1,632,000 0 1,632,000
225001 Consultancy services – short term 0 26,000,000 26,000,000
227004 Fuel ,lubricants and oils 18,126,000 23,184,004 41,310,004
228001 Maintenance – civil 465,894,160 0 465,894,160
228002 Maintenance – vehicles 8,900,000 7,669,200 16,569,200
228003 Maintenance–machinery, equipment & furniture 15,000,000 0 15,000,000
Sub - total 514,802,310 737,300,600 1,252,102,910
231004 Transport equipment 0 74,800,000 74,800,000
231005 Machinery and equipment 0 2,000,000 2,000,000
Sub – total 0 76,800,000 76,800,000
Overall total 524,262,310 859,743,000 1,384,005,310
CIVIL BUDGET
Code AWP code Details Recurrent Development Total
211103 Wrk/civ5 Allowances 9,460,000 0 9,460,000
Sub-total 9,460,000 0 9,460,000
22 USE OF GOODS AND SERVICES
221 Wrk/civ4 General expenses 460,000 0 460,000
221011 Wrk/civ5 Printing, stationery, photocopying and binding
1,690,000 0 1,690,000
221014 Wrk/civ5 Bank charges and other bank related costs
500,000 0 500,000
222 Communications
223 Wrk/civ5 Utility and property expenses 60,000,000 0 60,000,000
224 Supplies and services
224002 Wrk/civ5 General supply of goods and services
1,632,000 0 1,632,000
227004 Wrk/civ5 Fuel ,lubricants and oils 18,126,000 0 18,126,000
228 Maintenance
228001 wrk/civ1,wrk/civ2,wrk/civ3
Maintenance – civil 465,894,160 0 465,894,160
228002 Wrk/civ5 Maintenance – vehicles 8,900,000 0 8,900,000
228003 Wrk/civ6 Maintenance – machinery ,equipment and furniture
15,000,000 0 15,000,000
Sub –total 512,802,310 0 512,802,310
Overall total 522,262,310 0 522,262,310

57
WATER BUDGET
Code AWP code Details Recurrent Development Total 211102 Wrk/wat21 Contract staff salaries(Including, casuals,
temporary) 0 4,200,000 4,200,000
211103 Wrk/wat2 Allowances 0 41,442,400 41,442,400
Sub-total 0 45,642,400 45,642,400
22 USE OF GOODS AND SERVICES
221 Wrk/wat22 Wrk/wat15
General expenses 2,000,000 2,674,900 4,674,900
221002 Wrk/wat12 Workshops and seminars 0 2,120,000 2,120,000
221003 Wrk/wat3 Staff training 0 1,200,000 1,200,000
221008 Wrk/wat15 Computer supplies and information technology(IT)
0 1,800,000 1,800,000
221011 Wrk/wat2 Wrk/wat15
Printing, stationery, photocopying and binding 0 3,462,496 3,462,496
221014 Wrk/wat15 Bank charges and other bank related costs 0 1,000,000 1,000,000
222 Communications
222001 Wrk/wat15 Telecommunications 0 2,400,000 2,400,000
223 Wrk/wat15 Utility and property expenses 0 2,000,000 2,000,000
223001 Wrk/wat1 Property expenses 0 663,790,000 663,790,000
225001 Wrk/wat6 Consultancy services - short term 0 26,000,000 26,000,000
227004 Wrk/wat2 Fuel, lubricants and oils 0 23,184,004 23,184,004
228 Maintenance
228002 Wrk/wat11 Maintenance- vehicles 0 7,669,200 7,699,200
Sub –total 2,000,000 737,300,000 737,300,000
231004 Wrk/wat19 Transport equipment 0 74,800,000 74,800,000
231005 Wrk/wat20 Machinery and equipment 0 2,000,000 2,000,000
Sub-total 0 76,800,000 76,800,000
Overall total 2,000,000 859,743,000 861,743,000

58
SUMMARY OF REVENUE AND EXPENDTIURE STATEMENT FOR FY 2008/09
Actual revenue/ expenditure 2006/2007
Es./actual revenue/ expenditure 2007/2008
Code Revenue sources/ departments
Budget 2008/2009
Projected 2009/2010
Projected 2010/2011
REVENUE
104,819,367 234,253,426 Local revenue 161,313,950 166,153,368 171,137,970
15,213,966,329 15,834,207,664 Government grants 17,431,430,879 17,954,373,805 18,493,005,019
522,579,400 813,756,059 Donor/NGOs 962,763,674 991,646,584 1,021,395,982
15,841,365,096 16,882,217,149 Overall total 18,555,508,503 19,112,173,757 19,685,538,971
EXPENDITURE
692,969,258 1,564,218,259 01 Administration 687,597,502 708,225,427 729,472,189
1,427,182,749 543,917,886 02 Finance 365,872,295 376,848,463 388,153,918
198,618,800 285,194,691 03 Statutory bodies 422,486,434 435,161,027 448,215,858
752,839,053 674,821,810 04 Production 2,084,263,991 2,146,791,911 2,211,195,668
2,594,636,317 2,410,497,826 05 Health 3,236,357,000 3,333,447,710 3,433,451,141
7,673,929,783 8,101,858,973 06 Education 8,143,298,097 8,387,597,040 8,639,224,951
1,312,789,684 1,439,356,617 07 Works 1,334,931,308 1,374,979,248 1,416,228,625
35,031,173 15,772,700 08 Natural resources 354,764,045 365,406,966 376,369,175
134,516,376 48,905,234 09 Community bases services
204,019,995 210,140,594 216,444,813
81,180,737 943,493,822 10 Planning 1,276,273,466 1,314,561,649 1,353,998,499
29,568,034 8,482,000 11 Internal audit 55,474,390 57,138,622 58,852,780
Pallisa town council 390,170,000 401,875,100 413,931,353
14,933,261,964 16,036,519,818 Overall total 18,555,508,503 19,112,173,757 19,685,929,406
O/w Wages and salaries 10,433,527,577 10,746,533,403 11,068,929,406
Non wage(recurrent) 4,164,645,926 4,298,585,304 4,418,336,702
Development expenditure
3,957,335,000 4,076,055,050 4,198,336,702
Total 18,555,508,503 19,112,173,757 19,685,538,971
WORKS DEPARTMENT AND SECTOR BUDGET
Code Department Amounts
Recurrent Development Total
7 0 Works
7 1 Works office 145,437,808 0 145,437,808
7 2 Civil 355,968,500 0 355,968,500
7 3 Water 0 810,025,000 810,025,000
7 4 Mechanical engineering 23,500,000 0 23,500,000
Total 524,906,308 810,025,000 1,334,931,308
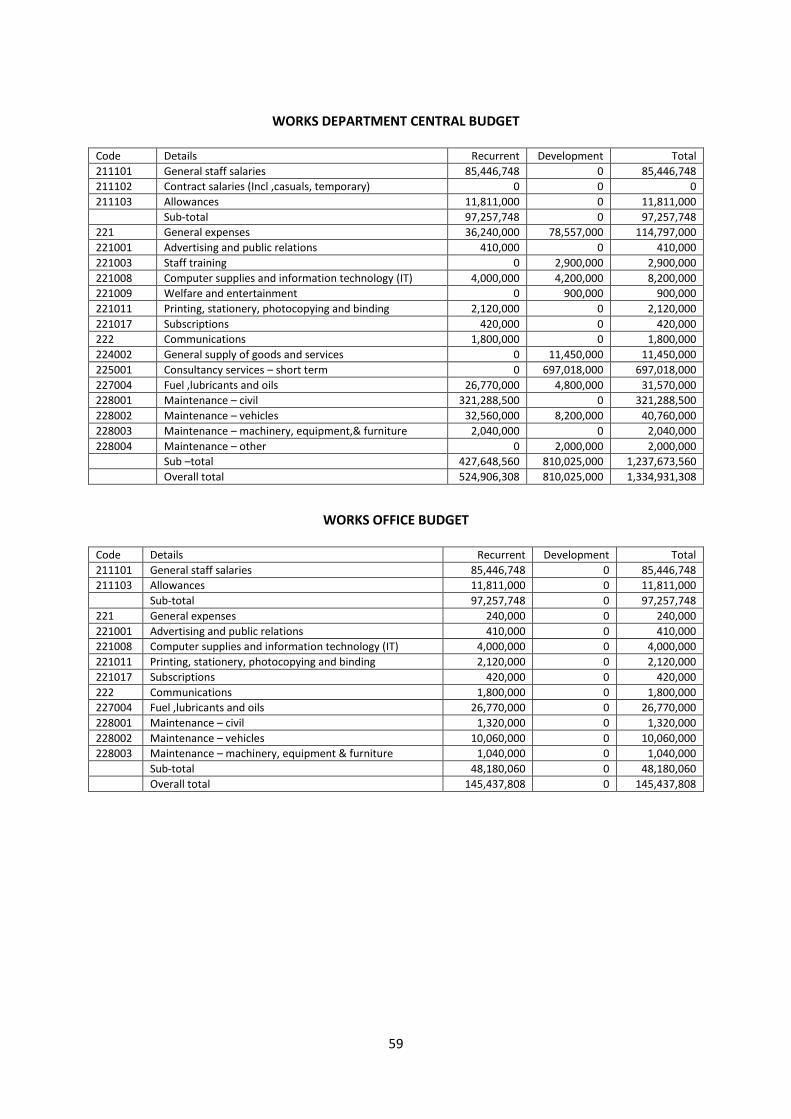
59
WORKS DEPARTMENT CENTRAL BUDGET
Code Details Recurrent Development Total
211101 General staff salaries 85,446,748 0 85,446,748
211102 Contract salaries (Incl ,casuals, temporary) 0 0 0
211103 Allowances 11,811,000 0 11,811,000
Sub-total 97,257,748 0 97,257,748
221 General expenses 36,240,000 78,557,000 114,797,000
221001 Advertising and public relations 410,000 0 410,000
221003 Staff training 0 2,900,000 2,900,000
221008 Computer supplies and information technology (IT) 4,000,000 4,200,000 8,200,000
221009 Welfare and entertainment 0 900,000 900,000
221011 Printing, stationery, photocopying and binding 2,120,000 0 2,120,000
221017 Subscriptions 420,000 0 420,000
222 Communications 1,800,000 0 1,800,000
224002 General supply of goods and services 0 11,450,000 11,450,000
225001 Consultancy services – short term 0 697,018,000 697,018,000
227004 Fuel ,lubricants and oils 26,770,000 4,800,000 31,570,000
228001 Maintenance – civil 321,288,500 0 321,288,500
228002 Maintenance – vehicles 32,560,000 8,200,000 40,760,000
228003 Maintenance – machinery, equipment,& furniture 2,040,000 0 2,040,000
228004 Maintenance – other 0 2,000,000 2,000,000
Sub –total 427,648,560 810,025,000 1,237,673,560
Overall total 524,906,308 810,025,000 1,334,931,308
WORKS OFFICE BUDGET
Code Details Recurrent Development Total
211101 General staff salaries 85,446,748 0 85,446,748
211103 Allowances 11,811,000 0 11,811,000
Sub-total 97,257,748 0 97,257,748
221 General expenses 240,000 0 240,000
221001 Advertising and public relations 410,000 0 410,000
221008 Computer supplies and information technology (IT) 4,000,000 0 4,000,000
221011 Printing, stationery, photocopying and binding 2,120,000 0 2,120,000
221017 Subscriptions 420,000 0 420,000
222 Communications 1,800,000 0 1,800,000
227004 Fuel ,lubricants and oils 26,770,000 0 26,770,000
228001 Maintenance – civil 1,320,000 0 1,320,000
228002 Maintenance – vehicles 10,060,000 0 10,060,000
228003 Maintenance – machinery, equipment & furniture 1,040,000 0 1,040,000
Sub-total 48,180,060 0 48,180,060
Overall total 145,437,808 0 145,437,808

60
CIVIL BUDGET
Code Details Recurrent Development Total
221 General expenses 36,000,000 0 36,000,000
228001 Maintenance – civil 319,968,500 0 319,968,500
Sub-total 355,968,500 0 355,968,500
Overall total 355,968,500 0 355,968,500
Code Details Recurrent Development Total
221 General expenses 0 78,557,000 78,557,000
221003 Staff training 0 2,900,000 2,900,000
221008 Computer supplies and information technology(IT) 0 4,200,000 4,200,000
221009 Welfare and entertainment 0 900,000 900,000
224002 General supply of goods and services 0 11,450,000 11,450,000
225001 Consultancy services –short term 0 697,018,000 697,018,000
227004 Fuel, lubricants and oils 0 4,800,000 4,800,000
228002 Maintenance – vehicles 0 8,200,000 8,200,000
228004 Maintenance – other 0 2,000,000 2,000,000
Sub-total 0 810,025,000 810,025,000
Overall total 0 810,025,000 810,025,000
MECHANICAL ENGINEERING BUDGET
Code Details Recurrent Development Total
228002 Maintenance – vehicles 22,500,000 0 22,500,000
228003 Maintenance – machinery, equipment & furniture 1,000,000 0 1,000,000
Sub-total 23,500,000 0 23,500,000
Overall total 23,500,000 0 23,500,000
District PALLISA
2005/20
06
2006/2007
2007/2008
2008/2009
Estimate
(000shs)
Actual
(000shs)
Estimate
(000shs)
Actual
(000shs)
Estimate
(000shs)
Actual
(000shs)
Estimate
(000shs)
Actual
(000shs)
Capital
Development
255789 255789 167894.357 167894.357 157845.561 157845.561 237372.65 237372.65
Recurrent 42250 34956 40000 36312 38500 98590.45 42877.2 36200
Total 298039 290745 207894.357 204206.357 196345.561 256436.011 280249.85 273572.65
Sub-counties
Agule 23887.95 22919.289 23450.263 22354.194 19885 16339.068 29914 28515.341
Kagumu 15391.93 11319.848 19984.764 18582.18 13954 11478.753 21026 20042.908
Kibuku 13728.62 11623 16409.257 16459.5 15566 12606.501 19547 18633.06
Petete 15586.30
3
11062.213 17886.1 17436.1 13690 11262.472 20629 19664.47

61
ANNEX 5: PROCUREMENT: APPROVED LIST OF REGISTERED CONTRACTORS AND SUPPLIER 2008/9 Name of firm Physical/postal address, Tel: contacts Name of Director
Construction/renovation of buildings
Patmo General Consult P.O Box 311564,Kampala, Or Box 275,Pallisa. Kasingiri Peter
Grace Contractors & General Traders P.O Box 125, Pallisa, Tel;0772-410793 Mudangha John
Kaderuma Women & youth Association
P.O Box 125 Pallisa, Tel;0772-410793 Mayende Peter
K.S General Associates P.O Box Pallisa Tel:0772-665218 Mayende Peter
F.G Enterprises P.O Box 129,Pallisa0772-686672 Adongot George
Muhumuza General Enterprises P.O Box 64 BudakaTel:0752586303 Nabale Nuhu, Mwambala Amos
Naita Service Delivery P.O Box 187,PallisaTel:0782496113 Naita Kenneth
Muweko Enterprises P.O Box 320 MbaleTel:0392960698 Koloto George, Wekhola
JEO Engineers& Planners P.O Box 192, Pallisa Tel:0752-520293 Omado Enock
Ogutu General Traders & Contractors
P.O Box 60 Bridget Namugere
Express Builders & Constructing Works ltd
Kakoro Traders centre P.O Box 2390,Mbale Mugala Topy
Kefa Brothers ltd P.O Box 228,Mbale Nayepe Sam
Namac & Contractors General Supplies
P.O Box 116,Pallisa Namansa Charles
Falasiko Buluka & Co.ltd P.O Box Tirinyi, PallisaTel:0714981977 Mbozi George
Mugotex General Enterprises P.O Box 110,KadamTel:0774986598 Musyoya
Butebo Tweweyo Traders P.O Box Butebo, Pallisa Tweweyo Achila Absa
Balala Contractors P.O Box Pallisa Wabwire James
Agule Builders P.O Box Pallisa Okello Deogracious
Tawfique Enterprises P.O Box 33 ,BudakaTel:0774773189 Kerekere Elias
African United Co P.O Box 80 Pallisa Hajji Ibrahim Aisu
Women Effort P.O Box 183, Akisim Butebo, Pallisa Tel:0774927554 Mudondo Jane
Roads above 40 metres
Khabusi Building Contractors & Furniture Centre ltd
P.O Box 2534,PallisaTel:0772462189 Khayiti Andrew
Tebex Superior Services P.O Box 8976,PallisaTel: 0772471073 Katebala Isaac
Roone Engineering Co. ltd P.O.Box15,PallisaTel:0752454366 Oriebo -Orone
Attiba Constructing Co. Ltd P.O Box 335,Tororo.Plot 1-3 Tagore RD, Tel:0782135400/0752595688
Osuna Otwani
Ventures Contractors Ltd PO Box 574, BusiaTel:0772440345 Wandera Geofrey
Roads below 40 metres
Grace Contractors P.O Box 125,Palisa Luvunia Robert
Boys Effort P.O Box 80,PallisaTel:0772626795 Pande Akim
Muweko Enterprises P.O Box 320,MbaleTel:0392960698 Mukhwana, Wekhola, Korota
Koire Enterprises P.O Box 72,BudakaTel:0774506867 Koire Victor
Express Builders & Contracting Kakoro Trading CentreP.O Box 2390,Mbale Mugala Topy

62
Name of firm Physical/postal address, Tel: contacts Name of Director
Engineering Works Ltd
Mogotex General Enterprise P.O Box 110,KadamaTel:0774981977 Musyoya Moses
Falasiko Baluka & Co ltd P.O Box Tirinyi, Pallisa Tel:0714986598 Mbozi .G
Naita Service Delivery P.O Box 187,Pallisa Tel:0782496113 Naita Kenneth
Umoja Company Ltd P.O Box 56,Pallisa Fatuma Kambo
Balala Contractors P.O Box 262,Pallisa Wabwire James
Roone Engineering Co. Ltd P.O Box 15,Pallisa Oriebo Orone
Rehabilitation of roads (labour based technology)
Khabusi Building Contractors & furniture Centre Ltd
P.O Box 2534,MbaleTel: 077246189 Khayeki Andrew
Rock Century Works Ltd P.O Box 9,TororoTel:0772525651 Teresa Olowo
Roone Engineering Co. Ltd P.O Box 15,PallisaTel:0752454366 Oriebo Orone
Supply of fuel and other lubricants
1 Hared Petroleum Ltd P.O Box 2804,KampalaTel:041269305 Yahaya Yusuf
Supply of drugs and other sundries
1 Health Care (U) Unit Ltd
2 Sky Pharmacy Ltd Plot No 28. Republic StreetP.O Box 1801,Mbale, Fax:0453400,Tel:0772427247
Salim Andani, Firoz Andani, Ruina Andani
Supply & repair of office equipment
1 BGA CONSULT Ltd P.O Box 35657,KampalaTel:0772607031/0774s043510 Mulosi Bahati Gaddie Gareeba
2 FMI Office System ltd P.O Box 794,Kampala Israel Koboi
3 Namanyi Investments Ltd P.O Box 27406,KampalaTel:0772843206 Wafula Stephen
General printing
1 S. H. Self Help Agencies P.O Box 28550,Kampala Musihko Ali
2 Namanyi Investments Ltd P.O Box 27406,KampalaTel:0772843206 Wafula Stephen
Grading sanitary lanes in Pallisa Town Council
1 Pallisa Integrated Contractors P.O Box 39,PallisaTel:0782209692 Abdallah Akim
Routine maintenance of Pallisa Town Council
1 Aisu Business Link P.O Box 256 Pallisa
Catering services
1 Combined Restaurant & take Away
P.O Box 155, PallisaTel:0392837089/0782840620 Opolot , Frank
Supply of agricultural inputs
1 Express Builders and Contractors
Kakoro Trading Centre P.O Box 114,Pallisa Tel:0754606021 Magala Toppy
2 Time Travel Group Ltd P.O Box107,Pallisa Mezei John Baptist
3 Bukutu General Enterprises P.O Box 116,PallisaTel:0772319605/ 070312160 Mayanja Idi Mubarak

63
Name of firm Physical/postal address, Tel: contacts Name of Director
4 Shamila Contractors P.O Box 1989,MbaleTel:0772556121/075556121 Hirome Muzamil
5 Haruna & Sons Enterprises P.O Box 315,PallisaTel:0774181370 Haruna Sirikye
6 Bangibasa General Enterprises P.O Box KabwangasiTel:0782235282 Nanzala Loy ,Sanja Yoweri
7 Mima Enterprises P.O Box 158,PallisaPlot 24,Pallisa Abdu Sizomu
8 Chickooku General Agencies P.O Box 2328,MbaleTel:0772694812/523353 Madanda Azizi
9 Ekonyelet Enterprises C/O P.O Box 129,Pallisa Adongot
Drilling of boreholes
1 China Geo Engineering Cooperation(U) Ltd
P.O Box 27782Kampala Plot,5,Charles IwangaRDTel:0392715498
Chen Xia
2 Royal Techno IndustriesLtd P.O Box 23009,Kampala,Tel:0782905839/0772319130 Y. Prasada Reddy
3 KLR (u) Ltd P.O Box 32370,KampalaTel:256782205498 K.V Neddy
4 BIK Water System P.O Box 28665,Kampala Tel:256772368308 Fred Isingoma
5 Galaxy Agro Tech P.O Box 36164,Kampala Tel:256414378891Fax:256414378203
Hitesh Patet
6 Sumadhura echnologies Ltd P.O Box 23456,Kampala Vankateshwar Reddy
7 Hippo Technical Service P.O Pallisa Sembali Gracious
Casting & installation
1 Mbojja Enterprises P.O Box 85, Jinja Mbojja Yonna
Protection of springs
1 Grace Contractors & General Traders
P.O Box 125,Pallisa Luvunia Robert
2 Namoli Mult Contractors P.O Box 1485,Mbale Sabadu Abasa
Supply of stationary
1 JBP MILLER P.O Box 119,Pallisa Tel:07722471865/686817 Balyaki John Patrick
Construction of pit latrines
1 Patmo General Consult P.O Box 275,Pallisa Kasingirizi Peter
2 Talimb (U) Ltd P.O Box 323,Kampala Tel:0782400147/0774326713
Hydro geological surveys & supervision of drilling of boreholes
1 Kasodo General Enterprises P.O Box 70,Pallisa Tel:077208962 Lajja Herbert
2 L HM Ground Water & Geo Mapping
P.O Box 29084,KampalaTel:0774049238 Nambale Dennis
3 Fels Consultants Ltd P.O Box 33436,Kampala Mukose George
Supply of office & school furniture
1 Time Travel Group P.O Box 107, Pallisa Mezei John Baptist
2 Nyaira (U) Ltd P.O Box 298,Pallisa Asio Luzira
3 Naita Service Delivery P.O Box 187,PallisaTel:0782496113 Naita Kenneth Ziwa Robert
4 Grace Acom Family Trading P.O Box 19,Pallisa Grace Acom
5 Hamp General Enterprises P.O Box Pallisa Okoboi John
Supply of food to Pallisa Hospital

64
Name of firm Physical/postal address, Tel: contacts Name of Director
1 Africa United CO P.O Box 80,Pallisa Haji Ibrahim Asiu
Routine maintenance of roads (labour based)
1 Kamya & Sons P.O Box kamuge, Pallisa Apio Syvia
2 Mpola-Mpola Youth Association. P.O Puti-Puti,Pallisa Tel:0774075210 Mpyagu James
3 Nyairu (U) Ltd P.O Box 298,Pallisa Asio Luzira
4 Mugotex General Enterprises P.O Box 110,KadamaTel:0774986598 Musyoya
5 Pallisa Kob P.O Box 80,Pallisa Kapata Yusuf
6 Muhazed General Enterprises P.O Box 64,Budaka Tel:0752586303 Naleba Nuhu,Mwambala Amos
7 Akibba Construction Co. Ltd P.O Tirinyi, Pallisa Walujo Larance
8 Kawangasi General Enterprises P.O Box 2423,MbaleTel:0772957200 Kiwere Robert
9 Jafferico Contractors KaderunaT/C,P.O ,allisa.Tel:0782341296 Bumba Jafari
10 Naka and Sons P.O Pallisa Nakeba Ali
11 Samo General Enterprises P.O Box 325,Pallisa Kungu S
12 Mima Enterprises P.O Box 158,Pallisa, Plot 24,Pallisa Abdu Sizomu
13 Zeries Nghire Enterprises P.O Box 118,Pallisa Areto Moses
14 Naita Service Delivery P.O Box 187,Pallisa, Tel:0782496113 Naita Kenneth Ziwa Robert
15 Batuta Technical Services P.O Box Pallisa Mukisa Denial
16 Bakabala Women Association P.O Pallisa, Tel:0774285456 Asiu Florence
17 Bangibasa General Association P.O Kabwangasi Pallisa, Tel:078223582 Sanya Yoweri
18 Kaderuna Women And Youth Association
P.O Box 125,Pallisa, Tel:0772410793 Mayende Peter
19 Express Builders Kakoro Trading Centre, P.O Box 2390,Mbale Mugula toppy
20 Patmo General Enterprises P.O Box 275,Pallisa Kazingirizi Peter
21 Women’s Effort P.O Box 185,Pallisa Mudondo Jane
22 Grace Achom Contractors P.O Box Pallisa Grace Acom
23 Soak Brothers P.O Box 116,Pallisa, Plot 101,Gogonyo Road Bingi Abdallah
24 Guma Technical services P.O Box 305,Pallisa Hakim Omaido, Kaganya Isaac
25 General purpose Contractors P.O Pallisa Kabajjah Henry
26 Daaki United co P.O Box 136,Pallisa Kauta. M
27 Kamuge United Buliso -Puti-Puti, P.O Box Pallisa Boole Moses
28 Okanga Kizige & Sons P.O Pallisa Okanga Mwatitibi
29 Ogarama and Brothers P.O Box 60,Pallisa Ogarama Sulayman Mugalya
30 Umoja Co. P.O Box 292,Pallisa Kambo Fatuma
Cleaning of Pallisa Hospital (internal and external)
1 Rissal Technical services Rissal
2 Omatala Women’s Association P.O Box Pallisa Tel:0772626775 Pande .B
Source: Pallisa District Procurement Office

65
ANNUAL DISTRICT ROAD WORKPLAN –TOTAL UNDISTRIBUTED EXPENSES
Line Reference Expenditure Item
Total cost
Planned Monthly Expenditure (Ush 000 )
July Aug Sept Oct NOV Dec Jan Feb March
April May June
1 Form D4 Office supply 3,610 245 830 85 830 315 55 385 280 85 185 640 135
2 Form D5 Major Schedule Procurement
0 0 0 0 0 0 0 0 0 0 0 0
3 Form D6 General Admin. expenses
67,517
5,405
5,655
5,593
5,115
5,843
5,115
5,115
5,593
5,365 5,115
5,593
5115
4 Bank charges
0 0 0
Total Undistributed expenses 71,127
5,650
6,485
5,678
5,945
6,158
5,170
5,500
5,873
5,450 5,300
6,233
5,250
Routine Maint.(RM)
Periodic Maint.(PM)
Rehabilitation (RH)
Road Bottleneck
(SR)
Structure Bottlenecks
(ST)
Sub-total
(All Works)
PAF-1 151,875 _ _ _ 151,875 49,179 201,054
PAF-2 _ 195,329 _ _ 7,745 203,074 13,459 216,533
PAF-3 _ _ _ _ _
Local Gov’t. Dev. Fund
_
35,650 _
_
35,650 4,350 40,000
Donor-DANIDA
_ _
200,000 _ _ 200,000 _ 200,000
Equalisation Grant
_
69,000 _
_
_
69,000 _
69,000
PLG _ _ _ 6,214 _ 6,214 4,139 10,353
PMA _ _ _ 8,000 _ 8,000 8,000
Total 151,875 299,979 200,000 14,214 7,745 673,813 71,127 744,940
FY 2005/06 ANNUAL DISTRICT ROAD WORKPLAN-ESTIMATE FOR OFFICE SUPPLIES Form D 4
Item Qty Unit Price (Ush)
Total Cost
Planned Monthly Expenditure (Ushs 000)
July Aug Sept Oct
Nov Dec Jan Feb Mar Apr May June
1 Photocopying study
50 Rms
10,000 500 30 50 50 50 30 50 30 40 50 50 50 20
2 Calculators 4 No 30,000 120 120
3 Assorted office stationary
(stapler, staples etc )
Item 100 30 50 20 50
4 File folders 300 No
300 90 15 15 20 5 5 5 5 5 15
5 Box file 40 No 5,000 200 20 20 20 30 20 20 30 20 20
6 Printers 4 No. 250,000 1,000 250 250 250 250
10 Binding Services
200pcs 4,000 800 200 160 80 80 80 120 80
11 Photocopying Services
Item 800 200 200 200 200
TOTAL 3,610 245 830 85 420 315 55 385 280 85 185 640 135

66
PALLISA DISTRICT FY 2005/6 ANNUAL DISTRICT ROAD WORKPLAN – GENERAL ADMINSTRATIVE EXPENSES, Ushs ‘000
Item Qty Unity Price
Total Cost
Planned Monthly Expenditure July Aug Sept Oct Nov Dec Jan Feb Mar April May June
Diesel(Supervision & Office runs)
16,440L 1,770 29,098.8 2,424.9 2,424.9 2,424.9 2,424.9 2,424.9 2,424.9 2,424.9 2,424.9 2,424.9 2,424.9 2,424.9 2,424.9
Petrol (Supervision) 3,840L 2,020 7,756.8 646.4 646.4 646.4 646.4 646.4 646.4 646.4 646.4 646.4 646.4 646.4 646.4
CDO, EO, Gender off .etc
1,080L 1,770 1,911.6 478 478 478 478
Safari day allowances Item 12,000 1,000 1,000 1,000 1,000 1,000 1,000 1,000 1,000 1,000 1,000 1,000 1,000
Night Allowances 60 No. 90,000 5,400 450 450 450 450 450 450 450 450 450 450 450 450
Computer and Photocopier repairs
Item 750 250 250 250
Repairs of supervision Transport
Item 10000 833 833 833 833 833 833 833 833 833 833 833 833
Tele/E-mail/Fax/Water services
Item 600 50 50 50 50 50 50 50 50 50 50 50 50
Total 67,517.2 5,404.63 5,654.63 5,592.53 51,14.63 5,842.53 5,114.63 5,114.63 5,592.53 5,364.63 5,114.63 5,592.53 5,114.63

67
ANNUAL DISTRICT ROAD WORKPLAN –TOTAL UNDISTRIBUTED EXPENSES, 2005/6 Ush ‘000
Line Reference Expenditure Item
Total cost
Planned Monthly Expenditure
July Aug Sept Oct Nov Dec Jan Feb March April May June
1 Form D4 Office supply 3,610 245 830 85 830 315 55 385 280 85 185 640 135
2 Form D5 Major Schedule Procurement
0 0 0 0 0 0 0 0 0 0 0 0
3 Form D6 General Admin. expenses
67,517 5,405 5,655 5,593 5,115 5,843 5,115 5,115 5,593 5,365 5,115 5,593 5115
4 Bank charges 0 0 0
Total Undistributed expenses 71,127 5,650 6,485 5,678 5,945 6,158 5,170 5,500 5,873 5,450 5,300 6,233 5,250
ACTIVITY –WISE SUMMARY OF BUDGET FY2006/7-PALLISA
Funding Source
Road Work Expenditure ‘000 UGX Operational Budget
Operational Bgt. in %
Annual Bgt.
Works + opr.
BUDGET CEILING Routine Periodic Rehab Rd.BNeck St.BNeck Total
PAF-1 90,796 90,796 16,023 15.0 106,819 106,819
Donor-DANIDA
200,000 200,000 200,000 200,000
Donor-USAID
836,921
Equalisation Grant
89,000 89,000 89,000 89,000
FDS 10,159 18,335 40,962 2,400 3,400 75,256 13,280 15.0 88,536 88,536
Local revenue
8,000 100.0 8,000 8,000
Sub-Total: 100,955 107,335 240,962 2,400 3,400 455,052 37,303 7.6 492,355 1,329,276

68
ANNUAL WORKPLAN FOR FY2006/07 –PALLISA
Item Qty Unit Price
Total Cost
July Aug Sept Oct Nov Dec Jan Feb Mar April May June
1 Photocopying Study 40Rms 1,000 400 30 40 30 20 10 50 30 40 50 50 50
2 Calculators(office) 30 30
3 Assorted office stationery
(Stapler, staples etc ) Item 81 20 41 20
4 Files 100 No
300 30 5 5 - 5 5 5 5
5 Box files 20 No 5,000 100 20 20 20 20 20
6 Printer Cartridges/photo
3 No 250,000 750 250 - 250 250
10 Binding/photocopying 50pcs 6,000 300 150 50 50 50
TOTAL 1,691 185 360 35 131 15 50 355 60 75 105 320
ANNUAL WORKPLAN-GENERAL ADMINISTRATIVE EXPENSES FY2006/07 Item Qty Unit
Price Total cost
Planned Monthly Expenditure (Ush 000)
July Aug Sept Oct Nov Dec Jan Feb Mar April May June
Diesel (supervision & office runs) 5100L
2,000 10200
850 850 850 850 850 850 850 850 850 850 850 850
Petrol(supervision) 2503L
2,300 5756.8
479.7
479.7
479.7
479.7
479.7
479.7
479.7
479.7 479.7
479.7 479.7
479.7
CDO, EO, Gender off. etc 815L 2,000 1630 408 408 408 408
Safari day allowances Item 8576 715 715 715 715 715 715 715 715 715 715 715 715
Night allowances 40 No
90,000
3500 291.7
291.7
292 292 292 292 292 292 292 292 292 292
Computer and photocopier repairs Item 750 250 250 250
Repairs of supervision Transport Item 5000 1250
1250
1250
1250
Tele/Email/Fax/Water services Item 200 16.7 16.7 17 17 17 17 17 17 17 16.7 17 17
Total 35,612.4
2,352.7
3,852.7
2,760.2
3,602.7
3,010
3,602.7
2,352.7
2,760.2
3,852.7
2,352.7
2,760.2
2,352.7

69
ANNUAL WORKPLAN FY2006/07 TOTAL UNDISTTRIBUTED EXPENSES Line Reference Expenditure Total cost Planned Monthly Expenditure (Us 000)
July Aug Sept Oct Nov Dec Jan Feb Mar Apr May June
1 Form D4 Offices 1691 185 360 35 131 15 50 355 6 75 105 320
2 Form D5 Major S - 0 0 0 0 0 0 0 0 0 0 0 0
3 Form D6 General 35,612 2,353 3,853 2,760 3,603 3,010 3,603 2,353 2,760 3,853 2,353 2,760 2,353
0 0 0
Total Undistributed expenses 37,303 2,538 4,212 2,795 3,734 3,025 3,653 2,708 2,820 3,920 2,458 3,080 2,353 FY 2007/8 ADRWP-Budget QUARTERY BUDGET SUMMARY Form D3.b
Funding source 1st quarter 2nd Quarter 3rd Quarter 4th Quarter
Works Operational
Total Works Operational Total Works operational Total Works 0perational Total
PAF-1 37,115 6,812 43,927 22,988 4,548 27,536 39,535 4,812 44,347 18,558 4,686 23,244
PAF-2 4,9243 3,950 53,193 40,379 3,950 44,329 3,950 3,950 3,966 3,966
PAF-3
Local Govt. Dev.Fund 22,106 19,159
Donor-DANIDA 84,172 52,830
Local Revenue 850 850 6,000 0 6,850 850 850 994 994
Other
Total for Quarter: 204,248 150,704 49,147 28,204
Cumulative Qrtr’ly Total 204,248 354,952 404,099 432,302
Cumulative Qrtr’ly % 47.2 82.1 93.5 100
PALLISA DISTRICT FY 2007/08 ANNUAL DISTRICT ROAD WORKPLAN – ESTIMATE FOR OFFICE SUPPULIES (FORM D4) (Ushs’000) Item Qty Unity
Price Total cost
Planned Monthly Expenditure
July Aug Sept Oct Nov Dec Jan Feb Mar Apr May June
1 Photocopying study 30Rms 10,000 300 40 30 20 10 30 40 30 40 40 20
2 Calculators(office) 2No. 40,000 80 80
3 Assorted office stationary
(stapler, staples etc ) Item 81 - 20 - 41 - - - 20 - - - -
4 File folders 100 No. 300 30 5 5 - 5 - 5 5 5 -
5 Box files 20 No 4,500 90 - 20 - 20 - - 20 20 - 20 -
6 Printer Cartridges/Photocopier 3 No. 250,000 750 250 - 250 250
10 Binding 50 pcs 6,000 300 100 - 50 - - 50 - 50 - 50
-
TOTAL 1,631 105 410 35 131 15 30 352 60 55 95 310 70

70
ANNUAL DISTRICT WORKPLAN –GENERAL ADMINISTRATIVE EXPENSES FY2007/08: FORM D6, PALLISA DISTRICT
Item Qty Unity Price
Total cost
Planned monthly expenditure
July Aug Sept Oct Nov Dec Jan Feb Mar Apr May June
Diesel(supervision & office runs)
5000L 2,100
10500.0 875.0 875.0 875.0 875.0 875.0 875.0 875.0 875.0 875.0 875.0 875.0 875.0
Petrol (supervision) 2703L 2,200
5946.6 495.6 495.6 495.6 495.6 495.6 495.6 495.6 495.6 495.6 495.6 495.6 495.6
CDO, EO, Gender off. etc)
800L 2,100
1680.0 420 420 420 420
Safari day allowances
Item 7400 617 617 617 617 617 617 617 617 617 617 617 617
Night allowances 32No. 80,000
2560.0 213.3 213.3 213.3 213 213 213 213 213 213 213 213 213
Computer and photocopier repairs
Item 1000.0 - 250.0 250 - 250 - - - 250 -
Repairs and servicing of supervision Transport
Item 7000.0 583 583 583 583 583 583 583 583 583 583 583 583
Tele/E-mail/fax/water services/electricity
Item 600.0 50.0 50.0 50 50 50 50 50 50 50 50 50 50
Total 36686.60 2833.88 3083.88 3253.88 3083.88 3253.88 2833.88 3083.88 3253.88 2,833.9 2,833.9 3503.88 2833.88
PALLISA DISTRICT ANNUAL DISTEICT ROAD WORKPLAN –TOTAL UNDISTRIBUTED EXPENSES FY 2007/08
Line Expenditure Item
Total cost (Ush 000)
Planned Monthly Expenditure (Ush 000)
July Aug Sept Oct Nov Dec Jan Feb Mar April May June
1 Form D4: Office Supplies 2,380 133 541 63 121 283 111 108 301 71 173 326 151
2 Form D5:Schedule of procurement 6,840 2,420 2,900 1,520
3 Form D6:Administrative Expenses 47,421 3,816 3,876 4,164 3,901 4,209 3,831 3,816 4209 3,831 3,816 4,209 3,746
Total : Undistributed expenses 56,641 3,949 6,836 4,227 6,921 4,492 3,941 3924 4,501 3,901 3,989 6,055 3,896
15,012 15,355 12,335 13,940

71
ANNUAL BUDGET FOR ROADWORKS –PALLISA DISTRICT SUMMARY (Ushs‘000)
FS Code
Funding Source Routine Periodic Rehabilitation Rd. B/Neck St. B/Neck Budget Ceiling
001 PAF-1 155,402 49000 204,402
002 PAF-2 110,314 110,314
003 PAF-3
004 Local Govt.Dev.Fund
2,180 2,180
005 Donor-DANIDA 343,161 343,161
011 Donor-PMA 3,999 3,999
Total 155,402 112,494 343,161 3,999 49,000 664,056
ANNUAL DISTRICT ROAD WORKPLAN ESTIMATE FOR OFFICE SUPPLIES FOR FY2008/9 (Ushs ‘000)
Item Qty Unit Price
Total Cost
Planned Monthly Expenditure
July Aug Sept Oct Nov Dec Jan Feb Mar April May June
1 Photocopying study –(Rms) 27 10 270 30 30 30 30 30 30 30 30 30
2 Calculators (office) – (No.) 2 30 60 60 -
3 Assorted office stationery(, note bks ,pen, punching, stapler, staples etc)-(Ls)
1
180
- 180
-
60
-
-
60
-
-
60
-
4 News studys 207 1.2 248 20.7 20.7 20.7 20.7 20.7 20.7 20.7 20.7 20.7 20.7 20.7 20.7-
5 Flash disks 2 50 100 100
6 File folder 124 0.5 62 12.4 12.4 - 12.4 - 12.4 12.4 - -
7 Box file 20 5 100 - 5 15 - 25 -
8 Printers cartridges/Photocopier-(No)
4 250 1000 -
250 - 250 250 250
9 Binding/photocopying services- (copies)
120 3 360 100 - - 55 - - 55 - - 50 100
Total 2380 133 541 63 121 283 111 108 301 71 173 326 151

72
ANNUAL DISTRICT ROAD WORKPLAN –MAJOR SCHEDULE PROCUREMENT FOR FY2008/9, (Ushs ‘000) No. Item Qty
Km/No Unit Price
Total cost
Planned Monthly expenditure
July Aug Sept Oct Nov Dec Jan Feb Mar April May June
1 Printing of MMS booklets 60 15
900
900
2 Laptop 1
2,900
2,900
2,900
3 Vehicle Tyres 8
380
3,040
1,500 ¤ 1,520
TOTAL 6,840
- 2,900 - 2,900 - - - - - - 1,520 -
PALLISA DISTRICT ANNUAL DISTRICT WORKPLAN-GENERAL ADMINISTRATIVE EXPENSES FOR FY 2008/09 FORM: D6 , Ushs ‘000
No. Item Qty Unit price
Total Cost
Planned Monthly Expenditure July Aug Sept Oct Nov Dec Jan Feb Mar April May June
1 Diesel (supervision & office running ) –Ltrs
6040 2.7 16,308 1359 1359 1359 1359 1359 1359 1359 1359 1359 1359 1359 1359
2 Petrol (supervision) – Ltrs 2710 2.8 7588 632 632 632 632 632 632 632 632 632 632 632 632
3 CDO, Aud. EO, Gender off. Etc Ltr 620 2.7 1674 419 419 419 419
4 Safari Day Allowances – LS 1053 7 7371 614 614 614 614 614 614 614 614 614 614 614 614
5 Night Allowances – No 33 80 2640 220 220 220 220 220 220 220 220 220 220 220 220
6 Professional & subscriptions/ ship members fees
1 420 420 105 105 105 7 Computer & Photocopier repairs -LS 1 340 340 85 85 85 85 8 Service & Repairs of supervision
Transport –LS 1 7020 7020 585 585 585 585 585 585 585 585 585 585 585 585
9 Maintenance of the HB solar system 1 700 700 175 175 175 175 10 Maintenance –office premises 1 600 600 150 150 150 150
11 12
Maintenance –office compound 1 720 720 60 60 60 60 60 60 60 60 60 60 60 60 Sandries & toiletries 1 240 240 20 20 20 20 20 20 20 20 20 20 20 20
13 Tele/Email/Fax/Water/Internet/Elect. Services –LS
1 1800 1800 150 150 150 150 150 150 150 150 150 150 150 150
Total 47421 3815.58
3875.58
1164.08
3900.58 4209.08 3830.58 3815.58
4209.08
3830.6 3815.6 4209.08
3745.58

73