uganda agriculture public expenditure review - world...
TRANSCRIPT
Report No. 53702-UG
UGANDA:
AGRICULTURE PUBLIC EXPENDITURE REVIEW
February 28, 2010
Agriculture and Rural Development Unit (AFTAR)
Sustainable Development Department
Country Department 1: Tanzania, Uganda and Burundi
Africa Region
Document of the World Bank
Pub
lic D
iscl
osur
e A
utho
rized
Pub
lic D
iscl
osur
e A
utho
rized
Pub
lic D
iscl
osur
e A
utho
rized
Pub
lic D
iscl
osur
e A
utho
rized
Pub
lic D
iscl
osur
e A
utho
rized
Pub
lic D
iscl
osur
e A
utho
rized
Pub
lic D
iscl
osur
e A
utho
rized
Pub
lic D
iscl
osur
e A
utho
rized

ii
All rights reserved:
This volume is a product of the staff of the International Bank for Reconstruction and
Development / The World Bank. The findings, interpretations, and conclusions expressed
in this paper do not necessarily reflect the views of the Executive Directors of The World
Bank or the governments they represent. The World Bank does not guarantee the
accuracy of the data included in this work. The boundaries, colors, denominations, and
other information shown on any map in this work do not imply any judgment on the part
of The World Bank concerning the legal status of any territory or the endorsement or
acceptance of such boundaries.
Rights and Permission
The material in this publication is copyrighted. Copying and/or transmitting portions or
all of this work without permission may be a violation of applicable law. The
International Bank for Reconstruction and Development / The World Bank encourages
dissemination of its work and will normally grant permission to reproduce portions of the
work promptly.
For permission to photocopy or reprint any part of this work, please send a
request with complete information to the Copyright Clearance Center, Inc.,
222 Rosewood Drive, Danvers, MA 01923, USA, telephone 978-750-8400,
fax 978-750-4470, www.copyright.com.
All other queries on rights and licenses, including subsidiary rights, should
be addressed to the Office of the Publisher, The World Bank, 1818 H Street
NW, Washington, DC 20433, USA, fax 202-522-2422, e-mail
Vice President:
Country Manager/Director:
Sector Manager:
Task Team Leader:
Co-Task Team Leader:
Obiageli Katryn Ezekwesili
Kundhavi Kadiresan/John Murray McIntire
Karen McConnell Brooks
Madhur Gautam
Sergiy Zorya

Acronyms and Abbreviations
AAMP Area Agricultural Modernization Program
ADB African Development Bank
AgPER Agriculture Public Expenditure Review
ARD Agriculture and Rural Development
A–SWG Agriculture Sector Working Group
BCC Budget Call Circular
BFP Budget Framework Paper
CAADP Comprehensive Africa Agriculture Development Programme
COFOG UN Classification of Functions of Government
COMESA Common Market for Eastern and Southern Africa
DDA Dairy Development Authority
DfID Department for International Development (UK)
DRA Direct Rate of Assistance
DSIP Development Strategy and Investment Plan
ECSSD Environmental and Socially Sustainable Development
EPRC Economic Policy Research Centre (Kampala)
FAO Food and Agriculture Organization of the United Nations
FITCA Farming in Tsetse Areas of East Africa Project
GDP Gross domestic product
GoU Government of Uganda
IFPRI International Food Policy Research Institute
ISFG Integrated Support to Farmer Groups
JICA Japan International Cooperation Agency
LDCP Livestock Disease Control Project
LGDP Local Government Development Program
M&E Monitoring and evaluation
MAAIF Ministry of Agriculture, Animal Industry, and Fishery
MoFPED Ministry of Finance, Planning, and Economic Development
MTEF Medium-Term Expenditure Framework
MWLE Ministry of Water, Lands, and Environment
NAADS National Agricultural Advisory Service
NARO National Agricultural Research Organization
NBFP National Budget Framework Paper
NEPAD New Partnership for Africa’s Development
NGO Non-Governmental Organization
NFA National Forest Authority
NLPIP National Livestock Productivity Improvement Project
NSCG Non-Sectoral Conditional Grant
NWSADP North-West Smallholder Agricultural Development Project
OPM Oxford Policy Management
PAF Poverty Action Fund
PEAP Poverty Eradication Action Plan
PER Public Expenditure Review
PMA Plan for Modernization of Agriculture
ReSAKSS Regional Strategic Analysis and Knowledge Support System

iv
PETS Public Expenditure Tracking Survey
PMU Project Management Unit
SACCO Savings and Credit Cooperative
SBFP Sectoral Budget Framework Paper
SFDP Support to Fisheries Development Project
SIDA Swedish International Development Agency
TRA Total Rate of Assistance
TTL Task Team Leader
UCDA Uganda Coffee Development Authority
UCDO Uganda Cotton Development Organization
UK United Kingdom
USAID United States Agency for International Development
UShs Ugandan shillings
VAT Value-added tax
VODP Vegetable Oil Development Project

Contents
Executive Summary ............................................................................................ x
1. Introduction .................................................................................................. 1
2. Level and Composition of Agricultural Sector Expenditure in Uganda .. 4
2.1. Trends in agricultural sector expenditure ............................................................. 4
2.2. Agricultural policy environment ........................................................................ 12
2.3. Economic composition of the sector budget ...................................................... 14
3. Budget Process and Performance ........................................................... 29
3.1. Budget preparation ............................................................................................. 29
3.2. Budget execution ................................................................................................ 35
3.3. Budget performance monitoring ........................................................................ 40
4. Efficiency and Effectiveness of Agricultural Sector Expenditures ....... 42
4.1. Methodology and analytical approach ............................................................... 43
4.2. Sample selection and procedures for field work ................................................ 45
4.3. Implementation arrangements of MAAIF development projects ...................... 47
4.4. Analysis of technical efficiency ......................................................................... 48
4.5. The impact of NAADS ....................................................................................... 57
4.6. Incidence of agricultural public expenditure ...................................................... 60
5. Conclusions and Policy Recommendations ........................................... 67
5.1. Agricultural sector budget: recent developments ............................................... 67
5.2. Agricultural price distortions ............................................................................. 68
5.3. Allocative efficiency of public expenditure ....................................................... 68
5.4. Technical efficiency of public expenditure ........................................................ 70
5.5. Budget processes ................................................................................................ 73
Annex 1: Recommendations to Improve the Guidelines of the Sector Budget Framework Paper ................................................................................ 75
Annex 2: Distribution of Goats for Restocking as at 30th September 2007 in NLPIP ................................................................................................................. 78

vi
Tables
Table 1: Shares of the agricultural sector budget in the national budget and GDP, 2001/02–
2008/09 (percent) ......................................................................................................... 7
Table 2: Medium-term expenditure framework for the agricultural sector budget, 2008/09–
2012/13 (UShs billions) ............................................................................................... 7
Table 3: Expenditures on agriculture based on the COFOG classification, 2001/02–2005/06
(UShs billions) ............................................................................................................. 9
Table 4: Off-budget disbursements to agriculture (based on the COFOG classification) by two
donors, 2000/01–2006/07 (UShs billions) ................................................................. 10
Table 5: International comparison of budgets for agriculture, average for 2002–04 ............... 12
Table 6: Distortion indicators for Ugandan agriculture, five-year averages ............................ 13
Table 7: MAAIF recurrent budget allocation, 2001/02–2008/09 (UShs billions) ................... 16
Table 8: Allocation to grants in the MAAIF approved recurrent budget, 2001/02–2008/09
(UShs billions) ........................................................................................................... 16
Table 9: Percentage distribution of MAAIF’s recurrent budget by department (excluding
grants and domestic arrears), 2005/06–2008/09 ........................................................ 17
Table 10: Main parts of MAAIF’s recurrent budget (excluding grants and domestic arrears),
2005/06–2008/09 (UShs billions) .............................................................................. 18
Table 11: Sources of funding for the development budget, 2005/06–2008/09
(UShs billions) ........................................................................................................... 19
Table 12: The economic composition of MAAIF’s development budget, 2005/06–2008/09
(UShs billions) ........................................................................................................... 19
Table 13: The detailed economic composition of MAAIF’s development budget, 2005/06–
2008/09 (UShs billions) ............................................................................................. 20
Table 14: Economic composition of MAAIF’s budget (excluding grants and domestic arrears),
2005/06–2008/09 (UShs billions) .............................................................................. 22
Table 15: Proportion of MAAIF budget allocated to DSIP priority areas, compared with DSIP
projections, 2005/06 to 2007/08 (percent) ................................................................. 27
Table 16: Evolution of 2007/08 budget ceiling projections for agriculture, March 2005 to
March 2007 (UShs billions) ...................................................................................... 30
Table 17: Evolution of the 2006/07 budget ceiling projections for agriculture by Vote
(UShs billions) ........................................................................................................... 31
Table 18: Approved, revised, and released recurrent expenditures for MAAIF, 2000/01–
2005/06 (UShs billions) ............................................................................................. 36
Table 19: Released recurrent expenditures as a percentage of approved recurrent budget
allocations for MAAIF programs, 2000/01–2005/06 ................................................ 36
Table 20: Released recurrent expenditure as a percentage of revised recurrent budget
allocations for MAAIF programs, 2000/01–2005/06 ................................................ 37

vii
Table 21: Disbursement/release of MAAIF of donor- and government-financed development
funds as a percentage deviation from development budget allocations, 2001/02–
2005/06 ...................................................................................................................... 37
Table 22: Approved and released development budgets in the selected MAAIF development
projects, 2005/06–2007/08 ........................................................................................ 38
Table 23: Shares of selected projects in MAAIF’s development budget, 2005/06–
2007/08 ...................................................................................................................... 46
Table 24: Contract performance within NWSADP ................................................................... 51
Table 25: Percentage of capital expenditures (approved budgets) of NWSADP, NLPIP, and
SFDP in the budget of these projects, MAAIF’s capital budget, and MAAIF’s
development budget, 2005/06–2008/09..................................................................... 52
Table 26: Financial resources transferred by the NWSADP Project Management Unit and
received by districts (UShs millions) ......................................................................... 54
Table 27: Financial resources transferred by NLPIP Project Management Unit and received by
districts (UShs millions) ............................................................................................ 54
Table 28: Physical resources reportedly transferred by the LDCP Project Management Unit and
received by districts (000 doses of vaccine) .............................................................. 55
Table 29: Physical resources reportedly transferred by NLPIP Project Management Unit and
received by districts (numbers of animals) ................................................................ 55
Table 30: Flow of financial resources from the NAADS Secretariat to districts, 2005/06–
2006/07 (UShs millions) ............................................................................................ 58
Table 31: Incidence of public and private services across wealth (per capita) quintiles, per
capita in 2007............................................................................................................. 66

viii
Figures
Figure 1: Trends in nominal and real approved budgets for agriculture, 2001/02–2008/09
(UShs billions) ......................................................................................................... 4
Figure 2: Released versus approved budgets for the agricultural sector, 2001/02–2005/06
(UShs billions) ......................................................................................................... 5
Figure 3: Structure of the approved budget for agriculture, 2001/02–2008/09
(UShs billions) ......................................................................................................... 6
Figure 4: Agriculture’s share of the national budget in relation to other sectors, 2007/08–
2012/13 (UShs bilions) ............................................................................................ 8
Figure 5: Agricultural sector Total Rate of Assistance, Uganda, 1961–2004 ....................... 14
Figure 6: MAAIF recurrent and development budgets, 2001/02–2008/09 ........................... 15
Figure 7: Economic composition of MAAIF’s budget (excluding grants and domestic
arrears), 2005/06–2008/09 (UShs billions) ........................................................... 22
Figure 8: Economic composition of the agricultural sector budget, 2005/06–2008/09
(UShs billions) ....................................................................................................... 23
Figure 9: Functional composition of the agricultural sector budget, 2006/07 ...................... 25
Figure 10: NAADS (Districts) budgeted and actual cash flows, 2005/06
(UShs billions) ....................................................................................................... 39
Figure 11: Relationship between inputs, outputs, and outcomes in agriculture ...................... 43
Figure 12: Implementation arrangement of most MAAIF agricultural development
projects .................................................................................................................. 48
Figure 13: Incidence of the public agricultural expenditures by household wealth quintile... 62
Figure 14: Incidence of total support by wealth quintile ........................................................ 62
Figure 15: Proportion of households receiving support by wealth quintile ............................ 62
Figure 16: Incidence of support for NAADS and non-NAADS participants.......................... 63
Figure 17: Amount of support received by NAADS and non-NAADS participants by wealth
quintile ................................................................................................................... 63
Figure 18: Incidence of credits and public expenditure by wealth quintile ............................ 63
Figure 19: Incidence of Agricultural Advisory Services by wealth quintile ........................... 64
Figure 20: Incidence of Advisory Services by NAADS membership and wealth quintile ..... 64
Figure 21: Access to information on crop production methods and practices by wealth
quintile ................................................................................................................... 65

ix
Acknowledgments
This report synthesizes findings from a joint effort to comprehensively review the
agricultural public expenditures in Uganda by the Ministry of Agriculture, Animal
Industries and Fisheries (MAAIF), the World Bank, and the UK Department for
International Development (DfID). The review was conducted under the auspices of the
Agriculture Sector Working Group (ASWG) and with the full support of the Ministry of
Finance, Planning, and Economic Development (MoFPED) and the other Agriculture
Development Partners of Uganda. The team gratefully acknowledges the financial
support received from the World Bank–DfID program on Agriculture Expenditure
Reviews (AgPER), DfID Uganda, the National Agricultural Advisory Services (NAADS)
Secretariat, and the Regional Strategic Analysis and Knowledge Support System
(ReSAKSS) node for Eastern and Central Africa to undertake the background studies for
this review. The team particularly appreciated the strong support and encouragement of
Limin Wang (DfID), Christopher Delgado (ARD), and the World Bank–DfID AgPER
program.
The core study team included Keizire Boaz Blackie (formerly CAADP and AgPER focal
point in MAAIF, now with the African Union Commission); Fred Mayanja (MAAIF);
Madhur Gautam, Sergiy Zorya, Wilson Onyang Odwongo, Varun Kshirsagar (World
Bank); Alan Tollervey (formerly with DfID Uganda, now DfID London); Peter Oumo
(DfID Uganda); and Godfrey Bahiigwa (formerly with RESAKSS and now PMA,
MAAIF).
This synthesis report was prepared by Madhur Gautam and Sergiy Zorya (Task Team
Leader and co-TTL for the World Bank). It is based on background studies conducted in
three phases by teams from the World Bank, Oxford Policy Management (OPM),
London; Economic Policy Research Centre (EPRC), Kampala; and the International Food
Policy Research Institute (IFPRI). The Phase I study on levels and patterns of allocation
of agricultural expenditures was prepared by the OPM team, led by Lawrence Smith and
including Martin Fowler, Frederick Mugerwa, and Milton Ogeda, with support from
Stephen Akroyd. The Phase II study on budget process and performance was conducted
by the same OPM team. The Phase III analysis of the efficiency and effectiveness of
agricultural public expenditures consisted of three studies: (i) a public expenditure
tracking study undertaken by the EPRC team, led by Nyende Magidu and supported by
Mugisha Fredrick and Omiat Omongin, with technical support from Sergiy Zorya; (ii) an
impact evaluation of NAADS, conducted by an IFPRI team led by Sam Benin and
Ephraim Nkonya and including Geresom Okecho, Josée Rdriamamonjy, Edward Kato,
Geofrey Lubade, Miriam Kyotalimye, and Francis Byekwaso; and (iii) an incidence
analysis of agricultural expenditures undertaken by Varun Kshirsagar and Madhur
Gautam.
Dina Umali-Deininger (Sector Manager, ECSSD), Mona Sur (Senior Economist, ARD)
and Christopher Delgado (Advisor, ARD) served as Peer Reviewers for the study. Limin
Wang, Christopher Delgado, Wilson Onyang Odwongo, and Stephen Mink provided
advice and comments throughout the preparation of the report. Kelly Cassaday edited this
report.
x
Executive Summary
This Agriculture Public Expenditure Review (AgPER) analyzes the efficiency
and effectiveness of agricultural sector expenditure in Uganda. Demand for this
AgPER comes from several quarters. The Ministry of Agriculture, Animal Industry, and
Fisheries (MAAIF) has a strong interest in using the results of a comprehensive AgPER
to better align future expenditure to its priorities, improve the quality of public service
delivery, and make the case for an appropriate level of funding for the sector. This
Review is also a part of a larger annual Public Expenditure Review, a core diagnostic
undertaken collaboratively by the Government of Uganda (GoU) and World Bank. An
additional justification for this AgPER has its origins in the commitment by member
states of the New Partnership for Africa’s Development (NEPAD) to allocate 10 percent
of their annual budgets to agriculture. Under NEPAD’s Comprehensive Africa
Agriculture Development Programme (CAADP), one of the first tasks for individual
countries is to undertake a public expenditure review to document the level, composition,
and quality of agricultural sector expenditure. Uganda is one of the first five pilot
countries to carry out the CAADP and has committed itself to conducting an AgPER.
The UK Department for International Development (DfID) and the World
Bank have established a global program to support PERs for the agricultural sector.
Uganda was selected as one of the case study countries for the program in response to the
demand expressed by the government—the Ministry of Finance, Planning, and Economic
Development (MoFPED) and MAAIF. The demand for this analysis also comes from the
local Agriculture Development Partners (in particular the DFID and World Bank country
offices), and the Regional Strategic Analysis and Knowledge Support System
(ReSAKSS) node for Eastern and Central Africa, which is mandated by the Common
Market for Eastern and Southern Africa (COMESA) to monitor agricultural sector
spending by governments in the region.
Against this background, the objectives of this AgPER are to help the
Government of Uganda better align future expenditures to its priorities, assess the
robustness of the agricultural public expenditure management system to maximize the
effectiveness of scarce resources, and make the case for the need and absorptive capacity
for additional expenditure targeted at high-priority areas.
The agricultural sector budget in this AgPER includes the following agencies:
(i) MAAIF, (ii) National Agricultural Research Organization (NARO), (iii) National
Agricultural Advisory Services (NAADS) at the central and district levels, (iv) Uganda
Cotton Development Organization (UCDO), (v) Uganda Coffee Development Authority
(UCDA), (vi) district agricultural extension staff, and (vii) Non-Sectoral Conditional
Grants.

xi
Trends in agricultural sector expenditure in Uganda
Between 2001/02 and 2008/09, agricultural sector expenditure can be divided
into two distinct phases. During the first phase, from 2001/02 to 2003/04, the budget for
agriculture fell sharply in nominal and real terms (Figure E1). It began to recover in
2004/05, and by 2008/09, cumulative growth in the sector budget was 46 percent above
2001/02 level in nominal terms. In real terms, although the budget was 38 percent higher
in 2008/09 than in 2004/05, it
was at about the same level as
in 2001/02. As a share of the
national budget, the budget for
agriculture had fallen to 3.8
percent in 2008/09 from 5.7
percent in 2001/02. Finally, in
terms of gross domestic
product (GDP), the sector
budget remained stable, albeit
low, at 1.6 percent. It is
important to emphasize that
these are the trends in the
approved budget. The
released budget was on
average 10 percent lower, reducing the share of sector expenditure in GDP to a very low
1.2 percent.
The agricultural sector budget is not much larger when measured according to
the United Nations classification of functions of government (COFOG). This
classification, recommended by CAADP/NEPAD for comparing agricultural sector
expenditures across countries in Africa, increases the sector budget by about 1 percent of
the national budget (to 5.4 percent for the released budget in 2005/06, for example).1
There is substantial off-budget spending by some donors, however, which is estimated to
be equivalent to 10–20 percent of the current sector budget. Information about off-budget
spending remains fragmented and difficult to obtain. Because it lies largely outside the
purview of planners and policy makers, off-budget spending makes coordination,
prioritization, and sector planning difficult. Even when off-budget funds are taken into
account, Uganda’s agricultural sector budget is still about two times lower than it must be
to meet Uganda’s Maputo Declaration pledge to allocate 10 percent of the national
budget to agriculture under CAADP. In addition to these public expenditures, it is
important to note the significant volume of expenditures by nongovernmental
organizations (NGOs). Estimated at about 10 percent of the present budget, these
expenditures pose additional coordination and harmonization challenges.
1 The COFOG classification increases the budget for agriculture with the addition of the land and forestry
sectors under the Ministry for Water, Lands, and Environment (MWLE) and National Forest Authority
(NFA).

xii
Is Uganda’s agricultural sector expenditure expected to grow in the near
future? Rather than growing, public expenditures on agriculture are projected to keep
declining, according to the
Medium-Term Expenditure
Framework. In 2012/13, the
agricultural sector expenditure
is expected to be 3.2 percent
of the national budget,
compared with 3.8 percent in
2008/09 and 4.6 percent in
2001/02 (Figure E2). Budget
resources will be shifted to
other areas, notably
infrastructure and social
development, which would
provide for indirect positive
benefits to agriculture. Within the agricultural sector budget, resources will continue to
shift from the national to local level, mainly to NAADS in the districts.
Given this outlook, it is more critical than ever to ensure that scarce budgetary
resources are used as effectively and efficiently as possible at all levels in the
agricultural sector. It is also vital for MAAIF to improve collaboration with local
governments, which increasingly will be responsible for implementing agricultural
programs.
How does Uganda’s spending on agriculture compare to spending by other
countries? An international comparison shows that Uganda spends relatively less than
other countries (Table E1), when spending is measured as the share of agricultural budget
in GDP (adjusted by the size of the sector). Uganda spends about as much as other Sub-
Saharan African countries but less than middle- and high-income countries. This finding
is consistent with Uganda’s narrower fiscal capacities and its greater need to support
competing public investments in infrastructure and social sectors compared to higher-
income countries. International
experience has shown, however,
that lower public spending does
not necessarily mean lower
agricultural competitiveness. It is
well known that in the United
States and the European Union, for
example, expensive public support
in the form of huge farm subsidies
has failed to keep farmers
competitive in world markets,
whereas lower spending in Brazil,
Australia, and New Zealand has
not prevented their farmers from being highly competitive.

xiii
Figure E3: Shares of development budget and capital outlays in the
approved MAAIF budget, 2005/06-2008/09
0%
10%
20%
30%
40%
50%
60%
70%
80%
90%
100%
2005/06 2006/07 2007/08 2008/09
Share ofdevelopmentexpenditure
Share of capitalexpenditure
Three conditions must be met to maximize the impact of public spending on
agriculture in Uganda. These conditions will be even more critical if spending begins
to rise again. First, public expenditures on agriculture must be supported through an
enabling environment in which agricultural prices are subject to few distortions. It is
counterproductive to raise the public expenditure on agriculture when farm-gate prices
are depressed. Second, the mix of spending should be efficient (allocative efficiency).
Spending that does not contribute (or does not contribute as much) to growth and poverty
reduction, relative to alternative goals, is allocatively inefficient or unproductive. Third,
technical efficiency should be high. Technical efficiency in the public sector involves
making the best use of inputs to provide outputs in the form of public services. (Put
simply, technical efficiency is doing things well, and allocative efficiency is doing the
right things.) When those three conditions are met, even small budgets will be well-
positioned to generate economic growth and encourage more private investment. It is also
very likely that when these conditions are met, the scaling up of agricultural sector
expenditure in Uganda will bring the highest rates of return.
Agricultural price distortions
Uganda has successfully addressed one requisite for the efficiency of public
expenditure: Agricultural price distortions have been largely eliminated, and most
farm-gate prices are at the level of reference border prices adjusted for marketing costs.
In 2001–04, the rate of assistance to agriculture was estimated at 1 percent, with no
taxation to exportables and about 13 percent support to importables such as rice. The
nonagricultural rate of assistance has also decreased notably, reducing the prices of farm
inputs and stimulating resource flows to agriculture. The policy environment in Uganda
can be described as quite conducive for public expenditure to have a lasting impact.
Allocative efficiency of public expenditure
The allocative efficiency of public expenditure can and must be improved.
The first drawback is the small share of capital expenditure in the sector budget. An
economic decomposition of
public spending illustrates
that in Uganda ―development
expenditure‖ is not
synonymous with ―capital
expenditure,‖ as usually
assumed. Development
expenditure makes up about
80 percent of the agriculture
budget but is heavily
oriented to nonwage
recurrent expenditures rather
than to capital expenditures.
The share of capital outlays
in the 2008/09 approved
budget is 6 percent, falling from an already low level of 11 percent in 2005/06. The share
of capital expenditures is higher in MAAIF’s budget than in the total sector budget; it

xiv
Figure E4: Economic structure of the sector budget
-
50
100
150
200
250
2005/06 2006/07 2007/08 2008/09
US
hs b
illio
n
Capitaloutlays
Non-wagerecurrent
Wage bill
was 22 percent in 2008/09 (Figure E3). This budget share is far less than that of the
development budget and may convey the erroneous impression that capital expenditures
dominate public spending. In reality, too little is invested in rural community roads,
bridges, and wholesale and livestock markets. Only a minor share of the budget is
allocated to irrigation and to veterinary, sanitary, and phytosanitary laboratories and
equipment, despite their considerable importance for raising agricultural productivity.
Furthermore, the high levels of technical inefficiency in capital expenditures reduce the
impact of even that small capital outlay to a very low level.
Uganda’s low level of capital expenditure is bad news, because the condition of
rural infrastructure strongly affects agricultural trade, farm diversification, and
ultimately poverty. A study in Uganda by Balat et al. (2008) demonstrates that greater
trade in cash crops (coffee, tea, cotton, and fruits) will have a strong effect on poverty
reduction. High marketing costs caused by poor rural infrastructure prevent many
Ugandan farmers from participating in markets, leaving them little choice but to grow
staple food crops in quantities sufficient for domestic consumption.2
The second drawback of agricultural sector expenditures is that they are
increasingly dominated by nonwage recurrent expenditures, mainly subsidized
inputs and other goods. Between 2005/06 and 2008/09, nonwage recurrent spending,
mainly for farm inputs, comprised 64.6 percent of MAAIF’s development budget on
average. The share of nonwage
recurrent spending in
MAAIF’s total budget grew
from 49 percent in 2005/06 to
80 percent in 2008/09. Inputs
are distributed by many
development projects and
increasingly by NAADS. In
2008/09, NAADS received
about UShs 37 billion ―for
inputs to the small-scale
farmers who cannot afford to
purchase the necessary inputs‖
(Figure E4).
Making inputs accessible is integral to raising agricultural productivity, but
the current approach of distributing inputs is unlikely to achieve this objective, because it does not strengthen private input suppliers, is not well targeted, or fails to
invest in infrastructure to ensure that farmers can obtain inputs easily. Most input
distribution and promotion appears to be supply driven and to favor wealthier farmers. It
does not meet the requirements of market-supporting smart subsidies. As allocations for
subsidized inputs grow, the fiscal burden and economic distortions (waste and leakages,
2 Balat, J., I. Brambilla, and G. Porto (2008): Realizing the Gains from Trade: Export Crops, Marketing
Costs, and Poverty. World Bank Policy Research Working Paper 4488, Washington, DC.
xv
Research19%
Advisory services38%
Livestock diseases7%
Plant pest and diseases
1%
Livestock & fish regulatory services
2%
Planning & policy2%
Institutional development
2%
Water capacity building
4%
Seed capacity development
5%
Processing & marketing
3%
Physical infrastructure15%
Promotion2%
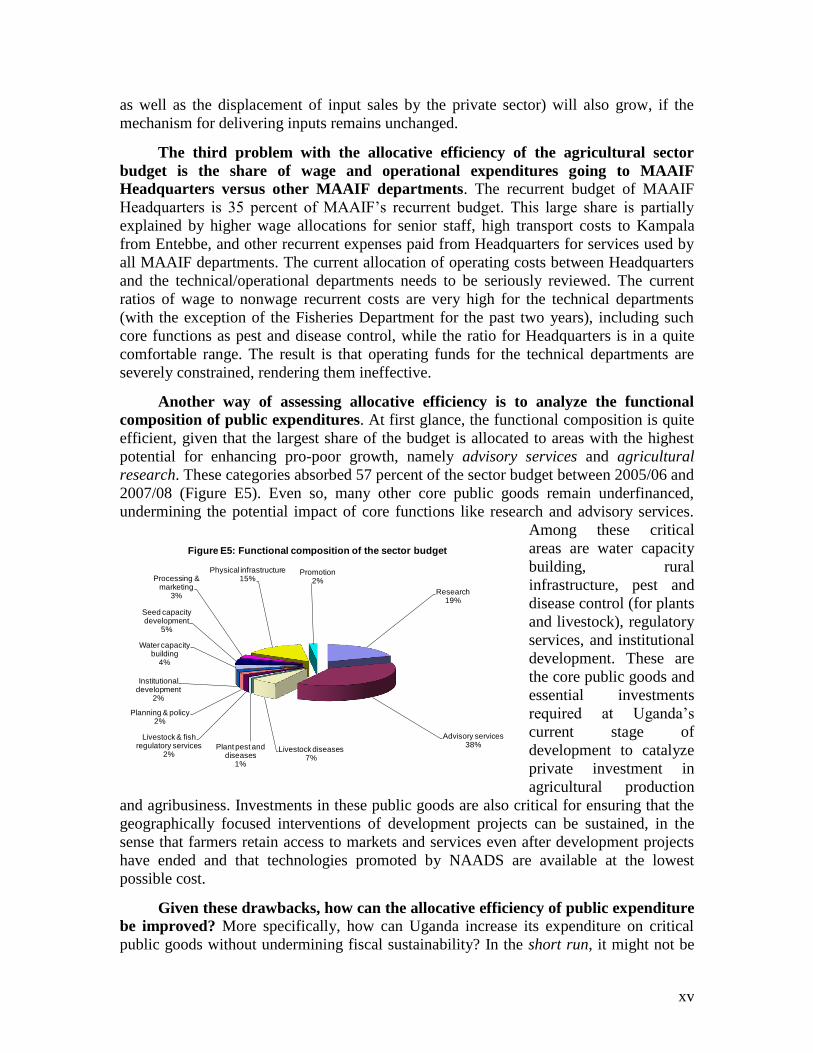
Figure E5: Functional composition of the sector budget
as well as the displacement of input sales by the private sector) will also grow, if the
mechanism for delivering inputs remains unchanged.
The third problem with the allocative efficiency of the agricultural sector
budget is the share of wage and operational expenditures going to MAAIF
Headquarters versus other MAAIF departments. The recurrent budget of MAAIF
Headquarters is 35 percent of MAAIF’s recurrent budget. This large share is partially
explained by higher wage allocations for senior staff, high transport costs to Kampala
from Entebbe, and other recurrent expenses paid from Headquarters for services used by
all MAAIF departments. The current allocation of operating costs between Headquarters
and the technical/operational departments needs to be seriously reviewed. The current
ratios of wage to nonwage recurrent costs are very high for the technical departments
(with the exception of the Fisheries Department for the past two years), including such
core functions as pest and disease control, while the ratio for Headquarters is in a quite
comfortable range. The result is that operating funds for the technical departments are
severely constrained, rendering them ineffective.
Another way of assessing allocative efficiency is to analyze the functional
composition of public expenditures. At first glance, the functional composition is quite
efficient, given that the largest share of the budget is allocated to areas with the highest
potential for enhancing pro-poor growth, namely advisory services and agricultural
research. These categories absorbed 57 percent of the sector budget between 2005/06 and
2007/08 (Figure E5). Even so, many other core public goods remain underfinanced,
undermining the potential impact of core functions like research and advisory services.
Among these critical
areas are water capacity
building, rural
infrastructure, pest and
disease control (for plants
and livestock), regulatory
services, and institutional
development. These are
the core public goods and
essential investments
required at Uganda’s
current stage of
development to catalyze
private investment in
agricultural production
and agribusiness. Investments in these public goods are also critical for ensuring that the
geographically focused interventions of development projects can be sustained, in the
sense that farmers retain access to markets and services even after development projects
have ended and that technologies promoted by NAADS are available at the lowest
possible cost.
Given these drawbacks, how can the allocative efficiency of public expenditure
be improved? More specifically, how can Uganda increase its expenditure on critical
public goods without undermining fiscal sustainability? In the short run, it might not be

xvi
possible to shift substantial resources to critical functions within the existing budget,
because these resources are committed to ongoing development projects. Resources for
underfinanced critical public goods would need to come from additional sources,
including donor funds. In the medium to longer run, however, development resources
must be shifted strategically from private to public goods and from nonwage recurrent to
capital expenditures. Furthermore, the technical efficiency of agricultural spending
requires improvement, as indicated in the next section, and those improvements will
increase the impact of better-allocated expenditure on agricultural growth.
Technical efficiency of public expenditure
The analysis of technical efficiency indicates that much work remains to be
done to make the case for substantially scaling up funding for agriculture in
Uganda. Project implementation suffers from many serious problems, although not all of
the blame rests with MAAIF. Many factors that are not specific to agriculture and often
beyond MAAIF’s immediate control significantly affect project implementation. They
include Parliament’s long delays of one to one-and-a-half years in ratifying loans,
untimely and insufficient release of counterpart funds by MoFPED (with the outturn from
10 percent to 50 percent, depending on the development project), public officials’ weak
procurement and fiduciary capacity, and insecurity in northern Uganda. These constraints
seriously affect the implementation of projects and increase their transaction and
implementation costs. MAAIF needs to be much more proactive in bringing these
issues to national attention and looking for concerted remedies at the national and
local level.
The remaining constraints on technical efficiency are significant and need to
be addressed by MAAIF and local governments. Most MAAIF development projects
with infrastructure components are characterized by long delays (three to five years) in
building and rehabilitating rural infrastructure. Aside from the issues just mentioned,
important problem areas include improper appraisal and feasibility work, poor
coordination of preparation and implementation between MAAIF and local governments,
inadequate operating budgets for local technical staff, ineffective project procurement,
and problems related to land tenure.3 These result in high cost overruns, low-quality
work, and other kinds of wastage. Given that capital expenditures account for such a
large share of the development projects reviewed (81 percent of MAAIF’s capital
budget), MAAIF needs to take immediate action to devise remedies to deal with these
problems. These lessons from experience should be taken into account when new
investment projects are prepared.
Other important lessons on technical inefficiencies emerge from studies of how
goods and services are delivered to farmers and frontline service providers. First, the
unit costs of goods procured at the central level is usually 20–50 percent higher than
comparable market prices or unit costs at the local level. Second, the delivery of centrally
procured goods is prone to wastage. The mortality rate of livestock distributed through
3 Land tenure problems are often related to improper appraisal and weak coordination of activities with
local governments.

xvii
several projects is unacceptably high (ranging from 7 to 38 percent across interventions).
In several instances, a significant number of cattle and goats died in the first months after
delivery. The distribution of vaccines entailed low value for money and substantial
wastage, because vaccines were overpriced and storage facilities inadequate. Records of
financial and physical resource transfers from the central management units to the
districts often do not match, suggesting wastage, diversion, or leakages, although the
source of the problem remains unclear (possibilities include poor record keeping and thus
low accountability, diversion from intended beneficiaries, corruption, resource
misallocation, improper accounting, or simply insufficient information from project
implementation units). Leakages were more pronounced for in-kind transfers than
financial transfers, suggesting that inputs/goods are more easily directed away from their
intended beneficiaries or uses. A key lesson from these experiences is to decentralize
procurement to reduce costs and to place resources directly at the command of the
beneficiaries to improve accountability. For example, such costs are lower for NAADS,
because most procurement is decentralized and involves the local communities and
beneficiaries.
The impact of individual projects is considerably circumscribed by the lack of
a strategic approach for using public expenditures to support agriculture. One
example is the current strategy for improving farmers’ access to inputs through
subsidized input distribution by development projects, complemented by farmer training.
This strategy fails to resolve the real causes of farmers’ poor access to inputs, including
high transaction costs (caused by poor rural infrastructure), slow progress in microfinance
development, and weak technical and business capacity of private agro-dealers. Once the
projects are phased out, inputs are still not accessible. Project expenditures are likely to
have been wasted, given that they could have been used for infrastructure or other public
investments with more sustainable outcomes.
Another example is the promotion of animal vaccines in the absence of
complementary disease control measures. Only 7 percent of Uganda’s agriculture
budget is allocated to controlling livestock diseases, and even that small sum is irregular
and unpredictable. MAAIF can detect and control only one-sixth of the dangerous
diseases listed by the World Health Organization and only those caused by ticks and
tsetse. Diseases caused by viruses cannot be traced at all. The central veterinary lab is
understaffed and ill equipped. Under these circumstances, the distribution of animals
without appropriate follow-up services or support results in low value for money and
wastage as a significant proportion of the animals die for lack of proper attention. The
distribution of vaccines, even if it could be more effective, may not by itself be a cost-
effective means of achieving the desired outcome—improved livestock health.
The NAADS impact evaluation supports these findings about technical
inefficiency in MAAIF development projects. NAADS has succeeded by being
demand-driven and decentralized. The wastage and leakage associated with centrally
managed programs is reduced because most NAADS activities and procurement occur
locally. Members of NAADS had fairly equal access to advisory services regardless of
wealth ranking, and they had greater access to information on various aspects of the
farming enterprise than the non-NAADS households. Yet the impact of NAADS could
have been even greater if its activities had been complemented by rural services and other

xviii
public investments, which could perhaps have been more equitably distributed than
grants and private goods. NAADS alone will not substitute for insufficient finance,
deteriorated roads, or expensive inputs. If complementary investments and actions are
undertaken, NAADS will remain a powerful means of sustaining rural development in
Uganda.
Against this background, the following recommended actions would increase
the effectiveness and technical efficiency of agricultural sector expenditure in
Uganda:
Faced with the prospects of declining budget allocations in the future, the
topmost priority for MAAIF is to ensure that its limited resources are used as
efficiently and effectively as possible. MAAIF should target the highest
priorities and seek institutional arrangements to more effectively deliver
services through decentralized implementation arrangements. In line with the
widely accepted principles of good governance, MAAIF should ensure
transparency, accountability and participation in its service delivery in an
effort to maximize the efficiency and effectiveness of its expenditures.
MAAIF should ensure that problems with launching projects are at the top of
the agenda for national stakeholders. Rates of return to development projects
will increase significantly if Parliament ratifies loans rapidly, government
counterpart funds are released in a timely and predictable way (budget
execution), and public officials improve their procurement and fiduciary
capacity. Remedies for these problems have to be found at the national level,
and MAAIF needs to play a critical role in this process.
The appraisal of infrastructure investments should be done in a participatory
manner with local governments and local stakeholders. Land tenure issues
must be clarified before projects are launched. Technical designs for
communal roads and bridges should take into account connectivity with feeder
and national roads. Where possible, procurement should be shifted from the
central to district level, as in NAADS, and local government procurement
staff should receive training. These actions will reduce unit costs, minimize
wastage, improve the quality of work, and lead to the timely delivery of
construction work.
In some instances, central procurement has merits and may be more cost
effective. For example, central procurement of vehicles and other products
procured internationally allows MAAIF to exploit economies of scale and
effectively deal with import tax credits and other importation issues. For
goods and services procured domestically, however, procurement must shift
gradually to local governments. Compared to central procurement, local
procurement usually has lower unit costs, wastage, and leakage. Local
government should receive technical and financial assistance to strengthen
procurement and fiduciary capacity and ensure the integrity of financial
management. This support should be provided not only by MAAIF but also by
national programs.

xix
During project implementation, wastage can be reduced through better
coordination of activities and allocation of adequate operating funds for
supervision by local production department staff. Local technical personnel
are overburdened by multiple projects and lack funds to do their job. More
resources should be set aside for operating expenses of local technical staff in
development project budgets.
Individual projects should be better integrated into the strategy for agricultural
growth and development. Public expenditures should address the roots, not the
results, of market failures. It is inefficient to disseminate technologies in
certain geographic areas without a coherent, sustainable approach to ensure
farmers’ access to those technologies once subsidies end. A larger share of
public expenditure needs to be allocated to core public goods. The
subsidization of private goods (inputs) must be considered only as a
temporary measure to overcome market failures. The delivery of increased
budgets for inputs and other goods should be directed at resource-poor
farmers, which is not currently the case, and should not displace but engage
the private sector.
Budget processes
The strategic improvement of public spending on agriculture must begin by
making greater use of the Sector Budget Framework Paper (SBFP). The format and
content of the SBFP are largely dictated by the guidelines in the Budget Call Circular
issued by MoFPED. It is time to reassess the information currently required for the SBFP
as outlined in the Circular to determine if it is essential and presented in the most
effective format for making informed decisions on budget allocations. Except for
2006/07, there has been no feedback to the Sector Working Group (or MAAIF) from
MoFPED on the content and quality of the SBFP, nor are there suggestions for
improvement in future years. Such feedback should become a regular feature of the
budget preparation process. Detailed recommendations for improving the SBFP
guidelines are summarized in Annex 1.
The credibility of MAAIF’s Development Sector Investment Plan (DSIP)
should be strengthened by giving greater attention to: (i) the criteria used for
prioritization; (ii) the expected outcomes; (iii) detailed explanations of expenditure
estimates; and (iv) linking the investment plans more closely to anticipated ceilings in the
Medium-Term Expenditure Framework (MTEF), indicating how plans would change if
MTEF ceilings were increased or decreased. There is an urgent need for MAAIF to
update its strategy and investment plan for 2008/09 onwards to provide a continued link
between policy, planning, budget preparation, and negotiations. MAAIF should also
consider whether a three-year or five-year investment plan is best suited to its purposes.
A five-year plan would provide a longer horizon for investment decisions and reduce the
perceived need for frequent revisions, but changing priorities and events might make the
estimates for outer years unreliable.
Budget execution, the binding constraint for implementing projects, should
take into account the strong seasonality of agriculture (and thus resource
requirements) and the large costs of untimely, unpredictable counterpart financing
xx
in development projects. Within the overall cash flow, MoFPED should cater for the
relatively small but particular cash flow requirements of agencies such as MAAIF and
NAADS to improve their operational effectiveness.
Substantial benefits will arise from creating a results-based system for
monitoring and evaluation (M&E) of public expenditures. Such a system would make
provisions for regular program monitoring and also for evaluating the impacts of major
interventions. Currently MAAIF focuses on regular monitoring of project
implementation. Such monitoring is necessary to follow the progress and achievement of
targets; it should cover not only budget but also off-budget expenditure, which is likely to
account for 10–20 percent of the sector expenditure. It is also critical to ensure that
monitoring reports are used inside and outside of MAAIF to reward good performance
(or invoke sanctions for poor performance), to address inefficiencies, or to reallocate
resources between different priority areas.
Rigorous impact evaluation should be done for most development projects.
The budget for impact evaluation needs to be sufficient and reflected in project budgets.
Results-based M&E is indispensable to good national management and policy planning.
The regular monitoring system provides very little information about the real impact of
public programs. The absence of a results-based M&E system makes it easy for interest
groups to manipulate public debates and thus very difficult to change current approaches
to public expenditures and agricultural policy in Uganda. Impact evaluations can range
from Public Expenditure Tracking Surveys (PETS) to impact evaluations such as the one
done for NAADS, both of which have been presented here. Once these evaluations
become the norm, policy makers and planners will be well equipped to guide budget
allocations across sectors and address operational constraints in agriculture programs.

1
1. Introduction
1. This Agriculture Public Expenditure Review (AgPER) comprehensively
reviews public expenditures on agriculture in Uganda and analyzes their efficiency
and effectiveness. Its genesis lies in Agriculture Sector Working Group (A–SWG)
discussions, especially during the budget process, which raised concerns about the
seemingly low budget allocations to the sector and the failure to align limited resources
with recognized priorities in the sector. To address these concerns, the A–SWG resolved
to undertake this AgPER. Aside from providing a better understanding of the nature and
composition of agricultural pubic expenditures in Uganda, the Review would specifically
analyze their efficiency and effectiveness with a view to identifying the types of
expenditures that would promote pro-poor growth.
2. The AgPER is thus a joint product of the Ministry of Agriculture, Animal
Industry, and Fisheries (MAAIF), the World Bank, and the Department for
International Development (DfID). It was carried out under the overall guidance of the
A–SWG and managed by a technical subcommittee of the Working Group, chaired by the
Permanent Secretary, MAAIF. The AgPER’s main objectives were to help the
Government of Uganda better align future expenditures to its priorities, assess the
robustness of the agricultural public expenditure management system to maximize the
effectiveness of scarce resources, and make the case for the need and absorptive capacity
for additional expenditure targeted at high-priority areas.
3. The rationale for the AgPER is that very little analytical information is
available to ensure that public expenditures are prioritized to support the objectives
of sustaining agricultural growth and reducing poverty. Such information is
particularly crucial in a context where the national budget is increasingly stressed (by
limited progress in generating domestic revenue, the demands of unforeseen crises, and
other government obligations) and it is vital to manage aid flows prudently. The annual
budget cycle is inevitably accompanied by complaints about insufficient allocations from
sector ministries and implementing agencies. The Ministry of Finance, Planning, and
Economic Development (MoFPED) has challenged line ministries to produce value-for-
money analyses of current expenditures as a basis for considering increased budgetary
allocations. Because of the weak information base, the annual sector Budget Framework
Papers offer insufficient information on expenditures in the previous year and on what
those expenditures achieved. Without this information, it is difficult to develop and
justify a more educated budget allocation for the coming year. With few exceptions,
annual budgets and Medium-Term Expenditure Framework (MTEF) ceilings present only
incremental changes, irrespective of emerging sector priorities.
4. This shortcoming is evident to MAAIF, which is deeply concerned about the
lack of resources as well as the limited potential for realigning expenditures to high-
priority activities set forth in its Development Strategy and Investment Plan (DSIP).
The bulk of MAAIF’s budget is already allocated to specific activities, either for the core
autonomous organizations—the National Agricultural Research Organization (NARO)
and National Agricultural Advisory Services (NAADS)—or for activities to which the
government has committed under various projects. MAAIF has a strong interest in
2
conducting a comprehensive AgPER to tailor its future expenditures to its priorities,
improve the quality of public service delivery, and make a compelling case for
appropriate levels of funding for agriculture.
5. Demand for the AgPER comes from several other quarters as well. The
AgPER is part of the broader annual Public Expenditure Review, a core diagnostic
undertaken collaboratively by the Government of Uganda and the World Bank. That
diagnostic identifies potential allocative efficiencies in public expenditures that would
create the space for high-priority investments to spur fiscally sustainable economic
growth that benefits the poor.
6. Additional justification for the AgPER comes from the New Partnership for
Africa’s Development (NEPAD), under which Africa’s Heads of State committed to
allocate 10 percent of their national budgets to agriculture each year. Although
prescriptive allocations need to be approached with caution—the quality of expenditure is
equally if not more important than the quantity—under NEPAD’s Comprehensive Africa
Agriculture Development Programme (CAADP), one of the initial tasks for each country
is to undertake a public expenditure review that documents the level, composition, and
quality of expenditures in the agricultural sector. Uganda is among the first five countries
to conduct such a review
7. DfID and the World Bank have established a global program to analyze and
disseminate evidence on the levels and composition of public expenditure that
stimulate pro-poor agricultural growth. Uganda was selected as one of the case study
countries for this program primarily because the government—MoFPED as well as
MAAIF—expressed demand for the information it could provide. The information would
also be useful to local development partners, especially DfID and the World Bank, and
the Regional Strategic Analysis and Knowledge Support System (ReSAKSS) for Eastern
and Central Africa, which is mandated by the Common Market for Eastern and Southern
Africa (COMESA) to monitor government spending on agriculture in the region.
8. This report synthesizes the findings from several studies that are key
building blocks for the AgPER. The analysis was carried out in three phases. Phase I,
conducted by Oxford Policy Management (OPM), focused on the levels and patterns of
expenditure in the agricultural sector. Phase I findings and analysis have been updated
and expanded by the task team to reflect more recent data. Phase II (also carried out by
OPM) reviewed the budget process and performance. Phase III studied the efficiency and
effectiveness of agricultural public expenditures using a variety of tools. These included a
public expenditure tracking study, carried out by the Economic Policy Research Centre
(EPRC), and a household survey, conducted by the International Food Policy Research
Institute (IFPRI), to analyze the incidence of key public expenditures and evaluate the
impact of NAADS, which accounts for the largest share of agricultural public
expenditures in Uganda.
9. The report is structured as follows. Section 2 analyzes trends in nominal and
real sector budgets. It highlights the current and projected importance of agricultural
sector expenditure in the national budget and gross domestic product (GDP). An analysis

3
of agricultural price distortions indicates the extent to which the sector benefits from
supportive policies. The allocative efficiency of public spending is evaluated to determine
whether scarce public resources are allocated in ways that reflect government priorities
for agriculture, with the proper combination of recurrent and capital expenditures.
10. Section 3 describes budget planning and implementation at the national and
local level and presents policy recommendations to improve those processes. Section
4 focuses on the technical efficiency of public spending. By tracking resource flows
and analyzing the unit costs of goods and service delivery, Section 4 sheds light on
whether public resources are used efficiently and which actions could improve efficiency.
The concluding section summarizes the major findings and policy recommendations.

4
2. Level and Composition of Agricultural Sector Expenditure in Uganda
2.1. Trends in agricultural sector expenditure
11. Public resources are expended on agriculture by a number of agencies at the
national and local level. At the national level, MAAIF is the lead ministry responsible
for agricultural expenditure, along with four autonomous organizations: (i) NARO, (ii)
the NAADS Secretariat, (iii) the Uganda Cotton Development Organization (UCDO),
and (iv) the Uganda Coffee Development Agency (UCDA). At the local level, District
Agricultural Extension, NAADS, and (through nonsectoral conditional grants) programs
such as those under the Plan for Modernization of Agriculture (PMA) also manage
agricultural expenditures.
12. The approved budget for Uganda’s agricultural sector grew by 46 percent
from 2001/02 to 2008/09, driven by a threefold rise in spending for NAADS through
the districts.4 Cumulative spending over the same period was UShs 1,346 billion (Figure
1). In real terms, the approved budget for the sector was stagnant over this period by (in
fact lower by about 2 percent), largely because of a sharp decline in the early 2000s.
Between 2004/05 and 2008/09, however, the budget grew by 38 percent in real terms.5
Figure 1: Trends in nominal and real approved budgets for agriculture,
2001/02–2008/09 (UShs billions)
Source: MoFPED and MAAIF.
4 Throughout this report, data for 2008/09 are derived from MoFPED (2008): Draft Estimates of Revenue
and Expenditure (Recurrent and Development). Kampala. 5 The real sector expenditure is estimated as the nominal sector expenditure adjusted for inflation.
100
120
140
160
180
200
220
240
2001/02 2002/03 2003/04 2004/05 2005/06 2006/07 2007/08 2008/09
US
Hs
billi
on
Nominal sector budget
Real sector budget

5
13. The funds that MoFPED released to the agricultural sector were usually
smaller than the budget approved by Parliament. During 2001/02–2005/06, the
released budget for agriculture was 10 percent lower than the approved budget. The
cumulative growth apparent in the approved budget (7 percent) was belied by the
cumulative decline in the released budget (15 percent) (Figure 2).6 In real terms, the rise
in spending is also less spectacular for the released budget (2 percent) compared to the
approved budget (28 percent).
Figure 2: Released versus approved budgets for the agricultural sector,
2001/02–2005/06 (UShs billions)
Source: MoFPED and MAAIF.
14. MAAIF, NARO, and the NAADS Secretariat receive the largest share of the
sector budget, although their share has declined very significantly since 2001/02.
These agencies received 89 percent of the budget in 2001/02 compared to 55 percent in
2008/09 (Figure 3). As budget allocations were increasingly decentralized, the share of
sector budget going to NAADS at the district level rose from only 2 percent in 2001/02 to
36 percent in 2008/09. According to the MTEF, 42 percent of the sector budget is
expected to be allocated directly to the sub-national level in 2008/09, a share that is
projected to increase to 51 percent by 2012/13.
6 As of this writing, no data are available on the released budget after 2005/06.
0
20
40
60
80
100
120
140
160
180
2001/02 2002/03 2003/04 2004/05 2005/06
US
hs
bil
l
Nominal approvedbudget
Nominal releasedbudget
Real approvedbudget
Real releasedbudget

6
Figure 3: Structure of the approved budget for agriculture, 2001/02–2008/09
(UShs billions)
Note: MAAIF budget includes the budgets of NARO and the NAADS Secretariat.
Source: MoFPED and MAAIF.
15. Over time, the approved budget for agriculture in relative terms has declined
from a level that was already quite moderate. In 2008/09, agriculture’s share in the
national budget and GDP is estimated at 3.8 percent and 1.6 percent, respectively, lower
than in 2001/02 (Table 1). The released sector budget has declined as well, leaving
agriculture with only 1.2 percent of GDP and 4.8 percent of national expenditure in
2005/06.7 This small budget for agriculture is a long way from the 10 percent share that
Uganda pledged to allocate under the Maputo Declaration of CAADP.
16. In the medium run, national expenditures on agriculture are projected to
continue declining. According to the MTEF, the agricultural sector’s share in the
national budget will be 3.2 percent in 2012/13, compared with 3.8 percent in 2008/09 and
4.6 percent over 2001/02–2007/08 (Table 2). The budget for agriculture as a share of
GDP will also decline from 1.6 percent in 2008/09 to 1.4 percent in 2012/13. Uganda
plans to shift resources to other priorities for sustaining its long-term economic
development, notably to roads, education, and health, which are also expected to help
agriculture and rural areas more broadly, with better access to markets, opportunities for
developing agro-processing industries, and better human capital (Figure 4).
17. In light of this outlook, it is imperative that the shrinking national budget for
agriculture is used as effectively and efficiently as possible at all levels. Strategically, it
will increasingly become more critical for MAAIF to work in collaboration with local
7 The share of agricultural sector expenditure in agricultural GDP also decreased during the period under
review. In 2003/04, the agricultural budget amounted to 9 percent of agricultural GDP, but in 2008/08 it
fell to 6.8 percent (based on the World Development Indicators data on agricultural value added).
0
50
100
150
200
250
2001/02 2002/03 2003/04 2004/05 2005/06 2006/07 2007/08 2008/09
US
hs b
ill
Non-Sectoral Conditional Grant
NAADS (districts)
District Agricultural Extension
UCDA
UCDO
MAAIF

7
governments, which are expected to take increasing responsibility for implementing
public programs as decentralization continues.
Table 1: Shares of the agricultural sector budget in the national budget and
GDP, 2001/02–2008/09 (percent)
2001/02 2002/03 2003/04 2004/05 2005/06 2006/07 2007/08 2008/09
Approved
agriculture budget
as share of national
budget
5.7 5.6 4.1 3.8 4.4 4.6 4.3 3.8
Released agriculture
budget as share of
national budget
8.2 5.5 3.8 3.3 4.8 n/a n/a n/a
Approved
agriculture budget
as share of GDP n/a n/a 1.5 1.4 1.5 1.7 1.6 1.6
Released agriculture
budget as share of
GDP n/a n/a 1.4 1.2 1.2 n/a n/a n/a
Source: MoFPED and MAAIF.
Table 2: Medium-Term Expenditure Framework for the agricultural sector
budget, 2008/09–2012/13 (UShs billions)
Ministry/agency
Average
2001/02–
2007/08
2008/09 2009/10 2010/11 2011/12 2012/13
MAAIF 122.6 122.0 114.5 130.1 131.1 134.4
UCDO 1.5 5.7 7.0 4.2 5.4 6.6
UCDA 2.3 0.9 4.6 2.2 2.7 2.8
District Agricultural
Extension 6.3 7.2 9.2 14.2 14.2 14.2
NAADS (districts) 21.2 81.2 98.7 103.7 108.7 113.7
Nonsectoral conditional grants 6.5 6.2 13.2 18.8 18.7 18.7
TOTAL BUDGET 160.4 223.2 247.2 273.2 280.8 290.5
Agriculture budget as a
percentage of national budget 4.6% 3.8% 3.7% 3.5% 3.4% 3.2%
Agriculture budget as a
percentage of GDP n/a 1.6% 1.5% 1.6% 1.3% 1.4%
Note: MAAIF budget includes NARO and NAADS Secretariat.
Source: MoFPED and MAAIF.

8
Figure 4: Agriculture’s share of the national budget in relation to other sectors,
2007/08–2012/13 (UShs billions)
Source: MoFPED/MTEF (2008).
18. The national expenditure on agriculture is slightly larger when analyzed
based on the United Nations Classification of Functions of Government (COFOG),
but it is still far from the 10 percent committed under CAADP. The COFOG
classification includes budgetary allocations for forestry, water for production, and issues
related to agricultural land, which are directed to the Ministry of Water, Lands, and
Environment (MWLE) and the National Forest Authority (NFA). Table 3 shows the
approved and released budgets for agriculture based on the COFOG classification. In
nominal terms, the approved budget in 2005/06 was the same as it was in 2001/02, after
declining by around 10 percent in 2003/04 and 2004/05—similar to the trend in
MAAIF’s approved budget (Figure 1).8 As a share of the approved national budget,
allocations to agriculture based on the COFOG classification declined continually from
8.1 percent in 2001/02 to 5.7 percent in 2005/06. The released budget for agriculture as a
percentage of the national budget fell from 6.9 percent to 5.4 percent over the same
period.
8 The data for approved and released budgets using the COFOG definition of agriculture is constructed only
until 2005/06 based on data available.
-
1,000
2,000
3,000
4,000
5,000
6,000
7,000
8,000
9,000
10,000
2007/08 2008/09 2009/10 2010/11 2011/12 2012/13
US
hs b
ill
Other sectors
Interest
PublicAdministration
Security
Water &Environment
Roads & Works
Health
Education
Agriculture

9
Table 3: Expenditures on agriculture based on the COFOG classification,
2001/02–2005/06 (UShs billions)
2001/02 2002/03 2003/04 2004/05 2005/06
Budget Release Budget Release Budget Release Budget Release Budget Release
CENTRAL GOVERNMENT
MAAIF*
Recurrent 7.45 5.82 7.85 6.58 6.64 7.22 11.46 10.71 14.49 13.55
Development 127.85 66.81 126.16 82.08 90.66 58.25 85.06 39.37 106.07 60.71
Other COFOG
Lands, Forestry, and Water-for-Production
Recurrent 1.51 1.12 1.84 1.10 1.38 1.12 0.19 0.16 0.24 0.21
Development 63.71 39.58 56.92 31.29 66.46 57.34 48.59 20.83 33.30 19.90
Agencies
DDA 0.50 0.50 0.16 0.16 0.24 0.24 0.22 0.22 0.22 0.22
UCDO 1.26 1.26 0.95 0.95 1.77 1.77 1.98 1.98 1.03 1.03
UCDA 2.12 1.85 1.89 1.76 2.78 2.25 2.61 2.69 2.76 3.12
NFA 0.00 0.00 0.00 0.00 1.03 1.03 10.76 10.76 13.25 13.25
LOCAL GOVERNMENT
Extension
Wage 2.47 2.16 3.06 2.83 3.06 3.19 3.06 3.89 3.08 3.85
Nonwage 3.00 2.90 2.92 2.73 2.92 2.81 2.92 2.92 2.92 2.78
NAADS
(Districts)** 2.57 2.42 5.66 9.32 14.27 13.75 16.02 15.13 27.46 24.87
NSCG*** 6.07 4.44 5.76 4.09 5.96 4.20 6.38 4.01 6.18 4.22
LGDP**** - 1.62 - 1.06 - 1.69 - 1.42 - 0.67
TOTAL 218.51 130.48 213.17 143.95 197.17 154.86 189.25 114.09 211.00 148.38
Government
of Uganda
expenditure 2,686 1,895 2,768 2,720 3,107 3,128 3,380 3,369 3,716 2,760
COFOG
agriculture
budget as %
of national
budget 8.1 6.9 7.7 5.3 6.3 5.0 5.6 3.4 5.7 5.4
Note: * Includes NARO and NAADS Secretariat. ** From 2003/04 an amount appears in this Vote under
Donor Development. This amount cannot be accessed by the NAADS program, and yet in at least one year
it was reported as fully spent. *** NSCG data were made available by the PMA Secretariat and analyzed
by the AgPER Task Team to identify COFOG-relevant agricultural expenditure. **** LGDP figures for
COFOG-relevant agricultural expenditures are based on the AgPER Task Team’s analysis of data provided
by the LGDP Co-ordination Unit.
Source: MoFPED Aid Liaison Department database; information collected by the AgPER Task Team from
MoLG, PMA Secretariat, and NFA; DDA, NFA, UCDO, and UCDA annual reports; MoFPED, various
MTEF projections.
19. Aside from the expenditure already described, there is considerable off-
budget expenditure on agriculture, both centrally and locally, but Uganda lacks a
mechanism for consistently monitoring these funds. The expenditures are fragmented
and it is difficult to obtain information on what is being spent and for what purpose.
Table 4 provides an example of development assistance provided by the United States
Agency for International Development (USAID) and the Swedish International
Development Agency (SIDA), two important players in the agricultural sector in Uganda
who were the only ones willing or able to share the information with the AgPER study
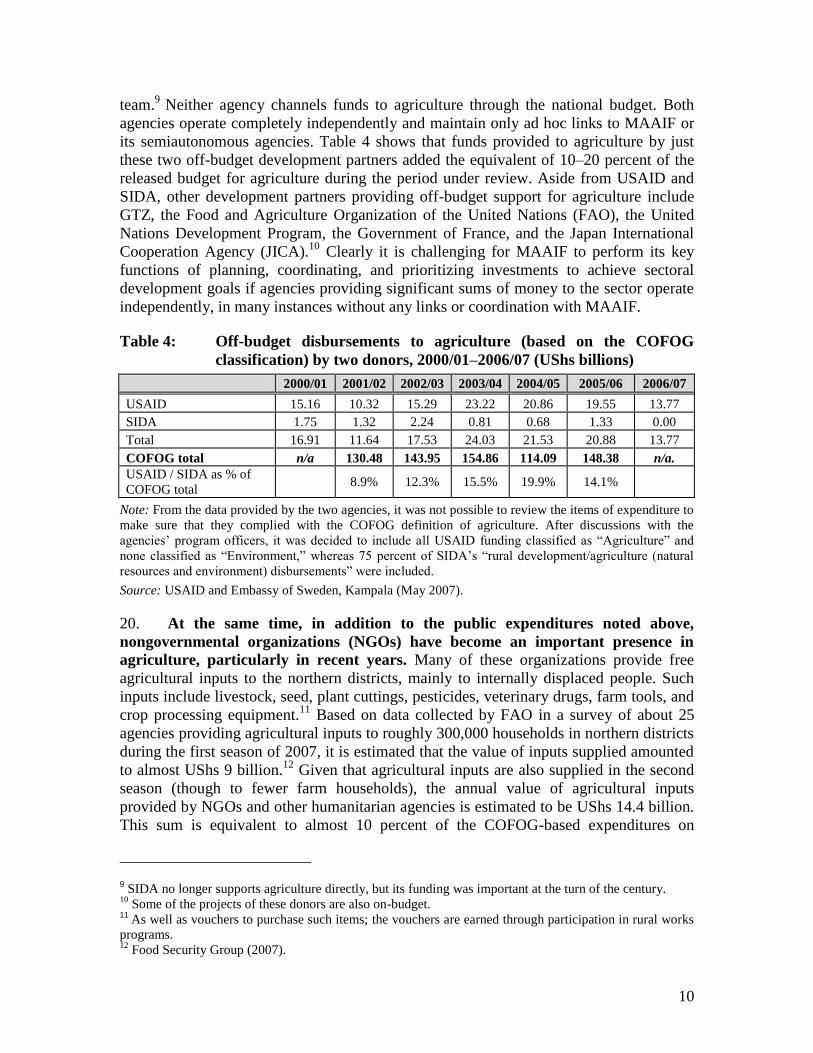
10
team.9
Neither agency channels funds to agriculture through the national budget. Both
agencies operate completely independently and maintain only ad hoc links to MAAIF or
its semiautonomous agencies. Table 4 shows that funds provided to agriculture by just
these two off-budget development partners added the equivalent of 10–20 percent of the
released budget for agriculture during the period under review. Aside from USAID and
SIDA, other development partners providing off-budget support for agriculture include
GTZ, the Food and Agriculture Organization of the United Nations (FAO), the United
Nations Development Program, the Government of France, and the Japan International
Cooperation Agency (JICA).10
Clearly it is challenging for MAAIF to perform its key
functions of planning, coordinating, and prioritizing investments to achieve sectoral
development goals if agencies providing significant sums of money to the sector operate
independently, in many instances without any links or coordination with MAAIF.
Table 4: Off-budget disbursements to agriculture (based on the COFOG
classification) by two donors, 2000/01–2006/07 (UShs billions)
2000/01 2001/02 2002/03 2003/04 2004/05 2005/06 2006/07
USAID 15.16 10.32 15.29 23.22 20.86 19.55 13.77
SIDA 1.75 1.32 2.24 0.81 0.68 1.33 0.00
Total 16.91 11.64 17.53 24.03 21.53 20.88 13.77
COFOG total n/a 130.48 143.95 154.86 114.09 148.38 n/a.
USAID / SIDA as % of
COFOG total 8.9% 12.3% 15.5% 19.9% 14.1%
Note: From the data provided by the two agencies, it was not possible to review the items of expenditure to
make sure that they complied with the COFOG definition of agriculture. After discussions with the
agencies’ program officers, it was decided to include all USAID funding classified as ―Agriculture‖ and
none classified as ―Environment,‖ whereas 75 percent of SIDA’s ―rural development/agriculture (natural
resources and environment) disbursements‖ were included.
Source: USAID and Embassy of Sweden, Kampala (May 2007).
20. At the same time, in addition to the public expenditures noted above,
nongovernmental organizations (NGOs) have become an important presence in
agriculture, particularly in recent years. Many of these organizations provide free
agricultural inputs to the northern districts, mainly to internally displaced people. Such
inputs include livestock, seed, plant cuttings, pesticides, veterinary drugs, farm tools, and
crop processing equipment.11
Based on data collected by FAO in a survey of about 25
agencies providing agricultural inputs to roughly 300,000 households in northern districts
during the first season of 2007, it is estimated that the value of inputs supplied amounted
to almost UShs 9 billion.12
Given that agricultural inputs are also supplied in the second
season (though to fewer farm households), the annual value of agricultural inputs
provided by NGOs and other humanitarian agencies is estimated to be UShs 14.4 billion.
This sum is equivalent to almost 10 percent of the COFOG-based expenditures on
9 SIDA no longer supports agriculture directly, but its funding was important at the turn of the century.
10 Some of the projects of these donors are also on-budget.
11 As well as vouchers to purchase such items; the vouchers are earned through participation in rural works
programs. 12
Food Security Group (2007).

11
agriculture in 2005/06. Considerable care has to be taken, however, to avoid double-
counting in aggregating donors’ budget and off-budget expenditures, because a high
proportion of the national budget is provided by donors. Once again, neither MAAIF nor
the District Production and Marketing Directorates have much knowledge of these
programs or activities, adding to the challenges of sector coordination and harmonization.
21. How does Uganda’s spending on agriculture compare to spending by other
countries? An international comparison shows that Uganda spends relatively less than
other countries (Table 5), when spending is measured as the share of agricultural budget
in GDP (adjusted by the size of the sector). Uganda spends about as much as other Sub-
Saharan African countries but less than middle- and high-income countries. This finding
is consistent with Uganda’s narrower fiscal capacities and its greater need to support
competing public investments in infrastructure and social sectors compared to higher-
income countries.
22. International experience also illustrates that lower public spending does not
always translate into lower agricultural competitiveness. It is well known that in the
United States and the European Union, for example, expensive public support in the form
of huge farm subsidies has failed to keep farmers competitive in world markets, whereas
lower spending in Brazil, Australia, and New Zealand has not prevented their farmers
from being highly competitive. Three conditions must be met to ensure that public
expenditures in agriculture are effective. First, public expenditures on agriculture must be
supported through an enabling environment in which agricultural prices are subject to
few distortions. It is counterproductive to raise the public expenditure on agriculture
when farm-gate prices are depressed. Second, the allocative efficiency of public
expenditures should be high. Spending that does not contribute (or contribute as much as
other types of spending) to major objectives for agriculture, such as economic growth,
private sector investment, and poverty reduction, is allocatively inefficient or
unproductive. Third, the technical efficiency of public expenditures should be high.
Technical efficiency in the public sector involves making the best use of inputs to provide
outputs in the form of public services. In other words, technical efficiency means doing
things well and allocative efficiency means doing the right things. When these three
conditions are met, it is highly probable that even small budgets will be well-positioned
to achieve national objectives for agriculture. The sections and chapters that follow
provide a detailed examination of each of these conditions in Uganda.

12
Table 5: International comparison of budgets for agriculture, average for
2002–04
Income group and country Agriculture as
percentage of
GDP
Agriculture
budget as
percentage of
GDP
Agriculture budget as
percentage of GDP,
adjusted to the size of
the agricultural sector
in each country
A C C/A
High-income countries
Australia 3.0% 0.31% 0.10
Canada 2.3% 0.51% 0.22
EU 2.3% 0.65% 0.28
USA 1.6% 0.73% 0.46
Middle-income countries
Turkey 13.0% 2.0% 0.15
Mexico 4.0% 0.7% 0.18
Venezuela 5.0% 0.5% 0.12
China 15.0% 1.2% 0.08
Brazil 9.3% 0.7% 0.08
Russia* 6.0% 0.95% 0.16
Ukraine 11.6% 1.3% 0.11
Low-income countries
Uganda 32% 1.5% 0.05
Tanzania 45% 1.2% 0.03
Ethiopia** 44% 2.7% 0.06
Kenya 29% 1.3% 0.04
Note: * Data for Russia are for 2003. ** Data for Ethiopia are for 2004/05. To make the data for Ethiopia
comparable to data for other countries, the AgPER Task Team excluded transfers under the vulnerability
and food security program and expenditures on rural energy, mining, federal roads, and water supply.
Source: Estimates derived from: Organization for Economic Cooperation and Development (2004):
Agricultural Policies in OECD Countries: At a Glance. Paris; Tangermann, S. (2006): OECD Work on
Agricultural Policies in Brazil, China, India, and South Africa. Presentation at Rural Week of the World
Bank, Washington, D.C., February 27, 2006; Zorya, S. (2006): Improving Agricultural Fiscal Policy in
Ukraine. World Bank ECSSD Working Paper 36970, Washington, DC; World Bank (2006): Ethiopia
Agricultural and Rural Development: Public Expenditure Review for 1997-98 and 2005-06. Washington,
DC; and Zorya, S. (2008): Rapid Assessment of the 2008/09 Agriculture Public Expenditure in Tanzania.
Washington, DC: World Bank.
2.2. Agricultural policy environment
23. Uganda has successfully addressed a key requisite for efficient public
spending by largely eliminating agricultural price distortions. Uganda’s agricultural
policies provide a conducive environment in which even scarce public resources can
make a difference. The recent World Bank study on agricultural incentives in Uganda

13
shows the shift from agricultural taxation to agricultural support in recent years.13
The
Direct Rate of Assistance (DRA) to agriculture was 1 percent during 2001–2004, with
zero support to exportable products and 13 percent support to importable products
through import tariffs (Table 6).14
For exportable products, this absence of support
represents a large shift from the high taxation (depressed prices) prevalent between 1961
and 1995. The level of support for importable products represents a reduction in taxation
of poor consumers that has only small negative effects on farmers, because Uganda’s
farmers produce only small volumes of these importable products.
Table 6: Distortion indicators for Ugandan agriculture, five-year averages
COMMODITY 1961–
65
1966–
70
1971–
75
1976–
80
1981–
85
1986–
90
1991–
95
1996–
2000
2001–
04
Coffee –0.15 –0.39 –0.64 –0.89 –0.73 –0.74 –0.20 –0.02 –0.01
Cotton –0.13 –0.22 –0.53 –0.80 –0.47 –0.51 –0.04 0.00 0.00
Exportables DRA –0.11 –0.28 –0.59 –0.88 –0.66 –0.66 –0.08 –0.01 0.00
Rice 0.14 0.21 0.52 0.49 0.48 0.36 0.07 0.13 0.18
Importables DRA 0.16 0.22 0.52 0.81 0.48 0.54 0.14 0.14 0.13
Changing status commodities
Maize –0.01 0.08 0.10 0.17 0.00 –0.13 –0.04 0.07 0.00
Beans 0.11 –0.07 0.00 0.00 0.00 0.00 –0.04 0.04 0.00
DRA agriculture 0.00 –0.04 –0.08 –0.14 –0.07 –0.07 –0.01 0.02 0.01
DRA nonagriculture 0.08 0.09 0.13 0.15 0.13 0.13 0.08 0.10 0.08
TRA agriculture –0.08 –0.13 –0.21 –0.29 –0.20 –0.19 –0.09 –0.09 –0.07
Source: Matthews et al. (2006).
24. The aggregate effect of direct distortions on the agricultural sector depends
not just on the size of agricultural policy interventions but also on the size of
distortions generated by policies in sectors outside agriculture. The Total Rate of
Assistance (TRA) to agriculture measures the size of direct distortions in agriculture
relative to those in other sectors. The latter are captured by the nominal direct rate of
assistance to nonagricultural production. The higher the assistance to nonagricultural
production, the more other sectors are in a position to attract resources away from
agriculture, adding to the discrimination against this sector or reducing the value of any
positive assistance that may be granted.
13 Matthews, A., P. Claquin, and J. Opolot (2006): Distortions to Agricultural Incentives in Uganda. World
Bank Agricultural Distortions Research Project. Washington, DC. 14
The methodology for estimating DRA resembles the widely used OECD methodology for ―rate of
protection.‖ During 2006–07, the World Bank Agricultural Distortions Research Project (which prepared
reports for many countries, including Uganda) adjusted the original OECD Producer Support Estimates to
the Bank’s methodology for producer assistance, and the new term ―rate of assistance‖ was introduced to
distinguish between Bank and OECD estimates.

14
Figure 5: Agricultural sector Total Rate of Assistance, Uganda, 1961–2004
Source: Matthews et al. (2006).
25. Various policy measures were included in computing the nonagricultural
rate of assistance: customs duties, export taxes (applied on copper, hides, and skins
in some years up to 1977), the import commission and withholding tax, and the
differential application of sales tax and VAT. Other nontariff barriers were not
included in the absence of specific information; these may have been important in earlier
decades but have been phased out since market liberalization. Table 6 and Figure 5
illustrate the notable decrease in nonagricultural rate of assistance and corresponding
improvement in the TRA to agriculture. As a result, during 2001–04 some small positive
protection (1–2 percent) of the agricultural sector arose from direct policies alone (due to
the continued protection of importables after government interventions were abolished on
exportables). Even so, this level of protection remains smaller than the positive protection
of the nonagricultural sector, which averages 8 percent. Thus at present a small negative
bias remains in incentives for agricultural production in Uganda. This small bias does not
have a large negative impact on spending in agriculture, however, so the current policy
environment for agriculture in Uganda may fairly be described as enabling public
expenditure to have a lasting impact.
2.3. Economic composition of the sector budget
26. What determines the allocative efficiency of public expenditures on
agriculture? Spending is allocated efficiently when it is used to support the ―right‖
things—in this instance, the priorities that are most capable of spurring pro-poor growth.
The analysis of allocative efficiency examines the economic and functional composition
-0.6
-0.4
-0.2
0.0
0.2
0.4
0.6
1961
1963
1965
1967
1969
1971
1973
1975
1977
1979
1981
1983
1985
1987
1989
1991
1993
1995
1997
1999
2001
2003
NRA non-agriculture DRA agriculture TRA agriculture
Post-Independence Collapse Recovery Post-liberalization

15
of the budget for agriculture.15
The economic composition is presented first for MAAIF
and then for the overall budget for agriculture.
27. In determining the economic composition of public expenditures on
agriculture, expenditures are first classified into recurrent and development
expenditures. Recurrent expenditures are further divided into ―wage bill‖ (employee
salaries, allowances, and other wage costs) and ―nonwage‖ recurrent expenditures.
Because ―development‖ and ―capital‖ expenditures no longer synonymous, they are
decomposed into ―current‖ and ―capital‖ expenditures.
28. The development budget constitutes the largest share of MAAIF’s budget. In
2001/02, its share was 96 percent and remains substantial at 76 percent in 2008/09
(Figure 6). On average, the share of development spending in MAAIF’s budget was 88
percent during the period under review.
Figure 6: MAAIF recurrent and development budgets, 2001/02–2008/09 (UShs
billions)
Source: MoFPED (various years).
29. The structure of the recurrent budget for MAAIF is presented in Table 7.
The recurrent budget consists of employee costs (the wage bill), use of goods and
services, grants to other organizations, and domestic arrears. MAAIF’s recurrent budget
fluctuated significantly because of substantial variation in grants and in allocations to pay
domestic arrears. On average, these two items constitute 55 percent of recurrent budget
allocations, with the remainder covering the more common items in a recurrent budget,
such as wages and recurrent operational costs of MAAIF staff.
15 Given the lack of detailed data on released budgets, the analysis of economic and functional composition
relies only on data for approved budgets.
0
10
20
30
40
50
60
70
80
90
100
2001/02 2002/03 2003/04 2004/05 2005/06 2006/07 2007/08 2008/09
USh
s bi
ll Development
expenditure
Recurrent
expenditure

16
Table 7: MAAIF recurrent budget allocation, 2001/02–2008/09 (UShs billions)
Year Wage bill Use of goods and
services
Grants Including
grants as a
wage
subvention
Domestic
arrears
Total
budget
2001/02 1.57 2.17 1.56 0.03 3.18 8.48
2002/03 2.22 1.48 0.56 0.03 0.75 5.01
2003/04 2.22 1.93 6.25 2.77 0.17 10.57
2004/05 2.17 1.11 4.76 1.99 0.00 8.04
2005/06 2.47 1.94 3.48 2.03 2.25 10.13
2006/07 2.49 2.26 3.13 1.55 1.46 9.35
2007/08 2.53 4.01 3.49 1.89 4.38 14.41
2008/09 2.60 4.30 4.98 1.94 4.87 16.76
Source: MoFPED (various years).
30. What grants are made by MAAIF? Table 8 lists all grants and shows the
importance of these subventions to autonomous institutions. On average, these
subventions made up about 90 percent of the grants over the period under review, with
half being wage subventions. Grants have grown larger since 2003/04. Large grants are
channeled mainly by the following programs:
Crop Production Department, to finance the NAADS Secretariat before it was
allocated a separate Vote.
Directorate of Animal Resources, to support the National Animal Genetic
Resource Centre and Databank.
Department of Animal Production, to finance the Dairy Development
Authority.
Department of Farm Production, to fund the PMA Secretariat and, in 2006/07,
a contribution to the Inter-Governmental Authority on Drought and
Development.
Department of Livestock Health and Entomology, to fund the Coordinating
Office for the Control of Trypanosomes in Uganda.
Table 8: Allocation to grants in the MAAIF approved recurrent budget,
2001/02–2008/09 (UShs billions)
2001/02–
2002/03
2003/04–
2006/07 2007/08 2008/09
1. Other grants 0.24 0.22 0.13 0.13
2. Contributions to international organizations 0.17 0.20 0.19 0.19
3. Grants to central government ministries 0.73 0.15 0.03 0.27
4. Contributions to autonomous organizations 0.01 1.80 1.25 2.46
5. Wage subventions to autonomous organizations 0.03 1.96 1.89 1.94
Total grants 1.18 4.33 3.49 4.98
Source: MoFPED (various years).
31. Domestic arrears are another share of the recurrent budget that is not
available for MAAIF to pursue its activities. Domestic arrears are debt liabilities to

17
various entities that have provided goods and services to MAAIF in previous years, such
as input suppliers and contractors. In 2001/02, domestic arrears constituted 38 percent of
MAAIF’s recurrent budget (Table 7). Although the arrears were fully repaid by 2004/05,
they began to grow again in 2005/06. In 2008/09, MAAIF had to use 29 percent of its
recurrent budget to pay debts. The rising accumulation of domestic arrears demands that
serious attention be given to paying bills on time. Otherwise the Ministry’s future budgets
will be utterly consumed by debt payments.
32. After the deduction of grants and domestic arrears, how was the remaining
recurrent budget spent? ―Headquarters‖ has typically absorbed the lion’s share of the
approved recurrent budget (Table 9), with a 34 percent share in 2008/09, down from 40
percent in 2005/06. The allocation to Headquarters is high partly because Headquarters
finances some expenses incurred by all departments, such as telecommunications,
electricity, water, and security guards (25 percent of the Headquarters budget). Other
major costs (42 percent) include travel (inland and abroad), fuel, and vehicle
maintenance; one reason for this is that MAAIF is located in Entebbe and many meetings
taken place in Kampala. Yet the high Headquarters allocation is not fully explained by
any of these facts. It remains important to reduce Headquarters costs with the objective of
shifting more resources to other departments so that MAAIF’s technical staff can do their
work. The crop programs had usually received one-quarter of the recurrent budget but
now receive less, as funds have been shifted to fisheries. The share of the livestock
subsector doubled between 2005/06 and 2008/09, when it absorbed 42 percent of
MAAIF’s recurrent budget. Allocations to the Department of Planning have fallen in
recent years.
Table 9: Percentage distribution of MAAIF’s recurrent budget by department
(excluding grants and domestic arrears), 2005/06–2008/09
2005/06 2006/07 2007/08 2008/09
01 Headquarters 39.6 40.6 32.4 33.9
02 Directorate of Crop Resources 0.9 0.9 0.6 0.6
03 Farm Development Department 7.5 7.2 5.1 4.8
04 Crop Protection Department 17.0 16.8 12.4 11.1
05 Crop Production Department 4.4 3.6 3.2 3.0
Subtotal crops 29.8 28.4 21.2 19.5
06 Directorate for Animal Resources 1.4 1.2 1.1 1.1
07 Animal Production Department 6.4 7.1 4.9 7.5
08 Livestock Health and Entomology 7.6 7.0 5.1 4.8
09 Fisheries Department 8.9 8.7 30.8 28.9
Subtotal livestock 24.5 24.0 41.9 42.4
10 Department of Planning 6.1 6.9 4.5 4.3
Total recurrent budget (UShs billions) 4.40 4.76 6.54 6.90
Source: MoFPED (various years).
33. How has MAAIF’s recurrent budget been distributed between wage and
nonwage expenditures? Until 2007/08, each type of expenditure accounted for about half
of the recurrent budget. The most important nonwage recurrent expenses were travel,
fuel, and vehicle maintenance. Starting in 2007/08, nonwage recurrent expenditures grew
to almost two-thirds of MAAIF’s recurrent budget, owing to the large allocation (UShs

18
1.6 billion per annum) to the Fisheries Department (Table 10). However, going beyond
the average for MAAIF, the breakdown across different spending units shows that the
ratio of wage to nonwage recurrent expenditures is very unevenly distributed. While the
ratio is in a comfortable range for MAAIF Headquarters, and for the past two years for
the Fisheries Department, for all other technical departments/units, including core
functions such as pest and disease control, the ratio is very high, indicating that most of
these departments are severely constrained in terms of operating funds, which prevents
them from being effective.
Table 10: Main parts of MAAIF’s recurrent budget (excluding grants and
domestic arrears), 2005/06–2008/09 (UShs billions)
2005/06 2006/07 2007/08 2008/09
Wage bill 2.47 2.49 2.53 2.60
Salaries 96.5% 96.6% 96.3% 93.3%
Allowances and other employee costs 3.5% 3.4% 3.7% 6.7%
Nonwage recurrent 1.94 2.26 4.01 4.30
Goods and services 3.0% 3.0% 42.1% 43.4%
Travel 20.4% 22.3% 12.3% 13.5%
Fuel and lubricants 10.8% 9.5% 5.5% 6.1%
Vehicle maintenance 11.3% 9.1% 5.9% 5.3%
Recurrent budget 4.40 4.76 6.54 6.90
Source: MoFPED (various years).
34. What are the trends in MAAIF’s development budget? As noted, between
2005/06 and 2008/09, development expenditure accounted for about 83 percent of
MAAIF expenditures. MAAIF has executed 24 development projects. The seven
principal projects constituted 82 percent of the development budget.16
Donors financed
85 percent of MAAIF’s development budget, as government allocations diminished from
20 percent in 2005/06 to 13 percent in 2007/08 (Table 11). The main donors are African
Development Bank (ADB), World Bank, International Fund for Agricultural
Development (IFAD), the European Union, the Danish International Development
Agency (DANIDA), and the United Nations Development Program. When one adds the
development expenditure of NARO and NAADS, however, the share of donor finance in
the agricultural development budget declines and the share of government financing rises
to 49 percent in 2007/08 and (even higher) 65 percent in 2008/09.
16 These projects are the North-West Smallholder Agricultural Development Project (11.6 percent);
National Livestock Productivity Improvement Project (19.7 percent); Livestock Disease Control (6.6
percent); Support to Fisheries Development (17.1 percent); Farm Income Enhancement Project (8.5
percent); Vegetable Oil Development Project (15.6 percent); and Farming in Tsetse Areas of East Africa
(3.6 percent).

19
Table 11: Sources of funding for the development budget, 2005/06–2008/09
(UShs billions)
2005/06 2006/07 2007/08 2008/09 Average Share,
%
MAAIF
Donor financing 51.89 51.21 63.02 44.17 52.57 84.2%
Government financing 12.98 7.28 9.67 9.63 9.89 15.8%
MAAIF development budget 64.87 58.49 72.69 53.79 62.46 100.0%
NARO
Donor financing 21.19 19.22 20.21 54.5%
Government financing 17.20 17.20 17.2 45.5%
NARO development budget n/a n/a 38.39 36.44 37.42 100.0%
NAADS
Donor financing 1.47 1.47 2.3%
Government financing 54.08 92.54 73.31 97.7%
NAADS development budget n/a n/a 55.55 92.54 74.05 100.0%
TOTAL AGRICULTURAL SECTOR BUDGET
Donor financing 85.68 63.39 74.25 42.7%
Government financing 80.95 119.37 100.40 57.7%
Total development budget n/a n/a 166.63 182.77 173.93 100.0%
Note: The development budget may deviate slightly from the official estimate because different exchange
rates were used to convert foreign financing from US dollars and Euros to Ugandan shillings. The year-
average market exchange rates reported by Uganda Central Bank were used for this AgPER.
Source: MoFPED (various years).
35. What share of the development budget is allocated to wages, nonwage
recurrent, and capital outlays? These data were not readily available but were collected
through rigorous analysis of documents and information for each MAAIF development
project. Table 12 indicates that nonwage recurrent expenditures made up 65 percent of
MAAIF’s development budget over the study period. The share of capital outlays ranged
from 19 percent in 2006/07 to 25 percent in 2008/09. The time has long since passed
when ―capital‖ and ―development‖ expenditures were synonymous, and Table 12 shows
that in practice the separation of ―recurrent‖ and ―development‖ spending is not being
properly applied. The wage bill accounted for the remaining 11 percent of expenditures in
the development budget.
Table 12: The economic composition of MAAIF’s development budget, 2005/06–
2008/09 (UShs billions)
2005/06 2006/07 2007/08 2008/09 Average Share,
(%)
Wage bill 6.41 8.30 7.70 5.30 6.93 11.1%
Nonwage recurrent 41.29 39.16 45.58 35.30 40.33 64.6%
Capital outlays 17.17 11.03 19.41 13.23 15.21 24.3%
Development budget 64.87 57.45 69.58 52.33 60.86 100.0%
Source: AgPER Task Team estimate, based on MoFPED (various years).
36. The detailed disaggregation of MAAIF’s development budget is presented in
Table 13. The wage bill makes up 11 percent of the development budget, with

20
allowances dominating. Allowances are difficult to control and target to the right
priorities. Attention must be given to this probably unsustainable source of growth in the
wage bill.
Table 13: The detailed economic composition of MAAIF’s development budget,
2005/06–2008/09 (UShs billions)
2005/06 2006/07 2007/08 2008/09 Average Share,
(%)
Wage bill 6.41 8.30 7.70 5.30 6.93 11.1%
Salaries 0.90 0.99 1.16 0.80 0.96 1.5%
Allowances 5.51 7.21 6.44 4.50 5.97 9.3%
Nonwage recurrent 41.30 39.16 45.58 35.30 40.33 64.6%
Goods and services 20.39 18.47 30.63 28.14 24.41 39.1%
Medical and veterinary
supplies
3.04 1.72 0.80 0.68 1.56 2.5%
Capital outlays 17.17 11.03 19.41 13.23 15.21 24.3%
Nonresidential buildings 8.16 4.47 10.03 4.75 6.85 11.0%
Other structures (markets) n/a 2.51 5.93 5.30 4.58 7.3%
Machinery and equipment 2.21 0.25 0.28 0.02 0.70 1.1%
Livestock 0.64 0.30 n/a n/a 0.23 0.4%
Irrigation n/a 0.28 0.20 0.01 0.12 0.2%
Roads and bridges 4.98 2.70 0.90 0.69 2.31 3.7%
Land 1.18 n/a 2.00 1.15 1.15 1.8%
Development budget 64.87 58.49 72.69 53.83 62.47 100.0%
Source: AgPER Task Team estimate, based on MoFPED (various years).
37. The most substantial share of the nonwage recurrent budget was allocated to
goods and services. On average, goods and services made up 61 percent of the nonwage
recurrent and 39 percent of MAAIF’s development budget (Table 13). According to
project documents, the category ―goods and services‖ comprises seed, fertilizer,
pesticide, and other agricultural inputs.17
In most cases these are hidden input subsidies.
Their share grew from 49 percent of the nonwage recurrent budget in 2005/06 to 80
percent in 2008/09. The subsidized inputs were distributed through various projects and
increasingly through NAADS. In 2008/09, NAADS received an additional UShs 37
billion ―for inputs to the small-scale farmers who cannot afford to purchase the necessary
inputs.‖18
Input delivery has been supply driven, however. Little has been done to
strengthen private networks of agro-dealers and improve subsidy targeting (through
vouchers, for example). Consequently, as currently implemented, most programs do not
meet the requirements for ―market-supporting smart subsidies‖ described in Box 1,
especially because they have tended to benefit the wealthiest rural households.19
As
allocations for subsidized inputs grow, the fiscal burden and economic distortions
17 The information is, however, insufficient to disaggregate this category into specific input subcategories.
18 The Budget Speech for the FY 2008/09 dated to June 12, 2008.
19 See the incidence analysis of various types of public expenditure in Section 4.6.

21
(wastage, leakage, and the displacement of input sales from the private to the public
sector) will grow as well, unless the input delivery mechanism remains unchanged.20
Box 1: What are the conditions for ―smart‖ input subsidies?
There are compelling rationales for implementing ―market smart‖ subsidy programs when markets do not
function properly. Voucher systems have proven more effective for providing inputs and less likely to
distort input markets than the direct subsidies and centralized input procurement and distribution systems
used intensively in the past. The benefits of a smart subsidy include increased agricultural output, the
promotion of private input markets, and increased adoption of new technologies by poor farmers, all of
which ultimately result in sustained poverty reduction.
But achieving benefits depends greatly on how the program is designed and implemented. The experience
from several African countries, especially Malawi, Tanzania, and Zambia, provides practical guidelines for
maximizing the effectiveness of input subsidies in meeting the objectives of improving food security,
alleviating hunger, and increasing equity. To be ―market smart,‖ input subsidies should: (i) be directed at
poor farmers to encourage incremental input use by people would not otherwise use inputs; (ii) not displace
existing commercial sales; (iii) use vouchers, matching grants, or other instruments and strengthen existing
private distribution systems; and (iv) be introduced for a limited period, with a clear schedule for phasing
out once their purpose has been achieved.
Source: Morris, M., V.A. Kelly, R.J. Kopicki, and D. Byerlee (2007): Fertilizer Use in African Agriculture: Lessons Learned and
Good Practice Guidelines. Washington, DC: World Bank, and World Bank, World Development Report 2008: Agriculture for Development (Washington, DC: World Bank, 2007).
38. The share of capital outlays remained stable but relatively low at 24 percent
during the study period. Notably, the capital investment budget was smaller than
the budget for goods and services. The largest infrastructure elements are livestock and
wholesale markets, rural communal roads and bridges, and machinery and equipment
(Table 13). Investments in irrigation to boost agricultural production and reduce farmers’
dependence on rainfall remain extremely low. This trend should be reversed to spur
agricultural growth in Uganda.
39. What is the economic composition of MAAIF’s consolidated recurrent and
development expenditures? Table 14 shows wage, nonwage recurrent, and capital
expenditures across the ―recurrent‖ and ―development‖ budget. When MAAIF’s recurrent
budget is added, the share of the wage bill and nonwage recurrent expenses grows to 14
percent and 64 percent, respectively, while the share of capital outlays falls to 22 percent.
Figure 7 illustrates the growing trend for nonwage recurrent expenditures and the
declining trend for capital expenditures during the period under review.
20 Section 4 presents many examples of low technical efficiency of input and vaccine delivery in selected
districts of Uganda.

22
Table 14: Economic composition of MAAIF’s budget (excluding grants and
domestic arrears), 2005/06–2008/09 (UShs billions)
2005/06 2006/07 2007/08 2008/09
REC DEV TOT REC DEV TOT REC DEV TOT REC DEV TOT
Wage bill 2.5 6.4 8.9 2.5 8.3 10.8 2.5 7.7 10.2 2.6 5.3 7.9
Nonwage
current 1.9 41.3 43.2 2.3 39.2 41.5 4.0 45.6 49.6 4.3 35.3 39.6
Capital
outlays 0.0 17.2 17.2 0.0 11.0 11.0 0.0 19.4 19.4 0.0 13.2 13.2
MAAIF
budget 4.4 64.9 69.3 4.8 58.5 63.3 6.5 72.7 79.2 6.9 53.8 60.7
Source: AgPER Task Team estimate, based on MoFPED (various years).
Figure 7: Economic composition of MAAIF’s budget (excluding grants and
domestic arrears), 2005/06–2008/09 (UShs billions)
Source: AgPER Task Team estimate, based on MoFPED (various years).
40. The share of capital outlays becomes even smaller in the context of the
recurrent and development budgets of the autonomous organizations. Most of the
budget allocations to NARO and NAADS go to pay wages, finance operational expenses,
and increasingly to provide goods and inputs through NAADS and other development
projects, as reported previously. As a result, capital outlays constitute only 8.5 percent of
the agriculture budget, with the wage bill absorbing 31.5 percent and nonwage recurrent
expenses 60.1 percent (Figure 8).
-
10
20
30
40
50
60
70
80
90
2005/06 2006/07 2007/08 2008/09
Ush
s b
ill
Capital outlays
Non-wage recurrent
Wage bill

23
Figure 8: Economic composition of the agricultural sector budget, 2005/06–
2008/09 (UShs billions)
Note: The sector budget comprises MAAIF, NARO, UCDA, UCDO, NAADS Secretariat, NAADS
districts, and district extension. It is assumed that 60 percent of the NARO and NAADS Secretariat
development budget is allocated to wages, with the rest allocated to nonwage recurrent expenditures. For
NAADS districts, it is assumed that about 30 percent of the development budget goes to wages, with the
rest going to nonwage recurrent spending.
Source: AgPER Task Team estimate, based on MoFPED (various years).
41. Is the present economic composition of sector expenditure appropriate to
enhance pro-poor agricultural growth in Uganda? There are several reasons to believe
that the current economic composition of expenditures requires improvement. First, too
little capital funding is allocated to construct markets, link remote areas to road networks,
rehabilitate and expand irrigation systems, upgrade veterinary and sanitary and
phytosanitary laboratories, and improve access to livestock breeds. The share of capital
outlays in the sector budget fell to 6 percent in 2008/09 from an already low level of 11
percent in 2005/06. Although there is a significant need for capital to ease the binding
constraints in the agricultural sector, as outlined in the Country Economic Memorandum
(2007), a greater share of spending is needed to finance capital investments.
42. A second reason for improving the current economic composition is the rapidly
rising share of the budget devoted to providing subsidized inputs. Accessible supplies of
inputs are integral to raising agricultural productivity, but supply-driven subsidies that do
not provide benefits for the poorest21
and do not support the development of private input
markets are likely to fail and crowd out much desirable capital investment at the same
time.
21 See the incidence analysis of public expenditures in Section 4.6.
-
50
100
150
200
250
2005/06 2006/07 2007/08 2008/09
US
hs
bill
Capital outlays
Non-wage recurrent
Wage bill
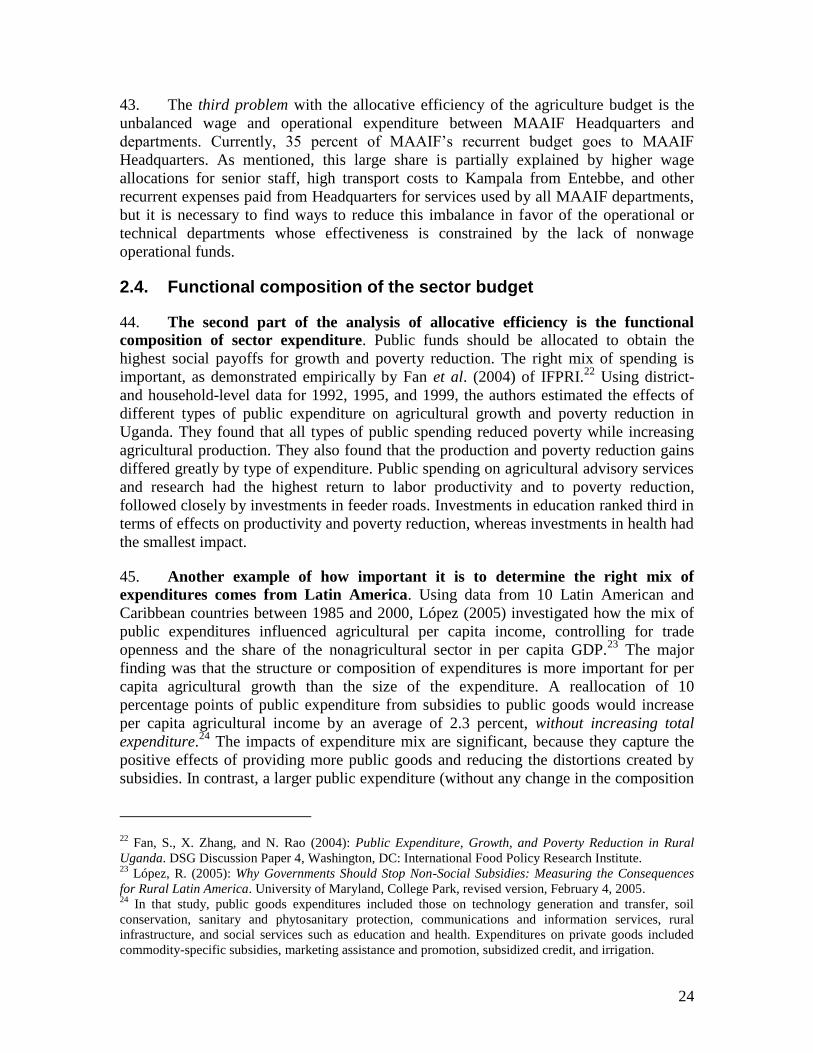
24
43. The third problem with the allocative efficiency of the agriculture budget is the
unbalanced wage and operational expenditure between MAAIF Headquarters and
departments. Currently, 35 percent of MAAIF’s recurrent budget goes to MAAIF
Headquarters. As mentioned, this large share is partially explained by higher wage
allocations for senior staff, high transport costs to Kampala from Entebbe, and other
recurrent expenses paid from Headquarters for services used by all MAAIF departments,
but it is necessary to find ways to reduce this imbalance in favor of the operational or
technical departments whose effectiveness is constrained by the lack of nonwage
operational funds.
2.4. Functional composition of the sector budget
44. The second part of the analysis of allocative efficiency is the functional
composition of sector expenditure. Public funds should be allocated to obtain the
highest social payoffs for growth and poverty reduction. The right mix of spending is
important, as demonstrated empirically by Fan et al. (2004) of IFPRI.22
Using district-
and household-level data for 1992, 1995, and 1999, the authors estimated the effects of
different types of public expenditure on agricultural growth and poverty reduction in
Uganda. They found that all types of public spending reduced poverty while increasing
agricultural production. They also found that the production and poverty reduction gains
differed greatly by type of expenditure. Public spending on agricultural advisory services
and research had the highest return to labor productivity and to poverty reduction,
followed closely by investments in feeder roads. Investments in education ranked third in
terms of effects on productivity and poverty reduction, whereas investments in health had
the smallest impact.
45. Another example of how important it is to determine the right mix of
expenditures comes from Latin America. Using data from 10 Latin American and
Caribbean countries between 1985 and 2000, López (2005) investigated how the mix of
public expenditures influenced agricultural per capita income, controlling for trade
openness and the share of the nonagricultural sector in per capita GDP.23
The major
finding was that the structure or composition of expenditures is more important for per
capita agricultural growth than the size of the expenditure. A reallocation of 10
percentage points of public expenditure from subsidies to public goods would increase
per capita agricultural income by an average of 2.3 percent, without increasing total
expenditure.24
The impacts of expenditure mix are significant, because they capture the
positive effects of providing more public goods and reducing the distortions created by
subsidies. In contrast, a larger public expenditure (without any change in the composition
22 Fan, S., X. Zhang, and N. Rao (2004): Public Expenditure, Growth, and Poverty Reduction in Rural
Uganda. DSG Discussion Paper 4, Washington, DC: International Food Policy Research Institute. 23
López, R. (2005): Why Governments Should Stop Non-Social Subsidies: Measuring the Consequences
for Rural Latin America. University of Maryland, College Park, revised version, February 4, 2005. 24
In that study, public goods expenditures included those on technology generation and transfer, soil
conservation, sanitary and phytosanitary protection, communications and information services, rural
infrastructure, and social services such as education and health. Expenditures on private goods included
commodity-specific subsidies, marketing assistance and promotion, subsidized credit, and irrigation.
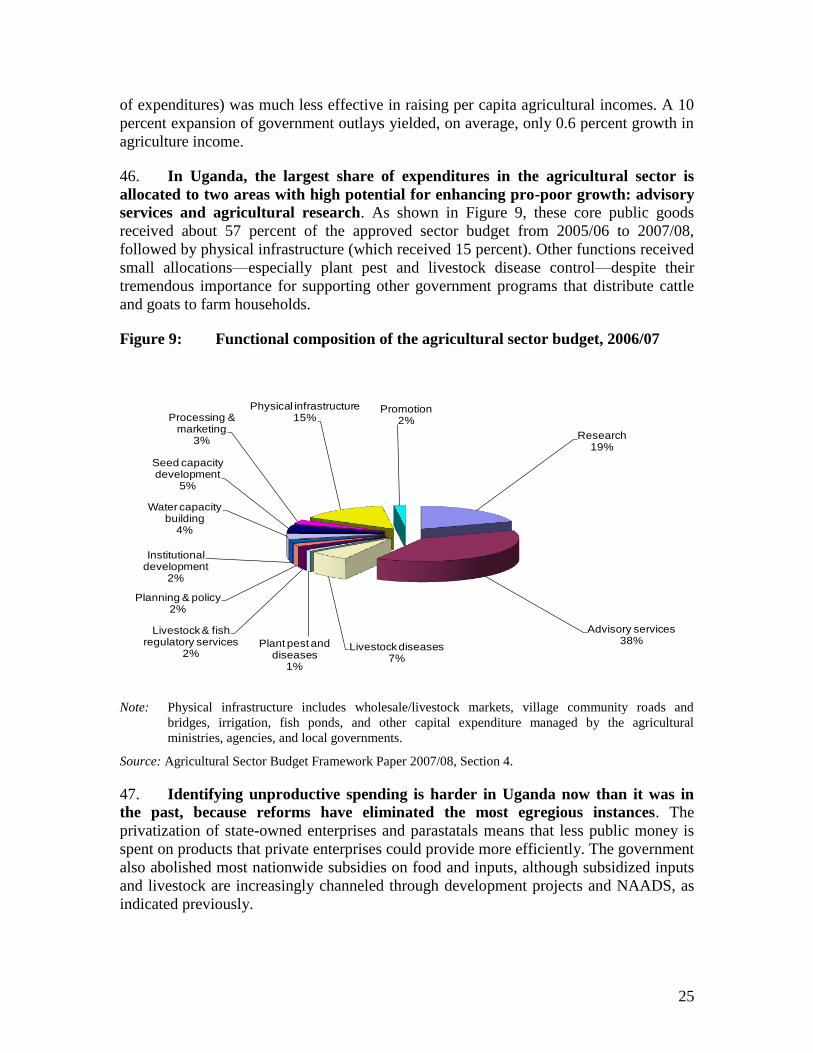
25
of expenditures) was much less effective in raising per capita agricultural incomes. A 10
percent expansion of government outlays yielded, on average, only 0.6 percent growth in
agriculture income.
46. In Uganda, the largest share of expenditures in the agricultural sector is
allocated to two areas with high potential for enhancing pro-poor growth: advisory
services and agricultural research. As shown in Figure 9, these core public goods
received about 57 percent of the approved sector budget from 2005/06 to 2007/08,
followed by physical infrastructure (which received 15 percent). Other functions received
small allocations—especially plant pest and livestock disease control—despite their
tremendous importance for supporting other government programs that distribute cattle
and goats to farm households.
Figure 9: Functional composition of the agricultural sector budget, 2006/07
Note: Physical infrastructure includes wholesale/livestock markets, village community roads and
bridges, irrigation, fish ponds, and other capital expenditure managed by the agricultural
ministries, agencies, and local governments.
Source: Agricultural Sector Budget Framework Paper 2007/08, Section 4.
47. Identifying unproductive spending is harder in Uganda now than it was in
the past, because reforms have eliminated the most egregious instances. The
privatization of state-owned enterprises and parastatals means that less public money is
spent on products that private enterprises could provide more efficiently. The government
also abolished most nationwide subsidies on food and inputs, although subsidized inputs
and livestock are increasingly channeled through development projects and NAADS, as
indicated previously.
Research19%
Advisory services38%
Livestock diseases7%
Plant pest and diseases
1%
Livestock & fish regulatory services
2%
Planning & policy2%
Institutional development
2%
Water capacity building
4%
Seed capacity development
5%
Processing & marketing
3%
Physical infrastructure15%
Promotion2%

26
48. To identify unproductive public spending on agriculture in Uganda now, it is
necessary to focus on whether the composition of public spending is in line with
development priorities, whether the economic composition of spending is
appropriate, and whether the government is using the right mechanisms (delivery
instruments) to do the right things (technical efficiency). The economic composition
of public agricultural expenditures was analyzed in Section 2.3, and their technical
efficiency will be analyzed in Section 4. Here, the analysis will focus on the extent to
which current public spending is aligned with the government’s priorities.
49. How well is the functional composition of expenditures aligned with the
government’s priorities for agriculture? The Government of Uganda describes its
priorities for the agricultural sector in the MAAIF Development Strategy and Investment
Plan, prepared in 2006. The DSIP presents the justification for a strategy to achieve
sustained growth in agricultural productivity and poverty reduction and estimates the
costs of high-priority investments to achieve those objectives. The DSIP is supposed to
be used to prioritize and define spending plans during the budgetary process each year.
Table 15 shows the extent to which MAAIF’s annual budgets25
(including expenditures
for development, recurrent costs, and district grants, which fall within the MAAIF
portfolio) are aligned with projections for the three years covered in the DSIP. Clearly
advisory services have been accorded higher priority in practice than planned, whereas
allocations to research have remained in line with DSIP projections. Together, advisory
services and research receive 59 percent of available funds, compared with the DSIP
projection of 48 percent. Both of these subsectors are accorded high priority in the
Poverty Eradication Action Plan (PEAP).
25 MAAIF’s recurrent budget was allocated on a pro-rata basis, in accordance with the proportion of other
funds allocated to each priority area. This approach was used because of the difficulty of allocating
recurrent funds to individual priority areas.

27
Table 15: Proportion of MAAIF budget allocated to DSIP priority areas,
compared with DSIP projections, 2005/06 to 2007/08 (percent)
Budget allocations Average
over the
period
DSIP
average 2005/06 2006/07 2007/08
Research 17 19 23 20 19
Advisory services 30 45 41 39 29
Livestock disease 9 7 4 7 6
Plant pests and diseases 1 1 0 1 5
Livestock and fish regulatory services 2 2 2 2 5
Planning and policy 2 2 1 2 1
Institutional development 4 1 0 2 9
Water capacity building 3 4 4 4 10
Seed capacity development 9 3 3 5 8
Processing and marketing 7 2 2 3 3
Physical infrastructure 12 14 18 15 5
Promotion 3 1 1 2 1
Source: MAAIF internal documents and discussions with MAAIF staff; MAAIF (2006).
50. With respect to other priority areas identified in the DSIP, notable
discrepancies appear between actual average budget allocations over the three years
and the DSIP projections. The most obvious difference is in the high proportion of
funds budgeted for physical infrastructure compared with the proportion originally
planned in the DSIP—15 percent compared with 5 percent. This discrepancy may be
explained partly by delays in implementing the infrastructure component of development
projects in previous years and a sudden increase in allocations to this activity in the
period under review. Yet whatever the reasons for this discrepancy, the capital
expenditure is desirable and should be increased from current low levels in terms of both
actual spending and planned spending in the DSIP.
51. Worryingly, the emphasis given in the PEAP to disease control has not been
reflected in the proportion of funds allocated to this activity in MAAIF’s annual
budgets. Plant pest and disease control has received less than 1 percent of total resources,
compared with the 5 percent originally planned, while the proportion of funding allocated
to livestock disease control has fallen in each of the three years, even if the average is
close to that projected in the DSIP. Other significantly underfinanced functions include
investments in livestock and fish regulatory services, water capacity building, and
institutional development. These are all core public goods and essential investments at
Uganda’s current stage of development. The private sector will not invest in most of
them, but they are important to catalyze private investments in agricultural production
and agribusiness. Core public goods are also critical for ensuring that the geographically
focused interventions of development projects are sustainable in the sense that local
farmers still have access to markets and services after the development projects end. Last
but not least, public investments in public goods are necessary to complement other
interventions. Section 4 shows how the small and declining budget for controlling
livestock diseases, for example, prevents the Veterinary Department from detecting and
controlling the most infectious and dangerous diseases in a timely way, with the result

28
that resources have been wasted in promoting vaccines with limited effectiveness. Failure
to invest in public goods has also diminished the impact of NAADS by burdening it with
an additional function—input distribution—which lies outside its mandate to provide
advisory services.
52. Finally, the share of budget allocated to each priority area varies
considerably from one year to the next. The approved budgets are less evenly balanced
than the planned budgets presented in the DSIP, with a greater concentration of resources
on fewer priorities: Five priority areas received 86 percent of MAAIF budget allocations
over the three-year period, compared with 75 percent in the DSIP. Based on this
information, it may be concluded that the DSIP has not been used to draw up subsector
budgets, which detracts from the value of the document and the effort involved in its
preparation. Preparation of the second DSIP, covering 2008/09–2010/11, should include
an analysis of future budget requirements by program, based on a realistic assessment of
the resources that will be available. The objectives and work plan for each priority area
should also clearly define its functions, specify budgets for these functions, and ensure
that these functions are fully aligned with national development strategies and programs,
such as PEAP and PMA.

29
3. Budget Process and Performance
53. The effectiveness of public expenditures depends, among other things, on
budget preparation and implementation. Parliamentary approval of the sector budget
is no guarantee that all approved funds will be released and spent. If funds are released at
unpredictable times, or if their release is concentrated in the last quarter of the financial
year, it is difficult to implement programs smoothly and procure goods and services at the
lowest cost. In other words, poor budget preparation and performance can undermine
even the best allocation of funds.
54. This section explains the budget preparation process at the central and local level,
analyzes budget execution and control, and describes how budget performance is
monitored. It also provides recommendations for improving budget preparation,
performance, monitoring, and evaluation.
3.1. Budget preparation
55. The main stages in formulating the national budget are described in Box 2.
For agriculture, the process, at least in principle, lasts nine months—from the national
consultative meeting scheduled in October, at which MTEF ceilings are announced, to
the reading of the Budget in June the following year.
Box 2: Steps in preparing the national budget
October: Draft Budget Ceilings
MoFPED distributes the Budget Call Circular (BCC) to all ministries and agencies with inter- and intrasector
MTEF allocations.
MoFPED hosts a ―Budget (Framework) Consultative Workshop.‖
November–December: Preparation of Sector Working Group Reports
Sector Working Groups use indicative budget ceilings to arrive at intersector allocations and prepare Sector
Budget Framework Paper (SBFP).
January: Preliminary Estimates
SBFPs discussed with MoFPED during ministerial consultations.
Ministries and agencies prepare draft budget estimates on this basis.
March: National BFP to Cabinet and Parliament
MoFPED compiles SBFPs into a National Budget Framework Paper (NBFP), presented to the Cabinet.
When the NBFP is considered and approved, it is submitted to Parliament.
April–May: Parliament and Public Expenditure Review
The Budget Committee of Parliament discusses the NBFP and presents recommendations to the President and
MoFPED.
The national PER meeting is held, at which the NBFP is discussed.
June: Finalization of Budget
On the basis of Parliamentary/PER recommendations, the proposed Budget and MTEF is amended.
The Budget is read.
Source: Adapted from Williamson, T. (2003): Targets and Results in Public Expenditure Management: Uganda Case
Study. ODI Working Paper 205, London: Overseas Development Institute.

30
56. The MTEF should provide a reliable, rolling three-year guide to sector and
subsector budget allocations. In practice, from year to year major changes are made to
the MTEF ceilings in total and in the allocations to individual Sector Votes. Such
changes make medium-term planning difficult to implement and undermine the
predictability of funding in the two later years. Table 16 shows the agricultural sector
MTEF and budget ceiling for 2007/08 as stated in annual National Budget Framework
Papers, Budget Speeches, and Approved Budget Estimates, from the time it was first
announced in the Budget Framework Paper in March 2005 to the Budget Framework
Paper in March 2007. Table 16 shows the substantial variation in the planning figure and
the individual sector components.
Table 16: Evolution of 2007/08 budget ceiling projections for agriculture, March
2005 to March 2007 (UShs billions)
Date Document Recurrent Development
Wage Nonwage Domestic Donor Total
March 2005 National Budget
Framework Paper 6.78 29.15 137.76 173.69
June 2005 Budget Speech 6.52 21.74 70.22 131.44 229.92
3rd
quarter, 2005 Approved Estimates for
2005/06 6.58 29.15 133.76 1.94 171.43
March 2006 National Budget
Framework Paper 6.03 31.71 53.43 85.22 176.39
3rd
quarter, 2006 Approved Estimates for
2006/07 6.52 23.24 70.22 131.44 231.42
December 2006 Budget Call Circular 6.29 20.84 71.75 53.65 152.53
March 2007 National Budget
Framework Paper 6.29 18.14 78.75 81.68 184.86
Note: The ―development‖ figure in the 2005 National BFP is an ―integrated ceiling‖ combining domestic
and donor funds. MoFPED has not maintained this practice.
57. There are also frequent modifications to the MTEF and budget ceilings as
sectors prepare their Budget Framework Papers and later when the proposed budget is
considered at the National Budget Workshop and by the Cabinet and Parliament. Table
17 illustrates changes to budget ceilings for the various agriculture Votes when the
2006/07 budget was under preparation.
58. The earlier adjustments reflect revised estimates of domestic revenue and donor
commitments and revised national policy priorities (such as energy generation and
hosting the Commonwealth Heads of Government Meeting) expected to affect national
and sector budget ceilings. Later adjustments are frequently related to new policy
initiatives and political directives. They tend to be accommodated by adjustments in
sector and subsector allocations.

31
Table 17: Evolution of the 2006/07 budget ceiling projections for agriculture by
Vote (UShs billions)
Vote Agency Date
RECURRENT DEVELOPMENT TOTAL
Wage Nonwage GoU Donor Exclud-
ing donor
Includ-
ing donor
010 MAAIF
05/06 Approved
Estimate 2.49 4.93 34.23 38.08 41.65 79.73
Nov. 05 MTEF 2.37 6.79 26.28 60.18 35.45 95.63
Apr. 06 NBFP 2.38 5.53 8.86 57.74 16.08 73.81
Jun. 06 Budget
Speech 2.41 5.53 7.08 48.88 15.03 63.91
142 NARO
05/06 Approved
Estimate 13.36 7.4 6.31 20.76 27.07
Nov. 05 MTEF 10.58 12.2 5.53 22.78 28.32
Apr. 06 NBFP 2.84 9.2 5.31 12.04 17.35
Jun. 06 Budget
Speech 2.84 17.2 5.35 20.04 25.39
501–
580
District
Exten-
sion
05/06 Approved
Estimate 3.21 3.2 6.41 6.41
Nov. 05 MTEF 3.21 3.15 6.36 6.36
Apr. 06 NBFP 3.08 2.87 5.95 5.95
Jun. 06 Budget
Speech 3.88 3.16 7.04 7.04
501–
580
NAADS
Districts
05/06 Approved
Estimate 27.1 2.76 27.1 29.85
Nov. 05 MTEF 34.75 2.56 34.75 37.31
Apr. 06 NBFP 24.75 2.47 24.75 27.21
Jun. 06 Budget
Speech 37.13 1.53 37.13 38.66
152
NAADS
Secre-
tariat
05/06 Approved
Estimate 3.77 2.44 6.21 6.21
Nov. 05 MTEF 3.77 2.44 6.21 6.21
Apr. 06 NBFP 3.77 8.42 12.19 12.19
Jun. 06 Budget
Speech 4.46 5.35 9.81 9.81
155 UCDO
05/06 Approved
Estimate
Nov. 05 MTEF
Apr. 06 NBFP
Jun. 06 Budget
Speech 1.2 1.2 1.2
160 UCDA
05/06 Approved
Estimate
Nov. 05 MTEF
Apr. 06 NBFP
Jun. 06 Budget
Speech 0.58 0.58 0.58
TOTAL
05/06 Approved
Estimate 5.7 25.26 71.17 47.15 102.13 149.27
Nov. 05 MTEF 5.58 24.29 75.67 68.27 105.55 173.83
Apr. 06 NBFP 5.46 15.01 51.23 65.52 71.01 136.51
Jun. 06 Budget
Speech 6.29 17.77 66.76 55.76 90.83 146.59
Source: SBFP; NBFP; Budget Speech.

32
59. The first stage in the annual budget process for agriculture is for the
Agriculture Sector Working Group to prepare the Agriculture Sector Budget
Framework Paper (SBFP). Next, the Budget Call Circular is distributed and the
National Consultative Workshop is held. At the Workshop, the main budget priorities and
MTEF ceilings are announced at the sector and Vote level. The proposed terms of
reference, composition, and method of work for the Sector Working Group are set forth
in the Budget Call Circular for 2005/06 (Box 3). The Permanent Secretary of MAAIF
chairs the Sector Working Group, which meets soon after the Budget Call Circular is
distributed in October and perhaps once or twice in December when the Budget
Framework Paper is prepared. Until recently, the Working Group met rarely, if at all,
outside of this October–December period.
60. The SBFP is drafted by the Secretariat of the Sector Working Group
(MAAIF’s Agricultural Planning Department). In some years, a small ―technical
drafting committee,‖ consisting of staff from several departments in MAAIF and
MoFPED, has been appointed to draft the Budget Framework Paper. The bulk of the task,
however, falls on the shoulders of the Agricultural Planning Department. Inputs to the
Budget Framework Paper are provided by each of the technical units in the Ministry and
its semiautonomous agencies; representatives of these units are invited to attend meetings
of the Sector Working Group. The final draft of the SBFP is presented at a meeting of the
Ministry’s Top Policy Management group,26
in which alterations to the document and
final changes to the proposed budget allocations are agreed.
61. Since the enactment of the 2001 Budget Act, all SBFPs have to be submitted
to MoFPED not later than December 31; there is no leeway for slippage, as was the
case in earlier years.27
MAAIF does not begin preparing the Budget Framework Paper
until receiving the Budget Call Circular and the National Consultative Workshop has
been held. Delays in either or both of these events further curtail preparation time. As
more and more staff members take their annual leave as December progresses,
considerable pressure is placed on a very small number of the staff. MAAIF could ease
this problem by starting to prepare its budget earlier. Much documentation could be
prepared in advance, particularly the current year’s performance evaluation28
and outturn
and cases for new initiatives, even in the absence of MTEF and budget ceilings for the
next year. MoFPED could assist by releasing the Budget Call Circular at a set time each
year, even if the National Consultative Workshop is delayed.
62. The SBFP’s format and content are dictated largely by the Budget Call
Circular. The guidance provided in the Circular would be improved, however, by
assessing whether the information it requires is essential and presented in the most
effective format for making informed decisions on budget allocations. Except for
2006/07, MoFPED has received no feedback or suggestions from the Sector Working
26 Chaired by the Minister of MAAIF.
27 Although in 2006/07 delays by MoFPED in sending out the Budget Call Circular caused the date of
submission to be fixed for January 15, 2007. 28
Much of this material is also required for the quarterly and annual Budget Performance Reports (see
later).

33
Group (or MAAIF) on improving the content and quality of the SBFP. It is recommended
that this kind of feedback should become a regular feature of the budget preparation
process. Other recommendations for improving SBFP guidelines are summarized in
Annex 1.
Box 3: The Agriculture Sector Working Group
Proposed terms of reference for the Working Group
Review sector strategies and investment programs.
Review and recommend projects for submission to the PMA Secretariat and Development Committee, in line
with sector plans.
Prepare Agricultural Sector Budget Framework Paper (SBFP) as a basis for compiling the sector’s annual
budget and for enabling MTEF to evolve over time.
Provide the main forum for the sector-wide approach to planning and budgeting for agriculture.
On the basis of sector expenditure and investment plans and SBFP, identify policy issues for consideration
and action by Ministry Top Policy Management.
Provide information for the Joint Government of Uganda Donor Reviews.
Monitor budget implementation with respect to the aims and objectives set forth in the BFP.
Composition of the Working Group
MAAIF (including PMA Secretariat).
MAAIF Agencies (NARO, NAADS, UCDA, UCDO, DDA, Animal Genetic Resource Centre, COCTU).
Donor Sub-Group on Agriculture.
MoFPED.
Representation from private sector.
Representation from nongovernmental organizations (NGO Forum).
Representation from civil society.
Representation from local governments (ULAA).
Representation from farmers' associations and the Agricultural Council of Uganda.
Proposed method of work for the Working Group
The Working Group will carry out its activities through meetings, retreats, and workshops as well as consultative visits to local governments, as appropriate, as follows.
During the SBFP preparation process:
- At least once immediately following the conclusion of the National Budget Conference.
- At least once during November to review the draft SBFP.
- At least once during December to review and approve the final SBFP.
Quarterly after the SBFP is finalized.
Extraordinary/emergency meetings as necessary.
Financing of the Sector Working Group
Funding for the Working Group’s activities should be budgeted from within the sector MTEF ceilings.
Source: MoFPED (2005).
63. The credibility of the DSIP—MAAIF’s strategy and investment plan—
should be strengthened. Its credibility can be improved by paying greater attention to:
(i) the criteria used for prioritization; (ii) the expected outcomes; (iii) detailed
explanations of expenditure estimates; and (iv) linking investment plans more closely to
anticipated MTEF ceilings and indicating how the plans would change if MTEF ceilings
were increased or decreased. It is urgent for MAAIF to update its strategy and investment

34
plan for 2008/09 and beyond to continue providing a link between policy, planning,
budget preparation, and negotiations. MAAIF should consider whether a three-year or
five-year investment plan is best suited to its purposes. A five-year plan would provide a
longer time horizon for investment decisions and reduce the perceived need for frequent
revisions, but changing priorities and events might reduce the reliability of estimates for
the later years.
64. How is the budget prepared at the local government level? A single Budget
Framework Paper is prepared for each district by the District Technical Planning
Committee, with contributions from the District Production Department. In principle, the
District Budget Framework Paper essentially coordinates plans submitted by lower levels
of government and developed in a participatory manner. In practice this participatory
process is weak, rarely involving more than a minority of the local population. Moreover,
many subcounties lack the capacity to prepare such plans.
65. There is only a short period between the Regional Local Government Budget
Framework Paper Workshop, when Indicative Planning Figures are announced,
and the date for submitting the District Budget Framework Paper. In 2005, for
example, the Regional Workshop for Mukono District was held on December 19–20 and
the Budget Framework Paper had to be submitted by January 20, 2006. The MoFPED
and line ministries comment on the Budget Framework Paper in March–April, and then it
is examined by various District Council committees before being read and approved by
the full District Council in June. As at the national level, the Indicative Planning Figures
for individual districts are frequently adjusted as the budget is prepared.
66. At the district level, funds for production activities come from various
sources. These sources include the NAADS District Grant, the District Agriculture
Extension Grant, and the parts of the Non-Sectoral Conditional Grant (NSCG) and the
Local Government Development Program (LGDP) that are apportioned to production
activities, together with any projects funded from local tax revenue. In some districts, the
Production Department receives extra funding from the 10 percent pooled from
conditional grants under the Fiscal Decentralization Strategy. Each grant channeled from
the Central Government is subject to various conditions. Decisions on how the NAADS
District Fund is allocated for the district and subcounties are predetermined by the
NAADS Secretariat. The district only distributes funds as scheduled by the Secretariat.
Decisions on the actual extension activities to be financed by the grant are made by
farmers in fora at the subcounty level.
67. In principle, the subcounties are supposed to decide how 65 percent of NSCG
funds should be used. The district’s role is to check conformity with the guidelines (for
example, to ensure that proposed investments are of the acceptable ―public good‖ type).
In practice, many decisions on project selection are made by the District Technical
Committee, based on recommendations from various Departments. The Production
Department’s scope for flexibility in planning is limited to decisions on allocating funds
from the NSCG, the LGDP, the allocation from the 10 percent flexibility fund under the
Fiscal Decentralization Strategy, and locally financed projects.

35
68. Local political pressures cause more plans to be developed than can be
realistically financed, so the plans inflate the projected level of local revenue. Failure
to implement projects is then blamed on shortfalls in local revenue collection. Aside from
funds that are controlled directly by local governments, many production activities in the
districts are supported by off-budget projects financed by donors and/or NGOs. In some
districts, this is an important source of finance, but at the moment it does not appear to be
taken fully into account by districts or central government agencies in planning the
allocation of their own funds.
3.2. Budget execution
69. The relationship between planned (approved) and actual (released)
expenditure is an indicator of the effectiveness of the budget in allowing
departments and programs to plan their activities and deliver public services for the
year, as expressed in policy statements, output commitments, and work plans.
Typically, in assessing aggregate budget performance, the original approved budget
allocations are taken as the measure of ―planned‖ expenditure‖ as, in principle, this
should be the basis used by ministries, departments, and agencies in deciding on their
programs of work.
70. During the period under review, the released budgets deviated significantly
from the approved budgets and were typically lower than planned (recall Figure 2).
These deviations can arise from at least four sources:
The extent to which budget allocations misjudged requirements in the first
place.
Readjustments in budget allocations after the ―approved‖ allocations have
been announced, owing to:
The need for MoFPED to accommodate fresh calls on the budget
from other Votes.
Effective negotiations to increase the ministries’ and agencies’
budgets in line with perceived requirements.
Budgeted funds (―approved‖ or ―revised‖) are not released due to revenue
shortfalls or further unforeseen calls on available funds.
The untimely release of funds required for seasonally determined uses.
71. The outturns (deviations) differed for recurrent and development
expenditure. Usually outturns were larger for development expenditures financed by
donors. In the case of recurrent expenditures, Table 18 shows the approved and revised
recurrent budget allocations for MAAIF and released recurrent expenditures for 2000/01–
2005/06. Released expenditures were lower than the approved budget allocations in three
of the six years, but higher in the other three. Recurrent budget allocations were revised
upwards from approved allocations in all years, but—with the exception of 2003/04—
released expenditures were lower than revised budget allocations.

36
Table 18: Approved, revised, and released recurrent expenditures for MAAIF,
2000/01–2005/06 (UShs billions)
2000/01 2001/02 2002/03 2003/04 2004/05 2005/06
Approved 4.71 7.36 6.01 4.88 9.54 11.41
Revised 4.73 7.61 6.34 5.89 12.19 12.19
Released 4.01 6.05 6.22 7.83 11.32 10.31
Source: MoFPED Approved Budget Estimates and Auditor General’s Reports.
72. Table 19 examines the released recurrent expenditure for MAAIF programs
(departments) as a percentage of the approved recurrent allocations. Variations of
more than 15 percent between approved and released allocations are shaded. In three of
the past six years, the total released recurrent expenditures have varied by more than 15
percent from the total approved recurrent allocations. In two years (2003/4 and 2004/05),
total released and total approved expenditures differed because the released allocations
for Headquarters and the Crop Protection Department were more than double the
approved amount. In 2001/02, the released expenditure was well below the approved
budget allocation, with most programs showing large downward deviations from
approved budget expenditures.
Table 19: Released recurrent expenditures as a percentage of approved
recurrent budget allocations for MAAIF programs, 2000/01–2005/06
2000/01 2001/02 2002/03 2003/04 2004/05 2005/06
01 Headquarters 88.1 80.2 122.1 241.7 206.7 81.4
02 Directorate of Crop Resources 83.9 77.0 94.4 85.0 96.2 75.8
03 Farm Development Department 89.2 78.1 100.2 93.7 103.4 97.1
04 Crop Protection Department 75.7 113.2 87.6 235.3 219.0 91.0
05 Crop Production Department 83.6 74.2 80.2 79.0 99.7 97.2
06 Directorate of Animal Resources 92.1 93.9 95.1 91.0 97.6 100.0
07 Animal Production Department 90.7 74.1 90.6 89.0 98.6 100.0
08 Livestock Health and Entomology 78.9 73.4 84.4 84.7 96.5 100.3
09 Fisheries Resources Department 82.5 89.8 77.7 91.0 94.0 74.9
10 Department of Planning 82.9 72.5 84.1 84.0 95.8 96.5
Weighted average 85.2 82.1 103.5 160.5 118.7 90.4
Source: MoFPED Approved Budget Estimates and Auditor General’s Reports.
73. Do any revised expenditures more closely match released recurrent allocations? Some do, although most do not. There was a closer match in Crop Protection in 2003/04
and 2004/05, indicating that the budget allocation was revised to include recruitment of
crop inspectors (Table 20). But Headquarters massively overspent in 2003/04 and then
underspent in 2004/05 and 2005/06. In fact, the most noticeable feature of Table 20 is
that virtually all programs underspend every year. It remains unclear whether this
behavior is voluntary or an obligatory response to shortfalls in MoFPED releases as a
result of the cash budget system and unforeseen calls on the aggregate budget.

37
Table 20: Released recurrent expenditure as a percentage of revised recurrent
budget allocations for MAAIF programs, 2000/01–2005/06
2000/01 2001/02 2002/03 2003/04 2004/05 2005/06
01 Headquarters 87.3 79.7 110.4 212.9 84.1 68.6
02 Directorate of Crop Resources 83.9 77.0 94.4 85.0 93.0 75.8
03 Farm Development Department 89.2 78.1 91.7 93.7 96.7 97.1
04 Crop Protection Department 72.9 81.5 89.3 94.5 95.2 91.0
05 Crop Production Department 83.6 69.4 80.6 79.0 97.0 97.2
06 Directorate of Animal Resources 92.1 93.9 95.1 91.0 90.3 101.8
07 Animal Production Department 90.7 75.5 90.6 99.9 92.2 102.5
08 Livestock Health and Entomology 80.7 72.9 84.1 84.7 96.8 94.7
09 Fisheries Resources Department 82.5 89.8 77.4 91.0 99.1 74.9
10 Department of Planning 86.0 72.5 84.1 84.0 96.9 96.5
Weighted average 84.8 79.5 98.1 133.0 92.9 84.6
Source: MoFPED Approved Budget Estimates and Auditor General’s Reports.
74. The shortfall was greater in development expenditures than in recurrent
expenditures. According to Table 21, the average shortfall of the development allocation
was 44.3 percent, compared with only 4 percent for the recurrent allocation, even after
excluding the 60 percent overspending in 2003/04 (see Table 19). There is also a
noticeable difference in outturn for donor-financed development funds allocated to
MAAIF and for funds financed by the Government of Uganda. As illustrated in Table 21,
over the period under review, donor-financed development disbursements/releases were
57.7 percent below the budget allocation, compared with a shortfall of 19.5 percent for
government-financed development funds.
Table 21: Disbursement/release of MAAIF of donor- and government-financed
development funds as a percentage deviation from development
budget allocations, 2001/02–2005/06
2001/02 2002/03 2003/04 2004/05 2005/06 Average
Donor –64.3 –43.4 –49.0 –66.9 –65.6 –57.7
GoU –23.5 –21.1 –10.0 –26.5 –17.1 –19.5
Total –48.4 –35.4 –35.1 –57.9 –47.2 –44.3
Source: MoFPED Aid Liaison Department databank.
75. The situation has not improved in recent years. Individual development
projects provided information on approved and released budgets at the project level.
Table 22 shows the outturn of the development expenditure across the projects that made
up 64 percent of MAAIF’s development expenditure during 2005/06–2007/08. The
underperformance of donor-financed funds significantly exceeded that of government-
financed funds. Reasons for the shortfalls in government funds were described earlier.

38
Implementation delays, procurement problems, and weak coordination of central and
local governments are the major reasons for shortfalls in donor funds.29
Table 22: Approved and released development budgets in the selected MAAIF
development projects, 2005/06–2007/08
2005/06 2006/07 2007/08
North-West Smallholder Agriculture Development Project
Donor financing (US$ millions)
Approved budget 6.31 3.52 1.73
Released budget 3.05 3.00 14.3
Share of released budget in approved budget (%) 48% 85% 829%
GoU financing (UShs millions)
Approved budget 472.0 156.0 156.0
Released budget 406.9 130.0 127.3
Share of released budget in approved budget (%) 86% 83% 82%
National Livestock Productivity Improvement Project
Donor financing (US$ millions)
Approved budget 6.49 5.35 7.93
Released budget 1.64 8.38 3.13
Share of released budget in approved budget (%) 25% 157% 39%
GoU financing (UShs millions)
Approved budget 824.0 500.0 450.0
Released budget 448.7 477.0 408.7
Share of released budget in approved budget (%) 54% 95% 91%
Fishery Development Project
Donor financing (US$ millions)
Approved budget 3.25 5.28 8.96
Released budget 0.47 2.94 1.36
Share of released budget in approved budget (%) 14% 56% 15%
GoU financing (UShs millions)
Approved budget 1,356.6 425.0 395.0
Released budget 657.1 500.0 260.0
Share of released budget in approved budget (%) 48% 118% 66%
Vegetable Oil Development Project
Donor financing (US$ millions)
Approved budget 5.42 4.09 4.33
Released budget 0.72 1.63 0.76
Share of released budget in approved budget (%) 13% 40% 18%
GoU financing (UShs millions)
Approved budget 1,986.4 250.0 2,250.0
Released budget 732.3 291.0 1,915.1
Share of released budget in approved budget (%) 37% 116% 85%
Source: MoFPED Approved Budgets of the development projects (various years).
76. In addition to the shortfalls in allocations, the effectiveness of the public
expenditures was weakened by uncertainty in seasonal cash flows. The development
budget typically is released in four equal installments in the first month of each quarter.
29 These reasons are examined and presented in detail in Section 4.

39
However, the cash budget system restricts quarterly fund releases to cash flow
availability. While this practice helps to ensure macroeconomic stability, it may
destabilize activities at the central and local government levels. Because wage payments
and Poverty Action Fund-related expenditures have first call on available funds, nonwage
recurrent expenditures and government development expenditures on non-PAF activities
tend to be affected the most.
Figure 10: NAADS (Districts) budgeted and actual cash flows, 2005/06 (UShs
billions)
Source: NAADS Secretariat (2007).
77. Cash flow within NAADS provides a good example of how seasonal
requirements can affect expenditures. NAADS District expenditure is classified as a
PAF activity and, as such, releases made on a regular quarterly basis are usually 98–99
percent of budget allocations. The seasonal nature of many agricultural operations,
however, means that NAADS District expenditures peak in the first and third quarters of
the financial year, when crops are planted (see Figure 10 above). One effect of cash
budget ceilings and limited cash releases to MAAIF is that some anticipated donor
project expenditures cannot be undertaken. At the national level, it used to be the case
that some donor projects required the government to provide counterpart funds to pay for
various items before donor funds were disbursed. This restriction appears to have been
relaxed by most, if not all, development partners.30
It is necessary that, within the overall
cash flow available, MoFPED should cater for the relatively small but particular cash
flow requirements of agencies such as NAADS to improve their operational
effectiveness.
30 Typically, however, the donor will refuse to reimburse the project for any items that should have been
funded by the Government of Uganda.
-
100,000
200,000
300,000
400,000
500,000
600,000
700,000
800,000
900,000
1,000,000
July
August
Septem
ber
October
November
Decem
ber
Januar
y
Febru
ary
Mar
chApril
May
June
USh
s m
ill
Budgeted cashflow
Actually released
40
3.3. Budget performance monitoring
78. MAAIF’s Policy Department has a Monitoring and Evaluation (M&E)
Division staffed by six officers, supplemented by ten others from technical
departments, who are required to monitor and evaluate all MAAIF activities. These
officials monitor each department, and each one is also responsible for the M&E of a
development project. The M&E Division is also supposed to undertake field visits to
monitor activities at the district level, but insufficient funds have been allocated to do
this. It is planned to pool the M&E funds now available to each individual project to
increase the funds available to the M&E Division.
79. As noted earlier, lists of outputs, indicators, and activities are now produced
for the SBFP. Similar information is provided in the quarterly Budget Performance
Reports that all Ministers responsible for a Vote in Appropriation-in-Aid are required to
make to Parliament under the Budget Act (2001). These reports are expected to explain
how funds have been spent and to reflect specific data on value for money from the
expenditure involved. The M&E Division of the Policy Department also prepares an
annual Performance Monitoring and Evaluation Report.
80. At the moment no use appears to be made of these various reports within or
outside MAAIF to reward good performance (or invoke sanctions for poor
performance), to measure the effectiveness of MAAIF’s public expenditure, or to
reallocate resources between priority areas. Furthermore, no feedback appears to be
provided to MAAIF on the quality or usefulness of any of these reports.
81. Within MAAIF, the Sector Working Group would be the appropriate body
to carry out regular quarterly appraisals of the effectiveness of budget expenditures
across MAAIF and its agencies. The terms of reference for the Sector Working Group
already include responsibility to monitor the performance of budget expenditures.
Implementing this responsibility would give the Sector Working Group a year-round
agenda and help to increase its effectiveness. Yet such a system can be instituted
effectively only if it receives strong ministerial support and is seen to be implemented
and supported by the Permanent Secretary and senior colleagues. It would also require,
and lead to, substantial improvement in the quality of the reporting system, with a critical
examination of the reasons for variations between planned and actual outputs and
attention paid to the cost-effectiveness of different programs and resource allocations.
MoFPED could also cause performance monitoring to be taken more seriously in MAAIF
by insisting on a more rigorous analysis and presentation of sector performance in the
SBFPs.
82. The monitoring and especially the evaluation of development projects also
require more attention. Despite the fact that most development projects are financed by
donors, impact evaluations are rare. Even if an impact evaluation is done, it presents
outputs rather than outcomes, yielding little information about the value for money of the
investments and few lessons, if any, to prepare new projects.

41
83. At the local level, on paper, performance monitoring is much more rigorous
at the district level than in MAAIF. Each department prepares a quarterly work plan
with quantifiable targets and also a quarterly plan and budget implementation report. This
information is reviewed by the District Council to measure the effectiveness of each
department, with an emphasis on physical and political accountability and value for
money. Different types of reviews and monitoring are carried out, including:
Quarterly reviews for sectors receiving PAF funding.
Annual reviews as part of the Budget Framework Paper preparation process.
Annual reviews undertaken after the end of the financial year.
LGDP annual assessment of minimum conditions and performance measures.
84. In theory, quarterly monitoring and review is expected to be done by the
central government (for activities under PAF) and by the districts using the
monitoring and accountability grant. However, funding shortages sometimes constrain
this exercise. At the subcounty level, for example, operational budgets are highly
constrained, so field supervision is often not undertaken, and the contribution that
subcounties are required to make to NAADS funding, for example, is often not possible.
85. Monitoring and evaluation constitute one of the principal roles of the
Directorate of Production and Marketing, while politicians also use the funds of the
Directorate (including those of the NSCG) to monitor the progress of projects in the
district. The preparation of the Budget Framework Paper involves a review not only of
the year for which the budget is under implementation but also the previous two to three
years. The down-side to this exercise is that neither MoFPED nor MAAIF provides
feedback to the districts.
86. At the end of every financial year, districts carry out an annual review with
the Annual Report as the main output. The quality of the reports varies from district to
district. Poor reports list activities that were carried out with little or no quantification of
results. Some reports, however, such as the report for Bushenyi during 2004/05, compare
targets with actual achievements, explain why there were deviations from planned
targets, and make recommendations for remedial action.
87. Finally, the annual assessment of minimum conditions and performance
measures is another form of review that is undertaken in local governments. The
assessment results in rewards (in the form of increased funding) for good performance
and sanctions (reduction in the LGDP grant) for poor performance. The assessment does
not cover production sector indicators, however, so it cannot be used to improve
performance in the sector.
42
4. Efficiency and Effectiveness of Agricultural Sector Expenditures
88. A review of how a sector spends its resources and what it gets for those
resources—in other words, value for money—is very important for a low-income
country with limited resources and high aid flows. Such an analysis is not
straightforward. It requires careful analytical work and systematic collection of key data
over a certain period. The discussion below presents the process and findings from such a
review of the largest agricultural development projects between 2005/06 and 2007/08.
89. The review of public expenditures is more complex for agriculture than for
other sectors. In the education sector, for instance, almost all resources follow the same
path from the central budget to schools: Inputs such as teachers, classrooms, and
textbooks are ―bought,‖ and outputs such as number of graduates with a minimum level
of proficiency are ―produced.‖ In contrast, agricultural projects vary in how they are
implemented and how resources, financial and physical, flow between various layers of
government. This is the first difficulty. The second difficulty arises from the absence of
consistently collected data on sector outcomes, except for overall agricultural production
and agricultural value added. Inputs cannot be linked easily with outputs/outcomes
because of the time lag in agricultural production, multiple outputs/outcomes, and
attribution problems.31
Impact evaluation is the most appropriate tool for examining those
issues, and such an evaluation was undertaken for the NAADS program, which accounts
for the largest share of Uganda’s agricultural sector budget. Presented later in this
section, the NAADS impact analysis (conducted by IFPRI, the NAADS Secretariat, and
other institutions) is an example of how these evaluations can be done.32
This section also
presents a technical efficiency analysis of public spending on agriculture for a range of
other development projects. Although it is not as comprehensive as the impact evaluation
done specifically for NAADS, the technical efficiency analysis does identify important
constraints on project implementation and offer potential remedies.
90. This section begins with a discussion of the methodology and the analytical
approach adopted. Public Expenditure Tracking Surveys (PETS) have been used in
Uganda since 1996 for the health and education sectors, but this report present the first
known application of PETS in agriculture in Uganda.33
After a brief description of the
31 Attribution is an issue in all sectors, but agriculture in Sub-Saharan Africa is especially affected by
numerous exogenous factors, such as highly variable weather and changes in terms of trade, which make it
difficult, for example, to link trends in overall agricultural growth with either particular or total public
expenditures. Agricultural output may decrease following a drought even if public expenditure rises, and
we may erroneously identify a negative relationship between spending and agricultural growth.
Econometric techniques must be used to answer this question, but the lack of consistent time-series data in
African agriculture makes such estimates very approximate, even if they are possible. 32
Benin, S., E. Nkonya, G. Okecho, J. Rdriamamonjy, E. Kato, G. Lubade, M. Kyotalimye, and F.
Byekwaso (2008): Impact Evaluation and Returns to Investment of the NAADS Program in Uganda.
October 27, 2008. 33
Uganda first used PETS in 1996 to explain poor performance and identify leakages in the education
sector. Since then, PETS has become the standard tool for measuring the effectiveness of public sector
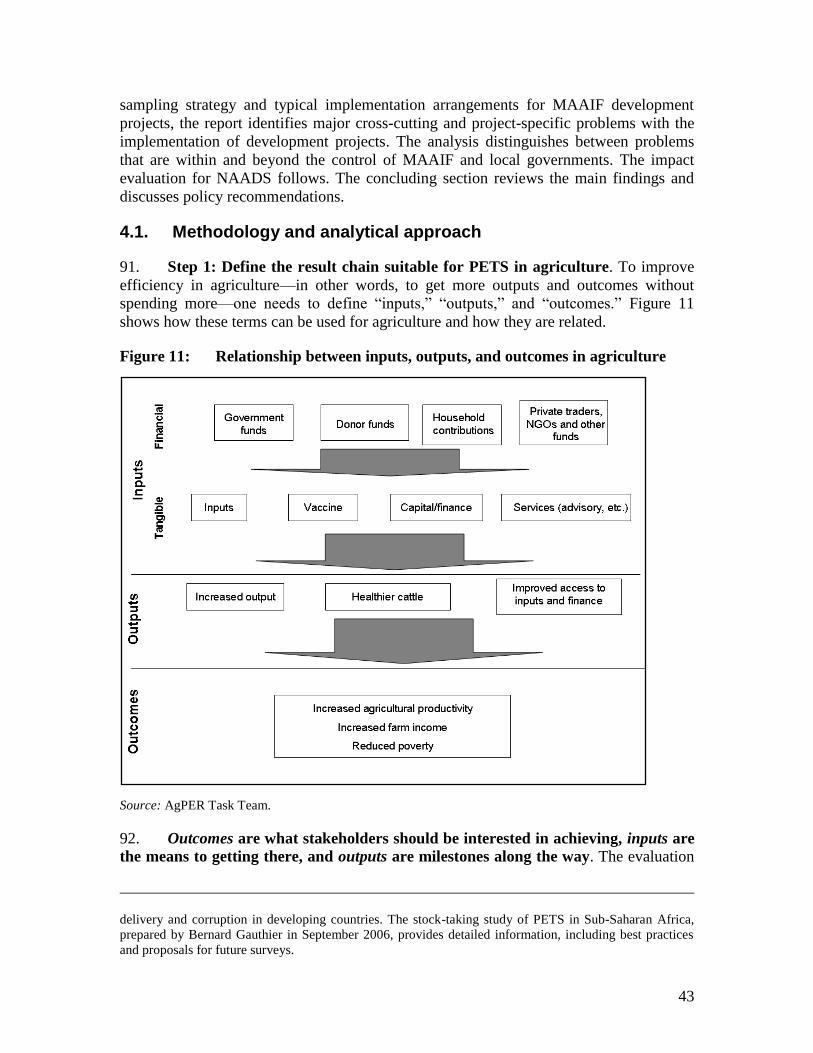
43
sampling strategy and typical implementation arrangements for MAAIF development
projects, the report identifies major cross-cutting and project-specific problems with the
implementation of development projects. The analysis distinguishes between problems
that are within and beyond the control of MAAIF and local governments. The impact
evaluation for NAADS follows. The concluding section reviews the main findings and
discusses policy recommendations.
4.1. Methodology and analytical approach
91. Step 1: Define the result chain suitable for PETS in agriculture. To improve
efficiency in agriculture—in other words, to get more outputs and outcomes without
spending more—one needs to define ―inputs,‖ ―outputs,‖ and ―outcomes.‖ Figure 11
shows how these terms can be used for agriculture and how they are related.
Figure 11: Relationship between inputs, outputs, and outcomes in agriculture
Source: AgPER Task Team.
92. Outcomes are what stakeholders should be interested in achieving, inputs are
the means to getting there, and outputs are milestones along the way. The evaluation
delivery and corruption in developing countries. The stock-taking study of PETS in Sub-Saharan Africa,
prepared by Bernard Gauthier in September 2006, provides detailed information, including best practices
and proposals for future surveys.

44
of outcomes of most agricultural public expenditure is critically important but also
difficult, and generally such information is not available in Uganda. There is a time lag in
agricultural production, and it is challenging to link specific inputs directly to marginal
value of product. For example, when a vendor is contracted and undertakes civil work
(inputs) to construct a wholesale market (output), it is important to have information
about how traders/farmers use the market and the market’s effect on transaction costs
(outcomes). When farmers use cattle vaccine (input), they expect that cattle will be
healthier (output) and that healthier cattle will be more productive (outcome). When
farmers apply fertilizers provided by a project, they expect crop yield to rise (output) and
farm income to increase (outcome). Each of these result chains requires a rigorous impact
evaluation comparing targeted and nontargeted households, and the evaluation must
cover a sufficient timeframe to allow outcomes to be realized and properly documented.
93. This kind of rigorous impact evaluation is presented for the NAADS
program later in this report. Similar detailed evaluations of additional programs were
not feasible, given the time and resources available. Instead, the PETS methodology was
used to identify sources of inefficiency in the delivery of public services. The PETS
methodology was complemented by focus group discussions with project beneficiaries,
service providers, agricultural staff in the local government and MAAIF, project
management unit staff, and political leaders to obtain qualitative feedback on service
quality and project performance. This combination of quantitative (PETS) and qualitative
(focus group) information provides an understanding of the factors affecting the quality
of service provision and makes it possible to evaluate the operational efficiency of project
implementation. For evaluating NAADS, the quantitative results of the impact evaluation
were combined with qualitative assessments in selected districts.
94. Step 2: Set up the operational framework for analyzing technical efficiency.
For operational purposes, it is important to distinguish between waste, leakage, and
inefficiency.34
Waste and leakage can be dealt with in a different way from
inefficiency—for example, by imposing stronger control systems, developing better
incentives against malpractice, and improving accountability. Public service inefficiency,
which stems from poor choices related to policy, technology, or management, is harder to
detect, with assessment demanding more knowledge of the service in question.
95. Inefficiency can arise because changing circumstances could cause the
optimal choice or combination of inputs or the appropriate type of output to change
over time. For example, a government can be doing the right thing but using the wrong
mechanism (delivery instrument)—resulting in inefficiency. In contrast, waste occurs
when a completely unnecessary and avoidable cost is borne by the public sector. Waste
cannot be defended with integrity. It can arise from many sources, such as weaknesses in
the system, weak capacity, low levels of management accountability, improper planning,
and corruption. Examples of waste include:
34 This AgPER uses the framework for technical efficiency analysis proposed in the Uganda Public
Expenditure Review (2007), World Bank, Washington, DC.

45
Duplication of administrative functions, either between MAAIF and local
governments or between MAAIF and other ministries/agencies.
Unnecessary delays and contract disputes in project implementation, which
lead to cost overruns.
Improper appraisal and feasibility work, which lead to delays and cost
overruns.
Poor asset maintenance, which leads to early replacement of physical capital
such as irrigation, market, and road infrastructure.
96. Leakages occur when released funds are not spent on the inputs for which
they were intended. One way to look for leakage is to track the flow of financial and
physical resources. This is the methodology used in PETS, which tracks the flow of funds
between different layers of government. For instance, the procured cattle do not end up
with the designated beneficiary but with someone else. Leakages in public service
increase the cost (input) of achieving a given level of service (output) and result in a
deteriorating measure of efficiency. But since leakage is not a consequence of choices in
policy, technology, or management, for operational purposes leakage should be detected
separately.
97. Step 3: Select the indicators of efficiency. The most simple but highly useful
indicator of efficiency is unit cost (the cost of producing one unit of output). Other things
being equal, reducing unit cost will improve the efficiency of production. While knowing
the level of unit costs is important, it is also necessary to know whether the current level
of unit costs is appropriate and to know which factors most affect variations in unit cost
across different projects. There are several ways to assess whether the level of current
unit costs is appropriate. For instance, unit costs for procured goods can be compared
with market prices. Unit costs of centrally and locally prepared items may also be
compared. For civil work such as building roads, unit costs can be compared with other
projects and guidelines from the Ministry of Infrastructure.
98. Step 4: Analyze the findings and develop hypotheses of what drives
inefficiency. It is one thing to identify the factors that mechanically drive unit costs up or
down. It is quite another thing to identify the underlying causes of these factors and
prescribe remedial actions at the local, MAAIF, and national government levels.
4.2. Sample selection and procedures for field work
99. The complex structure of agricultural projects in Uganda demands that the
sampling strategy be considered carefully. For this analysis, development projects
were selected if their budgets exceeded 3 percent of MAAIF’s development budget.35
Table 23 lists six projects that meet this criterion.36
Together they account for 74.1
35 The Farm Income Enhancement Project also falls within this category, because it accounts for 8 percent
of MAAIF’s development budget. Because this project was just launched, little activity has occurred and no
results have been achieved, so it is not included in the analysis. 36
During the period under review, MAAIF executed 24 development projects.

46
percent of MAAIF’s development budget and thus offer appropriate scope for the
analysis.
Table 23: Shares of selected projects in MAAIF’s development budget, 2005/06–
2007/08
Project Share of
development budget
(%)
1. Farming in Tsetse Areas of East Africa (FITCA) 3.6
2. North-West Smallholder Agricultural Development Project (NWSADP) 11.6
3. Livestock Disease Control Project (LDCP) 6.6
4. National Livestock Productivity Improvement Project (NLPIP) 19.7
5. Support to Fisheries Development Project (SFDP) 17.1
6. Vegetable Oil Development Project (VODP) 15.6
Total 74.1
Source: Policy Document for MAAIF (June 2007).
100. Geographically, the analysis covers much of the country. Projects were
analyzed in Mbarara, Kiruhura, and Bushenyi Districts (western Uganda); Mukono and
Wakiso Districts (central Uganda); Arua, Nebbi, Yumbe, Koboko, Moyo, and Adjumani
Districts (northwestern Uganda); and Palissa, Budaka, Mbale, Tororo, Busia, and Soroti
Districts (eastern Uganda). Subcounties within districts were randomly selected. The
districts covered in each project were:37
Livestock Disease Control Project: Kiruhura and Bushenyi.
National Livestock Productivity Improvement Project: Pallisa, Bushenyi,
Soroti, Kiruhura, and Mbarara.
Vegetable Oil Development Project: Pallisa, Soroti, and Tororo.
North-West Smallholder Agriculture Development Project: Arua, Nebbi,
Koboko, Yumbe, Moyo, and Adjumani.
Farming in Tsetse Areas of East Africa: Pallisa, Soroti, and Tororo.
Support to Fisheries Development: Lake Victoria.
101. The analysis drew on a range of primary and secondary information,
beginning with preliminary interviews with government officials, both at MAAIF and in
local governments, and moving on to include project documents from MAAIF and local
governments, government reports and budgets, various policy documents, and fieldwork
and interviews at the national, district, and subcounty level.
102. The analysis was initiated by meeting the respective technical staff of MAAIF and
heads of various units, departments, projects, and subject matter specialists in the sector.
37 Although other agricultural projects are implemented at the district level, such as the World Food
Programme’s Agricultural and Marketing Support Project, the Support for Irrigation Project, PMA
activities, and agricultural extension, this report focuses on the projects presented in the main text.

47
This approach was taken to create ownership of the process and enable the staff get
acquainted with the tools and methods of the study.
103. In each district, interviews were conducted at headquarters with technical officers
and at lower local government levels. These key informant interviews aimed to elicit
respondents’ perceptions of service delivery in their districts. In addition, group
discussions were conducted in the Production Department in all districts, because it is the
main coordinating department. These interviews sought to elicit technical perceptions of
delivery mechanisms under the projects. Similarly, field visits were made to learn about
beneficiaries’ perceptions of delivery of planned outputs in their localities and assess how
beneficiaries had been affected. Key project documents such as budgets, quarterly and
annual reports, final accounts, and work plans were reviewed to study the planned
activities, unit costs, target groups, and timeframe, among other things.
4.3. Implementation arrangements of MAAIF development projects
104. The resource flows in agricultural development projects are complex. Funds
originate from various sources—donors, central government, and local governments.
Each development project has a Project Management Unit (PMU), usually located in
Entebbe but sometimes in regional centers such as Arua, as in NWSADP. The PMU
receives funds from donors and the central government, and part of these funds is
transferred directly to the districts via a special account. The production departments in
the districts are responsible for overseeing the activities of subcounties and service
providers and for procuring small contracts. The districts also cofinance projects from
their local budgets.38
Figure 12 depicts the flow of funds and project implementation
arrangements.
105. Large procurements are centralized at MAAIF, however. For instance, about
83 percent of funds released from ADB for NWSADP between 2005/06 and 2007/08
were used by the National Project Coordination Unit. For NLPIP, this figure was about
60 percent. All funds for SFDP and LDCP were used centrally. It is argued that local
governments lack capacity in procurement and in controlling the use of funds.
38 In this report, the terms ―district‖ and ―local government‖ are used interchangeably.

48
Figure 12: Implementation arrangement for most MAAIF agricultural
development projects
Source: AgPER Task Team based on MAAIF project documents.
106. Public works, procured centrally, are supposed to be overseen by local
governments. As the subsequent analysis will show, weak coordination between the
central and local governments and inadequate incentives for local monitoring caused
many contracts to be implemented inefficiently.
107. The complex implementation arrangements of most projects studied here
posed several challenges for conducting PETS. A PETS analysis usually aims to
examine flows of funds and materials from central government to local service providers,
via regional and local governments, to identify resource use and leakages. In the projects
studied here, however, only a small share of funds is transferred directly to local
governments (Figure 12), and the bulk is spent at the central level to procure goods and
public works. Procured goods are transferred to the districts, but most public works, such
as road and market construction, bypass district budgets. For this reason, the analysis
tracks only tangible resource flows between central and local governments and looks
separately at the delivery of centrally procured public works.
4.4. Analysis of technical efficiency
108. The major components of the MAAIF projects under review can be classified
into two groups. The first group consists of investments in infrastructure, such as the
construction and/or rehabilitation of rural roads, bridges, livestock markets, and fish
ponds. A full value-for-money analysis was done for this group, because field
assessments and interviews with local government and beneficiary communities made it

49
possible to evaluate the progress and results of public works. The second group consists
of the supply of goods (mainly inputs), advisory services, and trainings to farmers. As
indicated previously, the outputs and outcomes of those interventions cannot be
measured. The analysis is limited to an assessment of the quality of delivery mechanisms
and the strategic alignment of project interventions with overall agricultural policy.
109. Before proceeding with the analysis, it is important to understand how the
broader environment enables or impedes project performance. The prerequisites for
launching projects quickly and smoothly are often beyond the immediate influence of
MAAIF, including ratification by Parliament, the provision of counterpart funds, and
overall procurement and fiduciary capacity in the public sector. If foreign loans are
ratified without delay, and if counterpart funds are provided in full and on time, MAAIF
and local governments are ―enabled‖ to deliver goods and services efficiently to
beneficiaries. If the opposite is true, a project’s effectiveness is likely to be hampered
from the very beginning.
110. In Uganda, the environment is not entirely conducive for implementing
agricultural projects. It takes about one-and-a-half years for Parliament to ratify a loan.
Delayed ratification reduces project benefits. For NLPIP, for example, a year’s delay in
project implementation is estimated to reduce the economic rate of return by 6 percent
(from 23 percent to 18 percent). The untimely release of counterpart funds by MoFPED
reduces the quality of project implementation. As indicated previously, outturns of
government funds ranged from 10 percent to 50 percent for the period under review
(recall Table 21 and Table 22). After Parliament ratifies a project, one year is typically
needed to establish a procurement and management unit that meets domestic and local
requirements and open special project accounts, especially if a project includes more
than one Ministry.39
Most of these issues are relevant to all projects, not just agricultural
projects. Yet even if these problems are beyond MAAIF’s immediate control, MAAIF
can still raise them with MFEDP and propose concrete remedies.
111. An equally important concern is the lack of security in some areas of
Uganda. For example, insecurity in Karamoja and Acholi Districts made it difficult to
implement NLPIP. Insecurity in Northern Uganda has also made VODP less effective.
This reality should be reflected when evaluating the performance of agricultural projects.
4.4.1. Infrastructure-related components
112. Poor infrastructure still limits farmers’ access to markets and capacity to
diversify. As Balat et al. (2008) demonstrate, increased trade in cash crops (coffee, tea,
39 No clear rules govern the opening of special project accounts at the district level when two or more
ministries are involved in implementing a project. To open such an account, three signatures are usually
required—the district chief, accountant, and Production Department staff. In the Farm Income
Enhancement Project, involving MAAIF and MWLE, the presence of an Agricultural Department
representative and Environment Department representative increases the number of staff involved from
three to four. This project experienced a delay of one year as it clarified project procedures and opened
special project accounts.

50
cotton, and fruits) has a strong positive effect on reducing poverty among Ugandan
farmers. High marketing costs caused by poor rural infrastructure have left many
Ugandan farmers with little choice but to produce staple food crops for domestic
consumption and avoid commercial agriculture.40
The NAADS impact evaluation
(Section 4.5) also confirms that poor rural infrastructure significantly constrains
commercial opportunities for NAADS participants.
113. Despite the urgent need for infrastructure, the share of capital investment in
the agricultural sector budget is low, estimated at 8.5 percent (Figure 8). Although
capital investments constitute a significant share of MAAIF’s budget (24 percent; Table
13), far more capital expenditure is needed to make a difference in rural areas. It will not
be effective to scale up these expenditures, however, unless they currently demonstrate
good value for money. Unfortunately, this is not the case for most of the MAAIF projects
with infrastructure components reviewed here. Urgent action is required to improve the
value for money spent on infrastructure under these projects, given its critical importance
to rural growth in Uganda.
114. Delays in delivering infrastructure have been significant in the projects
under review. The rural infrastructure component of NWSADP was delayed by five
years. Only 10 percent of large projects were built on time, to specification, and within
the agreed budget. Only 2 contracts of 25 issued for rehabilitating roads and building
bridges were nearing completion in 2009, implying that 92 percent of contracts under
NWSADP were at risk as the project prepared to close that same year (Table 24). Only 2
markets of 15 were nearing completion, implying that 86 percent of market construction
contracts were also likely to default. If the project were to end in 2009 as planned and the
remaining works remained unfinished, 56 percent of the project budget earmarked for
infrastructure (UShs 23 billion) would have been utterly wasted. The situation in SFDP is
similar: The rehabilitation of fish ponds has been slow, with much wastage.
115. Delays have various causes, mainly arising from improper appraisal and
feasibility studies, weak coordination of implementation between central and local
governments, ineffective procurement, and problems related to land tenure.
Improper appraisals and feasibility studies have also caused cost overruns. In
NWSADP, for example, the cost of building Moinya Bridge on Itikikwa River along
Obilokongo-Moinya-Ayiri Road in Adjumani District exceeded the cost specified in the
original contract by 69 percent, and it took four times longer than planned. Katu Bridge
on Lurujo-Nyai Road in Arua District has—so far—taken three times longer to build than
anticipated and posted an overrun of 27 percent.
40 Balat, J., I. Brambilla, and G. Porto (2008): Realizing the Gains from Trade: Export Crops, Marketing
Costs, and Poverty. World Bank Policy Research Working Paper 4488, Washington, DC.

51
Table 24: Contract performance within NWSADP
Nature of project activity
Contracts
in
number
Commencement
date
Contracts
nearing
completion
Contracts
at risk
(%)
Risk-free
contracts
(%)
Road rehabilitation and
bridge construction 25 Nov. 14, 2006 2 92 8
Market construction 15 Jun. 12, 2007
2 (Adjumani
District) 86 14
Construction of water
supply systems 6 Feb. 1, 2006 1 83 17
Rehabilitation of DFIs 2 Jul. 30, 2007 1 50 50
Construction of DFIs 2 Dec. 5, 2006 0 100 0
Source: Monitoring and Evaluation Reports, Project Office (2007/08).
116. Appraisals for bridge construction were flawed by numerous omissions in
technical design and connectivity. Esia Bridge on Odu-Kwoma Road in Adjumani
District, for instance, was not included in the original plan but proved important for
connecting roads. Technical faults included omitting gabion boxes, underestimating the
width of rivers, and failing to identify rivers across roads (as in Omuriba-Kangoo, Kova-
Odramacaka, Leju-itia, Odima-Kololo, and Menjo-Yoro in Arua District). Technical
inefficiency was exhibited by road contractors who failed to follow specifications for the
thickness of the gravel layer or compacting, as indicated by the heavy vegetation growing
through most roads. Aberi-Zombo Road in Nebbi District, Mongoya-Oya and Majale-
Kilaji Roads in Yumbe, and Arivu-Jayia-Opia Road in Arua exemplify this waste and
limited value for money.
117. Often improper appraisal has been caused by weak coordination of project
preparation with the local government and local communities. Involving local
governments in the implementation of centrally procured public works increases the
effectiveness of implementation, but engagement with local counterparts needs to begin
earlier, at the project appraisal stage. Local counterparts’ participation in project appraisal
creates the sense of ownership that fosters more effective implementation. The same
recommendation is valid for delivering centrally procured goods such as vaccines and
cattle, as discussed later.
118. During implementation, wastage can also be reduced through better
coordination of activities and allocation of adequate operating funds for supervision
by local production department staff. Local technical staff members are overburdened
by multiple projects and lack operating funds. Funds for supervising infrastructure
projects are often included in vendor contracts but not transferred (or transferred too late)
to local governments. Under SFDP, district fishery departments obtained motorcycles but
not the corresponding operational funds, leaving insufficient resources to mobilize
farmers, prepare contracts, and supervise work.
119. Public works on private and community land were delayed by unclear land
tenure before the project began. Most markets built under NWSADP are being
constructed on private land, and disagreements have arisen in some instances. For
example, the priest in Yumbe objected to the water tank being built on mission land, and

52
subcounty authorities were drawn into a dispute with the owners of land for Keri market
in Koboko and Nyaravur market in Nebbi.
120. The resulting cumulative wastage is high in the three MAAIF projects with
infrastructure components. In NWSADP, NLPIP, and SFDP, capital expenditures
accounted for 43.4 percent of the budget (Table 25), 81.2 percent of MAAIF’s capital
budget, and 20.4 percent of MAAIF’s development budget.
Table 25: Percentage of capital expenditures (approved budgets) of NWSADP,
NLPIP, and SFDP in the budget of these projects, MAAIF’s capital
budget, and MAAIF’s development budget, 2005/06–2008/09
2005/06 2006/07 2007/08 2008/09 Total
Share of capital spending in three projects in
total budget of these projects (%) 42.1 32.5 48.6 53.5 43.4
Share of capital spending of three projects in
MAAIF capital expenditure (%) 79.1 91.2 85.8 80.9 81.2
Share of capital spending of three projects in
MAAIF development budget (%) 21.0 17.1 22.9 19.8 20.4
Source: AgPER Task Team estimate, based on project documents and approved budgets for MAAIF.
121. Not only were most of the resources in the infrastructure components at a
high risk of being wasted—the unit costs of most work were inflated. The unit costs of
constructing roads were much higher under NWSADP than other programs. For example,
unit costs in NWSADP ranged from UShs 30.9 million to UShs 38.5 million per
kilometer, while the unit costs of road improvements under the Area Agricultural
Modernization Program (AAMP) were UShs 8–20 million per kilometer. Although the
costs of building and rehabilitating roads under NWSADP were estimated by MOTWC
engineers, who conducted the surveys and participated in evaluating the bids, more
realistic appraisals are necessary to plan implementation accordingly. One might argue
that roads constructed under NWSDAP are not directly comparable with those
constructed under AAMP, but field assessments show that the terrain was not any hillier
under NWSADP roads than under AAMP roads.
4.4.2. Project components related to the delivery of inputs and other goods
122. About 42 percent of MAAIF’s development budget and a similar share of the
agriculture budget went to supply goods and services (Section 2.3). The share of
goods and services in MAAIF’s nonwage recurrent expenditures rose from 52 percent in
2005/06 to 82 percent in 2008/09 (Table 13). How well were inputs and other goods
actually delivered?
123. There is evidence that goods procured locally cost less and were less prone to
wastage and leakage than goods procured centrally. The superior performance of local
procurement and goods distribution is explained by lower transaction costs and an
increased sense of ownership. The unit costs of vaccines procured centrally by LDCP and
NLPIP exceeded market prices; for example, lumpy skin vaccine procured under these
projects cost UShs 1,300 versus the market price of UShs 1,200, and brucellosis vaccine
53
cost UShs 1,000 versus the market price of UShs 800. The high prices of these vaccines
partially explain their low demand among farmers.
124. Prices of cattle procured centrally under NLPIP also exceeded market prices.
According to the 2005 quarterly project report, MAAIF procured Boer goats at a unit cost
that was nearly four times higher than it would have been at the local level (UShs
892,000 versus UShs 250,000). Even the local goats procured by MAAIF cost 1.5 times
more than goats procured locally (UShs 70,000 versus UShs 50,000). The unit costs of
centrally procured cattle under NLPIP exceeded those under NAADS, PMA, LGDP, and
Northern Uganda Social Action Fund. Based on data for June 2007/08, if all local goats
(13,087) procured centrally under NLPIP were procured by districts, the savings (or
losses avoided) would have reached UShs 262 million, or 30 percent of the budget for
central procurement of local goats. In contrast, the unit costs of oxen and spray drugs
procured at the district level by FITCA were close to reported market prices.
125. The delivery of centrally procured animals was prone to wastage. Under
NLPIP, the poor health of many goats reportedly made potential beneficiaries in Kiruhura
and Soroti Districts reluctant to accept them. According to project documents, of 14,239
animals distributed by mid-2008, 998 adult animals (7 percent) died and 235 abortions (2
percent) occurred. In Nyakayojo Subcounty of Mbarara District, 6 of 16 goats given to
farmers (38 percent of distributed goats) died.41
Casualties were worse when animals
were supplied during the dry season and no facilities were available to keep them, partly
because district staff had not been involved. Under FITCA, 6 of 31 tsetse-tolerant heifers
(19 percent) supplied to farmers in Palissa District for animal traction reportedly died in
the first months. The death rate in Budaka was reportedly 29 percent.
126. Serious wastage was also observed in supplying centrally procured vaccines.
Farmers usually are reluctant to vaccinate animals unless a major disease outbreak is in
progress. They are even more reluctant when they have to pay for vaccine to be
administered, especially when it costs more than it does in the local market. This
additional cost, according to respondents in Kiruhura and Bushenyi, led few farmers to
use lumpy skin vaccine supplied through NLPIP. In Kiruhura, Mbarara, and Bushenyi,
low use of 320,000 doses of brucellosis vaccine, intended to be supplied on a cost-
recovery basis, caused MAAIF to vaccinate animals free of charge to avoid losses from
expired vaccine. Wastage was also caused by a lack of communication between MAAIF
and the districts. Districts often received vaccine in quantities that exceeded the capacity
of the cold chain and thus could not be stored properly.
127. Records of transfers of physical and financial resources from central
management units to the districts often do not match, which could be indicative of
wastage, diversion, or leakages. The source of the problem is unclear. It could be poor
record keeping (which implies low accountability), diversion of resources away from the
intended areas or beneficiaries, corruption, resource misallocation, improper
accounting, or incomplete information from PMUs or local governments. Table 26 shows
41 Unpublished 2007/08 subcounty monitoring report.

54
the mismatch of records under NWSADP: Arua District reported receiving more funds
than the PMU reportedly transferred. No discrepancies were found for transfers to Nebbi
District, but there was a 5 percent shortfall for Koboko District. Under NLPIP, the
differences are more pronounced. Three districts reported receiving less funding than
reported by the PMU: Mbarara (22 percent), Soroti (2 percent), and Palissa (22 percent).
In Bushenyi District, the district authority reported receiving no funds, though it is not
clear if this discrepancy arose from improper accounting or leakage (Table 27).
Table 26: Financial resources transferred by the NWSADP Project
Management Unit and received by districts (UShs millions)
2006/07 2007/08 Total
Reported financial transfers from PMU to districts
Arua 96.5 302.2 398.6
Koboko 46.1 113.9 160.0
Nebbi 205.7 323.2 528.9
Financial transfers reported received by districts
Arua 313.9 282.6 596.5
Koboko 32.4 120.9 153.3
Nebbi 205.7 323.2 528.9
Source: NWSADP Project Office and districts.
Table 27: Financial resources transferred by NLPIP Project Management Unit
and received by districts (UShs millions)
2006/07 2007/08 Total
Reported financial transfers from PMU to districts
Mbarara 136.3 14.0 150.3
Bushenyi 22.8 0 22.8
Soroti 48.5 30.2 78.7
Palissa 50.2 24.0 74.2
Financial transfers reported received by districts
Mbarara 114.4 0 114.4
Bushenyi 0 0 0
Soroti 48.5 29.0 77.5
Palissa 50.2 7.4 57.6
Source: NLPIP Project Office and districts.
128. Leakage was also reported when centrally procured goods were transferred
to districts. Under LDCP, the leakages were quite high (Table 28). There was no
leakage of goats supplied by NLPIP and 4 percent leakage of heifers/zebu cattle (Table
29).

55
Table 28: Physical resources reportedly transferred by the LDCP Project
Management Unit and received by districts (000 doses of vaccine)
Bushenyi Kiruhura Mbarara Budaka Soroti
Min. Dist. Min. Dist. Min. Dist. Min. Dist. Min. Dist.
Rabies 7.5 11.5 20.5 11.0 1.0
Foot and mouth
disease
43.1 32.9 321.0 9.5
Newcastle disease 103.0 53.0 55.0 5.0 50.0 50.0 20.0 28.8
Lumpy skin
disease
9.1 11.0 24.0 25.0 0.7 3.9
CBPP 0.1 0.0 130.0 0.0 1.5 5.0
Brucella S19 60.6 30.5 43.5 20.0 25.0 1.4 4.0 1.6
Total 223.4 138.9 594.0 50.0 25.0 24.1 50.0 56.0 24.0 34.4
Source: LCDP Project Office and districts.
Table 29: Physical resources reportedly transferred by NLPIP Project
Management Unit and received by districts (numbers of animals)
Goats Heifers/zebu cattle
Cattle supplied by PMU to district
Mbarara 755
Bushenyi 400
Kiruhura 700
Soroti 1,595
Palissa 1,423
Cattle received by district
Mbarara 755
Bushenyi 400
Kiruhura 700
Soroti 1,560
Palissa 1,353
Source: NLPIP Project Office and districts.
129. Despite the leakage found under some projects, project procedures for
identifying potential beneficiaries took the geographic distribution of poverty into
account, in an effort to reduce leakage. Most projects used MoFPED’s formula for
distributing goods and services supplied through poverty alleviation funds to local
governments. The formula weights districts by population and poverty level (an example
of how the formula was used to distribute goats across NLPIP districts is shown in Annex
2). It is unclear, however, how beneficiaries were selected at the community level.
130. The last but not least weakness identified in the projects reviewed here is the
lack of strategic direction and of complementary public expenditure. Stand-alone
projects should nevertheless be part of a coherent agricultural development strategy. The
success of many projects depends on complementary public expenditures and policies. If
a project introduces improved seed and fertilizer to farmers, for example, farmers will
need to be able to obtain those inputs in the market even after the project ends. If access
to those inputs is not addressed systematically by improving roads and strengthening the
network of agro-dealers, the project usually does not result in the sustained use of
technologies by farmers, and the resources invested are simply wasted.

56
131. Distribution of vaccines or live animals is ineffective without complementary
measures for effective disease control. Even if wastage from vaccine distribution and
utilization can be reduced, vaccination alone is unlikely to improve animal health
substantially. Similarly, distributing livestock without addressing the prevalent diseases
will result in low value for money and wastage, because animals often die on delivery.
Livestock disease control has not been a priority for government spending. Only 7
percent of Uganda’s agriculture budget is allocated to controlling livestock diseases
(Table 15, Section 2.4), and even that small sum is irregular and unpredictable. MAAIF
can detect and control only one-sixth of the dangerous diseases listed by the World
Health Organization and only those caused by ticks and tsetse. Diseases caused by
viruses cannot be traced at all. The central veterinary lab is understaffed and ill equipped.
Samples are sent overseas, usually to Italy, for testing, and results are not available for
two to three months, which is a very long time to deal effectively with dangerous
diseases. The weak capacity of MAAIF and district veterinary departments to detect and
eradicate diseases leads to poor livestock health and consequently low livestock
productivity. Under these circumstances, the distribution of animals or even vaccines,
even if it can be done more effectively, may not by itself be a cost-effective means of
achieving the desired outcome—improved livestock health.
132. Another drawback in choosing the proper low-cost intervention to address
livestock diseases is the lack of a central mandate to coordinate the response to
disease outbreaks. Livestock disease control has been shifted to the districts, with
MAAIF providing technical and financial assistance. Diseases do not have borders,
however. District veterinary officers use animal checkpoints along known routes to deter
illegal movement of animals. Those who move the animals should have permits and
trading licenses. The checkpoints control disease better then vaccination, but when
disease outbreaks occur, neighboring districts do not necessarily limit the movement of
animals, and the outbreaks spread. When interviewed, local government staff who are
directly involved in managing outbreaks proposed that the response to disease outbreaks
should be centrally coordinated to ensure that all parties comply with control measures.
133. A final example of sources of waste relates to microfinance. Almost all
projects have sought to improve farmers’ access to credit through Savings and Credit
Cooperatives (SACCOs). NWSADP planned for farmers to obtain credit from SACCOs
to purchase improved seed and fertilizer, introduced by the project during the first year.
The lack of viable SACCOs and other microfinance institutions in most project areas,
however, delayed the project’s production enhancement component by five years.
SACCOs alone cannot solve farmers’ credit problem, however. Complementary work is
required on collateral, regulations, and macroeconomic improvements to ensure that
smallholders can obtain low-interest loans from SACCOs. Even if a SACCO is
established in an area, smallholder farmers do not automatically gain access to credit. On
the contrary, observations and interviews in rural areas show that most microcredit goes
to better-off households with diversified activities and off-farm income. And as in past
experiences with supply-driven rural finance, the low rates of repayment (55–59 percent
in NWSADP and 57–69 percent in AAMP) raise similar concerns about the sustainability
of SACCOs. When preparing and appraising project activities, it is vital to have realistic
expectations of what SACCOs or other rural financial institutions may and may not offer.

57
Funds will be wasted if project components are designed based on the assumption that
potential beneficiaries will have easy, automatic access to credit, use it effectively and be
able (and willing) to repay.
4.5. The impact of NAADS
134. The National Agricultural Advisory Services (NAADS) program is a 25-year
program with an initial phase of 7 years.42
Its goal is to increase market-oriented
agricultural production by empowering farmers to demand and control agricultural
advisory and information services. The specific objectives of NAADS are to:
Increase the effectiveness, efficiency, and sustainability (including financing,
private sector participation, farmer responsiveness, deepening decentralization,
and gender sensitivity) of the extension delivery service.
Increase and sustain farmers’ access to knowledge (education), information, and
communication to farmers.
Increase and sustain farmers’ access to effective, efficient, and productivity-
enhancing technologies.
Create and strengthen linkages and coordination within the overall extension
services.
Align extension to government policy, particularly privatization, liberalization,
decentralization, and democratization.
135. NAADS receives the highest share of the agriculture budget. It accounted for
36 percent of the average sector budget during 2005/06–2008/09, rising from 30 percent
in 2005/06 to 46 percent in 2008/09 (Table 2 and Table 3). At the beginning of
implementation, the NAADS Secretariat handled many procurement and other functions
on behalf of the districts and subcounties, but over time spending has shifted from the
Secretariat to local governments, as districts and subcounties assumed their functions and
as more districts were added to the program. Whereas only 59 percent of the NAADS
budget was managed at the district level in 2005/06, in 2008/09 this share was
programmed to reach 83 percent.
136. Investments in NAADS have brought high economic returns. The overall
benefit-cost ratio was estimated at 2.5 in the impact evaluation, indicating that every
shilling invested in NAADS yielded about 2.5 shillings of net social benefits. These
findings are supported by qualitative findings that a higher proportion of NAADS farmers
feel their food security, wealth, and overall wellbeing has improved over the past four
years relative to the non-NAADS members.
137. Since most NAADS activities are now locally designed and executed, the
districts receive financial transfers instead of centrally procured goods and services.
42 As mentioned, this subsection is based on a recent IFRPI impact evaluation, complemented by AgPER
Task Team findings in the districts visited.

58
Ending the central procurement and transfer of goods has reduced the scope for leakages.
Decentralized procurement, however, has not eliminated all concerns about whether
NAADS delivers value for money. In several instances, inputs have reportedly been
provided at a higher cost than the prevailing market price, and their quality has also been
reported to be poor. These issues were associated with the procurement process and are
now addressed by entrusting procurement directly to the communities. With substantial
resources now going into inputs, the concern with value for money will continue, calling
for closer monitoring.
138. Districts usually report that they have received the financial resources for
NAADS as planned. There are some minor discrepancies—mostly reports of higher
transfers than shown in the records at the Secretariat (Table 30).43
The scope for leakages
associated with central management, however, has been eliminated: Funds are transferred
directly from the Treasury to the districts, not through the NAADS Secretariat, and are to
be used only for expenditures related to NAADS.
Table 30: Flow of financial resources from the NAADS Secretariat to districts,
2005/06–2006/07 (UShs millions)
2005/06 2006/07 TOTAL
Reported financial transfers from the Secretariat to
districts
Arua 1,246.0 1,092.0 2,338.0
Mbarara 427.0 622.0 1,049.0
Bushenyi 891.0 1,277.0 2,168.0
Pallisa 224.1 224.1
Financial transfers reported received by districts
Arua 1,307.8 1,092.0 2,400.0
Mbarara 667.8 622.0 1,289.1
Bushenyi 823.6 1,283.8 2,107.4
Pallisa 224.1 224.1
Source: Secretariat and district NAADS offices.
139. Farmer training generally covered such skills as developing a group
constitution and bylaws, leadership, growth and development, planning, record
keeping, and savings mobilization. More groups were trained in subcounties where
NAADS first started than in subcounties where the program started later or was not
implemented. About 90 percent of farmers found the training to be very useful or useful,
although more groups in the initial NAADS subcounties reported that it was very useful
or useful, compared to groups in subcounties where the program started later. These
findings suggest that NAADS is gradually strengthening farmers’ skills and institutional
capacity to improve natural resource management, agricultural productivity, and
marketing. NAADS service providers, compared to others, were rated very highly on
their training methods and performance.
43 The small deviations between funds reported transferred and received might be explained by delays in
reflecting the full accounts at the district level or by improper placement of funds between fiscal years.

59
140. Farmers generally felt that their sense of empowerment, especially in relation
to technical public officers, was stronger. This response is very encouraging, because
technical public officers are well placed to address farmers’ agricultural production
problems and concerns. But technical public officers also received the worst performance
rating in terms of their response to farmers’ requests. This rating raises concern that the
ability of advisory services to meet farmers’ demands is weakening as NAADS expands
to more districts and subcounties. It is critical to provide sufficient resources to maintain
or increase advisory services for farmers already participating in the program and for new
farmers who will enter the program.
141. The evaluation findings indicate that NAADS has been successful in
increasing farmers’ capacity to demand improved crop varieties, crop management
practices, livestock breeds, postharvest practices, and marketing information,
indicating that the demand-driven approach is working. On the other hand,
participation in NAADS is associated with a lower probability that farmers will demand
improved soil fertility and agro-forestry practices, suggesting that either farmers have less
capacity to demand these technologies and/or that NAADS is not paying sufficient
attention to them. NAADS spent relatively few resources on demonstrations of soil
fertility management practices, compared to, for example, acquiring improved planting
material. To ensure sustainable productivity, NAADS must increase farmers’ capacity to
demand soil fertility management practices. In the initial stages of demand-driven
approaches, it may be necessary to proactively provide advisory services on soil fertility
and agro-forestry practices to build farmers’ capacity to demand them.
142. Consistent with the positive impact on capacity strengthening, demand for
advisory services, and adoption of improved technologies, NAADS has had a
significant impact on crop productivity. The gross value of crop output per acre was 29
percent higher for farmers participating in the NAADS program than for nonparticipants.
The impact of the NAADS program on livestock productivity is surprising: A decline of
about 27–45 percent in the value of gross livestock output per unit of animal was found
among NAADS participants compared to nonparticipants. This finding requires further
analysis, because it is not clear how an association with NAADS would make livestock
less productive.
143. NAADS participants were associated with a 42–53 percent average increase
in per capita agricultural income compared to nonparticipants. The impact of the
program on total agricultural income was more favorable than its impact on income from
crops and livestock, owing to the additional substantial income from participants’ high-
value agricultural activities, such as beekeeping and aquaculture. This finding
demonstrates the program’s effectiveness in diversifying incomes and promoting more
high-value activities. The results also show that compared to nonparticipants, a
significantly larger proportion of NAADS participants perceived their situation to have
improved; nonparticipants felt that it was unchanged or worse. For example, 41–58
percent of NAADS participants perceived that their average wealth, ability to meet basic
needs, overall wellbeing, access to adequate food, and the nutritional quality of their food
had improved between 2000 and 2004 and between 2004 and 2007, compared to 27–44
percent of their nonparticipating counterparts. These results are consistent with the

60
positive impacts of NAADS on the adoption of improved technologies and agricultural
productivity and income, and they suggest that NAADS has helped farmers improve their
households’ standard of living.
144. The impact evaluation clearly indicates that NAADS could have had a
greater impact if its activities had been complemented by other rural services and
public investments. For example, NAADS participants increased their sales of
agricultural output only marginally. Crop sales were 6 percent higher for NAADS
participants compared to nonparticipants, and sales of all agricultural produce were only
4 percent higher. The impact on sales of livestock products was negligible. The limited
impact on sales results from the failure to invest in infrastructure and market
development, as mentioned throughout this report.
145. Another finding of the impact evaluation supports the call for increased
public investments to complement NAADS: The program has had its greatest impact in
better-off areas. Income growth was highest in central and western Uganda, where the per
capita income of NAADS participants rose by 65–165 percent between 2004 and 2007
compared to that of nonparticipants. The better-off regions are characterized by higher
quality infrastructure and better access to such services as finance and transport. The
experience of NAADS strongly confirms the importance of a coherent strategy for
―packaging‖ public expenditure to support sustainable agricultural development.
4.6. Incidence of agricultural public expenditure
146. One measure of the effectiveness of public expenditures is the extent to which
they are reaching the targeted beneficiaries among the rural population. This kind of
benefit incidence analysis is particularly helpful in assessing the extent to which public
services are pro-poor, which is a key objective of government and development policy.
Using the household survey data that were also used to estimate the impact of NAADS,
the incidence of some public services in Uganda is examined here. The analysis begins
by examining the incidence of public expenditure by wealth quintile. It is then
complemented by as assessment of financial resources received from all sources,
governmental and nongovernmental. The final sections assess the incidence of access to
information and advisory services, infrastructure, and other public services (in other
words, core public goods).
4.6.1. Incidence of public support and nongovernmental credits
147. Are the various forms of public support pro-poor? As noted in Section 2.3,
expenditures on inputs and other private goods constitute the largest share of agricultural
expenditure in Uganda. A key rationale for subsidizing inputs and other private goods is
to help farmers, especially poor farmers, obtain new technologies and inputs. Yet the
results of the 2007 household survey show that the opposite has occurred. The Integrated
Support to Farmer Groups (ISFG) grants, as well as non-ISFG NAADS support, have
been concentrated mostly among wealthier households (Figure 13). Overall, Uganda’s
public support to agriculture, which is dominated by expenditures on private goods such
as inputs, appears to have been regressive.

61
148. The wealthiest quintile of farming households also benefited the most from
credit and other forms of assistance.44
Total support from all sources—including credit
as well as assistance from nongovernmental and governmental sources—was highest
among the most affluent farmers (Figure 14). The proportion of households receiving any
kind of support also increased with wealth, although the differences among wealth groups
were less marked (Figure 15). Overall, between 40 and 50 percent of households received
support in each of the top four quintiles, and the data show no gender bias.
149. Households participating in NAADS showed greater access to support in
every quintile, although the mean total support per capita is similar among NAADS and
non-NAADS participants across all quintiles, particularly when averaged across
households getting support from any source. This finding suggests that support provided
to NAADS households is more extensive and more equitable than support supplied to
other households (Figure 16 and Figure 17). On per capita basis, however, the households
that could obtain credit benefited the most from grants and subsidies. This finding holds
true for NAADS members as well (Figure 18).
44 Wealth is highly correlated with household consumption and income.

62
Figure 13: Incidence of public agricultural expenditures by household wealth
quintile
Source: AgPER Task Team, based on household survey.
Figure 14: Incidence of total support by
wealth quintile
Figure 15: Proportion of households
receiving support by wealth quintile
Source: AgPER Task Team, based on household survey.
020
4060
Sup
port
per c
apita
(US
h)
1 2 3 4 5
Incidence of Govt. Support per capita by Source : 2007
NAADS (non-isfg) Support (USh) ISFG Support (USh)
Other Govt. Support (USh)
0
100
200
300
Me
an
To
tal S
upp
ort
per
ca
pita
: C
red
it,
Gra
nts
& S
ub
sid
ies (
US
h)
1 2 3 4 5
Incidence of Credit, Grants & Subsidies over Wealth Quintiles : 2007
0.1
.2.3
.4.5
Fra
ction
of
Hou
se
ho
lds th
at R
ece
ive S
up
po
rt
1 2 3 4 5
Incidence of Support over Wealth Quintiles : 2007

63
Figure 16: Incidence of support for
NAADS and non-NAADS participants by
wealth quintile
Figure 17: Amount of support received by
NAADS and non-NAADS participants by
wealth quintile
Source: AgPER Task Team, based on household survey.
Figure 18: Incidence of credits and public expenditure by wealth quintile
Source: AgPER Task Team based on household survey.
0.2
.4.6
.8
Fra
ction
of
Hou
se
ho
lds th
at R
ece
ive S
up
po
rt
0 1
1 2 3 4 5 1 2 3 4 5
Incidence for Naads Non-Members (Left) and Naads Members (Right)
Incidence of Support over Wealth Quintiles : 2007
0
100
200
300
400
500
To
tal S
up
port
pe
r ca
pita :
Cre
dit, G
ran
ts &
Su
bsid
ies (
US
h)
0 1
1 2 3 4 5 1 2 3 4 5
Incidence for Naads Non-Members (Left) and Naads Members (Right)
Incidence of Credit, Grants & Subsidies over Wealth Quintiles : 2007
0
1,00
02,
000
3,00
0
Cre
dit,
Gra
nts
& S
ubsi
dies
per
cap
ita (U
Sh)
1 2 3 4 5
Incidence of Credit, Grants & Subsidies over Wealth Quintiles : 2007
Total Credit Support per capita (USh) Total Grant Support per capita (USh)
Total Subsidy Support per capita (USh)

64
4.6.2. Incidence of agricultural advisory services
150. The primary outputs of NAADS—advisory services and access to
information—appear to be supplied more equitably than credits, grants, and
subsidies. Across all households, the proportion that had received agricultural advisory
services in the previous year (2006–07) was higher among wealthier households (Figure
19). Even so, a comparison of NAADS members and nonmembers reveals that NAADS
members received significantly more advisory services and that those services were more
evenly distributed across wealth quintiles (Figure 20). Among NAADS members,
regardless of wealth quintile, the incidence of advisory services was unrelated to the level
of education, while it was related to education for non-NAADS households. Advisory
services were not supplied so equitably among male- and female-headed households,
however. Households headed by men received more agricultural advisory services in
2006–07.
Figure 19: Incidence of Agricultural
Advisory Services by wealth quintile Figure 20: Incidence of Advisory Services
by NAADS membership by wealth quintile
Source: AgPER Task Team, based on household survey.
151. Access to crop market information and production practices was evenly
distributed across wealth quintiles. Both NAADS and non-NAADS members accessed
information on crop markets and production practices irrespective of wealth quintile. As
a group, NAADS members had somewhat better access compared to nonmembers
(Figure 21).
152. The more equitable distribution of information and advisory services
provided by NAADS has increased the impact and effectiveness of this public
expenditure. As shown in Figure 9, about 37 percent of total agriculture spending was
allocated to the agricultural advisory services through NAADS. The high rates of return
to NAADS investments described in Section 4.5 and the more equitable incidence of its
advisory services suggest that the implementation arrangements have been successful.
0.1
.2.3
.4.5
Pro
po
rtio
n o
f H
ouse
ho
lds th
at R
ece
ived
Advic
e in
the
Last Y
ear
1 2 3 4 5
Incidence of Agricultural Advisory Services Across Welath Quintiles : 20070
.2.4
.6.8
Pro
po
rtio
n o
f H
ouse
ho
lds th
at R
ece
ived
Advic
e in
the
Last Y
ear
0 1
1 2 3 4 5 1 2 3 4 5
Incidence for Naads Non-Members (Left) and Naads Members (Right)
Incidence of Agricultural Advisory Services Across Welath Quintiles : 2007

65
Figure 21: Access to information on crop production methods and practices by
wealth quintile
Source: AgPER Task Team, based on household survey.
4.6.3. Access to infrastructure and other services
153. The incidence of other core public services varies for social and agricultural
services. Table 31 shows household access to various public and private services,
measured as the distance from the homestead to the service point. Social services such as
health, education, and drinking water are quite equitably distributed, whereas access to
agricultural services is not. The poorest wealth quintile lives farthest from most
agricultural and complementary services, especially extension officers, financial
institutions, and primary consumption markets.
0.2
.4.6
.8
Pro
porti
on o
f Hou
seho
lds
0 1
1 2 3 4 5 1 2 3 4 5
Incidence for Naads Non-Members (Left) and Naads Members (Right)
Incidence of Information on Improved Crop Production Methods over Wealth Quintiles : 2007
Improved Crop Production Technology Improved Crop Production Practice

66
Table 31: Incidence of public and private services across wealth (per capita)
quintiles, per capita in 2007
Median distance to service (km), 2007
Service Quintile 1 Quintile 2 Quintile 3 Quintile 4 Quintile 5
All-weather road 1.5 1.5 1.2 1.0 1.6
Seasonal road 0.4 0.2 0.3 0.2 0.2
Primary consumption market 1.6 0.8 0.8 0.8 0.5
Secondary (sellers) market 4.0 3.1 3.0 3.0 3.0
Livestock market 7.6 7.0 7.0 6.4 6.0
Slaughter facility 5.0 4.8 4.0 3.8 4.0
Input shop 8.0 7.0 6.4 6.0 6.0
Vet drugstore 7.0 6.4 6.4 5.0 4.8
Vet clinic 6.4 6.0 6.0 4.8 5.0
Livestock disease facility 7.8 5.0 6.4 4.8 4.8
Primary school 1.5 1.0 1.0 1.0 1.0
Public clinic 4.0 3.2 3.0 3.0 3.0
Private clinic 2.0 2.0 1.5 1.6 1.5
Human drinking water source 0.5 0.5 0.5 0.5 0.5
Livestock drinking water source 1.0 0.8 0.5 0.6 0.5
Fuel supply source 0.5 0.5 0.5 0.5 0.3
Bank 22.2 19.2 20.0 16.0 14.2
Microfinance institution 14.7 8.0 7.0 6.5 5.0
Extension/agricultural office 7.5 7.0 6.4 5.0 4.8
Source: AgPER Task Team, based on household survey.

67
5. Conclusions and Policy Recommendations
5.1. Agricultural sector budget: recent developments
154. Between 2001/02 and 2008/09, agricultural sector expenditures can be
divided into two distinct phases. During the first phase, from 2001/02 to 2003/04, the
budget for agriculture fell sharply in both nominal and real terms. It began to recover
after 2004/05. In nominal terms, cumulative growth in the sector budget was 46 percent
higher in 2008/09 than in 2001/02. Despite this seemingly spectacular increase, however,
in real terms the 2008/09 sector budget was about the same as it was in 2001/02. Real
expenditures were 38 percent higher in 2008/09 than at their low point in 2004/05. As a
share of the national budget, the agricultural sector budget had fallen to 3.8 percent in
2008/09 from 5.7 percent in 2001/02. Finally, in terms of GDP, the sector budget
remained stable, albeit low, at 1.6 percent. These are the statistics for the approved
budget. The released budget was on average 10 percent lower, reducing the share of
sector expenditure in GDP to a very low 1.2 percent.
155. The agricultural sector budget is not much larger when it is defined
according to the United Nations classification of functions of government. Under the
COFOG classification, recommended by CAADP/NEPAD for comparing agricultural
expenditures across African countries, the sector budget as a percentage of the national
budget is about 1 percent higher (for example, increasing to 5.4 percent for the released
budget in 2005/06). Donors account for substantial off-budget spending, although
information on these expenditures is fragmented, difficult to obtain, and largely ignored
by planners and policy makers. For two donors for whom data are available, off-budget
spending is estimated to account for 10–20 percent of the total sector budget. Overall,
even with off-budget funds, the agricultural sector budget in Uganda is still about twice
as low as necessary to meet Uganda’s Maputo Declaration pledge to allocate 10 percent
of the national budget to agriculture under CAADP. In addition to these public
expenditures, significant volumes of expenditures by nongovernmental organizations,
estimated conservatively at about 10 percent of the current budget amount, pose
additional coordination and harmonization problems.
156. Is the agricultural sector expenditure expected to grow in the near future? It is
not projected to grow but to keep declining, according to the MTEF. In 2012/13, the
agricultural expenditure is expected to be 3.2 percent of national expenditure, compared
to 3.8 percent in 2008/09 and 4.6 percent in 2001/02. Even though budget will shift to
other areas, notably infrastructure and social development, these shifts will indirectly
benefit agriculture. Within the agricultural sector budget itself, resources will continue to
shift from the national to local level, mainly to NAADS in the districts. Given this
outlook, it is more critical than ever to ensure that scarce budgetary resources are used in
a highly effective, efficient way at all levels. It is also vital for MAAIF to improve
collaboration with local governments, because they will increasingly be responsible for
implementing agricultural programs.
157. How does Uganda’s agricultural sector expenditure compare to that of other
countries? As a share of GDP, public spending on agriculture in Uganda (adjusted by the

68
size of the sector) is low compared to spending in high- and middle-income countries but
comparable to spending in selected Sub-Saharan African countries. Although additional
public spending is required for agriculture in Uganda, two important points must be borne
in mind. First, the current lower level of spending is consistent with Uganda’s narrower
fiscal capacities and its greater need to invest in infrastructure and social development.
Second, international experience shows that lower public spending does not necessarily
mean lower agricultural competitiveness. Vastly expensive farm subsidies in the United
States and European Union have failed to keep farmers competitive internationally, while
the small public expenditure on agriculture in Brazil, Australia, and New Zealand has not
prevented farmers from being highly competitive on world markets.
158. Three conditions must be met to maximize the impact of public spending on
agriculture in Uganda. These conditions will be even more critical if spending begins to
rise again. First, public expenditures on agriculture must be supported through an
enabling environment in which agricultural prices are subject to few distortions. It is
counterproductive to raise the public expenditure on agriculture when farm-gate prices
are depressed. Second, the mix of spending should be efficient (allocative efficiency).
Spending that does not contribute (or does not contribute as much) to growth and poverty
reduction, relative to alternative goals, is allocatively inefficient or unproductive. Third,
technical efficiency should be high. Technical efficiency in the public sector involves
making the best use of inputs to provide outputs in the form of public services. (Put
simply, technical efficiency is doing things well, and allocative efficiency is doing the
right things.) When those three conditions are met, even small budgets will be well
positioned to generate economic growth and encourage more private investment. It is also
very likely that when these conditions are met, the scaling up of agricultural sector
expenditure in Uganda will bring the highest rates of return.
5.2. Agricultural price distortions
159. Uganda has successfully addressed one important component of the
efficiency of public expenditure: Agricultural price distortions have been largely
eliminated, and most farm-gate prices are at the level of reference border prices adjusted
for marketing costs. In 2001–04, the rate of assistance to agriculture was estimated at 1
percent, with no taxation to exportables and about 13 percent support to importables such
as rice. The nonagricultural rate of assistance has also notably decreased, reducing the
prices of farm inputs and stimulating resource flows to agriculture. The policy
environment in Uganda can be described as quite conducive for public expenditure to
have a lasting impact.
5.3. Allocative efficiency of public expenditure
160. The allocative efficiency of public expenditure can and must be improved.
The first drawback is the small share of capital expenditure in the sector budget. An
economic decomposition of public spending illustrates that in Uganda ―development
expenditure‖ is not synonymous with ―capital expenditure,‖ as usually assumed.
Development expenditure makes up about 80 percent of the agriculture budget but is
heavily oriented to nonwage recurrent expenditures rather than to capital expenditures.

69
The share of capital outlays in the 2008/09 approved budget was 6 percent, down from an
already low level of 11 percent in 2005/06. Too little is invested in rural community
roads, bridges, and wholesale and livestock markets. Only a minor share of the budget is
allocated to irrigation and to veterinary, sanitary, and phytosanitary laboratories and
equipment, despite their considerable importance for raising agricultural productivity.
Furthermore, much technical inefficiency in capital expenditures reduces the impact of
even that small capital outlay to a very low level.
161. Uganda’s low level of capital expenditure is bad news, because the condition
of rural infrastructure strongly affects agricultural trade, farm diversification, and
ultimately poverty. The recent study by Balat et al. (2008) in Uganda demonstrates that
greater trade in cash crops (coffee, tea, cotton, and fruits) has a strong effect on poverty
reduction. High marketing costs caused by poor rural infrastructure prevent many
Ugandan farmers from participating in markets, leaving them little choice but to grow
staple food crops for domestic consumption.45
162. The second drawback of agricultural sector expenditures is that they are
increasingly dominated by nonwage recurrent expenditures, mainly subsidized
inputs and other goods.46
Between 2005/06 and 2008/09, nonwage recurrent spending,
mainly for farm inputs, comprised 65 percent of MAAIF’s development budget on
average. The share of nonwage recurrent spending in MAAIF’s total budget grew from
49 percent in 2005/06 to 80 percent in 2008/09. Inputs are distributed by many
development projects and increasingly by NAADS. In 2008/09, NAADS received about
UShs 37 billion ―for inputs to the small-scale farmers who cannot afford to purchase the
necessary inputs.‖
163. Making inputs accessible is integral to raising agricultural productivity, but
the current approach of distributing inputs is unlikely to achieve this objective. The
current approach favors the wealthiest farmers, who can perhaps already afford these
inputs. It does not strengthen private input suppliers, improve the targeting of subsidies
(through the use of vouchers, for example), or invest in infrastructure to ensure that
farmers can obtain inputs easily. Most input distribution and promotion is simply supply
driven. It fails to meet the requirements of market-supporting smart subsidies. As
allocations for subsidized inputs grow, the fiscal burden and economic distortions (waste
and leakages, as well as displacement of input sales by private sector) will also grow, if
the mechanism for delivering inputs remains unchanged.
164. The third problem with the allocative efficiency of the agricultural sector
budget is the share of wage and operational expenditures going to MAAIF
Headquarters relative to other MAAIF departments. MAAIF Headquarters absorbs
35 percent of MAAIF’s recurrent budget. Although this large share is partially explained
45 Balat, J., I. Brambilla, and G. Porto (2008): Realizing the Gains from Trade: Export Crops, Marketing
Costs, and Poverty. World Bank Policy Research Working Paper 4488, Washington, DC. 46
The analysis in Section 4.6 clearly shows the regressive nature of subsidies and fairly equal distribution
of core public goods.

70
by higher wage allocations for senior staff, high transport costs to Kampala from
Entebbe, and other recurrent expenses paid from Headquarter for services used by all
MAAIF departments, Headquarters operating costs must be reduced and more operating
funds shifted to technical staff in other departments of MAAIF, where recurrent
expenditures are dominated by wages, leaving little operational funding for the technical
staff to be effective.
165. Another way of assessing allocative efficiency is to analyze the functional
composition of public expenditures. At first glance, the functional composition is quite
efficient, given that the largest share of the budget is allocated to areas with the highest
potential for enhancing pro-poor growth, namely advisory services and agricultural
research.47
These categories absorbed 57 percent of the sector budget between 2005/06
and 2007/08. Even so, many other core public goods remain underfinanced, undermining
the potential impact of research and advisory services. The critically underinvested areas
are water capacity building, rural infrastructure, livestock and plant pest and disease
control, regulatory services, and institutional development. These are core public goods.
The private sector will not invest in most of them, but they are essential for catalyzing
private investment in agricultural production and agribusiness. Investments in these
public goods are also critical for ensuring that the geographically focused interventions of
development projects can be sustained, in the sense that farmers retain access to markets
and services even after development projects have ended and that technologies promoted
by NAADS are available at the lowest possible cost.
166. Given these drawbacks, how can the allocative efficiency of public expenditure
be improved? More specifically, how can Uganda increase its expenditure on critical
public goods without undermining fiscal sustainability? In the short run, it might be not
possible to shift substantial resources to critical functions within the existing budget,
because these resources are committed to ongoing development projects. Resources for
underfinanced critical public goods need to come from additional sources, including
donor funds. In the medium to longer run, however, development resources must be
shifted strategically from private to public goods and from nonwage recurrent to capital
expenditures. Furthermore, the technical efficiency of agricultural spending must be
improved, as indicated in the next section, but such improvements will increase the
allocative efficiency of public spending and its impact on agricultural growth.
5.4. Technical efficiency of public expenditure
167. The technical efficiency of most MAAIF development projects is low.
Technical efficiency must improve if MAAIF is to make a convincing case for
substantially scaling up funding for agriculture. Not all of the blame for technical
inefficiency rests with MAAIF. Many factors—neither specific to agriculture nor under
MAAIF’s immediate control—prevent projects from being implemented efficiently,
including delayed budget ratification by Parliament, untimely and insufficient release of
47 The impact of NAADS expenditure is reinforced by the program’s fair provision of services to all
NAADS members, irrespective of their wealth ranking.

71
government counterpart funds, the weak procurement and fiduciary capacity of public
officials, and insecurity in northern Uganda. These constraints cause several years to pass
before a project can be launched effectively in Uganda, and they adversely affect a
project’s viability. The transaction costs of implementing a project rise when counterpart
funds are constantly delayed and the procurement of goods and works is cancelled.
MAAIF should keep raising these important issues and actively seek concerted remedies
at the national and regional level.
168. Despite the many factors outside MAAIF’s control, the remaining constraints
on technical efficiency are significant and must be addressed by MAAIF and local
government. Most MAAIF development projects with infrastructure components are
characterized by delays of three to five years in building and rehabilitating rural
infrastructure. Aside from the above-mentioned causes, these delays have been caused by
improper appraisal and feasibility work, poor coordination of project preparation and
implementation between MAAIF and local governments, inadequate operating budgets
for local technical staff, ineffective project procurement, and problems related to land
tenure. The results are high cost overruns, low-quality work, and other kinds of wastage.
Given that capital expenditures account for such a large share of the development
projects reviewed here (81 percent of MAAIF’s capital budget), MAAIF must take
immediate action to devise remedies based on these lessons. These lessons should also be
considered when new investment projects are prepared.
169. Several other lessons on technical inefficiencies have emerged from
assessments of how goods and services are being delivered to farmers and frontline
service providers. First, the unit costs of goods procured at the central level were usually
20–50 percent higher than comparable market prices or unit costs at the local level.
Second, the delivery of centrally procured goods was prone to wastage. The projects
provided unhealthy livestock. A significant number of animals (ranging from 7 to 28
percent across interventions) died in the first months after delivery. Vaccine was wasted
because it was overpriced and could not be stored. Records of transfers of financial and
physical resources from central offices to districts often do not match, suggesting
wastage, diversion, or leakage, although the precise source of the problem remains
unclear. Possibilities include poor record keeping, indicating low accountability,
diversion from intended beneficiaries or areas, corruption, resource misallocation,
improper accounting, or simply insufficient information from project implementation
units). Leakages were more pronounced for in-kind transfers than financial transfers,
suggesting that inputs/goods are easier to redirect from the intended beneficiaries or
purpose. These costs are lower for NAADS, because most procurement is being
decentralized and the process is more participatory.
170. The impact of individual projects is considerably circumscribed by the lack
of a strategic approach for using public expenditures to support agriculture. One
example is the current strategy for improving farmers’ access to inputs, which focuses on
input distribution, complemented by training. This strategy fails to resolve the real causes
of farmers’ poor access to inputs, including high transaction costs (caused by poor rural
infrastructure), slow progress in microfinance development, and the weak technical and

72
business capacity of private agro-dealers. Although too little capital is invested in rural
areas, even that small expenditure can be improved significantly.
171. Other examples of how impact is reduced by the absence of a more strategic
vision is the distribution of animals and the promotion of animal vaccines without
investments in complementary disease control measures. The small share of the
agricultural sector budget allocated to control livestock diseases in Uganda means that
MAAIF’s capacity to detect and control dangerous diseases is extremely limited. Under
these circumstances, the distribution of animals is likely to result in low value for money
and wastage. Similarly, distribution of vaccines, even if it is improved, is unlikely to
improve livestock health sustainably.
172. The NAADS impact evaluation supports these findings about technical
inefficiency in MAAIF development projects. NAADS has succeeded by being
demand-driven and decentralized. Much of the wastage and leakage of centrally managed
programs is avoided because most NAADS activities and procurement occur locally.
Although NAADS has substantially improved the incomes of the program participants
and shows a high economic rate of return, its impact would have been greater if its
activities had been supported by complementary investments in rural services such as
finance and roads. If these investments are made, they can reduce the cost of inputs, make
inputs more accessible, and ensure that NAADS remains a powerful means of sustaining
rural development.
173. Against this background, the following recommended actions would increase
the effectiveness and technical efficiency of agricultural sector expenditure in
Uganda:
Faced with the prospects of declining budget allocations in the future, the
topmost priority for MAAIF is to ensure that its limited resources are used as
efficiently and effectively as possible. MAAIF should target the highest
priorities and seek institutional arrangements to deliver services more
effectively through decentralized implementation arrangements. In line with
the widely accepted principles of good governance, MAAIF should ensure
transparency, accountability, and participation in its service delivery in an
effort to maximize the efficiency and effectiveness of its expenditures.
MAAIF must ensure that problems with launching projects are at the top of
the agenda for national stakeholders. Rates of return to development projects
will increase significantly if Parliament ratifies loans rapidly, government
counterpart funds are released in a timely and predictable way (budget
execution), and public officials improve their procurement and fiduciary
capacity. Remedies for these problems must be found at the national level, and
MAAIF must play a critical role in this process.
The appraisal of infrastructure investments should be done in a participatory
manner with local governments and local stakeholders. Land tenure issues
must be clarified before projects are launched. Technical designs for
communal roads and bridges should take into account connectivity with feeder

73
and national roads. Where possible, procurement should be shifted from the
central to district level, as in NAADS. Procurement staff in local governments
should receive training. These actions will reduce unit costs, minimize
wastage, improve the quality of work, and lead to the timely delivery of
construction work.
In some instances central procurement has merits. For example, it may be
more cost effective to procure vehicles and other products internationally.
Central procurement of such goods allows MAAIF to exploit economies of
scale and effectively deal with import tax credits and other importation issues.
Procurement of domestically procured goods and services must shift gradually
to local governments, however. Compared to central procurement, local
procurement usually has lower unit costs, wastage, and leakage. Local
government should receive technical and financial assistance to strengthen
procurement and fiduciary capacity and ensure the integrity of financial
management. This support should be provided not only by MAAIF but also by
national programs.
During project implementation, wastage can be reduced through better
coordination of activities and the allocation of adequate operating funds for
supervision by local production department staff. Local technical staff
members are overburdened by multiple projects and lack funds to do their job.
More resources should be set aside for operating expenses of local technical
staff in development project budgets.
Individual projects should be better integrated into the strategy for agricultural
growth and development. Public expenditures should address the roots, not the
results, of market failures. It is inefficient to disseminate technologies in
certain geographic areas without a coherent, sustainable approach to ensure
farmers’ access to those technologies once subsidies end. A larger share of
public expenditure needs to be allocated to core public goods. The
subsidization of private goods (inputs) must be considered only as a
temporary measure to overcome market failures. The delivery of increased
budgets for inputs and other goods should be directed at resource-poor
farmers, which is currently not the case, and it should not displace but engage
the private sector.
5.5. Budget processes
174. The strategic improvement of public spending on agriculture must begin by
making greater use of the Sector Budget Framework Paper. The format and content
of the SBFP are largely dictated by the guidelines in the Budget Call Circular, issued by
MoFPED. It is time to reassess the information currently required for the SBFP as
outlined in the Circular to determine if it is essential and presented in the most effective
format for making informed decisions on budget allocations. Except for 2006/07, there
has been no feedback to the Sector Working Group (or MAAIF) from MoFPED on the
content and quality of the SBFP, nor are there suggestions for improvement in future
years. Such feedback should become a regular feature of the budget preparation process.

74
Detailed recommendations for improving the SBFP guidelines are summarized in
Annex 1.
175. The credibility of MAAIF’s Development Sector Investment Plan should be
strengthened by giving greater attention to: (i) the criteria used for prioritization; (ii)
the expected outcomes; (iii) detailed explanations of expenditure estimates; and (iv)
linking investment plans more closely to anticipated MTEF ceilings by indicating how
plans would change if MTEF ceilings increase or decrease. There is an urgent need for
MAAIF to update its strategy and investment plan for 2008/09 onwards to provide a
continued link between policy, planning, budget preparation, and negotiations. MAAIF
should also consider whether a three-year or five-year investment plan is best suited to its
purposes. A five-year plan would provide a longer horizon for investment decisions and
reduce the perceived need for frequent revisions, but changing priorities and events might
make the estimates for outer years unreliable.
176. Budget execution, the binding constraint for implementing projects, should
take into account the strong seasonality of agriculture (and thus resource
requirements) and the large costs of untimely, unpredictable counterpart financing
in development projects. Within the overall cash flow, MoFPED should cater for the
relatively small but particular cash flow requirements of agencies such as MAAIF and
NAADS to improve their operational effectiveness.
177. Substantial benefits will arise from creating a results-based system to
monitor and evaluate public expenditures. This system would contain provisions for
regular program monitoring and for evaluating the impacts of major interventions.
Currently MAAIF focuses on regularly monitoring project implementation. Such
monitoring is necessary to follow the progress and achievement of targets; it should cover
not only budget but also off-budget expenditure, which is likely to account for 10–20
percent of the sector expenditure. It is also critical to ensure that monitoring reports are
used inside and outside of MAAIF to reward good performance (or impose sanctions on
poor performance), address inefficiencies, or reallocate resources between different
priority areas.
178. Rigorous impact evaluation should be done for most development projects.
The budget for impact evaluation needs to be sufficient and must be reflected in the
project budget. Results-based M&E is indispensable to good national management and
policy planning. The regular monitoring system provides very little information about the
real impact of public programs. The absence of a results-based M&E system makes it
easy for interest groups to manipulate public debates and thus very difficult to change
current approaches to public expenditures and agricultural policy in Uganda. Impact
evaluations can range from the PETS analysis to more detailed assessments such as the
one done for NAADS. Once these evaluations become the norm, policy makers and
planners will be well equipped to guide budget allocations across sectors and address
operational constraints in agriculture programs.

75
Annex 1: Recommendations to Improve the Guidelines of the Sector Budget Framework Paper
To improve the analytical content and internal consistency of the SBFP guidelines, it
would be desirable to make the following adjustments, based on the example of the
2007/08 SBFP:48
Section 1.3.1 Priorities. Undertakings to be implemented as a result of the PMA
Joint Annual Review are listed. It is stated that they will also guide MAAIF’s
program of work, but currently there is no indication that this is the case, as the
undertakings are not discussed in the remainder of the Budget Framework Paper.
Section 2.2 Overview of FY 2005/06 Performance. Low outturns are simply
explained as ―Shortfalls...in releases.‖ A more detailed explanation of the reasons
and responsibility for these shortfalls and whether these were one-time or recurring
problems would be more helpful.
Five pages of text are devoted to listing key outputs of activities as outlined in the
2005/06 Ministry Policy Statement, but this information is unlikely to be sufficient
for proper planning. Currently all that is required in the SBFP is a listing of
highlights of selected physical and qualitative performance of activities. It is
difficult, however, to assess performance from this listing in the absence of the
targets set for the preceding year. A tabulation of achieved outputs against targets
would be much more informative and would help to establish a results-oriented
management culture in MAAIF. This could be complemented with a list of, say,
the 10 major achievements if required by the authors of the National Budget
Framework Paper.
Section 3. Overview of FY 2006/07 Budget Allocations and Objectives. The
observations made for Section 2.2 about budget and physical performance apply to
Section 3, which deals with budget performance in the first half of the fiscal year.
Although MAAIF needs to prepare quarterly Budget Performance Reports, which
list activities undertaken in each department, they contain no systematic tabulation
of planned and actual activities and outputs that could be used in the SBFP.
Section 4. Sector Budget Priorities for the Medium Term. The MAAIF
Development Strategy and Investment Plan 2005/06–2007/08 had been used last
year for the first time as the basis for sector planning and prioritization of spending
plans. At first glance, there is a clear link between policy, planning, and budgeting
decisions. However, as discussed in Section 1.4 of this report, there are wide
variations between planned expenditures as outlined in the DSIP and the approved
budgets proposed in the SBFP.
48 The content of the SBFP is complicated, because some agricultural activities (such as agro-processing,
marketing, and collecting agricultural statistics) are shared with other ministries, agencies, and local
government and not completely under the control or budget of MAAIF and its agencies. This situation
leads to ambiguities over the precise content of the agriculture SBFP.

76
Section 5. Expected Outputs, Performance Indicators and Planned Activities for
the Medium Term. Eight pages of text list outputs, indicators, and activities for the
12 priority areas. A tabular presentation would have been more concise and
effective, as it could have more clearly linked indicators to specific outputs and
activities. A table in this format could then be used in conjunction with the table
required in Section 9, showing outputs, indicators, targets, and allocation of
recurrent and development budgets to specific activities.
Section 6. Proposed Budget Allocations for FY 07/08. Having listed and explained
the 12 DSIP priority areas in Section 5, the table used in Section 6 to summarize
recurrent, development, and total budget allocations is confusing, as it shows only
9 priority areas listed in a different order and consequently numbered differently
from those in the DSIP and Section 5. In Section 6, two DSIP priority areas
(livestock and fish disease control and livestock regulation) have been
amalgamated as one priority. ―Processing and marketing of crops, livestock, and
fish‖ and ―Promotion of increased agricultural production and productivity‖ are
omitted; the activities and limited expenditure under these two priority areas are
incorporated in other priority areas. Annex 2, indicating the sources of funding for
each area, uses the same classification as the table in Section 6.
Section 7.1 Medium-Term Challenges with Implications for Additional Funding
for Sector MTEF. This section is the one place in the SBFP where a claim can be
made for additional resources. A table presents the gaps between the sums required
to implement the DSIP fully in six priority areas,49
amounting to UShs 72.5 billion
in total, but no attempt is made to identify priorities within this sum. Developed
properly, the SBFP should provide an evidence-based justification for additional
resources that might be compared by MoFPED with the claims made by other
sectors. At present, the agriculture SBFP cannot be used in this way. Until
MoFPED requires SBFPs to indicate and justify their expenditure priorities if their
budget ceilings are raised or lowered (by, say, 5, 10, or 20 percent), MAAIF is
likely to avoid making these hard prioritization decisions and much, or indeed
most, of the rationale of the SBFP process will continue to be lost.
Section 7.2 Challenges with Implications for Additional Funding Outside the
Sector MTEF Ceiling. This section allows the agricultural sector to highlight
constraints in other sectors that should be addressed, because they impinge on
agriculture’s performance. Six areas are indicated, including finalizing the
restructuring of local government production departments. Funding for the
Sembeguya goat multiplication project is also included in the list, but it is difficult
to understand why this is considered to be outside the Sector MTEF ceiling.
Section 8. Non Tax Revenue. Tables of nontax revenue (NTR) are shown for
various MAAIF cost centers and the semiautonomous agencies. The table for
MAAIF shows 2005/06 Budget NTR and outturn, 2006/07 Budget NTR and
estimated outturn, and Budget NTR estimate 2007/08. The latter is identical to the
49 Livestock disease control and regulation are again amalgamated, and a heading appears to be missing for
―Capacity building in irrigation, etc.,‖ so 8 of the 12 DSIP areas may be represented.

77
Budget 2006/07 figure, even though outturns for some expenditure items in
2006/07 differ from the budget estimates. NARO shows 2005/06 actual, 2006/07
estimated actual, 2007/08 budget, and budget forecasts for 2008/09 and 2009/10.
This approach seems more sensible and informative and might be adopted by all
agencies.
Section 9. Summary of Proposed Budget Allocations for FY 2007/08. This table
uses the 12 DSIP priority area classifications with the outputs, indicators, and
activities that were listed in bulleted text form in Section 5. It includes targets for
each indicator and a breakdown of recurrent and development budget allocations
for each activity. Because different classifications are used in the tables in Section
6 (and Annex 2) and Section 9, there are apparent inconsistencies in the amounts
allocated to each priority area, leading to confusion.
Annex 1. Details of Expected Outputs, Performance Indicators, and Planned
Activities, 2007/08 to 2007/10. This is the only opportunity in the BFP to indicate
how funds available under the MTEF ceilings for future years for each Vote would
be allocated. An effective approach would be to have a summary table indicating
whether any reallocation of funds between programs or subsectors within a Vote
was being contemplated or whether any changes in budget ceilings would be
distributed equally between programs. Justification for these adjustments could
then be presented, showing the predicted effects on outputs and activities. This
would appear to be more informative than the current approach in the SBFP, in
which some Votes and programs give detailed accounts of intended outputs,
targets, activities, and allocations of recurrent and domestic development funds
over the next three years, whereas others: (i) do not indicate whether the targets
and activities are annually recurring events or totals for the whole period; (ii)
contain typing errors; and (iii) lack some data and totals for the programs.

78
Annex 2: Distribution of Goats for Restocking as at 30th September 2007 in NLPIP
District Human
population
Household
consumption
Population
index
Poverty
index
Allocation by indices Goats
supplied Balance
Population Poverty Total
Apac 40,5524 27,677 0.0357 0.0174 1,476 481 1957 0 1,957
Bushenyi 731,392 37,625 0.0643 0.0237 2,663 654 3317 400 2,917
Kaberamaido 131,650 34,491 0.0116 0.0217 479 599 1079 0 1,079
Kamuli 558,536 34,014 0.0491 0.0214 2,034 591 2625 198 2,427
Kamwenge 263,730 39,870 0.0232 0.0251 960 693 1653 550 1,103
Katakwi 118,928 30,560 0.0105 0.0192 433 531 964 208 756
Kayunga 294,613 48,576 0.0259 0.0306 1,073 844 1917 259 1,658
Kibaale 177,000 38,729 0.0156 0.0244 644 673 1317 400 917
Kiboga 229,472 44,547 0.0202 0.0280 835 774 1609 622 987
Kitgum 282,375 24,696 0.0248 0.0155 1,028 429 1457 0 1,457
Lira 530,527 30,094 0.0467 0.0189 1,932 523 2454 0 2,454
Luwero 341,317 43,085 0.0300 0.0271 1,243 749 1991 302 1,689
Masindi 459,490 33,085 0.0404 0.0208 1,673 575 2248 400 1,848
Mbarara 453,172 51,612 0.0399 0.0325 1,650 897 2547 500 2,047
Mpigi 407,790 59,549 0.0359 0.0375 1,485 1035 2519 1023 1,496
Mubende 423,422 39,135 0.0372 0.0246 1,542 680 2222 719 1,503
Nakapiripirit 154,494 19,691 0.0136 0.0124 562 342 905 0 905
Nakasongola 127,064 39,467 0.0112 0.0248 463 686 1148 296 852
Ntungamo 379,987 53,391 0.0334 0.0336 1,383 928 2311 690 1,621
Pader 326,,338 24,696 0.0287 0.0155 1,188 429 1617 0 1,617
Pallisa 3840,89 35,554 0.0338 0.0224 1,398 618 2016 0 2,016
Rakai 404,326 43,264 0.0356 0.0272 1,472 752 2224 873 1,351
Sembabule 180,045 45,458 0.0158 0.0286 656 790 1445 1026 419
Sironko 283,092 43,320 0.0249 0.0273 1,031 753 1783 0 1,783
Soroti 369,789 34,491 0.0325 0.0217 1,346 599 1946 0 1,946
Ibanda 198,635 51,612 0.0175 0.0325 723 897 1620 550 1,070
Kaliro 153,543 34,014 0.0135 0.0214 559 591 1150 0 1,150
Kirihura 121,219 51,612 0.0107 0.0325 441 897 1338 700 638
Amolatar 96,189 30,094 0.0085 0.0189 350 523 873 0 873
Amuria 180,022 30,560 0.0158 0.0192 655 531 1186 0 1,186
Mityana 266,108 39,135 0.0234 0.0246 969 680 1649 720 929
Nakaseke 137,278 43,085 0.0121 0.0271 500 749 1248 635 613
Budaka 136,489 35,554 0.0120 0.0224 497 618 1115 0 1,115
Oyam 268,415 27,677 0.0236 0.0174 977 481 1458 0 1,458
Buliisa 633,63 33,085 0.0056 0.0208 231 575 805 0 805
Bukedea 122,433 34,036 0.0108 0.0214 446 591 1037 0 1,037
Isingiro 316,025 51,612 0.0278 0.0325 1,151 897 2047 400 1,647
Lyantonde 66,039 43,264 0.0058 0.0272 240 752 992 616 376
Total 11,370,782 1,588,684 1 1 41,400 27,600 69,000 10,616 58,384