public hospital governance in asia and the pacificpublic hospital governance in the asia pacific...
TRANSCRIPT


Public Hospital Governance in Asia and the PacificDale Huntington and Krishna Hort, Editors
Comparative Country StudiesVolume 1, Number 1 2015

ii
WHO Library Cataloguing-in-Publication Data
Public hospital governance in Asia and the Pacific
(Comparative Country Studies, Vol. 1 No. 1 2015)
1. Hospitals, Public – organization and administration. I. Asia Pacific Observatory on Health Systems and Policies. II. World Health Organization Regional Office for the Western Pacific.
ISBN 978 92 9061 711 2 (NLM Classification: WX 27.1)
© World Health Organization 2015
All rights reserved. Publications of the World Health Organization are available on the WHO website (www.who.int) or can be purchased from WHO Press, World Health Organization, 20 Avenue Appia, 1211 Geneva 27, Switzerland (tel.: +41 22 791 3264; fax: +41 22 791 4857; email: [email protected]).
Requests for permission to reproduce or translate WHO publications–whether for sale or for non-commercial distribution–should be addressed to WHO Press through the WHO web site (www.who.int/about/licensing/copyright_form/en/index.html). For WHO Western Pacific Regional Publications, request for permission to reproduce should be addressed to Publications Office, World Health Organization, Regional Office for the Western Pacific, P.O. Box 2932, 1000, Manila, Philippines (fax: +632 521 1036, email: [email protected]).
The designations employed and the presentation of the material in this publication do not imply the expression of any opinion whatsoever on the part of the World Health Organization concerning the legal status of any country, territory, city or area or of its authorities, or concerning the delimitation of its frontiers or boundaries. Dotted lines on maps represent approximate border lines for which there may not yet be full agreement.
The mention of specific companies or of certain manufacturers’ products does not imply that they are endorsed or recommended by the World Health Organization in preference to others of a similar nature that are not mentioned. Errors and omissions excepted, the names of proprietary products are distinguished by initial capital letters.
All reasonable precautions have been taken by the World Health Organization to verify the information contained in this publication. However, the published material is being distributed without warranty of any kind, either expressed or implied. The responsibility for the interpretation and use of the material lies with the reader. In no event shall the World Health Organization be liable for damages arising from its use.
The named authors alone are responsible for the views expressed in this publication.

1
Contents
Public Hospital Governance in the Asia Pacific Region – Drivers of Change
Dale Huntington ......................................................................................................................2
Case Studies:
A. Public hospital governance in Indonesia
Ni Luh Putu Eka Putri Andayani,Tiara Marthias, Likke Prawidya Putri, Armiatin .....26
B. Public hospital governance in New Zealand
Robin Gauld .....................................................................................................................64
C. Public hospital governance in Viet Nam
Tran Thi Mai Oanh, Khuong Anh Tuan, Hoang Phuong, Nguyen Khanh Phuong, Ong The Due, Krishna Hort ....................................................98
D. Public hospital governance in Thailand
Viroj Tangcharoensathien, Anuwat Supachutikul, Walaiporn Patcharanarumol, Piyawan Limpanyalert, Weerasak Putthasri, Rapeepong Supanchaimat, Supon Limwattananon, Angkana Sommanustweechai, Chanankarn Boonyodsawad ...........................................................................................138
E. Public hospital governance in the Philippines
Oscar F. Picazo ..............................................................................................................186
F. Public hospital governance in India
Antonio Duran, Kamal Gulati, Arunachalam Gunasekar, Shakti Kumar Gupta, Parmeshwar Kumar, Chandrakant Lahariya, Angel Rajan Singh. ................................222
G. Public hospital governance in Sri Lanka
Shanti Dalpatadu, Prasadini Perera, Ruwani Wickramasinghe, Ravindra P. Rannan-Eliya .............................................................................................256
Public Hospital Governance: Emerging Issues and Key Lessons
Krishna Hort and Nicolette Maunganidze ...........................................................................300
Author Biographies ...........................................................................................................321

2
Public Hospital Governance in the Asia Pacific Region – Drivers of ChangeDale Huntington

Public Hospital Governance in the Asia Pacific Region - Drivers of Change
3
Achieving Universal Health Coverage requires the full engagement of all levels and types of care throughout a nation’s health system. Sustaining Universal Health Coverage requires the efficient use of resources as well as an effective resource mobilization strategy to support the provision of preventive and curative health care across different levels of the health system. In all settings, hospitals account for a very significant proportion of total health expenditures. It is not uncommon for OECD countries to report spending on inpatient care as the single biggest cost component, consuming one quarter to one third of total spending (OECD, 2013). It is safe to assume that in the Asian emerging economies, a similar or even larger proportion of total spending on hospitals exists, in part due to the region’s relative insulation from the 2008 financial crisis and consequent slowdown in health spending seen in many European and North American countries (Thomson, 2014). As such, reforms that aim to improve hospital efficiency are at the center of policies that will effect sustainable achievements in Universal Health Coverage. Given this background, it is actually quite remarkable how limited comparative understanding remains of the leading experiences with hospital reforms in countries of the Asia Pacific region.
This is not because there is limited experience with hospital reform in Asia and the Pacific. The reorganization and restructuring of hospital management in the region has been underway for several decades, with different approaches being tried over time, as is shown in this book. Most reforms are taken up in response to common problems such as waste, inefficiency, failure to serve the poor, substandard quality, high costs, brain drain and public dissatisfaction. Public sector hospitals have implemented wide-ranging changes, generally under policy guidance that aims to increase autonomy and regional organization. Private management practices have been introduced in public hospitals, blurring lines between public and private. The growth of privately owned and operated hospitals has also occurred, and governments throughout the region are reacting to gain benefits from a mixed hospital system. Governments have introduced policy changes to adapt to these changes, aiming to manage and influence hospitals with the goal to improve efficiency, quality and patient responsiveness. A generalized focus of the reforms in most countries has been the governance of public hospitals, in particular the degree of autonomy provided to public hospitals.
4
In health policy the terms “public hospital” and “governance” have mixed connotations and vary across settings (Hort and Annear, 2012). There is a consensus that the public/private distinction refers to state/non-state hospital ownership. However, the dichotomy is complicated by real world experiences of mixed state/non-state hospital financing, differences in autonomy, blends of state-employed and non-state employed providers in a single hospital, and for-profit versus not-for-profit financing. “Hospital governance” refers to administrative or proprietary relationships that are external to a hospital’s individual organizational structure (Hort and Annear, 2012; Saltman et al., 2011; Ramesh et al., 2013). Governance may be conceptualized as centralized, decentralized, or network-based; hierarchical, non-hierarchical, or collaborative; and/or government-based or market-based structures (Ramesh et al., 2013).
Ideally, good public hospital governance implies that the internal hospital management follows the performance objectives set by its external ownership (Saltman et al., 2011). In practice there can be mismatches between the owners’ performance objectives and the incentives of hospital managers who have multiple and different types of accountabilities that complicate relations between owners and managers. Hospital governance reform is enacted to amend the governance system to enhance the functionality of those relationships with improved outcomes related to efficiency, quality and patient responsiveness. These reforms are highly setting-specific and are driven by differing contextual factors, structured in a range of ways, and with varied outcomes. Importantly, public hospital governance reform may be in response to, or an integral component of, larger public administrative reforms, such as decentralization or marketization (Jakab et al., 2002).
In the context of public hospital governance, the trend over the past several decades has been away from centralization, that is, command and control by the central ministry (Ramesh et al., 2013). Rather, measures that lessen central authority and increase the management autonomy of individual hospitals, accompanied by marketization forces, have been a pronounced trend in hospital governance reforms worldwide (Jakab et al., 2002). Experiences are diverse, but in general examples fall across this spectrum: (a) autonomization, in which the state may still support the hospital but

Public Hospital Governance in the Asia Pacific Region - Drivers of Change
5
with reduced centralized governance of certain aspects of the hospital’s functioning (e.g. financing); (b) commercialization or corporatization, in which hospital governance becomes market-based and subject to competition with other hospitals; and (c) privatization, in which state governance is replaced by a board of hospital owners/shareholders (Jakab et al., 2002; Ramesh et al., 2013).
I. Overview of public hospital governance reform in the Asia Pacific region
Late 20th century The economic system changes and crises that occurred throughout the Asia Pacific region from the late 1980s to the 1990s were accompanied by widespread public administrative reforms that aimed to maximize the reach and quality of services while minimizing the cost to the state. As a component of these larger multi-sector reforms, many governments looked to streamline or reallocate their centralized governance of hospitals through autonomization, corporatization, or privatization as they faced persistently high health expenditures with limited efficacy and gross inequity in health care accessibility (Jakab et al., 2002). This period of hospital governance reform reflected elements of the “new public management (NPM)” paradigm emerging from OECD countries (notably Australia and New Zealand, which were in the forefront of public administrative reforms described by the NPM terminology). This quickly spread throughout the Asian region as countries learned from the successes and challenges of NPM reforms (Barzelay, 2001;Cheung, 2002; Hood, 1995; Jakab et al., 2002). Two examples are cited of this trend: Hong Kong SAR (China) and Singapore.
Hong Kong SAR (China) was one of the earliest adopters of public hospital governance autonomization. Prior to its major health sector reforms beginning in the 1980s, the state’s governance of the hospital system was confronting multiple challenges, including unsustainable health care expenditures, inflexibility in management, low staff morale, poor responsiveness to patients’ expectations, long waiting lists, and overcrowded conditions (Caulfield and Liu, 2006; Cheung, 2002; Gauld, 1998, 2007; Ramesh, 2012). After a series of comprehensive reviews of its hospital governance structure, a regionalized hospital structure and a
6
more streamlined, centralized administrative body were recommended. Thus, in 1990, the Hong Kong Hospital Authority was established as a statutory body and transitioned governance responsibility from the Medical and Health Department to a more independent entity. The new Hospital Authority structure was comprised of a headquarters with a board, regional offices, and individual hospital management (Cheung, 2002). In essence, the new governance structure attempted to balance increased hospital autonomy with government oversight and financing (Cheung, 2002; Caulfield and Liu, 2006).
Like Hong Kong SAR (China), Singapore was among the first to employ elements of the NPM paradigm in its public hospital governance reforms, but ultimately the country tended towards privatization rather than autonomization (Ramesh, 2008). Aiming to make significant reductions in public expenditures on health care while enhancing service quality, Singapore began its hospital governance reforms through marketization and promoting competition between public hospitals in the late 1980s. To facilitate this process, the government established the Health Corporation of Singapore Private Limited to govern autonomous public hospitals. However, as the new market-based hospital governance structure proved unable to drive down health care costs, in the early 1990s the state became a stronger, more directive presence in regulating hospitals. By the late 1990s, Singapore had created an autonomized governance system that was harmonized with continued state guidance and control. Dissolving the Health Corporation of Singapore, the Government enacted a different privatization approach by dividing the country’s public hospitals into two privatized groups owned by a Ministry of Health holding company. Notably, the enacted reforms received widespread public support as the Government paid close attention to public interests in their development and iterations. Singapore has seen vast improvements in its national health outcomes, and it continues to receive international attention for the achievements of its health system in its ability to provide quality and accessible health care at a low cost (Ramesh, 2008).
While the reforms in Hong Kong SAR (China) and Singapore featured prominently during this NPM period in the health policy and development domain, other countries such as Australia, China, Indonesia, Malaysia

Public Hospital Governance in the Asia Pacific Region - Drivers of Change
7
and New Zealand undertook similar market-based reforms in the face of heightened economic and political pressure (Ramesh and Wu, 2008; Hort and Annear, 2012; Merican and bin Yon, 2002; Paphassarang et al., 2002). For most engaged in public administration reforms in the Asia Pacific region, the initial emergence of the NPM paradigm was only the beginning of an iterative process of adjusting governance functions of public hospitals that continued into the 21st century.
21st century During the first decade of the 21st century, rapid economic and social development in the Asia Pacific region, accompanied by a growing movement towards the attainment of Universal Health Coverage, acted to drive a renewed wave of public hospital governance reform. During this new period of reform, discourse evolved as well, and reforms become less characterized by terminology from the NPM paradigm (which was not so new any longer). Output-based aid, pay for performance, contracting-in and contracting-out and a variety of public-private partnership models became mainstream. Aid effectiveness agreements, initiated in the Paris Declaration, were refined and reaffirmed in subsequent conferences, developing a stronger set of government accountability measures (OECD, 2005).
Against this changing set of public administrative reforms, some countries adjusted and refined prior decentralization reforms that had increased autonomy, and others began their first decentralization reforms that enacted profound changes in local government authority. For other countries, actions taken early had resulted in increased health care expenditures and very limited performance improvement, leading governments to revert to re-centralizing some components of hospital governance. Social health insurance schemes expanded coverage during this period, having significant effects on hospital financing systems and governance in many countries. The global push for Universal Health Coverage developed a political dimension, as the growing middle class in Asian emerging economies brought increased expectations for health care and assertiveness in voicing patient demands.
Hong Kong SAR (China) continued its intensive public hospital governance reform process, introducing changes to the Hospital Authority’s autonomy after the millennium and moving steadily across the decentralization

8
spectrum (Cheung, 2002). In 2000, the central government proposed that all outpatient cases be managed under the Hospital Authority rather than in the private sector where they had previously been located, aiming to create a more collaborative private/public hospital system. The SARS epidemic in 2003 revealed that public and private entities were confused about their roles. After a series of small health system failures and a realized lack of public support, the central government requested another assessment of its health sector in 2005 (Ramesh, 2012). This assessment, conducted by Harvard University, concluded that the public and private health domains should be more integrated and competitive rather than aiming to achieve predominance over the other (Ramesh, 2012). In 2010, the central government turned to increased support of private hospitals, as its previous reform measures had been unsuccessful in terms of ensuring economic sustainability, efficiency, and improving performance outcomes (Ramesh, 2012).
During this period a new set of countries embarked upon reforms, joining Hong Kong SAR (China), Singapore and others that had begun earlier. For example, beginning in 2000, the Kingdom of Cambodia piloted a new decentralization reform strategy to improve efficiency and expand access to services (Khim and Annear, 2013). The Ministry of Health contracted nongovernmental organizations to work within the government system to manage a region’s public hospitals as a more neutral entity. In 2009, as part of the 2008–2015 Strategic Plan to further decentralize public administrative governance (including public hospital governance), the Government refined its earlier approach by establishing Separate Operating Agencies with semi-autonomous status in each previously contracted region.
By the end of the first decade of the 21st century, most countries in the Asia Pacific region had gained experience with reforms broadly related to public administration, including new modes of financing and systems of accountability across government and within the health sector: changes in public hospital governance have been a prominent element of these changes. However, as suggested earlier, there has been a gap between the experience of policy development and implementation and the evidence base on the nature of these reforms and their impact on efficiency, quality and patient responsiveness.

Public Hospital Governance in the Asia Pacific Region - Drivers of Change
9
The Asia Pacific Observatory on Health Systems and Policies StudyAgainst this background, the Asia Pacific Observatory on Health Systems and Policies (APO) launched an initiative in 2013 to undertake an in-depth analysis of public hospital governance. A two-stage project was initiated with the following objectives:
1. to describe the policy context, recent policy developments and reforms in regard to public hospital governance and performance;
2. to describe and assess publicly-owned hospital governance and performance in selected countries; and
3. to contribute to comparative analyses across different country settings on public hospital governance and performance (stage 2).
This volume reports on the first stage of the project, presenting results from a series of country case studies produced by national authors from seven countries in the region. Each country case study was based upon the conceptual framework (Figure 1), developed by an APO Public Hospital Study Group1.
1 The following are members of the public hospital governance study working group who developed the conceptual framework: Gerald La Forgia, Krishna Hort, Dale Huntington, Sjoerd Postma, Ravi Rannan-Eliya and Viroj Tangcharoensathien

10
Figure 1: Conceptual Framework of Public Hospital Governance
Hospital Governance Features
Different PoliciesPublic, Institutional Management, Health System Hospital specific
Management Capacities• Professionalized management• Use of information• Reward and sanction of staff based on performance• Listens and responds to patients voice• Continuous Quality Improvement• Performance tracking and correcting actions• Leadership• Conflict resolution between patients and professionals
Key Decision Rights / Structures• Decision making structure• Degree of autonomy in decision making power and authority over managing resources (human,financial, service delivery)
Key Accountabilities / Incentives• Representation and participation of stakeholders in governing body• Responsiveness and transparency• Behavioral motivations of hospitals or individuals
Technical Capabilities• Availability and competency (knowledge, skills) of staff (medical, nursing, clinical support and administrative)• Professional ethos / ethical conduct and work ethics• Infrastructure: availability, quality and functioning• Medical equipment: availability, quality and functioning
Relative Hospital Performance• Efficiency• Equity• Quality of care• Effective coverage• Responsiveness• Integration with different level of care• Contribution to health system goals
Cross-cutting External Environmental Factors: Socioeconomic environment; Political system and historical legacy; Level of decentralization of health systems; Level and type of competitions; Budget, financing / payments and purchasing incentive structures (e.g. P4P); Quality requirements of different purchasing agencies; Benchmarking; Patient rights; Rule of Law
P4P: Pay for performance Source: Asia Pacific Observatory on Health Systems and Policies
This framework is an adaption of elements from other publications and grey literature (Harding and Preker, 2003; Jakab et al., 2002; La Forgia et al, 2013; Saltman et al., 2011) and recognizes that hospital governance features are a product of, and an adaptation to, different policies that may be public administration reforms, institutional management reforms, health sector-specific (as opposed to government wide) or hospital-specific (that is, affecting a single hospital or category of hospitals).

Public Hospital Governance in the Asia Pacific Region - Drivers of Change
11
The process of hospital governance on an institutional level operates through two broad sets of features: decision rights and structures, and accountabilities and incentives. Decisions are made within a space of varying degrees of freedom depending upon the subject matter or local context (Bossert, 1998; Bossert and Beauvais, 2002). A public hospital may have a large degree of autonomy with financing (such as raising and retaining revenue) but limited autonomy with personnel or procurement practices. Different sets of accountabilities and incentives interact with the varying levels and types of decision rights, causing multiple and changing patterns of stakeholder participation in a governing body, less or more transparency, and effects on individual motivation and institutional culture. For example, in settings where a public hospital has strong autonomy with human resources, the governance feature would likely include accountability measures to oversee staffing decisions as well as incentives to influence them.
The outcome of the mix of hospital governance features will be mediated by the hospital’s management and technical capacity. The APO framework cites a number of management capacities that are considered critical to a hospital’s operations, including: the use of information; effective personnel policies in practice (rewards and sanctions); a system for collecting patient feedback and resolving conflicts between patients and professionals; continuous quality improvement including performance tracking and measures for taking corrective action, and leadership qualities coupled with a professionalized cadre of hospital managers. Along with management capacity, a hospital’s technical level will affect the implementation of governance decisions. Key technical issues described in the APO conceptual framework include: the skill mix and competencies of all staff – physicians, nursing, clinical support as well as administrative; the degree of professional ethos and work ethic exhibited by staff; and basic infrastructure features and medical equipment – availability, quality and functional status.
The goals of hospital reform are generally grouped around three performance measures: efficiency, quality and responsiveness (Saltman, 2011). The APO conceptual framework unpacks these dimensions by adding performance indicators of equity, effective coverage, integration of

12
the hospital within the overall health delivery systems (levels of care), and the contribution to national health goals.
Each element of the conceptual framework is profoundly influenced by a host of external factors: socioeconomic environment; the country’s political system and historical legacy; decentralization and devolution of government and the health sector; level and type of competition between hospitals both within the public and across to the private sector; financing systems, including payment and purchasing requirements; benchmarking; patient rights and the rule of law. These external factors profoundly influence public hospital governance features, acting to shape incentives and accountabilities that operate at an institutional level and system wide.
The application of the APO conceptual framework conceptual model to a real world setting is best characterized by an understanding of complex adaptive system theory (Plsek, 2001) in which adjustments are continuously in progress both within each domain, in the interactions between them and with the external environment.
Based upon this conceptual framework, a common set of research questions were developed to guide the country case studies’ investigations.
1. What and how are policies affecting governance of publicly-owned hospitals and what recent reforms have been undertaken?
2. What and how do different internal factors, including organizational capacities (technical and managerial), contribute to quality and efficiency?
3. What and how do external factors interact with hospital governance and operations?
4. How is hospital performance measured (internally and relative to other hospitals) and how is this information used by policy-makers, hospital managers and the public?

Public Hospital Governance in the Asia Pacific Region - Drivers of Change
13
MethodologyThe following countries produced case studies included in this volume: India, Indonesia, New Zealand, Philippines, Sri Lanka, Thailand, and Viet Nam.
The country teams were given a great deal of flexibility in the use of the conceptual framework and research questions (detailed descriptions of data sources and an annotated outline of the case study report were also provided to each country team) in order to best adapt the country’s case study protocol to the local setting. Case study authors were encouraged to be entrepreneurial in focusing in on a set of topics/issues for which there was robust evidence, while indicating gaps in evidence, helping to identify areas for future research.
For each site, the teams were asked to focus on the type of public hospitals that account for the bulk of budgets and patient load. These could be public hospitals that are experiencing health policy change directed towards their governance or operations, or which are adapting to other changes in their environment that are not necessarily coming from within the health sector. Case study authors determined the unit of analysis for the in-depth analytic work. For example, single hospitals or small groups of hospitals might be focused upon for more detailed analysis of exceptional or leading-edge reforms, while larger public hospital system-wide characteristics may be analyzed to describe broader trends in public hospital governance.
Thus a considerable degree of latitude in grounding the study’s conceptual framework, research questions and selection of hospitals for investigation within each of the selected countries was granted as a means to capturing the range of diversity within the region. Also, by allowing each country to bear down on a particular set of issues, the resulting case study would be more relevant to national policy discourse on public hospital governance.
Summary of the seven case studies The case studies from Indonesia, New Zealand and Viet Nam report on changes in public hospital governance that have been introduced in response to government wide policies related to public administration
14
reforms. Each of these case studies is fairly representative of nationwide experiences, and each show a diversity of implementation experiences with the reform.
The Government of Indonesia introduced a Ministerial Decree of Financial Management (termed by the Bahasa acronym BLU and BLUD) that effectively was a government wide, public administrative reform policy. In the health sector, BLUD has had a large effect on the governance and operations of hospitals. The reform grants all public hospitals greater flexibility in operational management and allows them to apply not-for-profit business principles to gain efficiencies and improve performance. The study reported on in this volume of papers was conducted in five BLUD district hospitals owned by district/municipal governments: Meuraxa Hospital (MH) in Banda Aceh City; Tidar Hospital (TH) in Magelang City, Central Java; Kota Yogyakarta Hospital (KYH), Panembahan Senopati Hospital (PSH), and Sleman Hospital (SH) in Yogyakarta Province. Since these hospitals are now governed under BLUD, they work under a five-year business planning model and use their operational revenue to fund all operating costs, with benefits noted. For example, PSH used its income retention to build new wings, expanding its capacity.
These BLUD hospitals also have a full authority to contract more staff to meet Class B hospital requirements, retain retired specialists or build cooperation with medical faculty from university hospitals to fill capacity gaps. Therefore, hospitals are expanding their capacity and range of services, improving efficiencies and responsiveness to patients through BLUD. The hospitals were found to apply a Minimum Service Standard, which included clinical, managerial, and customer satisfaction indicators, with some evidence of improved quality noted. The majority of the BLUD hospitals are governed by Supervisory Boards which act as owner (local government) representatives; these boards appear to have improved the hospitals’ accountability.
New Zealand has a long history of a devolved health system with multiple evolutionary stages that occurred, in part, as elections changed the executive branch of government. The health system is currently managed through 20 District Health Boards (DHBs), each with responsibility for planning and funding services for their populations. In the country, hospitals are public institutions while primary care services are almost exclusively in the private

Public Hospital Governance in the Asia Pacific Region - Drivers of Change
15
sector. Five DHBs representing different regions were chosen for the in-depth analysis described in the paper in this volume. The devolution of governance, albeit with strong central government oversight, means there is considerable variation and flexibility in local arrangements.
A recent focus on building “whole of system” service delivery approaches means the lines between hospital and community care governance are becoming increasingly blurred. The objective of the stronger emphasis on integration with primary care and community providers is to not only reduce pressure on hospitals, but also to proactively plan for the demographic transition and rising burden of chronic diseases. The study of five districts reveals that the recent emphasis on performance improvement has led to concrete activities promoting quality and process improvement at the DHB level. However, the decentralization of hospital governance has also posed several challenges, including with coordination and cooperation. Due to the complexity of New Zealand’s health system, performance measurement is also proving complicated.
Viet Nam began a government wide movement from a central subsidy system to a market economic system in 1989; policy changes introduced as part of that broad public administration reform movement also effected the health sector. The first change was the 1989 Law on Health Care for People which allowed Vietnamese people to seek health care services at any public health care facility without a referral document. Prior to this law, patients were entitled to all health care services free of charge, but they were not allowed to bypass to upper-level hospitals without referral documents. During the early years of the socioeconomic reforms, Viet Nam had difficulty ensuring a government budget for all activities of the health sector. Therefore, in 1994, the Government allowed public hospitals to collect fees for services to increase hospital revenue; correspondingly, it started to reduce the state budget for public hospitals. In 1995, the Government launched Resolution 90-CP that targeted the health and education sectors, which allowed public institutions to obtain funding from other sectors and non-state sectors. This policy was subsequently strengthened by other decrees.
In 2004, new policies allowed hospitals to gain autonomy in financial management. Two years later, an even stronger measure of autonomy was

16
authorized that granted all public hospitals autonomy in both financing and recruitment of staff, as well as other management and operational matters. These new policies have enabled public hospitals to achieve three levels of autonomy: 1) self-financing institutions (those able to finance their entire operating costs); 2) partially self-financing institutions; and 3) institutions fully subsidized by the state budget (revenue covering less than 10% of total expenditure). Currently all public hospitals utilize three main types of payment methods: (i) fee-for-services; (ii) capitation (applied only in district hospitals for both inpatients and outpatients); and (iii) health insurance payment based on actual expenditure.
Significant problems identified in the current system in Viet Nam include bypassing of lower level hospitals and overloading of central and provincial level hospitals, increasing total health expenditure, and persistently high levels of out-of-pocket expenditure. The case study reveals that health insurance payments and user fees are the dominant source of finance for public hospitals, and that central and provincial hospitals are better able to increase their revenues. As a result, district hospitals face lower levels of funding and have difficulty attracting staff, contributing to poor quality of services and bypassing. Despite nominally significant autonomy, hospitals need approval from local or central government bureaucracy for most human resource and investment decisions. On the whole, changes in autonomy, finance and accountability pursuant to reform have provided more autonomy for public hospitals in management of finance and investments in clinical services, but accountability, particularly for clinical quality and patient safety, is weak. Corresponding changes in the governance structure of hospitals has not kept pace with the financial reforms. In effect, the centralized command and control governance system has not been replaced with localized or institutional governance bodies.
The case study from Thailand reports on nationwide changes in public hospital governance which were associated more with health sector-specific policy than with government wide reforms. Hospitals in Thailand are dominated by the public sector: approximately 75% and 79% of all hospitals and hospital beds, respectively, are publicly provided. Although there have been ups and downs in the proportion of privately-owned and operated hospitals in Thailand, overall the proportion of public
Public Hospital Governance in the Asia Pacific Region - Drivers of Change
17
sector hospitals and beds has been relatively stable. The largest proportion of public hospitals falls under the Ministry of Public Health (MOPH), which has achieved full geographical coverage to all districts and provinces. District hospitals (comprising 75% of all public hospitals) are easily accessed by the rural population, who are covered by government health subsidies in favour of the poor. The case study in this volume reports on adaptive responses by public hospital governance to three important shifts within the Thai health sector: (i) the Universal Coverage Scheme (UCS) introduced in 2002, (ii) health care facility accreditation introduced in 2003, and (iii) an emerging context of medico-legal regulatory authority (malpractice lawsuits).
The UCS scheme introduction in 2002 benefited from the pre-existing strong hospital governance capacities. Although UCS was not intended to explicitly contribute to the improvement in these capacities, hospitals did adapt to this important change within the sector. The nature of purchaser-provider split defined a clear accountability framework across three key actors: the National Health Security Office (NHSO), public hospitals and the UCS members. As a result, hospital governance has become more responsive to UCS members compared to the previous integrated model in which MOPH owned and financed hospitals through supply-side financing (annual budget allocation). The UCS annual budget is based on estimated outpatient and inpatient utilization rates and unit costs of services, multiplied by the number of beneficiaries.
Closed-end payment mechanisms such as capitation and diagnostic-related groups have improved technical efficiency in public hospitals. Such payment schemes incentivize efficiency through, for example, the use of quality generic medicines, provincial bulk purchasing, active screening and prevention of chronic noncommunicable diseases (NCDs), offering health promotion to keep the registered population healthy. The Healthcare Accreditation Institute, which has no contractual relationship with hospitals, is aligned with the NHSO’s financial incentives to boost quality assurance and accelerate accreditation. As in New Zealand, the Thailand case study reports on the system integration of hospitals with lower-level health facilities. In Thailand the lines between levels of care are blurred as the result of a financing mechanism: the NHSO allocation of outpatient capitation budget for all UCS members in a given district has contributed to significant improvements in district health systems governance.

18
The Philippine case study discusses how a few hospitals have innovated to take advantage of national policy aiming to corporatize public hospitals. These hospitals are more of the exception than the rule in the country, as the highly devolved system of government, including the health sector, poses difficulties for the implementation of national reform. Under devolution, local government units are entitled to a set level of internal revenue allotment that is based on selected socioeconomic indicators which local government officials are then free to allocate across various social services including health. The Department of Health has retained its roles of stewardship, policy-making, and regulation as well as the ownership and management of 72 regional and upper-level hospitals (out of a total of 1700–1800 public hospitals in the country). The immediate effects of devolution were the rupturing of the referral system and the fragmentation of the financing of health services as the administrative, operational, and financial burden of devolved health facilities and programmes was turned over to local government while upper-level hospitals remained under Department of Health.
Thus, the previously integrated public health and upper-level hospital services were delinked, weakening the referral system that had been built over the years under a centralized system. In many local government units, the budget required by the devolved functions far exceeded the devolved fiscal resources available. The lack of inter-jurisdictional payment system for referrals, the mobility of patients, and frequent bypassing of primary care and district hospitals has led to the further fraying of the financing and delivery system. This has manifested in overcrowded provincial and Department of Health hospitals, and under-utilized health centres and district hospitals. The Department of Health has enacted a series of reforms in response to these (and other) stress points, including both supply- and demand-side interventions and a massive increase in the national health budget.
Against this background the Philippines case study examines how the Department of Health moved away from its centralized authority and toward a policy of corporatized hospital governance. The experiences of four tertiary referral hospitals are examined in the case study. In one case, the reforms were far-reaching and accompanied by executive order and

Public Hospital Governance in the Asia Pacific Region - Drivers of Change
19
congressional mandates, turning one hospital into a non-stock, non-profit local government-owned corporation with its governance controlled by a board of trustees. The changes in accountability and decision-making pertained to a wide range of functions, including hiring and firing of staff; procurement of civil works, equipment, goods and services; fee-setting and retention; generation/mobilization and use of internally-generated funds, and contracting arrangements.
In another site, the study found two complementary sets of a hospital reform programme: (i) provincial hospital reforms in the form of financing and supply-side reforms; and (ii) reforms in the PhilHealth social health insurance programme to provide premium subsidies to the poor and to quicken the eligibility verification system so that members can access services quickly and thereby increase and expedite reimbursement payments to the provincial hospitals. These reforms are deemed innovative in the Philippine context because they focused not on infrastructure (the usual starting point of many hospital upgrading programmes in the country) but on building a self-sustaining system of health financing that will make it possible for capital and human resource improvements to be made to public hospitals without entailing direct fiscal infusion from the provincial treasury, which most LGUs cannot afford.
The last two case studies in the volume, from India and Sri Lanka, report on a different type of experience in the governance of public hospitals. Both cases are somewhat unique for the region, and both are notable.
The case study from India draws upon the experience of the All India Institute of Medicine Sciences (AIIMS) hospital. AIIMS was established in 1956 by an Act of Parliament, completely autonomous from the Ministry of Health and Welfare in all aspects of its governance and operations, including financing with direct budget allocation coming to AIIMS from the Ministry of Finance. Very quickly AIIMS established itself as the country’s premier public sector medical institution, a centre of excellence that set standards in teaching and research and provided top-quality specialized health care. However, over the years AIIMS gradually shifted from a “referral” to a “referral and general” role. Having started as a single centralized institute, AIIMS has branched out with emergence of a number

20
of super-specialty, secondary and even primary care centres within the Institute’s framework.
AIIMS today is the largest public sector, tertiary-level teaching hospital in India, and has dual patient care roles as a specialized referral hospital and as a large general hospital. It has grown from nearly 750 beds in the 1970s to 2328 beds in 2013. The bed occupancy rate has been brought down in the same period from around 95% in the early 1970s to about 80% in 2013; the average length of stay during the same period has also been reduced from 17.9 days to 5.5 days. Outpatient department attendance has risen from around half a million annually in the early 1970s to 1.2 million in the late 1990s, and further to 2.75 million in 2012–13. Nearly 55% of the outpatients come from outside Delhi, reflecting their trust in the quality care provided by the Institute at subsidized rates; the cost to the inpatient being less than a US dollar per day with treatment for those “below poverty line” being provided free.
In this context, the governance of AIIMS has evolved since its founding and sometimes in unexpected ways. Originally AIIMS was given the mandate to develop itself, enabled by its autonomy, and to provide clinical and academic leadership. In order to become efficient, however, it often had to leverage its unique placement within the health system and many changes appeared as much as a matter of need as design. The level of its autonomy has changed over time: AIIMS was originally accountable to Parliament only, but recently it relinquished some independence on its governing board and now has closer control exercised by the Ministry of Health and Welfare. Over time, the accountability mechanisms have also become broader and more complex and other mechanisms such as a people’s charter and the right to information have been introduced. At the time of writing, the Government of India announced the creation of 8–10 new AIIMS throughout the country, increasing the significance of this model of hospital governance but ending the uniqueness of its condition.
The case study from Sri Lanka describes a fairly constant set of policies and operations for the country’s hospital sector, with little evidence of major reforms being implemented either as a consequence of government policy shifts or sectoral initiatives. The central Ministry of Health in Sri Lanka

Public Hospital Governance in the Asia Pacific Region - Drivers of Change
21
has a predominant role in the governance of public hospitals, although administratively the majority were decentralized to the provinces in 1987. Unlike in other decentralized settings, there remains a highly centralized health sector within Sri Lanka governing public hospitals, including the following elements: financing system (based on historical budgets); procurement of essential drugs and medical supplies; and the recruitment, assignment, and promotion of medical officers and medical administrators.
There have not been any major changes to hospital governance since the decentralization of power to the provinces in 1987. However, several notable public hospital operational reforms have improved the quality of care. For example, the upgrading and re-categorization of hospitals, the establishment of quality improvement programmes, and the establishment of a postgraduate qualification in medical administration are all centrally-driven initiatives which were implemented with little change in governance at the individual hospital level. Hospital directors have limited autonomy in terms of the strategic and financial direction of their hospital although they have sole authority to carry out day-to-day operational management with the resources provided. The performance of public hospitals has shown improvement over the years as seen through a number of efficiency and quality indicators. In Sri Lanka, stewardship and a centrally-dominated governance processes appear to have made a substantial contribution to the observed level of hospital performance, while the operations-level contributors are harder to identify.
A key policy decision taken in Sri Lanka was to ensure that higher-level medical administrators (including hospital directors in secondary and tertiary level hospitals) who are already qualified medical officers should also have an MSc or MD in medical administration or community medicine. Given their limited autonomy, the main function of hospital directors is operational day-to-day management within the resources allocated to them (e.g. budget, staff, medical supplies and drugs, budget for local purchasing of drugs). Supervision of hospital directors is conducted by their respective central or provincial ministries of health, and the bimonthly hospital management committee meetings among all hospital directors of secondary and tertiary hospitals provide a forum to share experiences.

22
ConclusionThe experiences in governing public hospitals that are described in this volume of papers clearly show that hospitals in the Asia Pacific region are undergoing profound changes in their governance and operations. In part, this is due to the rapid economic growth in the region that has brought with it increased aspirations for better health care. The early development of public administration reforms in Asia and the Pacific is another important influence on the willingness of governments to try new and different ways to manage the increased opportunities that economic growth brings, and the better governance and accountability that a middle class expects. These forces have played out within the arena of public hospitals, as the seven country case studies show responses have been highly adaptive and vary across settings. The importance of effective governance bodies and authority is revealed, as the different dimensions of the conceptual framework were effective in revealing important aspects of hospital performance across diverse settings.
Although the case studies suggest a direction of change, for example increased autonomy coupled with early stages of localized governance, the overall integration of public hospitals into their respective health care systems remains a challenge in the settings of these case studies. Given the demographic trend towards a rapidly ageing population and the growth in NCD burden, public hospitals will need to continue their adaptive responses and develop new forms of integration.
A close reading of the case studies will leave the reader with a good understanding of the extremely dynamic and resilient nature of public hospital governance – as well as a respect for the complexities that a governing body responds to. The case studies are also indicative of the large scale and rapid pace of change in the middle-income countries of Asia, driving public hospital reform at a speed unlike other regions. More studies of public hospital governance are needed to assist in understanding the direction and consequences of this change, and robust comparative analyses are called for to guide national policy decisions towards attainment of sustainable Universal Health Coverage.

Public Hospital Governance in the Asia Pacific Region - Drivers of Change
23
AcknowledgementsThe author acknowledges the research support provided by Laura Dellplain, and input provided by Antonio Duran, Robin Gauld, Krishna Hort, Xu Ke, Vivian Lin and Sjoerd Postma to earlier drafts of the paper.
ReferencesBarzelay M (2001). The New Public Management: improving research and policy dialogue. University of California Press, Project MUSE (http://muse.jhu.edu/, accessed July 3, 2014).
Bossert T (1998). Analyzing the decentralization of health systems in developing countries: decision space, innovation and performance. Social Science and Medicine.47(10):1513-1527.
Bossert T, Beauvais J (2002). Decentralization of health systems in Ghana, Zambia, Uganda and the Philippines: a comparative analysis of decision space. Health Policy and Planning. 17(1):14–31.
Caulfield J, Liu A (2006). Shifting concepts of autonomy in the Hong Kong hospital authority. Public Organization Review. 6(3), 203-219.
Cheung AB (2002). Modernizing public healthcare governance in Hong Kong: A case study of professional power in the new public management.Public Management Review. 4(3), 343-365.
Gauld R (1998). A survey of the Hong Kong health sector: past, present and future. Social Science and Medicine. Vol. 47:7; 927-939.
Gauld R (2007). Which way forward? An analysis of Hong Kong’s health system reforms. The Asia Pacific Journal of Public Administration. Vol. 29:2 (December); 173-190.
Harding A, Preker AS (2003). A conceptual framework for the organizational reforms of hospitals. Innovations in Health Service Delivery. Washington, DC: World Bank, 23-78.

24
Hood C (1995). The “new public management” in the 1980s: variations on a theme. Accounting, Organizations and Society. Vol. 20, Issues 2-3, February-April; 93-109.
Hort K, Annear PL (2012). The growth of non-state hospitals in Indonesia and Viet Nam: Market reforms and mixed commercialised health systems.Melbourne University: Nossal Institute of Global Health, Australia.
Jakab M, Preker A, Harding A, Hawkins L (June 2002). The introduction of market forces in the public hospital sector: From the new public sector management to organizational reform. World Bank: Health, Nutrition and Population.
Khim K, Annear PL (2013). Strengthening district health service management and delivery through internal contracting: Lessons from pilot projects in Cambodia. Social Science & Medicine. 1982. 96:241-249. doi:10.1016/j.socscimed.2013.02.029; 10.1016/j.socscimed.2013.02.029.
La Forgia J, Harding A, Hawkins L, de Roodenbeke E (February 2013). A framework for developing and analyzing public hospital reforms in developing countries that involve autonomy. Working draft [unpublished].
Merican MI, bin Yon R (2002). Health care reform and changes: The Malaysian experience. Asia-Pacific Journal of Public Health/Asia-Pacific Academic Consortium for Public Health. 14(1), 17-22.
OECD (2005). Paris declaration on aid effectiveness (http://www.oecd.org/dac/effectiveness/parisdeclarationandaccraagendaforaction.htm, accessed 1 August 2014).
OECD (2013). Health at a Glance 2013 (http://www.oecd.org/els/health-systems/Health-at-a-Glance-2013.pdf, accessed 22 August 2014).
Paphassarang C, Philavong K, Boupha B, Blas E (2002). Equity, privatization and cost recovery in urban health care: the case of Lao PDR. Health Policy and Planning. 17 Suppl. 72-84.

Public Hospital Governance in the Asia Pacific Region - Drivers of Change
25
Plsek P (2001). Redesigning Health Care with Insights from the Science of Complex Adaptive Systems. In: National Academy of Sciences, Committee on Healthcare in America, Institutes of Medicine. Crossing the quality chasm: a new health system for the 21st century. Washington, DC (http://www.nap.edu/catalog/10027.html, accessed19 June 2014).
Ramesh M (2008). Autonomy and control in public hospital reforms in Singapore. The American Review of Public Administration. 38(1):62-79.
Ramesh M (2012). Health care reform in Hong Kong: the politics of liberal non-democracy. The Pacific Review. 25(4):455-471.
Ramesh M, Wu X (2008). Realigning public and private health care in Southeast Asia. The Pacific Review. 21(2):171-187.
Ramesh M, Xun W, Howlett M (2013). Second best governance? Governments and governance in the imperfect world of health care delivery in China, India and Thailand. (http://www.icpublicpolicy.org/IMG/pdf/panel_11_s3_ramesh.pdf, accessed August 25, 2014).
Saltman RB, Durán A, Dubois HFW, editors (2011).Governing public hospitals. Governing public hospitals: reform strategies and the movement towards institutional autonomy. Copenhagen: WHO European Observatory on Health Systems and Policies: 201-16.
Thomson S, Figueras J, Evetovits T, et.al. (2014) Economic crisis, health systems and health in Europe: impact and implications for policy. Maidenhead: Open University Press.

26
Case Studies:A. Public hospital governance in IndonesiaA case study on public hospitals designated as “Local Public Service Agencies”Ni Luh Putu Eka Putri Andayani,Tiara Marthias, Likke Prawidya Putri, Armiatin

Public hospital governance in Indonesia
27
AbstractSince 2009, all public hospitals in Indonesia have been managed according to the 2007 Ministerial Decree on Financial Management Pattern of Public Service Agencies (Badan Layanan Umum Daerah, BLUD). The reform grants all public hospitals greater flexibilities in operational management and allows them to apply not-for-profit-business principles, e.g. hospitals may use their operating revenue directly to buy medical supplies, involving far less bureaucratic processes, thus increasing efficiency. This case study describes and assesses these important policy developments and practice in public hospital governance and performance in Indonesia after these reforms.
The study was conducted in five BLUD district hospitals owned by district/municipal governments in Indonesia: Panembahan Senopati Hospital (PSH), Kota Yogyakarta Hospital (KYH) and Sleman Hospital (SH) in the Special Region of Yogyakarta; Tidar Hospital (TH) in central Java; and Meuraxa Hospital (MH) in Banda Aceh. Data were collected from interviews with hospital managers and some external key stakeholders, such as the Head of the Organization and Governance Bureau, Financial and Asset Management Officer, District Secretary, and Head of the Local Staffing Agency, as well as from a review of documents.
The five hospitals involved in the study were designated as BLUD and therefore permitted to develop their five-year business plans. These hospitals use their operational revenue to directly fund their operating costs. For example, PSH used its previous years’ savings to develop new buildings. They also have full authority to contract more staff to meet B-class hospital requirements2 (PSH, KYH and TH), contract retired specialists (MH), or build cooperation with other medical faculties (SH) to suit their needs. This means that hospitals can expand their services and
2 According to Health Ministry Regulation No. 340/2010, B-class hospitals have higher competencies than C-class hospitals, including: the presence of a full-time Medical Rehabilitation Specialist; 1–12 kinds of specialist medical services other than the core types (paediatric, internal medicine, general surgeon and obstetrics-gynecology); 1– 4 kinds of subspecialist medical services; more than nine general practitioners; more than two dentists.

28
capabilities, improve revenue allocation to increase staffing levels, and upgrade medical equipment. They also apply a Minimum Service Standard that includes clinical, managerial and customer satisfaction indicators to improve quality control and management. The presence of an internal auditor (in PSH, KYH and SH) and an external auditor from the central Government appears to have improved the hospitals’ accountability. All hospitals except MH have Supervisory Boards which act as owner (local government) representatives.
Overall, these public hospitals have shown improvement in capacity as well as accountability following the implementation of BLUD, which has enabled them to meet patient needs better. Nonetheless, there are still challenges for public hospitals to deal with concerning subsidies and politics. In every election (local or national level), health care always becomes a “sexy” political commodity to win votes. Politicians promise to make health services free for the poor, but after election, most political leaders are unwilling to allocate enough budget to subsidise public health care facilities.

Public hospital governance in Indonesia
29
Acronyms and abbreviationsAPBD Local Revenue and Expenditure Budget
APBN National Revenue and Expenditure Budget
Bansos Social Assistance Fund
BLU Public Service Agency owned by central government (Badan Layanan Umum)
BLUD Public Service Agency owned by local government (Badan Layanan Umum Daerah)
PPK-BLUD Financial Management Pattern of Local Public Service Agency
BOS board of supervisors
BPKRI Supreme Audit Agency, Republic of Indonesia
BPS Statistics Indonesia
BPJS Social Insurance Fund Organizing Body
BUK Directorate General of Health Services, MOH
DAU General Allocation Fund
DAK Special Allocation Fund
GDR gross death rate
Jamkesmas National social insurance scheme
Jampersal Social insurance specifically for maternal care
JKN National Health Insurance (Universal Health Coverage Scheme)
KARS National Hospital Accreditation Committee
KYH Kota Yogyakarta City Hospital
LAKIP Government Performance Accountability Report
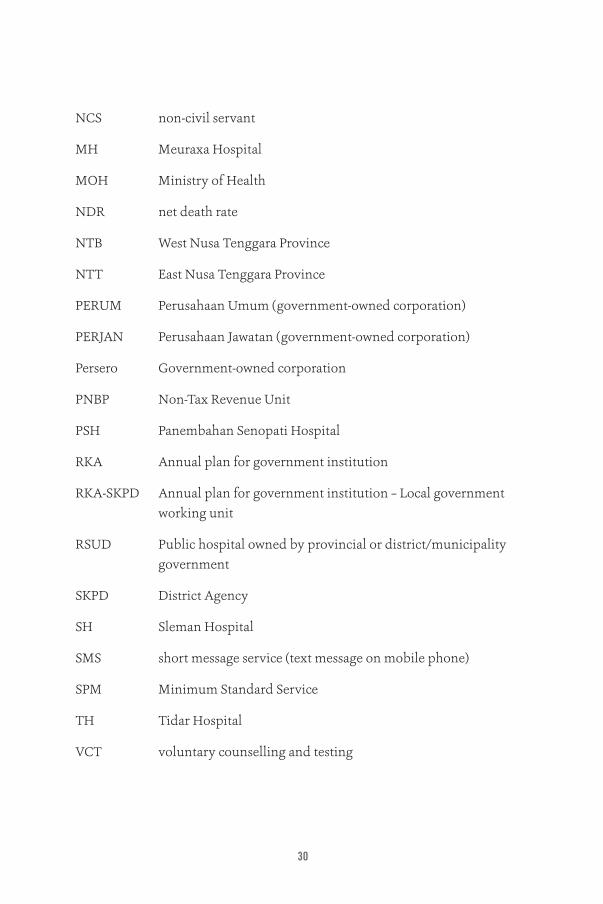
30
NCS non-civil servant
MH Meuraxa Hospital
MOH Ministry of Health
NDR net death rate
NTB West Nusa Tenggara Province
NTT East Nusa Tenggara Province
PERUM Perusahaan Umum (government-owned corporation)
PERJAN Perusahaan Jawatan (government-owned corporation)
Persero Government-owned corporation
PNBP Non-Tax Revenue Unit
PSH Panembahan Senopati Hospital
RKA Annual plan for government institution
RKA-SKPD Annual plan for government institution – Local government working unit
RSUD Public hospital owned by provincial or district/municipality government
SKPD District Agency
SH Sleman Hospital
SMS short message service (text message on mobile phone)
SPM Minimum Standard Service
TH Tidar Hospital
VCT voluntary counselling and testing
Public hospital governance in Indonesia
31
1. IntroductionSince 2007, Indonesia has been implementing a Government wide reform known as the Ministerial Decree on Pola Pengelolaan Keuangan – Badan Layanan Umum Daerah (PPK-BLUD) or Financial Management Pattern of Public Service Agencies. This initiative introduced public hospital governance reforms, the main principle of which was to grant all public service institutions (including hospitals) a wider autonomy in financial and operational management. In effect the reform transforms public hospitals from bureaucratic institutions into corporate-like organizations to improve their ability to respond to patients’ needs.
Previous literature suggests that the benefits of affording some hospitals wider autonomy include the clearer responsibilities of managers, ability to build effective management systems, increased awareness of hospital quality, wider community participation due to routine consumer satisfaction surveys, and better accountability (Praxis, 2007; Roubal & Hrobon, 2013; Docteur & Oxley, 2003). However, little is known of the contrasting experiences between hospitals and the attributing factors to such variation.
Out of the 548 public hospitals owned by the provincial and district governments of Indonesia, less than half have enacted the new reforms to date. The remainder have not yet started implementation. Some hindrances perceived by hospital managers and staff in implementing the new regulations are: a lack of staff capacity, apprehension about the organizational transformation and a lack of supporting regulation from the local governments (provincial and district).
Therefore, it is important to explore the benefits and disadvantages of the hospital reforms in order to encourage and support other hospitals to start implementing the initiative. It is also critical to derive lessons learned from earlier implementations as well as to assess recent policy developments on hospital reform to provide technical guidance and recommendations for hospitals about to make a start or continue towards implementation.

32
This study focuses on Yogyakarta, central Java and Aceh Province and involves five autonomous public (Government owned) hospitals. It included five hospitals in three provinces: Panembahan Senopati Hospital (PSH), Kota Yogyakarta Hospital (KYH) and Sleman Hospital (SH) in the Special Region of Yogyakarta; Tidar Hospital (TH) in Central Java; and Meuraxa Hospital (MH) in Banda Aceh, Aceh Province. All of the hospitals have implemented the new reforms for at least two years. MH in Banda Aceh was chosen to provide an example from outside of the island of Java.
Table 1: Hospitals involved in the case study
Hospital City or district Province Class
Sleman Sleman District Yogyakarta B, non-teaching
Kota Yogyakarta Yogyakarta City Yogyakarta B, non-teaching
Panembahan Senopati Bantul District Yogyakarta B, teaching*
Tidar Magelang City Central Java B, non-teaching
Meuraxa Banda Aceh City Aceh B, non-teaching
* The hospital is in the network of Sardjito Hospital (the main teaching hospital affiliated with the Medical Faculty of Gadjah Mada University in Yogyakarta)
Data in this study derived from primary and secondary sources and were collected during last half of 2013. Primary data consisted of in-depth interviews with the Directors/Chief Executive Officers (CEOs), Medical Directors and Finance Directors of the hospitals and/or relevant middle managers, such as heads of medical service divisions, heads of finance, and chiefs of medical committees. Secondary data included documentation gathered from each hospital, i.e. annual plans and hospital profiles.
The in-depth interviews, focus group discussions and document review collated explicit and tacit data. The following table outlines the types of information and sources of information in the study.

Public hospital governance in Indonesia
33
Table 2: Types and sources of information
Types of information Method of data collection Source of information
Policies and regulations related to hospital reform at national and sub-national level; external influencing factors in hospital governance
Document review Ministry of Health decree
Ministry of Home Affairs decree
Mayor or Governor decree
Hospital infrastructure Document review Hospital profiles 2012 obtained from hospital documentation (surveys conducted in 2013)
Governance aspects: financial management, accountability, human resource management
Document review Technical guidance for hospital management
Planning and budgeting
Standard operational procedures for recruiting human resources
Technical guidance for procurement
In-depth interviews and focus group discussions
Hospital managers
Hospital performance: patient load, gross death rate, increase in revenue
Document review Hospital profiles (as above)
Financial and accounting documents
The overarching aim of the study is to record lessons learned from experience in implementing hospital reform and provide best practice to improve hospital management and governance in Indonesia.

34
The specific objectives are:
• to describe the policy context, recent policy developments and reforms of public hospital governance, and performance in Indonesia;
• to describe and assess the change in governance, management and performance of the hospitals before and after the implementation of the new PSA regulations;
• to describe and assess variation in reform implementation between hospitals; and
• to identify benefits and disadvantages, as well as barriers and enablers, of the new hospital reform in terms of governance and performance.
1.1 Country context
1.1.1 Decentralization
Indonesia consists of 34 provinces under which there are 410 districts and 98 municipalities.
Decentralization took place in 2001. Central government roles were decentralized to the district level, which took on the responsibilities of planning, managing and financing most public services. A result of this government wide decentralization has been an increase in the number of provinces and districts, mainly in areas that are rich in natural resources. In every regional division, central government provides subsidies to newly formed districts. The “new” districts tend to split off from the main district in order to access revenue-sharing funds from natural resources. The funds go to the central government and 10% of that will be transferred back to the district of origin. Since 2000, there have been at least 170 additional districts formed nationally. The Ministry of Health (MOH) still continues to operate a number of tertiary and specialist hospitals, but its function has shifted mostly to regulation, including the regulation and supervision of hospitals’ resources. The MOH has no direct authority over the sub-national health offices either. The provincial health offices have now assumed a supervisory role over the district health offices, instead of the directional and financial roles they used to occupy.
Public hospital governance in Indonesia
35
1.1.2 Financing mechanism
In general, the budget mechanisms for health can be divided into two categories: the State Revenue and Expenditure Budget (Anggaran Pendapatan dan Belanja Negara, APBN); and Local Revenue and Expenditure Budget (Anggaran Pendapatan dan Belanja Daerah, APBD). The APBN includes funds for: MOH and the Central Executive Technical Unit; the De-concentration Fund; and the Assistance Fund. The De-concentration Fund originates from the state budget and is executed by the provincial government as the representative of central government for all activities necessary for the implementation of de-concentration. Since decentralization, provincial governments have greater authority over cross-district problems, such as health and education, and the De-concentration Fund enables them to implement related programmes. The Assistance Fund comes from the state budget and is executed by district-level government to implement programmes and tasks that fall under this Fund, such as developing infrastructure or purchasing medical equipment for public hospitals.
APBD consists of local revenues, the Balanced Fund and other legal revenues at the sub-national level. The Balanced Fund originates from central government but constitutes part of the local budget and aims to reduce the fiscal gap between central and local government as well as between districts. The Balanced Fund consists of: the Profit-sharing Fund; General Allocation Fund (Dana Alokasi Umum, DAU); and Special Allocation Fund (Dana Alokasi Khusus, DAK). DAU can be used for operational costs, employees’ wages and to fund local needs in implementing the decentralization. DAK can be used for asset or infrastructural investments that are locally focused and in accordance with national priorities.
In addition, the Social Assistance Fund (Bansos) was in place until 2013 and consisted of an insurance fund for poor populations (Jaminan Kesehatan Masyarakat, Jamkesmas) as well as a user-fee exemption fund for maternal and neonatal health services (Jaminan Persalinan, Jampersal). As of January 2014, all insurance funds were pooled into a single-payer mechanism under the Universal Health Coverage Scheme (Jaminan Kesehatan Nasional, JKN) organized by the Social Insurance Fund Organizing Body (Badan Penyelenggara Jaminan Sosial, BPJS).

36
1.1.3 Fiscal capacity
Indonesia is now the fourth largest economy in East Asia after China, Japan and South Korea. The gross national income per capita decreased from US$ 2120 in 2000 to US$ 790 in 2013, according to the World Bank (World Bank, 2014). There have been some economic recessions – notably during the 1997–1998 political turnovers and the 2008–2009 global economic crises – but the country has now returned to macroeconomic stability, with a growing fiscal space. Still, over 32 million people (13.67%) live below the poverty line (this is defined at a monthly per capita income of 292 265 rupiahs which is equivalent to US$ 22). Wealth inequality exists with vast geographical discrepancies. For example, according to the 2012 Indonesia Demographic and Health Survey, 47.2% of Jakarta’s population is in the highest wealth quintile, while only 3.3% of Papua’s residents fall under the wealthiest category (Statistics Indonesia [BPS] et al., 2013).
One of the impacts of decentralization is the growing discrepancy in fiscal capacity between provinces and districts in Indonesia. With greater authority over local revenues and local government shared funds, provinces that are rich in natural resources have much higher local revenues compared to others. Some districts with low population density – e.g. Kutai Kartanegara and Natuna – are substantially wealthier than other areas with denser populations. However, most districts that are rich with natural resources also have higher proportions of poor residents. Other districts with low natural resources rely on revenue from taxes, because they have higher proportions of middle- and high -income residents. Such districts include Badung (in Bali) and Jakarta, as well as Yogyakarta City, which features in this case study. However, there are also many districts with low natural resources and a high proportion of low-income residents, including Lembata and Waikabubak in East Nusa Tenggara Province.
2. Indonesian health system overviewFollowing decentralization, MOH services were devolved to the district level. Provincial and district health offices now oversee the planning, managing and financing processes for most public health services. The district also has the responsibility and power to plan and finance the delivery of district health services, including for primary health care and district hospitals.
Public hospital governance in Indonesia
37
As of 2013, Indonesia has 9601 primary health centres (Puskesmas), which provide different levels of care – i.e. primary or outpatient Puskesmas, along with referral or inpatient Puskesmas that provide secondary-level care in addition to basic emergency obstetric and neonatal care. Hospitals receive referral cases from both inpatient and outpatient Puskesmas.
There are in total 2195 secondary and tertiary hospitals in Indonesia. The MOH operates some of these tertiary and specialists hospitals (A-class, teaching hospitals) as well as a number of district-level vertical hospitals3 (B-class). At the sub-national level, the provincial and district governments manage province- and district-level hospitals (rumah sakit umum daerah [RSUD], or regional general hospitals) consisting of B-class teaching and non-teaching, C-class4 and D-class5 hospitals, and are also responsible for the planning and financing of the hospitals. RSUD financing is determined through local planning processes that require the budget approval of local parliament.
3 “Vertical hospitals“ are hospitals owned by the Ministry of Health
4 According to Regulation of Ministry of Health No. 340/2010, the standards for C-class hospitals are that they must employ specialists in the four basic types of medical care (i.e. paediatrics, internal medicine, general surgery and obestetrics-gynecology), and at least four of these specialists must be employed full-time.
5 According to Regulation of Ministry of Health No. 340/2010, the standards for D-class hospitals are that they must employ specialists in at least two of the basic types of medical care, and at least two of them must be employed full-time; there is no requirement to have an intensive care unit but a high care unit is required instead.

38
Table 3: Hospital numbers based on ownership and classification, 1 January 2013
Types of hospital Ownership/types
Hospital classification Non-specified
classTotal
A B C D
Public hospital
Ministry of Health 23 7 1 0 1 32
Provincial government 19 38 18 3 11 89
District government 1 65 228 120 33 447
City government 3 44 29 9 3 88
Non-profit organizations 1 53 195 164 314 727
Military 0 2 5 5 103 115
Police 0 2 3 0 34 39
Other ministries 0 1 0 0 2 3
Private hospital
Private 2 31 81 71 106 291
Enterprise/company 4 7 42 15 57 125
Individuals 1 0 10 17 24 52
State-owned enterprise 2 6 18 12 37 75
Total 56 256 630 416 725 2083
Source: Directorate General of Health Services (BUK), 2013
Private hospitals include those owned by not-for-profit (NFP) organizations and private providers. Private health-care providers are self-financed and regulated by the Health Office and MOH through accreditation, licensing and registration. Both for-profit hospitals and NFP hospitals face the same tax and levy burdens, and there is no difference in the burden of taxes applied to the purchase of medical equipment and supplies versus luxury cars or houses. This has resulted in stagnation in the growth of NFP hospitals and an increase in the number of for-profit hospitals over the last 10 years. The total hospital beds are 251 965 or about 10.4 beds per 10 000 people, and this number is growing steadily. However, public hospitals still account for the largest share, with ratio of around 70:30.
The acceleration in the growth of public hospitals is related to the increased number of districts as a result of the decentralization. While the number of

Public hospital governance in Indonesia
39
hospitals is still lower than the actual need, it is not subject to geographical inequalities. Figure 1 shows that the ratio of the number of hospital beds to the population ranges from between 0.96 in eastern part of Indonesia to 1.38 in Sulawesi region. There seems to be no large discrepancy in the hospital beds ratios between different regions in Indonesia.
Figure 1: Ratio of hospital beds per 1000 population in different regions in Indonesia, 2012
1.6
1.4
1.2
1.0
0.8
0.6
0.4
0.2
0.0
Sumatera Java-Bali Kalimantan Sulawesi Maluku-NTT-NTB-
Papua
NTB: West Nusa Tenggara; NTT: East Nusa Tenggara Source: Directorate General of Health Services (BUK), 2013; Statistics Indonesia (BPS), 2012
Figure 2: Ratio of beds in acute-care hospitals per 1000 population in Indonesia, 2012
0.7
0.6
0.5
0.4
0.3
0.2
0.1
0.0
2000 2001 2002 2003 2004 2005 2006 2007 2008 2009 2010 2011
Source: Directorate General of Health Services (BUK), 2013; Statistics Indonesia (BPS), 2012
40
The number of beds was derived from the national registry database, which, in 2008, began to monitor all infrastructure in both the public and private health-care systems. Figure 2 shows steady growth in the overall number of beds in acute hospitals. A similar trend was observed in the ratio of beds to 1000 population.
Table 4 illustrates the utilization rates of public and private hospitals across wealth quintiles. Those in the richest quintile have higher utilization rates compared to those in the poorest quintile. The gaps between the poorest and richest quintiles are larger for inpatient care, with no large difference between public and private hospitals.
Table 4: Mean utilization rates of hospital inpatient and outpatient care, YEAR
Deciles
Hospital
Inpatient Outpatient
Public Private Total Public Private Total
poorest 10% 0.53 0.04 0.57 0.14 0.08 0.22
2nd poorest 1.14 0.51 1.65 0.26 0.16 0.42
3rd 1.63 0.96 2.59 0.45 0.23 0.68
4th 1.58 0.93 2.51 0.44 0.23 0.67
5th 2.52 1.46 3.98 0.58 0.45 1.03
6th 2.34 1.32 3.66 0.54 0.43 0.97
7th 3.93 2.44 6.37 0.88 0.66 1.54
8th 3.72 2.28 6.00 0.84 0.63 1.47
9th 7.35 6.29 13.64 1.39 1.13 2.52
richest 10% 7.19 6.15 13.34 1.35 1.10 2.45
Population 3.19 2.23 5.43 0.68 0.51 1.19
Notes: Utilization rates given on an annualized per capita basis, i.e. visits per person per year Mean utilization rate given to two decimal places, e.g. 2.32 visits per capita per year
Source: Harbianto & Trisnantoro, 2011
Workforce availability in Indonesia has seen rapid growth over the last decade, shown by the increasing ratio of the number of health workers to population size. However, there are two remaining issues with the

Public hospital governance in Indonesia
41
workforce: first, the ratio of health workers to population remains low compared to World Health Organization recommendations, and second, the distribution of the health workforce is geographically uneven.
Table 5: Health workers in country per 1000 population, selected years
2003 2005 2009 2010
Primary care doctors 0.11 0.11 0.12 0.14
Specialist physicians 0.04 0.04 0.06 0.07
Nurses 0.64 0.52 0.73 0.92
Midwives 0.28 0.29 0.40 0.52
Dentists 0.03 0.03 0.04 0.04
Pharmacists 0.01 0.02 0.03 0.04
Sanitarians 0.06 0.05 0.05 0.07
Nutritionists 0.03 0.04 0.05 0.07
Physical therapists 0.01 0.01 0.01 0.01
Source: Statistics Indonesia (BPS), 2012
As of 2012, the average ratio between general practitioners and population size in Indonesia was 36.1; however, this ratio shows substantial variation across the country, signifying geographical discrepancies in the distribution of human resources for health. In the capital city of Jakarta, for example, the ratio was four times the national average (149.5), while the ratio amounted to only one fourth (8.9) of the average in West Sulawesi (Statistics Indonesia, 2012).
Figure 3 shows the ratio of the number of physicians and nurses to beds. In 2007–2008, the nurse ratio was higher than in other years. The physician-to-bed ratio shows no significant change during the last 11 years.

42
Figure 3: Physician- and nurse-to-bed ratios in Indonesia, 2012
2.5
2.0
1.5
1.0
0.5
02000
Nurse:Bed Ratio Physician:Bed Ratio
2001 2002 2003 2004 2005 2006 2007 2008 2009 2010 2011
Source: Directorate General of Health Services (BUK), 2013
According to Law No. 29/2004 on Medical Practice, Indonesian physicians are allowed to work in a maximum three health facilities concurrently. The intention is to ensure the appropriate distribution of health workers in the area and to increase public access to medical care. Few physicians work only in one health-care facility and the work hours are regulated by each respective facility. However, there is no national or representative data on the number of full-time equivalent doctors and nurses.
2.1 Quality assurance systemPublic and private hospitals must be accredited, according to Health Minister Decree No. 417/2011. The aim is to improve the quality of service by standardizing service provision, which should in turn ensure patient safety. At the time the Decree was made, Indonesia had three levels of accreditation: basic (five criteria, i.e. administrative and managerial, medical service, emergency service, nursing service, and medical records), advanced (i.e. basic criteria plus pharmacy, occupational health and safety, radiology, laboratory, operating theatre, infection control and high risk perinatology) and higher-advanced (advanced criteria plus anaesthesia and reanimation, medical rehabilitation, nutrition, central sterilization, and other services such as blood bank and VCT clinic), respectively. In 2012, the National Accreditation Committee (Komite Akreditasi Rumah Sakit, KARS) issued new accreditation

Public hospital governance in Indonesia
43
criteria focusing on patients, patient safety and continuity of care, among others (Directorate General of Health Services [BUK], 2012).
However, based on the 2011 health facility survey, only 51% of the public hospitals in Indonesia had been accredited. Many factors, including an unbalanced health workforce distribution outside of Java, contributed to this low percentage. Moreover, the accreditation level varied. Most hospitals that have been accredited (30.5%) attained the basic accreditation level, 10.5% achieved the advanced accreditation level, and less than 10% reached the higher-advanced level. In 2012 there were one class-A public hospital and six private hospitals accredited based on the new criteria. In 2013, there were three class-A public hospitals, one military hospital and 15 private hospitals accredited (KARS, 2014).
3. Public hospital reform3.1 Historical and key policy changesA number of hospitals in Indonesia, particularly those located in Java, have gone through financial reforms since 1991, when the hospitals became self-financing (Chawla et al., 1996). Prior to the 1991 reform, as described in Table 6, all public hospitals were generally non-tax revenue units (Pendapatan Negara Bukan Pajak, PNBP), managed primarily by Provincial or District Health Offices. These hospitals were required to develop annual plans based on the Health Office’s Plan and submit their operating revenues on daily basis to the Government account. They could use the budget only after approval by Parliament, which wouldn’t be received until the second quarter of the year. This procedure and timeline caused difficulties for public hospitals to respond to their patients’ needs, particularly in emergency situations. For example, if the only operating lamp of the hospital or the X-ray machine suddenly breaks down, replacement had to wait until the next quarter of the year when Parliament approves the budget. At the time, government-owned hospitals were not permitted to use their operating revenue without approval.
An increase in the number of patients, types of services required and increased competition drove public hospitals to adapt to these changes in environment in different ways. For example, the need for public hospitals to have greater authority and autonomy in the area of finance prompted the Government to develop new regulations. These were passed through Presidential Regulation No. 38/1991 on Swadana Hospitals – public hospitals that have wider

44
autonomy in managing their operating revenues (Republic of Indonesia, 1991). Based on the Decree, some local parliaments requested that the MOH grant Swadana status to some public hospitals in their districts. Meanwhile, the majority of public hospitals without Swadana status continued to be managed under the previous regulations. However, regardless of the self-financing mechanism adopted, the central and local governments still retained great control over hospitals’ planning and budgeting. In 2000, some MOH-owned hospitals were transformed into Government-owned corporate-style institutions (Perusahaan Jawatan, PERJAN) and applied business-like accounting systems.
Figure 4: Spectrum of bureaucratic and corporate types of organization
Type of organization
PNBP
District Health Office
Before 1991
Presidential Regulation No. 38,
1991
Law No. 44, 2009
Bureaucratic Corporate type of organization
Not-Swadana Hospital
Swadana Hospital
PT Askes Indonesia
(State-Owned insurance Corporate)
Public Service Agency
SWADANANOT-FOR-PROFITORGANIZATION PERJAN
PERUM (Perusahaan
Umum or common business
organization)
Persero (another type of State-Owned Corporate)
Example:
Source: Adapted from Trisnantoro, 2004
The implementation of Swadana and PERJAN brought a new perspective that public hospitals needed the authority to improve the health services provided for their communities. The public service management reform in Indonesia was rolled out nationally in 2003 through Law No. 17 on State Budget (Republic of Indonesia, 2003). Since then, a series of regulations have been issued, among others Law No. 1/2004 (on State Treasury) and Law No. 15/2004 (on State Financial Audit, Management and Accountability), Government Decree No. 23/2005 (on BLU transformed all PERJAN hospitals into BLU hospitals), Government Decree No. 24/2005 (on the Government Accounting Standard (Standar Akuntansi Pemerintah, SAP) and Decree No. 58/2005 (on District Financial Management) (Republic of Indonesia, 2004a, 2004b, 2005a, 2005b, 2005c). All of these decrees built

Public hospital governance in Indonesia
45
the foundations of the Home Affairs Ministerial Decree No. 61/2007, which regulates the PPK-BLUD (Republic of Indonesia, 2007). Law No. 44/2009 stipulates that hospitals should be managed under the BLU (for MOH-owned hospitals) or BLUD (for local-government-owned hospitals) systems (Republic of Indonesia, 2009).
3.2 DifferentiationTheoretically, the implementation of these regulations should have a major impact on hospital governance, which should lead to better service outputs.
Table 6: Difference in hospital management systems before and after BLU/BLUD
Distinguishing aspect
Non-Tax Revenue Unit (PNBP)
Swadana (self-financed) BLU/BLUD
Midterm plan Strategic plan Strategic plan Business strategic plan
Budgeting system RKA-SKPD (budgeting document for government institution, inflexible)
RKAP (government planning document)
RKA-SKPD (budgeting document for government institution, inflexible)
Business budget plan
Controlling system LAKIP (Government Performance Accountability Report)
LAKIP Performance achievement report based on SPM (minimum service standard) Financial report (using corporate system) Balance sheet Independent audits
Revenue management
Has to be transferred to the local government account within 24 hours
Operational revenue can be used for operational costs, service fee and staff contracting, with certain mechanism and restrictions
Operational income goes directly into the hospital’s account and can be used in accordance with the hospital’s needs (plan)
LAKIP: Laporan Akuntabilitas Kinerja Instansi Pemerintah; RKAP: Rencana Kerja Anggaran Pemerintah; RKA SKPD: Rencana Kerja dan Anggaran Satuan Kerja Perangkat Daerah; SPM: Standar Pelayanan Minimal
Source: Trisnantoro, 2007

46
3.3 Characteristics and requirements of reformThe following are characteristics of institutions implementing BLU/BLUD:
• serves as local government work unit;
• does not operate as a separate local revenue unit;
• produces goods/services that are sold fully/partially to the public;
• not-for-profit;
• serves as cost centre and /or revenue centre;
• autonomous and managed using corporate-like efficiency and productivity as the guiding principles;
• work and budget plan as well as accountability are consolidated with those of the local government or parent institution;
• all revenues, except for grant funds, can be spent directly;
• staff consist of both civil servants and non-civil servants (NCSs); and
• not subject to taxation.
Based on the Home Affairs Ministerial Decree No. 61/2007, public service institutions that provide public goods for the community, or manage certain catchment areas, or specific funding can be awarded BLUD status once they fulfil a number of requirements (Republic of Indonesia, 2007). This means that the Decree is only effective for qualified institutions. There are three levels of requirements for qualification. At the first level the public institution must provide services or goods to the community and receive payment for them, or manage a special region or special fund. The second level includes technical requirements, such as whether improvement of the hospital is feasible and the provider has a good financial performance. The third level consists of administrative documents that include a statement, signed by the hospital director, pledging to improve its performance after BLUD status is awarded; hospital governance information; business plan; minimum service standards signed by the regent or mayor and the hospital director; financial statement; and a financial audit report or letter which states that the hospital’s accounts will be made “available to be audited by public accountant”.

Public hospital governance in Indonesia
47
4. Case study4.1 Area characteristicsBased on data from Statistics Indonesia (Badan Pusat Statistik, BPS), in 2011, 13–24% of the population in the five areas of this case study were classed as poor (Statistics Indonesia, 2012). Based on data from the Directorate General of Health Services (Bina Upaya Kesehatan, BUK) of the MOH, in 2011 the Sleman District had the highest population and number of physicians; nonetheless, a physician there covers more than 5800 persons. Magelang City has lowest ratio of physicians to population at 1: 3300. However, physicians in Bantul District have the highest burden of work, with a physician to population ratio of 1 : 14 600.
Figure 5: Proportion of poor population in the study areas in 2011
Banda Aceh
Total Population
Magelang
Yogyakarta
Bantul
Sleman
0 200 000
225 56243 894
118 80516 000
457 66881 600
921 263
1 125 369
222 987
224 000
400 000 600 000 800 000 1 000 000 1 200 000
Poor Population
Source: Statistics Indonesia, 2012
When it comes to the number of beds, Magelang City has the best physician-to-hospital bed ratio, with one physician for every 10 hospital beds. Bantul District has the lowest ratio, with one physician for every 33 hospital beds. The best nurse–hospital bed ratios (1 : 1) are in Yogyakarta and Banda Aceh. Sleman District has the lowest number of nurses compared to hospital beds, with a ratio of 1: 4.

48
Figure 6: Health workers-to-bed ratio in five study areas, 2011–2012
Indonesia
Banda Aceh Municipality
Magelang Municipality
Yogyakarta Municipality
Bantul District
Sleman District
Nurse to bed ratio, 2011
0.00 0.50 1.00 1.50 2.00 2.50
Doctor to bed ratio, 2011 Doctor to nurse ratio, 2012
Source: Directorate General of Health Services (BUK), 2013
5. Hospital profilesAll the hospitals involved in this study are B-class hospitals. According to MOH Decree No. 340/2010, a B-class hospital must at least have four fundamental specialists (e.g. internist, paediatrics, obstetricians and surgeons); four diagnostic and medical supporting specialists (e.g. radiologists, clinical pathologists, rehabilitation medicine physicians, anaesthetists); eight other medical specialists (e.g. neurologists, psychiatrists, eye physicians, ear, nose and throat physicians); and two subspecialists (e.g. neurosurgeons, heart surgeons).
Table 7 summarizes the services provided by the case study hospitals. Note that the surveys to compile the hospital profiles for 2012 were conducted and reported in 2013. As shown in Table 7, PSH in Bantul District has the widest range of specialties compared to other hospitals; this is an improvement from 2011, when the district had the worst physician- to- hospital bed ratio.

Public hospital governance in Indonesia
49
Table 7: Services provided in the five hospitals, 2012
Service Group
SH (Sleman District)
PSH (Bantul District)
KYH (Yogyakarta
City)TH (Magelang
City)MH (Banda Aceh City)
Emergency and ambulatory
All basic services as required by the standard
All basic services plus nephrology, haemodialysis, orthopaedic, orthodontic and cosmetic
All basic services plus endoscopy, orthodontic and cosmetic
All basic services plus acupuncture
All basic services
Inpatient Patient rooms in different classes
Patient rooms in different classes
Patient rooms in different classes
Patient rooms in different classes
Patient rooms in different classes
Supporting specialist
Clinical pathology, radiology
Clinical pathol-ogy, radiol-ogy, electro medical, medical rehabilitation
Labora-tory, radiol-ogy, medical rehabilitation
Clinical and anatomy pathol-ogy, radiol-ogy, medical rehabilitation
Labora-tory, radiol-ogy, medical rehabilitation
Operating Theatre
Available Available Available Available Available
Pharmacy Available Available Available Available Available
Source: Hospital profiles 2012 obtained from hospital documentation (surveys conducted in 2013)
Due to the lack of an anaesthetist, the hospitals cooperate with nearby teaching hospitals (Dr Sardjito Hospital in Yogyakarta and Zainoel Abidin Hospital in Banda Aceh). This means that at least one anaesthetist from the teaching hospital is present in each B-class hospital.
Table 8 shows several performance indicators in each hospital according to Indonesian national standards. Based on the data, KYH was under-occupied while TH was over-occupied. The turnover interval in PSH and TH were below the national standard, with bed turnover in PSH especially low. Both the gross and net death rates at MH were very low compared to the other hospitals.

50
Table 8: Certain services and clinical performance indicators in five hospitals, 2012
Indicators SH PSH KYH TH MH National standard
BOR (%) 75.08 83.21 59.88 92.41 71.9 60–85
LOS (day) 4.99 4.32 4.27 4.50 4 6–9
TOI (day) 1.73 0.73 2.93 0.38 1 1–3
BTO (time) 66.34 6.92 50.16 75.16 68 40–50
GDR (per million) 23.15 27.00 43.79 16.82 3 -
NDR (per million) 12.65 12.60 21.96 31.31 1.3 -
BOR: bed occupancy rate; BTO: bed turnover; GDR: gross death rate; LOS: length of stay; NDR: net death rate; TOI: turnover interval
Source: Hospital profiles 2012 obtained from hospital documentation (surveys conducted in 2013); MOH, 2005 (for “national standard”)
As shown in Table 9, interviews with the five hospital managers found that all hospitals had compiled corporate-style business plans, which contain market and financial projections, instead of government-style strategic plans. The plans are dovetailed into the annual budget plan that sets out the basis for using the BLUD budget. However, TH must develop a strategic plan as well, as required by its local government; while KYH faces a different challenge in synchronizing its business plan with the local governments.

Public hospital governance in Indonesia
51
Table 9: Planning and budgeting in the five hospitals after BLUD
Planning aspects
SH PSH KYH TH MH
Business plan Yes Yes Yes Yes, plus Strategic Plan
Yes
Budget plan Yes Yes Yes Yes Yes
The use of non-govern-ment funding sources
Daily expen-diture
Daily expen-diture, some investment and salaries of non-civil servants
Daily expen-diture
Daily expen-diture
Daily expenditure, salaries of non-civil servants (NCSs) and also planned salary payments to NCS specialists, and capacity building
The use of local/national budget
Civil servants’ salaries and investment
Civil servants’ salaries and some invest-ment
Civil servants’ salaries and some invest-ment
Civil servants’ salaries and some invest-ment
Salary of contracted (temporary) staff, investment, mainte-nance or repair of medical equipment
Source: Asia Pacific Observatory on Health Systems and Policies
The hospitals’ revenue comes from their main activities (medical services), supporting activities (hospital business units), and government subsidies (APBD and APBN). The subsidy is used mainly for funding civil servant salaries and hospital investment, in which the budget amount and mechanism of procurement should be in compliance with the national and local regulation, such as: the amount of salary, the mechanism of tender for the investments and the guidelines on use of the current annual budget. Non- subsidy revenue may be used to fund operational costs with a significant amount of flexibility (10% on average), based on the hospital’s annual Budget Plan. This flexibility enables hospitals to create innovations or to respond quickly to patients’ needs. However, the study found that PSH uses hospital-operating revenue to fund some investments; while SH, PHS, KYH and TH are able to meet their operational costs from operating revenue.
According to the Home Affairs Ministerial Decree, BLUD has 14 flexibilities that distinguish it from other district agencies (Satuan Kerja Perangkat Daerah, SKPD). These flexibilities are designed to: manage revenue and costs; manage cash; manage debt; manage claims; manage investment; procure

52
supplies and goods; manage goods; develop a budgeting system; set the tariff; manage surplus and deficit; cooperate with other parties; manage non-civil-servants; manage operating revenue directly; and, develop the standards, policies, systems and procedures of financial management. This means that BLUD hospitals are no longer required to comply with many operational regulations at the national level (e.g. Presidential Decrees on Procurement, regulation on human resources management, etc.). Instead, the new BLUD mechanism requires regional regulations (which are enacted by the mayor/regent or district/provincial parliament) to provide the technical regulations behind these new flexibilities which replace the previous bureaucratic system.
Table 10: Implementation of governance and accountability after BLUD
Governance aspects SH PSH KYH TH MH
Regent or mayoral decrees
Regulate technical hospital financial management
Regulate almost all flexibilities for BLUD except for goods and services procurement
Regulate technical hospital financial management
No information on governance
Regulate technical hospital financial management
Board of Supervisors
Exists Exists Exists Exists Exists
Board of Trustees Exists Exists None Exists None
Board of Supervisors’ role in hospital perfor-mance
Not very effec-tive in evalu-ating hospital performance
Effective for consulta-tions on the changes in financial and planning mechanisms
No statement can be issued
No statement can be issued
Not very effec-tive, but the hospital can ask for inputs directly from local govern-ment staff

Public hospital governance in Indonesia
53
Governance aspects SH PSH KYH TH MH
Accountability/ auditor
Responsible to the head of district, audited by national and provincial financial supervisory bureaus
National and provincial financial supervi-sory bureaus, public accountant, Internal Supervi-sory Unit and inspectorate
Internal Supervi-sory Unit and auditors (Development Supervisory Board and the national financial supervisory bureau)
Biannual monitoring and evaluation by the Board of Supervisors
Audited by the inspectorate, BPKRI and Ombudsman
Evaluation 3-monthly internal evaluation of service quality
SPM, LAKIP, financial report
LAKIP Weekly meeting report
BPKRI: Badan Pemeriksa Keuangan Republik Indonesia; LAKIP: Laporan Akuntabilitas Kinerja Instansi Pemerintah; SPM: Standar Pelayanan Minimal
Source: Asia Pacific Observatory on Health Systems and Policies (drawing from unpublished Supreme Audit Agency (BPK) reports)
Before the BLU/BLUD, public hospitals had Boards of Trustees (BOT). Their functions were to give legitimacy to the hospital director’s decisions, to raise funds and/or to give political support for the hospital (Trisnantoro, 2005). Membership of the BOT consists of the mayor (municipality) or regent (district), vice mayor or vice regent and regional secretary. After the BLU/BLUD, some hospitals maintained their Boards, but senior staff from the Health Office and Finance Bureau replaced the previous members. According to the Finance Ministerial Decree, the regent or mayor must establish a Board of Supervisors (BOS) whenever any public agency’s total annual revenue exceeds US$ 1.3 million, or when its assets amount to more than US$ 6.5 million. The BOS represents the regent or mayor and monitors and evaluates the service and financial performance of the BLUD. Thus, the role of BOS is more active in ensuring the quality and accountability of the hospital.
Table 10: Implementation of governance and accountability after BLUD (cont.)

54
Table 11: Implementation of Human Resource Management after BLUD
HR Management
aspects SH PSH KYH TH MH
Recruitment of non-civil servants
Allowed Allowed Allowed Allowed Allowed
Specialists recruited by hospital
None Paediatricians and obstetri-cians
Orthopaedists, surgeons, paediatricians and internists
Paediatricians Paediatricians, internists, anaesthetists, pulmonologist, cardiologist and physio-therapist
Remuneration system
The development is in progress
Established, but simple Non-civil servants’ salaries are synchro-nized to civil servants’
Established, but simple
Under-devel-oped
Local govern-ment pays temporary staff salaries and sets the remuneration system
Source: Asia Pacific Observatory on Health Systems and Policies (drawing from unpublished Supreme Audit Agency (BPK) reports)
When they were Swadana, public hospitals were not allowed to recruit temporary or long-term staff. Hospitals submitted their workforce requirements to the Regional Staffing Board, through which the recruitment process was centralized. However, many newly recruited staff were being placed in the hospitals regardless of their qualifications or competencies. This caused a high human resources (HR) cost to the hospitals, which was exacerbated by the uncompetitive organizational culture within the hospitals.
Following implementation of the BLU/BLUD, hospitals are able to recruit their own non-civil service staff, as long as the hospitals are able to pay the HR costs. Although it remains a big challenge to develop and synchronize the hospital HR system with the existing civil service system, the policy enables hospitals to meet their HR needs more easily. The five hospitals included in this study have had a large proportion of contract-based employees compared to the total hospital staff. The contract-based employees comprise almost all types of staff at the hospital such as: nurses,

Public hospital governance in Indonesia
55
midwives, pharmacists, general practitioners, radiologists and laboratory technicians. PSH and MH also employed specialists by contract, thus not only meeting the required number of specialists but also increasing hospital revenue by allowing the hospital to keep longer working hours. These employees were recruited directly by the hospitals through merit-based selection mechanisms.
6. Factors affecting public hospital governance6.1 External environmentHospital autonomy has been known in Indonesia in very simple form since 1991 through the implementation of Swadana hospitals. This reform took 16 years – until 2007 – to implement with proper regulations. Despite the regulation that mandates all hospitals to conform to BLU/BLUD and the introduction of technical regulations over six years ago, only 50% of all public hospitals have actually implemented the regulation. There are many factors that have contributed to this low implementation rate, including the different perceptions between the hospitals and external stakeholders (such as the Head of the Organization and Governance Bureau, Financial and Asset Management Officer, District Secretary, and Head of the Local Staffing Agency) on the hospitals’ readiness to implement the system, as well as the lack of overall awareness of the BLU/BLUD reforms.
After decentralization, there were significant fiscal capacity differences among local governments as well as populations. Those districts or municipalities with greater fiscal capacity attracted more private health-care providers. Districts with many private providers and highly dense populations also have a more positive association with specialist distribution (Meliala, 2014). These factors explain why public hospitals in Java can recruit more specialists and open new services easily compared to other areas. Moreover, hospitals implementing the BLU/BLUD formulate their own strategies to adapt to changes in policy, including the direct recruitment of specialists in order to provide broader health-care services as needed. On the other hand, to put the BLU/BLUD principles into practice, hospitals must improve their efficiency, effectiveness and accountability. Contracting out non-core hospital business (i.e. laundry, security and parking as at PSH) is one example of how to put an efficiency strategy into practice.

56
However, the health sector is a salient political issue. A change in local leaders due to local elections (i.e. for mayor, regent and/or governor) may also bring changes to policies governing public hospitals. It is possible that the incoming regents or mayors would treat the hospitals as district revenue centres and demand the hospitals’ surplus revenue be used to fund development in other sectors. To anticipate this situation, hospital managers must engage in an ongoing advocacy and educate the public that “free health services” mean that more government subsidies need to be directed to public hospitals.
7. Key decision rights, accountabilities and incentivesThe BLU/BLUD requires hospitals to meet six administrative requisites to ensure public service accountability. These are: (1) a statement letter of ability to improve hospital performance, (2) a business plan document, (3) minimum service standards document, (4) a governance document, (5) a financial statement, and (6) a statement letter indicating that an external auditor may audit the hospital. In short, greater flexibility means greater responsibility. This responsibility is reflected in the strategic planning process, where the onus is on hospitals to define their goals. Moreover, the implementation of more businesslike standards in hospital accounting and finance aims to make government-owned hospitals auditable by external auditors. In other words, the hospitals’ right to use public resources is followed by an obligation to become more accountable and transparent. Flexibility in managing financial and human resources are the biggest levers in improving the performance of the hospital. These changes improve the hospitals’ abilities to respond to patients’ needs as well as their competitiveness.
Hospitals implementing BLU/BLUD may recruit NCS staff as needed, whenever they can afford the human resources cost. Government institutions are not allowed to hire NCSs unless the regent or mayor has signed a technical regulation permitting this. The regent decree regulates how a BLUD hospital recruits NCS, the salary, and other aspects of HR management. This enables the hospital to select and recruit the most competent staff as needed. The study reveals that PSH, KYH, TH and MH have been using this as an opportunity to recruit more specialist physicians. Other than to meet service standards, the additional staff are intended to offer more specialized services that should in turn increase the hospitals’ income.

Public hospital governance in Indonesia
57
The system of measuring civil servants’ performance is no longer suitable for the new corporate-like management structure implemented in the hospitals. This means that hospitals have to develop their own systems, including devising reasonable remuneration and pay-for-performance schemes. But this is a highly sensitive issue since no national standard of health professional pay currently exists. The five hospitals included in this study are in the process of developing performance-related pay systems, in which a large volume of work is considered to be a “high performance”. Consequently, doctors receive more fees for treating more patients. However, the implementation of JKN – the Universal Health Coverage Scheme – at the start of 2014 will influence the way hospitals pay professional fees. Quality of work should be considered the basis of performance instead of volume.
8. Performance outcomesIn the past, one of the performance measures used in the Government system was the budget absorption level, rather than budget efficiency. Often, travel for work was completed unnecessarily, absorbing more money than planned. Other hospitals were forced to refer patients to the nearby private pharmacy because they had allocated too little budget for procuring a year’s worth of medical supplies. The performance measure used also led to a tendency to spend the maximum budget allowed, while the outputs of medical programmes were not often associated with any improved patient care or patients satisfaction.
As BLUD institutions, hospital achievement is measured through the evaluation of performance indicators that are stated in the Business Plan and SPM, instead of by budget absorption. The BOS regularly monitors and evaluates achievement at quarterly BOS meetings. It produces reports for the regent/mayor with suggestions to be followed up by the hospital. Meanwhile, the hospitals have developed various strategies to maintain their outputs to the desired level of quality. Within the new governance system, hospitals may independently establish a Quality Committee (KYH and TH), Infection Monitoring Team (TH), via SMS Gateway to deal with patients’ complaints via text message/mobile phone (KYH) and regular training (KYH) as well as increased ward capacity to reduce infection, opening new medical services, appointing officials in charge of monitoring

58
clinical risk, and improving the Medical Committee’s role (PSH). According to MOH Regulation No. 755/2011, the Medical Committee is a tool in the hospital that conducts clinical governance so that all staff in the hospital preserve their professionalism through the credentialing mechanism, maintain quality of medical professionalism and maintain medical ethic and professionalism as well. Most hospitals also conduct regular patient satisfaction surveys.
Table 12: Selected indicators in five hospitals, 2012
VariablesHospital
SH PSH KYH TH MH
Bed capacity 168 300 201 215 200
Volume of patient
Inpatient visit 11 142 13 742* 10 842 17 147 8315
Outpatient visit 71 083 105 301* 105 728 125 475 66 035
Emergency visit 18 562 14 391* 27 125 14 747 2351
Human resources
Number of physicians 34 42 49 34 76
Number of nurses 150 255 226 247 220
Finance (in US$ million)
Total revenue 3.8 6 4.1 5.1 1.8
Total cost NA 8.1 5.4 4.9 NA
*January–June 2013 Source: Asia Pacific Observatory on Health Systems and Policies, drawn from Hospital profiles documentation (surveys conducted in 2013)
Transformation of public hospitals through the BLU/BLUD regulation has improved hospital governance and the hospitals’ competence and ability to provide care for their communities. These changes are in line with central and local governments’ policies that prohibit all Government-owned hospitals from refusing social insurance patients for any reason – even if the hospital has exceeded its capacity. In general, social insurance patients constitute more than 40% of total outpatient visits. In KYH, the number of outpatient and inpatient visits in 2012 increased to 11.28% and 30%, respectively, from the previous year, while the number of patients referred to bigger hospitals decreased by 9%. Longitudinal data from 2006 to 2013

Public hospital governance in Indonesia
59
show that net death rate (NDR) in PSH decreased by 0.7%, but in SH, KYH and TH it increased (these increases ranged from 2.7% to 9.3%). Meanwhile, during the same period, gross death rate (GDR) in KYH decreased by 1%, but in PSH, SH and TH it increased (these increases ranged from 1.7% to 4.8%). No data were available from MH. A clear explanation of the reason behind NDR and GDR values came from PHS. It had high bed-occupancy rates; turnover of inpatient beds amounted to less than one per day, despite the fact that capacity had been expanded. This low turnover of inpatient beds was found to impact on quality of care; particularly in the perinatology ward where two babies often share the same bed, increasing the risk of nosocomial infections. The hospital is still struggling with these issues.
9. ConclusionBroader government wide BLU/BLUD reforms have positively benefited public hospitals in Indonesia. The change in the standard of financial management – from government to business standards – has led to wider flexibility in the use of public resources and also to the expansion of hospitals’ responsibilities.
Looking across the five hospitals included in this study, the reforms proved to be more effective in the four hospitals in Java than in the hospital outside the area. The availability of external resources, particularly specialists, seems to have contributed to improved doctor-to-nurse ratios within Java. These ratios give hospitals the opportunity to improve the range of health services on offer, in addition to capacity and competency.
Successful implementation also depends on the operational management system of the hospital. Switching from Government accounting standards to business standards is a big challenge for everyone involved: the hospital, its supervisory body and the owner (local government). A new outlook and means of managing resources are often needed, which requires hospitals to develop their own operational systems – e.g. accounting, information, remuneration etc. – to gain the most benefit, remain accountable, and attain the best from the reform.

60
The hospital manager and all stakeholders need to understand and adhere to these new ways of working. Being a BLUD institution and allowed to manage resources independently does not signify that hospitals need no more support from Government. Indeed, the five hospitals in this study receive subsidies, but only for civil servant salaries and selected investments. Hospitals may also receive subsidies for operating costs if they provide services for the poor. But, apart from that, hospitals must use their own profits to build new wards or facilities.
Yet another challenge is the political situation. Many politicians treat health and hospitals as commodities to win people’s support. It is therefore hard to advocate that public hospitals are not-for-profit institutions, and consequently their savings or operating revenue cannot be used to subsidize other sectors in the region.
Based on these findings, this study suggests that:
• the hospital director should be trained in political communication skills to improve the effectiveness of the advocacy process;
• the operational management system should support accountability at the hospital;
• hospitals and stakeholders should monitor performance from various perspectives, including clinical, managerial and financial; and
• Central Government should regulate and monitor the distribution of medical staff so that hospitals outside Java have the same opportunities to improve performance.

Public hospital governance in Indonesia
61
ReferencesChawla, M, Govindaraj R, Berman P, Needleman J (1996). Improving hospital performance through policies to increase hospital autonomy: methodological guidelines. Washington (DC): United States Agency for International Development.
Directorate General of Health Services (BUK) [website] (2012). Tahun 2012 KARS fokus standar akreditasi baru rumah sakit. Jakarta: Ministry of Health (http://buk.kemkes.go.id/index.php?option=com_content&view=article&id=192:tahun-2012-kars-fokus-standar-akreditasi-baru-rumah-sakit, accessed 11 September 2014).
Directorate General of Health Services (BUK) [website] (2013). Data rumah sakit online [Hospital data online]. Jakarta: Ministry of Health (http://sirs.buk.depkes.go.id/rsonline/report/report_by_catrs_2012.php, accessed 11 September 2014).
Docteur E, Oxley H (2003). Health-care systems: lessons from the reform experience. Working Paper. Paris: Organisation for Economic Co-operation and Development.
Harbianto D, Trisnantoro L (2011). Is the public health care subsidy equitable? The impact of government health care subsidy on health equity.Working paper. Yogyakarta: Center for Health Service Management, Universitas Gadjah Mada.
National Hospital Accreditation Committee (KARS) (2014).
Meliala A (2014). Distribution and engagement of specialist doctors in public hospital Indonesia.BMC Public Health. 14(Suppl 1):O15. doi:10.1186/1471-2458-14-S1-O15.
Ministry of Health (MOH) (2005). Indikator Kinerja Rumah Sakit. Jakarta: Direktorat Pelayanan Medik, Departemen Kesehatan Republik Indonesia.
Praxis (2007).Center for Policy Studies. Hospital reform in Bulgaria and Estonia: what is rational and what not? Final report of the Local Government Initiatives Fund. New York (NY): Open Society Institute.
62
Republic of Indonesia (1991). Presidential Regulation No. 38/1991 on Self-financing Unit (Peraturan Presiden No. 38 Tahun 1991 mengenai Unit Swadana).
Republic of Indonesia (2003). Law No. 17/2003 on State Budget (Undang-undang No. 17 Tahun 2003 tentang Penganggaran Negara).
Republic of Indonesia (2004a). Law No. 1/2004 on State Treasury (Undang-undang No. 1 Tahun 2004 tentang Perbendaharaan Negara).
Republic of Indonesia (2004b). Law No. 15/2004 on Management, Accountability and Audit of State Finance (Undang-undang No. 15 Tahun 2004 tentang Pengelolaan, Akuntabilitas dan Audit Keuangan Negara).
Republic of Indonesia (2005a). Government Regulation No. 23/2005 on Public Service Agency (Peraturan Pemerintah No. 23 Tahun 2005 mengenai Badan Layanan Umum).
Republic of Indonesia (2005b). Government Regulation No. 24/2005 on Government Accounting Standar (Peraturan Pemerintah No. 24 Tahun 2005 mengenai Standar Akuntansi Pemerintahan).
Republic of Indonesia (2005c). Government Regulation No. 58/2005 on Financial Management at Subnational Level (Peraturan Pemerintah No. 58 Tahun 2005 mengenai Pengelolaan Keuangan Daerah).
Republic of Indonesia (2007). Home Affairs Ministerial Regulation No. 61/2007 on Financial Management of Public Service Agency (Peraturan Menteri Dalam Negeri No. 61 Tahun 2007 mengenai Pedoman Teknis Pengelolaan Keuangan Badan Layanan Umum Daerah).
Republic of Indonesia (2009). Law No. 44/2009 on Hospital Management under BLU, BLUD (Undang-undang No. 44 Tahun 2009 tentang…).
Roubal T, Hrobon P (2013). Does the legal form of hospital matter for good governance in the Czech Republic? Eurohealth incorporating Euro Observer. 19(1)[paragraph 16].

Public hospital governance in Indonesia
63
Statistics Indonesia (BPS) [website] (2012). Social and population (http://www.bps.go.id/eng/index.php, accessed 12 September 2014).
Statistics Indonesia (BPS), National Population and Family Planning Board, Ministry of Health (2013). Indonesia Demographic and Health Survey 2012. Jakarta and Calverton (MD): Ministry of Health, Indonesia and ICF International, MEASURE DHS.
Trisnantoro L (2004). Memahami penggunaan ilmu ekonomi dalam manajemen rumah sakit. Yogakarta: Gadjah Mada University Press.
Trisnantoro L (2005). Aspek strategis manajemen RS: antara misi sosial dan tekanan pasar. Yogyakarta: Andi Offset.
Trisnantoro L (2007). Modul training of trainer BLUD: pengantar. Jakarta: Departemen Dalam Negeri, Republik Indonesia.
World Bank [website] (2014). Data: GDP per capita (current US$). (http://data.worldbank.org/indicator/NY.GDP.PCAP.CD?page=2, accessed 11 September 2014).

64
B. Public hospital governance in New ZealandA case study on the New Zealand District Health BoardRobin Gauld

Public hospital governance in New Zealand
65
AbstractGovernance in New Zealand’s health system is devolved to 20 District Health Boards (DHBs), each with responsibility for planning and funding services for their populations. Public hospitals are an integral part of this system and their governance is intertwined with the local health system governance arrangements. This paper aims to describe the context for, and approach to, public hospital and health system governance in New Zealand.
Five DHBs, which represent different regions, were chosen for in-depth analysis. A search was conducted for publicly available information generated by national agencies and the five DHBs, with a focus on Government expectations, strategic planning, accountability and performance monitoring, were selected. Academic publications and grey literature were also searched.
The devolution of governance, albeit with strong central government oversight, means there is considerable variation and flexibility in local arrangements. A recent focus on building whole system service delivery approaches means the lines between hospital and community-care governance are becoming increasingly blurred. The objective of the stronger emphasis on, and integration with, primary health care and other community health service providers is not only to reduce the pressure on hospitals, but also to proactively plan for an ageing population and rising burden of chronic diseases.
This paper has three sections. First, it provides background on the New Zealand health system. Second, it describes the governance of hospitals and the local health system in five of New Zealand’s 20 District Health Board regions: Counties Manukau; Bay of Plenty; Hawke’s Bay; Hutt Valley; and Southern. Third, the paper discusses performance measurement and monitoring, which take place at the national government level as well as the district level. The study of five districts reveals that the recent emphasis on performance improvement has led to concrete activities promoting quality and process improvement at the DHB level. However, the decentralization of hospital governance has also posed several challenges, including the coordination and cooperation of many complex sub-systems across the country. Due to the complexity of New Zealand’s health system, performance measurement also proves complicated.

66
Acronyms and abbreviationsACC Accident Compensation Corporation
ALOS average length of stay
BOP Bay of Plenty
BSMC better, sooner, more convenient
CEO Chief Executive Officer
CM Counties Manukau
CMO Chief Medical Officer
DHBs District Health Boards
GDP gross domestic product
GP general practitioner
HB Hawkes Bay
HQSC Health Quality and Safety Commission
HV Hutt Valley
IHI Institute for Healthcare Improvement
IT information technology
NHB National Health Board
NMDS National Minimum Data Set
OECD Organisation for Economic Co-operation and Development
PHO Primary Health Organisation

Public hospital governance in New Zealand
67
1. Introduction1.1 Country contextNew Zealand is a developed country with a long history of transparent, democratic government. A single house of Parliament sits in the capital city, Wellington. General Elections are held every three years. Since the introduction in 1996 of a mixed-member proportional representation system, multi-party coalition governments have been led by either the National or Labour parties. Both parties are centrist in orientation, with National more towards the “right” and Labour the “left”. The present National-led Government has been in place since 2008. The National party dominates the Cabinet, which is the Executive branch of government and key decision-making forum, with members of coalition partners also represented. Government policy generally requires cross-party consensus.
As a member of the Organisation for Economic Co-operation and Development (OECD), New Zealand might be considered a “mid-range” economy in that gross domestic product (GDP) per capita was around US$ 30 000 (35 000 New Zealand dollars) (in 2012). This is somewhat below that of wealthier OECD countries. New Zealand’s capacity to fund public health care is constrained by this, as well as the various other factors that typically challenge policy-makers in the developed world.
Some background data on New Zealand are provided in Annex 1. New Zealand’s population of nearly 4.5 million is spread over two main islands and other outlying islands. A third of the population resides in Auckland – a city in the north of North Island. Around a quarter of the population lives on the larger South Island. Many smaller cities and towns are spread throughout the country. This creates challenges for health service planning and access. Average life expectancy in 2011 was 81.2 years (83 for females; 79.4 for males). Yet there remain considerable inequalities, with the life expectancies of the Māori and Pacific peoples up to a decade shorter than other New Zealanders and a higher incidence of various diseases (Tobias et al., 2009).
1.2 District Health BoardsIn 2013, total health expenditure was 10.2% of GDP placing New Zealand above the 2011 OECD average of 9.3% (New Zealand was 10.3 in 2011).
68
Government funding was around 83% of this. Public hospitals – which are free of patient charges and accessible to all permanent residents of New Zealand6 – dominate and provide all major trauma and acute services; with private hospitals providing only non-urgent and elective procedures. Public hospital employees, including all health-care professionals, are salaried, but around 40% of medical specialists work in dual practice meaning they also work in a private practice and hospital where income is fee-for-service and considerably higher than for comparable public work. Private hospitals function separately from the public sector, although many District Health Boards (DHBs) periodically contract with them, either to use their operating theatres to perform elective procedures using public hospital employees, or to undertake elective work on behalf of the public hospital. However, such arrangements are not part of the formal DHB plans. New Zealand’s private hospitals do not offer emergency and intensive care services meaning that, when there are complications, a patient will be transferred to public hospital. Private patients pay full cost, with many funded by private health insurance, which around one third of New Zealanders subscribe to. Patients often seek private care in order to avoid the waiting lists that characterize public hospitals, or to experience the more hotel-like private environment. A portion of private (and public) patients are funded by the Accident Compensation Corporation (ACC), which is a social insurance scheme funded by levies to pay for accident and injury victims.
In contrast with hospital care, primary medical care – which includes general practice, practice nurses and some associated services working together in small local practices – is largely provided privately. Most general practitioners (GPs) own their own practices. Their income, however, is a mix of government-funded capitation per patient enrolled, along with direct patient charges per consultation. Additional government funding is also provided for special services for patients with chronic diseases, to reduce access barriers for selected patients, and for health promotion. The
6 Non-residents are charged when hospitalized or treated at a public hospital emergency department. They also pay the full unsubsidized cost when visiting a GP or after-hours clinic.
Public hospital governance in New Zealand
69
ACC also subsidizes primary medical and other care for accident and injury patients.
2013 marked the 75th anniversary of the Social Security Act 1938, in which the foundations of the health system were created (Gauld, 2013). The Act was designed to establish welfare services for all New Zealanders. For health care this meant a “national health system” in which services were to be universally accessible, free from access barriers, focused on preventive rather than curative care, and fully integrated. A compromise between the Government and resistant medical profession at the time led to the arrangements outlined above – of dual medical practice, and largely public hospitals and private primary medical care retaining the right to directly charge patients, albeit with a government subsidy. These arrangements have meant different incentives in a health system with different service delivery compartments, but also that it has not been possible to deliver on the original 1938 goals outlined in the Act.
Over the years, the health system has undergone various restructurings, especially in the period from the late-1980s to 2000s (Gauld, 2012). The health-care delivery system today features 20 regional DHBs, enacted under the New Zealand Public Health and Disability Services Act 20007. Each DHB has the characteristics of an integrated local health system in that it is responsible for services for a defined population and geographical area: hospitals are one component of, and subsumed under, the DHB system and have limited autonomy. Most DHBs have a Chief Operating Officer or equivalent, who is effectively the hospital chief executive and sits on the executive leadership team. Direct governance is the responsibility of the hospital advisory committee of the DHB, discussed below. Hospitals themselves have a management team but, again, this group will have links with the broader DHB and local services that go beyond the hospital wall.
DHBs are individually governed by an 11-member Board, seven of whom are elected locally and four appointed by the Government including the
7 Legislative changes in 1992 saw funding and responsibility for the service needs of those with permanent disability moved into the health budget. Income support for such people continues to be provided via the social services portfolio.

70
Chair and Deputy Chair. These Boards are unusual in a democratic sense, in that they are accountable primarily to the Government rather than to electors (Gauld, 2010). A Board, therefore, oversees the development of a local plan for implementing government policy; it has limited capacity to voice concern about government policy, while potentially taking the blame for difficult decisions that may impact on the local population. A Board is subject to various levels of sanction, set out in the 2000 legislation, from the appointment of a Crown Monitor to work with an underperforming Board through to the dismissal of an entire Board and replacement by a Commissioner (Adam, 2003).
The DHB Board appoints the Chief Executive who, in turn, is responsible for all operational matters including all senior and other staff appointments, although many employment matters will be delegated to lower levels and handled by the Human Resources Department. DHBs and their hospitals have the autonomy to decide on the staffing mix, although there is a government-enforced cap on the number of people allocated to the non-clinical staff.
DHBs must plan for the health care needs of their populations. In this regard, they must conduct needs assessments and provide an appropriate range of services to meet these needs. They must also work within government policy, including delivering on government goals and targets and providing a prescribed set of services. DHBs own public hospitals which form part of their “provider arm” and purchase primary care, disability support, mental health provision, public health services and other community-based services from available and appropriate providers. Each DHB is required under legislation to have three sub-committees that govern different areas of activity: a public health committee; disability support services committee; and a hospital advisory committee8. Each of these committees features elected and appointed DHB members.
DHBs are funded by the Ministry of Health (MOH) and receive a fixed per annum allocation which they are expected to live within. Around two thirds of total DHB funding (NZ$ 14.665 billion in 2013–2014) is distributed
8 Several DHBs have combined these committees into one or two.

Public hospital governance in New Zealand
71
via a population-based formula, designed to reflect the needs of different population groups that reside in their respective catchment areas (Penno & Gauld, 2013). The composition of different DHB communities – some with older populations, others with more rural or Māori and Pacific peoples – means there is around a 25% difference in per capita funding between DHBs. This means that some DHBs seem to have greater difficulty in balancing their budgets than others, with the implication that some have more financial flexibility and capacity to invest in new service initiatives, while others are perpetually looking to curtail services and find efficiency gains. Those producing a deficit are doubly punished as they borrow from the government to fund a shortfall and pay interest on this. Producing a balanced budget and planning how they will deliver services within their funding allocation is, therefore, a key driver of DHB activity. The remainder of funding, outside the population-based formula, comes directly to DHBs from the Ministry for specific purchased services9. DHBs tend to fund their hospitals on a “production/volume” schedule, within a national pricing framework. This means that a global budget is allocated to the hospital with expectations that a certain level and scope of services will be provided and relative flexibility in terms of how expectations are met10.
DHBs perform their governance and service delivery roles within a complex administrative, financial and legislative context that requires interaction with, and pursuit of the goals of, a series of national agencies (see Box 1). This complexity, further described below, came about through the creation of 20 regional planning and purchasing systems in 2000; previously, there was a single national purchaser – the Health Funding Authority. In 2001, the Government of the day introduced Primary Health Organisations
9 This incorporates national services, including disability support services, public health services, some screening programmes, mental health services, elective services, Well Child and primary maternity services, Māori health services and postgraduate clinical education and training. In 2013–2014, some NZ$ 2.84 billion was directly allocated to such services. See http://www.health.govt.nz/new-zealand-health-system/funding (accessed October 2013).
10 Many DHBs previously operated a “price/volume” schedule, paying a fixed sum per procedure. This drove hospitals to increase services as they would receive less income if savings, perhaps in bed days through innovation, were made.

72
(PHOs) aimed at improving the organization primary care as well as service delivery. Initially, there were over 80 PHOs. Mergers required by the Government elected in 2008 mean there are presently around 30. In principle, DHBs and PHOs both serve important roles. In practice, the arrangements have embedded historic divides between primary and hospital service provision, and created convoluted and parallel planning processes and accountability arrangements that collide with present policy directions focused on regional planning and integration.
Box 1: Key organizations in New Zealand’s health system (2014)
National level:Pre-2008 and ongoing:
• Ministry of Health• Pharmac• National Health CommitteeNew since 2008:
• National Health Board (a business unit of the Ministry of Health)• Health IT Board• Health Workforce New Zealand• Capital Investment Committee• Health Quality and Safety Commission• Health Benefits Limited • Health Promotion Agency (since 2012)
Local level:• 20 DHBs with associated public hospitals• 32 PHOs• 12 regional Public Health Units• Other contracted health and disability support service providersNew since 2008:
• 9 pilot “better, sooner, more convenient” service delivery initiatives• Alliance Leadership Teams in each DHB (since 2013)

Public hospital governance in New Zealand
73
A new Government elected in 2008 launched a review of the health system resulting in a new strategic direction, while promising no major restructuring (Ministerial Review Group, 2009). Essentially, the Government is aiming to reduce duplication and fragmentation across the 20 regions, improve coordination and collaboration between regions, and drive improved performance in areas such as quality improvement, service integration, and patient access to services. It is also working to better coordinate health information technology (IT) and workforce planning – areas previously given inadequate national policy attention. This means new initiatives are being laid upon existing foundations, while these foundations (the DHBs) are being required to gradually coalesce. Lastly, the Government has emphasized “clinical governance and leadership” as pivotal to all planning and management activities (Ministerial Task Group on Clinical Leadership, 2009). This has meant a gradual increase in the number of health-care professionals sitting on boards of government agencies and collaborating with managers in their respective DHBs and other agencies.
1.3 Plans, policies and accountabilityIn line with the above, DHBs have several lines of vertical accountability upwards to the Government, as well as to their local communities. The MOH is the chief policy advisor to the Government, as well as DHB funder. It sets and monitors key goals for the health system, and oversees the sector on behalf of the Government. The Ministry also houses the National Health Board (NHB), which is its operational arm. The NHB therefore has responsibility for the performance of DHBs. The NHB’s Board reports directly to the Health Minister. Its business units include the Health IT Board (responsible for national coordination of health IT developments), Health Workforce New Zealand (charged with workforce planning and clinical training), and the Capital Investment Committee (which oversees capital investment planning in the DHB sector). The independent government-funded Health Quality and Safety Commission (HQSC) has responsibility for promoting patient safety and presides over a series of national programmes, from medications safety and falls prevention to the training of a series of DHB-based health-care professional “improvement champions”. Pharmac is the national drug-buying agency, which subsidizes community-prescribed medicines and purchases all DHB hospital-

74
prescribed drugs. The reconfigured National Health Committee is the Government’s health technology assessment advisor; while Health Benefits Limited’s aim is to look for back office DHB functions that may lead to savings when nationally provided for, such as the purchase of medical supplies. Finally, 12 regional public health units monitor and control disease outbreaks and other health risks; and, along with the newly created Health Promotion Agency, undertake health promotion activities.
This complex organizational system means there is a mix of plans and policies produced by the various agencies that DHBs need to respond to. For each DHB, the response is brought together in its Annual Plan which provides a detailed description of the challenges faced by the DHB, intentions for the year ahead, how it intends to configure and improve services, and milestones towards the achievement of particular goals. Each DHB’s Plan is unique to its circumstances, but produced with a relatively high level of MOH oversight and contains standard information expected by the Ministry. This includes the strategic priorities for the DHB as well as the “intervention logic” that underpins the planning process and, in turn, the DHB priorities (examples of these can be found in DHB Annual Plans which are published on their websites)11. DHBs with a history of poorer performance – especially financial but also managerial and organizational – are subject to considerably higher levels of scrutiny in a process that can take several weeks to reach agreement on. Final sign-off for Annual Plans is sought from the Minister of Health, who also outlines in a letter to the DHB specific expectations within the delivery of agreed goals. In this way, the Annual Plan is a key accountability document.
Legislative changes of 2010 increased horizontal accountability in requiring DHBs to plan regionally, especially for specialty services that are difficult to staff, but also to ensure that activities are coordinated in areas such as IT, strategy and service development. This has created considerable inter-regional activity, that four regional agencies assist with, and underpinned the merging of some DHB functions. Naturally, there are challenges associated with this, such as when DHBs have pre-existing arrangements
11 For example: http://www.southerndhb.govt.nz/pages/padocs/ (accessed September 2014).

Public hospital governance in New Zealand
75
in place that require adjustment in order to more closely interface with one another. An example is the five South Island DHBs, each of which has a different information system that needs to be adapted to deliver on shared goals.
The post-2008 National Party-led Government has also worked to implement its “better, sooner, more convenient” (BSMC) pre-election policy (Ryall, 2008). Two mechanisms have been pursued for this. First, the replacement of a series of DHB targets with six new Health Targets12. These are aimed specifically at improving hospital efficiency and service access, as well as increasing immunization rates and the provision of screening services. A crucial difference with the six targets is that they are publicly reported each quarter, designed for tracking progress over time and to reveal the performances of different DHBs. The targets are a key government accountability and performance monitoring device and have driven DHBs to focus much of their activity on the targeted areas.
Second, in 2010, the Government launched a series of nine pilot BSMC initiatives representing different locations and populations. For example, one features a group of Māori PHOs; another is based on the west coast of the South Island where there are substantial geographical challenges for providing service coverage (especially hospital and emergency services), high levels of deprivation, and difficulties retaining professional health workers; and a third works across the three DHBs in the greater Auckland metropolitan area which serve what is effectively a common population despite being separately funded and organized. The BSMC pilots are intended to stimulate new care delivery models, including the better integration of primary and hospital care; the provision of some specialist medical services in primary care settings; an expanded scope of GP services, along with advanced diagnostic capacity; the better use of allied health-care professionals (such as nurses with prescribing rights); and improved after-hours access for patients. The BSMCs all have the required “alliance” governance structure – a concept adapted from the construction
12 Information on the Targets can be found at: http://www.health.govt.nz/new-zealand-health-system/health-targets (accessed September 2014).
76
industry – that has a whole system focus. This sees the Alliance Leadership Team bringing together professionals from both DHB hospitals and PHOs, who pool resources from their respective organizations to develop services centred on what works best from the patient perspective. From mid-2013, the Government also required the development of an Alliance within each DHB, creating additional momentum for horizontal planning and service coordination.
To sum up, the various arrangements outlined in this case study mean there are multiple central government strategy documents that DHBs have to respond to, alongside meeting the specifications for providing health services. In researching this paper, at least 39 central agency policy documents requiring a DHB response were identified. These central-driven requirements are reflected at the local level in the range of DHB-specific documents. Of the five DHBs included in this study, one produced at least 13 such documents annually, as well as six reports on different components of performance. The others had a similarly diverse list. Added to the vertical requirements are the more recent horizontal planning documents and initiatives (South Island Alliance, 2012). Against this framework, DHBs have a reasonable level of autonomy in terms of how they configure services – so long as they deliver on core government policy requirements – meaning no two are alike. However, while there is reasonable control over the internal environment,the considerable external government-dictated factors have a bearing on DHB governance and planning.
The next section describes the five DHBs selected for the New Zealand case study.
2. Five District Health Boards: descriptions, strategies and performance
2.1 MethodologyThe five DHBs in Table 1 were selected based on various criteria: the representation of different regions of New Zealand, including urban and rural as well as North and South Islands; the socioeconomic status of the served population; and the author’s knowledge of the diverse management systems, strategies and challenges faced by each.
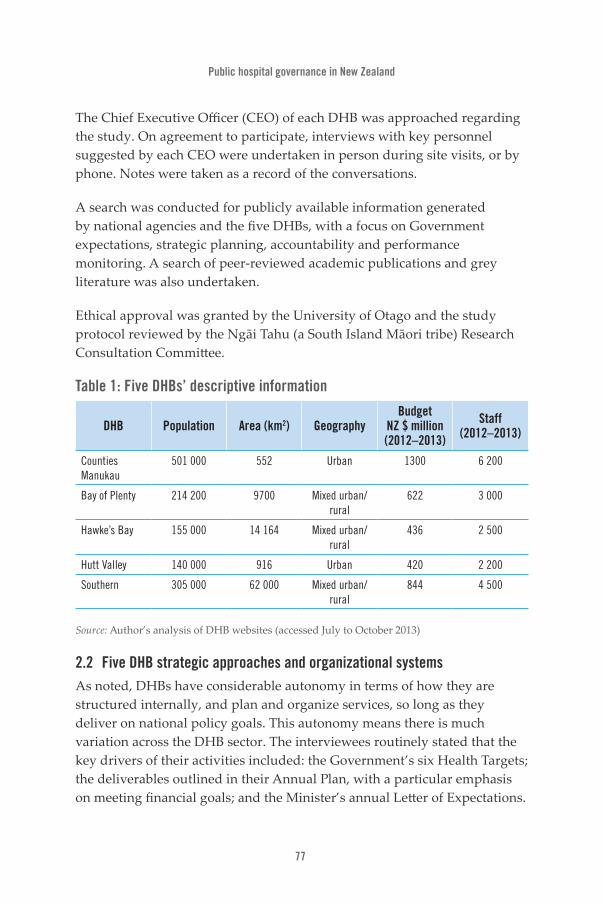
Public hospital governance in New Zealand
77
The Chief Executive Officer (CEO) of each DHB was approached regarding the study. On agreement to participate, interviews with key personnel suggested by each CEO were undertaken in person during site visits, or by phone. Notes were taken as a record of the conversations.
A search was conducted for publicly available information generated by national agencies and the five DHBs, with a focus on Government expectations, strategic planning, accountability and performance monitoring. A search of peer-reviewed academic publications and grey literature was also undertaken.
Ethical approval was granted by the University of Otago and the study protocol reviewed by the Ngāi Tahu (a South Island Māori tribe) Research Consultation Committee.
Table 1: Five DHBs’ descriptive information
DHB Population Area (km2) GeographyBudget
NZ $ million (2012–2013)
Staff (2012–2013)
Counties Manukau
501 000 552 Urban 1300 6 200
Bay of Plenty 214 200 9700 Mixed urban/rural
622 3 000
Hawke’s Bay 155 000 14 164 Mixed urban/rural
436 2 500
Hutt Valley 140 000 916 Urban 420 2 200
Southern 305 000 62 000 Mixed urban/rural
844 4 500
Source: Author’s analysis of DHB websites (accessed July to October 2013)
2.2 Five DHB strategic approaches and organizational systemsAs noted, DHBs have considerable autonomy in terms of how they are structured internally, and plan and organize services, so long as they deliver on national policy goals. This autonomy means there is much variation across the DHB sector. The interviewees routinely stated that the key drivers of their activities included: the Government’s six Health Targets; the deliverables outlined in their Annual Plan, with a particular emphasis on meeting financial goals; and the Minister’s annual Letter of Expectations.

78
Interviewees from all five DHBs noted that:
• there were a considerable number of centrally driven areas of compliance (driven by reporting requirements) and expected activity coming from the various agencies;
• there seemed to be an almost endless flow of documents and information coming from central agencies;
• some of this information was given limited attention, as DHBs were often already undertaking the activities listed;
• some central agencies and their work were more highly regarded than others; and
• central agencies sometimes showed a lack of leadership around issues facing DHBs, meaning DHBs had to develop their own responses. Examples included the regionalization process, subject of a 2013 Audit Office report (Office of the Auditor-General, 2013), health workforce planning, development of Alliance Leadership Teams, and topics such as water fluoridation.
The sections below describe the strategic directions and organization of the five DHBs, highlighting points of difference.
2.2.1 Counties Manukau
Counties Manukau (CM) is one of New Zealand’s largest DHBs and serves an urban area in South Auckland characterized by high levels of deprivation and higher than average Māori and Pacific populations. Its population is also younger than average. Middlemore Hospital in CM is a major academic tertiary medical centre, providing the full range of medical specialties. CM has a number of challenges for planning and pressures on hospital services driven by deprivation, living conditions and chronic diseases. Its response has been to focus on quality improvement in hospital and associated services, and to develop integrated community-based services. CM has an aim of being the best health-care system in Australasia by 2015, and is strongly focused on achieving this. It has used the title Counties Manukau Health to represent its whole system approach to planning and service delivery, bringing together resources from the hospital, PHO and others to
Public hospital governance in New Zealand
79
ensure that services are provided at an appropriate level and location with backup and support from other providers within CM and the wider region. In 2013, the CM Board approved a series of 12 system level measures, including a mix of process, quality of care and outcome indicators so it could benchmark its performance against these.
CM’s leadership model is similar to the four others discussed here in that there is a strong focus on clinical governance, with shared professional and managerial decision-making within service directorates.
In terms of quality improvement, CM has taken a number of steps. In 2010, it created Ko Awatea – an institute dedicated to promoting health- care innovation and improvement. This functions as a training centre for health-care professionals, hosts research groups, and is also home to multiple improvement advisors and campaigns. Ko Awatea is formally partnered with the Boston-based Institute for Healthcare Improvement (IHI) and has adopted several of its programmes, including use of the Triple Aim (Berwick et al., 2008) to underpin strategy development13. In addition, Ko Awatea runs various IHI training camps that are also open to staff from other DHBs. In some ways, Ko Awatea functions as a national quality improvement champion. At CM, it has presided over significant programmes, including a 20 000 days campaign aimed at saving this number of hospital-bed days over a year through better community care and patient safety. In 2013, CM announced that 23 000 days had been saved (Counties Manukau District Health Board, 2013). Other initiatives include a reduction of central-line associated blood stream infection rates by following standard procedures, as well as in-house clinical leadership development programmes and the organization of major conferences in partnership with IHI.
From 2012, as part of its strategy to reduce hospital pressure and improve population health, CM has reoriented service organization around four
13 The three foundations of the Triple Aim, used by most DHBs to guide their strategic planning, are to focus on: (1) improved quality, safety and experience of care; (2) improved health and equity for all populations; and (3) better value for public health system resources.

80
localities that represent different population groups in the district. The four localities are each based around a PHO, and are clinically led and structured as “alliances”. The aims are to integrate services for high-need populations – especially those with chronic diseases and other health risks; coordinate care in primary care settings; and link with other service providers including housing, welfare and various nongovernmental social service agencies. The strategy involves hospital and community-based health professionals working closely together to ensure their efforts are coordinated and directed at the right patients, sharing resources to do so. Where appropriate, hospital care is being devolved into PHO settings. In this way, the DHB is working to deliver on the Government’s BSMC policy, while pursuing its own goals of reducing hospital demand.
Regionally, CM collaborates through the Northern Regional Alliance – a regional shared services agency that works on behalf of two other Auckland DHBs and a fourth DHB that serves the region north of Auckland. These four DHBs have in common the use of IHI’s Triple Aim and a series of other initiatives designed to share service delivery and combine back-office functions.
2.2.2 Bay of Plenty
Bay of Plenty DHB (BOP) features two main hospitals, a major secondary hospital with some tertiary capacity in Tauranga, and a smaller hospital in Whakatane, around an hour’s drive away. With common leadership and management systems across the region, BOP operates a “one service, two sites” philosophy. The DHB also hosts a clinical school and pursues the Triple Aim.
BOP’s vision statement is “Healthy, Thriving Communities”. A focus for BOP in recent years has been on improving clinical leadership, patient flow and the allocation of resources in the hospital setting, as well as on promoting better community health. BOP features three PHOs, each representing quite different communities. For example, one is urban; another features high proportions of Māori living in rural areas with high health needs. The DHB and PHOs serve a population that has high levels of deprivation, concentrated particularly within the higher-than-average proportion of Māori. BOP also has an older than average population.

Public hospital governance in New Zealand
81
In terms of hospital services, the DHB has developed a Clinical Board, which represents a broad group of professionals along with management. It has oversight of the quality, clinical leadership and service organization activities and is chaired by the Chief Medical Officer (CMO). An aim has been to improve clinical–managerial collaboration and the development of a shared vision. Clinical Board activities include contributing to the development of the DHB’s “balanced scorecard”14, and driving improvements in theatre start times from 39% to 80% of operations starting on time. Leadership of clinical services is shared, with a nurse, doctor and administrator working in partnership with joint accountability for financial and clinical performance.
The DHB has developed an integrated operations centre which provides real-time centralized data on patient flow, bed occupancy and service demand. This permits whole hospital planning and has helped with the allocation of ward staff and rostering, as well as improving discharge planning and patient flow from the emergency department. Other initiatives include a Care Capacity and Demand Management Programme and use of Trendcare software, which assist with forecasting service demand and the creation of a “transit lounge” for patients requiring observation but not necessarily hospitalization. The DHB has placed considerable emphasis on quality improvement, using both Continuous Quality Improvement methods and criteria used for the United States Baldrige award for high-quality business15 to provide a focus.
In terms of working to better integrate care, induce behavioural changes amongst professionals, and reduce variations in clinical practice, the DHB has launched the Bay Navigator website which features clinical pathways to be used by primary and hospital-based professionals. As part of the regionalization programme, this will be integrated with the Map of
14 An example of a balanced scorecard can be found in: http://www.bopdhb.govt.nz/media/57376/bophac-open-agenda-020714.pdf (accessed September 2014).
15 The Baldrige criteria are: leadership; strategic planning; customer focus; measurement, analysis and knowledge management; workforce focus; and process management (for more information see: http://www.nist.gov/baldrige/publications/criteria.cfm).
82
Medicine pathways initiative facilitated for five Midlands DHBs by their shared services agency, Health Share Limited – meaning all five will use common clinical pathways. Finally, the DHB has issued a series of position statements spelling out its stance on various health risks, such as alcohol and tobacco, and health inequalities, along with its intent to reduce the burden of these risks by working with other agencies and the community.
Regionally, BOP collaborates through Health Share Limited with four other DHBs on issues and services that benefit from a regional approach. In 2012/13, such services included regional service planning and reporting; Clinical Service Network facilitation; the Maternity Quality and Safety regional programme; and Workforce Development support, featuring the Midland Training Network, regional clinical information systems development support, and the Midland Smokefree programme.
2.2.3 Hawkes Bay
Hawkes Bay DHB (HB) serves a mixed urban and rural population with high concentrations of deprivation, inequality and Māori people. Its vision is for “Excellent health services working in partnership to improve the health and wellbeing of our people and to reduce health inequalities within our community”.
The main Hastings Hospital in HB provides comprehensive secondary- level care and certain tertiary specialty services16. It is not uncommon for patients requiring advanced care to be transported to another DHB, such as Capital and Coast in Wellington, by ambulance or air. This means HB must pay the other DHB for services provided in a budgetary process known as “inter- district flows”, which creates challenges17. For example, HB is working to curtail such expenditure as it seeks to stay within budget and would prefer to employ fulltime clinical staff in areas such as vascular surgery. However, a stumbling block resulting from the regionalization
16 The secondary services are general medicine, general surgery, maternity and birthing services and paediatrics. There is some advanced (or tertiary) specialist capacity in certain areas, such as vascular surgery.
17 Inter-district flows are a considerable source of income and expenditure for most DHBs.
Public hospital governance in New Zealand
83
process is that DHBs will only support a certain number of vascular surgeons, raising questions about whether HB should have one. A lack of central guidelines in this area does not help the situation.
In common with other DHBs, the starting point for HB’s planning is the IHI Triple Aim. In mid-2014, HB will launch a comprehensive Quality Improvement and Patient Safety strategy aimed at promoting wellness in the community, improving peoples’ experience of health care, working with the community, and leadership and workforce development. There has been a strong focus in HB on clinical governance and leadership, with significant resources put into both restructuring the DHB in line with clinical governance principles as well as building a clinical leadership focus. Like other DHBs, HB has created a Clinical Council. However, in contrast with some DHBs, the Council has considerable powers including the capacity to veto planning and funding decisions. It also features strong primary care representation. These initiatives have breathed life into clinical leadership, with health professionals able to scrutinize and influence planning decisions leading to some important planning changes. For example, a significant proposed rebuild of a mental health facility was rejected by the Clinical Council due to the fact that its design had not taken account of the future model of care for patients with mental health needs. This model entailed less use of inpatient facilities and more community and outpatient services. The planning and funding department now has a seat on the Clinical Council and there is much closer involvement by health professionals in the planning and resource allocation processes. Leadership inside the hospital and across the wider DHB is, again, based on partnerships between professionals and administrators – from the Executive Team through to clinical service directorates.
To improve integration with primary care, the DHB was the first in New Zealand to appoint a Chief Medical Officer, Primary Care who sits on the Executive Leadership Team and, therefore, works closely with the CMO Hospital and other clinical and administrative leaders. From 2012, HB has invested additional resources in developing cross-sector service delivery approaches with the appointment of a General Manager, Integration. As with other DHBs, HB has also invested in the development of clinical pathways to support the integration process. At the time of writing, HB
84
was continuing to work through the requirement to develop an alliancing structure, given that it already had in place a whole system planning and service delivery strategy involving hospital-based, PHO and other professionals. It did not wish for an additional administrative structure.
2.2.4 HuttValley
Hutt Valley DHB (HV) is located in the greater Wellington urban area. Its population is characterized by high levels of inequality, deprivation and concentrations of Māori and Pacific peoples. The Hutt Hospital is a major trauma centre in HV that provides several tertiary-level services. More advanced services and support are provided by the Wellington Hospital, a half-hour drive away in the neighbouring Capital and Coast DHB region. HV is presently in considerable transition as a result of the regionalization. While it and the neighbouring Wairarapa DHB remain separate legal entities, they have effectively merged in a process that formally commenced in late 2012. Wairarapa is one of the smallest DHBs and HV long provided various services and support. There had previously been a joint Allied Health Director between the two DHBs.
The merger of Wairarapa and HV means two separate Boards remain but the management and clinical leadership systems have been brought together under a single CEO, Executive Leadership Team and “diamond” leadership structure in each clinical directorate that includes allied health, medical, nursing and administrative leaders working in partnership and reporting to a Hospital Manager in each of the two hospitals – Wairarapa and Hutt. In addition, the two DHBs are working closely with Capital and Coast on regional services integration. The surgery department is now common to all three DHBs, with other services set to follow. A Service Integration Development Unit is working to facilitate these activities.
At the Board level, there is considerable collaboration and cross-fertilization of ideas and initiatives, with common members from the three DHBs serving on Board sub-committees, and a common Board Chair of HV and Capital and Coast. There is also joined-up activity within various support services such as IT. These three DHBs, along with two others in the Central Region (including HB), are contributors to the Central Region Information Systems Plan which aims for a regional IT solution. Wairarapa was a pilot

Public hospital governance in New Zealand
85
BSMC site, so has an alliance structure in place. HV had a pre-existing Primary Secondary Strategy Group so the foundations for an alliance had been laid. A focus of these alliances has been the sustainability of primary care, and clinical pathways for specific illnesses such as respiratory conditions and cellulitis. A shared electronic care record has been a focus in the Wairarapa. HV has also introduced Māori Partnership Boards to facilitate activities to improve Māori health in the community.
HV has concentrated on system improvement at Hutt Hospital. The Triple Aim, again, underpins its planning, meaning the hospital is focused on what happens in the community with an aim of reducing admissions. The Hutt Emergency Department was a pilot site in the mid-2000s for the Optimizing the Patient Journey project, initiated by the Government’s Quality Improvement Committee (a precursor of the HQSC). This means it applied and continues to use lean methods to improve patient flows. Today, it has an integrated Operations Centre, with similarities to BOP’s. This provides centralized data on hospital activities via a series of dashboards, enabling patients to be tracked from the time they arrive at the Emergency Department. The system monitors how long they wait at various points in the service delivery process, where they are in the hospital at any point in time, and where beds in the hospital are free should a patient require admission. The aim is that the hospital functions in a conveyor belt fashion, and that professionals adjust their schedules (such as ward rounds) to ensure maximum bed utilization.
HV has developed a balanced scorecard for performance monitoring. Comparable with that of other DHBs, this includes a range of real-time data such as performance against the Health Targets, average length of stay, staff sick days, patient no-shows for outpatient appointments, elective procedures, readmissions, and so forth. HV interviewees noted that getting the measures right was not straightforward, especially around quality which is a key focus. Questions were raised by interviewees of how staff morale might be measured, given that this is a driver of high-quality service, and how integration might best be measured given the focus on this.

86
2.2.5 Southern
Southern DHB (SDHB) serves the largest geographical area of any DHB. SDHB features two main hospitals in Dunedin (home of the Dunedin School of Medicine, University of Otago) and Invercargill (also an Otago University teaching site but within a smaller city and hospital) some 2.5 hours’ drive away. Along with another Dunedin-based hospital and one in the resort of Queenstown, these hospitals are managed through SDHB’s provider arm. A series of smaller hospitals and health centres in towns around the region are managed by community-owned companies and trusts and deliver services on contract to the DHB.
SDHB was formed in 2010 as a result of a merger between the former Southland (Invercargill Hospital) and Otago (Dunedin Hospital) DHBs. The merger has proven challenging, partly due to the vast area the DHB covers, but has also meant bringing together the cultures of two different hospitals and developing common organizational systems. SDHB’s area also creates challenges in terms of access to specialist and diagnostic services for many living in outlying areas, as well as emergency services. The merger has brought with it the demand for a rural health strategy, under development at the time of writing. This is likely to involve a mix of facility and service redevelopment and telehealth (i.e. services delivered via video and other IT-enabled platforms).
SDHB has experienced sustained difficulties in delivering services within budget. Indeed, most years it faces a deficit meaning planned-for services, including forecast acute and emergency care, cannot be delivered within government funding. This means the DHB must borrow additional interest- bearing funds from the Government. Its financial situation is a key driver of planning and means there is limited scope for investing in new clinical or other services initiatives. It has also been a source of tension between the DHB and the Government. The financial situation means a Crown Monitor has been assigned to the DHB for several years to scrutinize aspects of finance and planning and report directly to the Minister of Health.
The merger, and focus on building common systems, means SDHB now has an Executive Leadership Team that draws administrative and clinical
Public hospital governance in New Zealand
87
leaders from both hospital sites, and common clinical services directorates. These are led by a triumvirate partnership structure including medical, nursing and administrative leaders, again drawn from both sites. While the SDHB has a CMO who is Invercargill-based, the Medical Director of Patient Services (effectively the CMO of Dunedin Hospital) is Dunedin-based. The SDHB Board is intended to provide members from across the region – at present, four of the seven elected members are selected by voters from the Otago region and three from Southland.
The core of the present SDHB strategy is expressed in its Southern Way statement, which aims for “Patients at the centre of everything we do, to create a high performing organisation with a focus on quality, become a single unified DHB, and provide financially and clinically sustainable services”. Guiding the quality improvement strategy is a variant of IHI’s Triple Aim contained in the DHB’s Performance Excellence and Quality Improvement Strategy. Known as the “fourfold” aim, this has the additional aim of building excellence in teaching and research, encapsulating the teaching component of its hospital and other services and medical school links. Finally, SDHB’s activities must align with those of the South Island Health Alliance which is coordinating regionalization activities and has produced a detailed plan for service development across the five South Island DHBs (South Island Alliance, 2012). This has implications in areas such as IT, where SDHB initiatives must align with directions in the South Island plan.
3. Performance measurement, monitoring and outcomesThe previous discussions imply a range of strategic policy that is being promoted by different central agencies which could be considered when seeking to measure the performance of the New Zealand health system, DHBs and their hospitals. Added to this, the five DHBs canvassed for this study have each developed their own measurement approaches. This section looks, first, at central government measurement of DHBs. Second, it discusses the DHBs’ approaches. Third, it considers other measurement initiatives and plans.
3.1 Government measurementAt the highest level, DHB hospital performance is measured by the six quarterly-reported Health Targets, although only some of these appear to be

88
specific to hospitals. Even those pertaining to elective medical procedures and emergency services require some joint planning with primary care if a DHB is to improve its performance. This aside, the targets provide a simple measure for assessing sector performance and stimulating competition amongst the DHBs.
Beyond the targets, measurement is more complex and there is no specific set of easily accessible indicators to track different dimensions of performance. Probably the best location for performance information is the MOH’s Annual Report to Parliament, which incorporates the Director- General’s report on the state of public health (Ministry of Health, 2013). The report is comprehensive and contains information on the financial performances of the DHBs. The 2013 report, for example, noted that eight DHBs performed poorly but collectively the DHBs’ financial performances improved against financial targets and they continued to reduce their deficits. The report notes that the Ministry and National Health Board work closely with those DHBs in difficult financial circumstances.
The Annual Report describes progress on multiple policies, such as developing integrated services or national approaches to health IT, providing useful information but limited easily accessible data for monitoring and tracking performance over time. It lists progress on many different health care issues, such as cardiovascular disease, diabetes and cancers, and features numerous tables and graphs on the burden of disease, comparative expenditure, inequalities, service access and so forth. Performance against various specific outputs and outcomes is described, such as ambulatory sensitive hospital admissions18 and improving survival after cancer or heart attack/stroke. Many of the data are placed in comparative international contexts, such as New Zealand being in the “best third” of OECD countries on an indicator (see Table 2, for example). However, the 260-page report means that gaining an overall picture of performance is an involved and challenging process.
The methods for collating and publicly reporting data have changed over time. For several years, the Ministry produced quarterly DHB Hospital
18 These are for conditions, such as asthma and diabetes, for which patients with appropriate primary health care access and a treatment plan should not be hospitalized.

Public hospital governance in New Zealand
89
Benchmark Information reports which provided a snapshot of the performance of each DHB (Ministry of Health, 2010). Included were a series of 15 quality and safety, efficiency and process, organizational health, and financial indicators used to rank and compare DHBs. These reports were discontinued in 2010, with emphasis placed on the six Health Targets, and the DHBs were expected to produce their own performance monitoring methods – discussed below. This means it is now difficult to obtain a clear picture of average length of stay (ALOS), for example, without going to each DHB19. Various routine data such as bed to population ratios, and staff to patient ratios are not necessarily collected by the DHBs or reported20; although the DHBs do collectively report some 23 process, cost and staffing indicators to DHB Shared Services which are not publicly available.
When it comes to quality and patient safety, the HQSC has worked to develop a set of simple measures and to support DHBs in their reporting in this area. In 2012, following public consultation, it released an initial set of quality and safety indicators. These provided an overall portrayal of New Zealand health care in an international context, as well as country-wide data on areas such as medical error, avoidable readmissions, cancelled surgeries, screening rates and some socioeconomic analyses (Health Quality and Safety Commission, 2012a). Where DHBs were ranked, these were anonymized. A key HQSC release is its annual Sentinel and Serious Events report, which lists, by DHB, the number of serious patient harms reported (Health Quality and Safety Commission, 2012b). In 2012, a series of four quality and safety markers was launched for falls, hand hygiene,
19 ALOS for all hospitals is expressed in the MOH’s 2013 Annual Report as having “…decreased overall since 2002. Total average length of stay decreased between 2002 and 2012, from 4.4 to 4.0 days. Average length of stay for surgical procedures decreased from 5.6 to 5.0 days, while for medical procedures it decreased from 3.8 to 3.5 days” (Ministry of Health, 2013, p. 227).
20 For example, the MOH was asked whether the following data were collected: “Basic indicators:a. Infrastructure: hospital bed population ratios, staff population ratio; doctor: nurse ratio, doctor/nurse bed ratio;b. Equity in utilization: outpatient and inpatient by wealth/income/expenditure quintiles;c. Throughput: outpatient visits and discharges per fulltime equivalent doctors/nurses”. The response (8 November 2013) was that this information is no longer collected.

90
perioperative harm and central-line associated bacteraemia21. These are reported by DHBs with the aim of improving compliance and in turn quality and cost savings, with indicators for these also reported. Initial components of an Atlas of Variation, derived from the United States’ Dartmouth Atlas, were released in 201222. HQSC is supporting DHBs in developing the Quality Accounts required of them from 2012/13, which detail how each approaches quality and safety, where improvements might be made, and results of efforts in this area (Health Quality and Safety Commission, 2012c). A final area of HQSC activity is its programme to support consumer engagement, a ministerial expectation of every DHB. In late 2013, it was announced that the HQSC would develop a measure of patient-reported care quality, probably along the lines of the United States Hospital Consumer Assessment of Healthcare Providers and Systems surveys23.
Table 2: 30-day in-hospital mortality rate after a heart attack or stroke, 2009
Event 30-day in-hospital case fatality rate per 100 patients OECD ranking
New Zealand OECD average
Heart attack (acute myocardial infarction)
3.2 5.4 Best third of OECD countries
Ischaemic stroke 5.4 5.2 Mid-third of OECD countries
Haemorrhagic stroke 21.1 19.0 Mid-third of OECD countries
Note: Rates are age–sex standardized to the OECD population (45+ years). Source: OECD, 2011, cited in Ministry of Health, 2013, p. 221.
21 For more information see:http://www.hqsc.govt.nz/our-programmes/health-quality-evaluation/projects/quality-and-safety-markers/ (accessed September 2014).
22 For more information see:http://www.hqsc.govt.nz/our-programmes/health-quality-evaluation/projects/atlas-of-healthcare-variation/(accessed September 2014).
23 For more information see:http://www.hqsc.govt.nz/our-programmes/consumer-engagement/work-streams/consumer-engagement/(accessed September 2014).

Public hospital governance in New Zealand
91
3.2 DHB-level measurementAs noted, each of the five DHBs has a bespoke “balanced scorecard” that enables performance to be tracked against benchmarks, but also reports a range of measures in its Annual Plan, Annual Report, planning and other documents. The scorecards contain a range of information, from staff absentee and turnover rates through to performance on the Health Targets, ALOS and hospital readmissions. CM is developing system level measures to drive improvement in agreed upon areas, with benchmarks set using a mix of national and international data. Data gathered during the 2012 Clinical Governance Assessment Project, and through interviews for this paper, suggests all 20 DHBs assess their own performance based on local clinical, executive team and Board preferences, with limited cross-fertilization of the measurement development process (Gauld & Horsburgh, 2012). However, DHBs are required to submit standard information to the MOH as per Table 3 below. The Crown funding agreement and indicators of DHB performance reports list progress on key deliverables that the DHB has contracted for with the Ministry. The Annual Plans of all DHBs describe how their priorities will be delivered against the key milestones (performance indicators) per quarter, each of which is used to hold the DHB to account for performance.
Table 3: DHB reporting to the Minister of Health
Reporting Frequency
Information requests Ad hoc
Financial reporting Monthly
National data collections Monthly
Risk reporting Quarterly
Health Target reporting Quarterly
Crown funding agreement non-financial reporting Quarterly
Indicators of DHB performance Quarterly
Annual Report and audited statements Annually
Source: Asia Pacific Observatory on Health Systems and Policies

92
3.3 Other initiatives and current plansVarious projects have sought to produce alternative approaches to measuring New Zealand’s health system and hospital performance. Most relevant to this paper is the Public Hospital Performance Project, led by a university research group. This drew on the National Minimum Data Set (NMDS) – a routine hospital discharge data set containing unique patient identifiers. The project developed around 180 indicators of hospital performance, showing varied performances by each hospital and over time. One journal article published from this project anonymously ranked DHB hospitals around aspects of equity, efficiency and effectiveness in care delivery (Davis et al., 2013). Other unpublished findings suggest that hospital performance improved by 3–5% in 2007–2009 as measured in three areas of efficiency: technology change; technical efficiency; and the allocation of staff and resources. Another project – illustrative of those using the NMDS – found Māori patients were 16% more likely to be readmitted to hospital or to die within 30 days of discharge (Rumball-Smith et al., 2013). A further project developed a balanced scorecard for the entire New Zealand health system, assessing performances against national and international benchmarks across 64 indicators in five categories: healthy lives; quality; access; efficiency; and equity. This gave an overall score of 71%, but a notably poor score of 57% for equity and 64% for access to health care (Gauld et al., 2011).
At the time of writing (November 2013), a government-commissioned working group had produced a draft Integrated Performance and Incentive Framework and invited public comment on this (IPIFEAG, 2013). Based on the Triple Aim and taking a whole system approach to health-care delivery, this detailed over 60 indicators intended to build joint accountability of hospital and primary care services. The package includes indicators for processes, quality of care, outcomes and resource utilization (such as staff ratios) and would see DHBs potentially scored on each indicator. Data for some indicators are available (such as ALOS); for others, data are either in need of work (polypharmacy in over-65-year-olds), or are not yet available (for example, patient-reported measures of care quality).

Public hospital governance in New Zealand
93
4. ConclusionThe health system and hospital governance in New Zealand exhibits characteristics that stem from historical developments as well as recent policy directions. These make for complexity but also permit considerable flexibility at the local level to pursue innovative service delivery solutions. Notably, hospital governance is devolved and has been for many decades under different organizational models (Laugesen & Gauld, 2012). However, it is also intertwined with other components of the local, regional and national health system, increasingly so since the 2000s with the creation of DHBs. Recent emphasis has been on closer links with primary care with the aims of reducing pressure on hospital services but also with a view to planning for projected increases in demand, driven by an ageing population and chronic diseases such as diabetes and heart disease.
The strengths of the New Zealand system are many and include the capacity to innovate locally, the focus on quality and process improvement, and the whole system approach to planning that sees hospitals as a part of the local system that must work in partnership with other community providers. The emphasis in recent years on performance improvement has stimulated activities in each of the five DHBs covered in this paper, particularly around quality and process improvement and involving health professionals in this. While the Health Targets have been a key driver of this, the focus on meeting goals has sometimes come at the expense of focusing on other process issues.
The challenges for the system, as outlined in this paper, would arguably be the complexity of coordinating multiple national agencies and accompanying policies and directives, regional planning arrangements and networks, and local DHBs, PHOs and other providers. These challenges provide a key lesson from New Zealand for other countries seeking to create autonomous integrated local health systems: that such a pursuit is multi-faceted and requires bringing together the parts of many complex adaptive systems (Timmins & Ham, 2013; Room, 2011). Another lesson may be that New Zealand has continued to layer new structures over existing ones. Those seeking to replicate New Zealand’s health system goals could look to a simpler central agency as well as local/regional structures.
One consequence of New Zealand’s complexity is that measurement of performance is similarly complicated. The six targets provide straightforward

94
insights but not a comprehensive description of performance. The proposed Integrated Performance and Incentive Framework should go some way towards addressing the shortcomings. A 2013 stock-take located some 300 unique health data sets, illustrating that New Zealand is awash with health data (Atalag et al., 2013). Yet these data have remained under-utilized. Various independent projects have worked to develop methods for performance analysis. More work is required in this area in order to better understand the performance and efficiency of different DHB hospitals and the New Zealand health system per se.
AcknowledgementsI am grateful to the five DHBs for providing information and for their participation in this project. My huge thanks go to the representatives of the DHBs for attending a meeting in Wellington at the Ministry of Health on 6 November 2013 to discuss a draft of this paper: Margie Apa, Director – Strategic Development, Counties Manukau DHB; Phil Cammish, CEO Bay of Plenty DHB; Kevin Snee, CEO, Hawke’s Bay DHB; David Tulloch, Chief Medical Officer, Southern DHB; and to Chai Chuah, Acting Director-General of Health, for hosting the meeting. Thanks also to Dr Brett Maclennan, Department of Preventive and Social Medicine, University of Otago, for assistance with the data collection.
ReferencesAdam B (2003). The challenges of running a District Health Board. In: Gauld R, editor. Continuity amid chaos: health care management and delivery in New Zealand. Dunedin: University of Otago Press.
Atalag K, Adler R, White C, Lovelock K, Gauld R, Gu H, et al. (2013). Value of New Zealand health data (VNZHD) project phase 1: final report. Wellington: New Zealand Trade and Enterprise.
Berwick DM, Nolan TW, Whittington J (2008). The triple aim: care, health, and cost. Health Aff (Millwood). 27(3):759–69.
Counties Manukau District Health Board (2013). 20,000 days campaign: from small revolutions to big change. Auckland: Ko Awatea and Counties Manukau DHB.

Public hospital governance in New Zealand
95
Davis P, Milne B, Parker K, Hider P, Lay-Yee R, Cumming J, et al. (2013). Efficiency, effectiveness, equity (E3).Evaluating hospital performance in three dimensions.Health Policy. 112:19–27.
Gauld R (2010). Are elected health boards an effective mechanism for public participation in health service governance? Health Expectations. 13:369–78.
Gauld R (2012). New Zealand’s post-2008 health system reforms: toward re-centralization of organizational arrangements. Health Policy. 106:110–13.
Gauld R (2013). Questions about New Zealand’s health system in 2013, its 75th anniversary year. N Z Med J. 126(1380):1–7.
Gauld R, Al-Wahaibi S, Chisholm J, Crabbe R, Kwon B, Oh T, et al. (2011). Scorecards for health system performance assessment: the New Zealand example. Health Policy. 103:200–8.
Gauld R, Horsburgh S (2012). Clinical governance assessment project: Final report on a national health professional survey and site visits to 19 New Zealand DHBs. Dunedin: Centre for Health Systems, University of Otago.
Health Quality and Safety Commission (2012a). Describing the quality of New Zealand’s health and disability services. Wellington.
Health Quality and Safety Commission (2012b). Making our hospitals safer – serious and sentinel events 2011/2012. Wellington.
Health Quality and Safety Commission (2012c). Quality accounts: a guidance manual for the New Zealand health and disability sector. Wellington.
Integrated Performance and Incentive Framework Expert Advisory Group (IPIFEAG) (2013). Integrated performance and incentive framework: description and outline of potential measures. 30 September. Wellington.
Laugesen M, Gauld R (2012). Democratic governance and health: hospitals, politics and health policy in New Zealand. Dunedin: Otago University Press.
Ministry of Health (2010). DHB hospital benchmark information. Wellington.
96
Ministry of Health (2013). Annual report for the year ended 30 June 2013 including the Director-General of Health’s annual report on the state of public health. Wellington.
Ministerial Review Group (2009). Meeting the challenge: enhancing sustainability and the patient and consumer experience within the current legislative framework for health and disability services in New Zealand. Wellington: Ministry of Health.
Ministerial Task Group on Clinical Leadership (2009). In good hands: transforming clinical governance in New Zealand. Wellington: Ministerial Task Group on Clinical Leadership.
Office of the Auditor-General (2013). Regional services planning in the health sector. Wellington.
Penno E, Gauld R (2013). How are New Zealand’s District Health Boards funded and does it matter if we can’t tell? N Z Med J. 126(1376):1–14.
Room G (2011). Complexity, institutions and public policy: agile decision-making in a turbulent world. Cheltenham: Edward Elgar.
Rumball-Smith J, Sarfati D, Hider P, Blakely T (2013). Ethnic disparities in the quality of hospital care in New Zealand, as measured by 30-day rate of unplanned readmission/death. In J Qual Health Care. 25(3):248–54.
Ryall T (2008). Better, sooner, more convenient: health discussion paper by the Hon. Tony Ryall MP. Wellington: National Party.
South Island Alliance (2012). South Island Regional Health Services Plan 2012–2013. Christchurch: South Island Alliance Programme Office.
Timmins N, Ham C (2013). The quest for integrated health and social care: a case study in Canterbury, New Zealand. London: The King’s Fund.
Tobias M, Blakely T, Matheson D (2009). Changing trends in indigenous inequalities in mortality: lessons from New Zealand. Int J Epidemiol. 38(6):1711–1722.

Public hospital governance in New Zealand
97
Annex 1: Background dataLand area 268 021 km2
Population 4.489 million (October 2013)
Ethnic composition 67% European; 15% Māori; 10% Asian; 7% Pacific peoples; 1% other
Capital city Wellington
Live births per woman 2.1
Infant mortality rate per 1000 live births 5.5
Life expectancy at birth (male/female) 79.4/83.0
Total health expenditure as % of GDP 10.3
Government expenditure as % of total health expenditure
82.7
Total health expenditure per capita (US$ PPP) 3182
Practising physicians per 1000 population 2.6
GDP: gross domestic product; PPP: purchasing power parity Source: Author’s analysis of latest available data from Statistics New Zealand and OECD

98
C. Public hospital governance in Viet NamA case study in two provinces Tran Thi Mai Oanh, Khuong Anh Tuan, Hoang Phuong, Nguyen Khanh Phuong, Ong The Due, Krishna Hort
Public hospital governance in Viet Nam
99
AbstractThe purpose of this study was to identify health policy reforms affecting public hospital governance introduced over the last ten years in Viet Nam, and how interactions between these reforms and governance have impacted performance in public hospitals.
The case study provides an overview of the Vietnamese health system, highlights relevant policy developments and identifies performance issues in relation to the function of hospitals within the system, using information from the Joint Annual Health Reviews (JAHR) of 2010, 2012 and 2013. This is supplemented with an in-depth study of six public hospitals in two of Viet Nam’s provinces: Quang Ninh (north) and Ho Chi Minh City (south). The study sample of six hospitals, included two hospitals from central, provincial, and district levels, respectively. Researchers conducted a document review and qualitative data collection to address the study questions. Documents reviewed included local policy and regulation documents as well as third-party country reports. Interviews with patients and providers, and focus groups, were the main data collection tools.
Viet Nam has predominantly public provision of hospital services, with only 7% of hospital beds contributed by the private sector. The government has been active in reforming the system, with a series of reforms since 1995 providing increasing autonomy to public hospitals, while introducing social health insurance and strengthening regulation in other areas of licensing and quality of care. Significant problems in the current system identified by JAHRs include: bypassing of lower-level hospitals and overloading of central and provincial hospitals, increasing total health expenditure, and persistently high levels of out-of-pocket expenditure for patients.
Study data reveals that health insurance payments and user fees are the dominant source of finance for public hospitals, and that central and provincial hospitals have more ability to increase their revenues. As a result, district hospitals face lower levels of funding and have difficulty attracting staff, contributing to poor quality services and bypassing. Despite nominally significant autonomy, hospitals need approval from local or central government bureaucracy for most human resource and investment decisions.

100
On the whole, changes in autonomy, finance and accountability pursuant to reforms have provided more autonomy for public hospitals in management of finance and investments in clinical services, but accountability, particularly for clinical quality and patient safety, is weak. Hospitals in urban environments have been able to take advantage of the reforms, while those at lower levels have been relatively disadvantaged. Further reforms in areas of payment mechanism and regulation of user fees are currently being developed to address these issues.

Public hospital governance in Viet Nam
101
Acronyms and abbreviationsGDP Gross domestic product
JAHR Joint Annual Health Review
JPG Joint Partnership Group
MOH Ministry of Health
MRI Magnetic resonance imager
PCP Provincial Centre for Preventive Medicine
PHB Provincial health bureau
PHD Provincial health department
VND Vietnamese dong (currency)
VSS Vietname Social Security

102
1. IntroductionThe study is one product of the multi-country study project of the Asia Pacific Observatory on Health Systems and Policies on hospital governance and performance to increase the understanding of how policy reforms are affecting the governance of public hospitals. This case study was conducted in six public hospitals spanning central, provincial and district levels. The objectives of this study are:
• to describe the policy context, policy developments and reforms concerning public hospital governance and performance in Viet Nam during the past 10 years;
• to assess public hospital governance and performance of selected public hospitals in Viet Nam; and
• to identify internal and external factors affecting hospital governance and performance and to understand their interactions.
2. MethodologyThe study uses two main sources of information:
• review of findings and recommendations from Joint Annual Health Reviews (JAHR), reported each year by the Ministry of Health and the Joint Partnership Group of development partners. Reports from 2010 to 2013 are the principal sources of information. The reports provide an annual update of key performance indicators, policy development, and an assessment of system performance.
• in-depth study of six hospitals, one each from the central, provincial and district levels, respectively in two provinces. This study reviewed financial and performance information from the annual hospital reports, and conducted interviews with hospital managers, providers and patients at each hospital site.
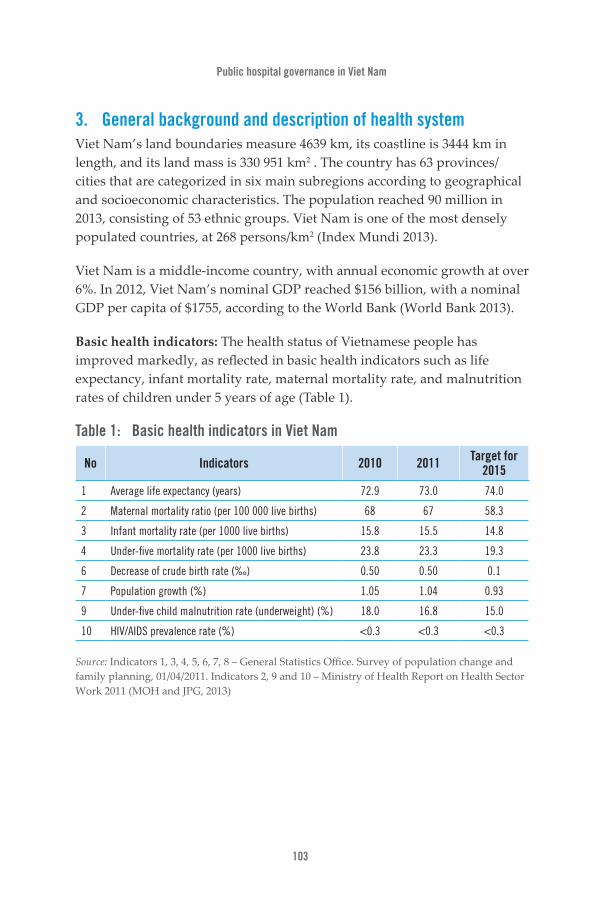
Public hospital governance in Viet Nam
103
3. General background and description of health systemViet Nam’s land boundaries measure 4639 km, its coastline is 3444 km in length, and its land mass is 330 951 km2 . The country has 63 provinces/cities that are categorized in six main subregions according to geographical and socioeconomic characteristics. The population reached 90 million in 2013, consisting of 53 ethnic groups. Viet Nam is one of the most densely populated countries, at 268 persons/km2 (Index Mundi 2013).
Viet Nam is a middle-income country, with annual economic growth at over 6%. In 2012, Viet Nam’s nominal GDP reached $156 billion, with a nominal GDP per capita of $1755, according to the World Bank (World Bank 2013).
Basic health indicators: The health status of Vietnamese people has improved markedly, as reflected in basic health indicators such as life expectancy, infant mortality rate, maternal mortality rate, and malnutrition rates of children under 5 years of age (Table 1).
Table 1: Basic health indicators in Viet Nam
No Indicators 2010 2011 Target for 2015
1 Average life expectancy (years) 72.9 73.0 74.0
2 Maternal mortality ratio (per 100 000 live births) 68 67 58.3
3 Infant mortality rate (per 1000 live births) 15.8 15.5 14.8
4 Under-five mortality rate (per 1000 live births) 23.8 23.3 19.3
6 Decrease of crude birth rate (‰) 0.50 0.50 0.1
7 Population growth (%) 1.05 1.04 0.93
9 Under-five child malnutrition rate (underweight) (%) 18.0 16.8 15.0
10 HIV/AIDS prevalence rate (%) <0.3 <0.3 <0.3
Source: Indicators 1, 3, 4, 5, 6, 7, 8 – General Statistics Office. Survey of population change and family planning, 01/04/2011. Indicators 2, 9 and 10 – Ministry of Health Report on Health Sector Work 2011 (MOH and JPG, 2013)
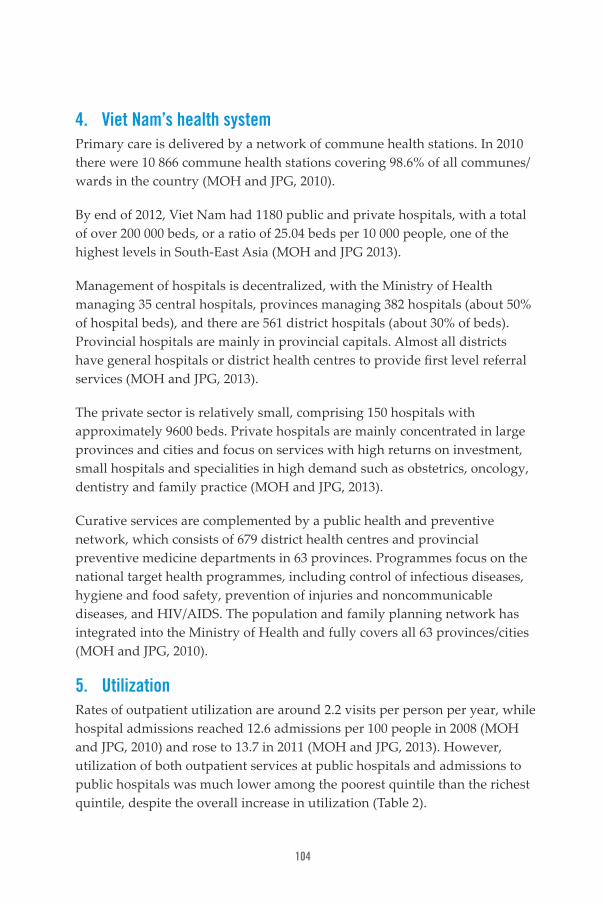
104
4. Viet Nam’s health systemPrimary care is delivered by a network of commune health stations. In 2010 there were 10 866 commune health stations covering 98.6% of all communes/wards in the country (MOH and JPG, 2010).
By end of 2012, Viet Nam had 1180 public and private hospitals, with a total of over 200 000 beds, or a ratio of 25.04 beds per 10 000 people, one of the highest levels in South-East Asia (MOH and JPG 2013).
Management of hospitals is decentralized, with the Ministry of Health managing 35 central hospitals, provinces managing 382 hospitals (about 50% of hospital beds), and there are 561 district hospitals (about 30% of beds). Provincial hospitals are mainly in provincial capitals. Almost all districts have general hospitals or district health centres to provide first level referral services (MOH and JPG, 2013).
The private sector is relatively small, comprising 150 hospitals with approximately 9600 beds. Private hospitals are mainly concentrated in large provinces and cities and focus on services with high returns on investment, small hospitals and specialities in high demand such as obstetrics, oncology, dentistry and family practice (MOH and JPG, 2013).
Curative services are complemented by a public health and preventive network, which consists of 679 district health centres and provincial preventive medicine departments in 63 provinces. Programmes focus on the national target health programmes, including control of infectious diseases, hygiene and food safety, prevention of injuries and noncommunicable diseases, and HIV/AIDS. The population and family planning network has integrated into the Ministry of Health and fully covers all 63 provinces/cities (MOH and JPG, 2010).
5. UtilizationRates of outpatient utilization are around 2.2 visits per person per year, while hospital admissions reached 12.6 admissions per 100 people in 2008 (MOH and JPG, 2010) and rose to 13.7 in 2011 (MOH and JPG, 2013). However, utilization of both outpatient services at public hospitals and admissions to public hospitals was much lower among the poorest quintile than the richest quintile, despite the overall increase in utilization (Table 2).

Public hospital governance in Viet Nam
105
Table 2: Utilization of hospital services by income quintile
Quintile Outpatient visits to public hospitals per 100 people in last 4 weeks
Public hospital admission per 100 people in last 12 months
Year 2004 2008 2004 2008
Poorest 10.6 16.4 5.4 5.9
Richest 53.9 63.3 10.0 9.1
Overall 26.0 35.7 7.8 7.3
Source: MOH and JPG, 2010
6. Health workforceViet Nam has a relatively high ratio of health workforce to population, with 7.5 doctors per 10 000 population in 2012, and 1.9 university-trained pharmacists per 10 000 in 2011. Increases have also occurred in the availability at commune level with 76% of commune health stations having doctors in 2012 (MOH and JPG, 2013).
However, the health workforce is not equally distributed, with a concentration of highly-qualified health workers at central level (14.5% of the workforce and 54% of the postgraduate-trained workforce), while 28% of the workforce work at district level, but only 5% of those with postgraduate qualifications. There continues to be a shift of health workers from public to private facilities, and from lower to higher level facilities (MOH and JPG, 2010).
7. Health financeTotal health expenditure as a proportion of GDP rose to 6.9% in 2010, up from 4.9% in 1998, with about 45% from public (government) expenditure, and the remaining 55% private. The majority of private expenditure is out of pocket, which made up 48% of total expenditure in 2010. The allocation of state budget for recurrent health expenditure was 8.3% in 2012, similar to the 8.1% in 2011 but much higher than 4.9% in 2008 (MOH and JPG, 2013).
While the share of out-of-pocket expenditure on private health services has fallen from 30% in 2001 to 22% in 2009, the proportion of payment for public sector services rose from 12% in 1998 to 44% in 2009, while the proportion spent on self-medication has fallen from 68% to 35% (MOH and JPG, 2013).
106
Viet Nam introduced a social health insurance programme to reimburse facilities for the cost of health care for the poor, commencing in 2004. The programme has progressively expanded and now covers the poor and children under six years of age, consuming 18% of the budget allocation for health. Health insurance covered 67% of the population in 2012, with high coverage among the poor and ethnic minorities, but less among children (81%), and the near poor (25%) despite a 50% government subsidy for premium payments by the near poor (MOH and JPG, 2013).
8. Hospital systemThe reforms of 1989, when Viet Nam switched from a central subsidy system to a market economic system, also led to significant reforms of the health system, which have continued since then.
The first change was the Law on Health Care for People (1989), which allowed Vietnamese people to seek health care services at any public health care facility without a referral document. Prior to this law, patients were entitled to all health care services free of charge, but they were not allowed to bypass to upper-level hospitals without referral documents.
In 1995, the government launched Resolution 90-CP about social mobilization for the health and education sectors, which allowed public institutions to obtain funding from other sectors and non-state sectors to contribute to investments for the health sector and health service provision. This policy was strengthened and specified by Decree 69/2008/ND-CP.
Decree 10/2002/ND-CP provided limited financial autonomy, allowing recovery of operating costs, reducing staff and increasing income (through payment of “additional salary” from surplus revenues) for workers. The extent of autonomy was subsequently extended through Decree 43/2006/ND-CP, which provided for autonomy and accountability in operations, organization, human resources and financing in all public services.According to this regulation, all public hospitals could be fully autonomous both in financial and human resources as well as other management/operational matters. In particular, hospitals were allowed to mobilize financial resources from different sources (private sector and public sector) and to make allocative decisions on which health services would be funded
Public hospital governance in Viet Nam
107
through different sources of revenues. Revenues could be allocated to supplement staff salaries, with limits on the amount of addition to basic salaries that could be provided.
The new policies and social mobilization within the health sector enabled public hospitals to achieve three levels of autonomy, namely: 1) self-financing institutions (those able to finance their entire operating costs); 2) partially self-financing institutions; and 3) institutions fully subsidized by the state budget (revenue covering less than 10% of total expenditure).
Currently, all public hospitals utilize three main types of payment methods: (i) fee-for-services; (ii) capitation (applied only in district hospitals for both in-patient and outpatient); and (iii) health insurance payment based on actual expenditure. Public hospitals may also raise investment capital from the private sector, and medical workers and other staff in the hospital are allowed to contribute to investments to procure medical equipment for the hospital (Circular 15/2007/TT-BYT) (MOH and JPG, 2010).
The government has also introduced financial protection for the poor through social health insurance, commencing with Decree 139 in 2002, and expanded with Decree 63 on Health Insurance Regulations in 2006, and the Law on Health Insurance in 2008 (MOH and JPG, 2010). Government subsidies cover the cost of premiums for the poor, ethnic minorities, and children under six years, as well as certain other groups (disabled, widows, veterans); while other members make a full or partial contribution (MOH and JPG, 2013).
Reforms to payment mechanisms under the insurance scheme are progressively being introduced, with a shift to capitation-based payments for first point of contact services (Circular 09/2009/TTLT-BYTG-BTC). By 2011, 52% of district facilities were using capitation, as were 14% of provincial facilities. Case-mix payments for hospitals are being piloted (MOH and JPG, 2012).
To assign clear functions to each level of the system, the Ministry of Health has issued a referral guide (the list of services and the level of medical facility that should be capable of performing those services) since 2005 (Ministry of Health Decision 23/2005/QD-BYT), and is drafting a revised

108
referral guide that is being updated in line with developments in the sector (MOH and JPG, 2010).
The Law on Examination and Treatment (40/2009) introduced requirements for practice licenses for practitioners and operating licences for facilities, and proposed quality management standards and procedures (MOH and JPG, 2012).
The Government has also introduced various measures to strengthen district health services, including the use of government bonds to upgrade district-level facilities, reaching 91% of district hospitals by 2011 (MOH and JPG, 2012), and Ministry of Health Decision 1816/QĐ-BYT on rotating health workers from higher-level facilities to lower-level facilities to improve the quality of medical examination and treatment services. Additional salary supplements for health workers in remote locations have been provided under Decree 56/2011/ND-CP (MOH and JPG, 2012).
9. Hospital system performance: key issuesIn some regards, the hospital system is performing well, with increases in consultations and admissions each year (up 6.8% and 6.0% respectively between 2011 and 2012), and a reduction in average length of stay to 7.0 days overall, and 8.3 days at central level (MOH and JPG, 2013).
9.1 Bypass of lower-level facilities and overcrowding at central level According to the Law on Health Insurance, patients are entitled to receive medical services at any health care facility without restrictions related to administratively-set geographic boundaries or the technical level of the facility. This allows bypass of lower-level facilities and direct self-referral to higher-level facilities and especially central facilities, resulting in under-utilization of district hospitals and overcrowding at central hospitals (MOH and JPG, 2013).
Overall, public hospital bed occupancy decreased slightly from 100.5% to 99.4% in 2012, but the rate at central level was still 112.5%. Overcrowding in tertiary hospitals remains a key issue. Major referral hospitals such as the
Public hospital governance in Viet Nam
109
National Hospital of Pediatrics, Ho Chi Minh City Oncology Hospital, Cho Ray Hospital, Pediatrics Hospitals 1 and 2 in Ho Chi Minh City and Central Obstetrics Hospital have occupancy rates over 120%. At district level, occupancy rates average 60%.
A study in 2008 (HSPI 2008) found bed occupancy rates of between 132% and 200% among central hospitals in 2007. The study noted that 48% of patients attending central hospitals were from other provinces, but only 18% were at the correct level of care. Over 50% could be treated at lower levels.
The main causes identified were:
• the weak capacity of lower-level hospitals (particularly district hospitals) to provide services and the inability of these hospitals to attract patients (district hospitals are able to provide about 70% of the total services that they are supposed to);
• the financial mechanisms and payment methods do not support and encourage lower-level hospitals to provide better quality services, as their cheaper prices negatively affect the quality of services, lower-level hospitals have cheaper prices to draw patients away from more expensive upper-level hospitals offering the same services). Moreover, the benefit packages do not incentivize patients to seek treatment at lower-level hospitals;
• public hospitals are autonomous. Thus, they try to attract and retain patients. Upper-level hospitals have a better capacity to attract patients; and
• the referral system is weak and the health service provision network lacks a “gatekeeper”.
9.2 Licensing/service provision/qualityCurrently, public hospitals are categorized by level of care, with a list of technical services that the hospitals in a particular grouping have to provide. In addition, public hospitals are also categorized by hospital grade

110
I, grade II or grade III, according to the list and the kind of services that they can provide based on their professional capacity. The technical lists for hospitals at different levels and grades are regulated by Circular 43/2013/TT-BYT, Ministry of Health.
Few hospitals have established quality systems. Only 9% of hospitals currently have quality plans: 29% of grade 1 hospitals, 12% of grade 2 hospitals and 2% of grade 3 hospitals. Only 5% of hospitals have projects or programmes for quality improvement [121] (MOH and JPG, 2013).
The Law on Medical Services (2009) mentions the licensing and accreditation of all public and private health facilities, but there is no official system or organization for accreditation of public hospitals as yet. On the other hand, there was no official or national set of indicators for quality assurance at the time of the study and no official model of quality management was found among the six hospitals studied.
9.3 Health workforceThe major problem identified in relation to workforce is the continuing inequitable distribution of health workers, and the difficulty that mountainous, isolated and remote areas have in attracting staff (MOH and JPG, 2010).
There are two laws that relate to human resource management in hospitals, and specifically the recruitment and use of health staff and health managers in public hospitals: the Labor Law and the Law on Public Officers and Employees.
The Labor Law governs the rights of hospital managers in using and contracting health staff, while the Law on Public Officers and Employees regulates the recruitment and promotion of health staff and health managers in state organizations. The other regulations that also affect the management of the health workforce and relate to the competency of health professionals are Circular 41/2011/TT-BYT of the Ministry of Health, regarding the conditions for professional practice licensing, and Circular 22/2013/TT-BYT, Ministry of Health, which specifies the continuous/in-service training required for health professionals in health facilities.

Public hospital governance in Viet Nam
111
The other policy being implemented creates the mechanism for health professional rotation in order to support and strengthen capacity for health care facilities at lower levels (Decision 1816/2008/QĐ-BYT of the Ministry of Health). According to this policy document, doctors at upper-level hospitals have to complete rotations in lower-level hospitals for a minimum of 3–6 months to give technical transfer, training, or to help lower-level hospitals provide assigned services that they had not been able to provide.
9.4 Increasing total expenditure on health and persistently high out-of-pocket expenditure
Total health spending increased at an average rate of 9.8% over the period 1998–2008, higher than the average GDP growth of 7.2%. Viet Nam’s GDP share of 6.9% is higher than many neighbouring countries (MOH and JPG, 2010). The share of government budget allocated to health has also increased from 4.8% in 2002 to 10.2% in 2008 (MOH and JPG, 2010). However, the proportion of out-of-pocket expenditure remains high, at around 55%, despite increased expenditure on social health insurance. It was estimated that 30% of people with health insurance for the poor still faced catastrophic health expenditure (exceeding 10% of non-food expenditure) (MOH and JPG, 2010). A major driver of this increasing expenditure is increasing medical costs. Costs of an outpatient visit increased 2.3 to 3 times between 2005 and 2008, and the average inpatient admission cost doubled (MOH and JPG, 2010). Factors identified include increased use of laboratory tests and diagnostic imaging, and more use of medication.
10. Impacts of reformsThe Joint Annual Health Review of 2010 reports that, in general, the revenues of hospitals have increased considerably in the past few years, especially hospitals that have a high degree of autonomy. The increase is primarily from user fee revenues and health insurance reimbursements. Of total revenues, service revenues account for the biggest share in almost all hospitals (96.8% in completely autonomous hospitals; 72% in central hospitals; 81.7% in provincial hospitals; and 59.4% in district hospitals). The share of total hospital expenditures spent on medical inputs (including drugs, chemicals, blood, medical consummables, and spending on other

112
professional activities, administrative costs and maintenance) varied between 46% and 66% (2008). The share spent on human resources varied between 22% and 45%. The share spent on drugs was very high, while controls on supply and use of drugs faced many difficulties (MOH and JPG, 2010).
A study of the impacts of autonomy (MOH 2011) noted the following.
• Significant growth in total hospital revenues, including Government budget, health insurance payments, and user charges. Between 2005 and 2008, hospital revenues multiplied by 1.8 in fully autonomous hospitals, by 3 in centrally managed hospitals, by 2.9 in provincial level hospitals, and by 2.5 in district-level hospitals. Most growth came from increased social health insurance payments, as the share of Government budget for recurrent expenditures decreased 2.5 to 2.7-fold.
• Increased capital investment in hospitals, particularly in medical equipment. Between 2005 and 2008, the range of health care services expanded 25% in fully autonomous hospitals, 17% in centrally-managed hospitals, 14% in provincial hospitals, and 16% in district hospitals. During the same time period the number of hospital consultations and admissions increased 1.3–1.5 fold, and 1.2–1.4 fold, respectively.
• Substantial growth in incomes of public hospital medical staff. The average additional income per hospital staff member was higher than the monthly salary in most hospitals, but varied from 2.3 times monthly salary in fully autonomous hospitals, to 1.3 times in centrally-managed hospitals, 1.4 times in provincial hospitals, and half the monthly salary in district hospitals.
The JAHR of 2013 provided the following assessment of the results of strengthening financial autonomy in health facilities according to Decree No. 43/2006/ND-CP:
Assessment has identified some fundamental weaknesses and unexpected results related to irrational delivery and use of health care services. The current mechanism of linking revenues of health facilities and

Public hospital governance in Viet Nam
113
supplementary income of health workers to facility performance provides insufficient motivation for health facilities and health workers at the grassroots level to increase provision of basic health services, especially in the preventive care sector or to improve Quality of Care. Health facilities have to generate revenues in order to pay their workers supplementary income. These arrangements are only really effective in socioeconomically affluent areas, in the curative care sector and specialties that are more marketable. The financial autonomy and social mobilization mechanisms lead to increased inequality because they have little effect on the incomes and remuneration package for health workers in socioeconomically disadvantaged areas or those providing services with little revenue generation potential (MOH and JPG 2013).
The same report also noted that:
“…there is widespread acknowledgement of the existence of inappropriate use of medicines, lab tests and medical services resulting in unnecessary health spending such as using innovator brands instead of generic medicines, overuse of drugs, overprovision of antibiotics, lab tests and diagnostic imaging, and rejection of the validity of lab test results and diagnoses across medical facilities. Fee-for-service payments are still widely used while there is not yet an efficient mechanism for management of quantity and prices of medical services and medicines, which leads to an unavoidable increase in health care costs (MOH and JPG, 2013, page 27).”
The in-depth case studies explore the current situation and responses to these reforms in the six selected hospitals.

114
11. Findings: case study hospital experiencesSelection of hospitals and site of study: Due to time constraints and limited financial resources, only two provinces were selected – one province in the north and one province in the central or in the southern region. Additional selection criteria included that each province must have central hospitals (of which at least one fully autonomous hospital)24, and that the tentatively selected hospitals in each province (of which one central, one provincial, and one district hospital) should be performing well.
Therefore, according to the selection criteria, in each province, three hospitals were selected for the investigation. In total, six hospitals were selected, including two central hospitals, two provincial hospitals, and two district hospitals. Among the six selected hospitals, only Cho Ray Hospital is fully financially autonomous; the other hospitals are partially autonomous (Box 1). Some general information about the hospitals studied is included in Table 3.
Box 1: Selected hospitals in the case study
Level of care Ho Chi Minh City Quang Ninh
Central hospital Cho Ray Uong Bi
Provincial hospital Nguyen Tri Phuong Quang Ninh
District hospital Thu Duc Dong Trieu
24 According to the current regulations, “Fully autonomous” means that the hospital is “fully autonomous in hospital financing”, not fully autonomous for human resources.

Public hospital governance in Viet Nam
115
Table 3: Descriptive and performance information on selected hospitals
Central Hospital Provincial Hospital District Hospital
Cho Ray Uong BiNguyen
Tri Phuong
Quang Ninh Thu Duc Dong
Trieu
Level of autonomy Full Partial Partial Partial Partial Partial
Number of beds
Number of planned beds 1800 750 700 700 500 210
Number of actual beds 2445 793 894 800 504 243
Volume of patients
Number of patient visits 1 197 134 199 935 401 392 289 926 747 428 107 777
Number of inpatients 123 015 40 463 44 716 34 097 43 216 13 036
Occupancy rate of planned beds
139% 91% 117% 100% 104% 123%
Occupancy rate of actual beds
102% 86% 91% 88% 103% 106%
Human resources
Number of doctors 698 162 245 146 228 36
Number of nurses 1483 294 498 288 369 63
Hospital finance (VND 1 000 000 000)
Total hospital revenues 2299.11 235.04 306.56 201.24 250.29 45.70
In which: 0 51.54 51.10 53.81 27.30 17.12
Recurrent state budget 0% 21.9% 16.7% 26.7% 10.9% 37.5%
1124.01 94.9 108.0 84.05 121.49 22.58
Health insurance 51.8% 40.4% 35.2% 41.8% 48.5% 49.4%
1044.46 83.69 97.26 46.16 93.34 5.03
Hospital user fee 48.2% 35.6% 31.7% 22.9% 37.3% 11.0%
Source: Annual hospital reports, administrative data

116
11.1 FinanceAccording to Decree 43/2006/QD-CP, all public hospitals have autonomy in hospital financing, including budget motivation, reallocation within the hospital, and proactive hospital expenditure. However, in terms of budget reallocation within the hospital, all six hospitals reported that they still encounter common challenges, including:
• the difficulty in balancing hospital revenues and expenditure due to gradual reductions in state budget and limited revenue from service provision; and
• the Ministries of Health and Finance require state budget expenditure on several specific activities and items, thus limiting hospital autonomy with regard to budget allocation, and in particular expenditure on infrastructure, medical equipment maintenance, salaries, and incentives.
Hospitals’ capacities to reallocate their budgets vary. Central hospitals reported that having greater capacity to expand service provision (like Cho Ray Hospital) can gain greater revenues from fees for services and health insurance; thus, these hospitals only face difficulties in budget allocation for infrastructure, medical equipment maintenance, and reallocating revenues (25% from interest) in order to increase salary for health staff. However, in poorer rural areas, district hospitals with partial autonomy (such as Uong Bi District Hospital and Dong Trieu District Hospital in Quang Ninh Province) reported that they were limited in the extent to which they can proactively use their budgets for hospital development.
11.2 Health insurance income Payments from health insurance are provided as fee-for-service (with service caps) or capitation (mainly for district hospitals). Four of the six hospitals studied (Cho Ray Hospital, Nguyen Tri Phuong Hospital, Uong Bi Hospital and Quang Ninh General Hospital in Quang Ninh, and Thu Duc District Hospital in Ho Chi Minh City) use the fee-for-service payment method for insured patients with level 2 payment cap. Only one district hospital (Dong Trieu) uses the capitation payment method for

Public hospital governance in Viet Nam
117
insured patients (including inpatients, outpatients, and referral patients). In addition to fee-for-service, Uong Bi Hospital and Quang Ninh General Hospital also apply the capitation payment mechanism for those who register for primary care at these hospitals.
The case studies show that most hospitals exceed the cap on insurance payments, and are owed money by the social insurance agency (Viet Nam Social Security – VSS). For example, in 2012, Uong Bi Hospital’s payment cap and fund exceeded VND 18 billion and VND 4 billion, respectively. Quang Ninh General Hospital’s fund exceeded VND 13 billion. Dong Trieu District Hospital’s fund exceeded VND 7.8 billion, while Nguyen Tri Phuong Hospital’s payment cap exceeded VND 4 billion. Cho Ray Hospital’s fund exceeded VND 5 billion for three quarters in 2013, and is predicted to exceed VND 25 billion; and Thu Duc Hospital’s payment cap exceeded VND 27.7 billion.
A major factor causing hospitals to exceed the cap is the bypass of patients directly attending central hospitals. Whenever insured patients bypass or are referred to upper-level hospitals, the costs of treatment for that patient in the upper-level hospital will be charged to the health insurance budget of the lower hospital, according to the health insurance regulation.
VSS has not reimbursed most hospitals exceeding the level 2 payment cap because VSS need approvals from the National Assembly prior to making any excess payments. Uong Bi Hospital, Quang Ninh General Hospital and Dong Trieu District Hospital were partially reimbursed; however, VSS still owes large sums of funds to the studied hospitals (i.e. VND 5 billion to Cho Ray Hospital, VND 4 billion to Uong Bi hospital, and VND 8 billion to Quang Ninh General Hospital).
The incomplete reimbursement by VSS since 2012 has caused many difficulties for hospitals’ spending. Hospitals have debts to pharmaceutical companies or must reduce the salary bonuses paid to staff. To resolve the funding deficits, hospitals reduce referrals and self-referrals, and attract patients by improving clinical quality and expanding the types of services. As a result, some hospitals have an increasing number of patients; the rate of referrals to higher levels has been reduced significantly.

118
11.3 User feesAccording to current regulations (Circular 04/2012/TTLT-BYT-BTC regarding the ceiling price for health services applied in public hospital), public hospitals are not allowed to set their own clinical service prices because the Ministries of Health and Finance have devised a list with price ranges for each health care service. Based on this national list, each province must develop its own health service price list with relevance to the local socioeconomic situation. In practice, all four hospitals at the provincial and district levels review the list approved in the previous year by the Provincial People’s Committee annually, then propose the same or a revised price list (some new services or procedures can be added). They must then submit the new list to the Provincial Health Bureau (PHB). This list is used as a reference together with those of other hospitals in the province to rebuild the common price list for that province.
This common list must then be submitted to the Provincial People’s Committee for approval.
The two central hospitals also build their own price lists based on the national price list before submitting them to the Ministry of Health for approval. However, hospitals are able to set their own prices for such non-clinical services as sanitation, food, and provision of special foods according to current local market prices.
All hospitals included in this study complained about the inappropriately low prices on the current service price list. Because the set prices may not cover the true costs of services, hospitals may face deficits if they do not provide a certain number of supplementary services. The lower-level hospitals also voiced similar complaints that the prices set for provincial and district hospitals are significantly lower than those set for upper-level hospitals for the same clinical services. These low prices provide no incentive for lower-level hospitals to provide the given services or provide support for hospitals to develop further services.
11.4 Services for the poorAll of the investigated public hospitals must serve all patients, including poor or very poor patients, even if they are unable to pay for health services. Normally, all the poor are provided with health insurance from

Public hospital governance in Viet Nam
119
the government; however, a number of people either do not possess a health insurance card or have a card with incorrect information, posing many difficulties for hospitals attempting to serve poor patients. The main reason for this implementation gap is that the current regulations do not specify the mechanism for budget allocation to provide free services to poor patients who are not covered by health insurance. To solve this problem, hospitals must set up their own procedures to identify poor patients unable to pay for services. Hospitals must also make their own decisions to use a portion of their own budget savings to support such patients. According to the hospitals included in this study, every year, hospitals must support the poor through the hospital’s savings that should actually be allocated for salaries or reinvestment, while the state budget does not provide any support for this expense.
11.5 WorkforceThis study found that most hospitals, including fully autonomous or partly autonomous hospitals, have independence in the recruitment and contracting of health staff for hospitals.
However, this independence is limited to contract staff. According to the Labor Law and Law on Public Officers and Employees, public hospitals do not have full autonomy to recruit health professionals as permanent staff, including government staff.
Permanent staff are recruited by the Provincial Health Department (PHD) and the hospital itself recruits contracted staff paid from the hospital revenue (Dong Trieu District Hospital). For permanent staff, public hospitals have to set up human resource plans according to the local government’s quota on human resources, and gain approval from the relevant Provincial Health Bureau. Within the hospitals, the director or the management board can make decisions on reallocating health staff or recruiting contracted health staff according to requirements, while the heads of departments may only propose the need for staff.
The Provincial Health Department proposes its staff plan, while the Directorate conducts the recruitment. The hospital has an annual staff recruitment plan but we don’t know the actual recruitment process. Staff in their probationary period are assigned to each department. Departments

120
propose only the number of staff they need but are not involved in the recruitment process (Focus group discussion among leaders of district hospital departments).
However, to terminate the employment of permanent and long-term health staff, all hospitals must also comply with the Labor Law and Law on Public Officers and Employees, and must gain the approval of the authority with direct responsibility for the administration of the hospital. Similarly, for promotions of hospital managers (director, vice director), the hospital follows a long procedure to acquire approval from local authorities (provincial dept. of human resources, Provincial People’s Committee, and Provincial Health Bureau) or the Ministry of Health.
Due to their limited autonomy with regard to human resources, all public hospitals have faced many difficulties and complications in proactively recruiting health professionals, particularly highly skilled health professionals and some specialists for the provision of services expected and needed.
11.6 Appointment of hospital directors or vice directorsAccording to current regulations, in the public sector, the director/vice director or manager of a hospital belongs to a government office, so hospital themselves cannot hire or remove such staff. However, the director can promote or remove lower-level managers within the hospital. In practice, the local authority that directly manages the hospital (Provincial People’s Committee or Provincial Health Bureau) decides and approves hospital director appointees. The approved hospital director can be from either the hospital or another health facility.
11.7 Rewards and sanctionsBecause all public hospitals are autonomous, especially in terms of financing, each has a document called “Internal regulation for expenses” that contains very strict mechanisms regarding the reward and sanction conditions for hospital staff. The reward and sanction of health staff is mainly based on their performance. In general, none of the six hospitals have much difficulty in rewarding and sanctioning staff.
Public hospital governance in Viet Nam
121
As stipulated in the regulations, salary bonuses can be provided up to a maximum of three times the basic salary for fully autonomous hospitals and twice the salary for partially autonomous hospitals. However, most hospitals have not reached these target levels; the bonuses given by the studied hospitals only range from 0.6 to 1.5 times the basic salary. Although hospitals aim to increase bonuses every year, some hospitals have cut bonuses for half of the hospital staff in recent years (i.e. Cho Ray Hospital, a fully autonomous hospital since 2012). Setting coefficients for bonuses is based on criteria from the internal expenditure regulations, which mainly consider the performance efficiency of teams and individuals, attitudes towards colleagues, and the working hours of each individual.
In addition to income from salary and allowances from the hospital’s operating surplus, the hospital may arrange extra income for staff from other non-clinical services, such as restaurant services (food shop), motorcar parking, etc. However, despite these efforts, many staff complain about the low level of income. Most participants said that although hospitals contribute to improving the spiritual and material well-being of staff, the current incomes do not. The income gap within hospitals (e.g. among positions and among departments, such as internal medicine and surgery departments) and among different levels and regions to which hospitals belong also leads to “brain drain” problems inside the country, whereby health staff move from public hospitals to private hospitals or from rural areas to urban areas.
Participants in the process of discussion, priority-setting, and decision- making around salary and incentives include the hospital directorate, leaders of different departments, the chief accountant, and the trade union. The review of salary and incentives of each staff member is done by a council with the involvement of representatives of the hospital’s directorate, representatives of accountants, and the hospital trade union. The additional salaries and incentives/bonuses derived from the hospital’s savings is public to all hospital staff through the Hospital’s Internal Expenditure Regulation. All staff have their own job descriptions. This is one of bases on which the Council can decide salaries, incentives, and bonuses for staff.

122
11.8 Infrastructure and capital investmentAll six hospitals face difficulties in maintaining or improving hospital infrastructure and equipment. The main issues mentioned were:
• infrastructure not aligned to the requirements for health service provision;
• lack of budget and mechanism for reallocating budget to the maintenance and repair of infrastructure and medical equipment; and
• lack of medical equipment, or equipment not aligned with requirements for services.
Regarding other non-medical infrastructure and equipment, not all hospitals are fully equipped with waste management, water, heating, AC, power supply, and oxygen centres.
11.9 Capital investmentAccording to Decree 69/2008/NDD-CP regarding social mobilization policy and the Circular 15/2007/TT-BYT, which guides implementation of joint venture non-state sector investments in public hospitals, public hospitals can formulate plans for expanding services, investment in infrastructure, or new equipment procurement based on their own situations. However, in practice, all public hospitals, including fully autonomous hospitals such as Cho Ray Hospital, must still seek approval of their investment plans from the Ministry of Health or the Provincial Health Bureau, and the local People’s Committee. For example, in order to purchase an MRI machine through funds from the local government or social-mobilization joint ventures, provincial hospitals must develop a proposal for investment and then submit their plans to the Provincial Health Bureau. If the Provincial Health Bureau agrees with the proposal, the hospital should submit the proposal to the Provincial People’s Committee for final review. For simpler kinds of service or services that require less sophisticated medical equipment, hospitals can make their own decisions.
However, the volume of capital investment from non-state partners varies among the six hospitals and depends on the hospitals’ capacity to provide services and the outsider partners’ forecast of the benefits they will gain
Public hospital governance in Viet Nam
123
from their investments. The capacity of lower-level hospitals, such as the two district hospitals included in this study, to attract capital investment is very limited. For these hospitals, capital investment is used only for pre-clinical service tests such as blood test equipment and ultrasound machines. In contrast, in central or provincial hospitals, capital investments are used for broader services and constitute a bigger slice of the budget. In addition, central hospitals such as Cho Ray Hospital are able to draw their budget from several sources, including not only non-state sector actors and partners, but also low-interest bank loans facilitated by the local government’s support of the hospital.
11.10 Assets leasing/salesAll hospitals included in this case study also have limited authority over asset lease. The extent of such autonomy depends on the kind of asset. The most common assets leased are infrastructure or free land that hospitals are not using for providing services. Hospitals can lease these assets for private or public use through canteens or restaurants for patients and health staff, or mini shops, in order to get more revenue for the hospital.
11.11 Priority-setting and decision-making in hospital equipment procurement and expansion of technical activities
For the hospital itself, a decision on equipment investment or professional expansion always requires establishment of a committee. Membership of such a committee consists of the directorate, leaders of administrative and technical departments and representatives of the hospital’s different organizations (party, trade union, youth union, etc.). In addition, before buying new equipment or expanding professional activities, all hospitals consult with national or even international experts on the equipment’s characteristics, its investment efficiency; the same applies for professional activities (Cho Ray Hospital is a case in point). All equipment procurement processes and professional expansion activities are conducted according to the direction and regulations issued by the Government and the Ministry of Health in response to the health care needs of the people.
11.12 ProcurementAutonomy with regard to drugs and supplies varies among hospitals according to their level of care and province. All the hospitals included in

124
the study are required to follow the national regulations, including the list of essential drugs and regulations for drug bidding.
Both of the central hospitals (Cho Ray and Uong Bi), are under direct administration of the Ministry of Health, so they can make their own decisions regarding drug procurement and supplies. In contrast, the provincial and district hospitals in both Ho Chi Minh City and Quang Ninh Province do not have the right to make these decisions themselves. Depending on the regulations issued by the local government, the organization responsible for making decisions regarding drug bidding can be either the Provincial Health Bureau or the Provincial General Hospital. However, all drug bidding processes have to comply with the Bidding Law and Circular 10/2007/TTLT-BYT-BTC (being replaced by Circular 01/2013/TTLT-BYT-BTC).
The challenges faced by the six hospitals included in this study are mainly related to the implementation of current regulations for drug procurement, including:
• Lack of clarity and consistency between regulatory documents in terms of guidelines and list of drugs. According to the regulations, all drugs included in the bidding should be listed by their generic names, but in practice, the same drugs are listed by different brand name and trade names, each with different prices, qualities, and suppliers. These branded drugs are thus included in the drug lists for hospital use. This complicates hospital processes, particularly health professionals’ decision-making regarding drug prescriptions.
• The specific drug bidding lists set for distinct types of hospitals (levels of care, as well as specialties covered, etc.) are often inappropriate. The drug list does not coincide with the list of services provided at lower- level hospitals. This discrepancy limits hospitals’ capacity to both provide services that they are capable of delivering and attract patients to use their services. For instance, the district hospital may have health professionals and medical equipment available to treat different stages of hypertension, but the drug required to treat the third stage of

Public hospital governance in Viet Nam
125
hypertension is excluded from the drug list assigned for hospitals at this level. As a result, district hospitals must refer such patients to upper-level hospitals.
• All six public hospitals often encounter drug shortages at certain times due to supplier delays.
11.13 Service mix and qualityCurrently, public hospitals are required to provide the services according to their level and category within the health system. According to the functions assigned for each hospital, hospitals in higher levels or in higher grades must provide a higher number of services with more specialized techniques. However, not all hospitals can provide all of the services in the list as assigned by regulation (Ministry of Health Decision 23/2005/QD-BYT).
Of the hospitals in our study, Cho Ray and Uong Bi are central hospitals that provide the most advanced services, but the hospitals at the provincial and district level are able to provide about 80% of the services in the list assigned to their hospital level or grade.
For example, Quang Ninh General Hospital is able to conduct 85% of the total of medical services that it should. District hospitals only have the ability to provide about 75–85% of their assigned service list. This is mainly due to: (i) lack of medical equipment (Quang Ninh still lacks 30% of the medical equipment listed for grade II hospitals); (ii) lack of health professionals, particularly specialists and (iii) the provider payment mechanism and service price list, which do not support or encourage district hospitals to provide services.
On the other hand, lower-level hospitals can provide all of the services assigned, but they can also provide a number of high-tech services that are assigned to upper-level hospitals or higher-grade hospitals, as there is no policy or mechanism to ensure compliance with the functions that are assigned to each level of hospital.
Upper-level hospitals are also responsible for providing technical support and assistance for lower-level hospitals in case of emergency and medical consultation. Decision 1816 by the Ministry of Health requires rotation of health staff from upper-level hospitals to lower-level hospitals for technical
126
support and transfer from the upper to lower hospitals in order to help increase their capacity to increase quantity and quality of services. However, the six hospitals studied currently all face difficulties in this activity due to the limited budget for implementation of technical support activities.
11.14 Enforcement of safety and quality standards None of the six public hospitals included in the study were required to be licensed or accredited, as the procedures have yet to be stipulated. To supervise the quality of professional practice, all six hospitals also established professional councils, which are medical councils that have responsibility for auditing and supervision of professional practice via review of medical records and prescriptions. They include a technical council, a drug council, a science council and a patient council. These councils’ regular activities assist other departments in technical aspects when they have problems and develop new techniques. The technical councils of hospitals are also involved in treatment at different levels. Most respondents agree that these councils work effectively and enable hospitals to ensure their technical quality. However, in practice, the effectiveness of their activities is very limited and not clearly reflective of the quality and safety of treatments due to potentially irrelevant quality measurement tools.
The main constraint to safety assurance faced by all hospitals included in this study is the absence of treatment guidelines for the application of quality management for medical procedures. The lack of relevant tools to supervise and manage the quality of services in the hospital, both in terms of hospital management and local health administration, is another constraint.
11.15 Clinical management systemsAmong the six hospitals, only Uong Bi applied a model clinical management system. This hospital inherited the system from the Viet Nam– Sweden cooperation project many years ago and this system has been retained. Recently, this hospital developed and applied 150 intensive care procedures. The other hospitals in the study provide very few intensive care procedures in intensive care units, operation rooms, and procedure rooms.
In terms of protection against clinical accidents and security for health staff, all six hospitals have applied some measures including organizing safeguards.
Public hospital governance in Viet Nam
127
11.16 Continuous quality improvementUong Bi Hospital has also applied the process of continuous quality management since the Viet Nam–Sweden cooperation project. However, the hospital faces difficulties in maintaining this process. Among the other five hospitals, there is no official model or process of continuous quality improvement.
11.17 Clinical knowledge and skills of medical, nursing, and support staffThe extent of the clinical knowledge and skills of medical, nursing, and support staff among the six hospitals decreases down the hierarchy from central to district hospitals. The two central hospitals (Cho Ray and Uong Bi) have many advantages in the development of capacity for both clinical and technical staff, as both hospitals are teaching hospitals. In addition, they also have more capacity for professional peer reviews, and more opportunity for medical practice and new knowledge absorption. Thus, the professional staff in these two hospitals have greater professional knowledge and skills.
The four lower-level hospitals (provincial and district) face many difficulties in assuring the professional competence of their health staff, particularly for specialist doctors and district hospitals. The following factors often cause inefficiency in health service provision:
• ineffective service training and continuous education even though the ministry has issued regulations for obligatory continuous training of health staff (Circular 07/2008/TT-BYT, replaced by Circular 22/2013/TT-BYT); and
• reluctance of lower-level hospitals to send doctors and skilled health staff for additional training due to health workforce shortages.
11.18 Citizen/patient involvementFindings from the study of six hospitals are that most hospitals do not include organizations and individuals outside the hospital or patients’ representatives in decision-making on hospital direction or policies. The hospital’s leaders manage all of the hospital’s work and activities. Since the enforcement of the social mobilization and hospital autonomy policy, private partners (individuals or organizations) can be involved in some of

128
the hospital’s social mobilization activities approved by the Ministry of Health or the Provincial Health Bureau as joint venture activities. However, private partners only participate in the initial stage of negotiation on profit-sharing in the contracting process; the entire equipment operation as well as tracking of financial revenues and expenditures is undertaken by the hospital. The partners also undertake the training of staff in operating equipment and the regular or irregular servicing of equipment at the hospital’s request.
11.19 Consumer satisfaction/voice and complaints mechanismsAll hospitals included in this study have established a mechanism for collecting complaints and feedback from patients and their relatives, consistent with national regulations. The model includes:
• a patient council, which is a temporary unit that consists of representatives for patients during hospitalization. The council has one meeting per week to relay their complaints and comments to the hospital (often to the chief nurse and planning department of the hospital); and
• a 24/7 hotline and comment box, which, according to current regulations, must be publicly announced and described so that every patient and consumer understands that he or she can receive and make phone calls if he or she has any comments or complaints. However, the mechanisms to receive and synthesize feedback, and the use of this information to improve the performance of hospitals, are still very limited and differ among hospitals. Outside of hospitals, there is no organization that routinely conducts surveys for patient satisfaction.
11.20 Management decision-making
Leadership skills and behaviourIn the six public hospitals, the director, vice director, and other administrative departments all have backgrounds as medical doctors or pharmacists. They have not undertaken formal courses in hospital management, but have participated in short courses organized by the Ministry of Health or other institution. In the interviews, they complained

Public hospital governance in Viet Nam
129
about their limited abilities in hospital management and their need for more training. The hospital leaders also undertake clinical work, and often have to perform operations on patients.
Professionalized managementAll six hospitals currently apply some form of professional management guidelines according to the Ministry’s “Hospital regulation,” which specifies the process and steps that every hospital must follow to control and ensure the quality of many hospital activities and services, including medical record management, professional practice, and patient feedback. However, according to the information from the focus group of hospital managers and health staff from six hospitals, adherence to this regulation document is not easy to measure, monitor or evaluate. Thus, each hospital has designed its own model of professional management based on the common regulations; however, the models are not consistent across hospitals. In addition, this document has not been updated since 1997 and needs to be revised.
Strategic direction/vision and quality and use of informationAll six hospitals have developed five-year strategic plans and annual action plans with clear objectives and target indicators. The activity of developing strategic and action plans is a routine mission that all public hospitals have to follow. Most of the typical hospital issues and activities are mentioned in the action plan, including clinical and non-clinical activities, human resources, hospital financing, issues of salaries and benefits, and incentives for health staff. The strategic and action plan is developed based on information synthesized from the plan proposed by each department within the hospital and other data and information related to the hospital’s situation. However, interviews show that the methods used to identify problems and set priorities and objectives still lack rational use of data analysis both for data from hospitals as well as data for the local action plan for socioeconomic development.
In the action plan, the issues of monitoring and evaluation are not highlighted, and the persons or organizations responsible are unclear. In addition, the indicators and tools for monitoring and evaluation are also not listed or mentioned in the plan.

130
All hospitals have applied information technology fully in hospital management with a local area network (LAN) and management software, although they have not yet implemented electronic medical records. However, the management software used differs among hospitals and comes from different software companies, not from the Ministry of Health. These differences may complicate the adoption of a routine reporting system as well as a consistent health insurance management system.
Most respondents said that in the process of developing their hospital’s investment plan, relevant information is regularly and publicly shared with all hospital staff through the annual or biannual staff meeting. The hospital’s financial statement or report, in which all concerns are clearly explained, is also transparently publicized.
All hospital staff can join or participate in giving comments on hospital development investment through monthly meetings. At the same time, hospitals have a LAN where information is regularly updated. Through these channels, hospital staff also have opportunities to learn and share information with each other.
11.21 Accountability
Supervisory structure (capacity, role, function, independence)Central hospitals (Uong Bi and Cho Ray) are under the direct management of the Ministry of Health in terms of professional and financial issues. These hospitals are also under the management of the Provincial Health Department in terms of epidemic prevention and staff assignment for prevention initiatives. Furthermore, these hospitals simultaneously send reports to the Ministry and PHD.
Provincial hospitals are under the direct management of the Provincial Health Bureau for professional and financial issues. These hospitals are also under the management and supervision of the Provincial People’s Committee.
District hospitals (Thu Duc and Dong Trieu) are under the direct management of the Provincial Health Bureau for professional issues. Regarding financial management, including investments in infrastructure, both district hospitals are managed by the District People’s Committee’s
Public hospital governance in Viet Nam
131
Finance Department. These two hospitals have to submit regular reports, including quarterly and annual reports as well as irregular reports, to PHD and related agencies.
Not all studied hospitals have a Stewardship Council, but all do have steering committees in some specific activities such as social mobilization and joint ventures. These committees includes representatives of hospital leaders, hospital parties, trade unions, and leaders of functional and professional departments.
11.22 Reporting on performance domainsIn terms of professional issues (clinical activities), hospitals at the central level have to report their activities directly to the Ministry of Health. Provincial hospitals have to report direct to Provincial Health Departments as well as the Provincial Center for Preventive Medicine (PCPs) for epidemic cases or for cases that have any signs of abnormality; district hospitals have to report to Provincial Health Departments and the District Health Unit (belonging to the District People’s Committee) when required.
In terms of finance, central hospitals have to report directly to the Ministry about health insurance, by directly sharing their reports for Viet Nam Social Security; provincial hospitals have to report to PHD, Provincial Social Security and the Provincial Department of Planning on Basic Construction. District hospitals have to report to PHDs or District Financial Departments, Provincial Social Security or District Social Security.
Hospitals have to submit reports monthly, quarterly, and annually. Hospitals also have to submit reports on request to the Ministry of Health, PHDs, Provincial People’s Committee, and District People’s Committees (e.g. when auditors visit the committees). Inside the hospitals, there are semi-annual review meetings and final meetings for reviewing hospital performance and planning for following years. Therefore, hospitals’ activities as well as financial performance are transparent to all staff and financial reports are publicly shared at congresses of officials and workers.
Output/volume targets and information/reportingAs mentioned above, a clear list of indicators and data are collected, reported, and synthesized to monitor the output volume and targets of

132
hospitals quarterly, semi-annually and yearly according to Ministry of Health regulations. The reporting is not only for the health sector but also for the local government, which receives a more brief and focused summary. All hospitals must report the outputs of clinical activities, finances and human resources by separate reports linked with overall information related to hospital performance. However, the absence of a mechanism for checking the accuracy of data and information, as well as feedback from upper-level organizations is a primary weakness. Another constraint is that the reporting form and method to categorize the reported data/information sometimes differs among departments and divisions. These discrepancies make it difficult for hospitals to collect and synthesize the data and information, leading to inaccuracy of information. In addition, the utilization of data and information related to outputs and targets is very limited in terms of making local health sector plans.
12. Conclusions12.1 Managers’ authorityIn general, with the policy of hospital autonomy and social mobilization, public hospitals have more independence in decision-making, but mainly in governing their finances and expanding their clinical services and expertise. Public hospitals can be proactive in reallocating their budgets to invest in their priority activities. They also have the right to raise funds from outside sources or coordinate joint ventures with the private sector to invest in both clinical services and non-clinical services in the hospital. Public hospitals are still limited in their autonomy over human resource management focusing on long-term and short-term health staffing, particularly in the recruitment and firing of permanent staff.
12.2 Accountability Regarding accountability mechanisms, financing and human resources for reporting information regarding output and volume targets are reasonable. All hospitals lack mechanisms to ensure the participation of health staff/labour in setting priorities, strategies and annual plans, as well as investments for hospital development.

Public hospital governance in Viet Nam
133
The accountability related to the participation of other outside stakeholders in hospital performance is very weak, with no strong mechanism that allows other stakeholders to contribute to the hospital’s process of decision- making.
With regard to performance accountability, hospital accountability for the clinical quality and patient safety is weak.
12.3 Incentives in operationThe current provider payment mechanisms of health insurance do not strongly help and encourage public hospitals to provide services, particularly for district hospitals. Provincial and district hospitals have difficulty in balancing their budgets. The lower-level hospitals have less capacity to maintain surpluses; therefore, hospitals at the district level have many difficulties in hospital reinvestment as well as in rewarding health staff and improving their salaries. Thus, the provider payment mechanism should be changed and revised to encourage hospitals to produce better services.
12.4 Management capacity Hospital management capabilities have improved in recent years, both in upper-level and lower-level hospitals. Public hospitals have better capacity to make strategic and action plans for hospital development, are more proactive in decision-making for investment in expanded services and are optimizing their resources and budgets. However, the major constraints are: leadership skills, and management capacity for quality management and patient safety in hospitals.
Hospital management training programmes should be introduced in training institutions and mechanisms for management training should also be created. Quality management, quality improvement programmes and patient safety measures should be developed and implemented in hospitals.
12.5 Technical capacityProvincial and district hospitals are not able to provide the full list of services expected, due to a lack of medical equipment; limitations of

134
health professionals both in the number of doctors and the capacity of doctors, which are exacerbated by the ineffectiveness of in-service training and continuous education. In addition, inappropriate provider payment mechanisms do not encourage hospitals to produce services.
12.6 Current policy responsesFurther reforms recently introduced by the Government of Viet Nam include Decree 85/2012/ND-CP on the operating and financial mechanism in state health service facilities and medical service prices in state medical facilities; and the Prime Minister’s project to reduce hospital overcrowding.
Decree 85, issued on 15 October 2012, replaces Decree 95/CP/1994 on partial user fees and stipulates in great detail the operational and financial mechanism and medical service prices in state medical facilities, which are classified into four groups based on the degree of financial autonomy of the facility. With regard to the operating mechanism, besides regulations on development of service provision plans and organization of health personnel, Decree 85 has an article regulating joint ventures and business partnerships, specifically stating, “capital contributions and mobilization, and joint ventures must be accounted for independently or an independent accounting unit must be set up”. In terms of the financial mechanism, the Decree separates the financial mechanism for development investment spending from that for recurrent spending. With regard to prices of medical services, Decree 85 stipulates implementation of the roadmap towards appropriate and adequate calculation of user fee by 2018 and stipulates gradual inclusion of salary and wages in medical service prices (MOH and JPG, 2013).
The JAHR 2013 comments that “Obviously, Decree 85 has created a fundamental change in the operating and financial mechanisms of state health facilities. Implementation of Decree 85 will certainly promote further implementation of hospital autonomy and strengthen social mobilization for health care services” (MOH and JPG, 2013).
The project to reduce hospital overcrowding for the period 2013–2020 approved by the Prime Minister in Decision 92/QD-TTg dated 9 January 2013 has the immediate goal of reducing overcrowding in

Public hospital governance in Viet Nam
135
oncology, surgery/trauma, cardiology, obstetrics and pediatric specialties in a number of tertiary hospitals in Hanoi and Ho Chi Minh City. It has the complementary objective of improving the quality of medical services in district and provincial hospitals where bed occupancy rates are low, raising the rates to 60% by 2015 and 80% by 2020. Following approval of that policy, the Ministry of Health has approved the Project on Satellite Hospitals in Decision 774/QD-BYT dated 11 March 2013 and has set up a network of 50 satellite hospitals linked to 14 hub hospitals and added 7150 beds for the five overcrowded specialties above (MOH and JPG, 2013).
While there are clearly problems with the current health policy settings in Viet Nam, this study demonstrates the wide-ranging nature of policy reform in Viet Nam and the continuous development and adjustment in response to changing circumstances that have characterized the last two decades of the country’s health sector.

136
ReferencesHealth Strategy and Policy Institute (HSPI)(2008). Assessment of hospital overload at some hospitals in Hanoi and Ho Chi Minh cities and recommended solutions. Ministry of Health, Hanoi. http://en.hspi.org.vn/velen/Hospital-overload-in-Hanoi-and-Ho-Chi-Minh-City--An-assesssment-and-recommendations-t15973-1043.html (accessed 30 August 2014).
Index mundi (2013). Viet Nam country information. http://www.indexmundi.com/vietnam/#Introduction (accessed 30 August 2014).
Ministry of Health (2011). Lessons for hospital autonomy implementation in Viet Nam from international experience. Policy Note. July 2011, Ministry of Health and World Bank Office, Viet Nam. http://go.worldbank.org/5T10YQ51E0 (accessed 30 August 2014).
Ministry of Health and Joint Partnership Group (2010). Joint Annual Health Review 2010. Viet Nam’s health system on the threshold of the Five-year Plan 2011-2015. Health Partnership Group, Hanoi, Viet Nam. http://jahr.org.vn/downloads/JAHR2010-EN.pdf (accessed 30 August 2014).
Ministry of Health and Joint Partnership Group (2012). Joint Annual Health Review 2010. Improving quality of medical services. Health Partnership Group, Hanoi, Viet Nam. http://jahr.org.vn/downloads/JAHR2012/JAHR2012_Eng_Full.pdf (accessed 30 August 2014).
Ministry of Health and Joint Partnership Group (2013). Joint Annual Health Review 2013. Towards Universal Health Coverage. Health Partnership Group, Hanoi, Viet Nam. http://jahr.org.vn/downloads/JAHR2013/JAHR2013_Final_EN.pdf (accessed 30 August 2014).
World Bank (2013). GDP and GDP per capita for Viet Nam. Global database. http://data.worldbank.org/indicator/NY.GDP.PCAP.CD (accessed 30 August 2014).


138
D. Public hospital governance in ThailandA case study on universal health coverage, health care accreditation and the emerging medico-legal environmentViroj Tangcharoensathien, Anuwat Supachutikul, Walaiporn Patcharanarumol, Piyawan Limpanyalert, Weerasak Putthasri , Rapeepong Supanchaimat , Supon Limwattananon, Angkana Sommanustweechai , Chanankarn Boonyodsawad

Public hospital governance in Thailand
139
Abstract The hospital sector in Thailand is dominated by government-owned hospitals. The majority of these public hospitals fall under the Ministry of Public Health (MOPH), which has achieved full geographical coverage to all districts and provinces. This case study seeks to understand how the governance of public hospitals has responded to
i) the Universal Coverage Scheme (UCS) introduced in 2002;
ii) health-care facility accreditation introduced in 2003; and
iii) the medico-legal environment.
This study applied a mixed-method approach, including literature review, secondary data analysis, on-site visits and interviews with key informants at four purposively selected MOPH hospitals (one district, one regional and two general hospitals).
The UCS was designed to extend coverage and provide financial risk protection to citizens; it was not intended to explicitly improve hospital governance capacity. However, its provision of a purchaser–provider split defines a clear accountability framework between the National Health Security Office (NHSO), the hospitals, and the UCS members. As a result, hospital governance has become more responsive to UCS members’ needs compared to the previous integrated model, in which budget allocation was neither linked to the numbers of population served nor to patient satisfaction.
Closed-end payment mechanisms applied through the UCS, such as capitation and diagnosis-related groups (DRGs), incentivize technical efficiency. Hospital quality is driven more by internal hospital demand than the NHSO’s external financial incentives. Nevertheless, the Healthcare Accreditation Institute (HAI), which has no contractual relationship with hospitals, allies with and uses the NHSO’s financial incentives to boost quality assurance and accelerate accreditation. Service integration between health centres and district hospitals is achieved through the NHSO allocation of outpatient capitation budget for all UCS members in a given district. This integration contributes to a significant improvement in the governance of district health systems, as it results in

140
improvements in service quality at health centres and continuity of care through effective referral systems. Finally, the medico-legal environment has resulted in changes in the service profiles and referral patterns of district hospitals, due to fear of lawsuits.
It is vital to sustain the performance of district hospitals and health centres in an integrated manner, in light of the demographic and epidemiologic transitions.

Public hospital governance in Thailand
141
Acronyms and abbreviationsCPI Corruption Perceptions Index
CSMBS Civil Servant Medical Benefit Scheme
DALY Disability-Adjusted Life Year
DHO District Health Office
DHS district health system
DRG diagnosis-related group
GDP gross domestic product
GNI gross national income
HAI Healthcare Accreditation Institute (public organization)
ICD International Classification of Diseases
ISO International Organization for Standardization
JCI Joint Commission International
MDGs Millennium Development Goals
MOPH Ministry of Public Health, Thailand
NCD noncommunicable disease
NHSO National Health Security Office
PHC primary health care
PMTCT prevention of mother-to-child transmission
PPP purchasing power parity
SHI Social Health Insurance
SSO Social Security Office
THE total health expenditure
TAO Tambon Administration Organizations
UCS Universal Coverage Scheme

142
UHC universal health coverage
UMIC upper-middle income country
WHO World Health Organization

Public hospital governance in Thailand
143
1. IntroductionThailand has achieved good records in health systems development, good health at low cost (Patcharanarumol et al., 2011; Balabanova et al., 2013), and all health-related Millennium Development Goals (MDGs) (Waage et al., 2010), as a result of the extensive availability of a well functioning primary health care (PHC) system (Rohde et al., 2008). However, progress in life expectancy at birth has been hindered by stagnation in adult mortality reduction, particularly among men, due to the HIV/AIDS epidemic (Rajaratnam et al., 2010).
Equitable access to quality heath services and improvements in income, female literacy, gender equality, and transportation infrastructure have all contributed to improved health in Thailand. Though PHC and hospitals play a critical role in health development, understanding of hospital governance is limited. This case study seeks to understand how the governance of public hospitals responds to external reforms and contributes to performance in terms of improved responsiveness and accountability to the population served, as well as improved efficiency and quality of services.
Mixed methods were applied in undertaking this study, including reviews of relevant literature, site visits and interviews with key informants by the research team, in four purposively selected Ministry of Public Health (MOPH) hospitals. The four sites include one district, one regional and two general hospitals. Through the in-depth interviews, the researchers sought to understand the hospital governance structure, the response after reforms were introduced, and the contributions of governance to hospital performance. The levels that exist within governance structures in MOPH hospitals are standardized across locations, but in other ways the governance structures are more sophisticated in general and regional hospitals than in district hospitals, since the latter type operate on a smaller scale. Performance of these hospitals varies across and within hospital type.
The data included in this case study contribute to valuable insights regarding governance and the responses of these three different types of hospitals. Interviews with key informants at the MOPH and the hospitals reflected that no major reforms had occurred in the past two decades, with
144
the exception of one district hospital (not one of the four sites visited), which was transformed into a public autonomous hospital (Putthasri et al., 2011). However, universal health coverage (UHC), which was introduced in 2002, and hospital quality improvement initiatives (financial incentives supporting accreditation), instituted in 2007, represent the two major external factors that have prompted hospital governance teams to respond by improving performance. Another external factor, the emerging medico-legal environment, was also taken into account by this study. Though the medico-legal environment is not a reform in itself, it has a major influence on the changes in the profile of services offered at district hospitals. Since public hospitals play a dominant role in Thailand and the MOPH governs the largest share of these, this study selected MOPH hospitals as representative sites for this case study.
2. Country profile, policy and health system context2.1 Economic contextThailand graduated from lower- to upper-middle-income country status in 2011. After the 1997 Asian financial crisis, Thailand’s gross national income (GNI) experienced negative growth, with an average of −3.7% between 1997 and 1999. Recovery was observed between 2000 and 2008, with an annual growth of 3.9%. The economy was not significantly affected by the 2008 global economic downturn. In 2012, Thailand’s GNI per capita, US$ 5210 (International $ 8129), was lower than the average among countries in the upper-middle-income country (UMIC) group, which was approximately US$ 6942 (see Box 1).

Public hospital governance in Thailand
145
Box 1: Thailand at a glancePopulation: 67 million
GNI 2012: US$ 5210 per capita, average GNI growth: 5% (2000–2007), 2.9% (2008–2012)
Gini index: 47.9 (1992), 40 (2009)
Fiscal space: tax to GDP 17.6% (2011), revenue to GDP 21.3% (2011)
Health expenditure (2010 National Health Account)THE US$ 194 per capita, 3.9% GDP
Source: Public 65%, Social Health Insurance 8%, Private 25%
Out of pocket 14% of THE
General government health expenditure, 13.1% of general government expenditure
Health status Total fertility rate 1.6 (2010), contraceptive prevalence rate, all methods 80% (2009)
Life expectancy at birth 74.1 years, adult mortality
Under-5 mortality rate 14/1000
Maternal mortality ratio 48/100 000
Health resources (per 1000 population): Physicians 0.5/1000 (2010)
Nurse and midwives 2.2/1000 (2004)
Total physicians, nurses and midwives 2.7/1000 population
Hospital bed 2.1/1000 (2010)
Service coverage: ANC and hospital delivery 99–100% (2009)
Source: The World Bank, World Development Indicators (available at: http://data.worldbank.org/data-catalog/world-development-indicators)
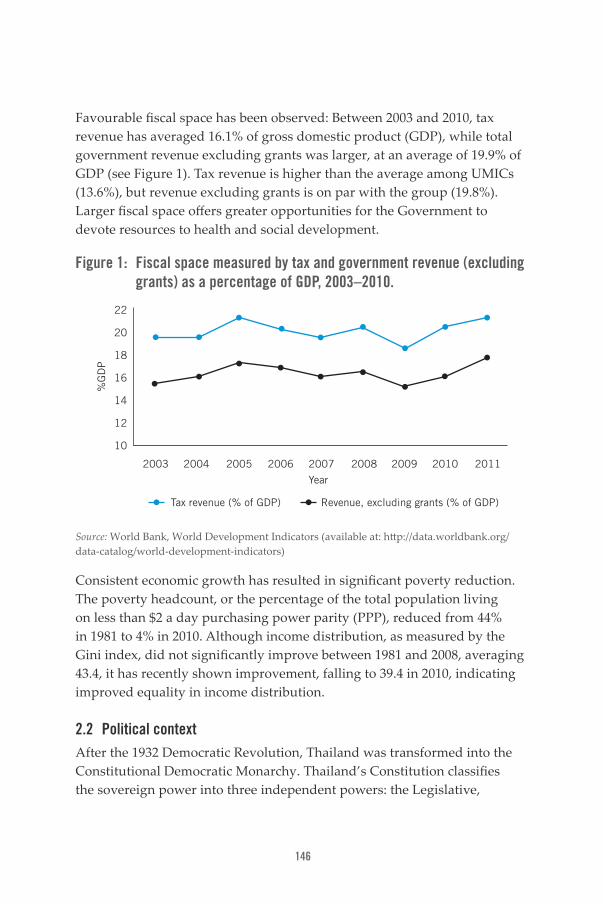
146
Favourable fiscal space has been observed: Between 2003 and 2010, tax revenue has averaged 16.1% of gross domestic product (GDP), while total government revenue excluding grants was larger, at an average of 19.9% of GDP (see Figure 1). Tax revenue is higher than the average among UMICs (13.6%), but revenue excluding grants is on par with the group (19.8%). Larger fiscal space offers greater opportunities for the Government to devote resources to health and social development.
Figure 1: Fiscal space measured by tax and government revenue (excluding grants) as a percentage of GDP, 2003–2010.
2003
%G
DP
2004 2005 2006 2007 2008 2009 2010 2011
Year
Tax revenue (% of GDP) Revenue, excluding grants (% of GDP)
22
20
18
16
14
12
10
Source: World Bank, World Development Indicators (available at: http://data.worldbank.org/data-catalog/world-development-indicators)
Consistent economic growth has resulted in significant poverty reduction. The poverty headcount, or the percentage of the total population living on less than $2 a day purchasing power parity (PPP), reduced from 44% in 1981 to 4% in 2010. Although income distribution, as measured by the Gini index, did not significantly improve between 1981 and 2008, averaging 43.4, it has recently shown improvement, falling to 39.4 in 2010, indicating improved equality in income distribution.
2.2 Political contextAfter the 1932 Democratic Revolution, Thailand was transformed into the Constitutional Democratic Monarchy. Thailand’s Constitution classifies the sovereign power into three independent powers: the Legislative,

Public hospital governance in Thailand
147
the Executive and the Judiciary (National Legislative Assembly, 2007). To date, Thailand has 18 Charters and Constitutions, reflecting high political instability. Politics in Thailand are dominated by practices such as vote buying and by business conglomerations that aim to protect their own interests. Although they hinder the development of a representative democracy where individuals elected by the people form the government, these practices continue to occur despite the various tough countermeasures introduced by the Election Commission (Asia Foundation, 2011). Despite the efforts and struggles of the National Anti-Corruption Commission, mandated by the Constitution (Quah, 2011), Thailand’s ranking in Transparency International’s Corruption Perceptions Index (CPI) deteriorated between 2012 and 2013 from a rank of 88 out of 174 countries worldwide (score 37 out of 100) to a rank of 102 out of 175 countries (score 35) (Transparency International, 2012 and 2013). The CPI scores measure the perceived levels of public sector corruption, ranging from 0 (highly corrupt) to 100 (very clean).
The current political conflict in Thailand originated when Thaksin Shinawatra was elected prime minister in 2001. In 2006, political turbulence led to a bloodless coup by the military, which deposed Thaksin, triggering a power struggle between pro-Thaksin “red-shirts” and anti-Thaksin “yellow-shirts”. Political instability in Thailand happened again during 2013-2014 where anti-government protest took place and resulted in the removal of the incumbent prime minister. The Royal Thai Army intervened by declaring martial law throughout the nation on 20 May 2014 and subsequently formed a junta called National Council for Peace and Order (NCPO) to rule the country and partially repealed the 2007 constitution. The Interim Constitution 2014 was enacted as the currently supreme law of Thailand. The NCPO leader, the army chief, was appointed prime minister.
2.3 Health systems contextAlmost all health-related MDG targets were achieved well before the 2015 target date, due to Thailand’s bold multi-sectoral human development initiatives aimed at achieving sub-national goals focusing on specific local health needs and priorities (Waage et al., 2010).
Thailand’s exemplary record in health and human development is based on heavy investment in health systems, which can be classified into two
148
strands: investment in health infrastructure, particularly PHC, to minimize geographical barriers (Balabanova et al., 2013; Patcharanarumol et al., 2011); and consistent extension of financial risk protection mechanisms by targeting different population groups, such as the poor and vulnerable, public and private sector employees, and those engaged in the informal economy, called the informal groups (Tangcharoensathien et al., 2009). Through these investments, by 2002, the whole population was covered by three public health insurance schemes (Evans et al., 2012; Tangcharoensathien, Pitayarangsarit et al., 2013).
Early and rapid responses to Thailand’s HIV/AIDS epidemic by the Government, civil society and health systems during the 1990s transformed a generalized epidemic in 1993 into a concentrated HIV epidemic in 2006. HIV prevalence among pregnant women declined from a peak of 2.3% in 1995 to 0.51% in 2012. The prevention of mother-to-child transmission (PMTCT) of HIV programme, which has offered free breast milk substitutes since 1995 and provided the antiretroviral drug azidothymidine (AZT) to all eligible pregnant women since 1998, reduced vertical transmission from 30% in 1995 to 8% in 1998. The inclusion of Nevirapine in the PMTCT programme in 2008 further reduced vertical transmission to 3.2% by 2011. Moreover, universal coverage of antiretroviral therapy (ART), launched in 2003, was rapidly scaled up to reach 250 000 individuals by 2011. Public hospitals are the main providers of ART, reflecting their capability in scaling up priority national programmes.
Noncommunicable diseases (NCD) have become a major health problem in Thailand. Between 1999 and 2004, the loss of Disability-Adjusted Life Years (DALYs) per 1000 persons decreased slightly in men but increased in women. HIV/AIDS remained the disease posing the highest burden for men in both 1999 and 2004, while stroke overtook HIV/AIDS as the disease posing the highest burden for women between the same years. The proportion of NCDs within the top 20 diseases has increased, while the burden of infectious diseases has decreased (Bundhamcharoen et al., 2011).
Furthermore, gains in health equity have been observed in Thailand. The average household economic status has improved while health inequities have declined between the two national household censuses in 1990 and 2000. Substantially larger reductions in child mortality were noted among

Public hospital governance in Thailand
149
poorer population quintiles. The excess child mortality risk between the poorest and richest quintiles decreased by 55% (95% CI 39–68%) in a single decade. Contributing factors include overall economic growth and poverty reduction, improved health insurance coverage, and a scaling-up and more equitable distribution of PHC infrastructure and intervention coverage. Understanding the factors that have led to Thailand’s success in these areas may help inform countries that are struggling to meet the fourth MDG (to reduce child mortality) and to reduce health inequities (Vapattanawong et al., 2007).
As local governments are at an early phase of development, the health system is still centralized, with the MOPH playing the dominant role. By 2012, only 39 out of all the 9762 MOPH sub-district health centres (0.4%) had been devolved to Tambon Administration Organization (TAO) (the sub- district-level local government unit). After a regular joint assessment by TAO and Provincial Health Office, it was determined that almost all of these health centres were not ready to assume responsibility for health service delivery (Health Systems Research Institute, 2012). Jongudomsuk and Srisasalux (2012) describe the lack of political leadership and readiness of local government to assume health responsibility in Thailand, and suggest that health-care decentralization is not a panacea and should be applied according to local context. Local government has a negligible role in health service provision and hence also in health financing: Only 11 hospitals (2 owned by municipalities and 9 by the Bangkok Metropolitan Authority) out of a total of 734 hospitals (1.5%) are owned by local government, reflecting the negligible role of local government in both health service provision and financing.
3. Hospital sector3.1 Public and private hospital systemsIn 2010, there were 51 308 PHC posts (small health posts) at the village level, where drug kits were available but no health staff were present, except for village health volunteers. Health centres, of which there are 10 120 in total, are the most peripheral of Thailand’s health delivery systems where there are trained health workers (see Table 1). Each health centre is staffed by 3–5 health workers. Hospitals are defined as medical premises that have beds, doctors, nurses, pharmacists, dentists and other

150
allied health professionals, diagnostic facilities, and capacity to offer other essential ancillary services for inpatients. Of the 988 public hospitals in Thailand, 74% (734) are MOPH district hospitals. In each provincial capital, the MOPH general hospital (there are 71 in total) covers tertiary care services in the city itself and supports referrals from district hospitals across the province. At this level, all basic medical specialties – such as internal medicine, obstetrics, paediatrics and surgery – are available. At the regional level, there are 25 MOPH regional hospitals and 48 other specialized hospitals that serve as regional referral centres, offering sub-specialty services such as cancer treatment, haematology and psychiatry. In addition, Thailand’s 11 teaching hospitals, which are owned by universities under the Ministry of Education, offer teaching for all health-related professionals and also provide sophisticated diagnostic and treatment services. By 2013, 16 public universities had became autonomous non-profit public organizations, while the remaining 16 are proceeding with the legislative process in Parliament.
Table 1: Public sector health-care delivery, 2010
Level
Non-hospitals Public hospitals (N=988)
PHC
cent
re
heal
th
cent
re
Min
istr
y of
Ed
ucat
ion
(teac
hing
)
MOP
H an
d ot
her
gene
ral
Min
istr
y of
De
fenc
e
Othe
r spe
-ci
aliz
ed
MOP
H re
gion
al
MOP
H di
stric
t
BKK - 68 5 26 - 13 - -
Region - - 6 - - 48 25 -
Province - - - 71 60 - - -
District - 284 - - - - - 734
Sub-district
- 9768 - - - - - -
Village 51 308 - - - - - - -
Total 51 308 10 120 11 97 60 61 25 734
Source: Wibulpolprasert, 2011
The MOPH health data do not adequately capture non-MOPH public and private sectors, but an annual Health Resource Survey, which is conducted by the MOPH and to cover all public and private health-care institutions, provides a more complete national picture.

Public hospital governance in Thailand
151
Public hospitals are the main providers of hospital care, accounting for 75% of all of Thailand’s 1310 hospitals and 79% of the total number of hospital beds, while private hospitals make up the remainder (25% and 21%, respectively), according to 2008 data. Most private hospitals are small, with 69% having fewer than 100 beds. Large private hospitals include several hospital chains that are registered in the stock market; they are located in Bangkok and offer services to international patients (see Figure 2). Private non-profit charity-run hospitals account for a negligible share of hospital beds.
Figure 2: Private hospital profile by number of beds, 2009
1-10 11-30 31-50 51-100 101-200 >200
Number of beds
Hospitals
Per
cent
Bed
40%
30%
20%
10%
0%
Source: Wibulpolprasert, 2011
Demand for private hospital services is sensitive to changes in household income, as reflected in Figure 3. During the economic boom from 1994 to 1997 (prior to the 1997 financial crisis), an average of 40 private hospitals were newly established each year. The reverse was true during the recession, particularly after 1998, when on average only nine private hospitals were newly established and 23 were closed down per year between 1998 and 2003. Despite economic recovery from 2003 onwards, there were few newly established private hospitals, probably due to the launch of the UHC policy in 2002, through which a comprehensive benefit package was offered to the whole population free of charge. Some proportion of private hospital users may have shifted to using public providers participating in the UHC scheme.

152
Figure 3: Number of newly established and closures of private hospitals, and GNI per capita, 1994–2009
19
94
19
95
19
96
19
97
19
98
19
99
20
00
20
01
20
02
20
03
20
04
20
05
20
06
20
07
20
08
20
09
80
60
40
20
0
Newly established
5000
4000
3000
2000
1000
0
GN
I per capita US
Dne
wly
est
ablis
hed
/ clo
sed
dow
n ho
spit
als
Closed down GNI per capita
Source: Bureau of Medical Registration, MOPH, Thailand, 2010, and World Bank, World Development Indicators (available at: http://data.worldbank.org/data-catalog/world-development-indicators)
Historically, the MOPH has provided a significant share of the country’s hospital beds, constituting approximately 60–70% of total beds between 1973 and 2008 (see Figure 4). The availability of private hospital beds significantly increased in response to the implementation of Social Health Insurance (SHI) in 1991, which was mandated by the 1990 Social Security Act. Through SHI, more than half of all private employees were registered with private hospital contractors (those with more than 100 beds). Prior to the 1997 financial crisis, the economic boom also boosted demand for private hospital services. In 2008, the private share of hospital beds was 21%. Other government hospitals such as those owned by the Ministry of Defence and the Ministry of Education (university-based/teaching hospitals) contributed a smaller share, at approximately 11% of the total. Local governments played almost no role in providing hospital care.

Public hospital governance in Thailand
153
Figure 4: Distribution of hospital beds by hospital ownership, 1973–2008
100%
75%
50%
25%
0%1973
Per
cent
MOPH
1977 1981 1985 1989 1993 1997 2001 2005 2007 2008
Private Other Govt Local Govt and State Enterprise
Source: Wibulpolprasert, 2011
Understandably, private hospitals contribute a significant share of hospital beds in response to high demand for private health-care services in affluent areas such as Bangkok and the central region. In contrast, MOPH hospitals contributed the highest share of hospital beds in the poorest northeast region and the poor southern and northern regions of the country, catering to the demands of less affluent populations (see Figure 5).
Figure 5: Distribution of hospital beds by hospital ownership and geographic region, 2009
100%
75%
50%
25%
0%
BKK Central North
Region
South Northeast
MOPH Other Govt Local Govt and State Enterprise Private Sector
Per
cent
Source: Wibulpolprasert, 2011

154
MOPH hospitals have higher bed occupancy rates (around 80%) than hospitals under the Ministry of Education (less than 70%) and the Ministry of Defence (around 50%). Private hospitals have occupancy rates of slightly higher than 50% (see Figure 6).
Figure 6: Hospital bed occupancy rate by hospital ownership, 2006–2009100
75
50
25
0MOPH MOE MOD Private
2006 2007 2008 2009
Source: Wibulpolprasert, 2011
As a result of significant expansion in the number of beds at MOPH district hospitals, especially between 1993 and 2000, the population-to-hospital-bed ratio had improved to around 450 : 1 in 2002 (see Figure 7). Increases in the number of beds in other government and private hospitals were insignificant.
Figure 7: Total hospital beds and population-to-hospital-bed ratio, 1979–2007
160 000
120 000
80 000
40 000
0
1979 1981 1983 1985 1987 1989
Bed
1991 1993 1995 1997 1999 2001 2003 2005 2007
800
600
400
200
0
Population per hospital bed
Tota
l hos
pita
l bed
s
PopBed Ratio
Source: Asia Pacific Observatory on Health Systems and Policies; authors’ computation from Wibulpolprasert, 2011, and World Development Indicators on population.

Public hospital governance in Thailand
155
3.2 Evolution of district hospitalsThe majority of the rural population access MOPH district hospitals, which constitute 74% of all public hospitals. Therefore, it is important to understand the evolution and profiles of these hospitals. The catchment population in a typical district is approximately 50 000. In response to the MOPH policy during the 1980s that every district must be served by a district hospital with the capacity to provide primary- and secondary-level health services, full geographical coverage of district hospitals was reached by the mid-1990s. District hospitals are designed to provide a wide range of health services, including inpatient, outpatient, and prevention and health promotion services. District hospitals range in size from 10 to 120 beds.
Between 1999 and 2009, the 10-bed district hospitals were gradually upgraded to 30 beds, while the 30-bed hospitals were upgraded to 60 beds (see Table 2). During this decade of change, there was also a small increase in the proportion of 90-bed and 120-bed hospitals. By 2009, 56% of all district hospitals had 30 beds.
Table 2: District hospital profile by number of beds, 1999 and 2009
Number of beds 1999 2009
10 14% 5%
30 59% 56%
60 18% 25%
90 7% 9%
120 2% 5%
Total 100% 100%
Source: Wibulpolprasert, 2011
In the 1980s, standard blueprints based on hospital size were developed by MOPH hospital architects for the construction of district hospitals. These blueprints are designed to accommodate future expansion in response to increases in health needs and budget availability. For example, a standard outpatient department includes the following: essential floor space for medical records, reception, waiting room, consultation rooms, accident and emergency unit, laboratory, basic radiology unit, labour and delivery,
156
surgical theatre and pharmacy. Each of these service units should be placed on the ground floor, whereas the second floor is designed for administrative units. At the back of the outpatient building is a standard ward of 30 beds, including a left wing for male patients and a right wing for female patients, while the middle areas are used for the nurse station and treatment facilities. When health needs increase and budget becomes available, another new ward of 30 beds should be constructed in order to upgrade a 30-bed hospital to a 60-bed hospital. Upgrading a 10-bed to a 30-bed hospital involves replacing a 10-bed ward with a standard ward of 30 beds in the same building.
The construction of district hospitals in each and every district was accompanied by a budget earmarked for a standard set of basic medical equipment. For example, a 50 milli-Amp X-ray machine, and basic biochemistry and laboratory equipment, as well as standard equipment for the operating room, labour and delivery, and accident and emergency. All of this equipment was procured once construction concluded at each new site.
3.3 Hospital workforceThe staff of public hospitals are mostly civil servants with life-time salaried employment, though it has also become common to employ other staff on contract. The health workforce in the public service sector are not subject to political changes; however, general and regional hospital directors are appointed by the MOPH Permanent Secretary while district hospital directors are appointed by the Provincial Chief Medical Office, which represents the MOPH at the provincial level. Civil servants are entitled to pension benefits after the age of 60, which is the compulsory retirement age, as well as medical benefits and Royal Insignias granted by the King for their public service.
As part of the 2006 public sector reforms, government services – including those in the health sector – were significantly downsized, despite substantial increases in demand for health services after the 2002 UHC reforms. Newly graduated nurses and pharmacists (but not medical and dental graduates) were thereafter employed directly by hospitals on annual contracts, based on continued demand. Contract workers are not entitled to membership in the Civil Servant Medical Benefit Scheme (CSMBS), but are covered by

Public hospital governance in Thailand
157
payroll contributory SHI schemes and still entitled to Royal Insignias for public service. These reforms are thus very discouraging for many new graduates. Also variations in wages and other benefits offered across district and general hospitals within and across provinces result in confusion, jeopardizing poorer district hospitals that are unable to compete with better employment offers at general or regional hospitals. This situation was exacerbated by weak MOPH leadership during the period of reform. Literature reviews have found only very limited evidence on the impact of public sector reforms on the hospital workforce, suggesting the need for further research in this area.
All health professionals generally have their own career ladder, but for hospital administration staff, there must be a vacant post before a manager can be promoted. Almost all medical staff of general hospitals are specialists with six-year medical qualifications and licensure, in addition to three to five years of specialist training in programmes accredited by the Medical Council and related Royal Colleges. Almost all medical staff at district hospitals are general practitioners with six years of training who are posted at these hospitals to fulfil their mandatory three years of rural service. More than 70% of district hospital doctors opt for residential training programmes as specialists. After completing three years of rural service (Tangcharoensathien, Limwattananon et al., 2013), some doctors are employed by general and regional hospitals where they can apply for residency training in a specialist area needed by the hospital; they are granted study leave with full pay, on the condition that they will come back to serve the hospital for a specified time period. Those who are not employed by a public hospital can still opt for “free training”; during this training they do not receive a salary, but as residents they receive some payment from the training institute. After specialist training, almost all of them join the private sector. Putthasri et al. (2013) have reported on the impact of policies to foster retention of hospital staff in rural areas, highlighting the importance of an integrated education strategy, especially recruiting medical and nursing students from rural areas and posting them in their hometowns through government bonding systems.
All professional staff at district hospitals are qualified at the bachelor’s degree level and licensed to practice in their field, including physicians,

158
nurses, dentists, pharmacists and medical technicians. It should be noted that the Thai Nursing and Midwifery Council only award accreditation to four-year bachelor degree professional nursing courses that integrate nursing and midwifery (there are no stand-alone midwifery courses). Nurses must pass an examination to receive their licence, and relicensing every five years is required through earning 50 credits of continued nursing education. A medical licence has lifetime validity, with no relicensing required. The availability of professionally qualified staff improves trust and confidence among patients regarding the quality of care offered. Increasingly, public health officers at health centres are also qualified as bachelors of public health; the numbers of staff that have only been trained through two-year diploma courses are diminishing. Capacities among public health officers are usually strengthened through in-service, on-the-job training.
In addition to a basic monthly salary, hospital professionals are entitled to additional financial incentives, such as hardship allowance, non-private practice incentives for those deciding not to operate a private practice during their off hours, workload incentives, and specific pay for performance, such as pay based on the number of surgical cases provided at all levels. On-call and evening and night shifts are paid on a per-session basis. It is legal for health professionals employed in the public sector to operate out-of-hours private practices (Jan et al., 2005). Governance to ensure commitment and accountability to public services among “dual practice” professionals has substantially improved over the last few decades, and field observations show that absenteeism is not a problem.
3.4 Equity in hospital utilizationThe Health and Welfare Survey (HWS), a national representative household survey conducted every two years by the National Statistical Office, is the only dataset that facilitates the assessment of equity in outpatient and inpatient service utilization (see Table 3).

Public hospital governance in Thailand
159
Table 3: Use of outpatient and inpatient services by the Thai population, by asset quintiles, 2011
Asset quintile
Percentage of
population
Percentage of outpatient visits Percentage of inpatient cases
Health centre
District hospital
Prov. and
other govt.
hospital
Private hospital
District hospital
Prov. and
other govt.
hospital
Private hospital
Poorest 21% 29.7% 28.7% 25.1% 14.5% 30.1% 20.8% 12.1%
Poor 20.1% 24.4% 21.8% 20.6% 11.5% 22.5% 21.2% 8.1%
Middle 22.7% 23.9% 23.0% 19.3% 11.6% 24.7% 21.8% 14.9%
Rich 16.6% 14.6% 16.5% 14.8% 12.7% 13.1% 16.7% 17.0%
Richest 19.6% 7.3% 10.1% 20.2% 49.7% 9.6% 19.4% 47.8%
Total (millions)
67.5 (100%) 3.4 (100%)
3.0 (100%)
3.2 (100%)
0.6 (100%)
1.3 (100%)
2.5 (100%)
0.5 (100%)
Note: Sampling weight applied Source: Asia Pacific Observatory on Health Systems and Policies; authors’ analysis of data from the Health and Welfare Survey 2011
According to the most recent HWS data (National Statistical Office, 2011), the poorest 21% of the population accounted for almost 30% of the total number of outpatient visits to health centres and district hospitals, whereas the richest 20% made only 7% of the outpatient visits to health centres and 10% of the outpatient visits to district hospitals. In contrast, the poorest quintile accounted for less than 15% of outpatient visits to private hospitals, whereas the wealthiest quintile accounted for almost half (49.7%) of these visits. For the public hospitals above the district level (i.e. general and university hospitals), the concentration of outpatient visits from among the poor population was less significant than it was for usage of the district-level health-care facilities.
The distribution of hospital admissions across the economic gradient of the Thai population was similar to that of outpatient visits: skewed towards utilization of public sector district hospitals among the poor and utilization of private hospitals among the rich. Inpatient admissions to the general and university hospitals were relatively equitable.

160
In summary, the 2011 HWS data show that Thailand still maintains significantly pro-poor outpatient and inpatient utilization in the district- level health system (Limwattananon et al., 2013). The concentration index is applied to measure relative inequity; positive values indicate that the variable is disproportionately concentrated among the rich, while negative values indicate that the concentration is among the poor. In 2011, the concentration indices were −0.204, −0.157 and −0.187 for outpatient visits to health centres and district hospitals, and inpatient admissions to district hospitals, respectively, indicating that use of services was concentrated among the poor. Use of general and university hospitals were relatively less pro-poor, with concentration indices of −0.054 for outpatient visits and −0.015 for inpatient visits. For private hospitals, the concentration indices for outpatient visits and inpatient admissions were pro-rich, at 0.327 and 0.334, respectively. Clearly, district-level health-care facilities (i.e. health centres and district hospitals) are the major hubs that translate UHC policies into pro-poor utilization outcomes, as they are the “close- to- the- client” service providers.
3.5 Efficiency in public hospital bed useBased on the application of the Pabon Lasso graph (Lasso, 1986), Figure 8 shows the scatter plot of occupancy rate on the x-axis and bed turnover rate (total discharge per 100 bed-days) on the y-axis. All MOPH general and regional hospitals in 2011 were plotted onto the four quadrants of the graph using mean occupancy rate (82.9%) and mean bed turnover rate (20.0%) as cut-off points. Hospitals that lie in the lower left quadrant are the least efficient due to having below average occupancy and bed turnover rates. Hospitals in the upper right quadrant are the most efficient, but nevertheless there remain concerns over quality of care due to high bed turnover, shorter stays and very crowded conditions (high occupancy). Quite a few hospitals lie in the upper left upper and lower right quadrants.

Public hospital governance in Thailand
161
Figure 8: Bed occupancy and turnover rate of general and regional hospitals, 2011
710
731
708
709
741
745
686
702
747
690
728
716714
715685701
694
736
750 717
729
720
706
707
727
726
738
730
748
721
743
705
724695
689696
687
692
723
725
711
737691
693
275
732
718
704
699
739
733
740
320688
746
703
749
751
719
666669
676
670
680
677
662
671
672
674
664661
675
681667
678
673
679
663
684660
665
683
Mean 20.0%
Mean 82.9%0
10
20
30
40
Turn
ove
r (d
isch
arge
s/10
0 b
ed-d
ays)
0 20 40 60 80 100 120 140Occupancy (% of beds)
Circle size proportional to number of beds (150-1,039), with last 3-digit codes of hospitals inside: black=GH, blue=RH
General and regional hospitals, 2011
Pabon Lasso graph
r = 0.835 (P<0.0001)
Source: Asia Pacific Observatory on Health Systems and Policies; authors’ computation from national inpatient dataset from three health insurance schemes on number of admission and hospital stays and from NHSO dataset on number of hospital beds.
Figure 9, which represents all district hospitals in 2011, shows that more are concentrated in the less efficient quadrants as compared to the scatter plot for the general and regional hospitals. National health policy is to ensure health security and equitable access to care by all citizens no matter where they live, whether in an island in the south, mountainous areas in the north and northeast, or hard-to-reach areas with sparse populations, resulting in less efficiency among health-care facilities in these locations, while ensuring health equity.

162
Figure 9: Hospital bed occupancy and turnover rate of district hospitals, 2011
82 22
19
57
90
04
8955
08
23
83
17
06
87
5254
17
80
52 64
28 9251
69
53
91
4110
77
21
97
93
61
898568
76
96
72
78
58
69
2699
38
21
01
74
16
62
58
94
0207
92
11
2584
56
06
30
53
65
31
46
27
47
05
45
32
93
48
3387
73
5967
3644
00
35
56
5554
19
74
62
09
12
70
11
04
8668
84
1418
65
37
08
09
96
85
15
07
61
19
24
75
18
01
13 48
66
58
81 75
76
17
88
71
57
97
59
15
16
66
6760
36
34
50
47
86
98
63
64
60
16 94
95
42
82
00
81
03
43
7863
1310
28
48
25
9221
53
14
94
19
54
66
05
65
60
9056
62
9677
42
38
55
23
93 89
04
57
2325
12
40
3247
26
69
67
31
33
11
50
32
222644 1595
63
183021
30
64
3756
19
49
67866152
61
72
54
2433
51
62
79
25
38
53
74
99
69
31
00 41
42
57
63
41
45
01
46 60
80
98
29
48
70
22
43
7388
52
64
2758
46
52 55
71
78
12
81
35
43
59
84
53
49
54
47
34
10
13
36
85
17 20
56
36 59
91
4050
65
97
02
51
58
35
39
6644
1643
09
87
55
72
45
76
34
75
08
07
57
39
24
70
28
06
83
98
29
90
34
50
3318
308915
98
45
87
77
28
99
0235
7800
51
84
91
04
81
49
57
23
23
23
46
27
15
05
9297
98
95
95
00
8751
4256
58
81
79
25
22
33
65
2466
24
46
18
0102
47
54
80
55
47
71
36
4493
19
75
08
8670
04
09
91 96
02
9093
01
99
890312
01
73
38
06
81
3614
14
02
21
60
19
06
10
77
79
66
35
67
32
53
51
75
76
83
78
86
79
640711
76
72
05
49
11
67
9258
12
37
57
06
10
52
85
08
08
5614 45
73
27
2656
31
80
09
63
72
16
19
13
88
72
61
32
77
59
93
9662
31
30
00
39
29
88
44
54
6871
63
1733
76
07
68 99
34
91
17
70
83
116459
08
60
48
10
9642
25
1838
74
20
03
32
84
40
75
39
28
53
74
71
05
65
22
13
88
07
82
43
94
02
56
69
87
62
79
35
2517
11
61
56
92
76
57
55
77
08
70
88
66
43
59
83
60
34
10
29
23
32
07
24
32
71
7286
4061
01
94
22
18
90
45
33
8116
54
62
29
35
67
33
30
38
25
98
44
26
36
26
95
49
93
42
82
99
96
27
68
58
65
27
38
37
19
64
13
6005
00
21
91
60
31
09
12
87
97
39
38
4214
15
52 28
5354
69
22
34
63 02
31
41
50
85
41
10
80
04
64
74
39
78
75
Mean 29.8%
Mean 81.4%0
10
20
30
40
50
60
70
80
Turn
ove
r (d
isch
arge
s/10
0 b
ed-d
ays)
0 20 40 60 80 100 120 140 160 180 200Occupancy (% of beds)
Circle size proportional to number of beds, with last 2-digit hcode inside: black=Central, gray=North, blue=Northeast, white=South
District hospitals, 2011Pabon Lasso graph
r = 0.946 (P<0.0001)
Source: Asia Pacific Observatory on Health Systems and Policies; authors’ computation from national inpatient dataset from three health insurance schemes on number of admission and hospital stays and from NHSO dataset on number of hospital beds.
4. Reforms affecting public hospitalsFrom literature reviews and discussion with key informants in a number of MOPH regional, general and district hospitals, two main reforms and one emerging context were identified and selected: the Universal Coverage Scheme (UCS), launched in 2002, and the health-care accreditation, which was extended to health-care facilities with National Health Security Office (NHSO) financial incentives in 2003, and the broader medico-legal environment.
4.1 Universal Coverage SchemeThailand’s tax-financed UCS was launched in 2002, providing a comprehensive benefit package to 47 million individuals (75% of the total population) who were not covered by the existing payroll tax-financed SHI for private employees or the tax-financed CSMBS for government employees and their dependants (Tangcharoensathien et al., 2009). The implementation

Public hospital governance in Thailand
163
of UHC has been shown to have had a favourable effect (Tangcharoensathien, Pitayarangsarit et al., 2013) in terms of pro-poor utilization (Limwattananon et al., 2013; Prakongsai, 2008), pro-poor benefit incidence (Limwattananon et al., 2012), minimum level of catastrophic health spending (Limwattananon et al., 2007), and impoverishment due to medical bills shouldered by households (Evans et al., 2012). High cost interventions are fully covered under the UCS, including chemotherapy, open-heart surgery and renal replacement therapy (Tantivess et al., 2013), resulting in a very low incidence of catastrophic health expenditure and related impoverishment.
Empirical evidence demonstrates that financing health care in Thailand is progressive, where the richer groups pay relatively more than the poorer groups, because of the dominant role of general tax financing. After the launch of the UCS, total health expenditure (THE) as a percentage of GDP did not increase due to steady growth of GDP, although the monetary value of the health expenditure had increased significantly. THE was approximately 4% of GDP before 2002 (see Figure 10). Because UCS is tax-financed, government health expenditure had significantly increased from 50% of THE prior to UCS in 2001 to 67% in 2010, while out of pocket payments by households decreased from 33% in 2001 to 14% in 2010 (see Figure 11).
Figure 10: Total health expenditure (THE) by source of funding, and percentage of GDP, 1994–2011
1995 1996 1997 1998 1999 2000 2001 2002 2003 2004 2005 2006 2007 2008 2009 2010 2011
400 000
300 000
200 000
100 000
0
Mill
ion
Bah
t
5.0
4.0
3.0
2.0
1.0
0.0
% G
DP
Private expenditure on health
General government expenditure on health, NCU million
Health expenditure, total (% of GDP)
Source: Thai Working Group on National Health Account, 2013

164
Figure 11: Source of health finance, 1994–2010100%
75%
50%
25%
0%
19
94
19
95
19
96
19
97
19
98
19
99
20
00
20
01
20
02
20
03
20
04
20
05
20
06
20
07
20
08
20
09
20
10
Public SHI Households
Year
Other private
Perc
ent
SHI: Social Health Insurance Source: Thai Working Group on National Health Account,2013
UCS members are required to register with health-care facilities in their local district health system (DHS) – local health centres and the district hospital – in order to access free outpatient services including prevention and health promotion services. DHS provider networks (consisting of all sub-district health centres and the district hospital) are contractors in the UCS and are paid for their services through an age-adjusted capitation fee for the whole year. It is noted that a single capitation rate is applied throughout the country, and also equally applied to both public and private contractor networks. Use of services outside the registered networks requires referral, otherwise patients are liable to pay in full.
After the launch of UCS in 2002, the supply-side financing through annual budget allocation to MOPH hospitals was completely terminated and replaced by demand-side financing (money follows the people and the services they receive). Public hospital operating expenses are financed based on registered UCS and SHI members, and services offered to members of the three public health insurance schemes (CSMBS, SHI and UCS). There is almost no copayment by members in these three schemes. For example, public hospitals earn:
• for CSMBS patients – a fee for outpatient services and diagnosis- related groups (DRGs) for inpatient services;

Public hospital governance in Thailand
165
• for SHI patients – an inclusive capitation for both outpatient and inpatient services;
• for UCS members – a capitation for outpatient services and DRGs based on global budget for inpatient services;
• for patients who opt out or don’t register with any of the insurance schemes – a fee for outpatient and inpatients services; and
• for patients covered by private insurance – a fee for outpatient and inpatient services.
A purchaser–provider split model was applied in which the NHSO became the purchaser for 47 million UCS members and the MOPH and non-MOPH public and private health care networks are the providers. As a result of the purchaser–provider split, the financing authority, once fully implemented by the MOPH, was transferred entirely to the NHSO. This transfer has created a rival relationship between the MOPH and the NHSO (Tangcharoensathien, Pitayarangsarit et al., 2013). It it important to note that the NHSO applies a level field in purchasing services from the public and private contractor networks, in which the same capitation rate and DRG systems are applied and neither are allowed to over-charge patients. Further information and critique on the implementation problems of the purchaser–provider split are provided by Hughes and Leethongdee (2007) in their publication on universal coverage in Thailand.
Prior to the introduction of UCS in 2002, the District Health Office (DHO) was responsible for supporting and supervising all health centres offering PHC services and other public health interventions, and district hospitals were responsible mainly for curative services. Rival relationships and conflicts were also observed in the 1980s when there were no district hospitals and the DHO was the sole service provider.
4.2 Health-care accreditationThe Hospital Accreditation Programme in Thailand started as a research and development project in 1997 with a clear philosophy of “accreditation as an educational and learning processes, not an inspection”. The learning platform for quality improvement is based on self-assessment by hospitals and external peers with a positive attitude and approach. After more than a decade of learning (1997–2008), the Healthcare Accreditation Institute (HAI)

166
was established in 2009 as a public organization responsible for health-care accreditation, through the adoption of a Royal Decree as mandated by the Public Organization Act BE 2542 (1999). Note that the Public Organization Act 1999 serves as a parent law for any future establishment of a public organization through a Royal Decree. The HAI has been accredited by the International Society for Quality in Healthcare according to its health-care standards in 2013, reflecting international recognition of HAI (ISQua, 2013). Quality improvement was embedded in the accreditation standards from the beginning.
Previously, health-care facilities had to use their own budgets for hospital accreditation activities on a voluntary basis. Since 2007, the NHSO has earmarked a budget of 0.76 baht per capita (35.7 million baht in total) to offer financial incentives to hospitals achieving different levels of quality, with application of an innovative stepwise recognition programme implemented in 2002, which consists of three steps and a 5-point scoring system:
• Step 1 (minimum score of 1) – systems for risk prevention installed;
• Step 2 (score 2) – quality assurance and quality improvement in place; and
• Step 3 (maximum score of 5): full accreditation status, or re-accreditation status (accredited hospitals require a mandatory re-assessment every three years to gain re-accreditation status).
However, each contractor network was granted a certain amount of flexibility by the NHSO to modify the quality assurance scores depending on the local context. The revised second version of hospital standards (2006) integrates hospital quality and safety, health promotion, and criteria for performance excellence in line with the National Quality Award given during the Healthcare Accreditation National Forum. The Forum has attracted interest and support from a community of practitioners interested in learning and sharing experiences on hospital accreditation.
In addition to quality or performance improvement, the HAI also promotes the spiritual dimension of health-care, knowledge management, generation of research evidence from routine work platforms, and peer support across

Public hospital governance in Thailand
167
hospitals. Accreditation is a programme that lays down a foundation for changing the health-care delivery system. Though such reforms take a long time to introduce and implement and much effort to maintain, they have a tremendous and observable impact on the mindset of health workers in the health system.
HAI also works in an international accreditation environment. A series of international standards from the International Organization for Standardization (ISO) also influence quality improvement in many components of Thai hospital services, including quality management systems (ISO 9001), environmental management systems (ISO 14001), laboratory management systems (ISO 17025), quality management system of medical laboratories (ISO 15189), information security management systems (ISO 27001), business continuity management systems (ISO 22301), and occupational health and safety management (BS OHSAS 18001).
With the advancement of medical care and the competitive prices of Thai private hospitals following the government policy of promoting Thailand as a medical hub in Asia for international patients, key private hospitals applied for and were approved by the Joint Commission International (JCI) accreditation for specific clinical and ancillary services. Most of these private hospitals have been accredited by both national and international accreditation programmes. The JCI certifies quality of care, ensuring confidence in medical services among international patients.
4.3 Medico-legal environmentAs mandated by Section 41 of the National Health Security Act 2002, adverse outcomes from medical errors, such as mortality, morbidity or permanent disability, are financially compensated. This no-fault compensation, offered without proof of which party was at fault, covers all UCS beneficiaries and was fully implemented in 2002. The NHSO earmarks annually not more than 1% of the annual service budget for this compensation. Thus, the NHSO minimizes litigation against doctors and hospital personnel, since patients and their dependants feel that their pain and suffering have been taken into account. Financial compensation is neither large nor small, at a maximum of 200 000 baht (equivalent to approximately US$ 6700) for mortality and permanent disability, 12 000 baht (US$ 400) for disability, and 48 000 baht (US$ 1600) for injury or illness.
168
Despite the no-fault compensation policy, one outstanding lawsuit case has had major consequences as medical errors were not properly managed. A female patient, 49 years old, complained of abdominal pain and was diagnosed with acute appendicitis by a district hospital doctor in the southern province of Nakhon Si Thammarat in May 2002. A spinal block was administered and an appendectomy was performed in the district hospital. A high spinal block that went beyond the safety threshold likely resulted in the critical adverse outcome of hypovolemic shock during the operation. After referral to the regional hospital in the provincial capital city, the patient finally passed away due to complications of a lung infection. This case was filed to the Thung Song criminal court. The first ruling sentenced the doctors to three years’ imprisonment with no probation for medical negligence. The Court of Appeal reversed the ruling as the doctors had no intention to harm the patient. A civil lawsuit was subsequently filed for financial compensation, and compensation of US$ 20 000 plus 7.5% annual interest since the date of the patient’s death was awarded.
5. Case study: four selected Ministry of Public Health hospitals5.1 Governance featuresFour MOPH hospitals (Nakorn Prathom Regional Hospital, Loei and Prae General Hospitals and Huay Phlu District Hospital) were purposively selected for in-depth interviews with key informants from each, such as senior management team members, representatives from ancillary and clinical services, and members of each hospital management committee. A total of 32, 21, 18 and 18 key informants from the four hospitals, respectively, were interviewed in various groups according to their responsibilities. Several common patterns emerged in connection with hospital governance.
5.1.1 Key decision-making power and structures
Similar to other public sector entities, the decision-making structure for MOPH hospitals is centralized; the MOPH Permanent Secretary appoints general and regional hospital directors, while the provincial chief medical officer, representing the MOPH in each province, appoints district hospital directors.

Public hospital governance in Thailand
169
The degree of autonomy in decision-making power varies. Hospitals have full financial autonomy in managing their resources (revenue and expenditure), procurement of medicines and supplies, and hiring and firing staff members who are not civil servants; appointment, promotion and transfer of civil servants, however, are centrally managed either by the provincial chief medical officer or the MOPH.
Provincial health offices and hospitals in the provinces and districts are mandated to implement policies that are formulated by the MOPH. At each hospital, decisions can be made at the operational level, in particular decisions on how to improve service efficiency and quality, and how to sustain trust and support from the communities they serve.
5.1.2 Key accountabilities and incentives
Representation of other stakeholders within hospital governing bodies is very limited. Members of the hospital board, who play management and advisory roles, are appointed by the hospital director. The responsibilities of the board relate to hospital internal affairs, and there are no representatives from civil society, communities or from other government sectors. Members of the hospital board are active in shaping and improving hospital services and mostly serve on the board for longer than the term of the director.
Staff in the case study hospitals have a full sense of social accountability to the communities they serve, as the majority work in their hometowns. Accountability and responsiveness are exercised in accordance with professional standards, ethical conduct, professional ethos, the non-profit nature of public hospitals, and adherence to the 1998 Declaration of Patients’ Rights. The media play an additional role in representing consumer voices. Financial accountability is enforced through NHSO audits, financial audits and reviews by the Auditor General.
Annual contracts for payment and provision of outpatient services are legally signed between the NHSO and the MOPH, as the district, general and regional hospitals do not have legal status to enter into contractual agreements with the NHSO. However, in order to ensure accountability, the NHSO transfers outpatient capitation directly to the contractor network
170
and directly disburses inpatient claims based on a DRG system to the hospitals. This means that an accountability linkage is de facto established between the NHSO and hospital networks, though a de jure linkage was signed with the MOPH. Hospitals are also subject to financial audit by purchaser organizations such as the Social Security Office (SSO) for the SHI, the Comptroller General Department for the CSMBS, and the NHSO for the UCS. Hospitals are also accountable to the MOPH for priority policies, subject to programmatic supervision by the Inspector General of the MOPH.
5.1.3 Management capacity
Professionalized management has been gradually adopted. General and regional hospital directors required high-level management courses, and were gradually promoted from smaller to larger hospitals.
Use of information for decision-making is very advanced. Some hospitals have fully computerized systems to facilitate prompt services, such as laboratory and pharmacy services, and patient appointments. Epidemiological data, disease surveillance, mortality outcomes, use of hospital resources and hospital performance are all regularly monitored.
Rewards and sanctions for staff are based on annual performance assessments; 180 degree appraisals based on merit, participation and transparency are applied in most hospitals.
Continuous quality improvement is a very prominent activity in most hospitals, as 37% of all public and private hospitals were accredited (step 3) in 2012, while 46% achieved step 2, and 3% are still at step 1 (see Section 4.2). Though accreditation is voluntary, it significantly and sustainably improves service quality and patient safety.
After the lawsuit regarding medical negligence, hospitals became more aware of the risks and established various mechanisms for prompt conflict resolution between patients and professionals. The NHSO hotline 1330 helps to mitigate misunderstandings and minimize conflicts between patients and health-care providers.

Public hospital governance in Thailand
171
5.1.4 Technical capacity
Having a professionally qualified clinical staff forms the strength of a public hospital. All staff in general/regional hospitals are board-certified for specialist training, though district hospitals have only general practitioners. Other professional cadres such as nurses, dentists, pharmacists and medical technologists are trained to the bachelor’s degree level and licensed by their professional councils. Staff are motivated by non-profit organization goals and professional ethics.
Hospitals are fully equipped with the necessary diagnostic and therapeutic facilities, depending on the level of care offered, and patients are referred to a higher-level hospital if the care required is beyond the technical capacity of the hospital. Universal coverage of ambulance services, fully financed by the annual budget through the Emergency Medical Institute, is mandated by law.
5.1.5 Relative hospital performance
Technical efficiency was gained when a closed-end payment mechanism was applied, as hospitals were given an incentive to use quality low-cost generic medicines to keep within the margins of capitation and DRG. Systems efficiency was achieved, as DHS serve as the primary care gatekeepers to ensure proper use by level of care. Referral is required for specialized outpatient treatment services and this is financed by contractor networks, while patients are responsible for the costs of care if they bypass the referral chain.
Equitable utilization is achieved through the use of easily accessible DHS services as the main contractor provider. Quality of care is achieved through the application of quality assurance and hospital accreditation, although this is on a voluntary basis and incentive systems are applied.
Effective coverage of NCDs, such as diabetes and hypertension, was achieved through active screening and use of key performance indicators,

172
such as level of haemoglobin A1c25, screening of diabetic retinopathy and referral, percentage of patients with known conditions and adherence to pharmacological and non-pharmacological interventions. The NHSO offers additional pay for performance for cervical cancer screening and other services such as “stroke fast track”.
Integration between health centres and the district hospital in each DHS network was achieved through the NHSO capitation contractual agreement with the DHS network, catering to the whole UCS population in the district.
5.2 Governance responses to reformsA common pattern of responses to reforms emerged across the four case study hospitals. Interviews with key informants in the NHSO confirmed that this is a general country-wide phenomenon.
5.2.1 Responses to the Universal Coverage Scheme
The contract model, in which members are registered with a preferred provider network, results in improved hospital service quality with regard to both clinical and non-clinical aspects, prompt service, courtesy and reasonable waiting times, to keep UCS members satisfied. Hospital income from outpatient services is based on a capitation fee multiplied by the total number of UCS members registered in the network. People are free to choose and to change their registered network four times a year, especially if they are temporary migrants for reasons of employment, find the network inconvenient, or are dissatisfied with the services. When hospitals are paid by DRGs within a global budget for inpatient care, they have no incentive to refer patients out. The supply-side financing (through annual budget allocation) is totally replaced by demand-side financing, in which money follows the population (capitation for outpatient services) and the patients (DRG under a global budget for inpatient services). Hospitals are
25 The A1c test assesses an average blood sugar level over the past 2–3 months, and the result is reported as a percentage. Studies suggest that the lower the A1c level, the lower the incidence of diabetic complications. The American Diabetes Association recommends keeping the haemoglobin A1c level below 7% for good diabetic control.

Public hospital governance in Thailand
173
not fully exposed to market competition due to geographical monopoly. For example, often there is the only one district hospital in a particular locality.
The UCS supports integration and service coordination between the health centres and hospital in the DHS, resulting in continuity of care and quality services. The capitation fee is paid to the whole DHS based on the size of the catchment population in the district, and resources are shared among health centres and the district hospital accordingly. There are still some problems with regard to resource allocation that tends to favour curative over preventive services (Hughes et al.,2010). Basic diagnostics, medicines and medical supplies in health centres, which are supplied and managed by pharmacists in hospitals, significantly improve the quality of services at health centres and facilitate continuity and effective NCD management. These improvements are enabled not only through referrals between hospitals and health centres and weekly doctor visits to provide services at the local health centre, but also by consistency in medications given out by hospital and health centres, which helps to gain patients’ trust and confidence on quality of services. Hospitals have extended their governance through DHS joint governance involving representatives from hospitals and health centres, as well as district health officers, to undertake oversight of UCS operations, budget allocation between the district hospital and the health centres, managing common health problems in the district, service improvement, and information systems improvement.
To respond to capitation, hospitals were found to use quality and low-cost generic medicines to provide services to UCS and SHI members for whom capitation was also applied, leading to technical efficiency. At the provincial level, collective bargaining, or bidding for the best possible price with assured quality, for certain common items (such as intravenous saline) has led to cost savings. Hospitals have incentives to bring down their operational costs to keep some margin from the capitation fee. Hospitals are allowed to keep and use the surplus from purchasing organizations to improve priority services, according to rules and regulations. At the same time, they are held accountable for absorbing the negative balance if resources are carelessly used.

174
In contrast, fee-for-service payments for outpatient services to CSMBS members stimulate excessive uses of non-essential medicines and expensive brand products, resulting in cost escalation and inefficiency (see Figure 12).
Figure 12: Civil Servant Medical Benefit Scheme (CSMBS) expenditure in total and on outpatients and inpatients and annual growth, 1988–2010
3.2 3.5 4.3 5.1 6.07.9
10.011.2
13.615.5 16.4
15.317.1
19.220.5
22.7
26.0
29.4
37.0
46.5
54.9
61.3 62.2
1.7 2.0 2.3 2.8 3.4 4.0 4.8 5.6 5.9 6.2 7.08.1
9.511.4 13.9
16.9
21.9
30.8
38.8
45.5 46.6
2.6 3.1 3.65.1
6.6 7.28.8
9.9 10.69.0 10.1 11.1 11.0 11.3
12.1
12.4
15.1 15.6 16.1 15.8 15.6
1988 1990 1992 1994 1996 1998 2000 2002 2004 2006 2008 2010Year
15.7%
12.5%
19.8%
15.2%
- 1.8%
10.1% 6.1%
11.7%
20.3%
12.1%
-1.7%
5.8%
12.3%
27.5%
6.0%7.9%
-7.4%
10.6% 8.8%
8.0%
22.8%
12.7%
Annual change in total expenditure (real term)Total expenditure
Outpatient (OP) expenditure
Inpatient (IP) expenditurein thousand million Baht (nominal term)
- Copayment for hospital room and board- Limit of IP admission to private hospital
- IP DRG phasing in- OP direct billing
Source: Health Insurance System Research Office, 2014
Hospital financial accountability was exercised by the NHSO through a regular audit of inpatient claims under the DRG system. Initially, in 2006, the NHSO applied a 1% random sampling of inpatient claims for on-site hospital audits. Later, it applied certain criteria (such as audits for records with conflicting data on diagnosis and length of stay, and records of services beyond the hospital’s clinical capacity) to filter anomalies from the NHSO electronic claim database, followed by an on-site audit of these selected anomalous medical records by independent auditors. Independent auditors are selected from among hospital physicians and International Classification of Diseases (ICD) coders, and they are trained to act on behalf of the NHSO.

Public hospital governance in Thailand
175
The audits result in one of the following three scenarios when claims are compared by auditors to the gold standards for case management: i) over-coding and hence overstated claims by hospitals; ii) under-coding, and hence understated claims by hospitals; and iii) consistent coding between the two. Hospitals can appeal if they do not agree with the audit results. The NHSO imposes sanctions for overstated claims by recalling the amount of money equivalent to the excess coding and pays additional funds to hospitals where under-coding has occurred. Through effective training of ICD coders, the mismatches have been gradually reduced. Medical auditing facilitates mutual accountability between the NHSO and hospitals. In 2012, the NHSO audited 1.2% of total inpatient claims, and reclaimed the over-reimbursement by hospitals, totalling US$ 6.07 million. Key informants in the NHSO note that the quality and accuracy of inpatient discharge summaries, with particular regard to diagnosis, co-morbidity and complications, using the ICD (10th version), have significantly improved.
UCS reform has been smooth, as this has not significantly changed hospitals’ existing budgets or purchasing practices. Revenue from the three insurance streams is held in hospital non-budgetary accounts and used for procurement and paying hospital staff according to MOPH rules and regulations. Monthly reports to the Auditor General are still practiced, as required. New requirements by hospitals include on-site medical record audits by the NHSO, electronic claim of all inpatients discharged from hospital for the cost of service provided, as required by the DRG system, and management support to health centres in their networks.
5.2.2 Responses to hospital accreditation
Figure 13 shows the rapid transition from step 1 to step 2 after the quality incentives offered by the NHSO since 2007. Note that an increase in hospitals at step 0 from 1% in 2011 to 14% in 2012 was due to the expiration of hospitals’ accreditation status after three years. These hospitals must be re-accredited and are thus input as step 0. Also, the SSO has offered financial incentives to hospitals achieving different levels of accreditation. In 2013, the proportion of fully accredited hospitals had increased to 40.6% of all hospitals nationwide.
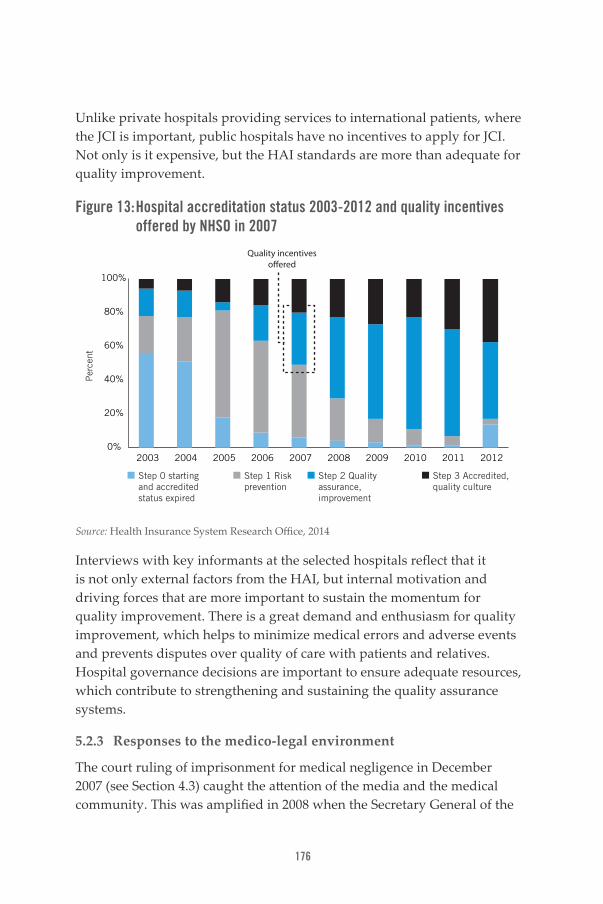
176
Unlike private hospitals providing services to international patients, where the JCI is important, public hospitals have no incentives to apply for JCI. Not only is it expensive, but the HAI standards are more than adequate for quality improvement.
Figure 13: Hospital accreditation status 2003-2012 and quality incentives offered by NHSO in 2007
Per
cent
Step 0 starting and accredited status expired
Step 1 Risk prevention
Step 2 Quality assurance, improvement
Step 3 Accredited, quality culture
0%
20%
40%
60%
80%
100%
2003 2004 2005 2006 2007 2008 2009 2010 2011 2012
Quality incentives o�ered
Source: Health Insurance System Research Office, 2014
Interviews with key informants at the selected hospitals reflect that it is not only external factors from the HAI, but internal motivation and driving forces that are more important to sustain the momentum for quality improvement. There is a great demand and enthusiasm for quality improvement, which helps to minimize medical errors and adverse events and prevents disputes over quality of care with patients and relatives. Hospital governance decisions are important to ensure adequate resources, which contribute to strengthening and sustaining the quality assurance systems.
5.2.3 Responses to the medico-legal environment
The court ruling of imprisonment for medical negligence in December 2007 (see Section 4.3) caught the attention of the media and the medical community. This was amplified in 2008 when the Secretary General of the

Public hospital governance in Thailand
177
Medical Council, Somsak Lohlekha, forbade district hospitals to perform surgical interventions unless an anaesthesiologist was present. As there is no policy on posting anaesthesiologists in district hospitals, the Secretary General’s action resulted in abrupt changes to the services provided by district hospitals. Since then, all surgical cases that were previously carried out successfully by district hospitals, such as hernia repair, appendectomy, caesarean section, vasectomy, tubal ligation and removal of bladder stones, have been referred to general/regional hospitals, resulting in increased burdens faced by these tertiary hospitals.
Analysis of appendectomies from the NHSO national inpatient database confirms that of all appendectomies diagnosed by district hospitals, 26% were operated on by district hospitals in 2006, and this declined to 15% in 2012. Complaints were also made by general and regional hospitals about unnecessary over-referral from district hospitals for surgical procedures that were once performed well by district hospitals. Also, in 2007, when the court ruling was made, the largest number of district hospital doctors resigned and joined private practices; this trend had a tremendous negative impact on the district hospital system, despite the fact that district hospitals are the major hub in translating UCS policies into equitable outcomes.
6. DiscussionThe public sector plays a major role on hospital services, contributing 75% of the total hospitals and 79% of the total hospital beds in Thailand. The MOPH provides the largest share of hospitals and beds among public facilities. District hospitals, which constitute 74% of total public hospitals, are the key hub, as they are easily reached by the district population, and thus contribute to pro-poor utilization and government budget subsidies. It is vital for Thailand to sustain the performance of district hospitals and health centres in an integrated manner, in order to respond to the national demographic and epidemiologic transitions. NCDs require effective continuity of care provided by PHC facilities and home visits for chronic care. Effective referral backup by general/regional hospitals is also essential.
Although MOPH hospitals are very centralized in terms of policy formulation and appointment of managers, hospitals have full financial autonomy to generate, retain and use revenue to improve service capacity, subject to MOPH procurement rules and regulations in a transparent manner.

178
Historically, public hospital directors are physicians who practice management based on their experience, though increasingly they are formally trained in hospital management. Hospital directors who are not physicians are not well accepted by the medical community. The role of “hospital doctor director” has been described by Hughes et al. (2010).
Figure 14 describes the inter-relationships among key actors in health systems, using principal–agent relationships (Grossman & Hart, 1983). The citizen is seen as the supreme principal (shown in the box labelled P) although quite powerless. The government, insurance purchasing agencies (the third party payers) and hospitals thus act as the agents (shown in the box labelled A) and they are expected to be accountable to the citizens, as shown by the arrows from the agent to the principal. The hospitals are the finite agents that are expected to be accountable to the principals – in this case the purchaser organization and the citizen – but are clinically powerful due to the information asymmetry between professionals and patients. This study shows that the professional ethics of doctors, the non-profit nature of public hospitals, and full-cost financing of services hold hospitals accountable to patients.
Figure 14: Principal–agent relationship, Thailand case study
Citizens
Agent
Principal
Government
3 Purchasers: CGD for CSMBS, SSO for SHI, NHSO for UCS
Hospitals: public/ private,
health centres
P P
P
P
PP
A
A
A
A
A A
CGD: Comptroller General Department; CSMBS: Civil Servant Medical Benefit Scheme; NHSO: National Health Security Office; SHI: Social Health Insurance; SSO: Social Security Office; UCS: Universal Coverage Scheme Source: Asia Pacific Observatory on Health Systems and Policies; authors’ synthesis

Public hospital governance in Thailand
179
Prior to the advent of the UCS in 2002, hospitals had already developed and strengthened their governance capacities in both management and technical fields, which provided the platforms for successful implementation of UCS. This study shows that the UCS does not contribute to improvement in hospital governance capacities, but the purchaser–provider split associated with the UCS results in a clear accountability framework between third-party payers, the hospitals and the citizens. In the previous integrated model in which the MOPH owns and finances hospitals through supply-side financing, hospitals did not necessarily need to be accountable to the citizens, as budget allocation was neither linked to numbers of patients served nor how satisfied patients were with hospital care.
The service integration between health centres and district hospitals by financing outpatient services through a capitation budget for all UCS members in a given district contributes to a significant improvement in the governance of the district health systems. This has a positive impact on service quality, use of medicines and continuity of care through effective referral systems.
Closed-end payment mechanisms, such as capitation and DRGs, result in technical efficiency through the use of quality low-cost generic medicines. Annual budgets for UCS are a full-cost estimate, based on outpatient and inpatient utilization rates and unit costs for providing services. Contractor providers felt that the budgets are fair to them. There are no “unfunded mandates”, as long as they operate efficiently by using generic medicines, bringing down prices through provincial bulk purchasing, actively screening and providing preventive services for chronic NCDs, offering health promotion to keep the registered population healthy, and keeping their costs and use rates lower than the national average. Through these strategies, hospitals can keep and use the surplus within their network.
It should be noted that the consumer protection movement and democratized society support the improvement of public sector governance, including hospital governance. The media, in particular television, newspapers and others, hold the Government accountable.
180
Hospital quality is not only driven by stepwise quality improvement; active engagement and a sense of ownership among hospital staff members are also important for sustainable quality development. In this study, the HAI is not the principal as such – it has no contractual relationship with hospitals, but it allies with and uses the NHSO financial incentives to boost quality assurance and accreditation.
7. ConclusionThis study offers some insights into the public hospital sector in Thailand. Public hospitals, in particular the MOPH hospitals, play a critical role in the country. They are fully equipped and are distributed across the nation, in all districts. Prior to the launch of the UCS in 2002, technical and management capacities were fully strengthened, and thus served as a sound platform for effective implementation of the UCS. The DHS, consisting of district hospitals and all health centres, is a strategic hub for pro-poor utilization of services and pro-poor government budget subsidies.
While the UCS does not have a direct impact on the structure of hospital governance, the purchaser–provider split and the contract capitation model (requiring populations to register with a network) established a clear accountability framework between the NHSO and the contractor provider network to respond to the health needs of the population. Hospitals responded to the UCS in a positive way as the budget is a full-cost estimate and equally available to public and private contractor networks. Capitation and DRGs result in cost containment and efficiency gains. In contrast, rapid cost inflation in the fee-for-service CSMBS outpatient care was noted. Hospitals responded to accreditation in a positive way, as they felt the need to ensure patient safety and prevent adverse events.
The Healthcare Accreditation Institute (HAI), in working closely with stakeholders inside hospitals for more than a decade, supports the concerted movement toward quality improvement, although participation is on a voluntary basis. Tapping additional financial resources from the NHSO and the SSO to incentivize hospital quality improvement proved to be a major breakthrough, as the majority of hospitals have improved and achieved steps 1 and 2 and many have advanced to full accreditation (step 3) in recent years.

Public hospital governance in Thailand
181
ReferencesAsia Foundation, The (2011). Dark reality to vote buying in Thailand. In: Notes from the field. Weekly Insight and Analysis in Asia [website], 13 July. San Francisco (CA) (http://asiafoundation.org/in-asia/2011/07/13/dark-reality-to-vote-buying-in-thailand/, accessed 25 July 2014).
Balabanova D, Mills A, Conteh L, Akkazieva B, Banteyerga H, Dash U, et al. (2013). Good health at low cost 25 years on: lessons for the future of health systems strengthening. Lancet. 381:2118–33.
Bundhamcharoen K, Odton P, Phulkerd S, Tangcharoensathien V (2011). Burden of disease in Thailand: changes in health gap between 1999 and 2004. BMC Public Health. 11:53.
Bureau of Medical Registration.(2014). Records of registration and licensing of private medical facilities (unpublished documents). Nonthaburi: Ministry of Public Health, Thailand. Evans TG, Chowdhury MR, Evans DB, Fidler AH, Lindelow M, Mills A, Scheil-Adlung X (2012). Thailand’s Universal Coverage Scheme: achievements and challenges. An independent assessment of the first 10 years (2001–2010). Nonthaburi: Health Insurance System Research Office.
Grossman S, Hart O (1983). An analysis of principal-agent problem.Econometrica. 51(1):7–45.
Healthcare Accreditation Institute (2013). Annual report on accreditation status of hospitals, various years. Nonthaburi: Healthcare Accreditation Institute, Public Organization [in Thai].
Health Systems Research Institute (HSRI) (2012). Lessons learned from transfer of health centres to local government. HSRI Forum. 1(2):1–15. (http://www.hsri.or.th/sites/default/files/hsri-forum2-website%20-2.pdf, accessed 4 March 2014).
Health Insurance System Research Office (2014). Reforming Civil Servant Medical Benefit Scheme (CSMBS. Nonthaburi: Health Systems Research Institute (http://www.hisro.or.th/main/?name=knowledge&file=readknowledge&id=12, accessed 8 August 2014).

182
Hughes D, Leethongdee S (2007). Universal coverage in the land of smiles: lessons from Thailand’s 30 baht health reforms. Health Affairs. 26(4):999–1008. doi:10.1377/hlthaff.26.4.999.
Hughes D, Leethongdee S, Osiri S (2010). Using economic levers to change behaviour: the case of Thailand’s universal coverage health care reforms. Soc Sci Med. 70(3):447–54. doi:10.1016/j.socscimed.2009.10.031.
International Society for Quality in Health Care (ISQua) (2013). International Accreditation Programme Awards 2012–2013, announced at ISQua’s 30th International Conference, Edinburgh, 13–16 October 2013 (http://www.isqua.org/accreditation/accredited-organisations-standards, accessed 25 July 2014).
Jan S, Bian Y, Jumpa M, Meng Q, Nyazema N, Prakongsai P, Mills A (2005). Dual job holding by public sector health professionals in highly resource-constrained settings: problem or solution. Bull World Health Org. 83(10):771–6. doi:10.1590/S0042-96862005001000014.
Jongudomsuk P, Srisasalux J (2012). A decade of health-care decentralization in Thailand: what lessons can be drawn? WHO South-East Asia J Public Health. 1(3):347–56 (http://www.searo.who.int/publications/journals/seajph/issues/seajphv1i3p347.pdf, accessed 24 July 2014).
Lasso P (1986). Evaluating hospital performance through simultaneous application of several indicators. Bull PAHO. 20(4):341–57.
Limwattananon S, Neelsen S, O’Donnell O, Prakongsai P, Tangcharoensathien V, van Doorslaer E (2013). Universal coverage on a budget: impacts on health care utilization and out-of-pocket expenditures in Thailand. Tinbergen Institute Discussion Paper (TI 2013-067/V).
Limwattananon S, Tangcharoensathien V, Prakongsai P (2007). Catastrophic and poverty impacts of health payments: results from national household surveys in Thailand. Bull World Health Org. 85(8):600–606.
Public hospital governance in Thailand
183
Limwattananon S, Tangcharoensathien V, Tisayathicom K, Boonyapaisarncharoen T, Prakongsai P (2012). Why has the universal coverage scheme in Thailand achieved a pro-poor public subsidy for health care? BMC Public Health. 12(suppl 1):S6.
National Legislative Assembly (2007). The Constitution of the Kingdom of Thailand, enacted 24 August BE 2550 (2007). Royal Gazette. 124(47) (http://library2.parliament.go.th/giventake/content_cons50/cons2550.pdf, accessed 8 August 2014).
National Statistical Office. The 2011 Survey on Health and Welfare. Nonthaburi, Ministry of Information and Communication Technology, Nonthaburi 2011 (http://web.nso.go.th/en/pub/soc/556012-healt.htm, accessed 22 September 2014).
Patcharanarumol W, Tangcharoensathien V, Limwattananon S, Panichkriangkrai W, Pachanee K, Poungkantha W, et al. (2011). Why and how did Thailand achieve good health at low cost? (chapter 7). In: Balabanova D, McKee M, Mills A, editors. ‘Good health at low cost’ 25 years on. What makes a successful health system? London: London School of Hygiene and Tropical Medicine:193–223.
Prakongsai P (2008). The impact of the universal coverage policy on equity of the Thai health care system (Doctoral thesis). London: LondonSchool of Hygiene and Tropical Medicine, University of London.
Putthasri W, Kessomboon N, Soonthorn S, Senso O, Daengpayont P, Sengkhampa K (2011). Evaluation of 10 years of Baan Phaew hospital (public organization). Health Systems Research Institute (http://ihppthaigov.net/DB/publication/attachresearch/146/chapter1.pdf, accessed 4 March 2014).
Putthasri W, Suphanchaimat R, Topothai T, Wisaijohn T, Thammatacharee N, Tangcharoensathien V (2013). Thailand special recruitment track of medical students: a series of annual cross-sectional surveys on the new graduates between 2010 and 2012. Hum Resour Health. 11:47.

184
Quah J, editor (2011). Curbing corruption in Asian countries: an impossible dream? London: Emerald Group Publishing.
Rajaratnam JK, Marcus JR, Levin-Rector A, Chalupka AN, Wang H, Dwyer L (2010). Worldwide mortality in men and women aged 15–59 years from 1970 to 2010: a systematic analysis. Lancet. 375(9727):1704–20. doi:10.1016/S0140-6736(10)60517-X.
Rohde J, Cousens S, Chopra M, Tangcharoensathien V, Black R, Bhutta ZA, Lawn JE (2008). 30 years after Alma-Ata: has primary health care worked in countries? Lancet. 370:950–61.
Tangcharoensathien V, Limwattananon S, Suphanchaimat R, Patcharanarumol W, Sawaengdee K, Putthasri W (2013). Health workforce contributions to health system development: a platform for universal health coverage. Bull World Health Org. 91:874–80.
Tangcharoensathien V, Pitayarangsarit S, Patcharanarumol W, Prakongsai P, Sumalee H, Tosanguan J, Mills A (2013). Promoting universal financial protection: how the Thai universal coverage scheme was designed to ensure equity. Health Research Policy and Systems. 11:25.
Tangcharoensathien V, Prakongsai P, Limwattananon S, Patcharanarumol W, Jongudomsuk P (2009). From targeting to universality: lessons from the health system in Thailand (Chapter 16). In: Townsend P, editor. Building decent societies: rethinking the role of social security in development. Houndmills, Basingstoke, Hampshire: Palgrave Macmillan:310–22.
Tantivess S, Werayingyong P, Chuengsaman P, Teerawattananon Y (2013). Universal coverage of renal dialysis in Thailand: promise, progress, and prospects. BMJ. 346:f462. doi:10.1136/bmj.f462.
Thai Working Group on National Health Account (2013). National Health Account 2011, annual report. Nonthaburi: International Health Policy Program, Ministry of Public Health, Thailand (http://ihppthaigov.net/DB/publication/attachresearch/326/chapter3.pdf, accessed 4 March 2014).
Public hospital governance in Thailand
185
Transparency International (2012). Corruption Perceptions Index 2012 (http://www.transparency.org/cpi2012, accessed 25 July 2014).
Transparency International (2013). Corruption Perceptions Index 2013 (http://www.transparency.org/cpi2013, accessed 25 July 2014).
Vapattanawong P, Hogan M, Hanvoravongchai P, Gakidou E, Vos T, Lopez A, Lim S (2007). Reductions in child mortality levels and inequalities in Thailand: analysis of two censuses. Lancet. 369:850–5.
Waage F, Banerji R, Campbell O, Chirwa E, Collender G, Dieltiens V, et al. (2010). The Millennium Development Goals: a cross-sectoral analysis and principles for goal setting after 2015: Lancetand London International Development Centre Commission. Lancet. 376:991–1023. doi:10.1016/S0140-6736(10)61196-8.
Wibulpolprasert S, editor (2011). Thailand Health Profile 2008–2010. Bangkok: WVO Office of Printing Mill, War Veterans Organization of Thailand (http://www.moph.go.th/ops/thp/images/stories/Report_pics/CD_ROM53/Eng/Actwork.pdf, accessed 8 August 2014).
World Bank, World Development Indicator (http://data.worldbank.org/indicator/SP.POP.TOTL, accessed 24 September 2014).
186
E. Public hospital governance in the PhilippinesA case study on health sector reformsOscar F. Picazo

Public hospital governance in the Philippines
187
AbstractThe Philippine health care system is characterized by a combination of public and private ownership of assets and services. Household utilization of these services is still largely dictated by the ability to pay, with the Government providing direct service (through its health facilities) or premium subsidies to poor households under PhilHealth (the social health insurance programme), and the private sector focusing on middle- and higher-income households. The purpose of this study is to determine how health sector reforms in the Philippines have affected hospital governance and delivery of services.
Hospital reforms in four facilities were studied: La Union Medical Center, Leyte Provincial Hospital, National Kidney Transplant Institute/Hemodialysis Center–Fresenius Medical Care Public–Private Partnership, and the Southern Philippines Medical Center. Several lessons and trends were drawn from these case studies.
The most profound health sector reform was the devolution of primary and secondary health services to local government units (LGUs) in 1992. Primary services refer to those provided in rural and city health units and barangay (village) health stations under municipal and city governments, while secondary services refer to those provided in district and provincial hospitals under provincial governments. The immediate effects of devolution were the rupturing of the referral system and the fragmentation of the financing of health services as the administrative, operational, and financial burden of devolved health facilities and programmes were turned over to LGUs while upper-level hospitals remained under the Department of Health.
All the reforms initiated in the case study hospitals responded to the need for a stronger financial base to support and sustain better services. The reforms were achieved primarily through the expansion of internally generated (non-budgetary) funds; initially through patient fees and increasingly through PhilHealth reimbursements. Almost all of the reforms that have succeeded are based on central PhilHealth financing, without which internal revenue generation (based on patients’ fees and other non-insurance sources) would be grossly inadequate.

188
In this regard, PhilHealth and participating hospitals need further strengthening to increase patients’ access to hospital services and utilization; make payment fair and efficient; and establish a provider payment process between funder (PhilHealth) and accredited providers (hospitals, physicians) that is transparent and fair.

Public hospital governance in the Philippines
189
Acronyms and abbreviationsBOT Build-Operate-Transfer
DOH Department of Health
IRA internal revenue allotment
LGU local government unit
LUMC La Union Medical Center
NKTI National Kidney Transplant Institute
PGLU Provincial Government of La Union
PhilHealth Philippine Health Insurance Corporation
PPP public-private partnership
SPMC Southern Philippines Medical Center
SSF special service fee

190
1. Introduction1.1 Country contextIn the last three years, the Philippine economy has blossomed beyond expectations, but this growth is yet to be realized in better health service coverage and the health status of all Filipinos. As the country aspires to become a higher-middle income economy, policy-makers need to focus on more inclusive growth and stronger human development. In the health sector, this is daunting as the country faces a double-edged challenge: the coexistence of the unfinished public health agenda reflected in the Millennium Development Goals with the emergence of the demographic and health transition leading to a higher prevalence of non-communicable diseases (NCDs) and increasing hospitalization. NCDs are growing in part due to the ageing population, more rapid urbanization and congestion as well as work and lifestyle changes brought about by modernization and higher household incomes. Thus, even with the best of public health interventions, there will be even more demand on hospitals in the future. The governance and performance of hospitals, therefore, is a critical policy issue.
Geography and politicsWith a total land area of 343 449 km², the Philippines is an archipelago and its 7107 islands pose a key obstacle to transportation and communication in health care, creating a sensible referral framework for health facilities, and establishing a rational logistics system for commodities. Within major and minor islands there are geographically isolated, depressed areas where indigenous and poor people live in ancestral domains and fragile communities, often eking out a living in the harshest conditions. In some of these areas, the 30-year Leftist insurgency and Muslim separatist movements persist, disrupting Government and community investments in economic and human development.
The Philippines regained democracy in 1986 when a people-power revolution overthrew the dictatorial regime of Ferdinand E. Marcos who ruled with his cronies for over two decades. Since then, national-, local- and village-level representatives have been directly elected by popular vote. In 1991, the Philippine Congress enacted the Local Government Code (R.A.

Public hospital governance in the Philippines
191
7160), leading to the devolution of primary and secondary health services to 79 provinces, 143 cities, and 1484 municipalities.
Many non-governmental organizations are active in service delivery, sector advocacy and legislative monitoring. They include for-profit groups protective of professional and industry interests, business groups, civil society organizations, civil-servants’ associations, and Left-leaning pro-poor and anti-privatization lobby groups. Few formal opportunities exist for these disparate groups to achieve consensus on vital health-sector issues, and differences often boil over in street demonstrations. Indeed, reforms in the health sector are often hindered by protracted discussions.
Demography and economicsThe Philippines is now the 12th largest country in the world. In 2010, the population reached 94.4 million, from around 36.7 million in 1970. The 2% annual population growth means that 1.9 million Filipinos are added each year. Limited economic prospects in rural areas often force people to troop to cities or to seek employment overseas, making many areas in the Philippines prematurely urbanized. About 49% of Filipinos now live in urban areas.
The population remains predominantly young, with 57% of the population below the age of 24. While total fertility rate has declined from 6.0 children per woman of reproductive age in 1973 to 3.3 in 2008, it remains one of the highest in Southeast Asia. Life expectancy at birth has also improved as the country addressed the major reasons for infant and child mortality and morbidity. These trends have led to a demographic transition, with a rising median age, declining dependency ratio and increasing proportion of elderly people (above 60 years old). With this demographic transition well underway, along with greater urbanization and Filipinos’ adoption of more modern diets and lifestyles, a health transition has also ensued. This is characterized by the falling – though still significant – burden of communicable diseases, and the rising burden of NCDs. The top ten major causes of mortality and morbidity now show a significant burden of NCDs such as hypertension, diseases of the heart and vascular system, malignant neoplasms, diabetes mellitus and renal diseases.

192
Until recently, economic growth in the Philippines has not been as rapid as the rest of East Asia. Because of the country’s high population growth, per capita income has virtually crawled at around US$ 2600 per year, putting the Philippines at the lower end of the middle-income bracket. The poverty rate has remained largely unchanged for decades: the figure marginally declined from 33.1% in 1991 to 28.6% in 2009 and 27.9% in 2012.
Part of the problem with poverty in the Philippines – and therefore people’s access to health services – is due to the economy’s weak ability to create jobs, especially for the poorest households. Philippine economic growth has been described by one local economist as “development progeria” – the marked ageing of its industrial (especially manufacturing) base, which has been stagnant for many years in terms of its share of gross domestic product (GDP) and productivity. The Philippines exports a significant number of its workers, rather than creating employment for them at home. The country has been highly reliant on overseas Filipino workers’ remittances, and on revenues from its highly lucrative business process outsourcing (establishment by large multinational companies of call centers offshore, e.g., the Philippines and India, to cater to the service needs of their customers) and other service industries. But in the process it has neglected its manufacturing sector, which is often a source of employment for the poor.
Fortunately, although challenges remain – especially on poverty reduction – the country’s macroeconomy has strengthened and stabilized. From a net external borrower of the International Monetary Fund, the Philippines has become a net external lender. The currency (Peso) has stabilized owing to massive foreign-exchange remittances. Gross international reserves are now at a very comfortable level (one year’s worth of imports). Economic growth over the past three years has been rapid, and the Government budget is now in surplus. The global rating agencies such as Standard and Poor’s and Fitch have conferred on the Philippines investment-grade status.
Sector contextThe Philippine health care system is characterized by a mixed public/private ownership of assets and services. Household utilization of these services is still largely dictated by the ability to pay, with the Government

Public hospital governance in the Philippines
193
providing direct health services (through government-owned health facilities) or premium subsidies to poor households so that they can be members under PhilHealth (the social health insurance programme), and the private sector focusing on middle- and higher-income households. In effect, it is a dual health care system. Reforms in social health insurance are intended to reduce the adverse equity effects of such a system by providing choice to members and by reducing (if not outright eliminating) out- of- pocket payments by households at the point of service.
The Philippines is a major producer of health workers of different cadres and the official policy is to train staff to meet both domestic and external demand. The Professional Regulations Commission licenses around 2600 physicians, 650 dentists, 67 000 nurses, 3900 midwives, 1400 medical technologists and 1200 pharmacists a year (NSO, 2011). While the health workers export policy seems well-intended, it has adverse consequences in the poor domestic retention rate.
Access to drugs remains difficult for poor households due to inappropriate financing (most drug purchases are funded out-of-pocket and bought at the point of need), procurement inefficiencies in the Government system, and an oligopolistic, private local production that is highly dependent on imported ingredients. Historically, the Philippines has had one of the highest retail prices of drugs in Asia. The Generics Drugs Law was passed in 1988 requiring providers to write out prescriptions in generics terminology, thereby giving consumers a choice of drugs to purchase and shifting the balance of power from doctors to pharmacists/consumers. However, it was not until the late 2000s that the generics drugs market blossomed and eased the supply problem, partly through parallel importation.
In terms of overall health financing, the percentage of total health expenditure to GDP has increased, but at 3.4% is still lower than the 5.0% prescribed by the World Health Organization, and lower than most middle-income countries. Per capita health expenditure has also increased, but out-of-pocket spending remains high as a percentage of total health expenditures (NSCB, 2013). Social health insurance spending has grown steadily, but is still low (around 10%) as a proportion of total health

194
spending. Government health expenditure has slightly increased since 2009, but the private sector remains the major funder of health.
2. Philippine hospital system The Philippine hospital network is a mixed public and private system that relies on multiple payment flows, including the Government budget (for Department of Health (DOH) and local government hospitals); PhilHealth; modest private health insurance (health maintenance organizations (HMOs) and private indemnity health insurance); and out-of-pocket financing. In 2011, personal health care expenditures amounted to PHP 338.9 billion, the vast proportion of which was accounted for by out-of-pocket spending (67%), and less so by Government (12%), social health insurance (10%), and private health insurance along with the private expenditures of corporations and schools (10%) (NSCB, 2013).
The infrastructure and staff complement of the Philippine hospital system have not kept pace with population growth. The number of hospitals has remained almost unchanged at around 1700–1800 since the early 1980s, while hospital beds per 10 000 people fell from 18 in the 1970s to just 10 in 2000. This figure increased slightly to 12 beds per 10 000 people in 2010, but hardly reached the ratio established more than a generation ago.
In 2010, there were 1812 hospitals (730 Government and 1082 private). Private hospitals have historically outnumbered government hospitals, although their share of the total has been declining due to low investments. In the 1970s, private hospitals accounted for around 75%, but this share went down to 67% in the 1980s, and measures 60% at present. While private hospitals are more numerous, they tend to be smaller (45 beds on average) than Government hospitals (which average 67 beds). Thus, the ratio of private and public hospital beds is around 50:50. As smaller hospitals are being constructed by the Government to bring health facilities closer to the rural areas, their average number of beds has dropped from 122 in 1976 to 67 in 2010.
The distribution of hospitals across regions has not changed much. The National Capital Region and adjacent regions (Central Luzon and Calabarzon) account for the largest number of hospitals (34% of the total).

Public hospital governance in the Philippines
195
At the other end of the scale are the relatively deprived Autonomous Region of Muslim Mindanao, Caraga, Mimaropa and the Cordillera Autonomous Region that have only 12% of the total number of hospitals. Government hospitals can be further classified according to who owns and manages them. Out of the 1620 Government hospitals in 2011, 75 (4.6%) are DOH- managed; 572 (35.3%) are LGU managed; 5 (0.3%) are owned by state universities; 28 (1.7%) are military; and 4 (0.3%) are managed by other government agencies.
The most profound reform that has affected the government health service and financing system is the devolution of primary and secondary health services to LGUs in 1992 (under the Local Government Code R.A. 7160). Under devolution, LGUs are entitled to a set level of internal revenue allotment (IRA) based on certain socioeconomic indicators (LGU classification based on tax revenues, area, population size and poverty rate), which they then allocate to various social services including health. Under this setup, DOH retained its roles of stewardship, policy-making and regulation as well as the ownership and management of 72 retained regional and upper-level hospitals, 17 regional Centers of Health Development and a handful of attached agencies, notably the Food and Drug Administration.
The immediate effects of devolution were the rupturing of the referral system and the fragmentation of the financing of health services as the administrative, operational, and financial burden of devolved health facilities and programmes were turned over to LGUs , while upper-level hospitals remained under the DOH. Thus, the previously integrated public health and upper-level hospital services were de-linked, weakening the referral system that had been built up over the years under a centralized system. In many LGUs, the devolved functions required far greater budgets than the devolved fiscal resources allocated. Moreover, devolution also stultified the health services in LGUs that were simply suboptimally-sized, while it energized similar services in LGUs that were financially better off or had more enlightened local government executives. The lack of an inter-jurisdictional payment system for referrals and the mobility of patients as

196
well as the frequent bypassing of primary care and district hospitals has led to the further fraying of the financing and delivery system. This has manifested in overcrowded provincial and DOH hospitals, and under-utilized health centers and district hospitals. Data show that all secondary and tertiary Government hospitals are operating way above 100% capacity while many Rural Health Units and primary hospitals are under-utilized. The network model that existed prior to devolution – based in a district catchment area with a district health structure that responds to it – has all but disappeared. DOH has been heroically trying to cohesively reorganize service delivery networks, but with little visible success.
Instead of increasing the local financing of health services, devolution has also led to a decline in the share of local health financing to total health expenditure (NSCB, 2013). The short term of office of local officials (three years, plus the possibility of re-election) also means the near-impossibility of sustaining any gains in local health service delivery, which may not be followed up by the subsequent LGU executive. Many local executives did not prioritize financing health facilities, especially hospitals, which are deemed a drain on local financing. Indeed, quite a few of them successfully returned their hospitals to the DOH as “renationalized assets”.
3. Case studies of hospital reforms3.1 La Union Medical CenterLa Union is a geographically small province in the Ilocos Region (or Region 1), with a medium-sized population of 720 000. La Union Medical Center (LUMC), a 100-bed hospital, is one of six hospitals that were turned over to the provincial government when health services were devolved in 1992. Prior to devolution, LUMC – originally called Doña Gregoria Memorial Hospital (DGMH) – served as the district hospital for 10 municipalities with a combined population of around 400 000 (Astom, 2012). Under this un-devolved and centralized setup, it obtained its annual budget from the DOH to which it reported, and acted as one of two primary referral facilities in the province’s second congressional district, which was also its health district.
When health services were devolved to the provinces and municipalities, the Provincial Government of La Union (PGLU), like the other provinces,

Public hospital governance in the Philippines
197
found itself in grave difficulty meeting the finances needed for its provincial hospitals. Before these reforms, the PGLU spent 33% of its annual budget on its hospitals – PHP 35 million alone being incurred for the running of DGMH. However, this amount was deemed highly inadequate by the PGLU and the hospital managers themselves, who estimated that the hospital would need an annual budget of at least PHP 80–100 million to bring its services up to par for its volume of patients; meaning that it must earn an additional PHP 45–65 million a year from patients’ fees. This underfunding was reflected in the limited staffing resources (especially specialist physicians), the sorry state of its basic infrastructure and the absence of high-end diagnostic and treatment facilities.
The financing problem would have been addressed somewhat if the hospital had been able to retain patients’ fees. However, existing provincial policy dictated that all the funds generated by provincial hospitals had to be channelled to the Provincial General Fund, as was the practice in most LGUs in the Philippines. As a result, the hospital was unable to upgrade its diagnostic and therapeutic capacities. Staff were also poorly paid and some positions were unfilled.
In addition to the annual financing requirements of the provincial hospitals, the PGLU was also saddled with the administrative and operational burden of running the hospital. As a hierarchical unit of the Provincial Government, the hospital exhibited the usual problems associated with centralized management, which in turn were reflected in day-to-day problems such as poorly motivated and inadequate staff, weak information systems and severe delays in the procurement of hospital inputs, such as drugs. The hospital had difficulty recruiting qualified personnel because of the restrictions on salary levels which must follow provincial standards. The hospital was treated as just one of the units under the PGLU, and critical procurements were often delayed because of the high volume of provincial business transactions. Administrative, accountability and transparency structures and processes were inadequate, due to the low level of computerization in the PGLU as a whole.
In the late 1990s, the European Union (EU) chose the hospital as the site of an €11.3 million (PHP 650 million) hospital rehabilitation programme,

198
which triggered its policy and institutional reform programme spearheaded by the PGLU. The new buildings were turned over to the Provincial Government in December 2001.To manage this new facility, the PGLU committed to transform it from a hierarchical unit of the province into an economic enterprise and then eventually into a fully autonomous hospital. The Province’s vision for the hospital is for it to be run by professional managers working under the structure of a corporate economic entity – a vision that could not be realized if it stayed as an appendage of the provincial administrative structure.
3.1.1 Reforms undertaken
The Local Government Code permits LGUs to run their social services as economic enterprises i.e., revenue-earning entities. Following the PGLU’s vision, on 8 April 2002 the Philippine President Gloria Macapagal Arroyo formally closed all operations of the old hospital before opening the new and renamed La Union Medical Center. On 15 April, the President subsequently issued Executive Order No. 4 transforming LUMC into an economic enterprise for sustainability and development. Finally, LUMC was made an autonomous hospital through a special charter of Congress (Republic Act 9256) that was signed into law by the President in March 2004. With this law, LUMC became the first LGU hospital that was turned into a non-stock, non-profit local government-owned and controlled corporation. So far, it is still the only LGU hospital to have achieved this status.
The autonomization of LUMC entailed a range of reforms in governance and management, including: a change in vision and mission (as a multispecialty centre involved in training and research); the expansion of its mandate and catchment area (from a district to a provincial hospital); advocacy with the municipal mayors of the province; the formation of an independent board of trustees; the creation of management teams in various technical fields; the installation of human resources, financial, procurement and other support systems; the training and capacity-building of its staff; the acquisition of new medical technology through outsourcing and public–private partnership (PPP) arrangements; and the implementation of a socialized pricing structure as well as the more focused claiming of PhilHealth reimbursements.

Public hospital governance in the Philippines
199
3.1.2 Governance structure
The hospital’s enabling Act envisioned a governance structure that was transparent and accountable; with a wide latitude to carry out activities; efficient; and with a strong political will for change. Through its enabling Act, the hospital ceased to be a unit of the PGLU hierarchy and became an independent institution governed by a Board of Trustees, with the governor of the Province as the Chairman, the Vice Governor as Vice Chairman, and 15 others as Trustees. The Provincial Governor acting as Chairman of the Board was intended to ensure that the PGLU’s commitments, in terms of budgetary support (PHP 30 million a year), would continue.
As an autonomous hospital, LUMC is deemed to be a Government corporation owned and controlled by the province of La Union. Its charter makes it independent and flexible in making decisions pertaining to its institutional direction and operations. The changes in accountability and decision-making pertained to a wide range of functions including the hiring and firing of staff; the procurement of civil works, equipment, goods and services; fee setting and retention; the generation/mobilization and use of internally generated funds; and contracting arrangements e.g. entering into PPP.
The creation of the Board of Trustees means that the governance of the hospital and decisions about its strategic direction were moved from the Office of the Governor, which barely had time to deal with hospital issues in the past, to a dedicated number of Trustees selected for their knowledge of hospital development. The Trustees were selected from among Government and private sector leaders who were knowledgeable about health sector development. The initial key decisions made by the Board had to do with the review and approval of the hospital’s Economic Enterprise Sustainability Framework which covered:
• the finance and pricing strategy, which defined the overall resource mobilization of the hospital including PhilHealth reimbursements, patients’ fees and subsidies from the PGLU;
• human resources development and the alignment of staff and incentives along a corporate structure and culture, and the increase in the number of employees from 138 to 278 plus 48 others to implement improved career-path arrangements;

200
• administrative and operational computerization, including that of the hospital’s accounting and financial system; and
• centralized procurement and supply chain management. The Board and senior hospital managers were also mandated to undertake advocacy work with municipalities whose constituents will be using the newly corporatized hospital.
The day to day running of the hospital was assumed by a professional team along with the 17 hospital committees mandated by the hospital’s enabling Act, including the Committees on Staff Promotion and Selection, Training and Research, Grievance and Ethics, Therapeutics, Utilization Review and Quality Assurance, and others. The management team obtained Board approval for the following key elements of hospital operations: i) joint venture (PPP) agreements for access to medical equipment, including a haemodialysis machine and laboratory equipment. Under these agreements, the private investors place their machines on the hospital premises before paying the staff, rent and other necessary costs and then share 15% of the revenues with the hospital; ii) fee-setting and cost-recovery, which is based on the principle of ability to pay, the implementation of payment in-kind or in-service, and the subsidization of the poor; iii) other income-generating activities including the operation of a pharmacy, the income from which augments the funds for medicines for indigents; and iv) the installation of an integrated information system which interlinks computers in billing and cashier sections for easy monitoring of cash flow. LUMC has also installed the new Government accounting system to ensure transparency and efficiency.
3.1.3 Results of reforms
LUMC was given the prestigious Gawad Galing Pook Award for excellence in local governance in 2004, from among 189 entries nationwide. It is frequently cited as a model for Philippine hospital autonomization and corporatization. Among its key achievements have been the following: i) the total number of patient discharges per year has increased from an average of 8 056 in 1995–2001, prior to the autonomization, to 11 481 in 2002–2008 afterwards; ii) within the same period, charity inpatients declined from 84.7% of the total number discharged to 53.4% due to the enrolment of a significant number of households under the PhilHealth Sponsored Program whose premiums are subsidized by the Government; and iii) correspondingly, the proportion of PhilHealth inpatients increased from 10.2–38.8%, while private pay patients

Public hospital governance in the Philippines
201
increased from 5.1–7.8%. Outpatient department patients increased from 23 856 in 2002 to 49 434 in 2008.
In terms of financing, the hospital’s PhilHealth collections increased several-fold from PHP 1.1 million in 2002 to PHP 19.1 million in 2008. Moreover, total collections from all hospital services – inpatient as well as outpatient, pharmacy and diagnostic services – increased from PHP 11.1 million in 2002 to PHP 57.8 million in 2008.
From the point of view of the PGLU, which owns the hospital, the hospital autonomy given to LUMC has freed the LGU of day to day operating problems as well as from worries about fiscal issues concerning its management. From the point of view of the hospital management, LUMC’s conversion into an autonomous corporate entity has been helpful in obtaining greater management latitude through the exercise of hospital corporate powers; the acquisition of technical expertise in such areas as medical technology, organizational management and other scarce skills through hospital Board membership; entering into contracts and other legal transactions, especially with respect to the acquisition of medical equipment through PPP; greater leeway in managing employees, free from the constricting civil service regulations; and greater overall stability as hospital governance is shielded from changes in local administration and elections. From the point of view of the employees, the autonomy and improved financial position of the hospital has given them better working conditions, more stable jobs and better salary structures, relative to what they experienced before the autonomy.
3.2 Leyte provincial hospitals Leyte is an island province in Eastern Visayas (or Region 8) with 40 municipalities and a population of 1.5 million in 2012. Although the province is politically independent, two cities are also within the province, Ormoc and Tacloban – a highly urbanized area. The Leyte Province inherited 12 public hospitals (nine district- or secondary-level and 3 community- or primary-level) when these were turned over by the DOH in 1992. Until the Province-wide hospital reforms were initiated in Leyte in the early 2000s, these provincial hospitals were operated and run independently by each hospital director, although they obtained their budget from the Provincial Government.

202
As in any province that inherited hospitals from the DOH, Leyte’s hospitals were poorly funded, mainly because the annual revenue the Province received from the national Government was not enough to fund the social and other services that the Province inherited. Moreover, Leyte Province is not wealthy and has few revenue sources. The Province was spending as much as a third of its IRA on running its hospitals, and the costs were increasing every year. In 2003, the provincial hospitals had combined running costs of PHP 227.3 million but were only collectively generating hospital revenues of PHP 7.3 million a year, necessitating a provincial subsidy of PHP 220.0 million. In the following year, the hospitals’ costs increased to PHP 233.8 million; and, although their revenues also increased to PHP 10.4 million, overall the subsidy required increased further to PHP 223.4 million.
The underfunding manifested itself in the poor condition of the hospitals, including dilapidated hospital buildings; poor facilities and services; a shortage of doctors who were poorly motivated and who were often nowhere to be found; poorly motivated hospital employees; and a lack of medicines and hospital supplies. Due to the bad reputation of these public hospitals, they tended to cater only to poor and lower-middle-class patients. And because of the worsening conditions of these hospitals, their overall census declined from 5867 people in 2003 to 5531 people in 2004.
The financial rescue and reform of the Leyte provincial hospitals focused on retaining medical doctors. In the view of the then-incoming Provincial Governor, hospitals cannot be sustained without doctors who are not only the medical providers but the generators of revenues through their services as well. This vision involved hiring full-time doctors and lessening the reliance on part-time private doctors, incentivizing doctors by maximizing the collection of PhilHealth reimbursements, and imposing reasonable fees on users, except the poor.
3.2.1 Reforms undertaken
There are two complementary flanks of the hospital reform programme in Leyte. The first is Leyte’s own provincial hospital reforms, i.e. financing and supply-side reforms (Petilla, 2013). The second involves reforms to the PhilHealth social health insurance programme, which now provides
Public hospital governance in the Philippines
203
premium subsidies to the poor and quickens the eligibility verification system so that members can access services and make reimbursement payments to the provincial hospitals more easily. These reforms are deemed innovative in the context of the Philippines. This is because they focused not on infrastructure (the usual starting point of many hospital upgrading programmes), but on building a self-sustaining system of health financing. This makes it possible for physician and human-resource improvements to be made on public hospitals without entailing direct budgetary infusion from the provincial treasury.
The Leyte provincial hospital reforms were initiated by Carlos Jericho L. Petilla when he became Governor in 2004 and was re-elected for another three-year term in 2007. A private-sector business manager by profession, he realized that the financial difficulties of these hospitals can only be addressed through more aggressive revenue generation, professional management and better incentives to doctors and staff. As soon as he assumed office, Governor Petilla created the Hospital Enhancement for Leyte’s Progress (HELP) programme in August 2004.
The first flank of this reform programme is fee-generation and the earmarking of funds for hospitals with set rules under the Office of the Governor for their distribution as staff incentives. This is supported by the Special Service Fee (SSF) scheme – a user-fee programme started in the Leyte Provincial Hospital in Candahug, Palo and then expanded to the other provincial hospitals to generate financing for the retention of doctors and upgrading of hospital services. To achieve this, patients are asked and assessed by a social worker whether they want to stay in the pay ward (PHP 800/day) or free ward, and whether they prefer the services of their personal doctor (for which they have to pay) or not. Poor patients, as determined by the social worker in the hospital, are not required to pay. Patients pay only to hospital cashiers, while payments to individual doctors are strictly forbidden (enforced via closed-circuit TV cameras in the hospitals). A patient who agrees to these terms signs a consent form and a hospital representative issues the corresponding SSF slip. All fees are standardized across all provincial hospitals (which were all secondary level), and collections are centralized in a single fund under the Provincial Government.
204
Other elements of this reform programme include formally allowing dual practice among doctors; the setting aside of private wards in Government hospitals where paying patients stay; the creation of a dedicated fund where hospital fees are collected; and the formulation of rules on how these funds should be used. As stipulated in a 2006 Provincial Board Resolution, the SSF revenues are distributed as follows: 70% for the attending physician, 20% for the support staff, and 10% for the Province (since the hospital continued to receive subsidies from the Province). Of the 20% given to support staff, 50% was allocated to the assisting physician, physician aides, operating room nurses, pharmacist and the chief of clinics.
Leyte’s resource mobilization programme for hospitals also involved the more focused claiming of PhilHealth reimbursements (hospital fees and professional fees), and the setting of rules for their use (rather than discretion). As stipulated in the Provincial Board Resolution, PhilHealth hospital income is distributed in a way that corresponds to the expenditure of each hospital. This benchmark amount is deducted from the gross income of the hospital to yield its net income: 50% of each hospital’s net income goes to the provincial coffers (since hospital staff remain provincial employees) and 50% goes to the hospital. Of the 50% retained by the hospital, 30% is allocated to maintenance and other operating expenses, 30% to capital outlay, and 40% to employee incentives. Of the 40% allocated to employee incentives, 20% is for hospital doctors and 80% is for nonmedical staff.
PhilHealth professional fees for doctors are distributed as follows: 20% goes to the Provincial Health Development Fund which was established to pool funds for the improvement of provincial hospitals, and 80% is a professional fee, of which 85% was given to the obstetrician/gynaecologist or other specialist (or 75% to a surgeon with assistant), 10% to the assisting doctor or nurse, 5% to the chief of hospital, and 10% for the pool to be used for other health workers.
The second flank of the hospital financing reforms in Leyte involved improving the management of PhilHealth members’ eligibility through the creation of a call centre called PhilHealth LINKS in 2010 in Tacloban – the regional centre of Eastern Visayas. This was also initiated by Governor

Public hospital governance in the Philippines
205
Petilla, through close coordination with the regional office of the PhilHealth. The PhilHealth LINKS call centre responds to the problem of protracted and often missed identification of PhilHealth members, especially those who were enrolled quickly under the premium subsidy programme and who have not received their membership cards.
A major problem of PhilHealth is the low demand for benefits by its members. The 2008 Benefit Delivery Review indicates that only 6.2% of PhilHealth members utilized their membership for inpatient hospitalization that year. This problem has been traced to many factors, for example, the cost of reaching members through information, education and communication campaigns is very prohibitive. Many new members, such as poor families whose premiums are paid for by the government under the Sponsored Program, were handed out membership cards which contained little information on how they should be used. Members often misplace the cards, or find it difficult to prove they are members because they are unable to produce birth certificates and meet other administrative requirements. PhilHealth’s policy on dependents is also extremely complicated (e.g. the children of single mothers are particularly disadvantaged, since single mothers and their children are not legally deemed “family”). Households are often unaware of the need to renew their membership annually, which may have lapsed as a result. Some hospitals prefer cash payments rather than delayed PhilHealth reimbursements and may intentionally control members’ access to benefits. Prior to the introduction of case rate payments, complicated PhilHealth rules on birth delivery – PhilHealth reimbursed delivery expenses only up to the fourth child, for example – also disincentivized many health facilities from assisting PhilHealth members to claim such benefits.
To correct these problems, PhilHealth Region 8, through the intervention of the Leyte Provincial Governor, initiated the LINK call centre that members can contact to assist in the verification of their membership. The Province of Leyte pays for an employee (PhilLINK) stationed at the call centre who serves as the call-centre agent for all 12 hospitals of the Province. In addition, the Province pays for provincial employees (PhilHELP) stationed within the 12 hospitals, who assist members when they are admitted and provide information on their health insurance benefits until they are discharged with completed claims forms.

206
Call inquiries from across Leyte to PhilHealth LINKS have increased from 5815 in 2011 to 24 994 for the first six months of 2013. Correspondingly, during the same period, new members have increased from 4856 to 18 918. Largely because of this system, as much as 76% of the callers during the first six months of 2013 have been confirmed to be PhilHealth members – higher than the 74% in 2012. As a result, the PhilHealth claim rate by Leyte hospitals has improved dramatically. For instance, data from the Leyte Provincial Hospital in Palo showed that only 30% of the patient census in 2005 consisted of PhilHealth members. This proportion had increased to 75% by 2011.
3.2.2 Governance structure
The hospital reform programme was orchestrated under the Office of the Governor who created the Provincial Ad Hoc Committee on Health in August 2004 to implement the vision laid out in the HELP Program. The Committee met and drafted the necessary rules and guidelines on the sources and allocation of fee revenues and PhilHealth reimbursements; the training and study tours for medical and nonmedical hospital staff; the installation of a financial management information system; the acquisition of medical equipment; and the approval of hospital facility improvement plans. Consequently, the Committee became the de facto governing and decision-making body for the HELP Program. The rules and guidelines, in turn, were issued as Executive Orders, Provincial Resolutions or Provincial Board Ordinances by the Office of the Governor. For regional initiatives, the Office of the Governor works very closely with the Regional Office of PhilHealth. For example, on the LINKS call centre programme.
Health service devolution transferred the governance of hospital services from the national Government to provincial government units in 1992, which then funded them largely with meagre IRAs from the national Government. This left many hospitals under the de facto governance of individual directors. For many years, this governance function was passively dispensed by most LGUs that did not know what to do with these assets and deemed them financial liabilities. The Leyte hospital reforms are important in the Philippine context for two reasons. First, they were the first attempt to deal with hospital financing in a comprehensive and politically active manner, using the same governance function that has been
Public hospital governance in the Philippines
207
available to LGU executives since 1992. Thus, while the Leyte Governor did not acquire additional powers, he simply exercised the functions that the Local Government Code conferred on him, and which many similarly placed LGU executives have difficulty exercising. What does seem to set the Leyte Governor apart from the other provincial executives is his vision and technical knowledge of how to go about the reform programme.
Second, the Leyte reforms reorganized the governance of LGU hospitals from individual directors left mostly on their own, to a governance system resembling a holding corporation under the Office of the Governor, issuing policies and guidelines to be followed by all hospitals in the Province. It is also critical to note the importance of the common fund, obtained from all sources and retained by the Office of the Governor – i.e. 10% of the SSF, 20% of the PhilHealth professional fee revenues and a benchmark amount from the PhilHealth hospital reimbursement. This income is used as an equalization fund to ensure that the provincial hospitals do not develop in an unbalanced way. To sustain the impetus of the reforms and ensure that standards are commonly applied across all provincial hospitals, relevant provincial resolutions and ordinances have been passed. These also make certain that the reforms will continue beyond the term of office of the elected provincial officials.
3.2.3 Results of reforms
The positive impact of the reforms has been unmistakable. The overall budget of the 12 provincial hospitals increased from PHP 227.3 million in 2003 (at the start of the reforms) to PHP 272.2 million in 2012. During the same period, income generated from fees and PhilHealth reimbursements increased from a measly PHP 7.3 million to a whopping PHP 118.4 million. As a result, the level of provincial subsidy has declined from PHP 220.0 million to PHP 153.8 million as planned. The subsidy is expected to decline further to about PHP 100.0 million in 2013 as PhilHealth reimbursements increase. Also, as a result of more citizens being enrolled in PhilHealth, the revenues from the SSF have remained stationary at around PHP 4.0 million a year since 2011.
Doctors are now much better remunerated. There are no longer any vacancies for medical specialists in any of the provincial hospitals. Indeed,

208
there is a queue of doctors wanting to apply. Provincial doctors earn anywhere from PHP 40 739–162 169, probably the best-earning provincial government doctors anywhere in the Philippines.
Despite the increase in fees for those with ability to pay, overall hospital census among provincial hospitals has nearly doubled from 5867 people in 2003 to 9973 people in 2012.The patient profile has also changed: while only 29% of the patients were PhilHealth members in 2005, this had risen to as much as 74% by 2011.Primarily due to the hospitals’ better technical capacity and services, and much-improved physical amenities due to capital upgrading, referrals from Rural Health Units have increased from 849 patients in 2005 to 983 patients in 2011, while referrals to other hospitals declined from 337 to 293 patients over the same period, mainly because improvement in the hospital allowed it to provide services to these patients who used to be referred.
3.3 National Kidney Transplant Institute/Hemodialysis Center– Fresenius Medical Care
The National Kidney and Transplant Institute (NKTI) is one of the four apex and autonomous hospitals established by the then President Ferdinand Marcos in the early 1980s – all located within a kilometre-radius of each other in Quezon City’s central business district. Established in 1983, NKTI is a Government owned and controlled corporation that has evolved into one of the top kidney and liver transplant hospitals in Asia.
During the first few years of NKTI’s operation, it had five haemodialysis machines used by inpatients and outpatients. In response to the rising number of dialysis patients, NKTI purchased 16 additional machines in 1998 through public bidding using the hospital’s budget for capital outlay. In 2000, four additional haemodialysis machines were purchased. These 20 machines provided 144–180 haemodialysis sessions for patients on twice-a-week treatments. At this scale, NKTI’s Hemodialysis Center was the largest in the country. But, at this capacity, the hospital was still turning away three new dialysis patients each day. However, in the wake of the Asian financial crisis during the late 1990s/early 2000s, the DOH was unable to increase the capital and recurrent budget of the hospital, as was also the case with the other DOH-retained hospitals.
Public hospital governance in the Philippines
209
The increasing demand for haemodialysis procedures coupled with the hospital’s financial difficulties, led to an impending vicious cycle of worsening services. An analysis of the problem showed that the daily pressures on the capacity of the Hemodialysis Center were creating frequent equipment breakdowns which caused logjams in maintenance, repair and other technical support (Riego-Javier, n.d.). Owing to the complex and protracted government bidding and procurement procedures, response times for repair and replacement of spare parts (usually 2–3 days) worsened, leading to the cancellation of treatments. Emergency cases could not be accommodated immediately due to the lack of machines; or, when they were given priority, other patients had to be dislodged from their original schedules, causing patient dissatisfaction. Due to increasing demand, the hospital warehouse became unable to accommodate all the necessary supplies to support haemodialysis services, leading to further delays. The staff were also showing fatigue as they had to juggle patients with whatever equipment was available, and staff turnover was becoming a problem. The hospital’s ownership of the equipment became a major management burden, and their replacement added to the problem due to the overall freeze in capital outlay.
The dilemma of increasing patient load and zero capital financing led the hospital’s management and Board to consider other options aside from the traditional financing of investments. In 2001, according to hospital administrators (led by Dr Aileen Riego-Javier, Executive Director), the expansion of the hospital’s Hemodialysis Unit became an essential and immediate priority of NKTI. The hospital management, working with the hospital Board, developed the following objectives: i) to expand the provision of haemodialysis services with a total of 31 machines, increasing the number of slots to 372 per week, for patients on twice-weekly treatments; ii) to establish a world-class haemodialysis centre in the country, with a separate facility for inpatients and another facility for outpatients; iii) to provide the best quality of haemodialysis treatment at an affordable cost; and iv) to provide a regular training programme for the hospital’s haemodialysis nurses along with technicians from other Government hospitals.

210
3.3.1 Reforms undertaken
To solve the problem of the high costs of new equipment and sustaining supplies for 180 haemodialysis sessions per day, in addition to removing the responsibility for maintenance and repair from management, the hospital embarked on a PPP arrangement with an external partner via public bidding. The PPP strategy follows the national Government’s Build-Operate-Transfer (BOT) or long-term lease approach that was being applied in large infrastructure projects but had not been tried in the health sector. The legal framework for this reform in service delivery and financing had already been established under R.A. 6957 (BOT Law), as amended by R.A. 7718, which authorized the financing, construction, operation and maintenance of infrastructure projects, including health, by the private sector.
The BOT scheme is a type of financing for long-term Government infrastructure projects, which sees the Government providing a lengthy concession to a private partner that arranges the building, operation and eventual transfer of the infrastructure. In return, the Government agrees to pay an annual unitary payment to the private partner until the concession ends. Hospital BOT, or its other variants, is a form of performance-based financing, since the concession agreement specifies the benchmark that the contractor is legally obligated to meet in exchange for the payment from Government.
The NKTI Hemodialysis Center is a PHP 54 million facility constructed as a PPP between NKTI and its private partner, Fresenius Medical Care. NKTI had a minimum equity contribution of 20% and Fresenius Medical Care put up 80%. The contract period initially ran for five years (2003/04– 2007/2008) but has since been extended for another five years (2009–2013). Fresenius supplied and replaced the Center’s haemodialysis machines including state-of-the-art water treatment and dialysis reprocessing technology; provides service technicians at all times; and ensures the around-the-clock availability of supplies. NKTI, in turn, pays the lease provider a fee per treatment in accordance with the pre- agreed lease payment schedule. It also meets the space, staff and utility requirements; monitors the partner’s quality performance in accordance with international standards; and ensures compliance with relevant Government regulatory health policies.

Public hospital governance in the Philippines
211
3.3.2 Governance structure
The BOT/PPP was put in place largely by the NKTI management team based on the decisions of the autonomous hospital Board. Would NKTI have succeeded in formulating and carrying out the Hemodialysis Center PPP if it were not autonomous? Hospital administrators have reported that its autonomy has allowed managers and Trustees to be more open-minded about potential options and more flexible in negotiations with potential offerors. Autonomous hospitals can also exercise greater latitude in terms of the size and modality of procurements and contracts, which non-autonomous hospitals cannot. Moreover, by delegating governance and decision-making to the Board of Trustees, the DOH has been able to devote more of its time to other pressing matters in the health sector.
However, as the following case study (Southern Philippines Medical Center) shows, the lack of hospital autonomy is not a complete deterrent to hospital reforms. Certain reforms can still be carried out even if the hospital is not autonomous, provided it has visionary leadership, adequate technical capacity to formulate and implement the reforms, and set rules and guidelines on how specific reform measures and operational aspects are to be achieved. Hence, while autonomy can be a facilitating factor for reforms, it is not the only key that can unlock potential innovations.
The major change in accountability and decision-making that resulted from this BOT/PPP reform is the delegation of day-to-day management of haemodialysis – equipment acquisition, procurement of supplies, scheduling of preventive maintenance, training of haemodialysis nurses – to the private-sector partner (Fresenius), based on the contract that both parties signed. In other words, the contract became the governing instrument for the reforms to take place. To make such an arrangement work requires a strong and high-level regulatory and monitoring capacity within the hospital. It is not clear, however, whether this is a governance or a management responsibility, although it does seem to be dispensed by both.
3.3.3 Results of reforms
NKTI was able to acquire the latest haemodialysis technology and expand its services to more patients at the same cost of treatment and less risk to the Government – such as the risk of project non-completion. The project was

212
formulated and awarded in a short time (about two years). Thanks to more machines and greater reliability, haemodialysis treatment has been extended to more Filipinos. From 2007–2010, the total number of dialysis patients reached 27 522, or around 6880 a year (or 19 a day). Access among those with a limited ability to pay has been enhanced – the fee at NKTI (around PHP 2000 per week) is still far more competitive than those in the private sector (around PHP 4000 per week). The PPP has also intensified nurses’ training programmes and improved the rotation of nursing staff. Nursing staff turnover has also been controlled. Finally, while the hospital’s annual Government budget has remained fairly constant since 1998, hospital fee revenues have increased dramatically and haemodialysis revenues have consistently outpaced the payment made to the PPP partner since the scheme started.
3.4 Southern Philippines Medical CenterThe Southern Philippines Medical Center (SPMC) is a tertiary referral hospital in Davao City – the largest metropolitan area in Mindanao, the Philippines’ second largest island. It is one of 72 hospitals retained by the DOH when health services were devolved in 1992, and serves as the regional hospital for the Davao Region, an agriculturally rich area. It has an authorized bed capacity of 600 but its average inpatients per day reach 1107 – a bed capacity exceeding 226%. The outpatient department attracts, on average, 1096 patients per day.
Like most large retained DOH hospitals, it is not autonomous and has faced financial difficulties for many years. It has not received a budget for capital outlay over the past three years (2010–2012), even though its patient-load increases every year. Its recurrent budget barely increased from PHP 250 million in 2011 to PHP 261 million in 2012. Given the more pressing needs of the DOH, it did not seem likely that the hospital would get relief from its financial problems with help from the national Government. The zero capital outlay meant the hospital was not able to improve and upgrade much-needed diagnostic and therapeutic equipment, much of it in bad condition. Given its sizeable patient-load, drug shortage was also common.
In 2008, the hospital conducted a stocktaking exercise which identified revenue generation, through the maximization of PhilHealth benefits, as

Public hospital governance in the Philippines
213
the key strategy to get out of its financial difficulties (Vega, 2013). This would also pave the way for the hospital’s future of efficient, effective and sustainable service delivery based on medical upgrades and much-improved human resource development. The chain of problems originated with the poor morale of employees, most of whom deemed claims-filling to be an additional and needless task, used as they were to passively receiving DOH subsidies and not having to actively earn it, as is the case with health insurance reimbursements. This staff attitude resulted in inaccurate data, miscoding and the computation of claims. This arose, in turn, from inadequate receipts; poor and unreadable penmanship, especially of doctors; a lack of information among doctors and nurses about the benefits of PhilHealth claims; a lack of knowledge among billing clerks on claim preparation, prescriptions using non-PNDF (Philippine National Drug Formulary) which PhilHealth does not pay, and the use of non-standard paper. The combined effect of these problems was a high rate of “return to hospital” claims, many of which were denied payment by PhilHealth. Poor collection followed, setting off a vicious chain ending with ill-incentivized workers.
3.4.1 Reforms undertaken
Three interrelated reforms were undertaken at the SPMC: hospital financing reforms to increase the revenue flow; the adoption of drug consignment as a system of accessing drugs from the private sector; and PPP as an approach to greater access of diagnostic technologies. To break the chain of low finances due to a lack of claims submitted to PhilHealth, the hospital management adopted a multi-pronged approach to maximize health insurance reimbursements, thereby significantly increasing the flow of revenues needed to improve the running of the hospital. First, management decided to gradually increase the number of PhilHealth billing staff from 7 to 40; provide regular training to appropriate doctors and nurses in ICD-10 – a standard for medical diagnosis and billing codes endorsed by the World Health Assembly; and assign three doctors as medical adjudicators. Second, all nurses were trained in the precise charging of supplies for procurement, to be reflected in costs. Third, a quality assurance system was put in place for documents to be near-perfect (“PhilHealth friendly”); increase compliance among doctors and nurses, while improving the legibility of their penmanship; and make all PhilHealth computations accurate.

214
To address the recurrent problem of drug shortages, the hospital pioneered a drug consignment system in which private pharmaceutical suppliers placed their inventories in the hospital and SPMC merely paid for what it consumed on a periodic basis. Thus, there was no upfront cash payment involved, and the hospital management was freed of the inventory task and stock-out problem.
To have access to modern medical equipment without resorting to large upfront investment, the hospital management adopted an innovative PPP involving a publicly bid, multiyear (usually 3–5 years) consignment of medical equipment through unit-cost-per-test payment to the private partner. These were put in place for new chemistry and immune-assay analyzers (at an estimated cost of PHP 14.8 million), two haematology analyzers (at an estimated cost of PHP 6.0 million), dialysis machines (at an estimated cost of PHP 14.0 million), computed radiography and digital radiography equipment (at an estimated cost of PHP 35.0 million), and 50 mechanical ventilators (at an estimated cost of PHP 77.4 million).The hospital also entered into publicly bid lease-to-own partnerships (usually within 5 years) with the private sector which covered: a 16-slice computerized tomography (CT) scan (at an estimated cost of PHP 31.0 million); and a 128-slice CT scan (at an estimated cost of PHP 77.0 million).
3.4.2 Governance structure
The hospital remained non-autonomous before, during and after the reforms. Its governance structure remained the same – as a DOH-retained hospital. This case study shows that the reforms were facilitated by strong, visionary leadership (the hospital Director was in the private sector before going into the Civil Service) rather than an explicit change in institutional governance. However, the contracts with private suppliers (pharmaceutical and equipment consignments) became the basis of the governance structure. It also helped that there was strong agreement among hospital managers on what needed to be done as well as the approach to get there. Finally, the hospital rules and guidelines on PhilHealth claiming and reimbursement as well as PPP/consignment provided the institutional basis on how to implement the reforms.

Public hospital governance in the Philippines
215
3.4.3 Results of reforms
The reforms have resulted in an increase in the proportion of PhilHealth-covered patients, from 32% in 2008 to 44% in 2012. Correspondingly, PhilHealth reimbursements have increased dramatically from PHP 170.4 million in 2008 to PHP 436.9 million in 2012. Due to the 156% increase in PhilHealth reimbursements, the hospital has been able to embark on a large-scale capital investment programme including: the upgrading of two pay wards; the construction of a new pay ward and nurse station; the upgrading of the PhilHealth service ward; improvement in the specialty wards (obstetrics/gynaecology; ear, nose and throat; internal medicine; pediatrics); the installation of a pneumatic tube to carry drugs and other vital supplies around the hospital; the improvement of the halal dietary provision; and the construction of the canopy and façade of the hospital complex.
The drug consignment system has solved the problem of chronic drug shortages in the hospital. Private suppliers appear to be happy with the arrangement, mainly because the hospital is now generating large revenues from PhilHealth reimbursements and is able to pay for the drugs consumed by patients. A Department of Health Administrative Order has been drafted for the adoption of drug consignment nationwide among Government hospitals, based on the pioneering experience of the SPMC. In 2011, the system was recognized as a health-market innovation with an award from the Philippine Institute for Development Studies, and has since been replicated in other Government hospitals.
4. Environment affecting public hospital governance4.1 Internal environment Active and visionary leadership and management is the most critical element of hospital reforms. Where this is missing, reforms cannot be initiated and sustained. Given a reform- or health-unfriendly leader, Filipino Civil Servants in the health sector tend to simply wait out the end of the tenure of the political leader or the reassignment of the appointed officer.

216
All the reforms detailed in these case studies relate to financial difficulties. While PhilHealth reimbursements have become more available, many hospital directors and local government executives are ill-equipped to understand and deal with the intricacies of a third-party payment system — they would rather rely on budgetary subsidies. Many of the internal environmental constraints in public hospitals could be addressed if only their leaders understood the nexus of health insurance and reforms, e.g. the purchasing of health services, new provider payment system and revised administrative procedures.
Success in hospital reforms hinges on the good relationship between local government executives and LGU hospital directors. The short-lived and frequent changes in local government due to elections every three years are a constraint in this regard. A constitutional amendment has been proposed by several groups to resolve this, but the situation is not likely to be altered any time soon.
Governance is often thought of only in terms of the institutional structure that is put in place. But governance also includes, perhaps more importantly, the rules and regulations that are created and agreed upon by stakeholders to guide their relationship and way of doing things. This is true whether the instrument is a contract, a memorandum of understanding, a provincial or municipal ordinance, or an internal directive. Indeed, it is these instruments of governance that may be more important and lasting than the new personnel appointed or the new structures put in place.
4.2 External environmentChanges in demand are being brought about by a growing population, changing demographic and health transition which alter the burden of disease, at the same time as rapid migration from rural to urban areas and persistent poverty lead to significant uncompensated care – all take their toll on hospital governance and management. Changes in supply brought about by new technologies and medicines, new business formats and operating arrangements, new information technology, a mobile and often vocal health workforce, and medical tourism – these, too, impinge on hospital operations. But many hospital managers may not be able to

Public hospital governance in the Philippines
217
think through these demand and supply challenges and propose strategic solutions.
The Government’s response to these challenges is often to regulate, as indicated by the number of DOH Administrative Orders (AOs). While services have long been devolved, a “delivery mentality” lingers at the heart of the DOH which often manifests in control and micromanagement. As a result, many of the AOs do not get implemented at the local or hospital levels, and are sometimes viewed by local health officials as nuisance. Indeed, some of the AOs have no teeth, since DOH may not have a mechanism for their effective enforcement. An alternative paradigm of educating, skilling, facilitating and leading LGUs and hospitals (boards, directors, staff) needs to take root, but is often constrained by capacity weaknesses at the centre.
5. Conclusions and recommendationsWhile full hospital autonomy is an ideal governance structure that Government hospitals aspire to, it is clear that smart administrators can still introduce a lot of innovation and reforms within their own powers as defined by devolution. This is clearly the case with the Leyte Provincial Hospitals and SPMC, which operate within the parameters of their structures, yet are able to achieve the types of successes that elude others.
5.1 Governance structure and key reforms affecting performanceFor LGU hospitals, the locus of reforms is in the office of the incumbent governor or mayor of large cities/municipalities which own the hospital assets (e.g. LUMC, Leyte Provincial Hospitals). In the case of DOH-retained hospitals, the hospital director and his team are the key reform leaders, as is the case at NKTI and SPMC.
Due to the short tenure of elected local officials, hospital reforms can be difficult to sustain unless the official who championed the reform programme gets re-elected, or a party colleague who thinks similarly becomes the next LGU executive. This has certainly been the case with LUMC and the Leyte Provincial Hospitals. It also helps if the reform programme is laid out formally in LGU ordinances or resolutions so that it is institutionalized.

218
The support of health leaders (provincial/municipal health officials, hospital directors and doctors practicing in the affected health facilities) is important. All of these case studies on hospital reforms were initiated in response to a need for a stronger financial base to support better services and to sustain them. Given the limited fiscal space that each of the hospitals faced, the reforms were achieved primarily via the expansion of internally generated (non-budgetary) funds – initially through user fees and increasingly through PhilHealth reimbursements. The reforms centred on rule setting – around fee schedules, the retention and allocation of revenues, the continued infusion of budget subsidies, and the the need to protect vulnerable people or charity referrals – as well as on establishing support systems for information technology (LUMC, NKTI, SPMC).
In hospitals that required large investments in technology, PPP arrangements were put in place (NKTI, SPMC, LUMC). The PPP approach allowed Government health facilities to benefit from the advantages inherent in the private sector, which they would have missed had they continued to operate within the bounds of a hierarchical budgetary and performance structure. The PPP instrument (contract) spelled out the legally binding roles and responsibilities of the partners as well as the governance structure of the partnerships.
All of the reforming sites enjoyed fiscal autonomy (LUMC, NKTI, SPMC, the Leyte Provincial Hospitals) which were used not only to generate much-needed resources but to incentivize workers and managers, based on strict internal rules and regulations.
5.2 Strengths and good practicesThe use of provincial ordinances and resolutions and, in the case of LUMC, an Executive Order and a Congressional Act, has made it possible for reform programmes to straddle political administrations. Given the fractious democracy and short political tenures in the Philippines, this is an important element of any hospital reform programme.
Competitive PPP is increasingly being used as a means of acquiring sophisticated medical technology in Government hospitals, sometimes at zero cost (in the case of consignment). Best practice documentation should

Public hospital governance in the Philippines
219
be institutionalized so that cross-institutional learning can occur and innovations implemented widely.
Almost all of the reforms that have succeeded are anchored on the centrality of PhilHealth financing, without which internal revenue generation (based on user fees and other non-insurance sources) would be grossly inadequate. In this regard, PhilHealth and participating hospitals need further strengthening to focus on increasing patient utilization and access to hospital services, making fair and efficient the level of payment and supporting the provider payment process.
In the few hospitals that undertook revenue improvement, the budget subsidy – whether from the DOH to its retained hospitals, or the provincial government to its LGU hospitals – was maintained until the hospitals were able to be self-sustaining. To achieve such degree of financial predictability, good negotiation using solid information is needed between the fund-holders and the fund-recipients.
Internal capacity strengthening, especially in information technology, is an essential ingredient of hospital reforms (especially in SPMC, LUMC and NKTI). Without it, reforms in finance and procurement cannot succeed. Given the Department of Budget and Management and Civil Service restrictions on the number of staff in Government hospitals, management should find alternative ways to plug this much-needed gap, either through outsourcing or part-time workers.
5.3 Challenges and recommendationsThe lack of an overall Government strategy for tertiary care service delivery is an important constraint of a more comprehensive hospital reform programme in the Philippines. The governance and financing reform initiatives are far too few, relative to the total number of facilities, and the efforts are rather sporadic and not coherently packaged as an entire reform programme. The few that have succeeded or are struggling rely heavily on leaders/advocates with individual vision, rather than a Government wide recognized necessity to change.

220
Part of the sporadic nature of hospital reforms is the lack of critical hospital information resulting from the overall weakness of information systems. Although hospitals submit their annual capacity and operating profiles to the DOH, these are not encoded, aggregated and analyzed. Senior policy-makers are disadvantaged in not having useful information that would help them to see the hospital sector in its entirety. As a result of this gap, plans and decisions are often made on a case by case basis.
Sceptics within government hospitals who are affected by the reform programme can be its most vociferous critics. Hospital reform initiatives in the Philippines are often met with demonstrations and other public displays of resistance; frequently abetted by advocacy groups that the disgruntled employees seek as allies or champions. The most difficult challenge is how to win over the media and other populist actors that are sceptical of hospital reforms and prefer the traditional approach of simply increasing Government budgets for hospitals.
In future, the challenge will be how to finance and provide services for both communicable and non-communicable diseases, which calls for the strengthening of both public health and hospital systems. Hospital governance reforms are a key ingredient in strengthening hospitals. While a few reforms are underway, they have been sporadic because of resistance within and outside the hospitals. Part of this resistance can be addressed in the short-term by greater information on key decisions, dialogue or mediation. But over the long-term, education of key decision-makers within the affected hospitals is critical, including their exposure to similar reform programmes elsewhere in the world. More research, documentation and sharing of experience should be undertaken.
ReferencesAstom, Fernando (2012). La Union Medical Center: An Economic Enterprise for Sustainability and Development. Unpublished PowerPoint presentation slides. Gawad Galing Pook.
MSH (2002). Implementation Kit for Government Hospital Corporatization (LGU Hospitals). Health Sector Reform Technical Assistance Project. Management Sciences for Health. Manila.
Public hospital governance in the Philippines
221
NSCB (2013). Philippine National Health Accounts 2011. National Statistical Coordination Board.
NSO (2011). Philippine Statistical Yearbook.
Petilla, Carlos Jericho (2013). Health Innovations: The Leyte Province Experience. Unpublished PowerPoint presentation during the seminar on “Sustainable and Inclusive Health Market Innovations: Challenges and Opportunities for the Philippines,” Manila Peninsula Hotel, 17 September 2013
Riego-Javier, Aileen (n.d.). The National Kidney and Transplant Institute’s Hemodialysis Center: A Public-Private Partnership Experience. NKTI. Processed document.
Vega, Leopoldo J. (2013). Innovations and Growth: Southern Philippines Medical Center – Perspectives from a DOH-Retained Tertiary Hospital. Unpublished PowerPoint presentation slides during the seminar on “Sustainable and Inclusive Health Market Innovations: Challenges and Opportunities for the Philippines,” Manila Peninsula Hotel, 17 September 2013.
222
F. Public hospital governance in IndiaA case study on the All India Institute of Medical Sciences, New DelhiAntonio Duran, Kamal Gulati, Arunachalam Gunasekar, Shakti Kumar Gupta, Parmeshwar Kumar, Chandrakant Lahariya, Angel Rajan Singh.
Public hospital governance in India
223
AbstractThe specific purpose of this case study on the All India Institute of Medical Sciences (AIIMS), New Delhi, is to increase the understanding of how policy reforms linked to social and economic changes in India affect the governance and performance of publicly owned hospitals.
In India, health is primarily a state subject. In principle, the public health care subsystem is a three-tier structure comprising primary, secondary and tertiary facilities and the predominant source of public financing is general tax (both direct and indirect taxes) and non-tax revenues (e.g. service charges, fees, grants, rent, etc.) made up of central funding from the Ministry of Finance as well as revenues raised by the state governments. However, the system is far from balanced in its primary, secondary and tertiary components and out-of-pocket expenditure by individual households constitutes 60–80% of total health expenditure across states. In the last two decades, the private health sector has emerged as a major service provider (nearly 80% of total outpatient and 60% of total inpatient care).
AIIMS, established in 1956, is considered India’s premier public-sector medical institution. It has undergone numerous adaptive responses to become the largest public sector, tertiary-level teaching hospital, with dual patient care roles: (i) a specialized referral hospital; and (ii) a large general hospital in the country, growing from nearly 750 beds in 1970s to 2328 beds in 2013. From the early 1970s to 2013, the bed occupancy rate decreased from around 95% to about 80%. Outpatient department attendance rose from around half a million people annually in the early 1970s to 2.75 million in 2012–2013. Nearly 55% of outpatients come from outside Delhi, reflecting their trust in the quality of care provided by the Institute at subsidized rates (the cost to inpatients is less than US$ 1 per day and treatment for those below the poverty line is free).
The level of AIIMS’ autonomy has changed over time. Originally accountable only to Parliament, today the Government of India has much closer control over AIIMS. Accountability mechanisms have also become broader and more complex since the People’s Charter and the Right to Information Act were issued, improving transparency. The Government is replicating the model and establishing other AIIMS-like institutions in different parts of the Union. This case study further confirms the fact that hospital performance is substantially influenced by hospital governance, which is in turn related to external and internal environments.

224
Acronyms and abbreviationsAIIMS All India Institute of Medical Sciences
CHC community health centre
CPA Consumer Protection Act
GDP gross domestic product
MHC maximum handling capacity
MOHFW Ministry of Health and Family Welfare
NRHM National Rural Health Mission
OOP out-of-pocket
OPD outpatients department
PHC primary health centre
PMSSY Pradhan Mantri Swasthya Suraksha Yojana
RTI right to information
WHO World Health Organization

Public hospital governance in India
225
1. IntroductionGiven the complexity of the country, this introduction is intended to provide a basic description of the country and its health system. For the case study proper, the reader is referred to Section 2.
1.1 Country contextIndia is the world’s largest democracy, the second most populous country in the world (1.21 billion people according to the 2011 census), and the eleventh largest economy, with a gross domestic product (GDP) of US$ 1.842 trillion in 2012 (World Bank, 2013). India has undergone extraordinary socioeconomic and demographic changes since independence in the 1947, the detailed analysis of which exceeds the scope of this case study. With a meagre 2.4% of the world’s total area, India supports 17.5% of the world’s population. It is, in many ways, a unique country, comprised of 29 states of varying populations (from 0.6 million in the hilly state of Sikkim to almost 200 million in Uttar Pradesh), and six union territories. Population density (382 people per km²) also varies widely – Arunachal Pradesh having a sparse population of 17 people per km² compared to the capital city, Delhi, with more than 11 000 people per km². The urban population has almost doubled, from 17.3% in 1951 to 31.2% in 2011.
India is undergoing a complex process of change. Between 1980 and 2010 its Human Development Index26 improved by 1.6% annually from 0.320 to 0.519 and yet the Index ranks the country 119th out of 169 countries with comparable data. Although life expectancy at birth increased to 65 years in 2009 (a gain of eight years since 1990) it remains comparative low. Also, despite years of economic development (annual GDP growth rates in the years 2004 to 2011 range from 6.8% to 9.6%) and policies focusing on areas most in need, poverty remains concentrated in certain states and inequalities in terms of purchasing power parity have increased (WHO Country Office for India, 2012). Enormous inter-state differences in health status remain; for instance, there is an 18-year difference in life expectancy between Madhya Pradesh at 56 years and Kerala at 74 years (Balarajan,
26 The Human Development Index is a composite statistic of life expectancy, education and income indices, used to rank countries into four tiers of human development ranging from 0 (lowest) to 1 (highest).

226
2011); and a difference of 44 per 1000 in infant mortality rates between Madhya Pradesh at 56 and Kerala at 12 per 1000 live births (Government of India, 2013).
Under the Constitution of India, health is historically a state issue. The central government retains aspects of policy-making, planning, guiding, evaluating and coordinating the different provincial health authorities and also provides funding to implement national programmes, but the states are responsible for running their own health care. One of the seminal health policy and planning documents, the Health Survey and Development Committee Report also known as the Bhore Committee Report (Bhore, 1946) was published before Independence. The Committee recognized the vast rural–urban disparities in India’s health services and developed its plan specifically with the rural population in mind. In 1961, the Planning Commission of India proposed increasing hospital beds and organizing hospitals’ outpatient departments (OPDs) into polyclinics to provide much of the treatment. It also encouraged establishing convalescent homes and dharamshalas (guesthouses) near hospitals to help reduce pressure on hospital inpatient facilities. Nearly twenty years later, however, the 1983 National Health Policy rated health services development as “urban oriented and curative” and brought the focus back to a “comprehensive public health system” with a primary health care approach (MOHFW, 1983). The health sector came under the Consumer Protection Act 1986, which provided a mechanism for redressing grievances.
As per the recommendations of the Bajaj Committee Report (1987), resources were provided during the early 1990s to set up the Education Commission for Health Sciences. Then, in early 1990s, a liberalization–privatization process enabled the entry of the corporate sector in health. This saw some states providing subsidized land, water and electricity to private entrepreneurs to set up tertiary care/super-specialty institutions on the condition that they would provide outpatient and inpatient care free to people below the poverty line. In response, several non-resident Indians and industrial/pharmaceutical companies set up super-specialty hospitals. The strategy, however, had serious policy omissions: (i) a failure to establish a robust regulatory framework and accreditation processes for governing the private sector; (ii) an absence of a surveillance and epidemiological system, resulting in poorly designed health interventions;

Public hospital governance in India
227
and (iii) inadequate investments in developing skilled human resources (National Commission on Macroeconomics and Health, 2005).
India’s ninth Five-Year Plan (1997–2002) highlighted the absence of primary health care and the complete reliance on secondary and tertiary services even for minor ailments in urban areas (Planning Commission, 1997). It recognized the growing demand for complex, costly diagnostic and therapeutic modalities as well as the lack of staff, equipment and consumables to meet demand. Thus the National Health Policy 2002 focused on the greater involvement of the private sector in public health delivery through public–private partnerships and outsourcing, in addition to the introduction of social insurance packages. The policy centred on regulating the private health sector through statutory licensing and the monitoring of minimum standards (MOHFW, 2002).
The All India Institute of Medical Sciences (AIIMS), established in 1956, is considered India’s premier public-sector medical institution. It has undergone numerous adaptive responses to become the largest public sector, tertiary-level teaching hospital. The Government of India launched the National Rural Health Mission (NRHM)27 in 2005 aimed at strengthening state health system with a special focus on reproductive and child health and disease control programmes. The Pradhan Mantri Swasthya Suraksha Yojana (PMSSY)28 launched in March 2006 aimed to correct the imbalances in the availability of affordable/reliable tertiary health services and augment facilities for quality medical education in the country. Under the scheme, the Government established six AIIMS-like institutions and proposed the upgrading of 13 existing government medical colleges in the first phase. This will be followed by two more AIIMS-like institutions and the upgrading of six more medical colleges in the second phase. There is a third phase of PMSSY, which intends to strengthen a few additional medical colleges in India. In addition, the non-contributory publicly funded Rashtriya Swasthya Bima Yojna was initiated in 2008 by the Ministry of Labour and Employment, Government of India, to provide health insurance coverage for families living below the poverty line.
27 http://nrhm.gov.in
28 http://pmssy-MOHfw.nic.in

228
Such events affect the vast majority of workers in the unorganized sector, including agriculture. In recent years, a number of states have also started to fund health insurance schemes using public money, to ensure the higher availability of funds and the sharing of risks within their respective populations.
1.2 Public health subsystemBy design, the public health care subsystem in India is a three-tier structure comprising primary, secondary and tertiary facilities. The primary tier includes three types of institutions, namely: a sub-centre for populations of 3000–5000 people; a primary health centre (PHC) for 20 000–30 000 people; and a community health centre (CHC), which acts as a referral centre, covering populations of 80 000–120 000 people. District hospitals function in turn as the secondary tier for rural health care and as the primary tier for the urban population. Tertiary health care is provided by institutions in urban areas and is equipped with sophisticated diagnostic and therapeutic facilities. Though the primary- to tertiary-level facilities (as shown in Figure 1) are expected to function as a well-coordinated referral mechanism (with provision for back-referral), in reality, patients often self-select themselves to any of these facilities. This is best exemplified by AIIMS; although it is an apex tertiary institution conceived primarily for referral cases, yet nearly 20% of its cases (as in Figure 4) are in reality walk-in patients.
Figure 1: Public health subsystem in India
Super-specialty tertiary care hospitals e.g. AIIMS
State medical colleges & hospitals
District and sub-divisional hospitals
Community health centres
Primary health centres
Sub-centres
Source: Asia Pacific Observatory on Health Systems and Policies; authors’ synthesis
Public hospital governance in India
229
As of March 2012, the country had 148 366 sub-centres, 24 049 PHCs, 4833 CHCs and 11 993 hospitals, but there were huge disparities across states and districts and between the urban and rural populations. Overall, India currently has about nine beds per 10 000 people and there is a shortfall of almost 23% of sub-centres, 26% of PHCs and 40% of CHCs (Government of India, 2012).
Including all public- and private-sector human resources, there are 3.8 allopathic29 doctors, 2.4 nurses and 8 health workers per 10 000 people in India (Rao et al., 2011) and public health facilities face a variable shortage of health staff (6.5 doctors, 10 nursing and midwifery personnel, 0.8 dentists, 5.4 pharmacists and 0.5 community health workers per 10 000 people (WHO, 2013). Approximately 80% of doctors, 75% of dispensaries and 60% of hospitals are located in urban areas, whereas nearly two thirds of India’s population still lives in rural areas.
The 12th Five-Year Plan(2012–2017) along with a number of recent publications (e.g. Reddy et al., 2011; Desai et al., 2010) also acknowledge ample room for improvement in health financing in India, which features low revenue collection, improper funds pooling and relatively low government spending. The primary source of public financing is general tax and non-tax revenues. Central funding is provided by the national Ministry of Finance to the Ministry of Health and Family Welfare (MOHFW) within each union, and to states based on the recommendations of the Planning and Finance Commissions. State governments also raise their own tax and non-tax revenue through sales tax, value added tax, property tax, etc. The squeeze on public health spending coupled with the low population coverage of health insurance schemes (5.4% coverage) and modest benefit package, has forced people to rely on out-of-pocket (OOP) health expenditure. OOP constitutes between 60–80% of total health expenditure across states. Fragmented resource allocation by both central and state governments completes the picture.
Figure 2 shows that at 3.7% of GDP and 28% of total health expenditure, the proportion of India’s public spending on health is very low, compared
29 That is, practitioners of conventional medicine, rather than traditional Indian medicine.

230
to other countries with a similar development status and the current global averages of 9.2% and 58.9%, respectively.
Figure 2: Health care expenditures (total, public and private) in India and selected countries, 2013
9%5% 3.7% 6.5% 3.5%
9.6%17.6%
9.2%
47%54.3%
28.2%
58.7%
41.5%
83.2%
48.2%
58.9%53%
45.7%
71.5%
41.3%
54.4%
16.8%
51.8%
41.1%
Brazil China India Russia Srilanka UK USA Global
Total expenditure on health as % of GDP
Public health expenditure as % of total expenditure on healthPrivate expenditure on health as % of total expenditure on health
Source: WHO, 2013
In the 12th Five-Year Plan, the allocation for health increased by 335%, with the health expenditure of the central government increasing from around 0.9% of GDP in the 11th Plan to 1.87% by 2017 (Planning Commission, 2012). The 12fth Five-Year Plan aims to achieve universal health coverage through the government’s various schemes, such as Rajiv Aarogyasri Community Health Insurance Scheme and Rashtriya Swasthya Bima Yojana, etc. In 2013, the Government approved a National Urban Health Mission – a sub-mission under the over-arching National Health Mission, which currently has service funding, organization and delivery at different stages of development (MOHFW, 2013).
1.3 Private health sectorAt the time of Independence, the private health sector provided only 8% of all health services, but in the last two decades has grown exponentially to emerge as the major service provider (nearly 80% of total outpatient and 60% of total inpatient care). As reported by the World Bank in 2001, approximately 93% of all hospitals, 64% of beds and 82% of doctors are in the private sector (World Bank, 2001), which contributed 70% of new beds between 2002 and 2010. During this period, the proportion of private

Public hospital governance in India
231
sector beds to total beds increased from 49 to 63%. Today, the private sector accounts for 80% of the market in India – the highest proportion in the world and worth US$ 23.72 billion, up from US$ 19.21 billion in 2006 (Gudwani et al., 2012).
The private health sector consists of the not-for-profit and for profit sectors. The not-for-profit sector includes nongovernmental organizations, charitable institutions, missions, trusts, etc. The for profit sector comprises different types of practitioners and institutions including general practitioners, super-specialists, consultants, nurses and paramedics, licentiates, registered/rural medical practitioners and unqualified providers. Private facilities range from clinics, polyclinics, dispensaries and single-bed nursing homes to large corporate hospitals, medical colleges, physiotherapy and diagnostic centres, blood banks, etc.
Until recently, only a few states had legislation for private hospitals, but many are now in the process of enacting them. Despite the setting up of a National Accreditation Board for Hospitals and Health-care providers, aimed at improving quality of health care on voluntary bases, the number of accredited facilities remains very low. The demand for accreditation has increased lately through medical tourism, and by the insistence of health insurance companies and third-party administrators for reimbursement purposes. The Janani Suraksha Yojana Scheme (JSY) under the NRHM has made accreditation mandatory for private health-care facilities wishing to participate in institutional deliveries. In 2010, the Government of India enacted the Clinical Establishment (registration and regulation) Act aimed at implementing regulations and quality assurance, but to date the Act had only been implemented by a few states and union territories.
2. AIIMS governance and performance2.1 Historical overviewWhen India became independent in 1947, the country only had 20 medical schools with an annual intake of about 1200 students. Realizing the scarcity of trained health workers, the Bhore Committee recommended that an all-India medical institute should be established immediately to ensure quality medical education, research and patient care. It was intended that doctors could get a high standard of medical education and research without going
232
abroad. A world-class institution in the fields of medical education, research and patient care, AIIMS was intended to excel in postgraduate courses, demonstrating high standards to all other medical colleges in India.
The initial funding for setting up AIIMS was provided by the Government of New Zealand under the Colombo Plan (a regional organization that embodies the concept of collective inter-governmental effort to strengthen economic and social development of member countries in the Asia Pacific region with a primary focus on human resource development). Technical, training and financial assistance came from the Rockefeller Foundation. The Institute was established in 1956 with a large measure of autonomy through the All India Institute of Medical Sciences Act, 1956, which provides for framing rules by the central government and specific regulations by AIIMS with government approval (AIIMS, 1956). The Central Civil Services (Conduct) Rules 1964 and Central Civil Services (Classification, Control and Appeal) Rules 1965 apply to AIIMS employees pertaining to their conduct, discipline and penalties. The Public Accounts Committee of the Parliament of India regularly audits AIIMS and its functions. The Comptroller and Auditor General, Central Vigilance Commission and other government bodies also regularly audit AIIMS either suo moto or when specifically requested by the Government of India. India’s first Department of Hospital Administration was set up in AIIMS in 1962, performing duties aimed at efficient and effective hospital performance including risk assessment and management strategies.
AIIMS has gone through many adaptive responses to become one of the largest public sector hospitals in the country, expanding from nearly 750 beds in 1970s to 2280 beds today (Figure 3). These are distributed as follows: main hospital 1052 beds; Cardiothoracic and Neurosciences Centre 423; Dr B.R. Ambedkar Institute Rotary Cancer Hospital 180; Dr Rajender Prasad Centre for Ophthalmic Sciences 302; Jai Prakash Narain Apex Trauma Centre 203; Centre for Dental Education and Research 20; National Drug Dependence Treatment Centre 50; and the Comprehensive Rural Health Services Project, Ballabhgarh, Haryana 50.

Public hospital governance in India
233
Figure 3: Rise in number of beds at AIIMS, 1972–2013
750 769 810 816 865 866
15431766
2280
0
500
1000
1500
2000
2500
1972-73 1977-78 1982-83 1987-88 1992-93 1997-98 2002-03 2007-08 2012-13
Source: AIIMS Annual Reports, 1972–2013
The increase in beds at AIIMS was largely due to the rapid growth of the newly established centres and growing clientele. There has been a corresponding transformation of AIIMS into a tertiary-level teaching hospital with dual patient care roles: (i) a specialized referral hospital; and (ii) a large general hospital. In addition, OPD attendance rose from around half a million annually in the early 1970s to 1.2 million in the late 1990s, and further to 2.75 million in 2012–2013. In its 2009 Report, the Valiathan Committee – which was constituted by the Government of India to study the functioning of AIIMS, New Delhi, and make recommendations for further development of the Institute – suggested an expansion of the OPD at AIIMS as a temporary reprieve and recommended that the OPDs of four other medical colleges in Delhi should also be expanded to draw away 8000 patients a day, thus reducing the pressure on the OPD at AIIMS (Valiathan Committee, 2009).
AIIMS interacts constantly with other hospitals, for example, with around 30 other government networked hospitals with reverse-referrals – referrals of patients from higher level hospitals to lower level hospitals – in cases of infectious diseases and certain other conditions (e.g. burns, plastic surgery). It also provides outreach services to 90 000 people at Ballabgarh in the nearby state of Haryana through the Comprehensive Rural Health Services Project. In addition to preventive, promotive and curative services, the project provides community ophthalmology, demographic surveillance
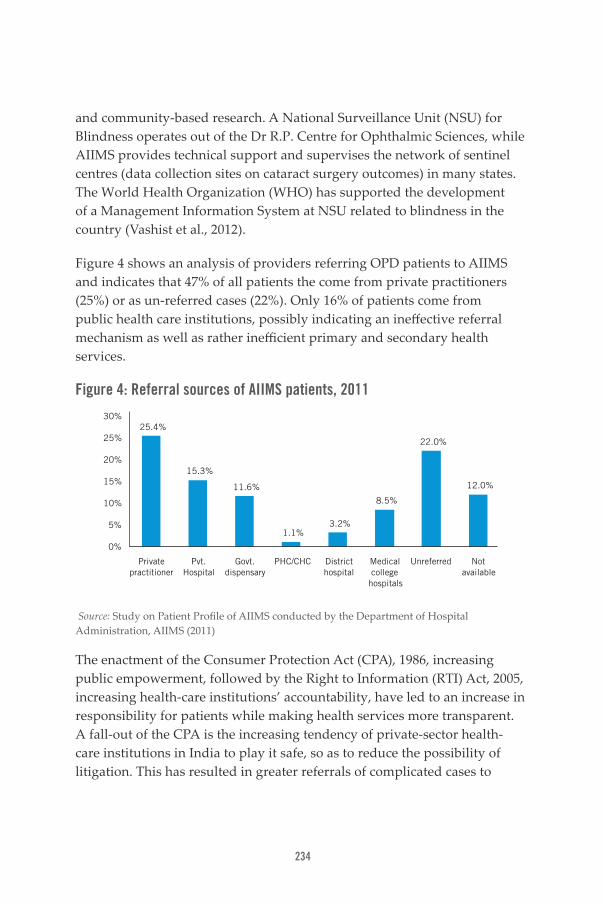
234
and community-based research. A National Surveillance Unit (NSU) for Blindness operates out of the Dr R.P. Centre for Ophthalmic Sciences, while AIIMS provides technical support and supervises the network of sentinel centres (data collection sites on cataract surgery outcomes) in many states. The World Health Organization (WHO) has supported the development of a Management Information System at NSU related to blindness in the country (Vashist et al., 2012).
Figure 4 shows an analysis of providers referring OPD patients to AIIMS and indicates that 47% of all patients the come from private practitioners (25%) or as un-referred cases (22%). Only 16% of patients come from public health care institutions, possibly indicating an ineffective referral mechanism as well as rather inefficient primary and secondary health services.
Figure 4: Referral sources of AIIMS patients, 2011
25.4%
15.3%
11.6%
1.1%3.2%
8.5%
22.0%
12.0%
0%
5%
10%
15%
20%
25%
30%
Private practitioner
Pvt. Hospital
Govt. dispensary
PHC/CHC District hospital
Medical college
hospitals
Unreferred Not available
Source: Study on Patient Profile of AIIMS conducted by the Department of Hospital Administration, AIIMS (2011)
The enactment of the Consumer Protection Act (CPA), 1986, increasing public empowerment, followed by the Right to Information (RTI) Act, 2005, increasing health-care institutions’ accountability, have led to an increase in responsibility for patients while making health services more transparent. A fall-out of the CPA is the increasing tendency of private-sector health-care institutions in India to play it safe, so as to reduce the possibility of litigation. This has resulted in greater referrals of complicated cases to

Public hospital governance in India
235
public hospitals, including AIIMS. The expert opinion of AIIMS doctors is also increasingly sought by consumer courts – special-purpose courts that deal with cases regarding consumer disputes and grievances.
While accepting the deficiencies due to extreme patient-load and limited resources, the Citizen Charter provides a framework through which users are aware of the services that are available in the hospital, the quality of those services and the way complaints regarding denial or poor-quality services are redressed. AIIMS has been, perhaps, more vulnerable to RTI findings due to its stature, media glare and patient-load but is responsive to feedback, though these efforts are resource-intensive.
2.2 Financial frameworkThe annual budget for AIIMS, provided by the central government, has increased commensurate with patient-load and health-care technology development. The raise from US$ 0.6 million in 1972 to US$ 173 million in 2011–2012 also mirrors India’s GDP increase as seen in Figure 5. Notably, even on occasions when the Government of India’s health-care outlay has fallen, allocation to AIIMS has continued to rise. Every year, the AIIMS Annual Report is tabled in Parliament. AIIMS submits its budgetary estimates to the Standing Finance Committee, which then submits it to the MOHFW. The Ministry of Finance allocates the annual budget for health to the MOHFW, which sanctions the funding for AIIMS as per the estimates submitted. This process is same for all centrally funded health-care institutions in the country.

236
Figure 5: Growth of India’s GDP and AIIMS budget, 1972–2012
2 000 000
1 500 000
1 000 000
500 000
0
200
150
100
50
0
Year
AIIM
S B
udget in US$
(Millions)In
dia'
s G
DP
in
US$
(Mill
ions
)
India GDP in US$ (Millions) AIIMS Annual Budget in US$ (Millions)
1972–73 1977–78 1982–83 1987–88 1992–93 1997–98 2002–03 2007–08 2011–12
Source: AIIMS Annual Reports (AIIMS, various years) and Government of India Five-Year Plans (Planning Commission, various years)
AIIMS maintains a master account of all funds received from any source. Its annual statement of accounts is subject to internal audit and by external audit by the Comptroller and Auditor General of India. The audited account is forwarded annually to the central government and then laid before the Parliament for approval. The Standing Finance Committee looks into all financial matters and tenders.
The AIIMS budget comprises Plan and Non-Plan30 components, with the former constituting about one-third of the total annual budget. AIIMS also receives funds through other resources, including:
• Intramural resources:
- hospital receipts (revenue receipts)
- patient treatment accounts
Income generated by revenue receipts is only 8.87% of the allocated budget and is excluded from the Demand for Grants forwarded to the Ministry of Finance.
30 Plan components represent expenditure, which has to be planned and approved for each scheme or organization by the Planning Commission and indicates the extent to which such outlays are met out of budgetary provisions. Non-Plan expenditure is that which does not need to be approved every year (i.e. staff salaries).

Public hospital governance in India
237
• Extramural resources (from governmental and nongovernmental agencies and individuals)- grants for specific research projects
- donations
- poor-patient and patient treatment funds
Figure 6 depicts the budgetary allocations to AIIMS main hospital and centres, with main hospital having nearly half the Institution’s beds and receiving 62% of the budget.
Figure 6: AIIMS budgetary allocation, 2010–2011
6%
15%
5%
1%
10%
1%
62%
Ophthalmic centre
Cardio-Neuro centre
Cancer centre
Drug dependence treatment centre
JPNA Trauma centre
Dental centre
Main hospital
Source: AIIMS Annual Report, 2010–2011 JPNA: Jai Prakash Narayan Apex
2.3 Governance factorsAIIMS makes autonomous decisions at institutional level leading to actions that are then duly implemented. The autonomy of AIIMS dates back to 1956 when the Union Health Minister stated in his speech in the Lok Sabha (Lower House of Parliament) that, “Subject to such minimum control as the Government of India may exercise through its rule-making powers, the Institute will enjoy a large measure of autonomy in order that it may fulfil the objectives… The Government of India will, of course, make itself responsible for providing adequate funds for the maintenance of the institute… The future of the Institute will lie ultimately in the hands of the Directors, the Professors and other members of the teaching staff and students…” (Rajya Sabha Secretariat, 2008).

238
Another facet of its autonomy relates to medical education and the move to keep this independent of the Medical Council of India, which does not recognize certain foreign medical qualifications. This would have resulted in the “disqualification” of several AIIMS faculty members who went on to establish their own departments during the Institute’s early years.
The decision-making structure of AIIMS has a top management authority called the Institute Body, with seventeen members. The All India Institute of Medical Sciences Act, 1956 provides that, “there shall be a President of the Institute who shall be nominated by the central government from members other than the Director of the Institute” (AIIMS, 1956). The President also acts as chairperson of an eleven-member Governing Body, functioning under the Institute Body as an executive authority. The Director of AIIMS is the Chief Executive Officer who acts as the Member Secretary to the Institute Body as well as to the Governing Body. The Director-General of Health Services, MOHFW is ex-officio member of the Institute Body. While in the early years, there were non-ministerial people serving as President, growing political pressure on public authorities resulted in the Union Health Minister being nominated as President since 1965.
There are also five standing committees: Finance Committee; Hospital Affairs Committee; Academic Committee; Estate Committee; and Selection Committee. There are also two Deans – the Dean of Academics and the Dean of Research – heading the academic and research programmes, respectively.
The formation of the specialty and super-specialty centres led to a certain delegation of authority to the Chiefs of these centres, initially designated as the “chief organizers”. The centres enjoy semi-autonomous status within the administrative framework of the Institute Body and Governing Body, with the various standing committees aligning the objective of the centre with the overall organizational goal.
The AIIMS grievance redressal mechanism has an eight-member committee and is accountable to the patients and taxpayers. It also plays a role in medical negligence investigations and negotiations with the trade unions. This mechanism – mandated to meet twice a year – also addresses the grievances of the faculty, residents, students and staff.

Public hospital governance in India
239
Efforts to ensure employee satisfaction at AIIMS include information dissemination through circulars and mechanisms for feedbacks. Information generated from the within the system (i.e. Infection Control Committee reports and maximum handling capacity studies) is forwarded to the appropriate department in order to make relevant operational changes.
The 1960 Employee Health Scheme provides access to the medical and health-care facilities for all employees of the Institute, including those on deputation. Family members can also gain access on a contributory basis that is paid monthly. The Scheme has also been extended to resident doctors, students and temporary employees.
2.4 Management and technical capacity of AIIMSAIIMS plans its staffing requirements based on its patient-load, teaching and research requirements, independent of the Medical Council of India’s Minimum Standard Requirements for Medical Colleges. However, the Seventh Report of the Public Accounts Committee (2004–2005) observed that in 2000 there were only 324 faculty members in AIIMS against a sanctioned strength of 471 (MOHFW, 2005). The sanctioned strength was also increased to 823 in 2011–2012, after some delays due to legal proceedings. AIIMS faculty members increased from 195 in 1972–1973 to 628 in 2011–2012; and non-faculty members from 4701 in 1987–1988 to 9312 in 2011–2012.
Each faculty is required to perform adequately in patient care as well as in academic and research areas. Annual confidential reports are raised for each faculty and similar mechanisms exist for other employees, including those employed under outsourced services. AIIMS recently introduced the Assured Promotion Scheme – a time-bound assured career progression initiative – in accordance with Government of India regulations to enable high employee morale, but with appropriate checks in place, such as a minimum number of research publications, annual performance appraisal, etc.
The Centre for Medical Education and Technology was established for conducting training and development programmes and providing

240
technology-based educational facilities to the staff and students. A telemedicine facility has also been established for remote consultation and educational purposes. Many departments within AIIMS are established WHO collaborating centres and two departments are ISO certified: the Department of Hospital Administration and the Centre for Community Medicine (CRHSP).
The AIIMS Result Framework Document (AIIMS annual reports) is a measure of the performance of the departments and has two purposes: firstly, to shift the focus from process-orientation to results-orientation, and secondly, to provide an objective basis from which to evaluate the department’s performance. The document incorporates all three components of education, research and patient care.
2.5 AIIMS performanceAn AIIMS study has measured the Institute’s performance in terms of clinical effectiveness and efficiency through the average length of stay and average bed-occupancy rates. As Figure 7 shows, the average length of stay has significantly decreased from 18 days in 1972–73 to 5.5 days in 2012–13. Adherence to the standard operations procedures for infection control, a shift towards short-term and day-care based surgeries, and technological advances are likely to have contributed to this reduction. However, this result should be viewed in the context of other departments where the average length of stay is inherently higher, for example, neurosurgery, orthopaedics, pulmonary medicine and geriatric medicine. Further, the bed-occupancy rate was brought down by 2012–2013 to near the globally acceptable level of 80% (Figure 8).
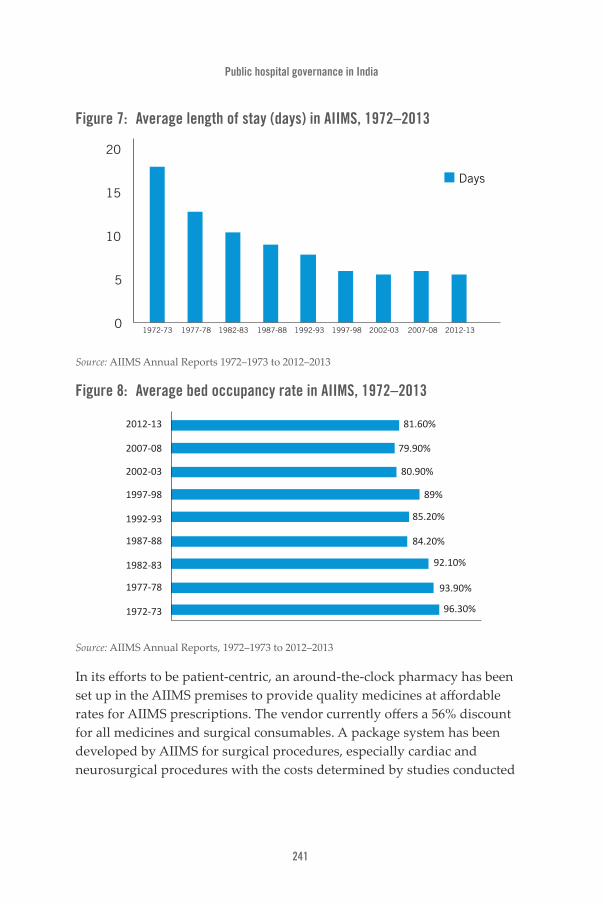
Public hospital governance in India
241
Figure 7: Average length of stay (days) in AIIMS, 1972–2013
0
5
10
15
20
Days
1972-73 1977-78 1982-83 1987-88 1992-93 1997-98 2002-03 2007-08 2012-13
Source: AIIMS Annual Reports 1972–1973 to 2012–2013
Figure 8: Average bed occupancy rate in AIIMS, 1972–2013
2012-13
2007-08
2002-03
1997-98
1992-93
1987-88
1982-83
1977-78
1972-73
81.60%
79.90%
80.90%
89%
85.20%
84.20%
92.10%
93.90%
96.30%
Source: AIIMS Annual Reports, 1972–1973 to 2012–2013
In its efforts to be patient-centric, an around-the-clock pharmacy has been set up in the AIIMS premises to provide quality medicines at affordable rates for AIIMS prescriptions. The vendor currently offers a 56% discount for all medicines and surgical consumables. A package system has been developed by AIIMS for surgical procedures, especially cardiac and neurosurgical procedures with the costs determined by studies conducted
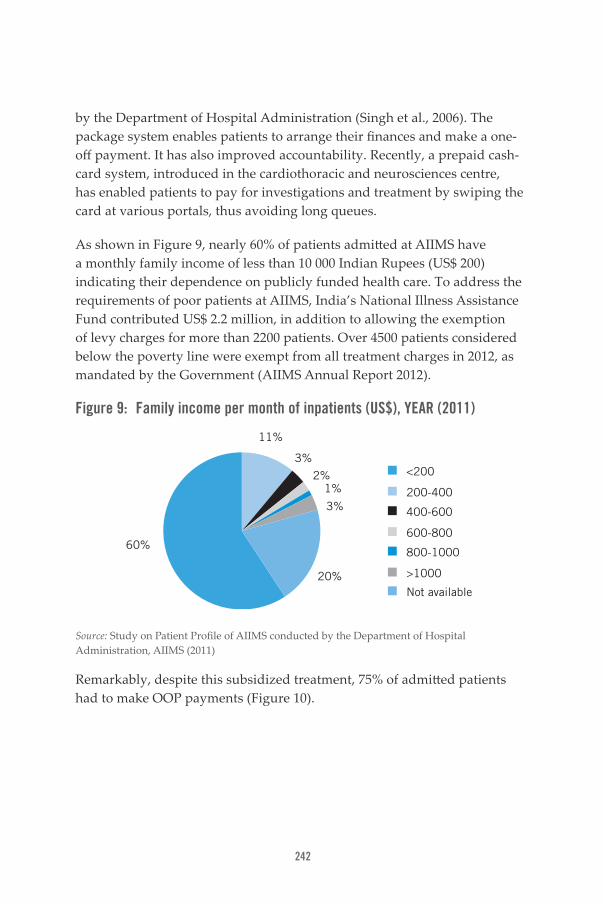
242
by the Department of Hospital Administration (Singh et al., 2006). The package system enables patients to arrange their finances and make a one-off payment. It has also improved accountability. Recently, a prepaid cash-card system, introduced in the cardiothoracic and neurosciences centre, has enabled patients to pay for investigations and treatment by swiping the card at various portals, thus avoiding long queues.
As shown in Figure 9, nearly 60% of patients admitted at AIIMS have a monthly family income of less than 10 000 Indian Rupees (US$ 200) indicating their dependence on publicly funded health care. To address the requirements of poor patients at AIIMS, India’s National Illness Assistance Fund contributed US$ 2.2 million, in addition to allowing the exemption of levy charges for more than 2200 patients. Over 4500 patients considered below the poverty line were exempt from all treatment charges in 2012, as mandated by the Government (AIIMS Annual Report 2012).
Figure 9: Family income per month of inpatients (US$), YEAR (2011)
<200
200-400
400-600
600-800
800-1000
>1000
Not available
60%
20%
3%
3%
2%1%
11%
Source: Study on Patient Profile of AIIMS conducted by the Department of Hospital Administration, AIIMS (2011)
Remarkably, despite this subsidized treatment, 75% of admitted patients had to make OOP payments (Figure 10).

Public hospital governance in India
243
Figure 10: Source of payment for patients admitted to AIIMS, 2011
75.1%
2.6%6.9%
1.6% 0.5%
7.9% 5.3%
0%
10%
20%
30%
40%
50%
60%
70%
80%
Self Friends & relatives
Govt. Employer Insurance Loan Others
Source: Study on Patient Profile of AIIMS conducted by the Department of Hospital Administration, AIIMS (2011)
As 70% of AIIMS patients come from outside Delhi, three dharamshalas (guesthouses) have been established nearby to provide accommodation for patients and family members at nominal cost. A railway reservation facility at AIIMS provided travel concessions for about 7 000 patients in 2012. A branch of the national bank is also available.
The educational status of patients admitted to AIIMS in 2011 is given in Figure 11 and shows that more than 60% of them are educated above primary school level, indirectly reflecting their awareness of the facilities available at AIIMS.

244
Figure 11: Education status of patients admitted to AIIMS, 2011
13.8%16.4%
30.2%
20.1%
9.1%
1.1%
9.0%
0%
5%
10%
15%
20%
25%
30%
35%
No formal schooling
Primary school
High school Graduate Postgraduate Professional education
Not mentioned
Source: Study on Patient Profile of AIIMS conducted by the Department of Hospital Administration, AIIMS (2011)
The results of three patient satisfaction studies carried out by AIIMS over 15 years (1996–1997, 2006–2007 and 2011–2012) shown in Figure 13, reflect an increasing level of satisfaction on most dimensions, a notable achievement in light of the increasing workload, a more discerning clientele, and the availability of private-sector hospitals.
Figure 12: Trends in patient satisfaction with AIIMS, 1996–1997, 2006–2007 and 2011–2012
2011-12 85% 93% 88% 89% 92% 95% 84% 65% 66% 81% 85% 80%
2006-07 93% 77% 89% 97% 93% 85% 86% 71% 65% 76% 83% 82%
1996-97 96% 71% 57% 96% 87% 66% 75% 44% 38% 70% 75% 83%
0%
20%
40%
60%
80%
100%
120%
Beh
avio
ur o
fad
mis
sion
sta
ff
Med
ical
Car
e
Info
rmat
ion
prov
ided
by d
octo
rs
Beh
avio
urof
doc
tors
Beh
avio
urof
nur
ses
Nur
sing
car
e
Qua
lity
of f
ood
Hyg
iene
of
was
hroo
ms
Beh
avio
ur o
f ho
spit
alan
d sa
nita
ryat
tend
ants
Line
n
Cle
anlin
ess
ofw
ards
Sec
urit
y se
rvic
es
Source: Study on Patient Satisfaction at AIIMS conducted by the Department of Hospital Administration, AIIMS (2012)
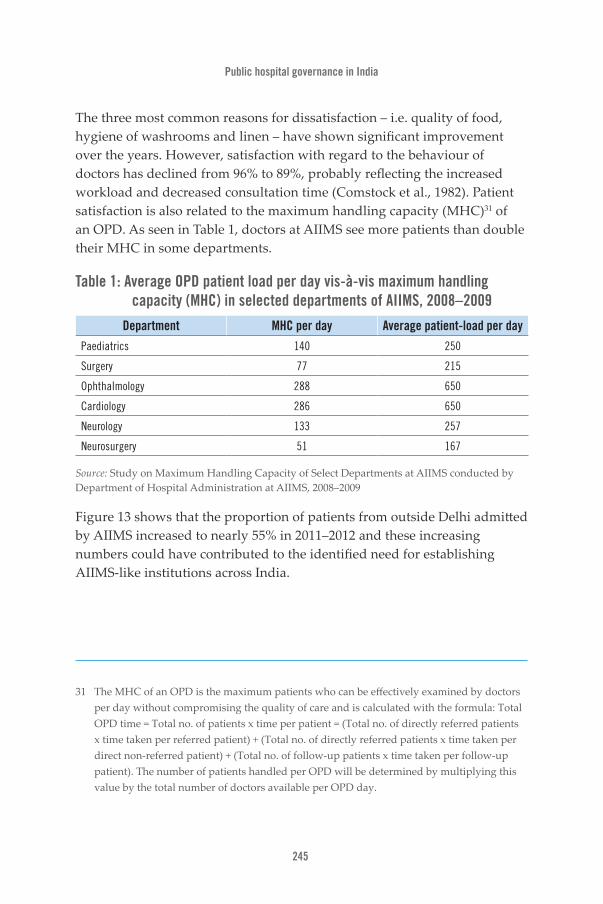
Public hospital governance in India
245
The three most common reasons for dissatisfaction – i.e. quality of food, hygiene of washrooms and linen – have shown significant improvement over the years. However, satisfaction with regard to the behaviour of doctors has declined from 96% to 89%, probably reflecting the increased workload and decreased consultation time (Comstock et al., 1982). Patient satisfaction is also related to the maximum handling capacity (MHC)31 of an OPD. As seen in Table 1, doctors at AIIMS see more patients than double their MHC in some departments.
Table 1: Average OPD patient load per day vis-à-vis maximum handling capacity (MHC) in selected departments of AIIMS, 2008–2009
Department MHC per day Average patient-load per day
Paediatrics 140 250
Surgery 77 215
Ophthalmology 288 650
Cardiology 286 650
Neurology 133 257
Neurosurgery 51 167
Source: Study on Maximum Handling Capacity of Select Departments at AIIMS conducted by Department of Hospital Administration at AIIMS, 2008–2009
Figure 13 shows that the proportion of patients from outside Delhi admitted by AIIMS increased to nearly 55% in 2011–2012 and these increasing numbers could have contributed to the identified need for establishing AIIMS-like institutions across India.
31 The MHC of an OPD is the maximum patients who can be effectively examined by doctors per day without compromising the quality of care and is calculated with the formula: Total OPD time = Total no. of patients x time per patient = (Total no. of directly referred patients x time taken per referred patient) + (Total no. of directly referred patients x time taken per direct non-referred patient) + (Total no. of follow-up patients x time taken per follow-up patient). The number of patients handled per OPD will be determined by multiplying this value by the total number of doctors available per OPD day.

246
Figure 13: State of origin of patients admitted to AIIMS, 2004–2005 and 2011–2012
DelhiUttar
PradeshHaryana Punjab Rajasthan Bihar
Other states
Other countries
2004-05
2011-12
53.7% 16.1% 11.3% 0.8% 1.9% 7.3% 0.1% 0.1%
45.2% 22.4% 10.5% 0.5% 1.7% 11.2% 8.0% 0.3%
Source: AIIMS Annual Reports 2004–2005 and 2011–2012Administration, AIIMS (2012)
A multi-hospital patient safety study in Delhi was conducted in 2010 with respect to hand hygiene practices in operation theatres. It showed that hand hygiene compliance at AIIMS (85%) is comparable to three leading private-sector hospitals (80–87%) and much better than two other public hospitals (68% and 70%).
Another AIIMS study assessed employees’ satisfaction (see Figure 14). This showed that 85% of lower and middle level employees had high overall satisfaction, despite being paid less than their colleagues. The overall satisfaction of consultants was 60% followed by technicians (58%), nurses (52%) and resident doctors (52%). However, the study showed that in terms of their work environment, doctors (consultants 24% and residents 22%) were the least satisfied.

Public hospital governance in India
247
Figure 14: Employee satisfaction at AIIMS, YEAR (2012)
86%
58%52% 52%
57%
25% 26%34%
20% 20%
68%74%
44%
22% 24%
81%
21%13% 10% 9%
50%
16% 16%
34% 35%
Others Technicians Nurses Resident doctors Consultants
Overall satisfaction Workload Work environment Work content Professional growth
Source: Study on Employee Satisfaction conducted by the Department of Hospital Administration, AIIMS (2012)
3. Lessons learnt and conclusionIndia’s uniqueness is also reflected in its health system. In short, relationships between stakeholders and between the different levels of care in India have affected hospitals and health care in general, sometimes in rather unexpected ways. While, for example, more resources, information, technology and doctors etc. have brought improved quality and choice in recent years, as the economic situation of the country improved, they have also made governance more complex. This has been accompanied by an extraordinary development of private-sector health-care providers and a change in the role played by some hospitals – AIIMS being a most illustrative example. A “Then (1969–1970) and Now (2013)” macro-analysis of AIIMS showing the relationships between external and internal factors as well as AIIMS governance is given in Table 2.
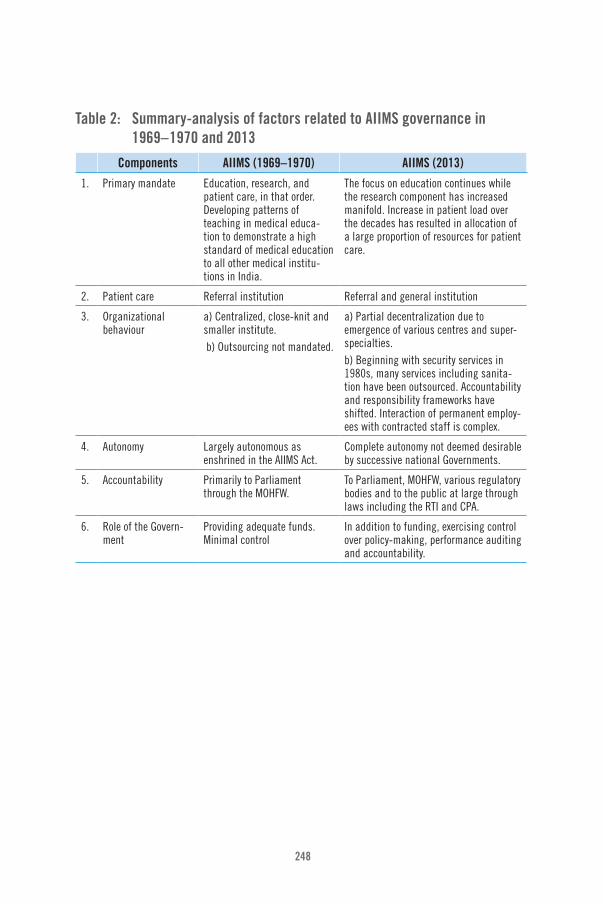
248
Table 2: Summary-analysis of factors related to AIIMS governance in 1969– 1970 and 2013
Components AIIMS (1969–1970) AIIMS (2013)
1. Primary mandate Education, research, and patient care, in that order. Developing patterns of teaching in medical educa-tion to demonstrate a high standard of medical education to all other medical institu-tions in India.
The focus on education continues while the research component has increased manifold. Increase in patient load over the decades has resulted in allocation of a large proportion of resources for patient care.
2. Patient care Referral institution Referral and general institution
3. Organizational behaviour
a) Centralized, close-knit and smaller institute. b) Outsourcing not mandated.
a) Partial decentralization due to emergence of various centres and super-specialties. b) Beginning with security services in 1980s, many services including sanita-tion have been outsourced. Accountability and responsibility frameworks have shifted. Interaction of permanent employ-ees with contracted staff is complex.
4. Autonomy Largely autonomous as enshrined in the AIIMS Act.
Complete autonomy not deemed desirable by successive national Governments.
5. Accountability Primarily to Parliament through the MOHFW.
To Parliament, MOHFW, various regulatory bodies and to the public at large through laws including the RTI and CPA.
6. Role of the Govern-ment
Providing adequate funds. Minimal control
In addition to funding, exercising control over policy-making, performance auditing and accountability.

Public hospital governance in India
249
Components AIIMS (1969–1970) AIIMS (2013)
7. Relation to external environment
(i) Patients’ perspec-tive
Considered primarily for research and education.
An institute for rendering accessible and affordable, quality patient care.
(ii) Private hospitals and increased paying capacity of the consumer
Few private hospitals to match the quality of AIIMS, thereby having no direct effect on functioning of AIIMS.
Affluent patients have, to an extent, been largely attracted by private hospitals. However, the continued respect of AIIMS doctors results in second opinions being sought at AIIMS and, sometimes, patients initially treated at private hospitals are transferred to AIIMS due to untreatable complications or spiralling costs. Yearly attrition rate of doctors in AIIMS is nearly 5.5%. The attrition of nurses is higher due to better opportunities abroad (and, to a lesser extent, due to the private-sector boom in India).
8. Limiting factors for growth
Limited funding, scarcity of trained staff, lack of technology, absence of global networking.
Land, limitations in infrastructure, complex administrative processes, older systems hindering modernization, growth of medical science, and attrition.
9. Patient demograph-ics
Limited to patients from Delhi and referral cases from other parts of country.
Large influx of patients from Delhi, neigh-bouring states and countries.
Source: Asia Pacific Observatory on Health Systems and Policies
The AIIMS Act mandates the Institute a role as an apex tertiary care, research and medical education centre in which patient care plays a supportive role. However, over the years, the pressures of an inadequate primary and secondary health-care system in the country, compounded by the absence of a structured referral system, has gradually led to the diversion of a substantial amount of AIIMS resources into patient care services – namely education and research.
Over that period, the functioning of the AIIMS has gradually shifted from a purely “referral” role to a “referral and general” role. Having started as
Table 2: Summary-analysis of factors related to AIIMS governance in 1969–1970 and 2013 (cont.)

250
a single centralized Institute, AIIMS has branched out with a number of super-specialty, secondary and even (almost) primary care centres within its framework, supported by budgetary allocations and necessitating adjustments to autonomy at different levels. Limitations in funding and the availability of trained staff have been crucial factors in the present growth of AIIMS and need to be resolved in order for it to continue to fulfil expectations.
This case study on the evolution of AIIMS from a governance perspective highlights that AIIMS as a hospital was given the mandate to develop itself, enabled by its autonomy, and provide clinical and academic leadership. In order to become efficient, however, AIIMS has often had to make its own space; and, as a result, many changes have taken place, as much a matter of need as a matter of design. The level of its autonomy has also changed over time – the Institute was originally accountable to the Parliament only but is now more closely controlled by the Government. In tandem, the accountability mechanisms have become broader and more complex and other mechanisms – such as the People’s Charter and RTI – ensuring accountability have been introduced.
It is interesting to note how AIIMS has managed to cope with its increasing workload while still maintaining and even improving quality, efficacy and efficiency in patient care services. Various factors have contributed to this achievement, the most important being the highly qualified and motivated faculty, staff and students. The ability of AIIMS to attract and retain the best of the medical profession in India could be attributed to the Institute’s reputation and central location with connectivity by rail, road and air. The trust afforded by politicians and officials, together with its proximity to India’s political power centre, could also have enabled the Institute to make quick decisions, bypassing numerous bureaucratic hurdles.
The existing semi-autonomous governance structure at AIIMS has served it well since its inception in 1956. However, there have been increasing demands for its revamp, including greater stakeholder participation in decision- and policy-making, i.e. the adequate representation of the faculty, staff and students in the Governing and Institute Bodies as well as insulation from the political environment, performance-based appraisal,
Public hospital governance in India
251
etc. These measures would enable the Institute to continue to attract and retain the best talent from across the globe. This is even more pressing in the current health care scenario, where the private-sector has grown manifold and is beginning to act as a counter-magnet to AIIMS and similar medical institutions in India. The Government is replicating the model and establishing other AIIMS-like institutions in different parts of the Union, which means both recognizing the validity of the model and ending the uniqueness of the original scheme.
In conclusion, AIIMS cannot be studied as an entity separate from the health system of India. Instead, the performance of AIIMS is strongly related to a number of institutional arrangements in addition to its own managerial and governance arrangements. It is evident that any attempt to develop health services in India should take into account how the service delivery institutions are interconnected and how they are organized internally. AIIMS is a robust health-care institution with reasonable autonomy to achieve its objectives, but it needs to adjust its relationships with other components of the health system both at state and national level by restoring its referral status in the hierarchy of the public health system in India; instead of just becoming another walk-in tertiary care hospital like many others in the country. This shall also enable enhanced focus on research and education at AIIMS, which over the years has been overshadowed by the ever-increasing patient care load and demands.
Finally, this case study further confirms the fact that hospital performance is substantially influenced by its governance, in turn related to its external and internal (managerial) environment.

252
ReferencesAll India Institute of Medical Science (AIIMS) (1956). All India Institute of Medical Sciences Act, 1956. New Delhi (www.aiims.edu, accessed 20 July 2013).
All India Institute of Medical Sciences (various years). AIIMS annual reports 1972–1973 to 2012–2013 (starting from 2004–2005, the annual reports are available at www.aiims.edu, accessed 20 July 2013).
Bajaj Committee Report (1987) (http://www.nhp.gov.in/sites/default/files/pdf/Bajaj_Committee_report.pdf, accessed 26 August 2013).
Balarajan Y, Selvaraj S, Subramanian SV (2011). Health care and equity in India. Lancet. 377:505–15.
Bhore J, editor (1946). Report of the Health Survey and Development Committee. New Delhi: Government of India Press; 1946 (http://nihfw.org/NDC/DocumentationServices/Reports/bhore%20Committee%20Report%20VOL-1%20.pdf, accessed 12 August 2013).
Comstock LM, Hooper EM, Goodwin JM, Goodwin JS (1982). Physician behaviors that correlate with patient satisfaction. J Med Educ. 57(2):105–12.
Desai SB, Dubey A, Joshi BL, Sen M, Shariff A, Vanneman, R (2010). Human Development in India – Challenges for a Society in Transition. Oxford: Oxford University Press.
Government of India (2012). National Health Profile of India. Central Bureau of Health Intelligence, Ministry of Health and Family Welfare (http://cbhidghs.nic.in/index2.asp?slid=1256&sublinkid=1163, accessed 17 August 2013).
Government of India (2013). Census of India: sample registration system bulletin. New Delhi: Office of the Registrar General and Census Commissioner (http://censusindia.gov.in/vital_statistics/SRS_Bulletins/Bulletins.html, accessed 11 September 2013).

Public hospital governance in India
253
Gudwani A, Mitra P, Puri A, Vaidya M (2012). Healthcare systems and services: India healthcare: inspiring possibilities, challenging journey. Prepared for Confederation of Indian Industry (CII). New Delhi: McKinsey & Company Inc. (www.mckinsey.com, accessed 10 September 2014).
Ministry of Health and Family Welfare (MOHFW) (1983). National Health Policy 1983. New Delhi: Government of India (http://www.communityhealth.in/~commun26/wiki/images/6/64/Nhp_1983.pdf, accessed 4 September 2013).
Ministry of Health and Family Welfare (MOHFW) (2002). National Health Policy 2002. New Delhi: Government of India (http://MOHfw.nic.in/WriteReadData/l892s/2105179110National%20Health%20policy-2002.pdf, accessed 7 August 2013).
Ministry of Health and Family Welfare (MOHFW) (2005). Seventh report of the Public Accounts Committee (14th Lok Sabha) – 2004–2005: All India Institute of Medical Sciences. New Delhi: Government of India.
Ministry of Health and Family Welfare (MOHFW) (2013). National Urban Health Mission (NUHM) as a sub-mission under the National Health Mission (NHM). Press Information Bureau, Government of India (http://pib.nic.in/newsite/erelease.aspx?relid=95385, accessed 10 September 2014).
National Commission on Macroeconomics and Health (2005). Report of the National Commission on Macroeconomics and Health 2005. New Delhi: Government of India, Ministry of Health and Family Welfare.
Planning Commission (various years). Five-Year Plans. New Delhi: Government of India (http://planningcommission.nic.in/plans/planrel/index.php?state=planbody.htm, accessed 8 September 2013).
Rajya Sabha Secretariat (2008). Report on All India Institute of Medical Sciences Regulations 1999: Committee on Subordinate Legislation 178th Report. New Delhi (http://rajyasabha.nic.in/rsnew/annual_report/2008/SubLegis.pdf, accessed 10 September 2014).

254
Rao M, Rao KD, Shiva Kumar AK, Chatterjee M, Sundararaman T (2011). Towards universal health coverage, human resources for health in India. Lancet. 377:587–98.
Reddy KS, Patel V, Jha P, Paul VK, Kumar AK, Dandona L; Lancet India Group for Universal Healthcare (2011). Towards achievement of universal health care in India by 2020: a call to action. Lancet. 377:760–8.
Singh M, Vaishya S, Gupta S, Mehta VS (2006). Economics of head injuries. Neurol India. 54:78–80.
Study on Employee Satisfaction conducted by the Department of Hospital Administration, AIIMS (2012).
Study on Maximum Handling Capacity of Select Departments at AIIMS conducted by Department of Hospital Administration at AIIMS, 2008–2009.
Study on Patient Profile of AIIMS conducted by the Department of Hospital Administration, AIIMS (2011).
Study on Patient Satisfaction at AIIMS conducted by the Department of Hospital Administration, AIIMS (2012).
Valiathan Committee (2009). Report on AIIMS (http://www.aiims.edu/aiims/report.pdf, accessed on 21 August 2013).
Vashist P, Gupta N, Rathore AS (2012). Sentinel surveillance of blindness: an initiative of the National Programme for Control of Blindness in India. Indian J Community Med. 37:139–41.
World Health Organization (WHO) (2013). World health statistics 2013. Geneva (http://www.who.int/gho/publications/world_health_statistics/2013/en/, accessed 26 August 2013).
World Health Organization (WHO), Country Office for India (2012). Country Cooperation Strategy 2012–2017. New Delhi: WHO, Country Office for India.

Public hospital governance in India
255
World Bank, Health, Nutrition and Population Unit, South Asia Region (2001). Raising the sights: better health systems for India’s poor. New Delhi: World Bank.
World Bank (2013). GDP India 2012 (http://data.worldbank.org/indicator/NY.GDP.MKTP.CD/countries?display=default, accessed 28 August 2013).

256
G. Public hospital governance in Sri LankaA case study on processes and performance Shanti Dalpatadu, Prasadini Perera, Ruwani Wickramasinghe, Ravindra P. Rannan-Eliya

Public hospital governance in Sri Lanka
257
AbstractPublic sector health services have been, and continue to be, the backbone of the health sector in Sri Lanka. This case study describes the governance processes and performance of secondary- and tertiary-level public hospitals in Sri Lanka.
Identifying governance processes involved a literature review of official Government publications and other published and unpublished literature, as well as focus group discussions and in-depth interviews with directors of secondary and tertiary hospitals. Assessing the performance of public hospitals was also achieved using data from official Government publications and the Medical Statistics Unit.
The central Ministry of Health (MOH) has a predominant role in the governance of public hospitals; although, administratively, the majority of these institutions were decentralized to the Provinces (in 1987). These relationships arise from the central disbursement of financing based on historical budgets and the MOH keeping control over functions such as national policy formulation and health legislation; the procurement of essential drugs and medical supplies; and the recruitment, assignment and promotion of medical officers and medical administrators.
There have not been any major changes to hospital governance since the decentralization of power to the provinces in 1987. Nevertheless, there have been recent adaptive policy responses such as the upgrading and re-categorization of hospitals, the introduction of quality improvement programmes and the establishment of a post-graduate qualification in medical administration. These however, are all centrally driven initiatives with little change in the governance structure at the individual hospital level. Hospital directors have limited autonomy in terms of the strategic and financial direction of the hospital, although they have sole authority to carry out day-to-day operational management within the resources provided. The performance of public hospitals has shown improvement over the years through a number of efficiency indicators. In Sri Lanka, stewardship and centre-dominated governance processes appear to have made a substantial contribution to the observed level of improved hospital performance, while the operational level contributors are harder to identify.

258
Acronyms and abbreviationsALOS average length of stay
BOR bed occupancy rate
BTOR bed turnover rate
NHDC National Health Development Committee
PMOH Provincial Ministry of Health
RDHS Regional Director of Health Services
Public hospital governance in Sri Lanka
259
1. Introduction This case study focuses on secondary- and tertiary-level public hospitals in Sri Lanka that provide curative care services. These include the categories of teaching hospitals, provincial general hospitals, district general hospitals and base hospitals (type A and type B). Secondary hospitals provide four basic specialities (medicine, surgery, paediatric, obstetrics and gynaecology) and manage patients needing specialist care that are not available in primary care hospitals, while tertiary hospitals provide added specialties. Divisional hospitals and primary medical care units (i.e. maternity homes and central dispensaries), which are primary-level facilities, are excluded from the study. In addition, some specialized teaching hospitals or apex referral hospitals for specific diseases/organ systems (e.g. cancer, eye, paediatric etc.) are also excluded from the case study because they lack generalizability with the patient mix in the other secondary- and tertiary-level hospitals. Additionally, there are two semi-autonomous board-managed public hospitals in Sri Lanka (Sri Jayawardenapura General Hospital and Vijaya Kumaratunga Memorial Hospital). These are similarly excluded from the case study because semi-autonomy for these hospitals was granted due to donor request, and not due to a specific intervention or policy change. Thus, the focus of this case study is a total of 98 secondary- and tertiary-level hospitals, which constitutes more than 9% of all public sector healthcare facilities in Sri Lanka (MOH 2010, 2013).
The focus on these secondary-and tertiary-level hospitals is due to several reasons. First, as a group, this 9% of hospitals accounts for the majority of total bed capacity and treats two thirds of total inpatients and a third of total outpatients that seek services from the public sector (Figure 1). Second, these hospitals are managed by medical administrators in administrative grades, have more complex governance structures considering their larger budgets, more advanced facilities, and a larger range and level of staff involved in service delivery. The expectation, therefore, was to glean more focused information on hospital governance pertaining to these higher-tier hospitals.

260
Figure 1: Bed capacity, inpatients treated and outpatient attendance at secondary- and tertiary-level hospitals (% of total), 2010
58.4%
67.8%
36.1%
0.0%
10.0%
20.0%
30.0%
40.0%
50.0%
60.0%
70.0%
80.0%
Per
cent
age
of t
otal
Number of beds Inpatients treated Outpatient attendance
Note: Percentages obtained from the total number of beds, total inpatients and total outpatient attendance in public-sector health facilities
Source: Medical Statistics Unit (data obtained in 2014)
The objectives of the case study were met with both secondary and primary data collection. Secondary data collection included a literature review of: a series of Government commissioned reports on the organization of medical and public health services and health administration; official policy documents, laws, regulations, health plans and supporting documents; and relevant published work on public hospitals and the health system in Sri Lanka and hospital governance literature in general. Additionally, the performance of public hospitals was assessed using a number of sources of information from the Medical Statistics Unit, MOH; MOH publications and Government-published statistics, including data from the Institute for Health Policy, Sri Lanka along with the Sri Lanka National Health Accounts database (Institute for Health Policy 2012a) and private hospitals and nursing homes database (Institute for Health Policy 2012b); and, for international benchmarking, the Organisation for Economic Co-operation and Development (OECD) health database (OECD Health Data 2014).

Public hospital governance in Sri Lanka
261
Importantly, the case study findings are expected to represent all secondary- and tertiary-level public hospitals in Sri Lanka, excluding the specialized hospitals and two semi-autonomous hospitals as explained earlier. This is due to the homogeneous bureaucratic way that public hospitals are administered, as well as the limited major reforms that have been implemented with a transforming impact on governance.
Primary-data collection is also an important component of this case study. Information on practical experiences, implications and manifestations of existing governance structures on processes and performance is partly tacit knowledge within public hospitals. This knowledge is available to those directly involved in running public hospitals at the supervisory and administrative levels. Focus group discussions and in-depth face-to-face interviews were carried out among administrators to gain an insight into the degree of authority over important inputs and resources as well as the possible reasons for observed levels of hospital performance. Focus group discussions were carried out with medical administrators from secondary- and tertiary-level central MOH hospitals. A total of 12 hospital directors, from among those who attended the bimonthly central MOH medical administrators’ meetings, were able to stay on to participate in two further focus group discussions. The first group consisted of five administrators: four teaching hospital administrators and one provincial general hospital administrator. The second focus group consisted of six district general hospital administrators and one base hospital administrator. Discussions focused on: the level of decision-making authority available to the hospital administrator with regard to different staff categories, the hospital budget and the procurement of medicines; hospital performance target-setting, monitoring and evaluation as well as incentives; external pressures; training and the capacity of hospital administrators to function in their current role; constraints in implementing process changes to improve hospital performance; and the role of the Japanese 5S tool in improving hospital performance. 5S is an approach to implementing total quality management (TQM) originally developed by Japanese manufacturers, drawing on work by both Japanese and American researchers, but adopted in a range of other industries around the world.

262
In addition to focus group discussions, in-depth face-to-face interviews were carried out with the following present and former medical administrators:
• three hospital directors: one each from a teaching hospital, district general hospital and a base hospital;
• one regional director of health services;
• one senior medical administrator from the MOH; and
• five retired senior medical administrators.
The administrators were selected as key informants based on their availability and agreement to participate in the case study. The interviews were designed to obtain in-depth information on strategic direction, decision-making authority, supervision and support, management and leadership, capacity, motivations, and challenges to performance.
2. Country contextSri Lanka is a small tropical-island nation (65 610 km²) in South Asia with a population of 20.5 million in 2013 (Department of Census and Statistics 2014). The population consists of multiple ethnicities and religions, and is predominantly rural. Sri Lanka has one of the fastest-growing ageing populations in Asia, with the share of the population aged 65 years or more expected to increase from 8% in 2011 to 13% by 2025 (United Nations Population Division 2013). Fertility has declined to near replacement level, and Sri Lanka is close to completing its demographic transition. (United Nations Population Division 2013). However, Sri Lanka is still dealing with a double burden of disease, with communicable disease in addition to poverty (e.g. malnutrition, low birth weight, etc.) still taking their toll, along with an unprecedented rise in the incidence of noncommunicable disease (NCD) (Medical Statistics Unit 2010). Some key demographic statistics are presented in Table 1.

Public hospital governance in Sri Lanka
263
Table 1: Key demographic indicators for latest available year
Indicator
Population 0–14 years (%), 2011 24.9
Population 65 years and above (%), 2011 8.4
Human Development Index, 2012 0.715
Female literacy rate (%), 2010 90.8
Male literacy rate (%), 2010 93.2
Average life expectancy at birth (years), 2011 74.9
Source: Central Bank of Sri Lanka 2013
2.1 Historical Initial contact with western (allopathic) medicine in Sri Lanka was during Portuguese occupation in the sixteenth century. However, it was during British colonial rule (1796–1948) that western medicine proliferated and became established alongside the local systems of medicine (Uragoda, 1987). The creation of a separate Civil Medical Department in 1858 is considered a major milestone in the establishment of a robust health service in the country (Uragoda, 1987). The development of a health infrastructure was to ensure a healthy population of immigrant plantation workers, and to create a relatively healthy place for expatriates. In response, health institutions were initially established in major cities, on immigrant worker routes and plantation districts. The network of institutions, ranging from hospitals (including specialized hospitals) to dispensaries and other administrative institutions, created a sound health infrastructure upon which the present healthcare system has been established and expanded (Uragoda, 1987).
2.2 Economy Sri Lanka first liberalized its economy in 1978, and at present is a recent entrant (in 2010) to the World Bank’s lower-middle income country status. The economy has reached lower-middle income country (LMIC) status (Table 2), with a GDP per capita of US$ 3280 in 2013 (Central Bank of Sri Lanka, 2014). The service sector had the highest proportion of labour force participation (42.9% in 2012) and is the main contributor to the economy (57.5% of GDP in 2012) (Central Bank of Sri Lanka, 2014). Table 2 provides some key economic indicators for Sri Lanka in 2000 and 2013.
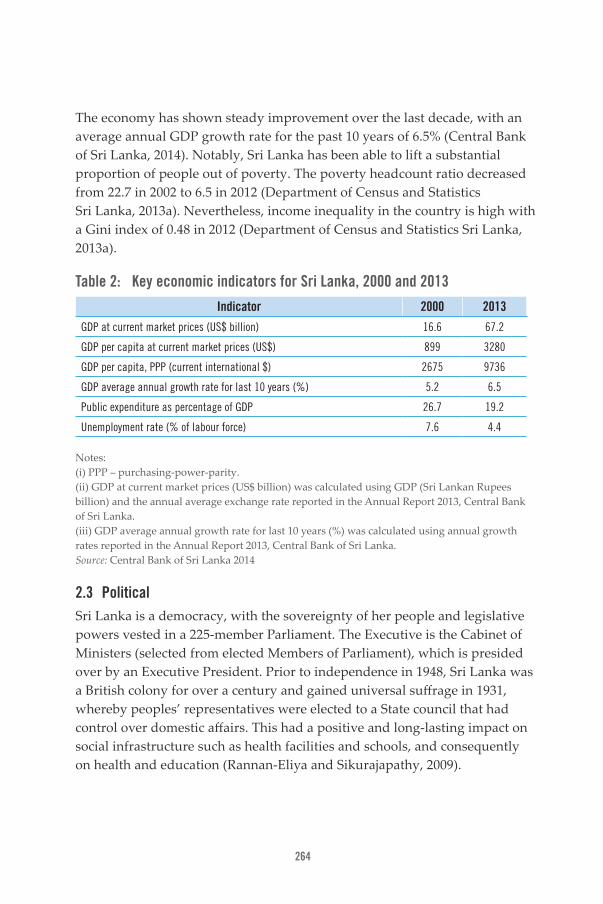
264
The economy has shown steady improvement over the last decade, with an average annual GDP growth rate for the past 10 years of 6.5% (Central Bank of Sri Lanka, 2014). Notably, Sri Lanka has been able to lift a substantial proportion of people out of poverty. The poverty headcount ratio decreased from 22.7 in 2002 to 6.5 in 2012 (Department of Census and Statistics Sri Lanka, 2013a). Nevertheless, income inequality in the country is high with a Gini index of 0.48 in 2012 (Department of Census and Statistics Sri Lanka, 2013a).
Table 2: Key economic indicators for Sri Lanka, 2000 and 2013
Indicator 2000 2013
GDP at current market prices (US$ billion) 16.6 67.2
GDP per capita at current market prices (US$) 899 3280
GDP per capita, PPP (current international $) 2675 9736
GDP average annual growth rate for last 10 years (%) 5.2 6.5
Public expenditure as percentage of GDP 26.7 19.2
Unemployment rate (% of labour force) 7.6 4.4
Notes: (i) PPP – purchasing-power-parity. (ii) GDP at current market prices (US$ billion) was calculated using GDP (Sri Lankan Rupees billion) and the annual average exchange rate reported in the Annual Report 2013, Central Bank of Sri Lanka. (iii) GDP average annual growth rate for last 10 years (%) was calculated using annual growth rates reported in the Annual Report 2013, Central Bank of Sri Lanka. Source: Central Bank of Sri Lanka 2014
2.3 Political Sri Lanka is a democracy, with the sovereignty of her people and legislative powers vested in a 225-member Parliament. The Executive is the Cabinet of Ministers (selected from elected Members of Parliament), which is presided over by an Executive President. Prior to independence in 1948, Sri Lanka was a British colony for over a century and gained universal suffrage in 1931, whereby peoples’ representatives were elected to a State council that had control over domestic affairs. This had a positive and long-lasting impact on social infrastructure such as health facilities and schools, and consequently on health and education (Rannan-Eliya and Sikurajapathy, 2009).

Public hospital governance in Sri Lanka
265
Since Independence, two major political parties have continued to swap power and political orientation. One party has been centre-left, while the other has been comparatively centre-right. Sensitivity of elected representatives to voter concerns has continued to garner bipartisan support for a strong public sector healthcare delivery system without user fees and driven by the principal of universal access.
In recent decades, Sri Lanka has fought an armed internal conflict that lasted for over 25 years (1983–2009), with the North and East of the island predominantly bearing the brunt of the debilitating struggle. In spite of this, elections at the local, provincial, parliamentary and presidential levels have been held continuously in many parts of the island; and, for the most part, public hospitals have operated continuously in the conflict areas throughout this period.
2.4 Institutional At present, for general administration the country is divided into nine Provinces, 25 Districts and 331 Divisional Secretary areas, with further divisions at the local level. Although Provinces have been in existence since the 19th century, they gained importance administratively in 1987 with the 13th Amendment to the Sri Lankan Constitution. The amendment was in response to external pressure to decentralize the Government. The nine provincial councils subsequently established were autonomous entities and not under any Ministry, and were granted the authority to write their own legislature in a number of areas including health (Sri Lanka Constitution 13th Amendment 1987, Provincial Councils Act No. 42, 1987).
However, in practice, power has remained largely centralized and continues to be a source of political and administrative dissatisfaction. Although the main authorities of the public health system are the MOH along with the Provincial Ministries of Health (PMOHs), the issues that arise due to the (insufficient) devolution of power are also relevant to the public health system and, consequently, to public sector facilities.

266
3. Public sector health services3.1 Current health care systemSri Lanka’s healthcare system today is mixed. Public services are funded by taxation, and private services mostly financed by household out-of- pocket payments. In 2010, total health spending was equivalent to 3.5% of GDP (Institute for Health Policy, 2012a), just under half (44%) of which was financed by public sources, and the rest by private financing. Funding by external donors is small, averaging 2.2% of total spending in the past decade (Institute for Health Policy, 2012a). Hospital spending accounts for 70% of the government’s recurrent health budget, a proportion which has changed little since the 1950s and which is one of the highest in the region (Rannan-Eliya 2008).
3.2 OrganizationGovernment health services are separated into two functional arms – curative and preventive. Two parallel hierarchies of managers administer each, although sitting within the same organizational structure. The preventive services operate an extensive, countrywide network of around 300 physician-led, standalone health units, which deliver preventive and routine MCH services to their catchment areas. The curative services comprise all the hospitals and other outpatient-only facilities, ranging from primary care units to tertiary and specialized hospitals. These are owned and operated by MOH and the nine PMOHs. They are organized into a hierarchical, pyramidal network, in which higher-level facilities act as referral centres for lower level ones in their catchment areas.
The infrastructure for the curative health care system consists of an extensive network of health care facilities. On average, a public health care facility is located less than five kilometres from a person’s residence (Medical Statistics Unit, 2010), and range from primary medical care units that provide only outpatient services to tertiary-level and specialized hospitals. Further details on the hospitals are provided in section 3.

Public hospital governance in Sri Lanka
267
3.3 UtilizationHealth care utilization in Sri Lanka is high, even reaching levels and exceeding some developed nations, particularly for inpatient care (OECD Health Data 2014; OECD-World Health Organization 2012). In 2011, total inpatient use was 275 discharges per 1000 population, with the public sector accounting for over 95% of total inpatient care (Institute for Health Policy, 2012b). In terms of equity, public sector inpatient use was generally equal across socioeconomic groups in 2003/04, with no evidence of a change in more recent years (Figure 2). Public sector hospitals, therefore, play a crucial role in reaching and providing inpatient hospital services to the large majority of Sri Lankans.
Figure 2: Utilization of inpatient care (total, public and private) by socioeconomic group, 2004 and 2009
50
45
40
35
30
25
20
15
10
5
0Total inpatient
(2003/04)(CI 0.05)
poorest 20%
Total inpatient(2009)
(CI -0.028*)
Public inpatient(2003/04)(CI -0.01)
Private inpatient(2003/04)
(CI 0.035***)
2 3 4 richest 20%
Per
cent
age
(%)
Notes: (i) CI: * p<0.05, ** p<0.01, ***p<0.001 (ii) Public/private breakdown was not possible to obtain from the HIES 2009
Source: Central Bank of Sri Lanka’s Consumer Finances and Socioeconomic Survey (CFS) 2003/04 and Department of Census and Statistics’ Household Income and Expenditure Survey (HIES 2009/10.

268
In 2011, outpatient utilization was 5.1 doctor consultations per capita (OECD–World Health Organization, 2012). Although this utilization rate is lower than the OECD average, it is higher than most countries in the Asia-Pacific region (OECD–World Health Organization 2012). Furthermore, the public sector provided 45% of total outpatient care. In terms of equity, although total utilization has tended to be pro-rich, total public sector outpatient utilization as well as hospital outpatient utilization has been pro-poor (Figure 3).
Figure 3: Utilization of outpatient care (total, total public, public hospital and private) by socioeconomic group, 2004 and 2009
40
35
30
25
20
15
10
5
0Total outpatient
(2003/04)(CI 0.05***)
poorest 20%
Total outpatient(2009)
(CI 0.060***)
Public outpatient(2003/04)
(CI -0.161***)
Public hospital outpatient (2003/04)
(CI -210***)
Private outpatient(2003/04)
(CI 0.232***)
2 3 4 richest 20%
Per
cent
age
(%)
Notes: (i) CI: * p<0.05, ** p<0.01, ***p<0.001 (ii) Public /private breakdown was not possible to obtain from the HIES 2009
Source: Central Bank of Sri Lanka’s Consumer Finances and Socioeconomic Survey (CFS) 2003/04 and Department of Census and Statistics’ Household Income and Expenditure Survey (HIES 2009/10).
4. Hospital systemThe public sector institutions that provide curative care services are presented in Table 3. The secondary and tertiary hospitals that are the focus of this case study are highlighted (Note: Under the teaching hospital category Table 3 includes the 10 specialized hospitals and the semi-autonomous hospital, although they are not part of this case study).

Public hospital governance in Sri Lanka
269
The catchment areas of the secondary and tertiary hospitals are demarcated by provincial and district boundaries, not on population basis.
Table 3: Number and bed strength of curative care institutions, 2011
Classification Description Number Beds
Teaching hospital (including special-ized teaching hospitals)
Tertiary Apex referral hospitals 21 21 350
Provincial general hospital
Tertiary Similar facilities as teaching hospitals located in provincial capitals that lack teaching hospitals
3 4203
District general hospital
Tertiary One or two hospitals in each district where there are no provin-cial general hospitals
18 10 423
Base hospital – Type A
Secondary Has four basic specialties and some other finer specialties (e.g., ear, nose and throat, eye)
26 8306
Base hospital – Type B
Secondary Has few basic specialties and is earmarked to be upgraded to type A once basic specialties are available
41 6458
Divisional hospital – Type A
Primary 46 4763
Divisional hospital – Type B
Primary 134 8732
Divisional hospital – Type C
Primary 311 7168
Primary medical care unit
Primary 476 271
Total 1076 71 674
Beds per 1000 population
354
Note: The 10 specialized teaching hospitals and one semi-autonomous hospital under the teaching hospital category account for approximately 31% of total teaching hospital bed-capacity
Source: MOH, Health Facility Survey (2013)
For each level and type of institution, MOH defines the expected level of staffing and equipment, and mix of services that must be delivered (Ministry of Health 1995, 2002), although services may often fall short

270
owing to gaps in available staffing or equipment (Nagayama, 2004). In terms of service configuration, all facilities – irrespective of type and level (with the exception of some specialized hospitals) – are expected to provide outpatient care, maternal and child health services and family planning. In addition to these primary care services, the secondary care facilities must provide radiology and comprehensive pathology services; have surgical theatres and intensive care units; and have the four basic specialties of medicine, paediatrics, surgery, and obstetrics and gynaecology. Base Hospitals are categorized as Type A or Type B, according to the availability of other specialist services, such as ENT, eye, dermatology, and psychiatry. Higher-level facilities provide more extensive specialist services, with teaching hospitals providing the most comprehensive range. Human resources in secondary and tertiary hospitals are given in Table 4.
Table 4: Human resources in secondary and tertiary public hospitals, 2011
Number Population per provider
Total number of medical specialists 1486 13 636
Physicians 192 105 540
Paediatricians 140 144 741
Obstetricians 135 150 102
General surgeons 112 180 926
ENT surgeons 41 494 237
Eye surgeons 54 375 254
Pathologists 113 179 325
Radiologists 71 285 405
Cardiologists 36 562 881
Maxillo-Facial surgeons 33 614 052
Psychiatrists 46 440 516
Consultant judicial medical officers 28 723 704
Notes: (i) Includes human resources in specialized teaching hospitals (ii) Medical officers, nursing officers and professions supplementary to medicine have not been included due to difficulty in disaggregating to secondary and tertiary hospitals only
Source: MOH, Health Facility Survey (2013)

Public hospital governance in Sri Lanka
271
Taken together, the public sector facilities are organized in a hierarchical manner that implies a referral system, although referral as implicitly intended is not realized in practice. As indicated in Table 3, divisional hospitals and primary medical care units only provide primary-level care, and these consist of nearly 90% of total public sector health care facilities. However, as noted earlier, all other hospitals (e.g., teaching, provincial general, district general and base hospitals) are also expected to, and do, provide primary care through the hospitals’ outpatient departments (OPD). The provision of facility-based primary care in the public sector is through this network of public sector institutions only. Patients are free to, and do, access care from any public sector institution of their choice, irrespective of district and provincial boundaries; and public sector facilities cannot deny services to anyone who turns up on their doorsteps.
Because a referral system was not explicitly implemented and because facilities at all levels provide primary care (including tertiary care hospitals), the bypassing of the lower-tier health care facilities by patients is a problem. This results in underutilization of the primary care institutions and overcrowding in higher-level institutions. The enforcement of a referral system is politically unpopular and has taken a back step in response to patients’ perceptions of the quality of care and their expectations of care and provider choice. This is in addition to the lack of an organized system of General Practitioners to act as gatekeepers to secondary and tertiary hospital services (Rannan-Eliya and Sikurajapathy, 2009). Furthermore, better access to roads and transportation has facilitated the bypassing of lower-tier institutions closer to patients’ homes. Patients that opt to receive first contact health care from secondary- and tertiary-level hospitals do so from general OPDs, which can facilitate referral to specialized clinics. In response to the bypassing issue, over time, the Sri Lankan health care system has shifted resources to hospitals with larger capacities (Ministry of Health, 2002). Additionally, a policy decision was made to upgrade a hospital in each district to a tertiary care district general hospital, particularly in districts without a teaching hospital or a provincial general hospital.
The private sector in Sri Lanka plays an important role in the delivery of health services, particularly in terms of outpatient care. Private hospitals

272
along with a large number of private General Practitioner clinics and specialist channelling centres provide outpatient care. In comparison to the public sector, the private sector accounted for 17% of total hospitals, 6% of total bed capacity, and 4% of total inpatients in 2010 (Table 5). The private hospitals are located predominantly in urban and suburban centres. The Western Province (with the most urbanized areas in the country) accounts for 51% of all hospitals in Sri Lanka, of which more than half are located in Colombo district alone (Institute for Health Policy, 2012b). The several thousands of private General Practitioner clinics and channelling centres have wider coverage throughout the island. Sri Lanka, like many other countries, allows its public sector medical officers to conduct dual practice – i.e. many private sector doctors are predominantly public sector medical officers who practice in the private sector in their off-duty hours. A referral system has also not been implemented in the private sector, so patients are able to select the specialists of their choice.
Table 5: Hospital ownership, beds and discharges, Sri Lanka 2010
Type Hospitals Beds Inpatient discharges
Number % of total Number % of total Number % of total
Public
Tertiary 32 4.3 28 459 37.1 2 476 947 42.4
Secondary 66 8.0 13 919 18.1 1 312 964 22.5
Special 11 1.5 6523 8.5 266 134 4.6
Other 507 68.5 23 609 30.8 1 535 180 26.3
Subtotal 616 83.1 72 510 94.5 5 591 225 95.8
Private 124 16.8 4 188 5.6 245 366 4.2
Total 740 100.0 76 698 100.0 5 836 591 100.0
Note: Public hospitals include all facilities with inpatient beds.
Source: Ministry of Health 2010, Institute for Health Policy 2012b, Medical Statistics Unit (data obtained in 2014).
Since 1990, the private hospital sector has shown a considerable expansion, particularly in the mainly urbanized Western Province of the country, and

Public hospital governance in Sri Lanka
273
these trends are expected to continue (Table 6). Even within the Western Province, the Colombo District predominates in the delivery of private sector hospital services (Rannan-Eliya et al. 2012). The majority of hospitals (73%) have less than 50 beds, with 7% of hospitals having over 100 beds. The latter accounts for 40% of total bed capacity, 56% of total inpatient admissions, and 42% of total outpatient visits in the private sector (Institute for Health Policy 2012b). These large hospitals are multi-specialized, sophisticated and rival the tertiary-level public hospitals. Anecdotally, the establishment of these hospitals alongside better hotel services has attracted the non-poor to seek health care from these institutions. These market forces have contributed to the implementation of total quality management programmes and improvements in cleanliness and other amenities in the public sector.
Table 6: Key statistics from private sector hospitals in Sri Lanka, 1990 and 2011
1990 2011
Sri Lanka (total)
Western Province (as % of total)
Sri Lanka (total)
Western Province (as % of total)
Colombo District (as % of total)
Number of hospitals 66 49% 125 51% 27%
Number of beds 2 004 54% 4 326 65% 50%
Number of admissions 100 211 59% 257 747 72% 58%
Number of outpatient visits 1 126 953 62% 5 094 222 66% 46%
Revenue (₹ million) 426 80% 19 941 89% 82%
Capital expenditure
(₹ million) 77 77% 3 192 83% --
Source: IHP 2012b
5. Public hospital governanceThe network of public sector facilities fulfils two important policy objectives in the Sri Lankan public health system. First, it acts as the backbone for delivering primary to tertiary care hospital services to improve the health of all citizens, irrespective of socioeconomic status, urban/rural location, ethnicity and other factors. Second, it removes barriers to access, both physical and financial, by ensuring a substantive network of facilities is

274
spread throughout the nation and by providing adequate risk protection with no user charges for the services delivered.
The structure for describing public hospital governance in Sri Lanka draws extensively from several publications on public hospital governance (European Observatory on Health Systems and Policies, 2011) and health system governance (Barbazza and Tello, 2013; Steel et al., 2008). These illustrate that public hospital governance is multi-dimensional, with complex interrelationships between the different dimensions, each of which must be given due consideration to understand their effect on the behaviour, management and performance of public hospitals.
At the macro level, governance of public hospitals is shaped by a nation’s politics, economy and history, as well as its population structure, disease patterns, and changing patient expectations. Each of these macro-level components was described earlier under ‘Country context’. The public hospital system is one component of the overall (public) health system. At an intermediate level, policies, rules and regulations, health personnel and training, professional organizations, trade unions, monitoring and evaluation, and the organizational and administrative power structures influence both the overall health system and hospital system within it. All these players exert influence on the management and performance of public hospitals.
Public hospitals must constantly attempt to improve their technical efficiency; provide clinical care that fulfils quality, safety and effectiveness criteria; and be responsive to changing disease patterns and patient expectations – all within the constraints mentioned previously. At the individual hospital level this can be challenging, depending on the extent to which a hospital has the managerial, technical and financial capacities and autonomy to make necessary adjustments. Thus, the strategic direction of a hospital, including its goal setting, establishment of performance criteria, supervision of hospital management and monitoring performance, as well as financial sustainability and accountability, become important. The structures in place that guide these strategic directions are an integral part of hospital governance.

Public hospital governance in Sri Lanka
275
5.1 Organizational structureAn overview of the organizational set up and two main external influences of the public hospital system in Sri Lanka are provided in Figure 4. The central MOH is headed by the cabinet minister for health in the central Government and the PMOHs are headed by the ministers of health in the provincial governments.
Figure 4: Set up of public hospital system and influencing agencies
Central Government
Ministry of Higher EducationIsland-wide
education and training of doctors and administrators
Provincial Government
Ministry of Health Ministry of Finance
Provincial Ministry of Health
Secretary
- Medical services- Public health services- Laboratory services- Biomedical services- Education, teaching and research- Dental services
- Finance- Administration- Audit- Building and Logistics- Investigation and flying squad- Management and planning
Provides financing to central MoH and Provincial MoH
Finance Commission
Director General of Health Services (DGHS)
Department of Health Services (DOHS)
MDH Hospitals
Secretary
Provincial Director of Health Services (PDHS)
Provincial Department of Health Services (PDOH)
Regional Director of Health Services (RDHS)
MDH Hospitals
Source: Asia Pacific Observatory on Health Systems and Polices
The above diagram illustrates the link between the health ministries and other agencies such as the Ministry of Higher Education, which trains all physicians and hospital administrators, and the Ministry of Finance, which provides financing. These are two examples of other Government agencies that can influence the public hospital system. The Public Services Commission, the Sri Lanka Medical Council, and the Ministry of Public Administration and Home Affairs are some of the other agencies that could influence the system.
The Director General of Health Services in the MOH, along with the various departments (Figure 4), is directly responsible for central MOH hospitals. They are also responsible for providing technical assistance to the provincial institutions when required. Similarly, the Provincial Director of

276
Health Services, along with the Provincial Department of Health Services, is directly responsible for provincial institutions.
Of the secondary and tertiary hospitals of interest to this case study, in 2010, nearly 30% came directly under the central MOH (all teaching and provincial and some district and base) while the rest were under the provincial ministries.
The transfer of hospital ownership to the nine provinces took place with the decentralization of the Government under the 13th Amendment to the Constitution in 1987. However, in practice, some of the important administrative functions remain under the direct control of the MOH. The procurement and allocation of essential drugs and medical supplies, as well as the recruitment, assignment and promotion of physicians and medical administrators also remained under the MOH. The provincial ministries can assign all other health staff and allocate drugs to individual hospitals. The provincial ministries also have the power to procure and maintain medical equipment.
5.1.1 Financing
The provinces fund their own hospitals, but all public sector health institutions are essentially funded by the central government from general taxation. Although the provincial councils have the authority to raise their own tax revenue, they raise less than 26% (2007-2010) of their budgets from their own revenues (The Finance Commission, 2012), and they remain dependent on central government transfers, which are made via the Finance Commission, a constitutional body established to determine fiscal transfers to provinces.
This reality and other features in practice limit the space for PMOHs to independently modify the funding and resources provided to individual hospitals. Hospital capital budgets are held and allocated centrally by MOH, although provincial ministries have some powers to procure hospital equipment. Although provinces are free to set the levels and composition of their own hospital recurrent budgets, in practice this is tightly constrained for four reasons. First, wage schedules and terms and conditions for almost all hospital staff are set centrally. Second, the doctors assigned to each
Public hospital governance in Sri Lanka
277
hospital are determined centrally, with the provincial budget required to fund the associated wage costs. Third, the centre makes the bulk of its fiscal transfers to provinces in the form of block grants, which are computed on the basis of the number and salary grades of all provincial workers currently in post, which reduces the flexibility of each council to substantially change staffing numbers in the province. Fourth, the bulk of the public sector budget for medicines and supplies is held centrally, with all items being centrally purchased and distributed, and only secondary and tertiary hospitals have some limited self-purchasing authority.
5.2 Strategic directionThe goal of the central MOH is the “provision of curative, preventive, rehabilitative and promotive services of optimum quality accessible to the entire nation”. Producing health legislation, formulating national and provincial health policy and strategy, providing operational guidelines for policy implementation, and monitoring and supervising policy execution is carried out by the central and provincial MOHs. While the provincial ministries can produce their own legislation and policies, in practice, the central MOH produces national-level health policies and legislation, which are also implemented in provincial ministry hospitals. The centrally driven policy interventions described in the following section are some examples of the direction provided by the central MOH to the overall hospital system.
5.3 Hospital reformsThere have not been any major changes to hospital governance since the decentralization of power to the provinces in 1987. Some policy interventions that were introduced to the hospital system in the last two decades are described below.
A notable public hospital reform has been the implementation of quality assurance programmes in all hospitals. The Japanese 5S programme to improve productivity and efficiency was first implemented at a maternity hospital in 2000 under the central MOH’s productivity improvement initiative. Since its successful implementation (Kaluarachchi, 2009), the programme has been implemented in all public hospitals island-wide. With the aim of expanding and institutionalizing this initiative, Quality

278
Management Units have been set up in every secondary and tertiary care hospital over the past two years (2012/2013). These units, which are accountable to the Quality Secretariat in the central MOH, are expected to perform the following functions (Ministry of Health, 2009):
• implement and monitor quality improvement programmes;
• develop tools for productivity and quality improvement;
• conduct employee satisfaction and patient satisfaction surveys to identify problems and take corrective action;
• prepare patient care guidelines and protocols in consultation with relevant stakeholders;
• maintain information systems with data on staff training on quality assurance and performance reviews, patient care and medical devices and equipment, including repair and maintenance;
• develop annual procurement plans;
• publish annual reports providing feedback to patients, employees and other stakeholders; and
• promote studies, research and medical audits in the hospital.
The upgrading of hospitals, especially in areas that did not have tertiary care facilities, was another policy reform that was implemented in the early 2000s. One secondary care hospital in each district was selected and earmarked or upgraded to a tertiary care district general hospital. This was based on the National Health Policy developed in 1996 and recommendations in the 1998 Presidential Task Force report on Health Policy Implementation (Ministry of Health, 2002). At present, each district in Sri Lanka has at least one tertiary-level hospital either as a district general, provincial general or teaching hospital.
The introduction of Master of Science (MSc) and Doctor of Medicine (MD) qualifications in Medical Administration in 1993 through the Postgraduate Institute of Medicine, and the stipulation in the 2007 Medical Services Minute (Ministry of Health 2007) that new medical administrators must hold a postgraduate qualification in medical administration or community medicine in addition to a clinical degree is another notable initiative. In 2013, 55% of hospital directors already had an MSc or MD specifically in medical administration(Wickramasinghe, Kugadas, and Dalpatadu 2013)

Public hospital governance in Sri Lanka
279
5.4 Management authorityThe degree of autonomy that hospital directors have to make decisions over inputs is limited. The budget and staff are assigned to each hospital from the centre. The former is based on a historical budget and the latter is based on hospital type and the facilities available. However, within the structure of the given inputs, hospital directors have the authority to:
• initiate disciplinary proceedings against hospital staff – however, they do not have the power to terminate employment, which lies in the hands of the ministries;
• assign staff who have not been assigned a job description by the ministry – typically these are mid-level to low-level employees;
• approve staff increments;
• conduct in-service training for staff;
• manage the hospital budget and allocate resources within the hospital – directors also have the use of a daily petty cash fund for emergency expenses;
• purchase of essential drugs locally, within the budget provided;
• lobby donors in the local community for contributions to the hospital; and
• develop medium-term hospital development plans and make requests to the MOH for capital investment or to seek the approval of locally donated capital improvement investments.
In focus group discussions with hospital directors, their limited power to take disciplinary action and terminate employment is frequently mentioned, and some directors express frustration and imply that this restricted authority is a limiting factor for their performance. However, directors in practice can and do use other approaches to manage staff. These include persuasion-based methods to reduce negative behaviour in staff, and conducting in-service training programmes with the aim of promoting positive staff attitudes. Hospital directors also report that having specialist training in medical administration contributes to empowering them with such strategies.

280
5.4.1 Management of inputs and outputs
The public hospital system not only focuses on inputs, which are controlled and provided to all hospitals by central and provincial authorities; hospital directors have limited or no decision-making authority to determine the patients they serve, core services and prices charged. The formal hospital budget allocated to each hospital is developed on a historical basis largely, taking into account the hospital type, available facilities and staffing levels. However, directors do have considerable authority over use and allocation of provided inputs to deliver services. The limited control of inputs and the outputs demanded and expected from public hospitals, have led to directors looking for more efficient ways of managing patient flows. For example, one hospital set up a preliminary care unit with less than 20 beds (a system which did not exist in other hospitals at the time) in the OPD, which reduced overcrowding in the wards by more than 50%. This led to an ongoing drive by MOH to set up preliminary care units in all secondary and tertiary care hospitals throughout the country (Ministry of Health, 2012).
However, because centralized policies govern health care delivery, individual hospital directors do not have the authority to make capital investments to expand health care services, if those services have not been prioritized under national health plans, and are subject to the availability of funds.
5.5 Accountability and supervisionAccountability is ensured by direct administrative control exercised by the central and provincial ministries (Figure 5). Financial accountability is maintained through the submission of monthly expenditure reports, and performance accountability through the submission of the quarterly Indoor Morbidity and Mortality Schedule (IMMS) which provides detailed information on patient turnover, mortality and operations. All secondary and tertiary care hospitals also have Quality Management Units that are accountable to the Quality Secretariat in the central MOH for maintaining quality standards.

Public hospital governance in Sri Lanka
281
To ensure action on the routine reports, line managers hold regular meetings with their subordinate hospital directors to review performance and discuss issues. In the case of MOH hospitals, directors are required to attend both the bimonthly meeting of MOH medical administrators,as well as the bimonthly National Health Development Committee (NHDC) meeting. The provincial and regional directors of health also attend the bimonthly NHDC meetings. Both meetings provide a platform to share experiences as well as discuss performance and operational problems. At the provincial level, some individual regional directors of health services (RDHS) hold monthly team meetings of their hospital directors to review performance and discuss operational issues, although this is not mandated. These meetings and the ultimate accountability to a single RDHS promotes hospital cooperation and networking at the district level, in effect transforming each area’s hospitals into a single network that can share resources, information and experience.
Our study’s in-depth interviews revealed that central MOH hospital directors are able to bypass the chain of command illustrated in Figure 5 and directly contact the Director General of Health Services for advice and support if needed.
Hospital directors of provincial ministry institutions are directly accountable to the RDHS. However, all hospital directors, whether they are appointed to central ministry or provincial ministry institutions, are recruited centrally and are finally accountable to the Director General of Health Services in the central MOH.
There is limited accountability to patients at the hospital level, as there is no clear mechanism for complaints.

282
Figure 5: Supervisory process of public sector hospitals
Provincial Government
Formal meetings
Bimonthly meeting of central MoH Hospital Directors with central MoH;
Secretary and Directors
National Health Development Committee Meeting
Bimonthly meeting of Provincial Secretaries and Directors with the central MoH; Secretary and Directors
Provincial Ministry of Health
Secretary of Health
Director General of Health Services
Deputy Director of General Medical Services
Hospital Director
Secretary of Health
Provincial Director of Health Services
Regional Director of Health Services
Hospital Director
Source: Asia Pacific Observatory on Health Systems and Policies
5.5.1 Supervision
The in-depth interviews revealed that there is very little scrutiny of how hospital directors manage the day-to-day operations of the hospital. Regular hospital inspection visits by the central MOH, about which retired administrators spoke at length, also appear to have declined in the recent past. Hospital directors revealed that they feel a sense of teamwork and encouragement from the ministries rather than a sense of strict supervision.
5.6 Leadership and managementHospital directors can make a key contribution to better public hospital governance and performance through good clinical and administrative leadership and management practices. Provided below is a brief review of the influences that were revealed through the in-depth interviews as factors that enhance, as well as undermine, the director’s leadership and management capacity.
Public hospital governance in Sri Lanka
283
Clearly communicated roles and responsibilities provide clarity and direction and can help to improve a director’s performance. The central MOH has published a manual defining the roles and responsibilities of hospital directors (Ministry of Health 1995).Although this manual is not widely distributed among hospitals, and only a limited number of physical copies are available at MOH, hospital directors interviewed stated that they had a clear understanding of their roles and responsibilities and knew what they were expected to achieve.
Management training can help to improve internal processes and enhance managerial professionalism. In its 2007 Medical Services Minute, MOH (2007) gave formal recognition to these qualifications by mandating that new medical administrators must hold a postgraduate qualification in either medical administration or community medicine. It is likely that eventually the requirement for postgraduate qualifications in administration will be made mandatory for most hospital and senior level management positions in MOH. Hospital directors stated that their clinical knowledge was important for informed and effective decision-making when taking certain budgetary decisions. As qualified physicians, there is also a sense of belonging to a profession, which facilitates better cooperation and understanding between hospital directors and physicians. The interviewees also emphasized that the training in medical administration was invaluable for improving their leadership skills and management practices. They particularly noted that it enhanced their ability to better manage hospital staff and operations. The postgraduate qualification in medical administration, in addition to the clinical training, has also given them higher status within the hospital than previously. This is important for engaging effectively with medical officers and specialist physicians.
A clear career pathway was found to be a motivating factor, as it laid down procedures for promotions, providing a sense of security. Furthermore, as all medical administrators are recruited centrally, there is no distinction between central ministry administrators and provincial ministry administrators. Directors serve for a term of four years in a hospital until they are assigned by the central MOH to another administrative position, either in the provincial ministry or central ministry, on the basis of seniority and performance record. Therefore, all directors and other medical

284
administrators have the opportunity to work their way up the ladder to the very top of the administrative chain at the central MOH. Directors identified this pathway as a motivating factor.
In terms of their political influence, political interference is a pervasive feature of the public sector in Sri Lanka, having grown incrementally since the 1960s. Interference particularly targets resource allocation, and the recruitment, promotion and placement of public servants. Most independent observers cite this interference as being the key factor behind the perceived deterioration in public sector performance in Sri Lanka since the 1960s.
Although political interference is least in the public health sector, because of strong trade unions, which resist political interference in decision-making, it is still a reality for hospital managers. The central recruitment and placement of hospital directors by the MOH appears to provide some protection for individual directors, but interviews indicate that local politicians are still able to wield their influence over hospital management through the highly politicised hospital development committees, which are mandated to work together with directors to ensure community needs are met.The committees made up of local community representatives, are often not knowledgeable about the healthcare system and work to serve particular political interests. Nevertheless, directors also indicate that they have some capacity to resist interference of these committees, taking advantage of social respect for their status. Having greater impact is the efforts of local politicians to exert patronage over appointments of minor staff at hospitals. Interviews revealed that these employees could be challenging to manage, and sometimes undermine the authority of hospital directors.
Trade unions present a different challenge. At the hospital level, they can limit the authority of directors, and industrial disputes can become a significant source of friction, even in rare cases threatening the functioning of the institution. However, interviewed directors indicate that these issues can be handled much of the time with appropriate management, for which prior management training often helps, although several mentioned the need for a separate human resource management unit at the Ministry level,

Public hospital governance in Sri Lanka
285
which could deal with pressures from different trade unions. At the same time, the main doctors union (Government Medical Officers Association (GMOA)) does play a positive role at the national level in exerting constant pressure on MOH to follow personnel regulations and to ignore political pressures.
5.7 Policies for better outcomesSweeping reform of the centrally controlled health care system described above is not under discussion at present. A World Bank study (World Bank 2011), which has analyzed the international experience with hospital reform and hospital autonomy from 1980–2009, finds that reforms should be accompanied by the following policies for a successful outcome:
• a credible budget constraint for the hospital;
• hiring and promotion of managers based on qualifications and track record;
• hospital management training;
• good information systems for clinical and financial management and reporting;
• complementary reform to strengthen the accountability of managers for the performance of the hospital through the creation of a board of external directors or trustees, or a hospital authority to supervise the manager; and
• increased managerial authority with freedom to recruit, promote, set tasks and work hours, and decide on performance rewards and sanctions.
The first three policies exist in the current system to a satisfactory extent, while the last three policies do not. Therefore, without pursuing further major reforms, it may be beneficial to consider incorporating the fourth, fifth and sixth policies within the existing system, in order to improve outcomes.

286
5.7.1 Goodinformationsystemsforclinicalandfinancialmanagement and reporting
While the policy of good information systems exists to some extent, it is an area that could be further developed and strengthened by building information technology (IT) capacity (software and human resources) within the public hospital system. Strong institutional IT systems in secondary and tertiary hospitals are needed to generate timely and reliable data for measuring the performance of each hospital, which can be readily and easily accessible to the management.
5.7.2 Complementary reform to strengthen accountability of managers for the performance of the hospital through creation of a board of external directors or trustees, or a hospital authority to supervise the manager.
Lack of accountability to the community at the hospital level is an area of weakness in the current system. At present, the hospital development committees (mentioned in section 4.6) do not appear to be fulfilling their mandate. The committees’ ability to achieve this is limited by their basic knowledge of the health care system, as well as the pressure to serve the interests of local politicians. It is important for the MOH to recognize the importance of these committees and their potential contribution to improving the performance of public hospitals. It should be ensured that external committees constitute a mix of community representatives and health care professionals who meet the stipulated criteria, and that the appointment process, as well as committee functioning, are not undermined by political interference.
5.7.3 Increased managerial authority with freedom to recruit, promote, set tasks and work hours, and decide on performance rewards and sanctions.
Within the centrally controlled system, hospital directors do not have the freedom to recruit, promote, set tasks and work hours, and decide on performance rewards and sanctions. Given that the management has been empowered with greater knowledge and skills through postgraduate training in administration, finding areas where management authority can be increased could lead to better performance outcomes

Public hospital governance in Sri Lanka
287
6. PerformanceAs described previously (section 3), the public sector plays a major role in the delivery of health care to Sri Lankans. Inpatient utilization in Sri Lanka is very high compared to many developed nations, but generally equitable overall – particularly in terms of public-sector inpatient utilization. Total outpatient utilization is also reasonable compared to some developed nations and is high compared to most Asian countries of similar or better socioeconomic status to that of Sri Lanka. Although total outpatient utilization increases with greater income, public-sector outpatient utilization is higher among the lower income groups. Together, these indicators suggest that the public-sector facilities have been successful in reaching the population of Sri Lanka, particularly the financially disadvantaged.
The following section provides information on the performance of hospitals for a limited set of indicators that assess hospital efficiency. Due to limitations in the data, performance indicators are not always presented for the hospitals that are the focus of this case study. These instances are clearly stated.
6.1 Efficiency in utilization of hospital resourcesUtilization efficiency is assessed in terms of average length of stay (ALOS), bed turnover rate (BTOR) and bed occupancy rate (BOR). This information is presented for two time points (1997 and 2009) for the sample of hospitals included in this case study. The sample is based on hospital statistics that were available for both years. Additionally, for 2009, ALOS is also presented for all case study hospitals overall as well as by type of hospital.
ALOS decreased from 1997 to 2009 for the 14 hospitals (relevant to the case study) for which data were available for both years (Figure 6). This is consistent with the worldwide trends in decreasing ALOS as observed in other developed nations (OECD Health Data, 2014). In 2009, the ALOS for the case study hospitals was 2.4 days (89 of 98 hospitals). But the case-mix unadjusted ALOS differs by type of hospital (Figure 6). Not unexpectedly, a longer ALOS is observed for the highest-level referral hospitals (teaching and provincial general), while the lowest ALOS is observed for secondary-

288
level base hospitals (type B). However, it is notable that ALOS in public hospitals in Sri Lanka is one of the lowest in Asia as well as other OECD nations, along with a very high rate of inpatient admissions (OECD–World Health Organization, 2012)
Figure 6: Average length of stay (days) for 1997 and 2009 and by hospital type in 2009
1997 3.7
2.7
2.4
3.5
3.3
2.8
2.4
Year
(N
=1
4)
Type
of
hosp
ital
, 2
00
9 (
N=8
9)
2009
All hospitals
Teaching
Provincial general
District General
Base (A)
Base (B) 2.0
Average length of stay (days)
0 1 2 3 4
Note: 14 total hospitals that includes 3 teaching, 2 provincial general, 2 district general, and 7 base hospitals had information in both 1997 and 2009 to calculate average length of stay Source: Medical Statistics Unit (data obtained in 2014), Public Hospital Inpatient Discharge Survey 1997
When ALOS is too short it can raise quality of care concerns. A comparison of ALOS for a number of selected diseases (acute myocardial infarction, asthma, diabetes, infectious diarrhoea and gastroenteritis, and single spontaneous delivery) with selected OECD countries (Australia, France, Japan, United Kingdom and the United States of America) indicates comparable ALOS for most of the conditions evaluated (Perera et al., 2009). A lower ALOS is likely due to admissions of non-trivial conditions that are best treated on an outpatient basis. In 2005, more than 19% of total discharges were same day discharges while another 22% were discharged the day after admission (Perera et al., 2009).

Public hospital governance in Sri Lanka
289
An indicator of utilization of available hospital beds is BTOR– a measure of the productivity of hospital beds. BTOR provides information on how often, on average, a hospital bed changes occupants during a defined period of time (e.g. number of patients per bed per year). BTOR has increased from 1997 to 2009 for all 14 hospitals (relevant to the case study) for which data were available in both years (Figure 7), suggesting that more patients are being treated per available bed. BTOR is lowest for teaching hospitals and base hospitals type B (Figure 7), but for different reasons. Low BTOR in teaching hospitals is likely due to longer ALOS resulting from treating patients with greater disease severity and complexity, while in type B base hospitals, low BTOR is likely due lower occupancy levels and shorter lengths of stay (Figure 6, Figure 8).
Figure 7: Bed turnover rate for 1997 and 2009 and by hospital type in 2009
1997 80
109
94
80
91
103
113
Year
(N
=1
4)
Type
of
hosp
ital
, 2
00
9 (
N=8
9)
2009
All hospitals
Teaching
Provincial general
District General
Base (A)
Base (B) 86
Bed Turnover rate
0 20 40 60 80 100 120
Note: 14 total hospitals that include 3 teaching, 2 provincial general, 2 district general, and 7 base hospitals had information in both 1997 and 2009 to calculate average length of stay. Source: Medical Statistics Unit (data obtained in 2014), Public Hospital Inpatient Discharge Survey 1997
Another often-used indicator of hospital efficiency is BOR – a measure of the utilization of available bed capacity (i.e. percentage of total bed-days in which beds are used in a year). From 1997 to 2009 bed occupancy was remarkably stable among the 14 secondary and tertiary hospitals relevant to the case study, for which information was available for both years

290
(Figure 8). Assessing average bed occupancy by hospital type indicates that all tertiary-level hospitals and type A base hospitals have bed occupancies of 70% or more (Figure 8). Close to half of the individual hospitals within these categories also reach the optimal level of bed occupancy of 80–85%. Close to 80% of individual hospitals also have bed occupancies of more than 70%, the OECD average (OECD Health Data, 2014). However, type B base hospitals have low bed occupancies, indicating underutilization of hospital resources in these hospitals. Because these hospitals do not have all the facilities of higher-level hospitals, patients prefer to bypass them.
Figure 8: Bed occupancy rate (%) for 1997 and 2009 and by hospital type in 2009
1997 76
77
62
74
82
78
70
Year
(N
=1
4)
Type
of
hosp
ital
, 2
00
9 (
N=8
9)
2009
All hospitals
Teaching
Provincial general
District General
Base (A)
Base (B) 48
Bed Occupancy Rate (%)
0 20 40 60 80 1009070503010
Note: 14 total hospitals that includes 3 teaching, 2 provincial general, 2 district general, and 7 base hospitals had information in both 1997 and 2009 to calculate average length of stay Source: Medical Statistics Unit (data obtained in 2014), Public Hospital Inpatient Discharge Survey 1997
Each of these measures of hospital efficiency can sometimes be misleading when considered in isolation. The Pabon Lasso technique assesses the relative performance of hospitals using all three of the above ratio indicators (Pabon Lasso, 1986). Figure 9 illustrates a general trend toward higher BTOR and BOR from 1997 to 2009, suggesting increased efficiency and fewer vacant beds for the 14 hospitals common to both years. However, there are some reasons for concern, with some hospitals having

Public hospital governance in Sri Lanka
291
a high BTOR but low BOR, indicative of unnecessary admissions and the oversupply of beds. Analysis by hospital type for 2009 (Figure 10) indicates that the majority of hospitals with low BTOR and BOR are type B base hospitals, the lowest level secondary hospitals among those of interest in this case study. These hospitals have more beds than existing demand, due in part to bypassing, which results in the underutilization of available capacity of these hospitals.
Figure 9: Pabon Lasso diagram for 14 hospitals in 1997 and 2009
B3HA
2TH
Turn
over
rat
e
150
0 20 40 60
Bed occupancy (%)
80 100 120
100
50
0
2009 1997
2DGH
3TH
4BHB
2BHA
1BHA
4BHA
2PGH 1TH
1PGH2BHB
1D3H
1BHB
2BHB
38HA4BHB
2DGH
2PGH
1PGH
2BHA
1DGH4BHA
3TH
1TH1BHA7BHB
2TH
I
II III
IV
TH = Teaching Hospital; PGH = Provincial General Hospital; DGH = District General Hospital; BHA = Base Hospital Type A; BHB = Base Hospital Type B HNote: 14 total hospitals that includes 3 teaching, 2 provincial general, 2 district general, and 7 base hospitals had information in both 1997 and 2009 to calculate average length of stay Source: Medical Statistics unit (data obtained in 2014), Public Hospital Inpatient Discharge Survey, 1997

292
Figure 10: Pabon Lasso diagram by hospital type, 2009Tu
rnov
er r
ate
Bed occupancy (%)
I
II III
IV
Teaching200
150
100
50
0
I
II
IV
Base Type A200
150
100
50
0
I
II III
IV
Provincial General
I
II III
IV
District General
III II
IV
Base Type B
III
I
0 20 40 60 80 100 120 140 0 20 40 60 80 100 120 140
0 20 40 60 80 100 120 1400 20 40 60 80 100 120 1400 20 40 60 80 100 120 140
Notes: 87 hospitals include 9 teaching hospitals, 3 provincial general hospitals, 15 district general hospitals, 19 base hospitals (type A), and 41 base hospitals (type B). The lines indicating mean and standard deviations of bed occupancy and turnover rate are for all 87 hospitals.
Source: Medical Statistics Unit (data obtained in 2014)
6.2 Effectiveness of careOne indicator of the effectiveness of care is in-hospital mortality. From 1997 to 2009, hospital mortality was similar for the 18 hospitals for which mortality data were available (Figure 11). Hospital mortality was higher among the tertiary hospitals compared to secondary hospitals. This is likely due to the case-mix, with patients with greater illness severity being treated in the tertiary-level hospitals.

Public hospital governance in Sri Lanka
293
Figure 11: Hospital deaths (per 1000 cases) for 1997 and 2009 and by hospital type in 2009
1997 9.0
8.7
6.7
13.5
11.2
9.2
6.9
Year
(N
=1
4)
Type
of
hosp
ital
, 2
00
9 (
N=8
9)
2009
All hospitals
Teaching
Provincial general
District General
Base (A)
Base (B) 3.5
deaths per 1000 cases
0 4 10 161412862
Note: 18 total hospitals that include 3 teaching, 3 provincial general, 2 district general, and 10 base hospitals had information in both 1997 and 2009 to calculate average length of stay. Source: Medical Statistics Unit (data obtained in 2014), Public Hospital Inpatient Discharge Survey, 1997.
6.3 CostsIt is notable that the relatively good performance of public hospitals has been achieved with productivity improvements. This has been observed through the estimation of unit costs for both a patient discharge and outpatient visit (whole public-sector) in relation to per capita GDP, which has shown a declining trend from 2003 (Rannan-Eliya 2008), but has largely plateaued in more recent years (Figure 12). These estimates, however, are not quality adjusted; and, for inpatient care, should take into consideration the very high inpatient admissions rate, which is in part likely due to unnecessary admissions.
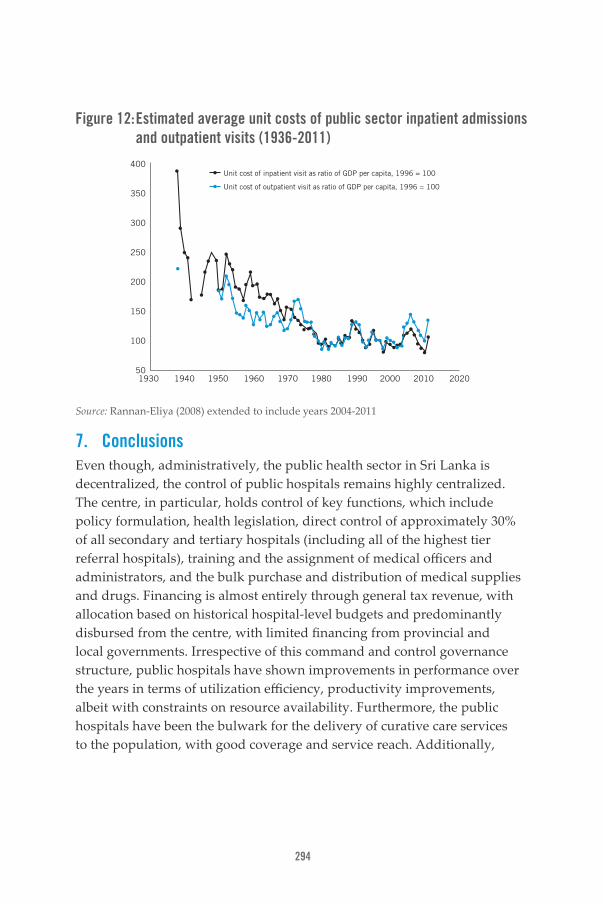
294
Figure 12: Estimated average unit costs of public sector inpatient admissions and outpatient visits (1936-2011)
400
350
300
250
200
150
100
501930 1940 1950 1960 1970 1980 1990 2000 2010 2020
Unit cost of inpatient visit as ratio of GDP per capita, 1996 = 100
Unit cost of outpatient visit as ratio of GDP per capita, 1996 = 100
Source: Rannan-Eliya (2008) extended to include years 2004-2011
7. ConclusionsEven though, administratively, the public health sector in Sri Lanka is decentralized, the control of public hospitals remains highly centralized. The centre, in particular, holds control of key functions, which include policy formulation, health legislation, direct control of approximately 30% of all secondary and tertiary hospitals (including all of the highest tier referral hospitals), training and the assignment of medical officers and administrators, and the bulk purchase and distribution of medical supplies and drugs. Financing is almost entirely through general tax revenue, with allocation based on historical hospital-level budgets and predominantly disbursed from the centre, with limited financing from provincial and local governments. Irrespective of this command and control governance structure, public hospitals have shown improvements in performance over the years in terms of utilization efficiency, productivity improvements, albeit with constraints on resource availability. Furthermore, the public hospitals have been the bulwark for the delivery of curative care services to the population, with good coverage and service reach. Additionally,

Public hospital governance in Sri Lanka
295
with no user fee charges, the public-sector hospitals provide financial risk protection to the entire population, particularly the poor.
In a system that has seen no sweeping reforms in the public health system since the 1950s and the devolution of power to provinces in 1987; several adaptive policy interventions can be identified in the past two decades. Through voter pressure, political commitment to the public health system has been consistent over the years, irrespective of party lines. This is particularly evident in terms of the commitment to improving the health of the population through financial risk protection and ensuring access to health care services through the continued functioning of a network of smaller hospitals, most of which are often bypassed and therefore underutilized. Although not stated explicitly, the enforcement of a referral system has consciously taken a back step, giving into patient demands and expectations of hospital choice and perceived quality of care. An adaptive policy intervention to bypassing has been to upgrade a hospital in each district to a tertiary level general hospital in those districts not already served by a tertiary level facility.
Other policy interventions driven by the centre, such as the quality improvement drive, have been important in improving the orderliness and cleanliness of hospitals in response to market demands within resource constraints.
Another policy decision was to ensure that higher-level medical administrators (including hospital directors in secondary- and tertiary-level hospitals) who are already qualified medical officers should also have an MSc or MD in medical administration or community medicine. Given their limited autonomy, the main function of hospital directors is the operational day-to-day management within the resources allocated to them (e.g. budget, staff, medical supplies and drugs, the local purchasing of drugs). Supervision of hospital directors is conducted by their respective central or provincial MOHs. Additionally, the bimonthly hospital development committee meeting among all hospital directors of secondary and tertiary hospitals under the central MOH, and the provincial and regional directors of health services of the provincial system provide a forum to share experiences.

296
Within the predominantly centrally controlled system, pinpointing reasons for why public hospitals have managed to achieve considerable productivity gains are harder to identify, particularly in light of the limited monetary incentives granted to hospital directors and health workers. Identifying these reasons will need more extensive research and is beyond the scope this case study.
While Sri Lanka performs well within given resources, changing demographics, disease and treatment patterns, and patient and provider expectations continue to challenge the system. The response to NCDs and related morbidity as well as to the increasing rates of injury and road traffic accidents through the existing structure of the public health system has been a challenge. The current double burden of disease, along with the complexity of treating NCDs that involve lifelong monitoring and treatment from the time of detection, has the potential to place the system under increased pressure due to the associated costs.
ReferencesBarbazza E, Tello JE. A review of health governance: definitions, dimensions and tools to govern. Health policy. 2014 May;116(1):1-11. PubMed PMID: 24485914.
Central Bank of Sri Lanka (2013). Economic and Social Statistics of Sri Lanka 2013. Colombo: Central Bank of Sri Lanka.
Central Bank of Sri Lanka. 2005. Consumer Finances and Socioeconomic Survey 2003/04. Colombo, Sri Lanka: Central Bank of Sri Lanka.
Central Bank of Sri Lanka. 2014. Annual Report. Colombo, Sri Lanka: Central Bank of Sri Lanka.
Department of Census and Statistics Sri Lanka (2013a). Household income and expenditure survey 2012/13: Preliminary report. Colombo: Department of Census and Statistics, Ministry of Finance and Planning, Sri Lanka
Department of Census and Statistics Sri Lanka. 2013b. Household Income and Expenditure Survey 2009-2010. Colombo: Department of Census and Statistics Sri Lanka.

Public hospital governance in Sri Lanka
297
Department of Census and Statistics. 2014. Estimated mid-year population 2012-2013 by district and sex. Department of Census and Statistics 2014 [Accessed 6 July 2014]. Available from http://www.statistics.gov.lk/page.asp?page=Population and Housing.
European Observatory on Health Systems and Policies (2011). Governing public hospitals: Reform strategies and movement towards institutional autonomy. Edited by SaltmanRB, Duran A, Dubois HFW, Observatory Studies Series 25. Denmark: World Health Organization Regional Office for Europe.
Institute for Health Policy. 2012a. Unpublished analysis of Sri Lanka National Health Accounts Database 1990-2011. Colombo, Sri Lanka: Institute for Health Policy.
Institute for Health Policy. 2012b. Unpublished analysis of Private hospitals and nursing homes database 1990-2011. Colombo, Sri Lanka: Institute for Health Policy.
Kaluarachchi, SP. Successful TQM implementation in Sri Lankan public hospitals. Annals of Business Administrative Science 2009; 8:55–74.
Medical Statistics Unit, Sri Lanka (2010). Annual Health Bulletin. Medical Statistics Unit, Ministry of Health, Sri Lanka.
Medical Statistics Unit. 2014. Administrative data on hospital beds and utilization. Colombo, Sri Lanka: Ministry of Health.
Ministry of Health. 1995. Manual and Management of Teaching, Provincial, Base, and Special Hospitals. Colombo, Sri Lanka: Ministry of Health.
Ministry of Health. 2002. Circular on Recategorisation of hospitals. Colombo, Sri Lanka: Ministry of Health.
Ministry of Health. 2007. Minutes in regard to medical personnel of the health services No.1493/3. Colombo, Sri Lanka: Government of Sri Lanka.
Ministry of Health (2009). Circular on the national quality assurance programme in health. Ministry of Health Sri Lanka. No. 01-29/2009.

298
Ministry of Health (2010). Hospitals and bed strength in Sri Lanka by districts (government sector) Colombo: Information Unit, Management Development and Planning Unit, Department of Health, Ministry of Health.
Ministry of Health (2012). Circular on the establishment and management of preliminary care units in government hospitals. Ministry of Health Sri Lanka.
Ministry of Health (2013). Health facility survey 2011. Colombo: Ministry of Health.
Nagayama K (2004). Master plan study for strengthening health system in the democratic socialist republic of Sri Lanka: Supporting document 1. Colombo: Ministry of Health.
OECD/World Health Organization. 2012. Health at a Glance: Asia/Pacific 2012: OECD Publishing. http://dx.doi.org/10.1787/9789264183902-en.
OECD. 2014. OECD Health Statistics 2014. Organization for Economic Co-operation and Development [Accessed 07 August 2014]. Available from http://www.oecd.org/health/healthdata.
Pabon Lasso H. Evaluating hospital performance through simultaneous application of several indicators. Bulletin of the Pan American Health Organization 1986;20(4):341–357.
Perera C, Rannan-Eliya RP, Senanayake S, Dalpatadu S, de Silva H, Wijesinghe R (2009). Public hospital inpatient discharge survey 2005. In Health Statistics Report Number 1. Colombo: Institute for Health Policy.
Provincial Councils Act, No. 42 (1987). Colombo: Government of Sri Lanka.
Rannan-Eliya RP (2008). Population ageing and health expenditure: Sri Lanka In: Research Study Series 2. Colombo: Institute for Health Policy.
Rannan-Eliya RP, Sikurajapathy L (2009). Sri Lanka: Good practice in expanding health care coverage. In: Research Studies Series 3. Colombo: Institute for Health Policy.

Public hospital governance in Sri Lanka
299
Rannan-Eliya RP, De Alwis S, Amarasinghe S, Fernando T, Balasundaram A (2012). Private hospitals and nursing homes survey (draft report) Colombo: Institute for Health Policy.
Sri Lanka Constitution, 13th Amendment (1987). Colombo: Government of Sri Lanka.
Steel NB, Maisey S, Shekelle P, Breeze E, Marmot M, Melzer D. Self-reported receipt of care consistent with 32 quality indicators: National population survey of adults aged 50 or more in England. British Medical Journal. 2008;337:957.
The Finance Commission. 2012. Recommendation to H.E. the president on the appointment between the provinces of funds to be allocation from the annual budget 2012 (In terms of the Article 154R (4) of the Constitution) Colombo, Sri Lanka: The Finance Commission.
United Nations Population Division (2014). World Population Prospects: The 2012 Revision. (Available at: http://esa.un.org/unpd/wpp/index.htm, accessed 2 April, 2014).
Uragoda CG (1987). A history of medicine in Sri Lanka. Colombo: Sri Lanka Medical Association.
Wickramasinghe, R., T. Kugadas, and K.C.S. Dalpatadu. 2013. Survey of hospital director’s views on workplace challenges. Colombo, Sri Lanka: Institute for Health Policy.
World Bank (2011). Lessons for hospital autonomy implementation in Viet Nam from international experience. Washington DC: World Bank.

300
Public Hospital Governance: Emerging Issues and Key LessonsKrishna Hort and Nicolette Maunganidze

Public Hospital Governance: Emerging Issues and Key Lessons
301
This concluding chapter seeks to reflect across the individual case studies, to identify commonalities and differences, and to identify emerging key issues or lessons. The chapter commences by examining how the case studies contribute to answering the four research questions described in the introduction.
This is followed by an examination of the underlying themes proposed in the conceptual framework for the studies, and a consideration of the extent to which the case studies align with the framework. Finally, key issues and lessons for further investigation and consideration by policy-makers are identified.
1. Case study perspectivesAs a group, the case studies confirm some of the assumptions put forward in the introduction as the basis for the studies. They demonstrate that significant hospital reforms are being undertaken over long periods in many countries of the region, with increasing autonomy being a major component or theme in most (but not all) of the reforms. In general, the reforms show a trend towards increasing marketization, exposure to competition, and autonomy in public hospital management.
The case studies illustrate the diversity in scope and range of reforms, and their impacts on hospital performance. In content and scope the case studies themselves demonstrate a range of approaches to addressing the terms of reference. The key elements of the terms of reference were: a description of recent policy developments and reforms in regard to public hospital governance, an assessment of the state of public hospital governance and performance, and an analysis of how policy reforms have impacted on governance and performance.
In approaching this task, the case studies provide us with a series of “snapshots” ranging from close-ups of a single large tertiary facility in India, to group shots of representative hospitals in Sri Lanka and Indonesia, and some long-range overviews of the whole system, such as in Thailand or Sri Lanka. Some studies focus on the performance of hospitals specifically (Indonesia, Viet Nam, and India), while others examine hospitals as part of local health systems (Philippines, New Zealand). The studies also vary

302
in the extent of detail on the broader health system and the contribution of hospitals to system-wide objectives.
These variations reflect the decisions of study authors in individual countries on how best to describe and represent the key reforms and their impact on hospital performance: whether to focus on the outstanding exceptions, to compare across different subnational contexts, or to describe how the system responds as a whole.
In so doing, the studies situate public hospitals, their governance and performance, within each country’s overall reform context. For some, public hospital reforms were a part of larger government reforms such as the decentralization of authority to lower levels of government, or broader public administrative reforms (Indonesia, Philippines, Viet Nam). In others, reforms were more specific to the health sector, such as in Thailand and Sri Lanka. They also reflect differences in historical legacies, with a history of reforms extending for decades in many cases, and relatively recent reforms in others. The studies also address the differences in operating contexts, such as in the mix of public and private ownership of hospitals and the variations in operating contexts within countries, particularly between urban areas and rural and remote areas.
2. Research questionsAs described in the introduction, the case studies aimed to answer four key research questions, which explore the key factors that link reforms with changes in governance, and these changes in governance with improvements in performance. We begin by considering each of the research questions in turn.
What and how are policies affecting governance of publicly-owned hospitals and what recent reforms have been undertaken?The reforms described in the case studies address a number of areas, including governance (autonomy and decision space), financing, accountability, internal management and performance.
Public Hospital Governance: Emerging Issues and Key Lessons
303
Table 1 provides a summary of the reforms described in the case studies. The reforms introduced in most countries have changed the status of hospitals and shifted them along the continuum from budgetary units towards semiautonomous bodies (Jakab et al., 2002). As Table 1 indicates, reforms providing increased autonomy in the management of hospital finances have been common. But the degree of autonomy provided in other management areas varies, with some extending autonomy to management of the workforce (Indonesia, Philippines, Viet Nam), while others have retained central control over this area (Thailand, Sri Lanka). Autonomy in decision on the mix and level of services provided also varies, with some allowing considerable autonomy to introduce new services (Viet Nam, Indonesia, Philippines), while in others, autonomy in this area is limited.
Reforms in the area of accountability were less marked, with several countries requiring accountability at the central level (Sri Lanka, New Zealand and Thailand), while in others, accountability (and ownership) of some subnational-level hospitals has been delegated to local levels of government (Indonesia, Philippines and Viet Nam).
But even where central control is retained, reforms have given increased management autonomy to hospital directors, such as in Sri Lanka and New Zealand, and encouraged hospital managers to introduce innovation and manage resources within centrally-determined budget envelopes. The Indian case study describes how a centrally-owned hospital has balanced relative autonomy in growing service provision and developing specialized services, while responding to increasing accountability requirements introduced by government such as the Charter of Patient Rights.
Financing has been a key element of most reforms, with an emphasis on controlling costs, increasing utilization, and gaining efficiencies. Many of these reforms involve a shift from direct budgetary financing by government towards third party purchasing of hospital services, and introduce a range of financial incentives to which hospitals have the opportunity to respond through their increased financial autonomy.
In Thailand, Philippines and Viet Nam, financial reforms have also included the introduction of UHC schemes which have provided hospitals with

304
another avenue to broaden their revenue sources and to increase service utilization by the poor.
In New Zealand and Thailand, financing and payment reforms strengthened the role and authority of the district health service in integrating hospital and primary care services. The district health network purchases services from hospitals in Thailand; while the District Health Boards allocate funding to hospitals within their area and purchase services from primary care providers in New Zealand.
Reforms in the area of internal hospital management appear to be less common and more a response to the management needs generated by the financing, autonomy and accountability reforms. A recurring theme is the balance between clinical and administrative leadership capability in hospitals. In many of the countries, clinicians continue to predominate as hospital leaders, and Sri Lanka and Thailand have introduced reforms to require greater management skills among hospital directors. On the other hand, New Zealand has focused more on increasing clinician engagement in management and leadership alongside generalist managers.
Other common management reforms have been undertaken more internally, such as aligning hospital staff remuneration with performance, investing in information technology and more use of information in decision-making.
Finally, reforms in the performance area are still emerging. New Zealand demonstrates the most focus on this area, with a range of centrally-determined performance requirements being used to guide and direct hospital operations. However, explicit performance requirements in other countries are just emerging. Central reporting requirements have been introduced in several countries, including Indonesia and Viet Nam, while Thailand and Sri Lanka have introduced quality assurance requirements.
The case studies thus demonstrate the breadth and the depth of reform being undertaken in the region, and the extent to which reforms address hospital governance and accountability. The next research question examines the complex factors which determine how hospitals have responded to these reforms.

Public Hospital Governance: Emerging Issues and Key Lessons
305
Table 1: Summary of reforms described in the case studies
Governance (autonomy)
Governance (accountability) Financing Internal
management Performance
Increased autonomy and decision space for hospital manage-mentManagement of finances (Viet Nam, Indone-sia, India (central hospital), Philip-pines, Thailand
OwnershipDelegation of ownership of some hospitals to subnational levels of govern-ment (Philip-pines, Viet Nam, Indonesia)
Introduction of social health insurance payments to hospitals (Philip-pines, Thailand, Viet Nam, Indonesia)
Requirement for hospital directors to have manage-ment competen-cies (Sri Lanka, Thailand)Encouraging engagement of clinicians in management and leadership (New Zealand)
Requirements for performance measurement and reporting on centrally deter-mined priorities (New Zealand)
Autonomy in expansion of type of clinical services provided (India – AIIMS, Viet Nam, Indonesia, Philip-pines)
Introduction of supervisory hospital boards (Indonesia, Thailand, Philip-pines – reform of such board in India)
Purchasing of hospital services by district health service authorities (Thailand, New Zealand)
Performance-based remunera-tion of hospital staff (Indonesia, Viet Nam, Philip-pines)
Quality assurance programs (Sri Lanka, Thailand)
Limited autonomy in management of HR (Thailand, Sri Lanka); greater autonomy in management of HR (Indonesia, Philippines, Viet Nam, India – AIIMS)
Major account-ability retained by central ministry of health (Sri Lanka, Thailand, New Zealand)
Decreased government direct financing of hospi-tals (Philippines, Viet Nam)
Increased invest-ment in and use of IT (Thailand, Philippines, New Zealand) and use of information in decision-making
Defining performance and reporting require-ments (Indonesia, Thailand, New Zealand)
Source: Asia Pacific Observatory on Health Systems and Policies

306
What and how do external factors interact with hospital governance and clinical care?The role of external factors in influencing hospital responses to reforms is brought out in several of the case studies.
A key external factor is how the hospital relates to the other health facilities within its area of operation, particularly other primary care or ambulatory care facilities, and lower-level hospitals. This emerges in the problem of “hospital bypass” whereby patients present directly to hospital without passing through a primary care level gatekeeper, or avoid attendance at a lower-level district hospital and self-refer to a central hospital (Sri Lanka and Viet Nam). This results in overload at the central level, and under-use of peripheral facilities. As a result, in both Sri Lanka and Viet Nam, more investment is being made to upgrade district-level hospitals in an effort to reduce bypass.
The Thai health insurance system with its stricter controls on gatekeeping at lower levels and purchase of services by the district health network is better able to control and reduce bypass. Similarly, the NZ system of District Health Boards managing district budgets provides greater control over hospital referral, although it also creates problems of waiting lists for referral when hospital capacities are exceeded.
Other aspects of the external environment that were identified include the accountability and control relationships with higher levels of government and with subnational levels of government in decentralized systems (see specifically India).
Several case studies demonstrate the role of local government in enabling or constraining hospital autonomy. In the Philippines, despite being delegated the responsibility and authority to manage local hospitals, most local governments have not taken up the opportunities offered by autonomy, or fulfilled their responsibilities. The Philippine case study focuses rather on the exceptions, the still relatively rare examples of local government and hospital administrations that have responded to the opportunities and new demands generated by the reforms.

Public Hospital Governance: Emerging Issues and Key Lessons
307
In Viet Nam, hospitals have been able to take advantage of revenue earning opportunities offered by financial autonomy, but have lacked adequate oversight or control by local governments. This has resulted in sometimes inappropriate investment in new services and medical technology with the aim of increasing revenue, rather than addressing population health needs.
Conversely, in Indonesia, the case study describes how hospital autonomy provisions in some areas have been constrained by interpretations of local governments. These examples demonstrate how autonomy granted in policy and law (de jure) translates into variation in practice (de facto) in the interaction with local contextual factors.
In Sri Lanka and Thailand, despite some decentralization of authority to provincial or district health offices, the central Ministry of Health retains significant control, particularly of health workforce distribution. Hospitals need to operate within a more limited “decision space” (Bossert 2008) and work out how to manage their resources to achieve the best results.
Other key aspects of the external environment that impact on how hospitals manage autonomy are related to the availability of other sources of financing to supplement reduced direct government budgetary allocations. In the Philippines, the introduction of the Philippine Health Insurance Corporation (PhilHealth) provided hospitals with a potential funding stream, and the case studies describe how some hospitals were able to access these funds to increase their financial resources and improve service provision. In Thailand, hospitals now receive the majority of their government funding through third party payments from the national health insurance scheme. However, in Viet Nam, delays in payment and insufficient allocation from the national health insurance system have reduced the contribution of this source to hospital revenue.
Financial autonomy in Viet Nam has enabled hospitals, particularly in urban areas, to raise revenue from patient fees, and to expand services with private investment. However, this further exacerbates urban-rural inequalities, as urban hospitals in major cities have much greater capacity to raise investment funds, and to increase and diversify their services, than hospitals at provincial or district levels. As a result, provincial and district

308
hospitals are unable to generate as much revenue, and have difficulties in funding services and retaining staff.
Similarly in Indonesia, the growing divergence in fiscal capacity among provinces and districts means that hospitals located in areas of high fiscal capacity enable staff to increase their incomes through private practice (dual practice being allowed), while those in low fiscal capacity areas have difficulty attracting or retaining staff due to limited opportunities for private practice.
The extent of competition from the private sector varies, and has not yet emerged as a major influential factor, except perhaps in the Philippines and Indonesia. In most of the countries studied, the public sector remains the dominant provider of hospital services. The Thai study notes that the Thai private sector provides about 21% of hospital beds and is largely for profit, with growth responding to economic opportunities and fluctuating depending on the economic context. On the other hand, the private sector in Indonesia contributes a similar proportion of total beds, but is largely not for profit (75%), with many hospitals operated by religious and charitable organizations. Even in Sri Lanka, where the private sector contributes only 6% of hospital beds, the case study notes recent growth in the private sector, and a tendency to attract the wealthier patients.
What and how do different internal factors, including organizational capacities (technical and managerial), contribute to quality and efficiency?A key aspect of the internal organizational capacity that emerges from the case studies is the management and leadership capacity of the hospital directors. In many cases it appears that it is the capacity of the hospital leadership to operate within the expanded “decision space” of autonomy, and to identify opportunities and work around constraints, that enables the hospital to translate reforms into actual change.
This is particularly brought out by the Philippine case study, which describes how more entrepreneurial leaders in a few hospitals and in local governments were able to transform poorly performing hospitals through changes that were accommodated within the governance system, but which other hospitals or local government areas had not taken advantage of. The

Public Hospital Governance: Emerging Issues and Key Lessons
309
study speaks of the “delivery mentality” which persists in some hospitals and inhibits thinking beyond providing services as instructed.
The Sri Lankan study describes innovations developed by individual hospital directors within the constraints of the more centrally-controlled system, while the Indonesian study describes how hospitals with BLUD status were able to expand services and change their operations.
Similarly, the Indian case study describes how the AIIMS hospital leadership was able to negotiate with the central government to maintain their budget and expand operations.
In most cases, hospital leadership in these countries is still in the hands of clinicians. Several countries have introduced management training for clinician leaders, including Sri Lanka and Thailand, in response to the perceived need to have better performing and more competent hospital leaders.
New Zealand, as a higher income country, has already transitioned from clinical leadership to professional management leadership, but it is interesting to note how the case study emphasizes the need for reforms that engage clinicians more in leadership and management.
While the New Zealand study describes the central role that the District Health Boards have in internal governance and management, the case studies in the other countries demonstrate that the role of elected or appointed supervisory boards is still limited. The Sri Lankan study refers to local hospital development committees as “highly politicized” and notes that local politicians influence the appointment of local staff, creating problems in management for the hospital directors. While the Thai study refers to the lack of community or civil society representation on hospital boards appointed by hospital directors, and their relatively minor role in internal governance. The Indonesian study also refers to the establishment of supervisory boards, and to their poor effectiveness.
Given the weakness of hospital internal and local governance systems, the accountability of the hospital director becomes a key issue in determining hospital function. The case studies indicate that hospital leaders face

310
competing accountability demands – from government in relation to managing within budget; from staff wanting increased allowances and new services; and from patients, expecting a higher standard of service.
How is hospital performance measured (internally and relative to other hospitals) and how is this information used by policy-makers, hospital managers and the public?The case studies in general do not provide a comprehensive assessment of the performance impacts of the various reforms. While not specifically discussed by the case study authors, an important limitation to the assessment of performance is the limited availability and often poor quality of information on hospital performance. This reflects the low investment in information systems within hospitals, and the relative lack of focus on performance in accountability.
A second factor relates to the design and implementation of the reforms themselves, which were often largely politically motivated, and did not include specific performance objectives, or invest in methods of data collection and analysis which would enable an assessment of performance changes resulting from the reforms.
Performance information where provided tends to focus on revenue and utilization measures. The Indian case study refers to reductions in Average Length of Stay (ALOS), increased bed occupancy and increase in outpatient visits as a result of the growth and development of the AIIMS; interestingly, these improvements in measuring and monitoring have been promoted as much by the hospital management as by the controller. The Philippines study refers to increases in hospital revenue, while the Viet Nam study also focuses on revenue issues.
Only the Sri Lankan and Thai studies provide detailed information on hospital performance. The Sri Lankan study provides more comprehensive information on the performance of hospitals across the system, including the ALOS, bed turnaround rates and bed occupancy rates, as well as average costs. The Thai study provides information on usage of hospitals by socioeconomic status, indicating high levels of usage by the poor; as well

Public Hospital Governance: Emerging Issues and Key Lessons
311
as comparison of hospital efficiency at different levels using Pabon-Lasso diagrams.
The New Zealand study provides an interesting example of multiple performance measures and multiple accountabilities. District Health Boards need to report on the priority targets determined nationally, as well as on their own selected balanced score cards. Performance is recorded and reported through annual reports to Parliament, and patient safety and quality are reported to the National Quality and Safety Centre. Despite, or because of, such a multitude of performance measures and reporting, it remains difficult to assess performance changes.
However, in general it appears that performance tends to focus on financial and utilization measures, with some measures of utilization equity. Measures of quality appear to be neglected, although both the Thai and Sri Lankan studies describe quality improvement reforms.
Several case studies, notably the Thai study, refer to the IT investments that are needed in order for hospitals to measure and report on performance. The introduction of diagnosis-related group (DRG) and case mix payments is stimulating these investments in order for hospitals to claim payments from health insurance agencies.
3. Performance outcomesAs proposed in the introductory chapter, the key performance objectives of interest are efficiency, quality and patient responsiveness. A fourth area of interest for many of the reforms has been equity.
The case studies have shed some light on the effectiveness of the reforms in achieving these performance objectives.
The Thai study provides perhaps the most comprehensive review of achievement of performance objectives, demonstrating high levels of equity of utilization, with the poorest income quintile having higher levels of use of hospital inpatient and outpatient care than the richest quintile. In terms of efficiency, however, while the average bed occupancy rate is 83%, and bed turnover 20%, there is considerable variation in efficiency

312
among hospitals. Pabon-Lasso graphs of bed occupancy and bed turnover demonstrate that district hospitals had lower levels of efficiency than regional and central hospitals. As the authors note, this reflects an explicit commitment from the Thai government to favour equity of access as opposed to efficiency, and to ensure availability of services to the rural poor through district hospitals.
The Sri Lankan case study demonstrates a similar pattern, against a relatively high rate of utilization of inpatient care (275 discharges per 1000 population in 2011). Utilization of hospital inpatient care by income quintile demonstrates relatively equal proportions across the income quintiles, while utilization of outpatient care is slightly higher among the richest quintile overall, with higher utilization of public services by the poor, and of private services by the rich.
In terms of efficiency, while overall there are indications of improvements in efficiency, with a reduction in average length of stay from 3.7 days (1997) to 2.7 days (2009), there is a considerable scatter of hospitals when plotted on the Pabon-Lasso diagram, with a tendency to less efficiency in the type B (lower-level) secondary hospitals. This again may represent a trade-off to achieve equity before efficiency.
Data on hospital inpatient care utilization in Indonesia demonstrate much higher rates of utilization of both public and private inpatient and outpatient services by the richest decile than the poorest decile, indicating lower levels of equity in utilization. The introduction of the Universal Health Coverage programme should result in improvements in this area. Among the study hospitals, bed occupancy rates ranged from 60% to 92%, and length of stay between 4–5 days, indicating significant scope to improve efficiency.
The New Zealand case study reports data which demonstrates some improvements in efficiency (with reduction in average length of stay from 4.4 days in 2002 to 4.0 days in 2012), but concerns in regard to equity and quality with Maori patients having higher rates of readmission and death within 30 days of discharge. A multi-indicator assessment against 64 indicators of quality, equity, access and efficiency gave an overall score of 71%, but lower scores on equity and access.

Public Hospital Governance: Emerging Issues and Key Lessons
313
Performance data from the other studies do not provide such a comprehensive picture of achievement against objectives, but indicate improvements in utilization, revenue generation, and efficiency in several examples (India, Philippines and Viet Nam).
A common theme emerging from the examination of impacts on performance is the need to balance increasing revenue, and improvements in efficiency, with quality and equity in access and utilization.
4. Overarching themes and conceptual frameworkThe conceptual framework described in the introductory chapter proposes an interaction between governance, conceived of as combining decision rights and accountability, and internal management and capacities in leading to performance, within specific operating contexts.
The importance of this interaction has been confirmed in the country case studies, and some light is shed on the nature of the interactions among the elements of the framework.
Reforms have tended to focus on the delegation of autonomy to hospitals, particularly in terms of raising and using revenue. Reforms in autonomy in terms of other resources, particularly management of workforce, have been variable, with authority over the workforce retained by the central ministry of health in Thailand and Sri Lanka, but delegated in Indonesia and the Philippines.
Accountability has been split between accountability upwards towards the central authorities; accountability to local governments where authority or ownership has been decentralized to local governments, and accountability towards funders, particularly health insurance agencies or third party payers. This often seems to leave hospitals with conflicting accountabilities, something which emerges from the New Zealand studyin particular.
A key weakness in reforms which transfer accountability to the local level has been the lack of capacity in local governments or local community structures to hold hospitals accountable for their performance. The Philippines study refers to the “service mentality” that inhibits innovation or accountability. This applies both to the service providers (those
314
managing hospitals) and to those responsible in local governments or local communities.
There has in general been less attention paid to the governance of the system as a whole, and in particular, to the internal governance within the hospital, its relationship with other surrounding health care facilities and providers, and with the community it serves. Reliance has instead been put on the hospital director as the manager and leader, most of whom are clinicians.
The New Zealand system demonstrates the most explicit governance arrangements at the district level, with a district board representing the local community and responsible for all services within their area. But in most other examples, there has been little attention paid to mechanisms or requirements for accountability to local communities. Supervisory boards may have local community representation, but these are generally regarded in the case studies as opportunities for political patronage and interference, rather than avenues of accountability to local communities.
Reforms have also not always been explicit about their performance objectives, nor taken into account the full range of roles and functions of a hospital (including the role in training and education, research, in supporting the local economy, and as the supervisory and referral apex of the local health system). This has created opportunities for hospitals to pursue their own agendas, and to develop services and roles that are not always consistent with the needs and best interests of their communities. It has also tended to separate hospitals as autonomous units from their role and function within district health systems.
In some countries, more control has been retained by the central level, such as in Thailand, Sri Lanka and New Zealand, and the role of the hospital and its connection with the local health system has been given more prominence. In others, notably Indonesia and the Philippines, despite nominal accountability towards local governments, the link with district health systems is weak.
The role and function of the district health system and its governance emerges as a key theme which has not been identified in the conceptual
Public Hospital Governance: Emerging Issues and Key Lessons
315
framework. This relates to different views of the role of the hospital: as a public service delivery organization, with the focus of reform on efficiency and responsiveness to users; or as a component of a local health system, with the focus of reform on the functioning, efficiency and responsiveness of the system, and the hospital’s role in that system.
Several studies demonstrate a convergence between these approaches, particularly notable in New Zealand, where the drive for greater efficiency in hospital operation has led to a need to better engage with and use primary care services in order to limit the use of more expensive hospital services to those patients and conditions that require it. This relies on integration between the hospital as the referral centre managing complications and acute episodes, and primary care managing the ongoing care of patients. As populations move along the epidemiological transition, and chronic non-communicable disease becomes the major cause of ill-health, the need for integrated care between hospitals and primary care will increase.
An interesting commonality among the case studies is the divergence between the design and intention of reforms, and their actual implementation. This is particularly apparent in the Philippines study, where despite being given the opportunities of autonomy and local ownership to improve performance, the “delivery mentality” inhibits hospital and local government officials from taking advantage of this autonomy.
On the other hand, despite rather limited autonomy, some hospital directors have been able to introduce innovations and respond flexibly to local opportunities and needs in Sri Lanka.
In these circumstances particularly, the capacity and competence of the hospital leadership is of prime importance in determining the priorities and performance of the hospital. In some cases this has enabled significant local innovations (see examples from the Philippines, Indonesia and Sri Lanka), but in others there has been a tendency to expand services to maximize revenue, rather than to respond to community needs (Viet Nam).

316
The external operating environment provides the constraints or opportunities within which the hospital can develop, with the risk that variation in local economic capacities can lead to inequities in access to resources between hospitals in richer urban areas, and those in poorer, rural areas. The Indian experience is a case in point.
5. Lessons learnt and issues arising5.1 Governance of public hospitals needs to balance autonomy with
accountability to achieve performance objectives.Saltman, Duran and Dubois, editors (2011) distinguish three levels of governance or decision-making around hospitals:
• the macro level, or decisions by national governments on the “basic structure, organization and finance of the entire health system, and the hospital sector within it”;
• the meso level, or decision-making at the “institutional level of the hospital”; and
• the micro level, or day-to-day operational management of staff and services within the organization.
This lesson relates to the role of the national government at the macro level, and the capacity of the government to steer the health system, that is, the process of “coordinating and goal setting” for the health system.
The case studies in this volume demonstrate that national governments in the region have already begun the transition from direct management of the delivery of (mainly public) services, to the management of a complex, mixed, public-private system. The complex reforms that have been initiated encompass the broad range of governance activities described by Jakubowski and Saltman in the governance role of national governments (Jakubowski and Saltman, editors, 2013).
However, the case studies also demonstrate the challenges of this role, particularly in the context of complex, mixed health systems of low- and middle-income countries. These have been characterized as having blurred boundaries between the public and private sector, weak regulatory capacity, and high levels of out-of-pocket expenditure (Nishtar, 2010).
Public Hospital Governance: Emerging Issues and Key Lessons
317
The case studies demonstrate that while governments in the region have adopted a variety of approaches in their governance of the health system, they have not always balanced autonomy and accountability, or aligned these with the financial incentives and regulatory controls. In addition, they have not always been sufficiently explicit in defining the performance goals to be achieved, or the balance between equity and efficiency expected. At the same time, limited hospital or local government leadership and management capacities – and local operating constraints – may limit or prevent the reform intentions from being translated into action.
Health systems are dynamic, and hospitals as key elements of health systems adapt and respond to their operating environments, governance and accountability frameworks, and availability of resources in achieving performance objectives. Reforms are thus ongoing, and need continual monitoring and adjustment. Governments have not always demonstrated the capacity to learn from experience and to modify and revise reforms in the light of evidence on outcomes.
Further investigation is needed to identify key principles in effective governance of reform of health systems, and in balancing the various factors that influence hospital performance.
5.2 Reforms of hospital financing need to balance improvements in efficiency with ensuring equity of access and maintaining quality of care.
Changes to the financing of hospitals have been a key component of most of the reforms presented in the case studies. Financing reforms typically involve a reduction in direct budgetary funding of hospitals, and a shift towards third party payment, accompanied by increases in delegated autonomy to manage finances locally. In a number of countries, these reforms are part of broader reforms to financing of health systems and the shift towards universal health coverage.
The impact of these reforms on hospital performance has been variable, with improvements in efficiency and maintenance of equity in some countries, while in others, the pursuit of increased revenue by hospitals has contributed to increased overall health expenditure, while failing to address inequities in access and financial protection. In these cases, there has been a
318
failure of oversight and accountability, particularly by local governments. As Kutzin points out in his review of financing reforms in countries in transition in Europe, alignment between financing and other aspects of reforms is crucial to achieving desired performance outcomes (Kutzin, 2010).
Given the importance of financing, further investigation is suggested into the impact of reforms on hospital performance, particularly in association with different governance and accountability arrangements.
5.3 Hospital management and leadership The case studies have demonstrated the critical role of hospital managers and leaders in determining how hospitals respond to the governance and accountability arrangements, the financial incentives and resource constraints, and in determining the achievement of performance objectives. This is the meso and micro level of the governance arrangements in the structure proposed by Saltman, Duran and Dubois (2011).
This area provided an interesting contrast between the situation in most of the low- and middle-income countries where clinicians are primarily the hospital leaders, and the situation in the high-income country studied where a separate professional hospital management cadre has arisen, and efforts are focused on engaging clinicians in hospital management. Reforms have been introduced in several countries to strengthen the management capacities of clinician hospital leaders, and to introduce hospital-level governance structures such as hospital supervisory boards.
However, further investigation is needed of appropriate methods to strengthen hospital supervisory boards, and to build the management capacity of clinicians.
5.4 Integration of hospitals with local health care systemsA further difference among the case studies is the extent to which reforms focused on hospitals as independent service delivery units, as opposed to their role as providers of referral services within district health systems. The impact of some reforms has been to view hospitals as individual units, responsible for achieving individual institutional objectives; in other cases,

Public Hospital Governance: Emerging Issues and Key Lessons
319
hospitals are viewed as parts of a local or district health system, and it is the system as a whole that needs to achieve the objectives.
Failure to integrate hospital services within functioning district health systems can lead to unnecessary and expensive hospital treatment of patients that could be managed in lower-level hospitals or in primary care (bypassing), as well as inequities in access, long waiting times, and overcrowding of hospitals which can undermine the quality of care. As hospitals also provide specialized primary health care through outpatient departments, and with the increasing predominance of chronic diseases requiring shared management between primary care and hospital services, strategies to improve integration of hospitals into district health systems are increasingly vital.
5.5 Quality of careOne aspect of performance that has not received as much attention in reforms has been the quality of care. While New Zealand has specific performance objectives around patient safety and quality of care, other countries are just commencing with hospital accreditation requirements (Thailand, Sri Lanka, Philippines and Indonesia), as a consequence of the expansion of national health insurance.
Further investigation is needed into how high quality of care and patient safety can be incorporated into performance objectives, and how governance arrangements and financial and regulatory incentives can encourage improvements in quality of care.
These are issues that will be followed up Phase 2 of these studies, and become the topic of further publications.
AcknowledgementsThe author gratefully acknowledges the contributions made by reviewers to earlier drafts including Dale Huntington, Antonio Duran and Robin Gauld.

320
ReferencesBossert T (June 2008). Decentralization and governance in health. Bethesda: Health Systems 20/20 Project.
Jakab M, Preker A, Harding A, Hawkins L (June 2002). The introduction of market forces in the public hospital sector: From the new public sector management to organizational reform. Washington, DC: World Bank. https://openknowledge.worldbank.org/handle/10986/13703.
Kutzin J, Cashing C, Jakab M, editors (2010). Implementing health financing reform: lessons from countries in transition. Copenhagen: WHO for the European Observatory on Health systems and policies.
Jakubowski E, Saltman RB, editors (2013). The changing national role in health system governance. A case based study of 11 European countries and Australia. Copenhagen: WHO for the European Observatory on Health Systems and Policies.
Nishtar S. The mixed health systems syndrome. Bulletin WHO. 2010; 88:74-75 B doi:10.2471/BLT.09.067868.
Saltman RB, Duran A, Dubois HFW, editors(2011). Governing public hospitals: reform strategies and the movement towards institutional autonomy. Copenhagen: WHO for the European Observatory on Health Systems and Policies: pp 201-16.

Author Biographies
321
Author BiographiesNi Luh Putu Eka Putri AndayaniShe was born in Denpasar, October 31, 1975. She finished her master in public health on January 2002 in Universitas Gadjah Mada. She joined Center for Health Policy and Management, Universitas Gadjah Mada in September 2001 as junior researcher. All of her works are on hospital management area, mostly on government owned hospitals. In 2007 Internal Affair Ministry of Republic of Indonesia hired her and some other experts and hospital management practitioners to work in a team to develop modules due to Public Service Agency Legislation& Regulations that were issued in 2003, 2005 & 2007. Since then, she has worked even closer with IAM and District Hospital Association to train and give technical assistance for local government owned hospitals all around Indonesia in implementing financial management reform for public hospital. In 2011 she spent one year in Germany to participate International Leadership Training on Hospital Management, including three months as an apprentice in a trauma hospital in Berlin. Since 2012, she has managed the Performance Management and Leadership program, which aims to implement the financial reform in 11 district hospitals in East Nusa Tenggara, among other goals.
Shanti DalpataduShanti Dalpatadu is a Senior Fellow at the Institute for Health Policy, Colombo, Sri Lanka. He is a Board Certified Consultant in Community Medicine and has obtained the MD in Community Medicine from the Post Graduate Institute of Medicine in Sri Lanka and is also a Fellow of the College of Medical Administrators of Sri Lanka. He has extensive experience as a senior medical administrator in the Sri Lankan government health sector, and has worked in various capacities in the Curative, Preventive & Administrative sectors and the last post held has been as Deputy General of Health Services (Planning). He has worked in the capacity of consultant and temporary advisor for the WHO South East Asia Office on a number of projects. At present he is an examiner and lecturer in MD and MSc courses in Medical Administration at PGIM. He has also supervised a number of research work of MD and MSc trainees in Medical Administration and Community Medicine at the Post Graduate Institute of Medicine.

322
Antonio DuranThrough almost 20 years, Antonio Duran has achieved a broad professional record as International Consultant collaborating with many international organizations. He has especially extended working relationships with WHO and the WB and has also worked for DfID, the EU and IDB and others.
Antonio Duran has gained particular expertise in working in and leading health system reform projects. His experience in Eastern European and Former Soviet Union Countries provided him with particularly deep knowledge of Transition Countries. He has also worked in Asia (Bahrain, China and Maldives) and Latin America (Bahamas, Brazil, Dominican Republic and Panama). He is currently working regularly in India, Ukraine and Uzbekistan.
Antonio Duran acts as CEO at Técnicas de Salud, a private consultancy company in the fields of Health Policies and Systems. Dr. Duran regularly collaborates and holds an honorary appointment as Technical Adviser for the European Observatory on Health Systems and Policies in Brussels.
He is also visiting Lecturer at the Andalusian School of Public Health, in Granada, Spain, where he teaches Health Systems and International Health Policies and is a regular lecturer on the same topics for the Management Centre in Innsbruck, Austria, as well as a frequent speaker at national and international forums. He has a broad range of publications on the above areas, the latest ones being on “Governing Public Hospitals”.
Robin GauldRobin Gauld is Professor of Health Policy and Director of the Centre for Health Systems in the Department of Preventive and Social Medicine, University of Otago, Dunedin, New Zealand. He was a Senior Fellow at the Boston University Health Policy Institute 2009-13, was a Commonwealth Fund Harkness Fellow in 2008-09, and is Independent Chair of the Southern Health Alliance Leadership Team which brings together clinical leaders to focus on ‘whole of system’ approaches to health system and patient care improvement in the Southern region of New Zealand. Prior to joining Otago University in 1997, Gauld was resident in Hong Kong, where he taught at the City University of Hong Kong and completed his PhD at the University of Hong Kong. Current research interests and funded projects are in comparative

Author Biographies
323
health policy, health system and quality improvement, care coordination, clinical governance, hospital and health system governance, population based health funding formulas, health information technology and primary care. Robin has authored over 100 peer-reviewed journal articles and several books including The New Health Policy (Open University Press, 2009) which was awarded First Prize in the Health and Social Care category at the 2010 British Medical Association Medical Book Awards. Other recent books include Health Care Systems in Asia and Europe co-edited with Christian Aspalter and Uchida Yasuo(Routledge, 2011) and Democratic Governance and Health: Hospitals, Politics and Health Policy in New Zealand co-authored with Miriam Laugesen (Otago University Press, 2012).
Krishna HortKrishna Hort is Deputy Director and Head of the Health Systems Strengthening Unit, at the Nossal Institute for Global Health, University of Melbourne. Kris has a background as a doctor in paediatrics and public health, and started his career as a volunteer doctor in a charitable rural hospital in Bangladesh. Since then, he has worked in the Australian health system as a regional director of public health in Western Sydney, and in health assistance programs in developing countries of the South and SE Asian regions. Kris has experience as a team leader on a reproductive health project in Indonesia, technical director of projects in Indonesia and Viet Nam, and consultant in project design, evaluation and implementation in Bangladesh, Indonesia, Philippines, China, Laos and Viet Nam. As technical director of the AusAID funded Health Policy and Health Finance Knowledge Hub, he led a range of research studies in areas such as governance and regulation of private hospitals, hospital accreditation, and non communicable disease policy. His interests include health systems reform, the relation between knowledge and policy, environmental health, maternal and child health, and mechanisms for development assistance.
Dale HuntingtonDale Huntington is currently Director, Asia Pacific Observatory on Health Policy and Systems, based in the WHO Western Pacific Regional Office, Philippines. Previously he was a Scientist with the World Health Organization’s Department of Reproductive Health and Research, Geneva. His research interests includes bringing evidence to inform public policy

324
towards the private health sector, advancing health equity, aid effectiveness issues, health financing systems, large scale-programme evaluation. He holds a Doctorate in Science degree from the Johns Hopkins University School of Hygiene and Public Health, specializing in health services research and evaluation. Prior to joining the World Health Organization he was a Senior Health Specialist at the World Bank, Washington, D.C. He has lived and worked in developing countries for over 20 years, including assignments as regional director for USAID supported operations research programmes in West Africa, the Middle East and South and East Asia regions. He has an extensive publication record and is proficient in French.
Tiara MarthiasTiara Marthias is a public health researcher with a training in general medicine from Faculty of Medicine Universitas Gadjah Mada and a master in public health from The University of Melbourne. She joined the Center for Health Policy Management (CHPM UGM) in 2011, focusing on maternal and child health (MNCH). She has been involved in various research and health projects, including as the writing team for the Indonesian Health System in Transition report, module developer for health equity research, researcher in MNCH planning and budgeting, Informing Evidence-Based Policy Making for RMNCH case study, and module developer on MNCH planning and budgeting for Republic Democratic of Timor Leste. Her current projects are the evidence-based planning and budgeting for MNCH project and health financing expenditure bottleneck study that takes place in eighteen Indonesian districts. Her research interests include maternal and child health, and health equity.
Nicollette MaunganidzeNicolette is student in the Master of Arts, International Relations and Internal Economics, at the Johns Hopkins School of Advanced International Studies (SAIS) studying International Relations and Economics. She has a background is in Biomedical and Public Health Research and her interests lie in health economics, decision analysis and health systems strengthening in Africa. She has undertaken short term work in China, Zimbabwe, and Peru, as well as biomedical research in the UK. In 2014, she was the recipient of a Global Health Fellowship sponsored by The Gates Foundation, and elected to spend her fellowship at the Nossal Institute for

Author Biographies
325
Global Health, University of Melbourne. During her fellowship she audited the Master of Public health short course on Systems for Global Health, and reviewed policy frameworks and evidence arising from the country case studies on public hospital governance.
Tran Thi Mai OanhTran Thi Mai Oanh is the Director of Health Strategy and Policy Institute. She has been working for the Institute for 23 years. As the Director of Viet Nam’s leading research institution, she has been officially tasked to provide evidence for policy development in health. She has experience in generating robust evidence for policy making and has worked extensively with policy makers to make most efficient use of evidence in policy making. She conducts many studies in the area of policy and health system research, including the aspects of health service utilization, human resources for health, health financing in general and health insurance specifically. She was trained as a general practitioner at the Hanoi Medical University. She was trained for master degree of public health at Karolinska Institute and then for PhD degree in the area of public health at National Institute of Hygiene and Epidemiology in Viet Nam.
Walaiporn PatcharanarumolWalaiporn Patcharanarumol got her PhD in public health and policy from London School of Hygiene and Tropical Medicines, University of London. Her main interested researches are in health care financing, public health insurance and health system research with extensive experiences of health financing since 1997, for example hospital costing, National Health Account, National Drug Account, National AIDS Spending Assessment, long term projection of national health expenditure, health care financing for the poor and capitation rate estimation for the public health insurance scheme. One major work is ‘Good Health at Low Cost’ explaining why and how Thailand achieved good health at reasonable cost. She published extensively in peer review journals mostly on health policy and systems research.
Not only research, she provides technical support for capacity strengthening to a number of countries in the Region through various platforms such as a technical coordinate of the Asia Pacific Action Alliance on Human Resource for Health (AAAH) between 2009 and 2011. She was seconded by the Royal

326
Thai Government through the Prince Mahidol Award Foundation to Health System Financing Department, WHO Geneva between Aug 2011 and April 2012 for the global advocates on Universal Health Coverage. Upon her return in 2012; she has been responsible on “Capacity Building for Universal Health Coverage, CapUHC”; and recently, she is the technical secretariat for the ASEAN Plus Three UHC Network established in April 2014, by the mandate of the ASEAN Plus Three Health Minister Meeting in July 2012.
Prasadini PereraPrasadini Perera is a Research Fellow at the Institute for Health Policy (IHP), Colombo, Sri Lanka. She is a Pharmacist and has a BSc in Pharmacy from the University of Colombo, Sri Lanka. She obtained her MS and PhD in Pharmaceutical Economics, Policy, and Outcomes at the University of Arizona, USA. She has number of years (since 2008) experience in pharmaceutical and health services research during her graduate education, and at IHP.
Oscar F. PicazoOscar F. Picazo is a senior research consultant on health at the Philippine Institute for Development Studies. He retired as senior health economist from the World Bank in 2009 after ten years of service in Washington, D.C. and in Pretoria, South Africa. He also worked for seven years as a health financing specialist for the United States Agency for International Development (USAID) in Manila, Philippines and in Nairobi, Kenya. As a health policy analyst, he has written or co-written 65 reports and articles on global health issues, 30 of which have been published. His current research interests are medical tourism, health market innovations, and achieving universal health care. Oscar studied economics at the University of Santo Tomas (A.B. Economics, magna cum laude) and the University of the Philippines (M.A. in Economics). In 1991-92, he was a Hubert Humphrey Fellow on health policy at the Bloomberg School of Public Health, Johns Hopkins University. Mr. Picazo has traveled to 63 countries, worked in 22, and lived in four. He teaches health economics to students in M.B.A. in Health at the Ateneo Graduate School of Business and is chair of the Philippine NGO Support Program. He is a also a member of the Department of Health’s Research Hub Executive Board, and is consultant of the Chairman of the Board of the Philippine Health Insurance Corp.

Author Biographies
327
Likke Prawidya PutriLikke Prawidya Putri joined Center for Health Policy Management (CHPM UGM) as a junior researcher in 2008 after finishing medical degree from School of Medicine Universitas Gadjah Mada. After working for Yogyakarta municipal health office for almost two years, she continued her study to pursue a Master of Public Health at the University of Melbourne. She spent most of her time conducting quantitative and qualitative research and collaborating with health office staff at district level focusing on maternal-neonatal-child health (MNCH) and health systems. She currently serves as senior researcher in a health financing systems bottleneck study, and a case study on the evidence-based planning and budgeting for maternal child health in Papua.
Anuwat SupachutikulAnuwat Supachutikul is the Chief Executive Office of the Healthcare Accreditation Institute (HAI) in Thailand. He pioneered movement of Hospital Accreditation in 1997. He started with a pilot program supported by Health Systems Research Institute (HSRI); and gradually, when more capacities and experiences were gained, HAI was finally institutionalized as a Public Organization, an independent state agency, through a Royal Decree in 2009. He also chairs the Technical Subcommittee of the Thailand Quality Award Program.
Though an orthopaedic surgeon, he has extensive experiences in hospital management and information system. After his Master of Health Planning and Financing from London School of Hygiene and Tropical Medicines in 1992, he managed the Health Card Project, a voluntary health insurance scheme for the informal non-poor households, and then worked in HSRI on quality. Most of his work focuses on quality improvement ranging from quality management, development of hospital standard to a full Hospital Accreditation program.
The 2001 advent of universal health coverage increases demand for access to quality healthcare nationwide, he proposed and was well accepted by all partners, a stepwise recognition program to assist smaller hospitals with limited resources and capacities on their long journey towards quality

328
improvement and accreditation status. This recognition and accreditation programs were adopted by two major insurance funds: the Social Security Office for social health insurance and National Health Security Office for universal coverage scheme, by offering quality incentives to public and private healthcare providers achieving each of the three progressive landmarks.
Piggybacking with the accreditation driving force, he initiated patient safety, spiritual dimensions of healthcare and mobilized domestic resources to form Quality Learning Networks as platforms for fostering partnership and ownership in quality movement by all stakeholders.
Viroj TangcharoensathienViroj Tangcharoensathien is a Senior Expert in Health Economics at Ministry of Public Health, Thailand and advisor to International Health Policy Program of the MOPH. Trained in Medicine, he served nine years in rural district hospitals in a poor northeast province of Thailand and received the ‘Best Rural Doctor’ award in 1986 from the Thai Medical Association.
In 1990 he got a PhD in health planning and financing at the London School of Hygiene and Tropical Medicine, and Woodruff Medal Award from the London School of Hygiene and Tropical Medicine (LSHTM) in 1991 for his outstanding PhD thesis on Community Financing: The urban health Card in Chiangmai, Thailand.
He returned to work in Health Planning Division of the Thai MOPH, later the co-founder of IHPP in 1998 which strengthened institutional capacities in health policy and systems research in Thailand and support other countries in the Region. With various partners, he designed capitation system and estimated the capitation fee for Social Health Insurance Scheme at its inception in 1991 and Universal Coverage Scheme at its inception in 2001. He earned the Edwin Chadwick Medal from LSHTM in 2011 for the contributions to the generation of evidence which improves health systems in the interests of the poor.
By 2014, he published 141 articles in international peer reviewed journals. He chaired the negotiation of the WHO Global Code of International Migration

Author Biographies
329
of Health Personnel in which was adopted by the 63rd World Health Assembly on 21 May 2010. He also chaired the negotiation of the Inter-Government Working Group on Public Health, Innovation and Intellectual Property and a number of WHA resolutions where there are conflicts among WHO Member States. He supports the implementation of Universal Health Coverage in various countries, and heads IHPP research hub for the Asia Pacific Observatory.
Khuong Anh TuanKhuong Anh Tuan is Vice Director of Health Strategy and Policy Institute of Viet Nam. He has been working in Health Strategy and Policy Institute since year 2000 after working as a physician in hospital for ten year in the area of infectious and communicable diseases. He was trained as general doctor in Army Academy of Medicine, he got Degree of Master in Clinical of Tropical Medicine in Mahidol University - Thailand in 1996, and PhD decree in epidemiology in 2007. He conducts and participates in several studies in the area of policy and health system research in the areas of health service provision and utilization, human resources, and he also has experience in working with policy makers to make most efficient use of evidence in policy making.
Ruwani WickramasingheRuwani Wickramasinghe is a Consultant at the Institute for Health Policy. She previously worked as a Research Officer at the Centre for Policy Alternatives from 2005 to 2006. She obtained her MSc in Population and Development at the London School of Economics and her BA in Sociology from the University of Warwick, UK.


