public policy and european society university of castellanza session 3(a) inequality in europe and...
TRANSCRIPT

Public policy and European society
University of Castellanza Session 3(a)
Inequalityin Europe and the USA
March 28 2014

Outline
Inequality» Measuring» Causes
How and why is the USA so different? Recent changes in Europe
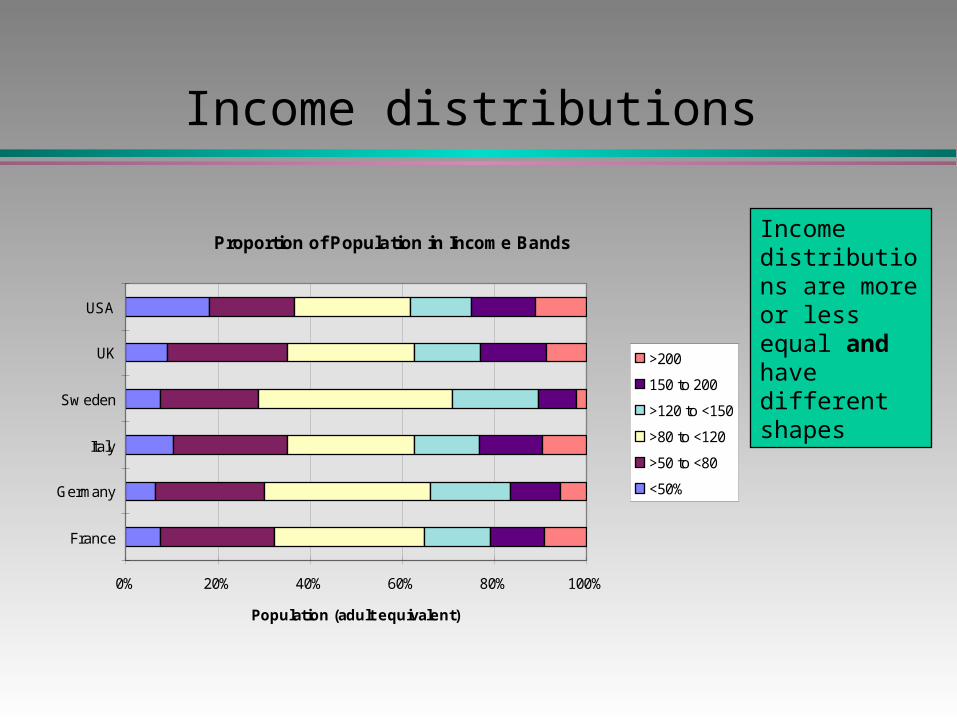
Income distributions
Proportion of Population in Income Bands
0% 20% 40% 60% 80% 100%
France
Germany
Italy
Sw eden
UK
USA
Population (adult equivalent)
>200
150 to 200
>120 to <150
>80 to <120
>50 to <80
<50%
Income distributions are more or less equal and have different shapes

Growing inequality

Defining income
Different definitions of income» Market income» Disposable income
– Less taxes, plus transfers
» Imputed income– Example: ‘cost’ of state education
Unit: Individual or household» Equivalised household income – income adjusted
for household size Sources: surveys, tax returns

Income distributions
Gini coefficients» 0=complete equality, 1 = complete inequality
Percentages of people » What is the income of (e.g.) the poorest 10%?» S90/S10 decile share: gap between average
income of richest 10% and of poorest 10% Percentages of income
» What percentage of people have (e.g.) less than 50% of the average (mean or median) income?

Income inequality within EU: Gini coefficients mid 2000s
0.05.0
10.015.020.025.030.035.040.0
The Gini coefficient is the simplest measure of inequality of any distribution: 0 means total equality (everybody is equal) and 1 total inequality (1 person has everything).
Are rich countries more equal?
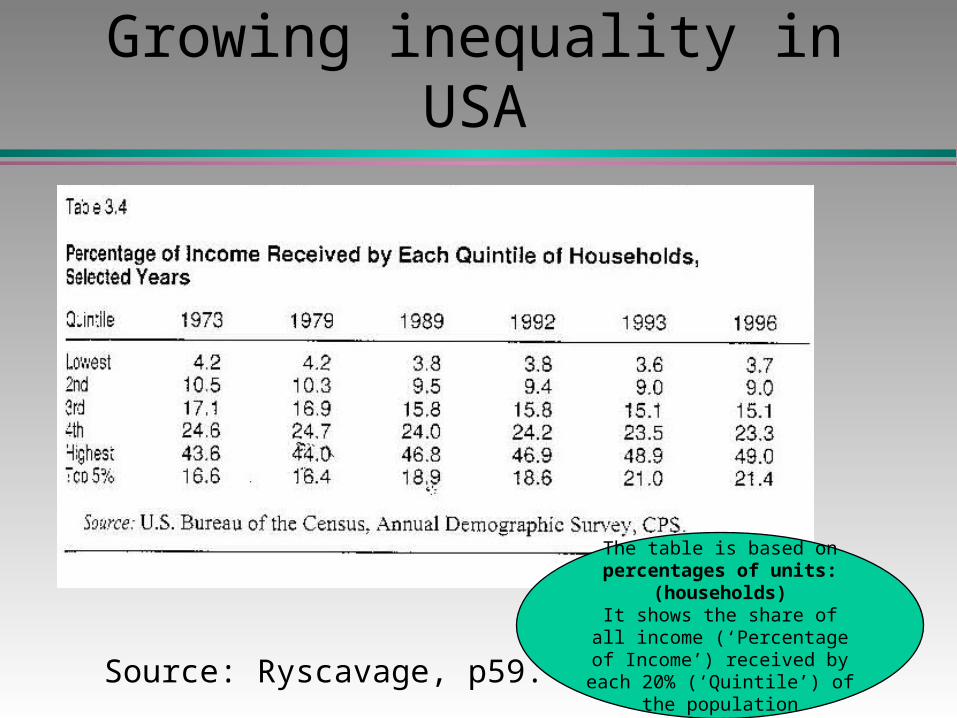
Growing inequality in USA
Source: Ryscavage, p59.
The table is based on percentages of units: (households)
It shows the share of all income (‘Percentage of Income’) received
by each 20% (‘Quintile’) of the population
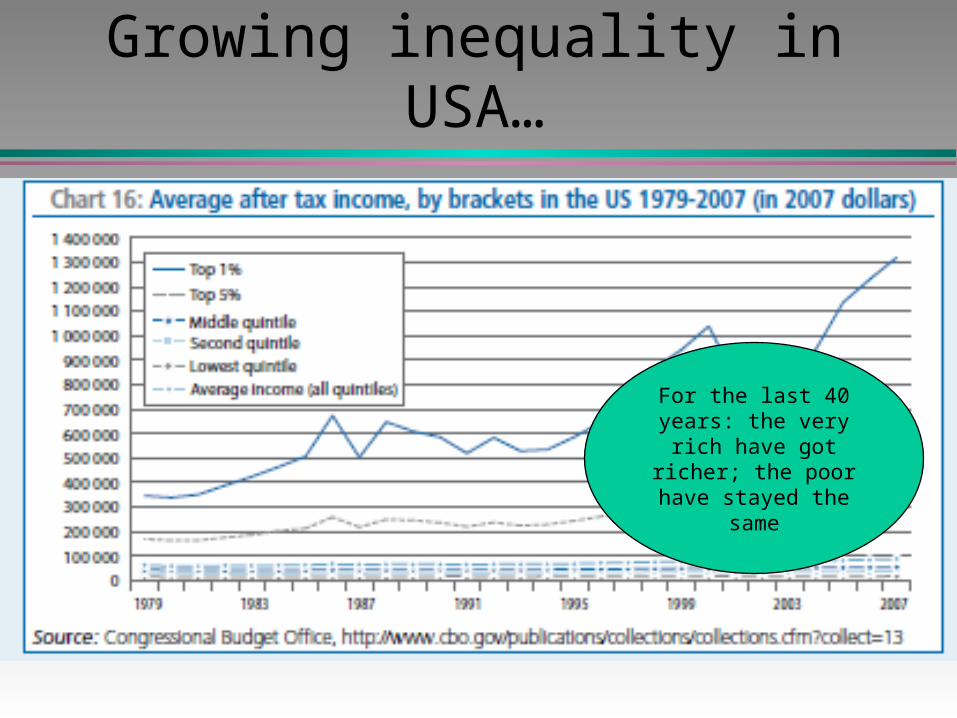
Growing inequality in USA…
For the last 40 years: the very rich have got richer; the poor have
stayed the same
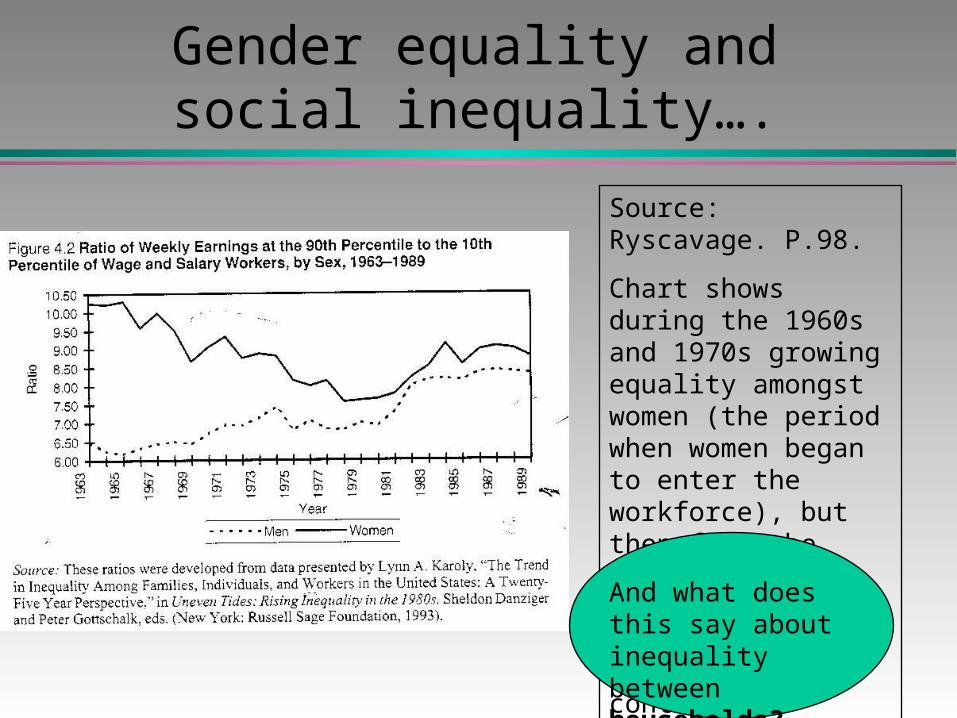
Gender equality and social inequality….
Source: Ryscavage. P.98.
Chart shows during the 1960s and 1970s growing equality amongst women (the period when women began to enter the workforce), but then from the late 1970s inequality amongst women increases. By contrast inequality amongst men has been rising since the early 1970s.And what does this say about inequality between households?
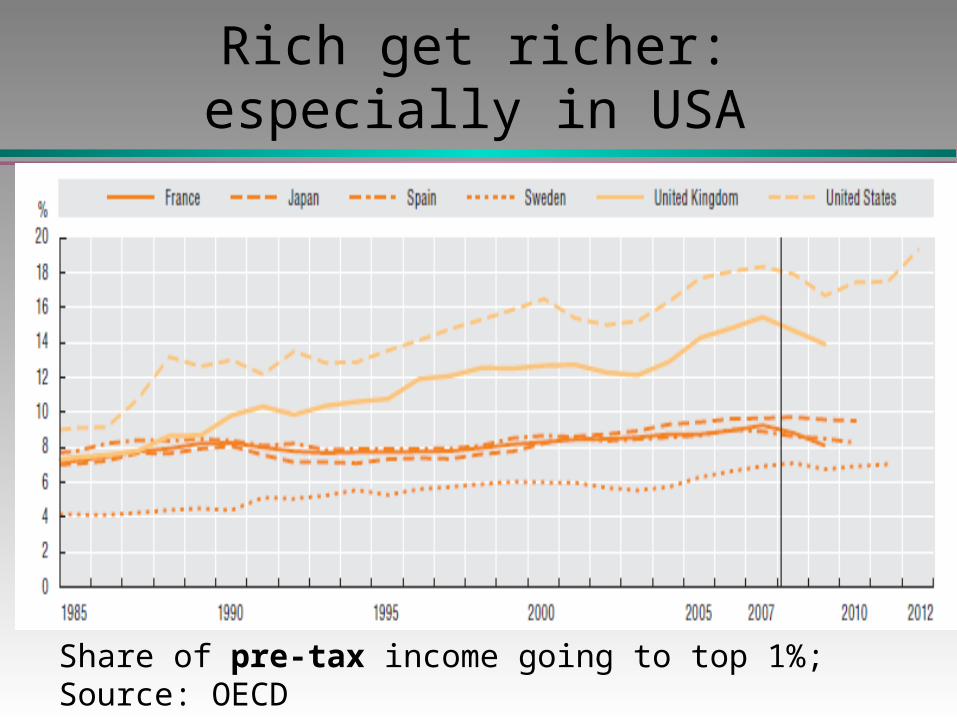
Rich get richer: especially in USA
Share of pre-tax income going to top 1%; Source: OECD
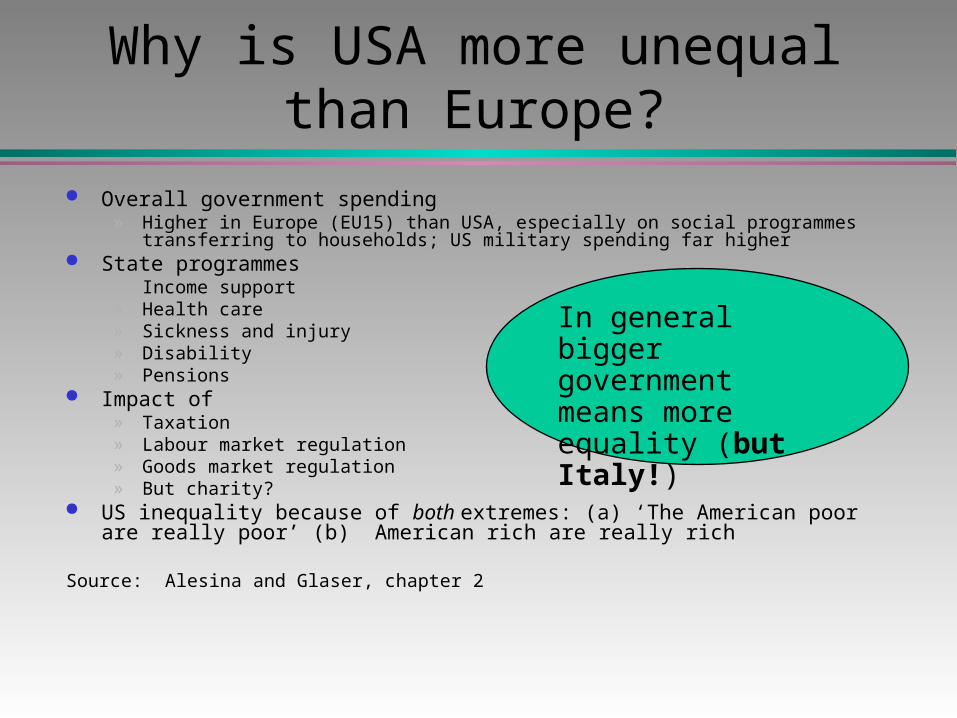
Why is USA more unequal than Europe?
Overall government spending» Higher in Europe (EU15) than USA, especially on social programmes transferring to
households; US military spending far higher State programmes
» Income support» Health care» Sickness and injury» Disability» Pensions
Impact of» Taxation» Labour market regulation» Goods market regulation» But charity?
US inequality because of both extremes: (a) ‘The American poor are really poor’ (b) American rich are really rich
Source: Alesina and Glaser, chapter 2
In general bigger government means more equality (but Italy!)

Growing inequality: some possible causes
Globalisation– Falling demand for unskilled labour– Competition for unskilled jobs through outsourcing and/or mass immigration
Sectoral and structural change– Fewer well-paid male manual jobs (see ‘Full Monty’ film)– Service sector more polarised than manufacturing industry– Mass unemployment– New impact of women’s labour force participation
Earnings inequality within sectors– Privatisation & marketisation– Lower demand for unskilled– Winner takes all job market’ – Managers able to demand higher ‘remuneration’ especially in financial services
Political» Tax cuts and changes benefit rich» Reduced income support and welfare» Decline of trade unions
The big difference between the USA
and Europe seems to be political

UK: more equal

Germany: more unequal

European convergence
Equal societies (e.g. Sweden,
Germany) have been getting more unequal; but some unequal societies (e.g UK) have got
more equal

Impact of crisis
Solid bar: Disposable income inequality.Diamond: Market inequalitySource: OECD, Society at a Glance 2013
Crisis increases market income inequalityTransfers reduce this increase

Does it matter?
A moral issue?Extremes of rich and poor are wrong
An efficiency issue?» Too much equality reduces growth?
Or
Inequality reduces growth?
A universal issue» Inequality is bad for everyone, including the rich» Wilkinson & Pickett (2009), The Spirit Level: Why more equal
societies almost always do better