public safety lte over distributed antenna systems - · pdf filethe indoor coverage provided...
TRANSCRIPT
PUBLIC SAFETY LTE OVER DISTRIBUTED ANTENNA SYSTEMS
Team: Daithankar Prachee, Samadian Saman, Gavva Sai, Gopal Lavanya
Faculty Advisor: Dr. Ken Baker
Industry Advisor: Dr. Bob Johnk
University of Colorado, Boulder

ABSTRACT
First responders for Public Safety (PS) require seamless roaming, high data rates, and immediate
access to voice, video and data applications. The Public Safety Communications Research
(PSCR) macro-network is often unable to provide these services satisfactorily within buildings.
Currently, the PSCR is in the process of developing standards for the PS LTE signal
communication. To that end, they have developed a three-phase plan that involves creating
network test plans, deploying equipment and executing the tests. As a part of this project, we
deployed an indoor Distributed Antenna System (DAS) fed by an LTE small cell. We achieved
connectivity in the test area (DLC building of CU Boulder) by distributing the public safety 700
MHz LTE signal from the small cell via the DAS. This particular research is unique because the
test networks of the developers (in-building Wireless service providers) so far have not deployed
the 700 MHz LTE signal over a DAS or fed the DAS with a small cell, which proved to provide
the best performance. In order to quantify that, we analyzed nine Key Performance Indicators
(KPIs) which represent quality, coverage and throughput to demonstrate the ability of the DAS
and other systems such as a discrete antenna system and a Cell-On-Wheels (COW) site.

Table of Contents
I. INTRODUCTION ...............................................................................................................1
i. Research Question .........................................................................................................1
ii. Problem Setting ..............................................................................................................1
iii. Sub Problems .................................................................................................................1
iv. Hypothesis......................................................................................................................2
II. LITERATURE REVIEW ....................................................................................................2
i. Public Safety and LTE ...................................................................................................2
ii. Public Safety and Service Providers ..............................................................................3
iii. DAS and LTE ................................................................................................................3
iv. State of the art ................................................................................................................3
III. RESEARCH METHODOLOGY.........................................................................................4
i. DAS Test ........................................................................................................................4
i. CW Testing ....................................................................................................................4
ii. RF Model .......................................................................................................................5
iii. Inventory and Link Budget ............................................................................................5
iv. Installation ......................................................................................................................6
v. Walk Test .......................................................................................................................7
vi. Measurement Metrics .....................................................................................................7

ii. Discrete Antenna Test ....................................................................................................9
iii. Cell-on-Wheels Test ......................................................................................................9
IV. RESEARCH RESULTS ......................................................................................................9
V. DISCUSSION OF RESULTS ...........................................................................................13
i. UE Transmit Power ......................................................................................................13
ii. MIMO Rank .................................................................................................................15
iii. CINR ............................................................................................................................15
iv. Throughput ...................................................................................................................17
VI. CONCLUSION AND FUTURE SCOPE ..........................................................................18
REFERENCES
Index of Figures
Figure 1: RF Model……………………………………………………………………………….5
Figure 2: DAS Deployment.............................................................................................................7
Figure 3: Discrete Antennas feeding by small cell..........................................................................9
Figure 4: COW site deployment outside the DLC..........................................................................9
Figure 5: COW and Green Mountain site locations......................................................................10
Figure 6: UE TX power.................................................................................................................14
Figure 7: CINR..............................................................................................................................16
Figure 8: Throughput.....................................................................................................................18

Index of Tables
Table 1: Link Budget.....................................................................................................................6
Table 2: Level 1- TCP Downlink..................................................................................................11
Table 3: Level 1- TCP Uplink…...................................................................................................11
Table 4: Level 1- UDP Downlink and UDP Uplink…………....……………………....…….....11
Table 5: Level 1B- TCP Downlink and TCP Uplink....................................................................12
Table 6: Level 1B- UDP Downlink and UDP Uplink..................................................................12

I. INTRODUCTION
Emergency services such as fire, medical and law enforcement require a Public Safety (PS)
wireless communication network that does not suffer from problems such as excess path loss due
to penetration loss through the buildings. Reliability is essential for in-building communications
in order to respond adequately to incidents such as fires or accidents that endanger people or
property.
i. Research Question
How can we improve indoor wireless coverage and optimize network performance for the public
safety LTE signal at the 700 MHz band?
ii. Background
We conducted this project in collaboration with Public Safety Communications Research
(PSCR), located at the U.S. Department of Commerce Boulder Laboratories. It is a joint effort
between the National Telecommunications and Information Administration (NTIA) and National
Institute of Standards and Technology (NIST). We focused the scope of our research on studying
in-building wireless coverage at the Discovery Learning Center (DLC) building located on the
campus of the University of Colorado Boulder. We split the problem of providing adequate
wireless network coverage for public safety inside this building into three sub-problems. We
conducted the experiments on the public safety 700 MHz LTE band (band 14). To provide
coverage inside of the DLC building, PSCR provided a commercial small cell for the tests in
DLC 1B40.
iii. Sub-Problems
For simplicity, we divided the research question into the following three sub-problems:
2
1. Deploying and analyzing an in-building DAS fed by an in-building small cell
2. Obtaining and analyzing performance measures of an in-building discrete antenna system fed
by an in-building small cell
3. Obtaining and analyzing performance measures of a Cell-on-Wheels (COW)
iv. Hypotheses
Indoor DAS can be successfully deployed for public safety 700 MHz LTE. The low power DAS
can provide better performance than a high power discrete antenna system. The indoor coverage
provided by DAS and/or discrete antenna system can be better than the coverage provided by a
COW from outside the building.
Section II details the ‘state-of-art’ technologies employed in the sub-problems. The sections III
and IV address the methodology used to tackle each sub-problem and discuss the results obtained
respectively. The ultimate section concludes this research and mentions the future scope.
II. LITERATURE REVIEW
i. Public Safety and LTE
Since 2004, PSCR has recognized the importance of establishing a public safety broadband
network and commenced “developing standards for organizations such as 3GPP, GSMA and
ATIS” [1]. As NIST indicated on its website, mobile equipment vendors began to contribute in
deploying a nationwide broadband public safety network in September 2010 [2]. Following that,
in 2011 the FCC determined that first responders require accurate, immediate and uninterrupted
wireless services for their Land Mobile Radios and allocated the 758-768/788-798 MHz band for
nationwide, interoperable wireless broadband communications network that will benefit public
safety users [3].
The progression of cellular 2G and 3G services, from GSM to UMTS to HSPA to CDMA has

3
resulted in 4G LTE technology. LTE is a packet switching network that has a higher data-
carrying capacity and spectral efficiency [4], making it a superior choice for communication, and
as was determined after much research [5], a better technology for public safety networks.
ii. Public Safety and Service Providers
Existing mobile broadband cellular network operators such as AT&T, Verizon, T-mobile and
Sprint, as well as broadband cellular network equipment providers such as Ericsson, Alcatel-
Lucent, Nokia Siemens Networks (NSN) and Motorola contributed in the FCC inquiry for a plan
to design and deploy public safety networks nationwide and shared their concerns and opinions
with FirstNet plan and design [6], [7].
iii. DAS and LTE
In DAS, multiple low-power antennas, connected to each other using a coaxial cable or optical
fiber, provide wireless network coverage. DAS provides enhanced signal quality, increased
capacity and coverage and reduced interference [8]. Considering these advantages, many
wireless companies are providing indoor and outdoor wireless coverage using passive
distribution, active distribution, hybrid solutions, repeaters and small cells [9].
Telecommunication Properties Inc. has deployed an LTE-DAS system at the Medical Branch of
the University of Texas-Dallas to provide high-speed wireless services for students, faculty, and
healthcare professionals in the campus. Their system consists of a broad range of wireless
service through a fiber optic based backbone and several hundreds of LTE antenna nodes
distributed around the site. This indoor DAS network addressed only commercial cellular
frequencies and did not support public safety networks [10].
iv. State-of-art
Very limited work has been done on providing indoor DAS coverage for Public Safety networks

4
so far. Feeding a DAS with a small cell is an innovative measure as most of the recent research
and indoor DAS networks use a cellular carriers’ tower that is closest in proximity as an RF
source. These systems provide wireless services for commercial and civilian customers. Recently
installed LTE PS networks provide wireless coverage and seamless roaming for outdoor
environment. Our research aims to evaluate the performance of using a DAS for public safety in-
building coverage. Prior to this work, PS 700 MHz LTE signals have not been deployed over a
DAS, which makes this project unique and meaningful.
To summarize, the systems of cellular on DAS, Public Safety on cellular, and Public Safety on
LTE have been implemented so far. This project implemented Public Safety LTE on DAS to
provide enhanced signal quality, capacity and coverage for in-building public safety radio
communications.
III. RESEARCH METHODOLOGY
This capstone project involved deployment and testing of the systems, as mentioned in the sub-
problems, to analyze an optimum solution for enhanced indoor wireless coverage for public
safety. The research methodology is as follows.
i. DAS
For the first sub-problem we deployed passive DAS with MIMO and performed walk tests to
demonstrate coverage improvements when compared to coverage from a nearby macrocell.
a. CW Testing
Continuous Wave Testing is a vital step in the RF design process that provides a solid validation
to design objectives. It is a cost effective solution to evaluate and select the most suitable
location to place antenna nodes in an in-building DAS. We used Anritsu signal generator and
Omni antenna to transmit a CW signal at 763 MHz center frequency of Band-14 LTE (758 to
5
768 MHz). With this setup, we performed a walk test to measure the signal received in DLC 1B
floor. This walk test involved measuring RSSI of signal received by a receiver Omni antenna, on
a portable spectrum analyzer.
b. RF Model
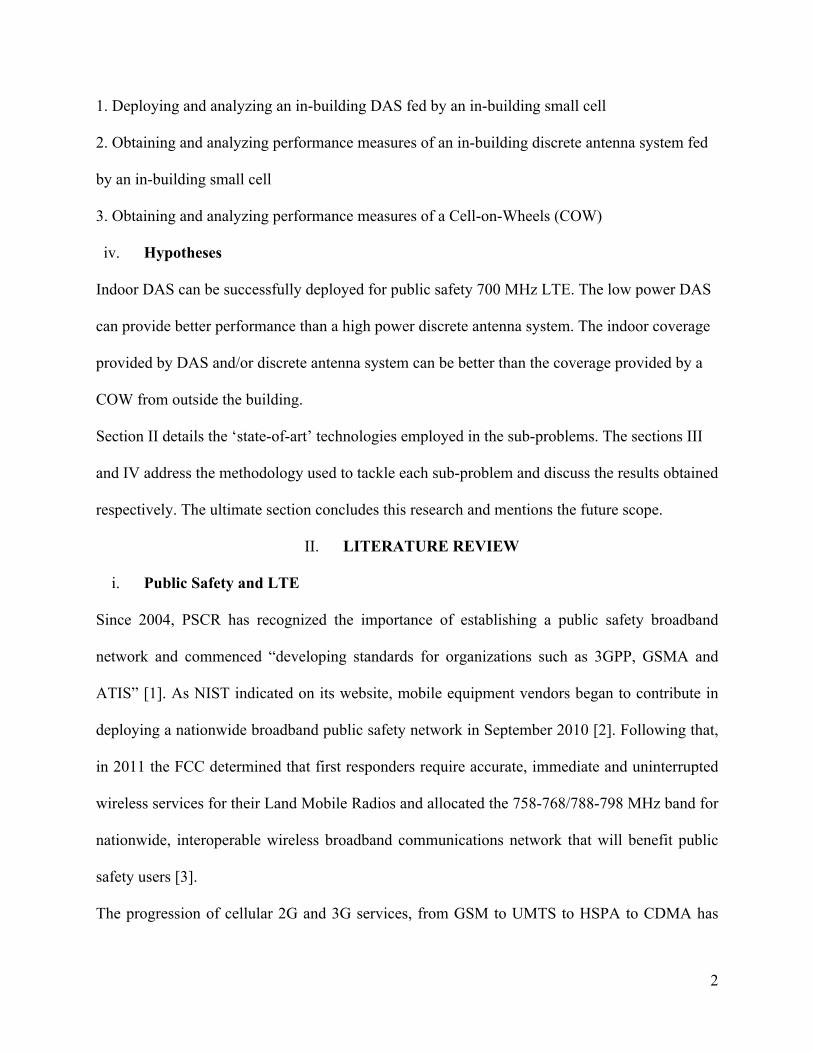
According to the results from the CW testing, we designed an RF model that provides coverage
to the entire DLC1B and DLC1 floors. Long hallways, metal dividers, low-emission glass
windows and doors characterize these floors. These are a few causes for reduced coverage and
multipath interference on these floors. To address this problem and include benefits of multipath,
we designed DAS with Multiple Input Multiple Output (MIMO). The system transmitted two
spatial streams from the small cell to two omni-antennas at one node in the same frequency. We
expected significant improvement in data throughput with spatial multiplexing and one
wavelength distance between the antennas. We fixed the antenna nodes mid-way in each hall to
provide better coverage on the floor. The figure 1 refers to approximate coverage obtained from
two omnidirectional antennas at each node. The
design also involved some overlap between two
nodes to compensate interference and attenuation
effects from walls.
c. Inventory and Link Budget
According to our RF model, we purchased an
LMR-400 coax cable roll, fifteen Amphenol RF
N connectors and ClearLink Omni Directional
Antennas (four for MIMO) for Band 14 LTE. We specified the required cable lengths
originating from each leg of the small cell using a measuring wheel and proceeded to cut, solder
Figure 1: RF Model
6
and affix the connectors onto them. We obtained the instruments involved in this process along
with the splitters and attenuator from the university’s resources.
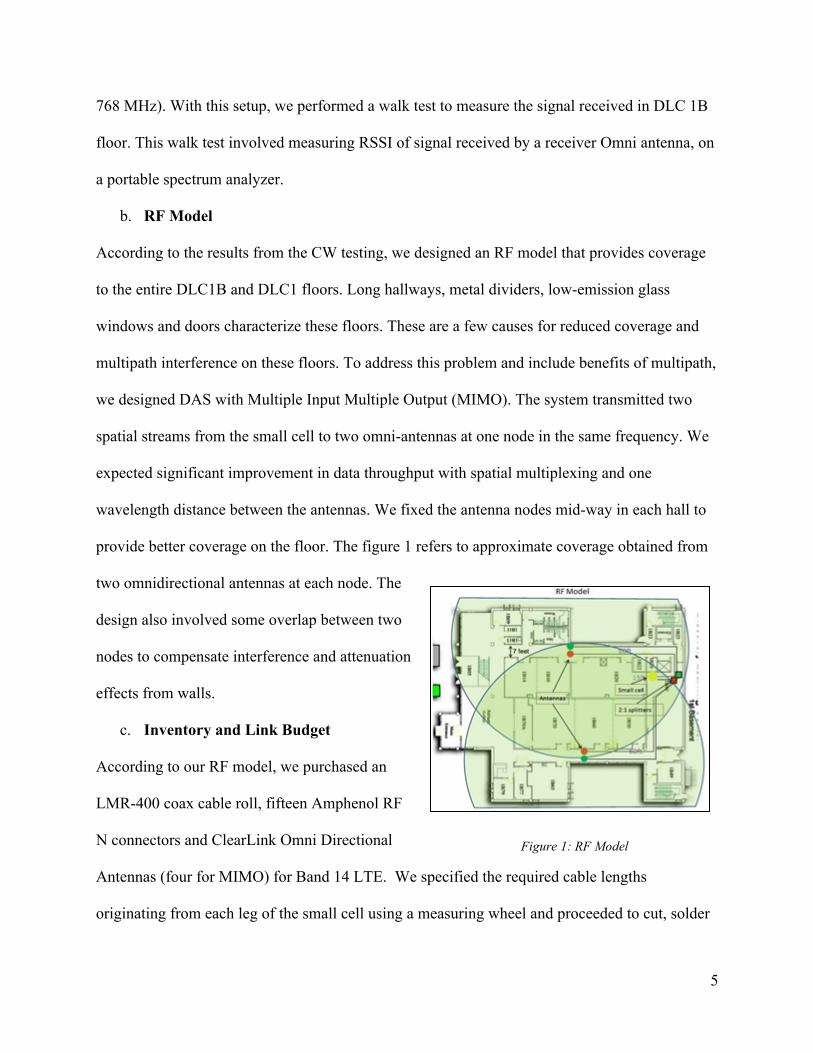
The available inventory helped determine the link budget, which is a means of quantifying link
performance. We calculated losses from the specific devices using their specification sheets and
prepared a link budget consisting of gains and losses from the source to the user end device,
ensuring adequate signal coverage (Table 1).
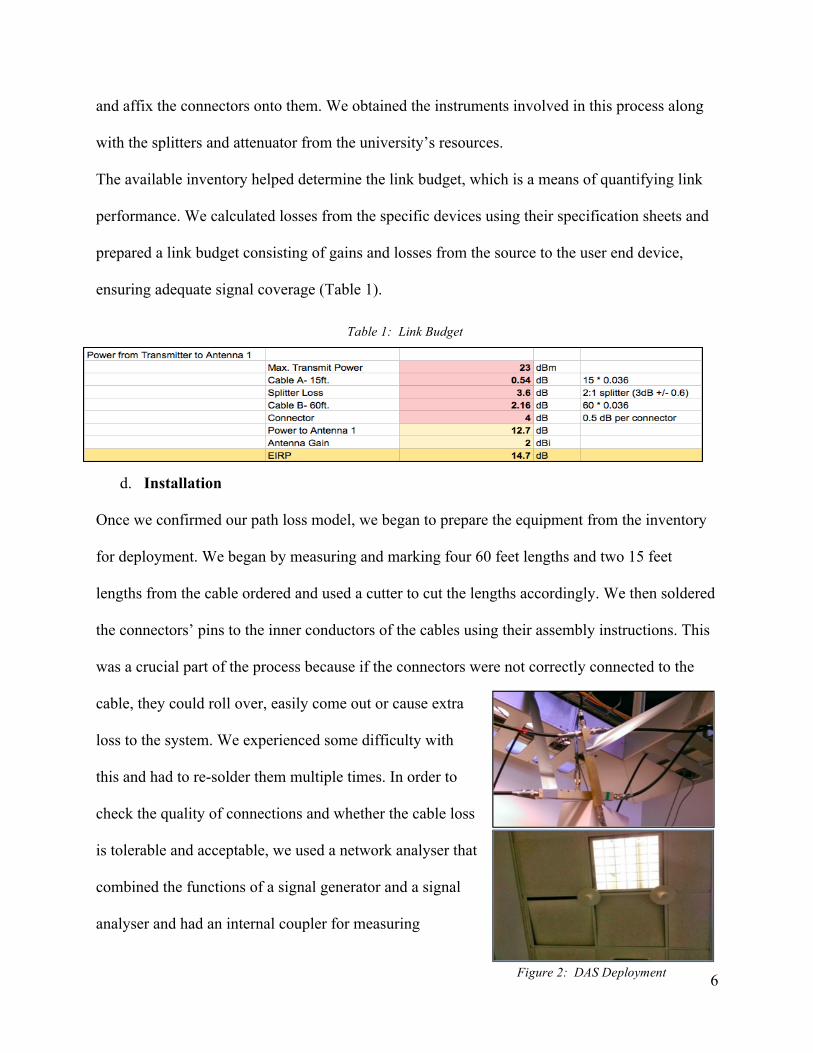
d. Installation
Once we confirmed our path loss model, we began to prepare the equipment from the inventory
for deployment. We began by measuring and marking four 60 feet lengths and two 15 feet
lengths from the cable ordered and used a cutter to cut the lengths accordingly. We then soldered
the connectors’ pins to the inner conductors of the cables using their assembly instructions. This
was a crucial part of the process because if the connectors were not correctly connected to the
cable, they could roll over, easily come out or cause extra
loss to the system. We experienced some difficulty with
this and had to re-solder them multiple times. In order to
check the quality of connections and whether the cable loss
is tolerable and acceptable, we used a network analyser that
combined the functions of a signal generator and a signal
analyser and had an internal coupler for measuring
Table 1: Link Budget
Figure 2: DAS Deployment
7
purposes. We measured the loss in all cables and found it to be lower than what we estimated in
our link budget and were therefore, prepared for deployment.
We connected the 15 feet cables to both the legs of the small cell and ran those cables to two
splitters. To those splitters we attached the 60 feet cables and ran them across the ceiling to the
antennas in the hallway. The symmetry in dimensions assured easy troubleshooting. We fed
200mW of power into the small cell and commenced the testing process (figure 2).
e. Walk Tests
We performed walk test using JDSU backpack system configured with LTE modem and JDSU
1314 scanner. We conducted walk tests in four parts:
1. Walk test inside DLC with PSCR (Green Mountain) macro network only
2. Walk test inside DLC with small cell and MIMO DAS illumination
3. Walk test inside DLC with small cell and discrete antennas
4. Walk test inside DLC with a cell on wheels illuminating DLC externally
Test 1 determined coverage from PSCR macrocell network inside the DLC. The tests 2, 3 and 4
corresponded to each sub-problem as mentioned in Section I. These tests involved measuring
TCP (uplink and downlink) and UDP (uplink and downlink) data transfer on the same route for
each test and recording them using JDSU E6474A software.
f. Measurement Metric Definition
To be able to compare the performance of three scenarios we mentioned in part 2, certain metrics
are defined. For this purpose, we used the following standard key performance indicators (KPI)
as defined for LTE performance measurements by the 3GPP (3rd Generation Partnership
Project):
• Received Signal Strength Indicator (RSSI): Cumulative power present in a received radio

8
signal.
• Reference Signal Received Power (RSRP): Linear average (in watts) of the downlink
reference signals (RS) across the channel bandwidth.
• Reference Signal Receive Quality (RSRQ): Measure of signal quality; defined as the ratio
of RSRP to the E-UTRA carrier received signal strength indicator (RSSI).
• Carrier to Interference and Noise Ratio (CINR): Ratio of desirable signal power to the
summation of interference and noise power.
• Multiple Input Multiple Output (MIMO) Rank: Total number of MIMO transmit streams
of antennas.
• Physical Downlink Shared Channel Throughput (PDSCH Throughput): Throughput of
the main data bearing channel which is allocated to users on a dynamic and opportunistic
basis.
• Physical Uplink Shared Channel Throughput (PUSCH Throughput): Throughput of the
uplink channel which carries the user data.
• Block Error Rate (BLER): Ratio of the number of erroneous blocks received to the total
number of blocks sent in a communication system.
• User Equipment Transmit Power (UE TX Power): Maximum power that can be
transmitted by a user equipment. It is an indicator of battery life.
• Serving cell Identification (Serving Cell ID): Identification of the cell which the UE is
connected to.
ii. Discrete Antennas
Dr. Bob Johnk of PSCR [11] has performed the deployment and data acquisition for the discrete
antenna test consisting of a small cell and two Commercial-Off-The-Shelf (COTS) antennas

9
Figure 4: COW deployment outside the DLC
placed in DLC1B40. This test demonstrated improvement in RF signal levels and data rates from
indoor walk tests when compared to results from macrocell
network. They fed five watts of power into this system. The walk
tests involved measuring TCP and UDP uplink and downlink data
transfer on same routes (figure 3).
iii. COW
Dr. Johnk and the PSCR team have performed the deployment and
data acquisition for this test. The externally-deployed COW with the
eNodeB macrocell fed RF energy to the single-sector cellular panel
antenna from the nearby parking lot. Prior to beginning this test,
they had locked the Macrocell and the small cell. They fed 40W
into the COW system. The microwave link from the Green
Mountain site provided the backhaul. The testing methods were
the same as the ones performed during the DAS deployment and
they performed walk tests over the same routes in order to have
the same basis for analysis (figure 4).
IV. RESEARCH RESULTS
The purpose of this section is to indicate the result of data analysis
by comparing the data obtained from the above three mentioned methods for all the sub-
problems. First, when we attempted to connect to the PSCR macro network of the Green
Mountain site, we did not achieve any connectivity on the 1B floor of the DLC building, as it
was 2 km away (Figure 5). Consequently, we decided to provide in-building coverage using
Figure 3: Discrete Antennas feeding by small
cell
10
Figure 5-COW and Green Mountain site locations
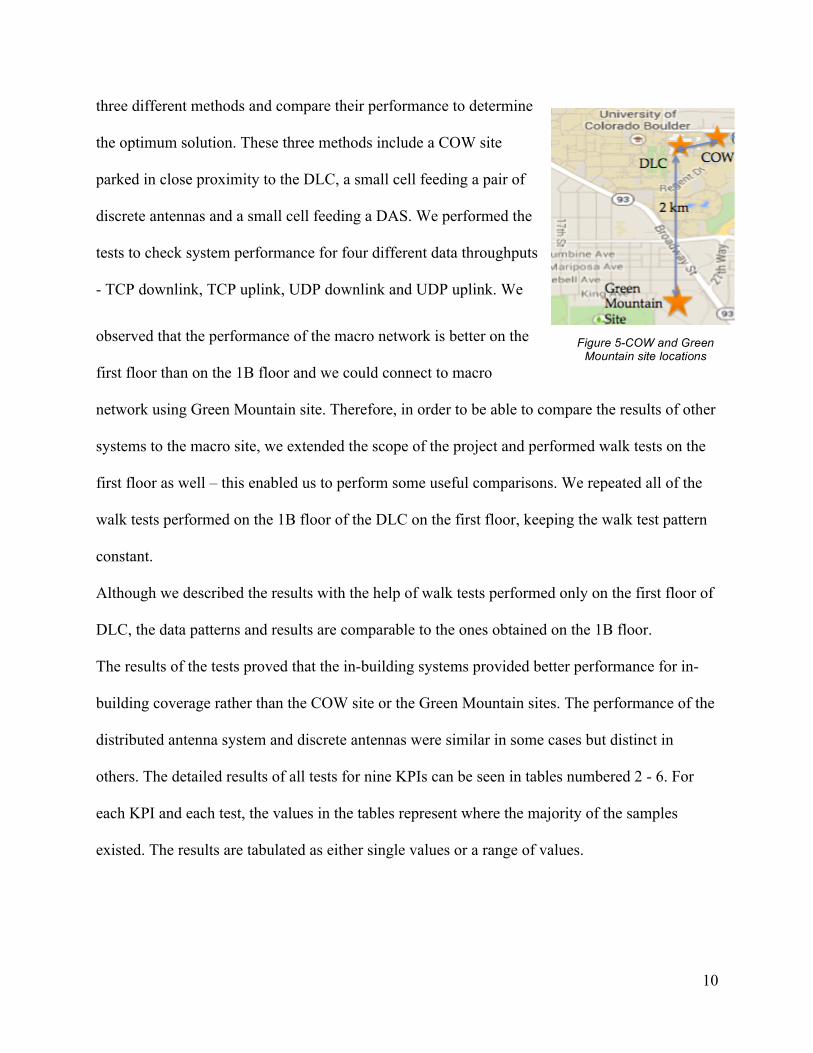
three different methods and compare their performance to determine
the optimum solution. These three methods include a COW site
parked in close proximity to the DLC, a small cell feeding a pair of
discrete antennas and a small cell feeding a DAS. We performed the
tests to check system performance for four different data throughputs
- TCP downlink, TCP uplink, UDP downlink and UDP uplink. We
observed that the performance of the macro network is better on the
first floor than on the 1B floor and we could connect to macro
network using Green Mountain site. Therefore, in order to be able to compare the results of other
systems to the macro site, we extended the scope of the project and performed walk tests on the
first floor as well – this enabled us to perform some useful comparisons. We repeated all of the
walk tests performed on the 1B floor of the DLC on the first floor, keeping the walk test pattern
constant.
Although we described the results with the help of walk tests performed only on the first floor of
DLC, the data patterns and results are comparable to the ones obtained on the 1B floor.
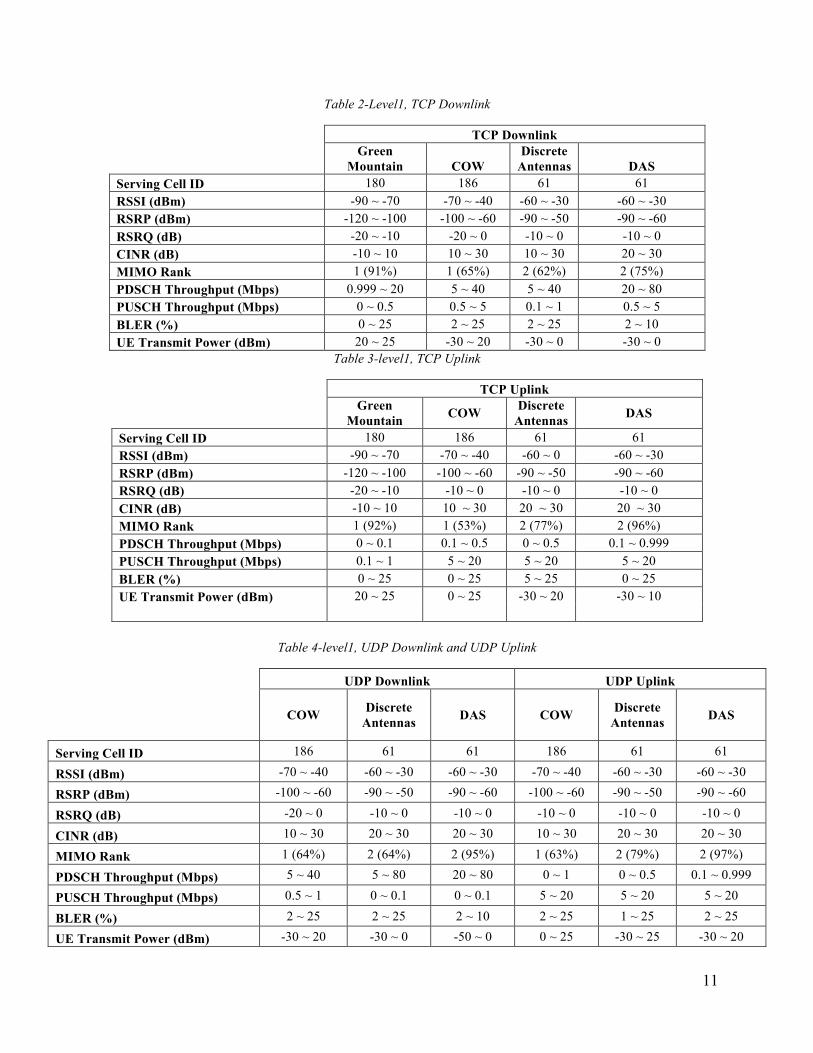
The results of the tests proved that the in-building systems provided better performance for in-
building coverage rather than the COW site or the Green Mountain sites. The performance of the
distributed antenna system and discrete antennas were similar in some cases but distinct in
others. The detailed results of all tests for nine KPIs can be seen in tables numbered 2 - 6. For
each KPI and each test, the values in the tables represent where the majority of the samples
existed. The results are tabulated as either single values or a range of values.
11
Table 2-Level1, TCP Downlink
TCP Downlink
Green Mountain COW
Discrete Antennas DAS
Serving Cell ID 180 186 61 61 RSSI (dBm) -90 ~ -70 -70 ~ -40 -60 ~ -30 -60 ~ -30 RSRP (dBm) -120 ~ -100 -100 ~ -60 -90 ~ -50 -90 ~ -60 RSRQ (dB) -20 ~ -10 -20 ~ 0 -10 ~ 0 -10 ~ 0 CINR (dB) -10 ~ 10 10 ~ 30 10 ~ 30 20 ~ 30 MIMO Rank 1 (91%) 1 (65%) 2 (62%) 2 (75%) PDSCH Throughput (Mbps) 0.999 ~ 20 5 ~ 40 5 ~ 40 20 ~ 80 PUSCH Throughput (Mbps) 0 ~ 0.5 0.5 ~ 5 0.1 ~ 1 0.5 ~ 5 BLER (%) 0 ~ 25 2 ~ 25 2 ~ 25 2 ~ 10 UE Transmit Power (dBm) 20 ~ 25 -30 ~ 20 -30 ~ 0 -30 ~ 0
Table 3-level1, TCP Uplink
TCP Uplink
Green Mountain COW Discrete
Antennas DAS
Serving Cell ID 180 186 61 61 RSSI (dBm) -90 ~ -70 -70 ~ -40 -60 ~ 0 -60 ~ -30 RSRP (dBm) -120 ~ -100 -100 ~ -60 -90 ~ -50 -90 ~ -60 RSRQ (dB) -20 ~ -10 -10 ~ 0 -10 ~ 0 -10 ~ 0 CINR (dB) -10 ~ 10 10 ~ 30 20 ~ 30 20 ~ 30 MIMO Rank 1 (92%) 1 (53%) 2 (77%) 2 (96%) PDSCH Throughput (Mbps) 0 ~ 0.1 0.1 ~ 0.5 0 ~ 0.5 0.1 ~ 0.999 PUSCH Throughput (Mbps) 0.1 ~ 1 5 ~ 20 5 ~ 20 5 ~ 20 BLER (%) 0 ~ 25 0 ~ 25 5 ~ 25 0 ~ 25 UE Transmit Power (dBm) 20 ~ 25 0 ~ 25 -30 ~ 20 -30 ~ 10
Table 4-level1, UDP Downlink and UDP Uplink
UDP Downlink UDP Uplink
COW Discrete Antennas DAS COW Discrete
Antennas DAS
Serving Cell ID 186 61 61 186 61 61
RSSI (dBm) -70 ~ -40 -60 ~ -30 -60 ~ -30 -70 ~ -40 -60 ~ -30 -60 ~ -30
RSRP (dBm) -100 ~ -60 -90 ~ -50 -90 ~ -60 -100 ~ -60 -90 ~ -50 -90 ~ -60
RSRQ (dB) -20 ~ 0 -10 ~ 0 -10 ~ 0 -10 ~ 0 -10 ~ 0 -10 ~ 0
CINR (dB) 10 ~ 30 20 ~ 30 20 ~ 30 10 ~ 30 20 ~ 30 20 ~ 30
MIMO Rank 1 (64%) 2 (64%) 2 (95%) 1 (63%) 2 (79%) 2 (97%)
PDSCH Throughput (Mbps) 5 ~ 40 5 ~ 80 20 ~ 80 0 ~ 1 0 ~ 0.5 0.1 ~ 0.999
PUSCH Throughput (Mbps) 0.5 ~ 1 0 ~ 0.1 0 ~ 0.1 5 ~ 20 5 ~ 20 5 ~ 20
BLER (%) 2 ~ 25 2 ~ 25 2 ~ 10 2 ~ 25 1 ~ 25 2 ~ 25
UE Transmit Power (dBm) -30 ~ 20 -30 ~ 0 -50 ~ 0 0 ~ 25 -30 ~ 25 -30 ~ 20
12
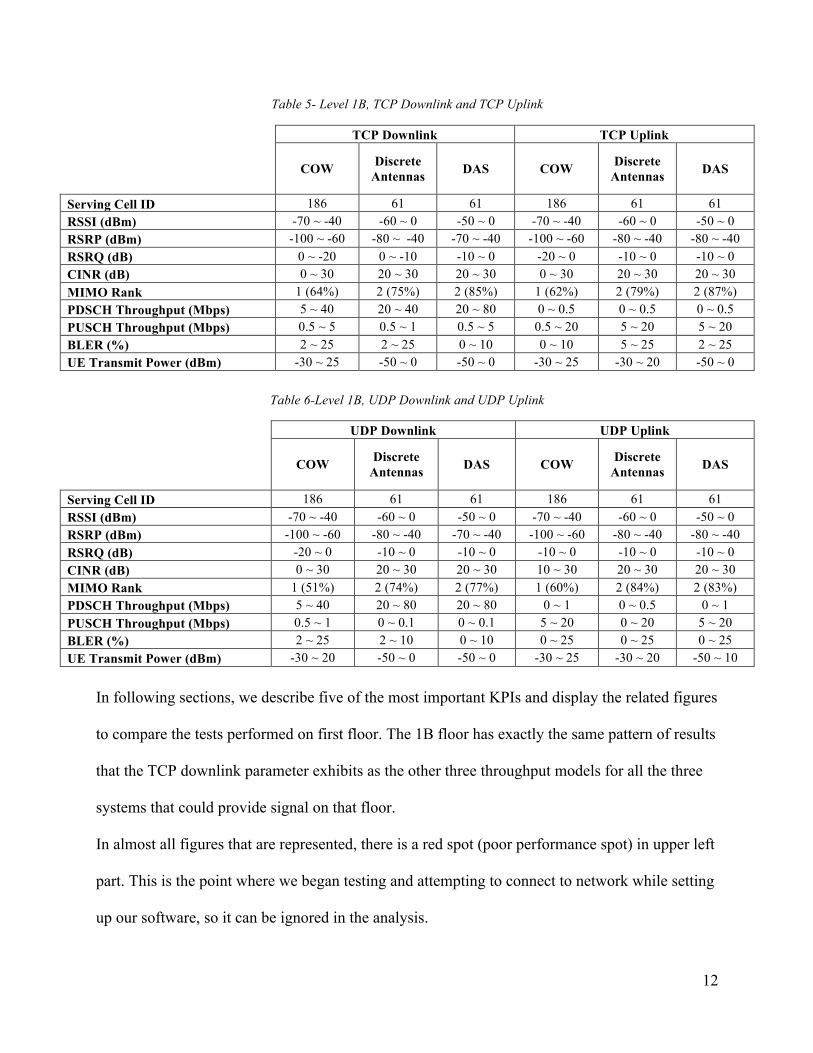
Table 5- Level 1B, TCP Downlink and TCP Uplink
TCP Downlink TCP Uplink
COW Discrete Antennas DAS COW Discrete
Antennas DAS
Serving Cell ID 186 61 61 186 61 61 RSSI (dBm) -70 ~ -40 -60 ~ 0 -50 ~ 0 -70 ~ -40 -60 ~ 0 -50 ~ 0 RSRP (dBm) -100 ~ -60 -80 ~ -40 -70 ~ -40 -100 ~ -60 -80 ~ -40 -80 ~ -40 RSRQ (dB) 0 ~ -20 0 ~ -10 -10 ~ 0 -20 ~ 0 -10 ~ 0 -10 ~ 0 CINR (dB) 0 ~ 30 20 ~ 30 20 ~ 30 0 ~ 30 20 ~ 30 20 ~ 30 MIMO Rank 1 (64%) 2 (75%) 2 (85%) 1 (62%) 2 (79%) 2 (87%) PDSCH Throughput (Mbps) 5 ~ 40 20 ~ 40 20 ~ 80 0 ~ 0.5 0 ~ 0.5 0 ~ 0.5 PUSCH Throughput (Mbps) 0.5 ~ 5 0.5 ~ 1 0.5 ~ 5 0.5 ~ 20 5 ~ 20 5 ~ 20 BLER (%) 2 ~ 25 2 ~ 25 0 ~ 10 0 ~ 10 5 ~ 25 2 ~ 25 UE Transmit Power (dBm) -30 ~ 25 -50 ~ 0 -50 ~ 0 -30 ~ 25 -30 ~ 20 -50 ~ 0
Table 6-Level 1B, UDP Downlink and UDP Uplink
UDP Downlink UDP Uplink
COW Discrete Antennas DAS COW Discrete
Antennas DAS
Serving Cell ID 186 61 61 186 61 61 RSSI (dBm) -70 ~ -40 -60 ~ 0 -50 ~ 0 -70 ~ -40 -60 ~ 0 -50 ~ 0 RSRP (dBm) -100 ~ -60 -80 ~ -40 -70 ~ -40 -100 ~ -60 -80 ~ -40 -80 ~ -40 RSRQ (dB) -20 ~ 0 -10 ~ 0 -10 ~ 0 -10 ~ 0 -10 ~ 0 -10 ~ 0 CINR (dB) 0 ~ 30 20 ~ 30 20 ~ 30 10 ~ 30 20 ~ 30 20 ~ 30 MIMO Rank 1 (51%) 2 (74%) 2 (77%) 1 (60%) 2 (84%) 2 (83%) PDSCH Throughput (Mbps) 5 ~ 40 20 ~ 80 20 ~ 80 0 ~ 1 0 ~ 0.5 0 ~ 1 PUSCH Throughput (Mbps) 0.5 ~ 1 0 ~ 0.1 0 ~ 0.1 5 ~ 20 0 ~ 20 5 ~ 20 BLER (%) 2 ~ 25 2 ~ 10 0 ~ 10 0 ~ 25 0 ~ 25 0 ~ 25 UE Transmit Power (dBm) -30 ~ 20 -50 ~ 0 -50 ~ 0 -30 ~ 25 -30 ~ 20 -50 ~ 10
In following sections, we describe five of the most important KPIs and display the related figures
to compare the tests performed on first floor. The 1B floor has exactly the same pattern of results
that the TCP downlink parameter exhibits as the other three throughput models for all the three
systems that could provide signal on that floor.
In almost all figures that are represented, there is a red spot (poor performance spot) in upper left
part. This is the point where we began testing and attempting to connect to network while setting
up our software, so it can be ignored in the analysis.
13
V. DISCUSSION OF RESULTS
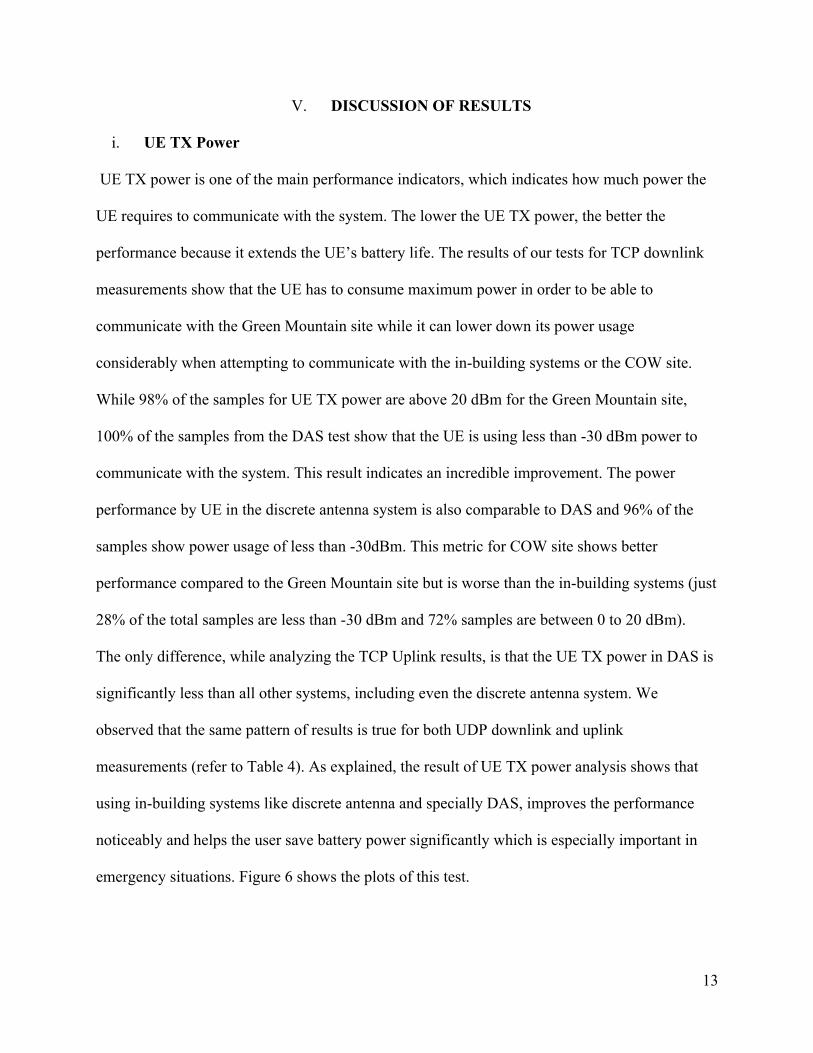
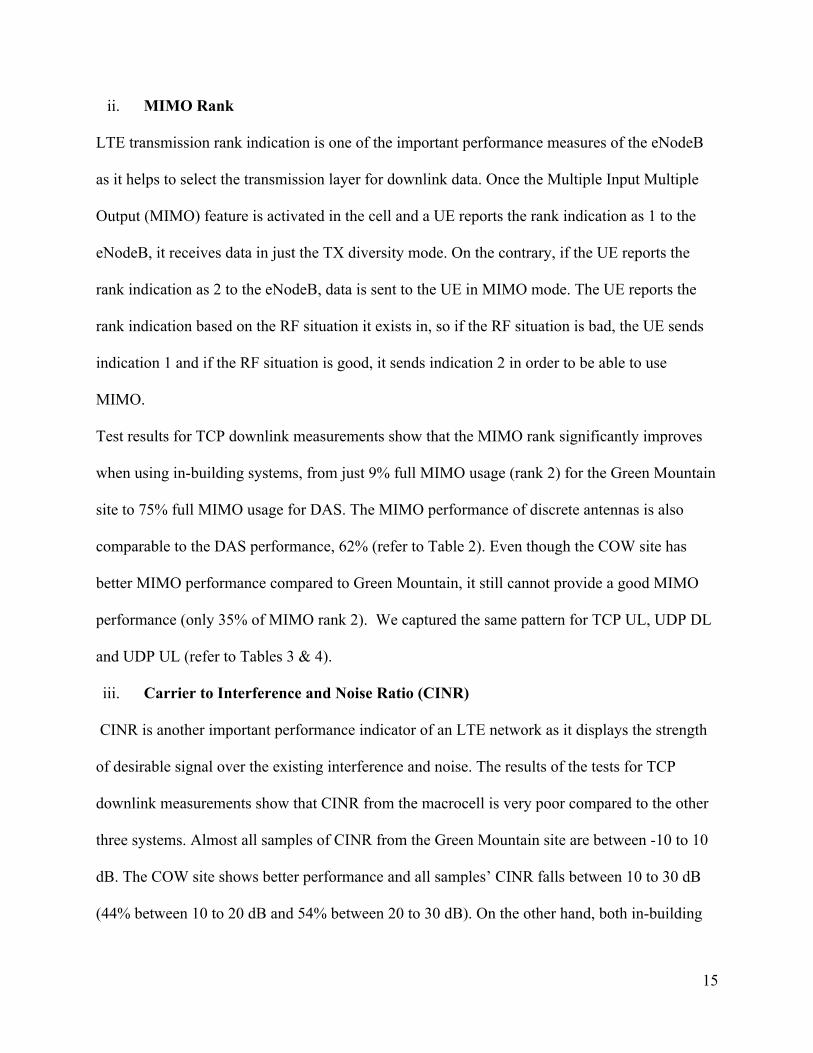
i. UE TX Power
UE TX power is one of the main performance indicators, which indicates how much power the
UE requires to communicate with the system. The lower the UE TX power, the better the
performance because it extends the UE’s battery life. The results of our tests for TCP downlink
measurements show that the UE has to consume maximum power in order to be able to
communicate with the Green Mountain site while it can lower down its power usage
considerably when attempting to communicate with the in-building systems or the COW site.
While 98% of the samples for UE TX power are above 20 dBm for the Green Mountain site,
100% of the samples from the DAS test show that the UE is using less than -30 dBm power to
communicate with the system. This result indicates an incredible improvement. The power
performance by UE in the discrete antenna system is also comparable to DAS and 96% of the
samples show power usage of less than -30dBm. This metric for COW site shows better
performance compared to the Green Mountain site but is worse than the in-building systems (just
28% of the total samples are less than -30 dBm and 72% samples are between 0 to 20 dBm).
The only difference, while analyzing the TCP Uplink results, is that the UE TX power in DAS is
significantly less than all other systems, including even the discrete antenna system. We
observed that the same pattern of results is true for both UDP downlink and uplink
measurements (refer to Table 4). As explained, the result of UE TX power analysis shows that
using in-building systems like discrete antenna and specially DAS, improves the performance
noticeably and helps the user save battery power significantly which is especially important in
emergency situations. Figure 6 shows the plots of this test.
14
Figure 6: UE Tx Power
a. Green Mountain b. COW site
c. Discrete Antennas d. DAS
15
ii. MIMO Rank
LTE transmission rank indication is one of the important performance measures of the eNodeB
as it helps to select the transmission layer for downlink data. Once the Multiple Input Multiple
Output (MIMO) feature is activated in the cell and a UE reports the rank indication as 1 to the
eNodeB, it receives data in just the TX diversity mode. On the contrary, if the UE reports the
rank indication as 2 to the eNodeB, data is sent to the UE in MIMO mode. The UE reports the
rank indication based on the RF situation it exists in, so if the RF situation is bad, the UE sends
indication 1 and if the RF situation is good, it sends indication 2 in order to be able to use
MIMO.
Test results for TCP downlink measurements show that the MIMO rank significantly improves
when using in-building systems, from just 9% full MIMO usage (rank 2) for the Green Mountain
site to 75% full MIMO usage for DAS. The MIMO performance of discrete antennas is also
comparable to the DAS performance, 62% (refer to Table 2). Even though the COW site has
better MIMO performance compared to Green Mountain, it still cannot provide a good MIMO
performance (only 35% of MIMO rank 2). We captured the same pattern for TCP UL, UDP DL
and UDP UL (refer to Tables 3 & 4).
iii. Carrier to Interference and Noise Ratio (CINR)
CINR is another important performance indicator of an LTE network as it displays the strength
of desirable signal over the existing interference and noise. The results of the tests for TCP
downlink measurements show that CINR from the macrocell is very poor compared to the other
three systems. Almost all samples of CINR from the Green Mountain site are between -10 to 10
dB. The COW site shows better performance and all samples’ CINR falls between 10 to 30 dB
(44% between 10 to 20 dB and 54% between 20 to 30 dB). On the other hand, both in-building

16
systems, DAS and Discrete Antenna, have far better CINR performance which shows great
improvement (92% between 20 to 30 dB in DAS and 90% between 20 to 30 dB in Discrete
Antenna). The same pattern can be seen for TCP UL, UDP DL and UDP UL. Figure 7 shows the
plots of this test:
a. Green Mountain
Figure 7: CINR
b. COW site
c. Discrete Antennas d. DAS
17
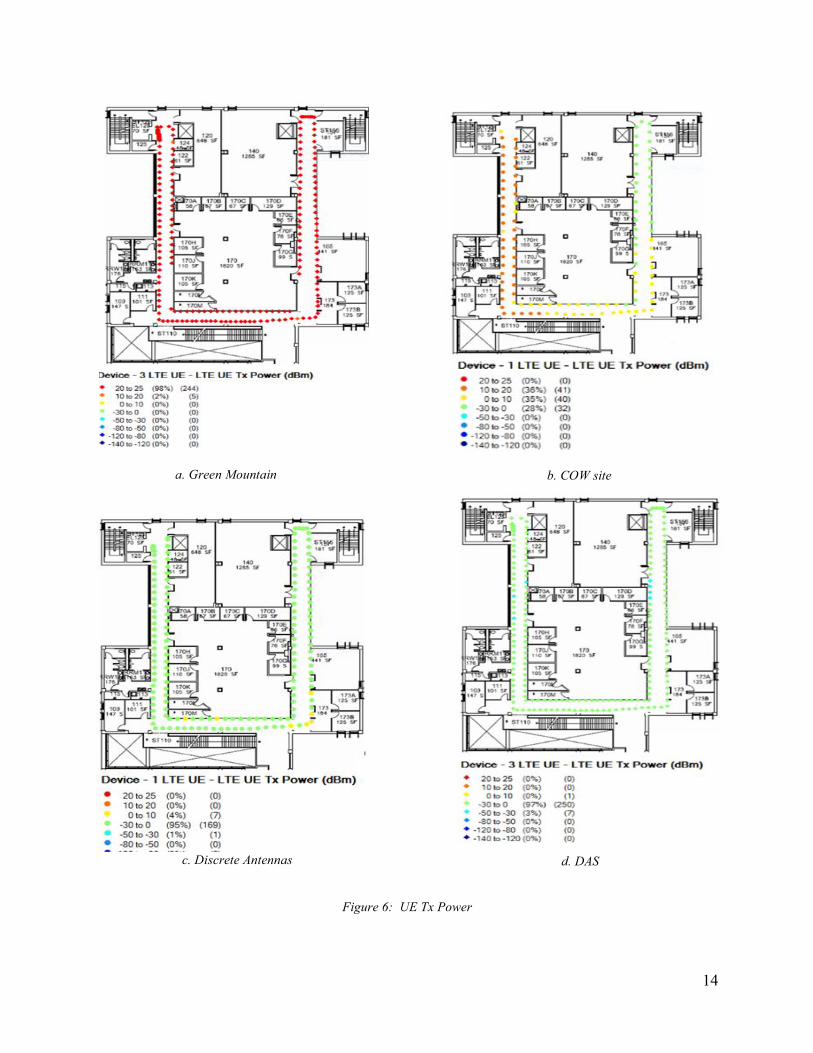
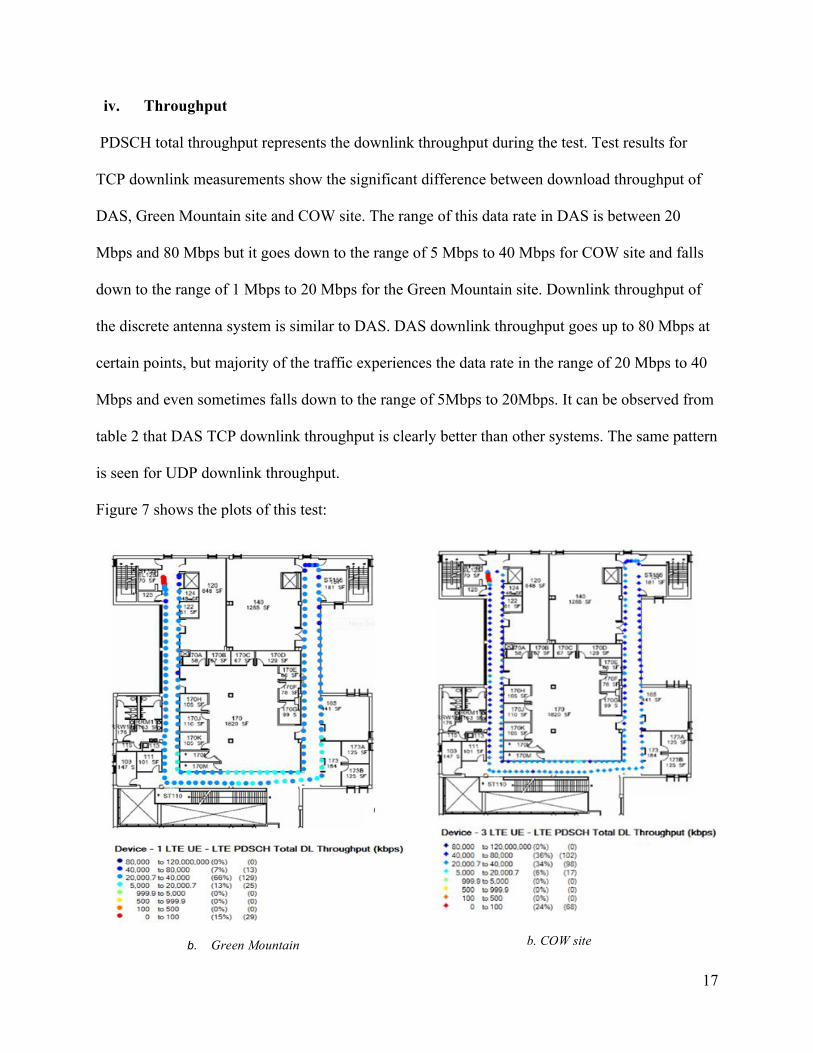
iv. Throughput
PDSCH total throughput represents the downlink throughput during the test. Test results for
TCP downlink measurements show the significant difference between download throughput of
DAS, Green Mountain site and COW site. The range of this data rate in DAS is between 20
Mbps and 80 Mbps but it goes down to the range of 5 Mbps to 40 Mbps for COW site and falls
down to the range of 1 Mbps to 20 Mbps for the Green Mountain site. Downlink throughput of
the discrete antenna system is similar to DAS. DAS downlink throughput goes up to 80 Mbps at
certain points, but majority of the traffic experiences the data rate in the range of 20 Mbps to 40
Mbps and even sometimes falls down to the range of 5Mbps to 20Mbps. It can be observed from
table 2 that DAS TCP downlink throughput is clearly better than other systems. The same pattern
is seen for UDP downlink throughput.
Figure 7 shows the plots of this test:
b. Green Mountain b. COW site

18
PUSCH total throughput represents the uplink throughput during the test. Test results for TCP
uplink measurements show that the uplink throughput for DAS, discrete antenna and COW site
are almost the same and fall between the range of 5Mbps to 20 Mbps. Uplink throughput for the
Green Mountain site is far less than others (mostly between 100 Kbps to 500 Kbps). The exact
same pattern is repeated for UDP uplink throughput.
VI. CONCLUSIONS AND FUTURE RESEARCH
In order to secure people and property from incidents, public safety has to provide appropriate
coverage inside buildings. For this purpose the PSCR department has experimented with
different scenarios to find an optimal solution. As a part of their team, we deployed a distributed
antenna system and compared the performance with already existing or other experimental
systems.
c. Discrete Antennas d. DAS Figure 8: PDSCH Downlink Throughput

19
Despite COW having the advantage of mobility, the results of the tests clearly show that having
an in-building system provides noticeably better coverage than an outdoor solution, COW, which
is our third sub-problem. Between the two types of in-building solutions that we deployed so far,
we believe that DAS offers a better solution. Even though the performance of discrete antennas,
in some cases, closely resembles DAS, the power usage of DAS (200mW) is considerably lower
compared to the discrete antenna system (5W), which is a huge advantage. DAS can help avoid
interference with other systems and enable a safer solution with regard to health concerns of the
people in the vicinity. Therefore, as we had expected and indicated in our hypotheses, DAS
succeeded in providing the best and optimal performance for in-building public safety coverage.
This research can be further progressed in multiple directions. We have deployed the DAS
system on only one floor of the building. It would be interesting to see the results and effects like
RF bleed if DAS is implemented on multiple floors. Different antenna types for the DAS can be
explored to find better solutions. More research efforts can be directed towards experiments with
outdoor DAS.
Furthermore, the economic tradeoffs between these systems and their effects on practical
implementation are yet to be seen. DAS implementation for public safety signals depends on its
suitability with the operational and funding paradigm of the PS (FirstNet), allowing for more
interesting research paths to explore in future.
CINR- clockwise: Macro, DAS, COW, Discrete
DL throughput- clockwise: Macro, DAS, COW, Discrete
REFERENCES
[1] PSCR, Public Safety Broadband Communications. [Online] Available: PSCR database
[2] NIST, NTIA Seek Collaborators for Emergency Communications Demo Network.
[Online] Available: http://www.nist.gov/oles/network.cfm
[3] FCC [Online] Available: http://www.fcc.gov/encyclopedia/700-mhz-spectrum
[4] C. Cox, An introduction to LTE [electronic resource]: LTE, LTE-advanced, SAE, and 4G
mobile communications. Hoboken, NJ: John Wiley & Sons, 2012.
[5] T. Doumi, M. F. Dolan, S. Tatesh, A. Casati, G. Tsirtsis, K. Anchan, D. Flore,
LTE for Public Safety Networks, pp. 106-112. [Online] Available:
http://ieeexplore.ieee.org/xpls/abs_all.jsp?arnumber=6461193
[6] NTIA, Reopening of Comment Period for Development of the Nationwide Interoperable
Public Safety Broadband Network. [Online] Available: http://www.ntia.doc.gov/federal-
register-notice/2012/notice-inquiry-reopening-comment-period-development-nationwide-
interope
[7] NTIA, Nationwide Interoperable Public Safety Broadband Network. [Online] Available:
http://www.ntia.doc.gov/federal-register-notice/2012/comments-nationwide-
interoperable-public-safety-broadband-network-noi?page=3#comment-29574
[8] HetNet Forum, DAS and small cell technologies distinguished. [Online] Available:
http://www.thedasforum.org/wp-content/uploads/2013/11/DAS-and-Small-Cell-
Technologies-Distinguished_HNF.pdf
[9] M. Tolstrup. Indoor Radio Planning: A Practical Guide for GSM, DCS, UMTS and
HSPA. West Sussex, UK: Wiley, 2011.

[10] J. Chiles, Telecommunications Properties, Inc. Installs LTE-DAS System for University.
[Online] Available: http://www.prweb.com/releases/2013/6/prweb10834925.htm
[11] B. Johnk, Phase 1 in building testing. PSCR (2013).