public utilities commission · 2017-03-24 · public utilities commission of the state of...
TRANSCRIPT

STATE OF CALIFORNIA Edmund G. Brown Jr., Governor
PUBLIC UTILITIES COMMISSION
505 VAN NESS AVENUE
SAN FRANCISCO, CA 94102-3298
July 8, 2013
Advice Letter 4227-E
Brian K. Cherry
Vice President, Regulation and Rates
Pacific Gas and Electric Company
77 Beale Street, Mail Code B10C
P.O. Box 770000
San Francisco, CA 94177
Subject: Smart Grid Pilot Deployment Projects Implementation Plan,
Pursuant to D.13-03-032
Dear Mr. Cherry:
Advice Letter 4227-E is effective June 21, 2013.
Sincerely,
Edward F. Randolph, Director
Energy Division

Brian K. Cherry Vice President Regulatory Relations
Pacific Gas and Electric Company 77 Beale St., Mail Code B10C P.O. Box 770000 San Francisco, CA 94177 Fax: 415.973.7226
May 22, 2013
Advice 4227-E (Pacific Gas and Electric Company ID U 39 E)
Public Utilities Commission of the State of California
Subject: Smart Grid Pilot Deployment Projects Implementation Plan, Pursuant
to Decision D.13-03-032
Purpose The purpose of this advice letter is to comply with the Ordering Paragraphs (OP) 11 of Decision (D.) 13-03-032, which directs Pacific Gas and Electric Company (PG&E) to submit a Tier 2 Advice Letter, providing a Pilot Implementation Plan for each Smart Grid pilot deployment project approved by the California Public Utilities Commission (Commission or CPUC).
Background On November 21, 2011, PG&E filed Application (A.) 11-11-017 requesting authorization to recover costs for implementing six Smart Grid Deployment Pilot Projects (SG Pilot) over four years. The SG Pilot projects seek to advance the modernization of PG&E’s electric grid consistent with the policy of the state of California as described in Senate Bill (SB) 17 and PG&E’s Smart Grid Deployment Plan filed with the Commission on June 30, 2011. On March 27, 2013, the Commission issued D.13-03-032 approving four out of the six SG Pilot projects proposed by PG&E in its November 2011 application, including the Smart Grid Line Sensor Pilot Project, the Smart Grid Voltage and Reactive Power Optimization (Volt/VAR) Pilot Project, the Smart Grid Detect and Locate Distribution Line Outages and Faulted Circuit Conditions Project and the Smart Grid Short Term Demand Forecast Pilot Project.
Discussion On May 1, 2013, pursuant to OP 10 of D.13-03-032, PG&E met with Energy Division to discuss and develop details regarding the Pilot Implementation Plan for the four Smart Grid pilot projects that were approved by the CPUC. Specifically, PG&E discussed (a) specific methodologies for the evaluation, measurement, and validation and cost-benefit

Advice 4227-E - 2 - May 22, 2013 processes for each of the approved Smart Grid pilots, (b) an updated schedule for each of the approved pilots with detailed milestones and estimated dates for the end of each phase of each pilot, and (c) expectations for the end of phase status report. Pursuant to OP 11, PG&E submits this Tier 2 advice letter within 30 days following the May 1, 2013, meeting with Commission staff. In the Advice filing, PG&E provides a Pilot Implementation Plan for each Smart Grid pilot project, including final metrics and methodologies, for the evaluation, measurement, and validation and cost-benefit processes and an updated schedule with estimated dates for off-ramps. The Pilot Implementation Plan is included in the enclosed Attachment 1. The Pilot Implementation Plan addresses the following elements for each pilot:
1. New and innovative program design, concepts or technology that have not yet been tested or employed;
2. A specific statement of the concern, gap, or problem that the pilot seeks to address and the likelihood that the issue can be addressed cost-effectively through utility programs;
3. How the pilot matches the characteristics for Smart Grid technologies enumerated in SB 17 * (with three added characteristics adopted in D10-06-047).
4. Specific objectives and goals for the pilot;
5. A clear budget and timeframe to complete the pilot and obtain results. Pilots that are continuations of pilots from previous portfolios should clearly state how it differs from the previous phase;
6. Information on relevant standards or metrics or a plan to develop a standard against which the pilot outcomes can be measured;
7. Where appropriate, propose methodologies to test the cost effectiveness of the pilot;
8. A proposed EM&V plan; and
9. A concrete strategy to identify and disseminate best practices and lessons learned from the pilot to all California utilities and to transfer those practices to resource programs, as well as a schedule and plan to expand the pilot to utility and hopefully statewide usage.
Pursuant to OP 9 of D.13-03-032, PG&E is required to submit a status report via a Tier 2 advice letter within 14 days of the completion of each phase of each approved pilot.
Advice 4227-E - 3 - May 22, 2013
Protests
Anyone wishing to protest this filing may do so by letter sent via U.S. mail, facsimile or E-mail, no later than June 11, 2013, which is 20 days after the date of this filing. Protests must be submitted to:
CPUC Energy Division ED Tariff Unit 505 Van Ness Avenue, 4th Floor San Francisco, California 94102 Facsimile: (415) 703-2200 E-mail: [email protected]
Copies of protests also should be mailed to the attention of the Director, Energy Division, Room 4004, at the address shown above. The protest shall also be sent to PG&E either via E-mail or U.S. mail (and by facsimile, if possible) at the address shown below on the same date it is mailed or delivered to the Commission:
Brian K. Cherry Vice President, Regulatory Relations Pacific Gas and Electric Company 77 Beale Street, Mail Code B10C P.O. Box 770000 San Francisco, California 94177 Facsimile: (415) 973-7226 E-mail: [email protected]
Any person (including individuals, groups, or organizations) may protest or respond to an advice letter (General Order 96-B, Section 7.4). The protest shall contain the following information: specification of the advice letter protested; grounds for the protest; supporting factual information or legal argument; name, telephone number, postal address, and (where appropriate) e-mail address of the protestant; and statement that the protest was sent to the utility no later than the day on which the protest was submitted to the reviewing Industry Division (General Order 96-B, Section 3.11).
Effective Date
PG&E requests that this Tier 2 advice filing become effective on regular notice, June 21, 2013, which is 30 calendar days after the date of filing.

Advice 4227-E - 4 - May 22, 2013
Notice
In accordance with General Order 96-B, Section IV, a copy of this advice letter is being sent electronically and via U.S. mail to parties shown on the attached list and the service list for A.11-11-017. Address changes to the General Order 96-B service list should be directed to PG&E at email address [email protected]. For changes to any other service list, please contact the Commission’s Process Office at (415) 703-2021 or at [email protected]. Send all electronic approvals to [email protected]. Advice letter filings can also be accessed electronically at: http://www.pge.com/tariffs
Vice President, Regulatory Relations Attachments cc: Service List A.11-11-017

Advice 4227-E - 5 - May 22, 2013
ATTACHMENT 1
Pacific Gas and Electric Company Smart Grid Pilot Deployment Projects Implementation Plan
May 22, 2013 The following provides a Pilot Implementation Plan for each Smart Grid pilot project. The implementation plan includes specific objectives and goals of the pilot, metrics and methodologies for the evaluation, measurement, and validation, cost-benefit processes and an updated schedule with estimated dates for off-ramps.
A. Smart Grid Line Sensor Pilot Project
1. New and innovative program design, concepts or technology that have not
yet been tested or employed;
Smart Grid Line Sensors are a new and innovative technology that PG&E has not tested or employed on its distribution system or integrated into its Information Technology (IT) systems. This pilot is not part of the California Energy Systems for the 21st Century Project (CES-21) or the Electric Program Investment Charge (EPIC) programs. This new technology seeks to improve reliability by reducing outage duration and enhance operations and planning information gathering and analysis. Specifically, in piloting this new technology, PG&E will examine its ability to: (1) enhance grid outage detection, problem isolation, and restoration; and (2) enhance grid system safety, monitoring, control and analysis.
2. A specific statement of the concern, gap, or problem that the pilot seeks to
address and the likelihood that the issue can be addressed cost-effectively
through utility programs;
The current technology installed on PG&E’s distribution system requires significant physical inspection to identify the location of an outage cause resulting in longer outage restoration times and higher costs than may be possible using the latest technology. In addition, PG&E operators and engineers rely largely on computer models to determine current flow on the distribution system beyond the substation. The Smart Grid Line Sensor project will focus on testing Smart Grid Line Sensors that will assist in: (1) reducing the outage area to be patrolled improving reliability by reducing response time and outage duration, and (2) provide for more granular loading information to assist in operations, planning decisions and analysis. The use of actual field measurements rather than computer models may enable increased penetration of distributed renewable generation sources by basing interconnection studies and requirements on actual field measurements.

Advice 4227-E - 6 - May 22, 2013
PG&E believes that the Smart Grid Line Sensor project will address these issues cost-effectively and provide significant benefits upon full deployment.
3. How the pilot matches the characteristics for Smart Grid technologies
enumerated in SB 17 * (with three added characteristics adopted in
D.10-06-047);
The Smart Grid Line Sensor project is consistent with increased use of digital information to improve the reliability and efficiency of the grid characteristics listed in SB 17.
a) Be self-healing and resilient – Using real-time information from embedded sensors and automated controls to anticipate, detect, and respond to system problems, a Smart Grid can automatically avoid or mitigate power outages, power quality problems, and service disruptions. (§ 8360 a, b, and d; § 8366 a, e, f, and g.)
The Smart Grid Line Sensor project will install line sensors that detect and communicate to operations personnel via a communications network if outage conditions are detected. Additionally, the installation of line sensors will assist operations and planning personnel to anticipate future system problems including potential overloads and adverse impacts from increased penetration of intermittent power generation sources including rooftop solar PV systems.
b) Empower consumers to
actively participate in
operations of the grid
This is not a major focus area of Smart Grid Line Sensor project.
c) Resist attack – A Smart Grid system should better identify and respond to man-made or natural disruptions. A Smart Grid system using real-time information should enable grid operators to isolate affected areas and redirect power flows around damaged facilities. (§ 8360 a, b, and d; § 8366 a, e, f, and g.)
As described in PG&E’s Smart Grid Deployment Plan, effective cyber security controls and mechanisms are critical to the safe, reliable, and secure operation of Smart Grid technologies. As part of the Smart Grid Line Sensor project, PG&E will evaluate and test system interfaces to ensure security controls are in place. The investment associated with cyber security for this project is limited to secure file transfer systems.
d) Provide higher quality power that will save money
wasted from outages – A Smart Grid system should create and provide more stable and reliable power to reduce down time. (§ 8360 a and b; § 8366 a, e, f,
In addition to improving reliability by reducing outage duration, as described in a) above, the line sensor technology may capture information that can assist operations and engineering personnel in identifying problems causing intermittent or momentary outages or voltage fluctuations adversely impacting
Advice 4227-E - 7 - May 22, 2013
and g.) customer equipment.
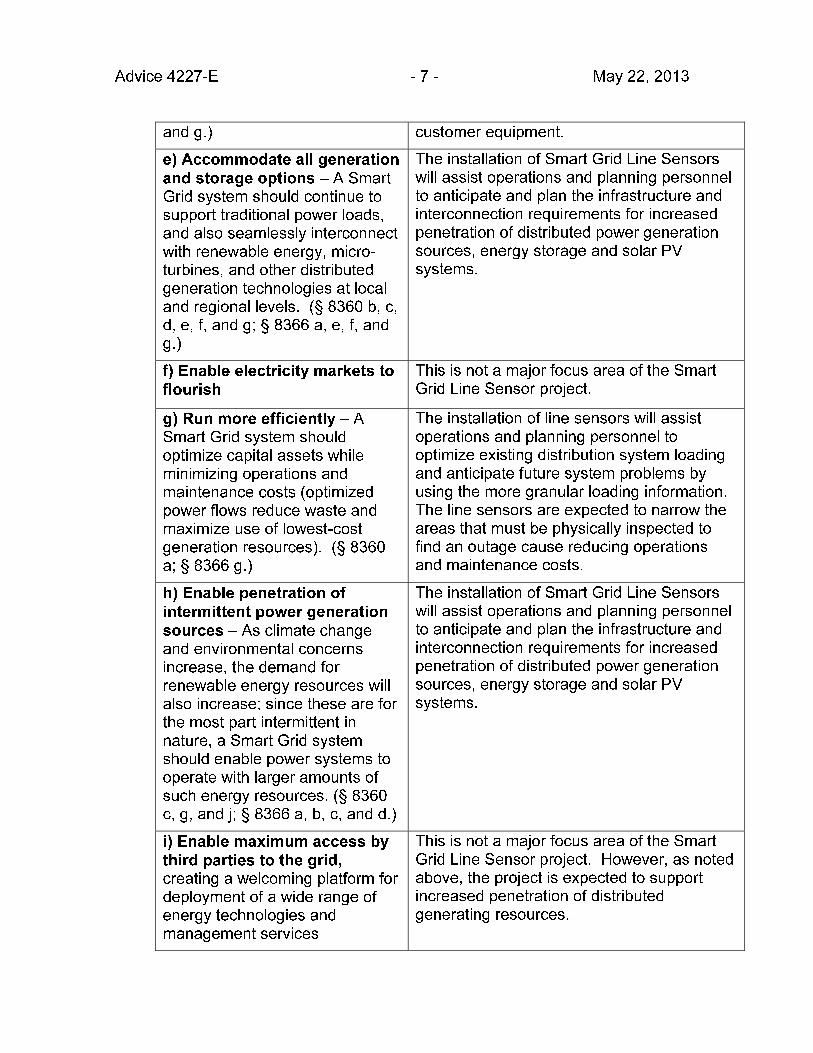
e) Accommodate all generation and storage options – A Smart Grid system should continue to support traditional power loads, and also seamlessly interconnect with renewable energy, micro-turbines, and other distributed generation technologies at local and regional levels. (§ 8360 b, c, d, e, f, and g; § 8366 a, e, f, and g.)
The installation of Smart Grid Line Sensors will assist operations and planning personnel to anticipate and plan the infrastructure and interconnection requirements for increased penetration of distributed power generation sources, energy storage and solar PV systems.
f) Enable electricity markets to
flourish
This is not a major focus area of the Smart Grid Line Sensor project.
g) Run more efficiently – A Smart Grid system should optimize capital assets while minimizing operations and maintenance costs (optimized power flows reduce waste and maximize use of lowest-cost generation resources). (§ 8360 a; § 8366 g.)
The installation of line sensors will assist operations and planning personnel to optimize existing distribution system loading and anticipate future system problems by using the more granular loading information. The line sensors are expected to narrow the areas that must be physically inspected to find an outage cause reducing operations and maintenance costs.
h) Enable penetration of
intermittent power generation
sources – As climate change and environmental concerns increase, the demand for renewable energy resources will also increase; since these are for the most part intermittent in nature, a Smart Grid system should enable power systems to operate with larger amounts of such energy resources. (§ 8360 c, g, and j; § 8366 a, b, c, and d.)
The installation of Smart Grid Line Sensors will assist operations and planning personnel to anticipate and plan the infrastructure and interconnection requirements for increased penetration of distributed power generation sources, energy storage and solar PV systems.
i) Enable maximum access by third parties to the grid, creating a welcoming platform for deployment of a wide range of energy technologies and management services
This is not a major focus area of the Smart Grid Line Sensor project. However, as noted above, the project is expected to support increased penetration of distributed generating resources.

Advice 4227-E - 8 - May 22, 2013
j) Have the infrastructure and policies necessary to enable and support the sale of demand response, energy efficiency, distributed generation, and storage into energy markets as a resource among other things, on equal footing with traditional generation resources; and
This is not a major focus area of the Smart Grid Line Sensor project. However, as noted above, the project is expected to increase the penetration of distributed generating resources.
k) Significantly reduce the total environmental footprint of the current electric generation and delivery system in California.
This is not a major focus area of the Smart Grid Line Sensor project. However, as noted above, the project is expected to increase the penetration of distributed generating resources.
4. Specific objectives and goals for the pilot;
The goal of the Smart Grid Line Sensor Pilot project is to determine how PG&E can further reduce outage response time, improve outage cause location identification accuracy and provide field measurements of line loading information for improved system operations, planning and analysis. To achieve this goal PG&E will undertake a three and a half year pilot that will:
• Identify and assess line sensor technology commercially available in the industry and being used by other utilities.
• Analyze technology requirements to support line sensors deployment and use, including software analysis and visualization applications, cyber security, information architecture, equipment standards and telecommunications.
• In a laboratory environment, test the selected line sensors and identify the specific line sensors and supporting technologies to use for the field trial.
• Deploy the selected line sensor products on up to 30 distribution feeders in a limited number of PG&E’s divisions and proceed to operate, evaluate and demonstrate the project in a field trial.
5. A clear budget and timeframe to complete the pilot and obtain results.
Pilots that are continuations of pilots from previous portfolios should
clearly state how it differs from the previous phase;
The budget and timeframe for the Smart Grid Line Sensors was updated to reflect the approved costs in Decision 13-03-032.

Advice 4227-E - 9 - May 22, 2013
PACIFIC GAS AND ELECTRIC COMPANY
LINE SENSOR PROJECT PILOT COSTS
Line No. Title
2013 Forecast
2014 Forecast
2015 Forecast
2016 Forecast Grand Total
1 Line Sensor Capital $2,304,996 $8,408,355 $2,324,795 $1,882,171 $14,920,317
2 Expense $– $188,259 $606,847 $683,696 $1,478,802
No prior pilots were completed or are in progress for the proposed technology.
6. Information on relevant standards or metrics or a plan to develop a
standard against which the pilot outcomes can be measured;
In its opening testimony filed on November 21, 2011, PG&E provided a listing of metrics used to describe the benefits of full deployment. These are the same metrics plus an additional metric that uses avoided customer outage costs based upon a Value of Service analysis that will be used to evaluate the results of this Smart Grid Line Sensor pilot. The metrics include:
• Avoided O&M costs (savings associated with reduced travel and patrol time)
• System Average Interruption Duration Index (SAIDI), which is also a Smart Grid metric
• Customer Average Interruption Duration Index (CAIDI)
• Avoided customer outage costs based on a Value of Service (VOS) analysis
PG&E will perform a statistical analysis to compare the variation in these metrics with and without the new technology during the analysis and laboratory testing phase and the field trial phase of the project. PG&E will also examine the effectiveness of the field measurement capabilities to improve system analysis. PG&E will utilize industry accepted or CPUC approved models and calculations to update forecasted results and/or compare PG&E’s original projections against actual results.
7. Where appropriate, propose methodologies to test the cost effectiveness of
the pilot;
The methodologies to test the cost effectiveness of the pilot will be designed to capture the information to calculate the before and after metrics and the estimated future deployment costs noted in the response to Question 6 above. The costs to implement the project will be compared to the potential benefits such as avoided O&M costs and avoided customer outage costs using a VOS

Advice 4227-E - 10 - May 22, 2013
analysis to demonstrate the benefits at completion of each phase of the pilot and upon completion of the pilot.
8. A proposed Evaluation, Measurement &Verification (EM&V) plan;
a) Goals and Objectives: The EM&V plan goals and objectives are to test and evaluate the ability of the smart grid line sensors to communicate and display field conditions effectively; the integration of information and data from the line sensors into PG&E’s existing and planned operational, data storage, planning and outage management systems; and identify measurable benefits in terms of improved customer reliability and reduced operations and maintenance costs.
b) Technology Characteristics (hardware/software/peopleware):
New application of an existing technology? –Yes.
Development of a new technology? – No.
Integration of new and existing technologies? – Yes.
Prospective vendors – Sentient, Tollgrade, QinetiQ, Grid Sentry, SEL, Optisense, Cooper Power Systems, GridSense, ABB, General Electric, Siemens and others.
c) Location selection and rationale: The smart grid line sensors are proposed to be installed on PG&E’s distribution main line overhead and underground conductors, not beyond tap line protective devices. The line sensors will be installed at locations on the main line to break up the main line into smaller zones to allow PG&E’s outage systems and operations personnel to go directly to a smaller area to physically patrol for the outage cause rather than the entire mainline. As an example, an outage affecting a 25 mile main line currently requires personnel to drive the entire 25 miles to find the cause of the outage. In comparison, with smart grid line sensors installed every five miles, the amount of miles to patrol would be reduced by one fifth. In the analysis and laboratory test phase, PG&E will install the line sensors and associated IT and telecommunications infrastructure at its test facility in San Ramon. In the field trial phase of the pilot, PG&E will install the smart grid line sensors and associated infrastructure on distribution feeders that have historically shown a need for reliability improvement or present opportunities to demonstrate the capabilities of the technology. The exact locations for the field trial have not been determined but will be determined based on the results of the analysis and laboratory test phase of the project.

Advice 4227-E - 11 - May 22, 2013
d) Project phases, milestones and expected timelines: The project is broken into two distinct phases.
Phase I – Analysis and Laboratory Test Phase, 2013 through 2014
The analysis and laboratory test phase involves: (1) scanning the industry for products that are commercially available, reviewing their specifications, capabilities and vendor viability; (2) finding out which utilities are using the various technologies, data the devices are providing, operational experience and benefits being captured; and (3) test a subset of the commercially available smart grid line sensors that have a high probability of success of efficient integration into PG&E’s systems, provide accurate and required information, are easily installed and integrated into PG&E’s distribution infrastructure and operational systems and will provide benefits expected. This testing will integrate the smart grid line sensors into existing distribution and operational systems, test their specifications including cyber security protection and operations in a laboratory environment to verify their ability to be deployed successfully in the field trial phase of the project. The testing will provide the necessary design and field installation instructions to move from the laboratory environment to the field trial phase. Lastly, systems for collecting and storing data will be put in place along with the necessary analysis tools to assess the expected benefits to justify moving to the next phase in the pilot. Phase I of the Smart Grid Line Sensor Pilot is estimated to be completed by December 2014.
Phase II – Field Trial Phase, 2015 through 2016
The field trial phase will test the successful smart grid line sensors and systems from the analysis and laboratory test phase on up to 30 of PG&E’s distribution circuits in a limited number of PG&E’s divisions. This phase will also provide actual field benefit information to determine if a system roll out project should be proposed after completion of the field trial phase. The Smart Grid Line Sensor Pilot is estimated to be completed by December 2016.
e) Detailed budget and expenditure tracking: PG&E will budget and track expenditures within its current financial systems. The planned budget is provided in item 5 above for this project. PG&E will update this section with actual expenditures upon completion of each phase of the pilot.
f) Measurable data, performance tests or other project outputs, key metrics of success:
Analysis and Laboratory Testing Phase: (1) accuracy of data output, (2) equipment and software systems performance relative to manufacturer

Advice 4227-E - 12 - May 22, 2013
specifications, (3) equipment and software system performance relative to PG&E’s expectations, (4) equipment safety impacts, (5) ease of equipment installation and integration, (6) the ability of equipment to withstand environmental impacts, (7) expected life of equipment, and (8) expected benefits to justify moving to the second phase of the pilot.
Field Trial Phase: (1) accuracy of data output, (2) equipment and software systems performance relative to manufacturer specifications, (3) equipment and software system performance relative to PG&E’s expectations, (4) equipment safety impacts, (5) ease of equipment installation and integration, (6) the ability of equipment to withstand environmental impacts, (7) expected life of equipment, (8) employee training and business process changes necessary for large scale deployment and (9) cost and benefits analysis associated with the project metrics described in Item 6 above for this project.
g) Data collection and analysis procedures: PG&E will determine and test the appropriate data collection and analysis procedures in Phase I, the Analysis and Laboratory Test Phase. PG&E believes at this time that data will be collected using existing data storage systems enhanced specifically for this project so the data is easily accessible for status and analysis.
h) Performance test results:
The information below will be provided after completion of the Analysis and Laboratory Test phase.
1. Performance data collected
2. Technical and market barriers overcome
3. Technical milestones met
4. Significant knowledge gained
5. Unresolved technical or market barriers identified
i) Recommendations for pilot program changes or course corrections:
This information will be provided after completion of the Analysis and Laboratory Test phase.
j) Off-ramp decision point and failure analysis:
The information below will be provided after completion of the Field Trial phase.

Advice 4227-E - 13 - May 22, 2013
1. Products/programs developed as a result – patents filed or received?
2. Projection of how and when measures may be deployed in the marketplace or utility system?
3. Cost/benefit analysis – To the extent it is applicable, PG&E would analyze the costs and benefits of this pilot using the Total Resource Cost test in the Standard Practice Manual. Otherwise, PG&E would anticipate analyzing the costs and benefits using economic analysis that is consistent with similar types of investments.
9. A concrete strategy to identify and disseminate best practices and lessons
learned from the pilot to all California utilities and to transfer those
practices to resource programs, as well as a schedule and plan to expand
the pilot to utility and hopefully statewide usage.
PG&E will include results, best practices and lessons learned from this pilot in its annual Smart Grid report filed at the Commission and available to the public each year. PG&E will provide CPUC Commission staff with its findings and recommendations in the required Tier 2 advice letter after completing the Analysis and Laboratory test phase and Field Trial phase of the pilot project. PG&E will also look for specific opportunities to disseminate best practices at public forums, such as industry conferences, industry organization meetings (i.e., Gridwise Alliance, IEEE, Western Electricity Institute, DistribuTech, etc.), and CPUC-sponsored presentations related to Smart Grid deployment plan progress.
B. Smart Grid Voltage and Reactive Power (Volt/Var) Optimization Pilot Project
1. New and innovative program design, concepts or technology that have not
yet been tested or employed;
The Voltage and Reactive Power (Volt/VAR) Optimization pilot project is an innovative technology that seeks to optimize operating voltage and reactive power resulting in reduced customer energy usage and reduced utility system losses, once deployed in the pilot and pilot indicates broader deployment would benefit customers. Specifically, this project seeks to (1) enhance grid system monitoring and control, (2) manage grid system voltage and losses, and (3) support increased penetration of distributed renewable resources.
PG&E has not deployed or tested a Volt/VAR Optimization system on its distribution system or as part of its information technology (IT) systems. This pilot is not part of the California Energy Systems for the 21st Century Project (CES-21) or the Electric Program Investment Charge (EPIC) programs.

Advice 4227-E - 14 - May 22, 2013
2. A specific statement of the concern, gap, or problem that the pilot seeks to
address and the likelihood that the issue can be addressed cost-effectively
through utility programs;
Current voltage and reactive power management systems deployed by PG&E, and generally throughout the industry, manage distribution system voltage based on a set of scenarios (typically peak demand and minimum demand levels) for the distribution system to maintain voltage within Rule 2 requirements during these “bookend” periods. However, industry studies have shown that a more active, real time optimization regimen can provide improved customer appliance efficiency and reduced distribution system losses. In addition, with increasing levels of distributed solar photovoltaic (PV) generation, tools like a Volt/VAR optimization solution will be required to maintain voltage levels within required regulations. The Volt/VAR Optimization project will focus on testing software that will control and use real-time information from Supervisory Control and Data Acquisition (SCADA)-controlled distribution feeder equipment and SmartMeters™ to manage the distribution circuit voltage. PG&E believes that the Volt/VAR Optimization project will address these issues cost-effectively potentially providing significant benefits upon full deployment.
3. How the pilot matches the characteristics for Smart Grid technologies
enumerated in SB 17 * (with three added characteristics adopted in
D.10-06-047);
The Volt/VAR Optimization project is consistent with increase used of digital information to improve the reliability and efficiency of the grid characteristics listed in SB 17.
a) Be self-healing and resilient This is not a major focus area of the Volt/VAR Optimization project.
b) Empower consumers to actively
participate in operations of the grid
This is not a major focus area of the Volt/VAR Optimization project.
c) Resist attack – A Smart Grid system should better identify and respond to man-made or natural disruptions. A Smart Grid system using real-time information should enable grid operators to isolate affected areas and redirect power flows around damaged facilities. (§ 8360 a, b, and d; § 8366 a, e, f, and g.)
As described in PG&E’s Smart Grid Deployment Plan, effective cyber security controls and mechanisms are critical to the safe, reliable, and secure operation of Smart Grid technologies. As part of the Volt/VAR Optimization project, PG&E will evaluate and test new system interfaces to ensure security controls are in place. The investment associated with cyber

Advice 4227-E - 15 - May 22, 2013
security for this project is limited to secure file transfer systems.
d) Provide higher quality power that will save money wasted from outages – A Smart Grid system should create and provide more stable and reliable power to reduce down time. (§ 8360 a and b; § 8366 a, e, f, and g.)
The Volt/VAR Optimization project will optimize the distribution primary and secondary voltage creating stable and reliable voltage levels necessary for improved power quality.
e) Accommodate all generation and storage options – A Smart Grid system should continue to support traditional power loads, and also seamlessly interconnect with renewable energy, micro-turbines, and other distributed generation technologies at local and regional levels. (§ 8360 b, c, d, e, f, and g; § 8366 a, e, f, and g.)
The Volt/VAR Optimization project will demonstrate the ability of PG&E’s current distribution system to reliably and cost-effectively integrate and manage the variations in voltage associated with distributed generation, especially solar PV generation.
f) Enable electricity markets to
flourish – A Smart Grid system should create an open marketplace where alternative energy sources from geographically distant locations can easily be sold to customers wherever they are located. Intelligence in distribution grids should enable small producers to generate and sell electricity at the local level using alternative sources such as rooftop-mounted photo voltaic panels, small-scale wind turbines, and micro hydro generators. (§ 8360 b, c, d, e, f, g, h, i, and j; § 8366 a, b, c, and d.)
The Volt/VAR Optimization project will demonstrate the ability of PG&E’s current distribution system to reliably and cost-effectively integrate and manage the variations in voltage associated with distributed generation, especially solar PV generation, to support sustainable markets for these resources.
g) Run more efficiently – A Smart Grid system should optimize capital assets while minimizing operations and maintenance costs (optimized power flows reduce waste and maximize use of lowest-cost generation resources). (§ 8360 a; § 8366 g.)
The Volt/VAR Optimization project uses real time information from SCADA monitored and controlled distribution devices and SmartMeters™ to manage the distribution circuit voltage from the substation to the customer service point (distribution primary, secondary and service systems). By managing the distribution circuit voltage, PG&E can reduce distribution system losses and

Advice 4227-E - 16 - May 22, 2013
improve customer appliance efficiencies assisting customers in reducing their energy usage.
h) Enable penetration of intermittent power generation sources – As climate change and environmental concerns increase, the demand for renewable energy resources will also increase; since these are for the most part intermittent in nature, a Smart Grid system should enable power systems to operate with larger amounts of such energy resources. (§ 8360 c, g, and j; § 8366 a, b, c, and d.)
The Volt/VAR Optimization project will demonstrate the ability of PG&E’s current distribution system to reliably and cost-effectively integrate and manage the variations in voltage associated with distributed generation, especially solar PV generation.
i) Enable maximum access by third
parties to the grid, creating a welcoming platform for deployment of a wide range of energy technologies and management services;
This is not a major focus area of the Volt/VAR Optimization project. However, managing distribution system voltage is critical to enable increased use of distributed renewable resources owned and operated by third parties.
j) Have the infrastructure and policies
necessary to enable and support the
sale of demand response, energy
efficiency, distributed generation, and
storage into energy markets as a resource among other things, on equal footing with traditional generation resources; and
The Volt/VAR Optimization project may provide the ability for distribution operators to reduce the distribution system voltage during system or local emergencies supporting demand response capabilities. In addition, the Volt/VAR Optimization project may improve management of distribution system voltage which is critical to enable increased use of distributed renewable resources owned and operated by third parties.
k) Significantly reduce the total environmental footprint of the current electric generation and delivery system in California.
The Volt/VAR Optimization solution is expected to be able to reduce distribution system losses and improve customer appliance efficiency resulting in reduced need for electric generation and the associated environmental impacts in California.

Advice 4227-E - 17 - May 22, 2013
4. Specific objectives and goals for the pilot;
The goal of the Volt/VAR optimization pilot project is to evaluate the ability of different systems to reduce customer energy usage and reduce utility system losses by managing the distribution voltage and devices from the substation to the customer’s service point. To do so,
• PG&E will assess the Volt/VAR optimization systems available in the industry in production and or being used by other utilities to identify solutions that will meet PG&E’s needs.
• PG&E will analyze and identify the technology requirements necessary to support Volt/VAR optimization system implementation.
• In a laboratory environment, test the selected Volt/VAR optimization systems and devices and identify the specific solution and supporting technologies to use for the field pilot. The laboratory testing will include a benefits assessment that will be used to support a recommendation to proceed to the field trial stage of the pilot project.
• Finally, following successful lab testing, PG&E will field trial the Volt/VAR optimization and telecommunications system on up to 12 distribution feeders in a limited number of PG&E’s divisions.
5. A clear budget and timeframe to complete the pilot and obtain results.
Pilots that are continuations of pilots from previous portfolios should
clearly state how it differs from the previous phase;
The budget and timeframe for the Volt/VAR Optimization pilot was updated to reflect the approved costs in the final decision.
PACIFIC GAS AND ELECTRIC COMPANY
VOLT/VAR OPTIMIZATION PILOT COSTS
Line No. Title
2013 Forecast
2014 Forecast
2015 Forecast
2016 Forecast Grand Total
1 VVO – Volt Var Optimization
Capital $2,032,566 $15,772,070 $9,288,284 $8,572,582 $35,665,503
2 Expense $– $282,567 $876,135 $959,896 $2,118,598
There are no prior pilots completed or in progress for Volt/Var Optimization project.
6. Information on relevant standards or metrics or a plan to develop a
standard against which the pilot outcomes can be measured;

Advice 4227-E - 18 - May 22, 2013
In the Workpapers Supporting Chapter 1, Smart Grid Policy, at page 1-3, PG&E provided metrics used to consider the benefits of full deployment which will be additionally used to evaluate the results of the Volt/VAR optimization pilot. The metrics are:
• Avoided energy and procurement costs
• Avoided Generation Capacity procurement costs
• Avoided CO2 emissions
PG&E will measure results in the laboratory in Phase 1 of the pilot and actual system results in Phase 2 of the pilot, perform a statistical analysis to compare the variation in these metrics with and without the new technology and develop projections of the benefits if the technology is deployed at a wider scale. PG&E will utilize industry accepted or CPUC approved models and calculations to update forecasted results and/or compare PG&E’s original projections against actual results.
7. Where appropriate, propose methodologies to test the cost effectiveness of
the pilot;
The methodologies to test the cost effectiveness of the pilot will be designed to capture the information to calculate the before and after metrics and future deployment costs noted in the response to question 6 above. The costs to implement the project will be compared to the potential benefits such as avoided O customer outage energy costs to demonstrate the benefits at completion of each phase of the pilot and upon completion of the pilot.
8. A proposed Evaluation, Measurement &Verification (EM&V) plan;
a) Goals and Objectives: The EM&V plan goal and objective is to test and evaluate the ability of the Volt/VAR Optimization system to manage the primary and secondary voltages; communicate effectively using commercially available telecommunications systems; integrate the information and data from the Volt/VAR Optimization system controlled substation and line equipment into PG&E’s existing operational, data storage, planning and SCADA management systems; and provide measurable benefits to customers.
b) Technology Characteristics (hardware/software/peopleware):
New application of an existing technology? – Yes.
Development of a new technology? – No
Integration of new and existing technologies? – Yes.

Advice 4227-E - 19 - May 22, 2013
Prospective vendors – Cooper, Telvent, ABB, IBM, Lockheed Martin, GE, Areva, Alstom Grid, Siemens, Utilidata, Silver Springs and others.
c) Location selection and rationale: The primary Volt/VAR Optimization system cost reduction benefits are comprised of reduced customer and utility system losses, which tend to be higher on more heavily loaded circuits. Therefore, a Volt/VAR Optimization system provides the maximum cost reduction benefit when installed on highly loaded distribution circuits that have multiple stages of voltage regulation devices. In addition, the Volt/VAR Optimization system benefits associated with integrating higher levels of distributed solar PV systems are most effective on circuits with higher penetrations of solar PV generation. Based upon these factors, PG&E will install the Volt/VAR Optimization system in a laboratory environment in San Ramon and simulate heavily loaded circuits and circuits with high penetrations of solar PV generation in the first phase of the pilot. PG&E plans to select actual circuits on its distribution system that meet these same characteristics for the field trial phase of the pilot. PG&E may adjust this selection criteria as it learns more about the maximum benefit potential over the course of the analysis and test phase and filed trial phase.
d) Project phases, milestones and expected timelines: The project is broken out into two distinct phases.
Phase I – Analysis and Laboratory Test Phase, 2013 and 2014
The analyze and laboratory test phase involves: (1) assessing commercially available Volt/VAR Optimization system products, reviewing the manufacturer’s specifications and capabilities relative to PG&E’s performance requirements and integration with existing systems as well as vendor performance and viability; (2) benchmarking with other utilities to assess industry experience with the technology provided by various vendors, assess operating performance and benefits and new innovations developed through actual field usage; and (3) test a small subset of Volt/VAR Optimization systems that have a high probability of successful integration into PG&E’s system, providing accurate and necessary results, and being used by operators and engineers to change system operations practices to achieve the targeted benefits. The proposed pilot will integrate the Volt/VAR Optimization system into existing distribution and operational systems, test performance against specifications and operation in a lab environment to verify the ability to be deployed successfully in the field trial phase. The testing will also provide the necessary design, field installation and operating instructions and training for the project to move from the laboratory environment to the field trial phase. Lastly, systems will be put in place for collecting, storing, analyzing and extrapolating data necessary to assess the benefits relative to expectations. These tools and

Advice 4227-E - 20 - May 22, 2013
resulting analyses will be used to justify moving to the field trial phase of the pilot and will be used to assess this second phase of the pilot. Phase I of the Volt/Var Optimization Pilot is estimated to be completed by December 2014.
Phase II – Field Trial Phase, 2015 and 2016
The field trial phase of the pilot will involve the installation and performance testing of the best Volt/VAR Optimization system or systems identified in the first phase on up to 12 of PG&E’s actual distribution circuits. The field trial phase of the pilot will provide actual field benefit information to determine if a wider scale technology deployment would be appropriate and cost effective. The Volt/VAR Optimization Pilot is estimated to be completed by December 2016.
e) Detailed budget and expenditure tracking: PG&E will budget and track expenditures in its current financial systems as it would any other project. The planned budget is provided in item 5 under this project. PG&E will update this section with actual expenditures upon completion of each phase of the pilot.
f) Measurable data, performance tests or other project outputs, key metrics of success:
Analysis and Laboratory Testing Phase: (1) accuracy of data output, (2) equipment and software systems performance relative to manufacturer specifications, (3) equipment and software system performance relative to PG&E’s expectations, (4) equipment safety impacts, (5) ease of equipment installation and integration, (6) the ability of equipment to withstand environmental impacts, (7) expected life of equipment, and (8) expected benefits to justify moving to the second phase of the pilot.
Field Trial Phase: (1) accuracy of data output, (2) equipment and software systems performance relative to manufacturer specifications, (3) equipment and software system performance relative to PG&E’s expectations, (4) equipment safety impacts, (5) ease of equipment installation and integration, (6) the ability of equipment to withstand environmental impacts, (7) expected life of equipment, (8) employee training and business process changes necessary for large scale deployment and (9) cost and benefits analysis associated with the project metrics described in Item 6 above for this project.
g) Data collection and analysis procedures: PG&E will determine the appropriate data collection and analysis procedures in Phase I, the Analysis and Laboratory Test Phase. PG&E believes at this time that data will be collected using existing data management systems enhanced

Advice 4227-E - 21 - May 22, 2013
specifically for this project so the data is easily accessible for status and analysis.
h) Performance test results:
The information below will be provided after completion of the Analysis and Laboratory Test phase.
1. Performance data collected
2. Technical and market barriers overcome
3. Technical milestones met
4. Significant knowledge gained
5. Unresolved technical or market barriers
i) Recommendations for pilot program changes or course corrections
This information will be provided after completion of the Analysis and Laboratory Test phase.
j) Off-ramp decision point and failure analysis
The information below will be provided after completion of the Field Trial phase.
1. Products/programs developed as a result – patents filed or
received?
2. Projection of how and when measures may be deployed in the
marketplace or utility system?
3. Cost/benefit analysis – To the extent applicable, PG&E would
analyze the costs and benefits of this pilot using the Total Resource
Cost test in the Standard Practice Manual. Otherwise, PG&E
would anticipate analyzing the costs and benefits using economic
analysis that is consistent with similar types of investments.
9. A concrete strategy to identify and disseminate best practices and lessons
learned from the pilot to all California utilities and to transfer those
practices to resource programs, as well as a schedule and plan to expand
the pilot to utility and hopefully statewide usage.

Advice 4227-E - 22 - May 22, 2013
PG&E will include results of this pilot in its annual Smart Grid report filed at the Commission and available to the public each year. PG&E will include best practices and lessons learned in that report. PG&E will provide CPUC staff with its findings and recommendations in the required Tier 2 advice letter after completing the Analysis and Laboratory test phase and Field Trial phase of the pilot project.
PG&E will also look for specific opportunities to disseminate best practices at public forums, such as industry conferences, industry organization meetings (i.e., Gridwise Alliance, IEEE, Western Electricity Institute, DistribuTech, etc.), and CPUC-sponsored presentations related to Smart Grid deployment plan progress.
C. Smart Grid Detect and Locate Distribution Line Outages and Faulted Circuit
Conditions Project
1. New and innovative program design, concepts or technology that have not
yet been tested or employed;
The Detect and Locate Distribution Line Outages and Faulted Circuit Conditions project seeks to test new and innovative technology aimed at improving system safety and reliability. Through this new technology, PG&E seeks to: (1) enhance grid outage detection, isolation, and restoration; (2) enhance grid system safety by identifying previously undetected and potentially hazardous conditions on the grid and (3) enhance monitoring and control of the grid consistent with SB 17 Smart Grid characteristics.
PG&E has not previously tested or employed any portion of the Detect and Locate Distribution Line Outages and Faulted Circuit Conditions Project on its distribution or information technology (IT) systems. This pilot is not part of the California Energy Systems for the 21st Century Project (CES-21) or the Electric Program Investment Charge (EPIC) programs.
2. A specific statement of the concern, gap, or problem that the pilot seeks to
address and the likelihood that the issue can be addressed cost-effectively
through utility programs;
PG&E currently relies on a number of manual processes to locate the cause of an outage or to identify conditions on its distribution system that could present a hazard to the public. These procedures, while generally accepted industry practices, could be improved through the use of new technology that collects and analyses information available from circuit breaker relays, new smart grid line sensors as described in the Smart Grid Line Sensor Pilot project above, Smart Meters and potentially other sources. With currently available technology, PG&E may be able to automate or more quickly analyze available data to help

Advice 4227-E - 23 - May 22, 2013
operators more precisely pinpoint problems to speed outage restoration and identify previously undetected conditions that could pose a hazard to the public.
PG&E believes that the Detect and Locate Distribution Line Outages and Faulted Circuit Conditions Project will address these issues cost-effectively with significant benefits upon full deployment.
3. How the pilot matches the characteristics for Smart Grid technologies
enumerated in SB 17 * (with three added characteristics adopted in
D.10-06-047).
The Detect and Locate Distribution Line Outages and Faulted Circuit Conditions project is consistent with increased used of digital information to improve the reliability and efficiency of the grid characteristics listed in SB 17.
a) Be self-healing and resilient
– Using real-time information from embedded sensors and automated controls to anticipate, detect, and respond to system problems, a Smart Grid can automatically avoid or mitigate power outages, power quality problems, and service disruptions. (§ 8360 a, b, and d; § 8366 a, e, f, and g.)
The Detect and Locate Distribution Line Outages and Faulted Circuit Conditions project uses real time information from embedded sensors to more precisely identify actual locations of damaged equipment. Additionally, this system may be able to use waveform analysis capability to avoid an outage and assist in finding and resolving power quality issues impacting sensitive customers.
b) Empower consumers to
actively participate in
operations of the grid
This is not a major focus area of the Detect and Locate Distribution Line Outages and Faulted Circuit Conditions project.
c) Resist attack – A Smart Grid system should better identify and respond to man-made or natural disruptions. A Smart Grid system using real-time information should enable grid operators to isolate affected areas and redirect power flows around damaged facilities. (§ 8360 a, b, and d; § 8366 a, e, f, and g.)
As described in PG&E’s Smart Grid Deployment Plan, effective cyber security controls and mechanisms are critical to the safe, reliable, and secure operation of Smart Grid technologies. As part of the Detect and Locate Distribution Line Outages and Faulted Circuit Conditions project, PG&E will evaluate and test new system interfaces to ensure security controls are in place. The investment associated with cyber security for this project is limited to secure file transfer systems.
d) Provide higher quality power that will save money wasted from outages – A Smart
The Detect and Locate Distribution Line Outages and Faulted Circuit Conditions project may be able to use waveform

Advice 4227-E - 24 - May 22, 2013
Grid system should create and provide more stable and reliable power to reduce down time. (§ 8360 a and b; § 8366 a, e, f, and g.)
analysis capability to avoid an outage and assist in finding and resolving power quality issues impacting sensitive customers.
e) Accommodate all generation and storage options
This is not a major focus area of the Detect and Locate Distribution Line Outages and Faulted Circuit Conditions project.
f) Enable electricity markets to flourish
This is not a major focus area of the Detect and Locate Distribution Line Outages and Faulted Circuit Conditions project.
g) Run more efficiently – A Smart Grid system should optimize capital assets while minimizing operations and maintenance costs (optimized power flows reduce waste and maximize use of lowest-cost generation resources). (§ 8360 a; § 8366 g.)
The installation of the Detect and Locate Distribution Line Outages and Faulted Circuit Conditions project is expected to narrow the areas that must be physically inspected to find an outage cause reducing operations and maintenance costs.
h) Enable penetration of
intermittent power generation
sources
This is not a major focus area of the Detect and Locate Distribution Line Outages and Faulted Circuit Conditions project.
i) Enable maximum access by
third parties to the grid
This is not a major focus area of the Detect and Locate Distribution Line Outages and Faulted Circuit Conditions project.
j) Have the infrastructure and
policies necessary to enable and support the sale of
demand response, energy
efficiency, distributed generation, and storage
This is not a major focus area of the Detect and Locate Distribution Line Outages and Faulted Circuit Conditions project.
k) Significantly reduce the total
environmental footprint
This is not a major focus area of the Detect and Locate Distribution Line Outages and Faulted Circuit Conditions project.
4. Specific objectives and goals for the pilot;
The goal of this project is to evaluate, through the use of a fault analysis software system or systems, plausible improvements in locating failed equipment that

Advice 4227-E - 25 - May 22, 2013
cause outages, identifying previously undetected conditions that could pose a hazard to the public and determine if there are additional benefits of providing more accurate outage locations to utility first responders. To do so,
• PG&E will assess the fault analysis systems available in the industry in production and or being used by other utilities to identify solutions that will meet PG&E’s needs.
• PG&E will analyze and identify the technology requirements necessary to support fault analysis system implementation.
• In a laboratory environment, PG&E will test the selected fault analysis systems and devices and identify the specific solution and supporting technologies to use for the field pilot. The laboratory testing will include a benefits assessment that will be used to support a recommendation to proceed to the field trial stage of the pilot project.
• Finally, following successful lab testing, PG&E will field trial the fault analysis systems and telecommunications system on up to 15 distribution feeders in a limited number of PG&E’s divisions.
5. A clear budget and timeframe to complete the pilot and obtain results.
Pilots that are continuations of pilots from previous portfolios should
clearly state how it differs from the previous phase;
The budget and timeframe for the Detect and Locate Distribution Line Outages and Faulted Circuit Conditions Project was updated to reflect the approved costs in the final decision.
PACIFIC GAS AND ELECTRIC COMPANY
DETECT AND LOCATE DISTRIBUTION LINE OUTAGES AND
FAULTED CIRCUIT CONDITIONS PROJECT PILOT COSTS
Line No.
2013 Forecast
2014 Forecast
2015 Forecast
2016 Forecast Grand Total
1 Capital $1,559,972 $8,007,724 $1,262,585 $1,207,497 $12,037,778
2 Expense $– $99,753 $239,446 $253,091 $592,289
No prior pilots were completed or are in progress for the proposed technology
6. Information on relevant standards or metrics or a plan to develop a
standard against which the pilot outcomes can be measured;
PG&E provided a listing of metrics in the Workpapers supporting Chapter 1, Smart Grid Policy, at page 1-2, for which it used to consider the benefits of full

Advice 4227-E - 26 - May 22, 2013
deployment. These are the same metrics that will be used to evaluate the results of the pilot. The metrics include the following:
• Avoided O&M costs (savings associated with reduced travel and patrol time).
• System Average Interruption Duration Index (SAIDI), which is also a Smart Grid metric.
• Customer Average Interruption Duration Index (CAIDI).
• System Average Interruption Frequency Index (SAIFI), which is also a Smart Grid metric.
• Momentary Average Interruption Frequency Index (MAIFI), which is also a Smart Grid metric.
• Avoided customer outage costs based on a Value of Service (VOS) analysis.
PG&E will perform a statistical analysis to compare the variation in these metrics with and without the new technology during the analysis and laboratory testing phase and the field trial phase of the project. PG&E will utilize industry accepted and/or CPUC approved models and calculations to update forecasted results and or compare PG&E’s original projections against actual results.
7. Where appropriate, propose methodologies to test the cost effectiveness of
the pilot;
The methodologies to test the cost effectiveness of the pilot will be designed to capture the information to calculate the before and after metrics and future deployment costs noted in the response to question 6 above. The costs to implement the project will be compared to the potential benefits such as avoided O&M costs and avoided customer outage costs using a VOS analysis to demonstrate the benefits at completion of each phase of the pilot and upon completion of the pilot.
8. A proposed Evaluation, Measurement &Verification (EM&V) plan;
a) Goals and Objectives: The EM&V plan goal and objective is to test and evaluate the ability of the fault analysis system to perform effectively; verify the information and data from the fault analysis system is integrated into PG&E’s existing operational systems, data management and storage, planning and outage management systems effectively; and provide measurable benefits to customers. Additionally, this project will seek to put in place and evaluate a system that can identify and de-energize high impedance faults to address previously undetected and potentially hazardous conditions to improve public safety.

Advice 4227-E - 27 - May 22, 2013
b) Technology Characteristics (hardware/software/peopleware):
New application of an existing technology? – Yes.
Development of a new technology? – No.
Integration of new and existing technologies? – Yes.
Prospective vendors – Cooper, Utilidata, ABB, GE, Areva, Siemens, Alstom Grid and others.
c) Location selection and rationale: The primary benefits of the Detect and Locate Distribution Line Outages and Faulted Circuit Conditions are improved system safety, reliability and reduced operating costs. Therefore, the fault analysis system is proposed to be installed on distribution circuits that have all overhead, all underground and combined overhead and underground conductors. PG&E believes that there will be more time savings and outage time reduction associated with more quickly finding damaged equipment on the underground system rather than the overhead system. However, the number of underground outages is smaller than the number of overhead outages. Therefore, PG&E believes that using this system on all types of circuits is beneficial. Additionally, the longer the circuit, the greater the potential for savings when compared to the time to patrol a shorter circuit to find the damaged equipment. Overhead circuits tend to be longer than underground circuits. Based upon these factors, PG&E will install the fault analysis system in a laboratory environment in San Ramon and simulate the different overhead and underground circuit combinations in the first phase of the pilot. PG&E plans to select actual circuits on its distribution system that meet these same characteristics for the field trial phase of the pilot. PG&E may adjust this selection criteria as it learns more about the maximum benefit potential over the course of the analysis and laboratory test phase and field trial phase.
d) Project phases, milestones and expected timelines: The project is broken out into two distinct phases.
Phase I – Analysis and Laboratory Test Phase, 2013 and 2014
The analyze and laboratory test phase involves: (1) assessing commercially available fault analysis system products , reviewing the manufacturer’s specifications and capabilities relative to PG&E’s performance requirements and integration with existing systems as well as vendor performance and viability; (2) benchmarking with other utilities to assess industry experience with the technology provided by various vendors, assess operating performance and benefits and new innovations

Advice 4227-E - 28 - May 22, 2013
developed through actual field usage; and (3) testing a small subset of fault analysis systems that have a high probability of successful integration into PG&E’s system, providing accurate and necessary results, and being used by operators and engineers to change system operations practices to achieve the targeted benefits. The proposed pilot will integrate the fault analysis system into existing distribution and operational systems, test performance against specifications and operations in a lab environment to verify the ability to be deployed successfully in the field trial phase. The testing will also provide the necessary design, field installation and operating instructions and training for the project to move from the laboratory environment to the field trial phase. Lastly, systems will be put in place for collecting, storing, analyzing and extrapolating data necessary to assess the benefits relative to expectations. These tools and resulting analyses will be used to justify moving to the field trial phase of the pilot and will be used to assess this second phase of the pilot. Phase I of the Detect and Locate Distribution Line Outages and Faulted Circuit Conditions Pilot is estimated to be completed by December 2014.
Phase II – Field Trial Phase, 2015 and 2016
The field trial phase of the pilot will involve the installation and performance testing of the best fault analysis system or systems identified in the first phase on up to 15 of PG&E’s actual distribution circuits. The field trial phase of the pilot will provide actual field benefit information to determine if a wider scale technology deployment would be appropriate and cost effective. The Detect and Locate Distribution Line Outages and Faulted Circuit Conditions Pilot is estimated to be completed by December 2016.
e) Detailed budget and expenditure tracking: PG&E will budget and track expenditures within its current financial systems as it would any other project. The planned budget is provided in item 5. PG&E will update this section with actual expenditures upon completion of each phase of the pilot.
f) Measurable data, performance tests or other project outputs, key metrics of success:
Analysis and Laboratory Testing Phase: Accuracy of results; equipment and software system performance relative to manufacturer and PG&E specifications; equipment and software system performance relative to expected benefits; equipment safety, reliability or operational impacts; ease of equipment installation; the ability of equipment to withstand environmental impacts; and the expected life of equipment.

Advice 4227-E - 29 - May 22, 2013
Field Trial Phase: Accuracy of data output; equipment and software system performance relative to manufacturer and PG&E specifications; equipment and software system performance relative to expected benefits; failure analysis should any occur; equipment safety, reliability or operational impacts; ease of equipment installation and operation; environmental assessment and benefit analysis associated with the project metrics described in item 6 above.
g) Data collection and analysis procedures: PG&E will determine the appropriate data collection and analysis procedures in Phase I, the Analysis and Laboratory Test Phase. PG&E believes at this time that data will be collected using existing data management systems enhanced specifically for this project so the data is easily accessible for status and analysis.
h) Performance test results:
The information below will be provided after completion of the Analysis and Laboratory Test phase.
1. Performance data collected:
2. Technical and market barriers overcome
3. Technical milestones met
4. Significant knowledge gained
5. Unresolved technical or market barriers
i) Recommendations for pilot program changes or course corrections
This information will be provided after completion of the Analysis and Laboratory Test phase.
j) Off-ramp decision point and failure analysis
The information below will be provided after completion of the Field Trial phase.
1. Products/programs developed as a result – patents filed or received?
2. Projection of how and when measures may be deployed in the marketplace or utility system
Advice 4227-E - 30 - May 22, 2013
3. Cost/benefit analysis – To the extent applicable, PG&E would analyze the costs and benefits of this pilot using the Total Resource Cost test in the Standard Practice Manual. Otherwise, PG&E would anticipate analyzing the costs and benefits using economic analysis that is consistent with similar types of investments.
9. A concrete strategy to identify and disseminate best practices and lessons
learned from the pilot to all California utilities and to transfer those
practices to resource programs, as well as a schedule and plan to expand
the pilot to utility and hopefully statewide usage.
PG&E will include results of this pilot in its annual Smart Grid report filed at the Commission and available to the public each year. PG&E will include best practices and lessons learned in that report. PG&E will provide CPUC staff with its findings and recommendations in the required Tier 2 advice letter after completing the Analysis and Laboratory test phase and Field Trial phase of the pilot project.
PG&E will also look for specific opportunities to disseminate best practices at public forums, such as industry conferences, industry organization meetings (i.e., Gridwise Alliance, IEEE, Western Electricity Institute, DistribuTech, etc.), and CPUC-sponsored presentations related to Smart Grid deployment plan progress.
D. Short Term Demand Forecasting Smart Grid Pilot
1. New and innovative program design, concepts or technology that have not
yet been tested or employed;
The Short Term Demand Forecast pilot project is an innovative program that will rely on more granular sources of data to determine short-term electricity demand forecasts. PG&E currently employs a “top-down” approach to creating short-term electricity demand forecasts as described in the direct testimony.1 This is the same “top-down” approach used by other entities such as CAISO. As part of this proposed pilot project, PG&E will use additional sources of data, such as Supervisory Control and Data Acquisition (SCADA) data from PG&E’s transmission and distribution network and SmartMeters™, to determine if more accurate demand forecasts can be achieved, in comparison to current practice. This pilot is not part of the California Energy Systems for the 21st Century Project (CES-21) or the Electric Program Investment Charge (EPIC) programs.
1 PG&E Direct Testimony, pp. 4-2.

Advice 4227-E - 31 - May 22, 2013
2. A specific statement of the concern, gap, or problem that the pilot seeks to
address and the likelihood that the issue can be addressed cost-effectively
through utility programs;
While PG&E’s current approach of “top-down” forecasts for short-term electricity demand forecasts produces reasonable demand forecasts, this method, does not directly account for the impacts of micro-climates within PG&E’s service area. The direct testimony provides an example where the effects of coastal fog are combined with the effects of high temperatures in the Central Valley to determine a temperature index for PG&E’s entire service area. Through this project, PG&E will evaluate the feasibility of improving the accuracy of its short-term demand forecast by using more granular and location specific information.2
Through the Short Term Demand Forecast pilot project, PG&E aims to demonstrate and evaluate the costs and benefits of using more granular information for the purposes of forecasting short-term electricity demand. The cost and benefits estimates derived from the pilot project will be used to determine whether a broader, system-wide deployment is warranted.3
3. How the pilot matches the characteristics for Smart Grid technologies
enumerated in SB 17 * (with three added characteristics adopted in
D.10-06-047).
The short-term demand forecasting pilot project is consistent with increased use of digital information to improve the reliability and efficiency of the grid characteristic listed in SB 17.
a) Be self-healing and resilient This is not a major focus area of the short-term demand forecasting pilot project.
b) Empower consumers to
actively participate in operations of the grid
This is not a major focus area of the short-term demand forecasting pilot project.
c) Resist attack – A Smart Grid system should better identify and respond to man-made or natural disruptions. A Smart Grid system using real-time information should enable grid operators to isolate affected areas and redirect power flows around damaged facilities. (§ 8360 a, b,
As described in PG&E’s Smart Grid Deployment Plan, effective cyber security controls and mechanisms are critical to the safe, reliable, and secure operation of Smart Grid technologies. As part of the short-term demand forecasting pilot project, PG&E will evaluate and test system interfaces to ensure security controls are in place. The investment associated with cyber security for
2 PG&E Direct testimony, pp. 4-3. 3 PG&E Direct testimony, pp. 4-1.

Advice 4227-E - 32 - May 22, 2013
and d; § 8366 a, e, f, and g.) this project is limited to secure file transfer systems.4
d) Provide higher quality power that will save money wasted from outages
This is not a major focus area of the short-term demand forecasting pilot project.
e) Accommodate all generation and storage options – A Smart Grid system should continue to support traditional power loads, and also seamlessly interconnect with renewable energy, micro-turbines, and other distributed generation technologies at local and regional levels. (§ 8360 b, c, d, e, f, and g; § 8366 a, e, f, and g.)
As part of this pilot project, PG&E will engage in initial investigation of forecasting tools to assess the impacts that distributed solar photovoltaic (PV) and electric vehicles (EVs) have on demand forecasts.
f) Enable electricity markets to
flourish
This is not a major focus area of the short-term demand forecasting pilot project.
g) Run more efficiently – A Smart Grid system should optimize capital assets while minimizing operations and maintenance costs (optimized power flows reduce waste and maximize use of lowest-cost generation resources). (§ 8360 a; § 8366 g.)
If the short-term demand forecasting pilot project is successful and it is fully deployed, the added granularity of load in various localized areas could facilitate the siting of new supply and demand response resources.
If the pilot project is successful and fully deployed, it could reduce PG&E’s exposure to procuring energy in the more volatile real-time energy markets by procuring more energy the day-ahead energy markets.
h) Enable penetration of
intermittent power generation sources – As climate change and environmental concerns increase, the demand for renewable energy resources will also increase; since these are for the most part intermittent in nature, a Smart Grid system should enable power systems to operate with larger amounts of
While this is not a major focus area of the short-term demand forecasting pilot project, PG&E will engage in initial investigation of forecasting tools to assess the impacts of distributed PV and EVs on demand forecasts.
4 PG&E Direct testimony, pp. 4-11.
Advice 4227-E - 33 - May 22, 2013
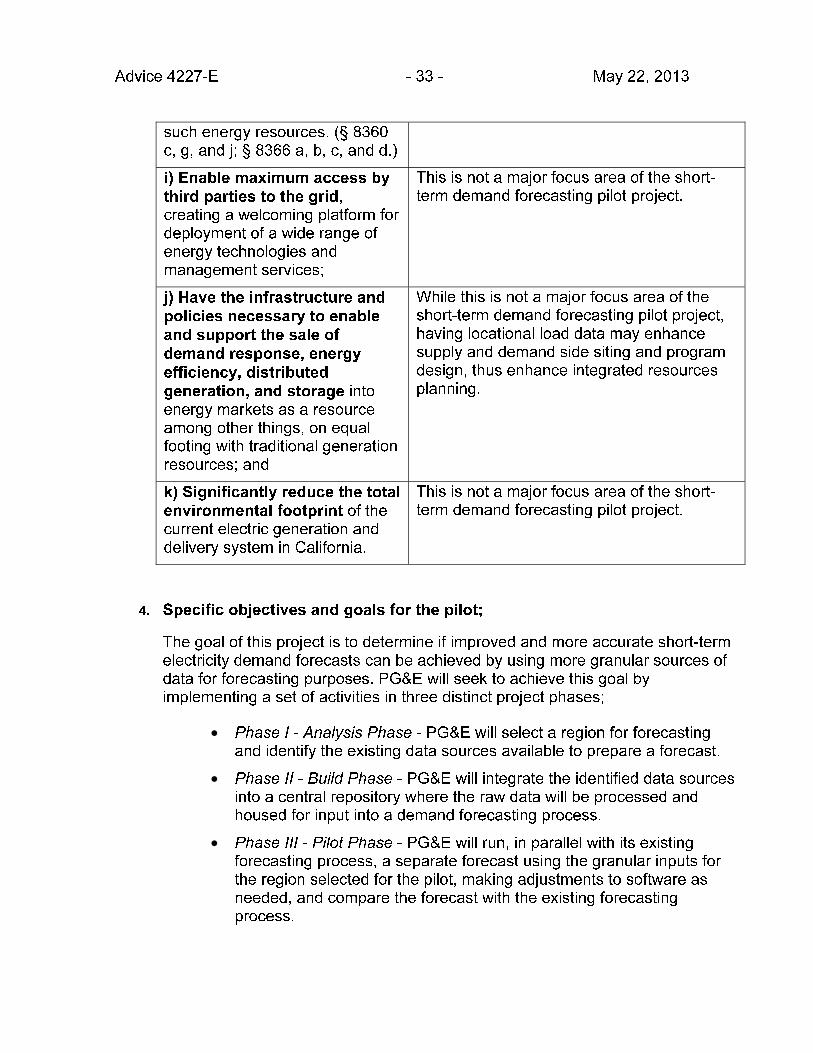
such energy resources. (§ 8360 c, g, and j; § 8366 a, b, c, and d.)
i) Enable maximum access by third parties to the grid, creating a welcoming platform for deployment of a wide range of energy technologies and management services;
This is not a major focus area of the short-term demand forecasting pilot project.
j) Have the infrastructure and policies necessary to enable and support the sale of demand response, energy
efficiency, distributed
generation, and storage into energy markets as a resource among other things, on equal footing with traditional generation resources; and
While this is not a major focus area of the short-term demand forecasting pilot project, having locational load data may enhance supply and demand side siting and program design, thus enhance integrated resources planning.
k) Significantly reduce the total
environmental footprint of the current electric generation and delivery system in California.
This is not a major focus area of the short-term demand forecasting pilot project.
4. Specific objectives and goals for the pilot;
The goal of this project is to determine if improved and more accurate short-term electricity demand forecasts can be achieved by using more granular sources of data for forecasting purposes. PG&E will seek to achieve this goal by implementing a set of activities in three distinct project phases;
• Phase I - Analysis Phase - PG&E will select a region for forecasting and identify the existing data sources available to prepare a forecast.
• Phase II - Build Phase - PG&E will integrate the identified data sources into a central repository where the raw data will be processed and housed for input into a demand forecasting process.
• Phase III - Pilot Phase - PG&E will run, in parallel with its existing forecasting process, a separate forecast using the granular inputs for the region selected for the pilot, making adjustments to software as needed, and compare the forecast with the existing forecasting process.

Advice 4227-E - 34 - May 22, 2013
5. A clear budget and timeframe to complete the pilot and obtain results.
Pilots that are continuations of pilots from previous portfolios should
clearly state how it differs from the previous phase;
The project costs below have been updated to reflect the approved costs in the final decision of the Commission.
PACIFIC GAS AND ELECTRIC COMPANY
SHORT-TERM DEMAND FORECAST SMART GRID PILOT PROJECT COSTS
Line No. Items 2013 2014 2015 2016 Total
1 Energy Procurement Costs $587,412 $486,911 $496,671 $506,700 $2,077,694
2 Information Technology Costs 1,888,923 6,283,797 1,353,861 1,379,532 10,906,113
3 Total $2,476,335 $6,770,708 $1,850,533 $1,886,232 $12,983,807
No prior pilots were completed or are in progress for the proposed functionality.
6. Information on relevant standards or metrics or a plan to develop a
standard against which the pilot outcomes can be measured;
PG&E will perform a statistical analysis to compare the accuracy of the forecasts produced from this pilot project to the accuracy of the existing forecasting process. PG&E will compare the following items:
• Variation between day-ahead forecasts
• Variation between day-ahead forecasts and real-time forecasts
• Variation between real-time forecasts5
The standards by which the outcome of the short term demand forecasting pilot project will be measured are stated above.
7. Where appropriate, propose methodologies to test the cost effectiveness of
the pilot;
At the end of the pilot project, the project will compare the difference in the accuracy of the forecasts produced in this project to the current forecasting process, for the specific region. The methodologies to test the cost effectiveness will capture the future costs of deployment and any benefits associated with the accuracy of the demand forecasts.
5 PG&E Direct Testimony, pp. 4-7.

Advice 4227-E - 35 - May 22, 2013
8. A proposed EM&V plan;
PG&E will design and implement an EM&V plan consistent with the EM&V plans developed for the other pilot projects, using the specific metrics and performance goals set for this pilot project.
a) Goals and Objectives: PG&E aims to evaluate whether there are benefits from using more granular sources of data to forecast PG&E’s bundled customer demand to meet its obligations to serve its retail customer load reliably and economically.
b) Technology Characteristics (hardware/software/peopleware):
1. New application of an existing technology? Yes.
2. Development of a new technology? No.
3. Integration of new and existing technologies? Yes. See response to 8(b)(i).
4. Prospective vendors: PG&E plans to continue to collaborate with Pattern Recognition Technologies (PRT), the existing forecasting vendor that specializes in performing load forecasts. By collaborating with the current vendor, PG&E can measure differences due to more granular forecasting, rather than differences in software and modeling methodologies. In addition, by collaborating with the existing vendor, PG&E can minimize costs to integrate a new software for the pilot project.
c) Location selection and rationale: The physical hardware and software will be deployed at PG&E offices. The pilot project will focus evaluation of granular forecasting for a specific region. The location will be determined in the Analyze phase of the project and will be based on the following criteria:
• Region with a maximum of 500,000 customers.
• Region with available transmission historical demand data.
• Region with a high percentage of deployed distribution automation systems.
• Region with a high percentage of deployed SmartMeters™ and/or customer interval meters.
• Region where the SmartMeters™, distribution substations, and transmission substations can be electrically isolated.

Advice 4227-E - 36 - May 22, 2013
• Region with as much historical data (preferably with at least three years of data) as possible for the above items.
Selection of an appropriate region is an important step to be able to conduct an effective pilot. By piloting in a region that is already well instrumented with technology that generates demand data, PG&E will be able to develop more meaningful analytics to train the forecasting model while also leveraging existing baseline investments in Smart Grid.
d) Project phases, milestones and expected timelines: The project is broken into the following distinct phases.
Phase I – Analysis (June 2013 to January 2014):
PG&E will select a region for forecasting and identify the existing data sources available to prepare a forecast. The data, compiled across multiple existing platforms, will be extracted, analyzed, validated, and cleansed where necessary. Phase I of the Short Term Demand Forecast Pilot is estimated to be completed by January 2014.
Phase II – Build (January 2014 to December 2014):
PG&E will integrate the many data sources into a central repository where the raw data will be processed and housed for input into a demand forecasting process. Phase II of the Short Term Demand Forecast Pilot is estimated to be completed by December 2014.
Phase III – Pilot (December 2014 to December 2016):
In the pilot phase, PG&E will run, in parallel with its existing forecasting process, a separate forecast using more granular inputs for the region selected for the pilot, making adjustments to software as needed, and compare the forecast with the existing forecasting process. The Short Term Demand Forecast Pilot is estimated to be completed by December 2016.
e) Detailed budget and expenditure tracking: PG&E will budget and track expenditures within its current financial systems. The planned budget is provided in item 5 above for this project. PG&E will update this section with actual expenditures upon completion of each phase of the pilot.
f) Measurable data, performance tests or other project outputs, key metrics of success:
The key metrics for success will be the forecast accuracy compared to output from the existing forecast tools for the selected region.

Advice 4227-E - 37 - May 22, 2013
g) Data collection and analysis procedures:
A statistical analysis will be performed to compare the accuracy of the forecast from this pilot project to the accuracy of the existing forecasting process. The items to be compared are as follows:
• Variation between day-ahead forecasts
• Variation between day-ahead forecasts and real-time forecasts
• Variation between real-time forecasts
h) Performance test results (provided after Analysis and Build phase): To be determined.
1. Performance data collected
2. Technical and market barriers overcome
3. Technical milestones met
4. Significant knowledge gained
5. Unresolved technical or market barriers
i) Recommendations for pilot program changes or course corrections (after completion of analysis and test phase): To be determined at the end of each phase.
j) Off-ramp decision point and failure analysis (after completion of Pilot Phase)
1. Products/programs developed as a result – patents filed or received?
2. Projection of how and when measures may be deployed in the marketplace or utility system
3. Cost/benefit analysis –Otherwise, PG&E anticipates analyzing the cost/benefit using economic analysis that is consistent with similar types of investments.
9. A concrete strategy to identify and disseminate best practices and lessons
learned from the pilot to all California utilities and to transfer those
practices to resource programs, as well as a schedule and plan to expand
the pilot to utility and hopefully statewide usage.

Advice 4227-E - 38 - May 22, 2013
PG&E will include results, best practices and lessons learned from this pilot in its annual Smart Grid report filed at the Commission and available to the public each year. PG&E will provide CPUC Commission staff with its findings and recommendations in the required Tier 2 advice letter after completing each phase of the pilot project. PG&E will disseminate best practices at industry and CPUC sponsored forums related to Smart Grid deployment plans.

CALIFORNIA PUBLIC UTILITIES COMMISSION
ADVICE LETTER FILING SUMMARY
ENERGY UTILITY
MUST BE COMPLETED BY UTILITY (Attach additional pages as needed)
Company name/CPUC Utility No. Pacific Gas and Electric Company (ID U39 E)
Utility type: Contact Person: Igor Grinberg
� ELC � GAS Phone #: (415) 973-8580
� PLC � HEAT � WATER E-mail: [email protected] and [email protected]
EXPLANATION OF UTILITY TYPE
ELC = Electric GAS = Gas
PLC = Pipeline HEAT = Heat WATER = Water
(Date Filed/ Received Stamp by CPUC)
Advice Letter (AL) #: 4227-E Tier: 2
Subject of AL: Smart Grid Pilot Deployment Projects Implementation Plan, Pursuant to Decision D.13-03-032
Keywords (choose from CPUC listing): Compliance
AL filing type: � Monthly � Quarterly � Annual � One-Time � Other _____________________________
If AL filed in compliance with a Commission order, indicate relevant Decision/Resolution #: D. 13-03-032
Does AL replace a withdrawn or rejected AL? If so, identify the prior AL: No
Summarize differences between the AL and the prior withdrawn or rejected AL: ____________________
Is AL requesting confidential treatment? If so, what information is the utility seeking confidential treatment for:
Confidential information will be made available to those who have executed a nondisclosure agreement: � Yes � No
Name(s) and contact information of the person(s) who will provide the nondisclosure agreement and access to the confidential
information: __________________________________________________________________________________________________
Resolution Required? �Yes �No
Requested effective date: June 21, 2013 No. of tariff sheets: N/A
Estimated system annual revenue effect (%): N/A
Estimated system average rate effect (%): N/A
When rates are affected by AL, include attachment in AL showing average rate effects on customer classes (residential, small
commercial, large C/I, agricultural, lighting).
Tariff schedules affected: N/A
Service affected and changes proposed: N/A
Pending advice letters that revise the same tariff sheets: N/A
Protests, dispositions, and all other correspondence regarding this AL are due no later than 20 days after the date of this filing, unless
otherwise authorized by the Commission, and shall be sent to:
California Public Utilities Commission Pacific Gas and Electric Company
Energy Division
EDTariffUnit
505 Van Ness Ave., 4th
Flr.
San Francisco, CA 94102
E-mail: [email protected]
Attn: Brian Cherry
Vice President, Regulatory Relations
77 Beale Street, Mail Code B10C
P.O. Box 770000
San Francisco, CA 94177
E-mail: [email protected]

PG&E Gas and Electric Advice Filing List General Order 96-B, Section IV
1st Light Energy Downey & Brand OnGrid Solar
AT&T Ellison Schneider & Harris LLP Pacific Gas and Electric Company
Alcantar & Kahl LLP G. A. Krause & Assoc. Praxair
Anderson & Poole GenOn Energy Inc. Regulatory & Cogeneration Service, Inc.
BART GenOn Energy, Inc. SCD Energy Solutions
Barkovich & Yap, Inc. Goodin, MacBride, Squeri, Schlotz & Ritchie
SCE
Bartle Wells Associates Green Power Institute SDG&E and SoCalGas
Bear Valley Electric Service Hanna & Morton SPURR
Braun Blaising McLaughlin, P.C. In House Energy San Francisco Public Utilities Commission
CENERGY POWER International Power Technology Seattle City Light
California Cotton Ginners & Growers Assn Intestate Gas Services, Inc. Sempra Utilities
California Energy Commission Kelly Group SoCalGas
California Public Utilities Commission Linde Southern California Edison Company
Calpine Los Angeles Dept of Water & Power Spark Energy
Casner, Steve MAC Lighting Consulting Sun Light & Power
Center for Biological Diversity MRW & Associates Sunshine Design
City of Palo Alto Manatt Phelps Phillips Tecogen, Inc.
City of San Jose Marin Energy Authority Tiger Natural Gas, Inc.
Clean Power McKenna Long & Aldridge LLP TransCanada
Coast Economic Consulting McKenzie & Associates Utility Cost Management
Commercial Energy Modesto Irrigation District Utility Power Solutions
Crossborder Energy Morgan Stanley Utility Specialists
Davis Wright Tremaine LLP NLine Energy, Inc. Verizon
Day Carter Murphy NRG Solar Water and Energy Consulting
Defense Energy Support Center Nexant, Inc. Wellhead Electric Company
Dept of General Services North America Power Partners Western Manufactured Housing Communities Association (WMA)
Douglass & Liddell Occidental Energy Marketing, Inc.