pull and push factors for international students in ......• gain knowledge of current immigration...
TRANSCRIPT

Pull and Push Factors for International
Students in Australia, Canada
and the United Kingdom
NAFSA: Association of International Educators
Boston, Massachusetts
May 28, 2015

Presenters:
Jennifer Humphries, Vice-President, Canadian Bureau for
International Education (CBIE)
Brett Blacker, President, International Education Association
of Australia (IEAA)
Dominic Scott, Chief Executive, UK Council for International
Student Affairs (UKCISA)
Learning Objectives
• Gain knowledge of current immigration policies for international
students in Australia, Canada and the UK, recent changes, and
programs that encourage or discourage retention
• Consider how immigration policy impacts the ability of the
country to attract and retain international students
• Understand the role that educational institutions play in
immigration policy and practice

CBIE at a glance
• National, bilingual, not-for-profit, membership organization
founded in 1966 – celebrating our 50th anniversary in 2016
• Dedicated to the internationalization of education and
partnerships between Canada and countries across the globe
• 150 members across Canada & sister associations worldwide
including NAFSA
• 49th Annual Conference: Niagara Falls, November 22-25, 2015 –
first ever conference ‘on the border’

Canada: Permanent Immigration
• Target: 250,000 to 285,000 immigrants in 2015.
• Skilled workers (economic immigrants), Family members (including spouses) and Refugees.
• For the past 20 years, Canada has welcomed over 200,000 permanent immigrants per year.
Source: http://www.cic.gc.ca/english/resources/statistics/facts2013/permanent/01.asp

Immigration Trends
• In 2011, Canada had a foreign-born population of about 6,775,800 people
representing 20.6% of the total population, highest proportion in G8.
• Asia (including the Middle East) was Canada's largest source of immigrants in the
past five years, although the share of immigration from Africa, Caribbean, Central
and South America increased slightly.
• The vast majority of the foreign-born population lived in four provinces: Ontario,
British Columbia, Québec and Alberta, and most lived in the nation's largest urban
centres.
• More than 200 ethnic origins were reported in the 2011 National Household Survey
(NHS). In 2011,13 different ethnic origins had surpassed the 1-million mark.
Source: http://www12.statcan.gc.ca/nhs-enm/2011/as-sa/99-010-x/99-010-x2011001-eng.cfm

Students: Ideal Immigrants
• International students have Canadian education and training.
• High level of English and/or French.
• Education credentials that will be
recognized by Canadian employers.
• Adjusted to Canadian society.
• Likely to integrate into the Canadian job
market with less difficulty.
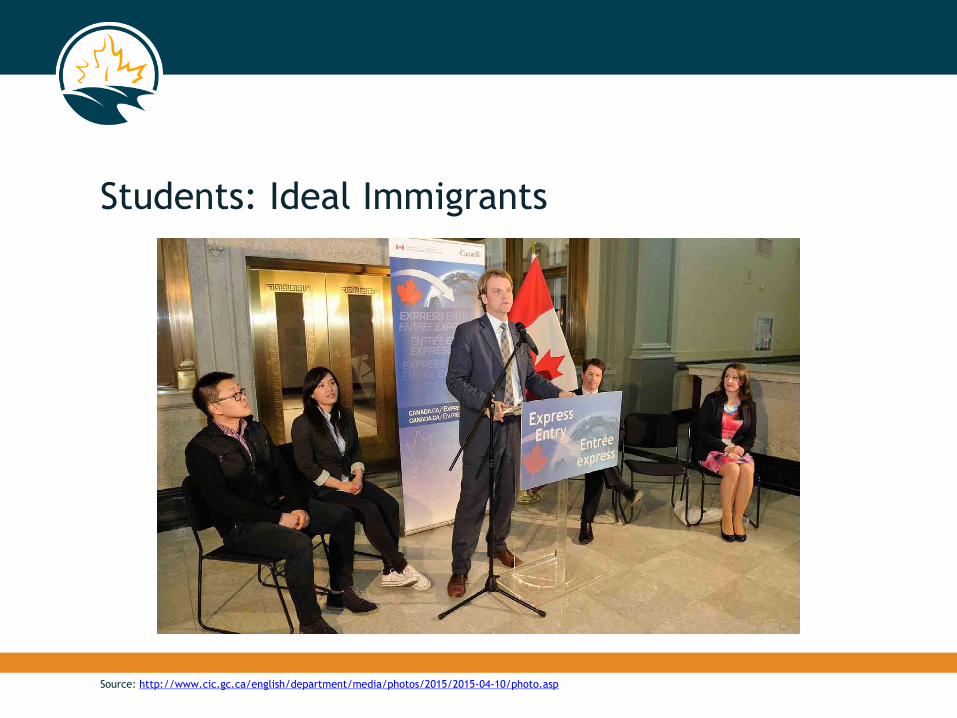
Students: Ideal Immigrants
Source: http://www.cic.gc.ca/english/department/media/photos/2015/2015-04-10/photo.asp
Impacts of Immigration Policy on International
Student Decision-Making
• In CBIE’s 2014 Survey, 35% of students said that the possibility of
working full-time in Canada post-graduation was a key reason for
choosing Canada.
• The opportunity to work part-time during studies was also
important.
• Being able to apply for permanent resident status without leaving
the country was valued.

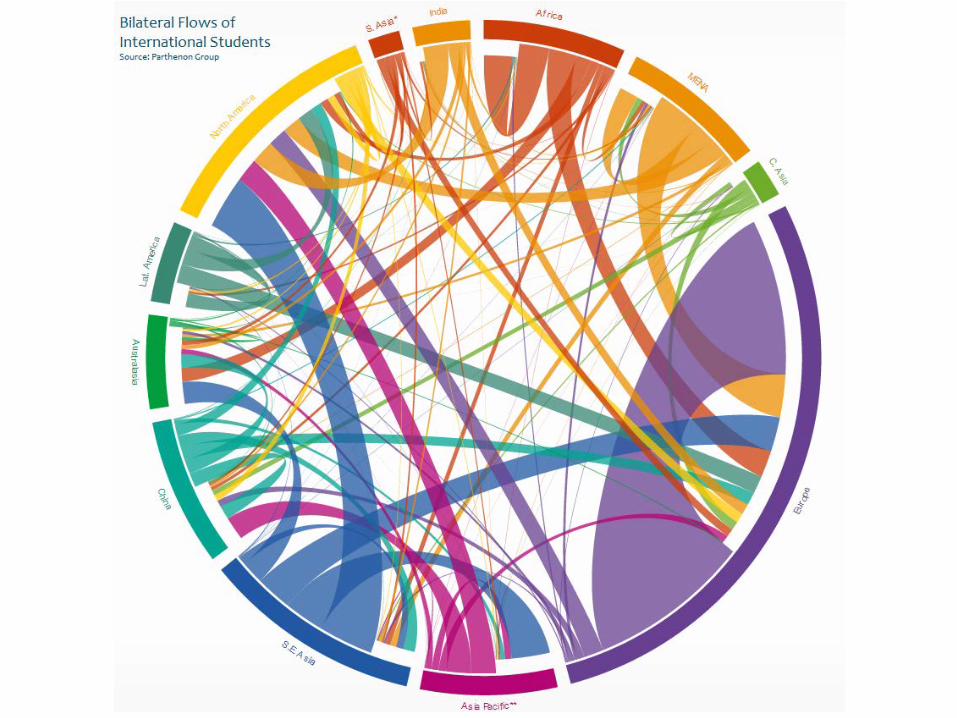
Where do students come from?
Top 10 countries of origin
China 26,238
France 8,325
India 8,142
United States 7,437
Korea 4,218
Saudi Arabia 3,168
Iran 2,805
Nigeria 2,031
Pakistan 1,929
China, Hong Kong 1,566

International students in Canada by year,
2003 to 2013, all levels of study

Student satisfaction with their Canadian
experience
Source: CBIE – A World of Learning – Canada’s performance and potential in international education

Pull Factors
• Post Graduation Work Permit
• On-Campus and Off-Campus Work – No Permit Needed
• Co-op Work
• Spouses can work in Canada
• Application from within Canada for change in Study Permit, Permanent
Resident status
• Canadian Experience Class
• Provincial Nominee Programs
• Federal Skilled Worker Program, Federal Skilled Trades Program

Push Factors
• NEW Express Entry: Concern about Comprehensive Ranking System
which focuses on work and does not give added points for education in
Canada
• NEW International Mobility Program Changes: New requirements for
short-term research students, visiting researchers, workers
• NEW Compliance Reporting: Definitions and technical issues
• Section 91: International Student Advisers (ISAs) cannot advise students
unless they are regulated – NEW RISIA program
• Processing Delays: Perception is negative even when times improve

Intention to seek permanent resident status in Canada following
studies, by region of origin
Source: CBIE – A World of Learning – Canada’s performance and potential in international education
MENA = Middle East and Northern Africa

Canada’s International Education Strategy
• Recognizes international education as a priority sector
• The International Education Strategy is centred on:
• Setting targets to attract international students
• Focusing on six priority education markets
• Branding Canada
• Strengthening research partnerships and educational exchanges
• Supporting activities and leveraging resources to maximize results
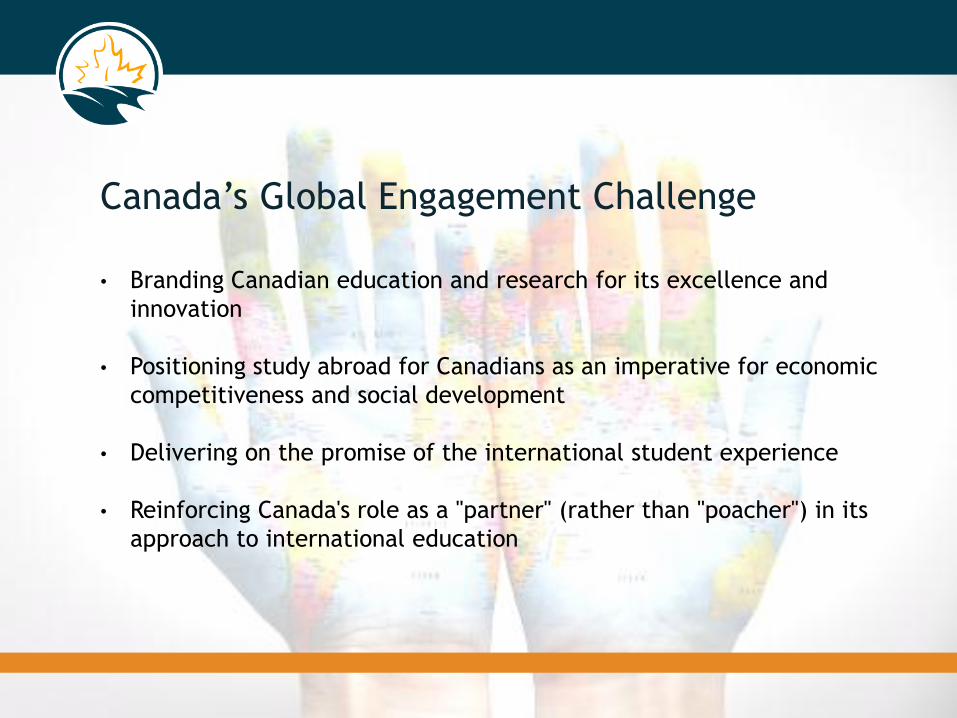
Canada’s Global Engagement Challenge
• Branding Canadian education and research for its excellence and
innovation
• Positioning study abroad for Canadians as an imperative for economic
competitiveness and social development
• Delivering on the promise of the international student experience
• Reinforcing Canada's role as a "partner" (rather than "poacher") in its
approach to international education
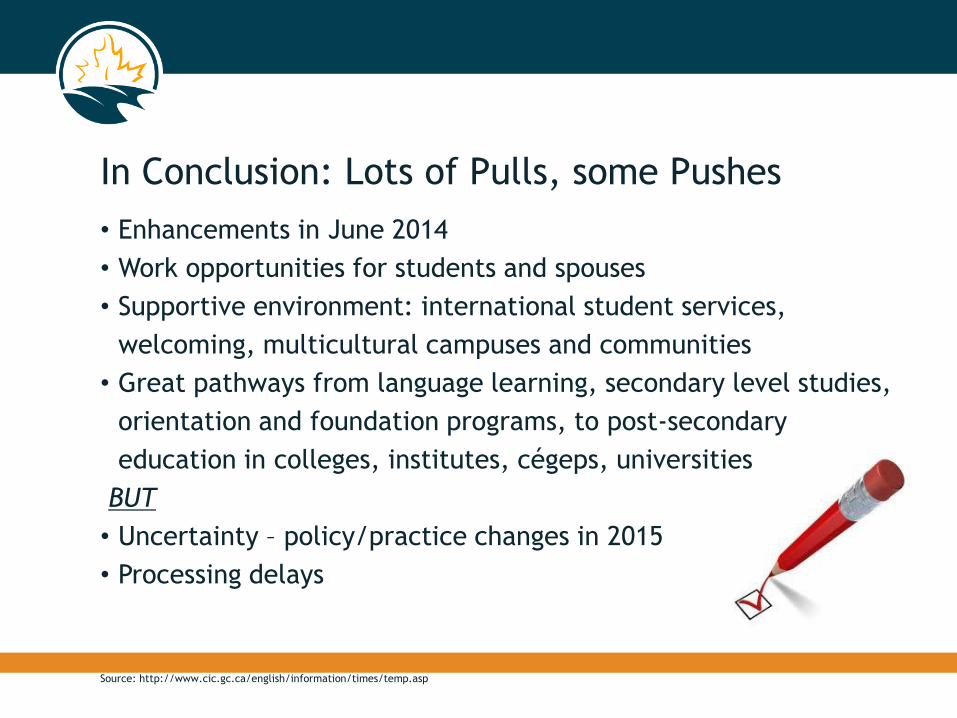
In Conclusion: Lots of Pulls, some Pushes
Source: http://www.cic.gc.ca/english/information/times/temp.asp
• Enhancements in June 2014
• Work opportunities for students and spouses
• Supportive environment: international student services,
welcoming, multicultural campuses and communities
• Great pathways from language learning, secondary level studies,
orientation and foundation programs, to post-secondary
education in colleges, institutes, cégeps, universities
BUT
• Uncertainty – policy/practice changes in 2015
• Processing delays

Pull and Push Factors for International
students in Australia, Canada and the UK
Australia update
Brett Blacker
President, International Education Association Australia (IEAA)
Director International
University of Newcastle
28 May 2015

Pull Factors: Significant Policy Drivers
Genuine Temporary Entrant
Streamlined Visa Processing
And
Post Study Work rights
ieaa.org.au

Genuine Temporary Entrants On 5 November 2011, the Government introduced a new genuine temporary entrant (GTE) requirement as an upfront integrity measure.
Student visa applicants must be both a GTE and a Genuine Student to be granted a visa.
To be granted a student visa, applicants must satisfy the department that they have a genuine intention to stay in Australia temporarily.
Factors that the department considers as part of the GTE requirement include:
• circumstances in the applicant’s home country
• the applicant’s potential circumstances in Australia
• the applicant’s immigration history
• the value of the course to the applicant’s future
• any other matter relevant to the applicant’s intention to stay temporarily.
ieaa.org.au

Streamlined Visa Processing – updates On 24 March 2012
Streamlined Student Visa processing arrangements were introduced for prospective international students with a Confirmation of Enrolment (CoE) from a participating university at bachelor, masters or doctoral degree level or for a non-award university student exchange or study abroad programme.
On 22 March 2014
Streamlined Student Visa processing arrangements were extended to certain eligible non-university higher education providers for bachelor, masters or doctoral degree level courses.
On 23 November 2014
Streamlined student visa processing arrangements were extended to certain eligible vocational education and training (VET) and higher education providers for advanced diploma level courses.
ieaa.org.au

Post Study Work These arrangements provide an opportunity for graduates to spend some time in Australia following their studies, gaining practical work experience to accompany their Australian qualification. The post-study work arrangements are not linked to the skilled migration program. • Applicants will not need to nominate an occupation on
the Skilled Occupation List or undertake a skills assessment.
• This is designed to encourage courses on the basis of their educational interest, rather than a migration outcome.
ieaa.org.au
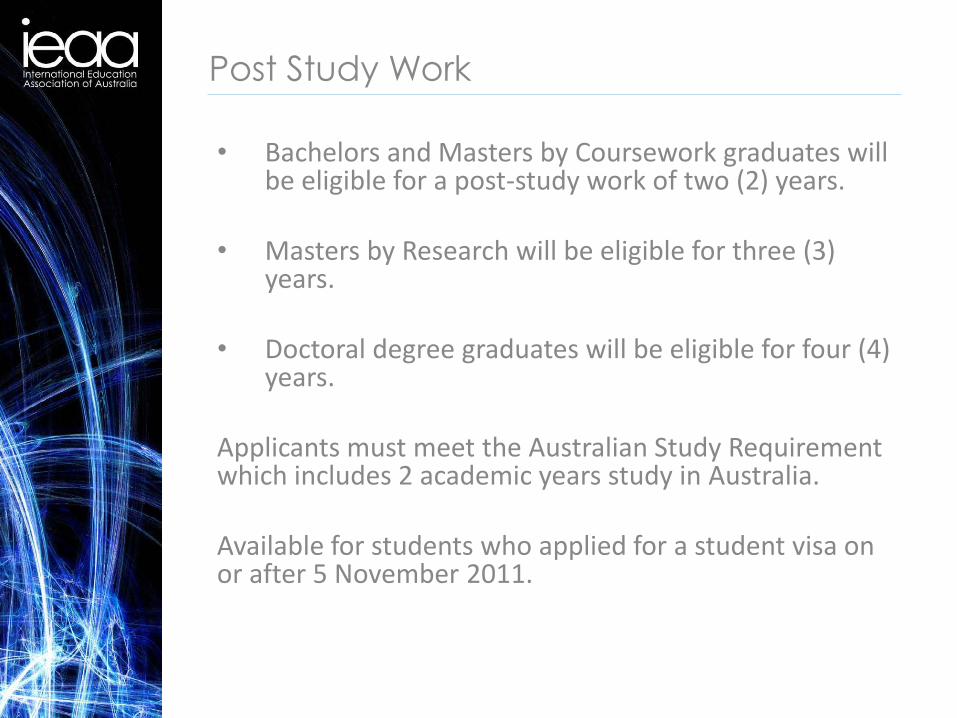
Post Study Work • Bachelors and Masters by Coursework graduates will
be eligible for a post-study work of two (2) years.
• Masters by Research will be eligible for three (3) years.
• Doctoral degree graduates will be eligible for four (4)
years. Applicants must meet the Australian Study Requirement which includes 2 academic years study in Australia. Available for students who applied for a student visa on or after 5 November 2011.
ieaa.org.au

How is Australia tracking?
Offshore student visa lodgements increased by 4.9%
(Dec 2014), with Higher Education (573 visas) comprising 42%
Total student visa grants (353,704) increased by 17.4% over prior year (Dec 2014)
Australia had 589,860 international student enrolments– the highest recorded number since 2010 (Dec 2014)
Top source countries:
China 25.9%
India 10.7%
Vietnam 5.1%
Korea 4.7%
Thailand 4.3%
All other nationalities – 49.3%
Source: Australian Government – Department of Education and Training Monthly Summary of International Student Enrolment Data – Australia – Dec 2014.
ieaa.org.au

Australia – International Student Commencements
Number of student visa commencements March 2012 – March 2015
Source: Australian Government – Department of Education and Training Monthly Summary of International Student
Enrolment Data – Australia – YTD March 2015
ieaa.org.au

Student visa applications granted
Number of student visa applications granted in 2014-15 to 31 December 2014 (by citizenship), compared with same period in previous year. Source: Australian Government – Department of Education and Training
ieaa.org.au

Visa holders in Australia
Number of student visa holders in Australia as at 31 December 2014
(by visa subclass), compared with the same date in previous year. Source: Australian Government – Department of Education and Training
ieaa.org.au

New Colombo Plan
The Australian Government has committed $100 million over five years to the New Colombo Plan.
Scholarships and mobility grants are on offer through the New Colombo Plan.
The 2014 program launch was successful in supporting approximately 1,300 mobility program students and 40 scholarship recipients to study in four pilot locations:
• Indonesia
• Japan
• Singapore
• Hong Kong
Under the mobility program, Australian universities develop project bids for grants to fund student programs. These grants are transferred to the students at a rate of between AUD1,000 and AUD7,000 per student.
ieaa.org.au
Push Factors - Australian Gov’t Support

New Colombo Plan - 2015 More than 3,000 students from 37 universities will live, study and work in the
Indo-Pacific region during the second year of the Australian Government’s New Colombo Plan.
“New Colombo Plan mobility grants will support these students to study in 32 locations across the Indo-Pacific from India in the west, to Mongolia in the north and the Cook Islands in the east,” Minister Julie Bishop.
2016 - Around $20 million in mobility grants will be available in 2016.
Multi-year funding will be available for mobility projects that can be delivered over up to three years.
Around 100 New Colombo Plan scholarships.
Community support Bennelong Foundation, Myers and Asialink joint support of close to $1
Million for pre-departure intercultural competency training.
Outreach through schools sector.
Promotion/ facilitation of Asian language training courses.
ieaa.org.au
Australian Government Support
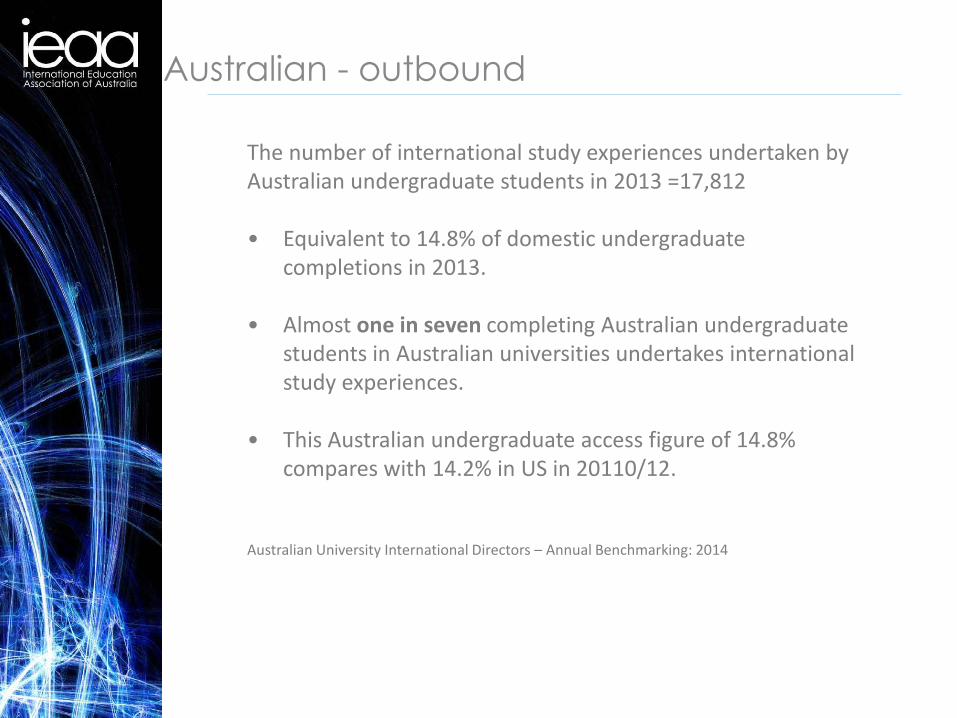
Australian - outbound
The number of international study experiences undertaken by Australian undergraduate students in 2013 =17,812 • Equivalent to 14.8% of domestic undergraduate
completions in 2013. • Almost one in seven completing Australian undergraduate
students in Australian universities undertakes international study experiences.
• This Australian undergraduate access figure of 14.8%
compares with 14.2% in US in 20110/12.
Australian University International Directors – Annual Benchmarking: 2014
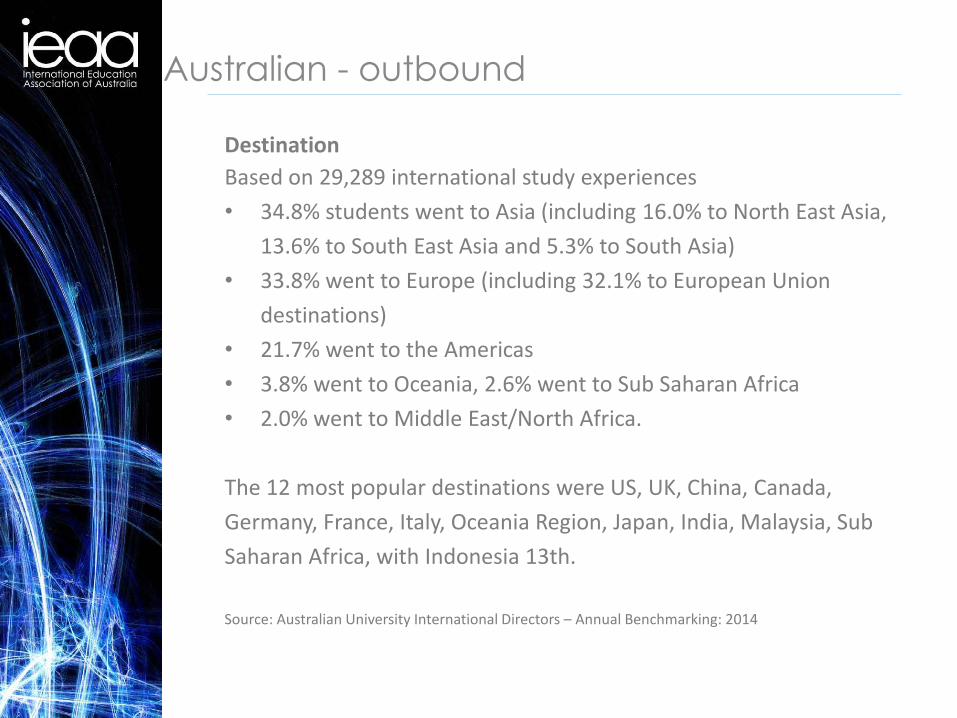
Australian - outbound
Destination
Based on 29,289 international study experiences
• 34.8% students went to Asia (including 16.0% to North East Asia,
13.6% to South East Asia and 5.3% to South Asia)
• 33.8% went to Europe (including 32.1% to European Union
destinations)
• 21.7% went to the Americas
• 3.8% went to Oceania, 2.6% went to Sub Saharan Africa
• 2.0% went to Middle East/North Africa.
The 12 most popular destinations were US, UK, China, Canada,
Germany, France, Italy, Oceania Region, Japan, India, Malaysia, Sub
Saharan Africa, with Indonesia 13th.
Source: Australian University International Directors – Annual Benchmarking: 2014
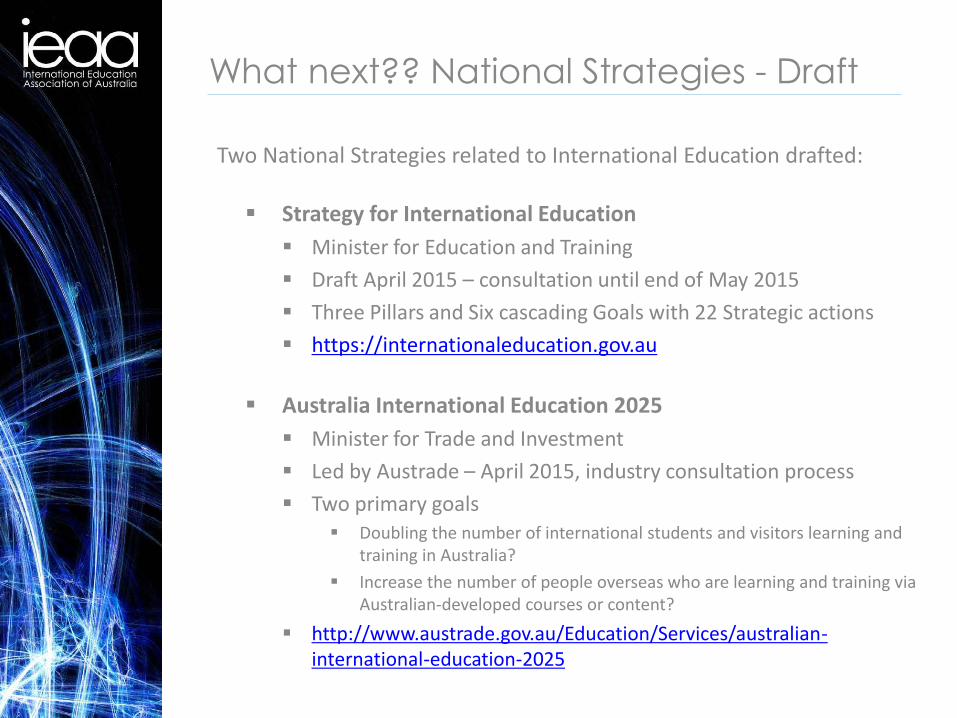
What next?? National Strategies - Draft Two National Strategies related to International Education drafted:
Strategy for International Education
Minister for Education and Training
Draft April 2015 – consultation until end of May 2015
Three Pillars and Six cascading Goals with 22 Strategic actions
https://internationaleducation.gov.au
Australia International Education 2025
Minister for Trade and Investment
Led by Austrade – April 2015, industry consultation process
Two primary goals Doubling the number of international students and visitors learning and
training in Australia?
Increase the number of people overseas who are learning and training via Australian-developed courses or content?
http://www.austrade.gov.au/Education/Services/australian-international-education-2025
ieaa.org.au

THANK-YOU
NAFSA 2015
Student visa changes and impact on recruitment – the UK story
Dominic Scott Chief Executive UK Council for International Student Affairs
3
6

2010/11 2011/12 2012/13 2013/14
3
7
The elephant in the room: tier 4 visas

Main student visa changes 2011, 12 and 13
• Post-Study Work scheme abolished • Part-time work for students in private colleges abolished
(leading to 80% reduction) • Rights to bring dependents abolished (except PGs) • New levels of English required – and SELTs • Academic progress mandatory • Maximum study rules • Credibility interviews • Much stricter licencing and ‘sponsorship’ system • Visa rejection rates, arrivals, drop outs and reporting and • Promoting a rhetoric around the world that only the ‘brightest
and the best’ would be welcome in the UK • (Plus 2014 and 15 – the ETS scam and Immigration Act)
3
8

First year international enrolments, English HEIs
0
20000
40000
60000
80000
100000
120000
140000
160000
2009/10 2010/11 2011/12 2012/13 2013/14
Other European Union
Non-European Union
First year enrolments
fell 470 in 2011/12
and another 860 in
2012/13
3
9 Source: HESA

Total international enrolments, English HEIs
0
50000
100000
150000
200000
250000
300000
2009/10 2010/11 2011/12 2012/13 2013/14
Other European Union
Non-European Union
First recorded all-
years decline since
1981, down from
251,980 in 2011/12
to 249,630
4
0 Source: HESA
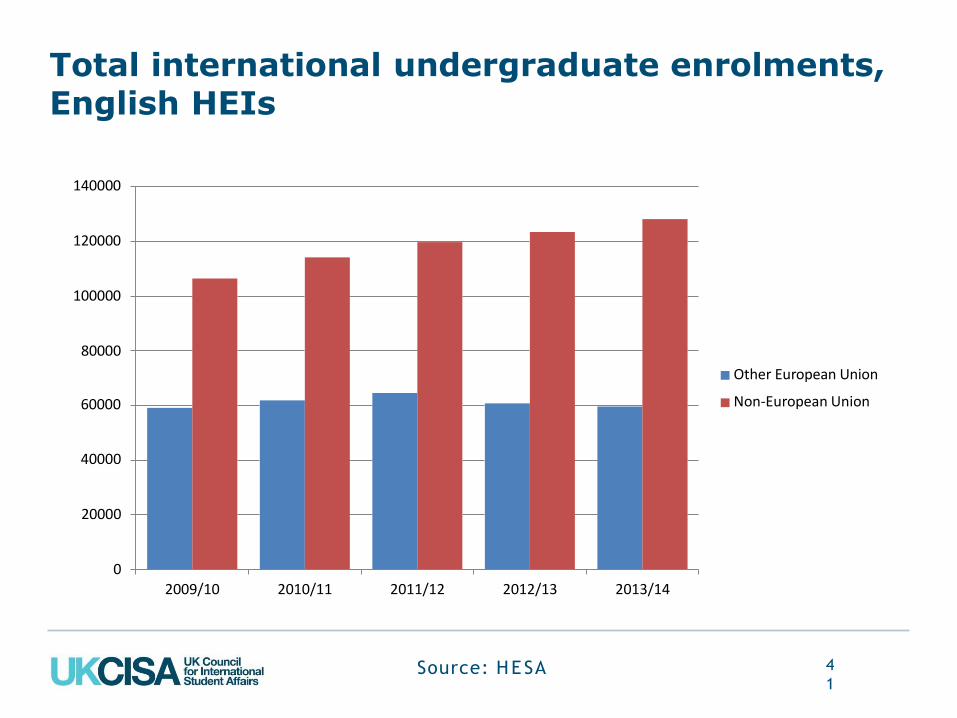
Total international undergraduate enrolments, English HEIs
40000
20000
0
60000
140000
120000
100000
80000
2009/10 2010/11 2011/12 2012/13 2013/14
Other European Union
Non-European Union
4
1 Source: HESA

Total international postgraduate enrolments, English HEIs
0
20000
40000
60000
80000
100000
120000
140000
160000
2009/10 2010/11 2011/12 2012/13 2013/14
Other European Union
Non-European Union
Postgraduates peak
at 134,270 in
2010/11
4
2 Source: HESA

Who comes? Top 10 non-EU enrolments, English HEIs
4
3 Source: HESA
2009/10 2010/11 2011/12 2012/13 2013/14 % change 2009/10 - 2013/14
China 48625 56990 66050 69970 74020 52% India 31195 30890 24030 18525 16480 -47% Nigeria 13525 14165 14415 14305 14850 10% Malaysia 12095 11950 12440 12615 14005 16% Hong Kong (SAR) 9105 9510 10275 11850 13415 47% United States 11100 11510 12120 11865 11985 8% Saudi Arabia 6975 8765 8400 7930 7485 7% Singapore 3435 4030 4750 5370 6075 77% Thailand 4955 5335 5555 5475 5555 12% Pakistan 8155 8120 6880 5695 5230 -36% All other 87735 87190 87060 86035 89330 2% Total 236900 248455 251980 249630 258430 9%
Thank you
www.cbie-bcei.ca
www.istudentcanada.ca
www.educationau-incanada.ca
www.cic.gc.ca
www.ukcisa.org.uk
www.gov.uk/browse/visas-immigration
www.ieaa.org.au
www.immi.gov.au
220, Laurier ouest/West, # 1550 Ottawa, Ontario CANADA K1P 5Z9
t: (613) 237-4820 • f: (613) 237-1073 • [email protected] • www.cbie-bcei.ca