pulp & paper edge · ... july 2015 pulp & paper edge intelligence report ... unlike the...
TRANSCRIPT

EDITION 121: July 2015
Pulp & Paper EdgeINTELLIGENCE REPORT
Greek tragedy – but will there be an exit, stage left?Although the grand experiment may not be over, even the prospect of a Grexit from the
European Union and from the Euro is damaging the European economy and further
weakening European recovery. Australia and New Zealand have very limited direct exposure
to the Euro. However, there are unavoidable consequences from this latest Greek tragedy.
Australian Dollar prices for much of the paper imported from Europe (mainly coated paper
grades) remain very low. A depreciated Euro would normally allow those prices to fall
further. That is unlikely to occur on this occasion, because of historically low prices, highly
constrained mill converting margins and the depreciating Australian Dollar. The Europeans
have to make some money, some time soon.
The Euro exchange rate may have some marginal impact, but it is more likely a further
weaking of the Euro will simply reduce the size of price increases that are expected in Q3’15.
The chart below shows the experience of the Euro, Japanese Yen, Korean Won and the US
Dollar against the Australian Dollar since January 2012.
Selected Currencies vs Australian Dollar: Jan ’12 – May ’15 Index (Base: Jan’12 =100)
Source: Uni of BC
Pulp & Paper Edge is published monthly by IndustryEdge Pty Ltd
ABN 39 109 201 630ISSN: 1449-9711
Email: [email protected] or go to www.industryedge.com.au
Pulp & Paper Edge is availabe in PDF and online. Subscription enquiries should be directed to IndustryEdge P/L.
Phone: +61 (3) 5229 2470 Email: [email protected] mail
IndustryEdge P/L, PO Box 7596, Geelong West Victoria 3218, Australia.
Subscription rates per year (11 issues Feb - Dec) AUD1,000 plus GST for Australian subcribers.
Squaring the rectangle – folding boxboard markets overdue rationalisation
Australia’s folding box market has been relatively stable by some measures and declining, according to others, over much of the last decade. The conversion sector is increasingly fragmented, including by growing imports of fully converted boxes. As this month’s feature finds, consolidation, leading to rationalisation, appears to be overdue...
Jan-
2012
May-2
012
Sep-2
012
Jan-
2013
May-2
013
Sep-2
013
Jan-
2014
May-2
014
Sep-2
014
Jan-
2015
May-2
015
60
70
80
90
100
110
120
130
Inde
x (B
ase:
Jan
-201
2 =
100)
Month
USD
Euro
Yen
SthKoreanWonSA
MPLE

2
We share some sympathy for the Greek argument that lenders share some responsibility
for the crisis. After all, you shouldn’t lend to those you know cannot repay. Equally relevant
is that within Europe, there is a long history of forgiving debts, in the interests of peace and
stability. The most prominent example is of course the end of the Second World War, when
after a long period of austerity, Greece was among the countries that wrote off the debts of
other countries.
Perhaps this is just a matter of timing. In the meantime, expect to see imported European
paper prices increase in coming months, but not by as much as might have been expected.
Imported folding boxes defy currency gravityDespite the depreciation of the Australian Dollar, imports of pre-converted folding boxes (or
converted cartonboard), further eroded the domestic sector, growing by 3.9% for the year to
end of May 2015. Although the growth has slowed compared with prior years, any growth
in a period of significant depreciation is important.
Despite the growth, total imports will fall short of 50 kt for the 2014-15 financial year due
largely to the impact of a lower Australian dollar on prices, making imports less competitive.
However, it seems inevitable that milestone in a rapidly developing trade will be reached in
the medium term, if not before the end of the year.
The chart below shows imports, by country of origin from June 2013.
Imports of Converted Folding Boxes by Country: Jun ’13 – May ’15 (ktpm & AUDFob/t)
Source: ABS
From a supply perspective, China has dominated imports to Australia for several years. In May
2015, it delivered 57.5% of the total, below the peak of 62.6% recorded just a month earlier.
Further evidence of the resilience of imports is that the average price has observably
continued to grow over the last year. At AUDFob2,631/t the average price is 19.9% higher
than a year before. Price increases of this magnitude suggest that the segments being
supplied by the imports are reasonably stable though observably under pressure.
folding boxes is an average 19.9% higher than a year ago
Continued on page 9...
Jul-2
013
Sep-2
013
Nov-2
013
Jan-
2014
Mar-20
14
May-2
014
Jul-2
014
Sep-2
014
Nov-2
014
Jan-
2015
Mar-20
15
May-2
015
0.0
0.5
1.0
1.5
2.0
2.5
3.0
3.5
4.0
4.5
5.0
0
500
1,000
1,500
2,000
2,500
3,000
ktpm
AU
DFo
b/t
Month
China/HK
Malaysia
New Zealand
Taiwan
Vietnam
Other
TWA
SAMPLE

3
Australia’s folding box (cartonboard) market has been relatively stable by some measures and declining, according to others, over much
of the last decade. Despite some uncertainty about the absolute size of the market, some parts of its supply chain have undergone
considerable change in recent years. Yet at the same time, the conversion sector appears to be increasingly fragmented, including by
rapidly growing imports of fully converted boxes. The conclusion is that consolidation, leading to rationalisation, is overdue.
Australian market sizeFor most of the last decade, Australia’s folding box market was supplied with approximately 190 kt of substrate, sourced from both
the domestic producer and imports, supplemented by an ever growing volume of imported pre-converted folding boxes. Following the
closure of the Petrie Mill by Amcor in 2013, domestic production ceased altogether.
Significant inventories, in the hands of Amcor (and then Orora), as well as converters and brand-owners, washed through the market,
at the same time as new imports commenced. At least some of the new imports were mis-classified as coated woodfree printing and
communication papers. The result of this was that apparent consumption declined dramatically on a single year basis. The experience of
the last decade is displayed in the chart below.
Australian Apparent Consumption of Coated Cartonboard: 2004 – 2014 (ktpa)
Source: ABS & IndustryEdge research and estimates
Industry participants consider any remaining inventories are fully worked through the market and that Australia is now fully supplied by
imported coated cartonboard. Supplies of non-aseptic liquid packaging board, including cup stock, have been removed from this data.
Full financial year data will be available later this month. For the year to the end of May 2015, imports have totalled 125.5 kt as the chart
following shows. While that volume is the highest on record, the total import volume remains well below expectations, due to the import
mis-classification. Industry participants are working with IndustryEdge to resolve the mis-classification.
There are instances where IndustryEdge (and others) would take an accusatory tone where mis-classifiation occurs. The industry is
rightly wary of those who claim an ‘error’ to ‘hide’ a trade or worse, try to avoid a duty. But concur with those who find the tariff codes for
coated cartonboard and coated woodfree printing and communication papers complex. They border on the bewildering and few have a
complete handle on it.
Squaring the rectangle – Folding boxboard market’s overdue rationalisation
2004
2005
2006
2007
2008
2009
2010
2011
2012
2013
2014
-50
0
50
100
150
200
250
ktpa
Y/E June
Production (e)
Exports
Imports
Apparent
SAMPLE
4
Imports of Coated Cartonboard by Grade: Jun ’13 – May ‘15 (ktpm)
Source: ABS & IndustryEdge research and estimates
Because supply of substrate is fully imported, it is relevant to consider the country of origin of these same` imports. The chart below shows
that New Zealand continues to be the major supplier nation, but supply from the USA is having an increasing influence. New Zealand’s
supply is waning, as the sole producer – the Whakatane Mill, part of SIG Combibloc – completes its transition to the production of liquid
packaging boards.
Imports of Coated Cartonboard by Country of Origin: Jun ’13 – May ‘15 (ktpm)
Source: ABS & IndustryEdge research and estimates
Coupled with the closure of Petrie, the ‘swing’ of Whakatane has created a more dynamic import supply, which has in turn brought about
the confusion of import data. However, supplies of substrate are not the only structural changes evident in the market.
Australian market structureThe structure of Australia’s folding box-board market is similar to most major packaging markets, in that a relatively small number of
producers dominate delivery to a wide range of end-users. Inevitably, this gives rise to a very wide supply offering, which is considered to
represent operational challenges in a small market.
Jul-2
013
Sep-2
013
Nov-2
013
Jan-
2014
Mar-20
14
May-2
014
Jul-2
014
Sep-2
014
Nov-2
014
Jan-
2015
Mar-20
15
May-2
015
0
2
4
6
8
10
12
14
ktpm
Month
Austria
Chile
China
Finland
Korea
Malaysia
NZ
USA
Other
Jul-2
013
Sep-2
013
Nov-2
013
Jan-
2014
Mar-20
14
May-2
014
Jul-2
014
Sep-2
014
Nov-2
014
Jan-
2015
Mar-20
15
May-2
015
0
2
4
6
8
10
12
14
ktpm
Month
GeneralCartonboard
Coated KraftBack
CHLP
Aseptic
SAMPLE

5
Similarities between packaging sectors end at that point however, as this sector includes, among those holding significant market share,
heavily integrated or diversified businesses (Orora, Hannapak), specialist cartonboard businesses that operate primarily at a single point
in the supply chain but supply the widest possible group of end users (Colorpak) and businesses that dominate supply to one or more
discrete end-use sectors (Anzpac Services).
Unlike the corrugated packaging market, which is dominated by Orora and Visy, there is evident fragmentation of the conversion sector,
with almost 20% of the sector supplied by smaller businesses.
The table below shows IndustryEdge’s assessment of the market shares of the major producers in 2014. It is important to emphasise that
this estimate does not include the liquid packaging board market. A revised and more detailed assessment will be included in the 2015
Pulp & Paper Strategic Review.
Estimated Market Shares of Australia’s Folding Box Board Market: 2014 (AUDM)
Company Turnover (AUDM)
Amcor Cartons 160
Colorpak 190
Anzpac 71
Hannapak 73
Others 111
Total 605
Source: IndustryEdge research and estimates
An alternative and more fully inclusive analysis of market shares was provided by Colorpak’s Managing Director, Alex Commins in June
2014 at IndustryEdge/Appita’s Packaging Market Outlook Forum. That market share analysis is reproduced below and segments what
Colorpak estimates is an AUD645M market.
Folding Carton Market Shares: 2014 (%)
Source: Colorpak
The purpose of showing this different analysis is not to create confusion. The Colorpak breakdown is of the entire market, inclusive of all
products and categories. Based on other information related to liquid packaging boards, we consider the total market size to be closer
to AUD700M or something close to 6.5% higher than the Colorpak assessment.
What this breakdown, provided by the major player with the greatest proportion of their skin in this particular game, is that the two largest
companies hold just 44.1% of the market. Compare this with the sibling corrugated box market, in which Orora and Visy together hold
something close to 85% of the market.
Orora (22.5%)
Colorpak (18.6%)
Hanna (10.9%)ANZ Oneworld Pac (9.1%)
Visy (9.0%)
Abaris (5.4%)
Platypus (3.1%)
Jaypack (1.7%)
Other local (11.9%)
Other importers (7.8%)
SAMPLE

6
Hannapak, the division of the Hanna Group, has throughput of approximately 30 kt per annum, but not all of that is cartonboard. Its
production estimate is that it is ‘approaching 1 billion’ boxes per annum, across a staggering 2,500 stock keeping units (SKUs) per year.
Their apparent ability to deliver small runs, as well as large volume runs, is indicative of a market fragmenting in a variety of ways.
The growing market share of smaller converters and fully converted importers is telling for the sector. When the Petrie mill closed in 2013,
domestic supply of substrate ended, but so too did the market’s ability to easily supply a very wide range of options, on short notice. If it
was renowned for anything, Petrie’s capability in delivering whatever folding box configuration was required was a key advantage.
Over the two years since the end of domestic manufacturing, the market has evidently fragmented further, with growing market share
for smaller converters and ever-increasing volumes of pre-converted imports filling supply gaps. Pre-converted imports are discussed in
greater detail in the item leading into this analysis.
Based on import volumes, IndustryEdge considers the market’s structure has changed, with pre-converted cartonboard imports now
accounting for as much as 27.5% of the total market. Moreover, imports have grown over the last year, and average prices have increased
sharply, as a result of the Australian Dollar’s depreciation.
The implication of rising pre-converted import prices is twofold. First, the domestic market struggles to meet the supply requirements
that the imports deliver, making the imports reasonably resilient to price increases. Second, domestic prices have increased over the last
year and the sector’s value has grown.
The volume of supply situation is displayed in the following pie chart, for the year to end of May 2015, which sets out imports by grade
and includes the rising pre-converted imports as though a separate grade. The chart excludes imports of what are described as uncoated
cartonboard, but which are generally considered to be the substrate imported for liquid packaging board production.
Coated Cartonboard Imports (inc. Pre-Converted) by Grade: Y/E May ‘15 (kt)
Source: ABS & IndustryEdge research & estimates
The suspicion has long been that the folding box market in Australia (and to a lesser extent, New Zealand) has not been extracting full
value for its products and services. In part, this is because the sector is over supplied, both with capacity and by too long a tail of small
producers, chasing the same markets.
Though it was a Petrie strength, the ability to deliver a very wide variety of SKUs from a domestic producer on relatively short supply lines
and timeframes, created what became a market expectation. That expectation appears to be serviced increasingly, at least at the edges
of the market, by a variety of converters and importers.
According to some, consolidation of converters, and rationalistaion of the market and supply, is required for the sector to extract full value
for the advantage of the entire supply chain. However, some of the smaller converters that fill market gaps, contest that view, as do end-
users whose unique requirements and expectations continue to be serviced by the sector.
Aseptic (1.2%)CHLP (5.0%)
Coated Kraft Back (8.2%)
General Cartonboard (58.1%)
Pre-Converted Cartonboard (27.4%)
SAMPLE

7
End-users changing faster than the suppliersAnalysis of the Australian cartonboard market by its end uses, on a proportional basis, is described in the pie chart below. IndustryEdge
has developed this analysis from information from Colorpak and additional analysis of retail and other sales volumes.
Cartonboard Supplies by End-Use: 2015 (%)
Source: Colorpak & IndustryEdge research and estimates
The pace of consolidation in a number of these end-use sectors has been significant over the last half decade. In the key markets of
Food, Pharmaceuticals and Beverage, consolidation has been rapid and is continual. While that creates opportunities to win tenders, it
also creates challenges from losing tenders.
The result can be that a converter with a large capital footprint goes from being close to full capacity to well below capacity in the blink
of an eye.
This has driven, to some extent, the folding box conversion sector’s over-capacity, making consolidation all the more urgent and yet, ever
more difficult to achieve. That risk for the sector is ultimately a supply risk for end-users, some of whom are aware of the problem. Some
are reportedly considering longer term supply contracts to encourage innovation and capital investment.
Prospects of RationalisationIn part because it is fully exposed to substrate imports, Australia’s folding boxboard market is under more pressure than ever before.
Converters and their merchant suppliers are obliged to tightly manage inventories, yet must retain a volume of supply to meet quite
diverse demand. The impact on margins can be acute, particularly in a conversion market that is over-capacity, faces constant challenges
from the seemingly more innovative flexible packaging sector and that ultimately, seems to be overdue for a further round of consolidation.
The suspicion is that the value of folding boxes is not being rewarded in the market, with the prices that a rationalised sector could
command. The sector’s fragmentation has seen pre-converted imports rise, further eroding domestic market opportunities and value.
Without overplaying the situation, IndustryEdge considers sector rationalisation cannot be far off. Perhaps how that will happen, remains
the better question. For its part, Colorpak has done some heavy lifting. It consolidated the former Carter Holt Harvey operations in
Australia into its business over the four years to the middle of 2014.
Orora, the largest player in the market and the large player with the greatest integration, is the logical player to make a rationalisation
move. Their options are quite broad because any single acquisition would still see their market share below 50%.
Others, including the always-capable Visy, could expand their share of the market through acquisition and rationalisation.
There is at least one other option being considered in the market.
Food (37%)
Pharmaceutical/Healthcare (27%)
Beverage (18%)
FMCG (6%)
Fast Food (4%)Cosmetics (1%)
Technology (1%) Other (7%)
SAMPLE

8
The recent acquisition of Jalco by Pact Group Holdings gives rise to some options for consolidation. Jalco’s product lines include personal
care & cosmetics, food & beverage and promotional packaging components, each of which uses, to some extent, folding boxes. It is not
clear whether Pact’s strategic interests extend to the cartonboard sector, but there is speculation in the investor community about such
a development being possible.
Rationalisation remains challenging however, in part because the cost of entry to the conversion sector is relatively low. Import competition
is also an element of concern to those who might be considering rationalisation. Ultimately, those issues cannot be addressed in the
market until there is sectorial consolidation and tighter integration.
Re-forming the boxMost of the discreet sectors of the Australian packaging market are rationalised or at least, undergoing consolidation that will lead to
rationalisation. Such a move is overdue in the folding box conversion market and value seems to be the victim right now.
No party in the supply chain – including the end-users – is immune from the pressures.
Regardless of the importance of end-users, it is the converters that need to make the moves to improve the structure of the sector. It may
not yet be urgent, but it is increasingly important, as fragmentation is demonstrating.
That said, we are only observing the beginning of a sector wide awareness and activity on the consolidation front. If that is the case, the
situation of challenging value extraction may need to get tougher, before it can get better.
SAMPLE
9
As a result of volume and price rises, the value of imports has risen to be AUDFob114.5M
for the year to end of May 2015. Analysis shows it will continue at above AUD100M for at
least the remainder of 2015, measured for the year to the end of each month. There is little
prospect of it falling below that level.
Also of interest, as the chart below shows, is that imports are prevalent into all mainland
states. This is no longer a small and additional import volume, filling occasional, niche
and small markets. We would go as far as to add that supplies into NSW are now stable
and predictable.
Imports of Converted Folding Boxes by State: Jun ’13 – May ’15 (ktpm)
Source: ABS Excludes Tas and NT
Growing imports of pre-converted folding boxes are a lost opportunity for the domestic
converters, valued as the data shows, at more than AUD100M. As the import prices rise,
the argument that it is all low value boxes that are of little interest to domestic producers is
no longer true, if it ever was.
Why ChAFTA chafes for domestic industryThe China Australia Free Trade Agreement (ChAFTA) has been signed by the Australian
and Chinese governments, even though it has yet to pass the Australian Parliament. The
‘signing’ was conducted as the thousands of pages of text and details were released.
From an Australian perspective, especially related to manufactured goods and the
movement of people, ChAFTA appears to have few friends. Ideological supporters of free
trade agreements have lined up to support ChAFTA, as have those involved in the energy,
raw resources, food and services export sectors.
Their desire to see the further opening up of trade opportunities with Australia’s major
trading partner (even if that is at the expense of other sectors) comes as no surprise.
Partly, this is because they are the big beneficiaries from Australia and also, they look to the
opportunities that were created for sectors like New Zealand’s dairy industry (and collaterally
the packaging sector) from the NZ/China Free Trade Agreement, signed in 2008.
of paper from China are immediately duty free under ChAFTA
Continued from page 2...
Jul-2
013
Sep-2
013
Nov-2
013
Jan-
2014
Mar-20
14
May-2
014
Jul-2
014
Sep-2
014
Nov-2
014
Jan-
2015
Mar-20
15
May-2
015
0.0
0.5
1.0
1.5
2.0
2.5
3.0
3.5
4.0
4.5
5.0kt
pm
Month
NSW
Vic
Qld
WA
SA
SAMPLE

10
The details below come from a close examination of the ChAFTA text and details.
Imports to AustraliaMuch as with other FTAs concluded by the Australian Government, the reduction in tariffs
on imports from China is faster than those for Australian exports to China (on average).
Australia’s tariff reductions are extremely rapid. The 349 page schedule of Australian tariff
reductions shows that by the middle of 2020, no Chinese manufactured goods will have
any tariffs imposed on them.
In the sectors of specific interest – pulp, paper and paper products – there is little good
news for domestic producers.
The majority of paper, paperboard and paper products imported from China have long had
a 5% tariff imposed on them. For all but a handful of elaborately transformed products that
are fully manufactured in Australia, those tariffs are immediately reduced to zero.
Paper, paperboard and paper products that do not have an immediate reduction are
detailed in the following table.
ChAFTA Tariff Reductions for Import to Australia
HS Code Description (Industryedge shorthand)
Current Tariff No. Years to Zero
4802.56.10 Cut reams/copy paper (A4) 5% 5
4802.56.90 Cut reams/copy paper (A3) 5% 5
4810.13.90 Coated woodfree reels 5% 3
4810.19.90 Coated woodfree sheets 5% 3
4810.29.90 Medium weight coated mechanicals 5% 3
4810.99.00 Coated cartonboard (C1S) 5% 3
4818.10.00 Toilet paper (converted) 5% 5
Source: DFAT
To place the table into context, these are the only items in eighteen pages of close written
tables that do not have immediate reduction of the existing 5% tariff to zero.
Even within this data there are some bitter ironies.
Australia does not manufacture coated woodfree papers, so reducing the tariffs over time
appears to be an alignment with terms of other FTAs. That is, it may be a measure to ensure
equal treatment of Australia’s trading partners, but it has virtually no utility in Australia.
The removal, over three years, of the tariffs on medium weight coated mechanical papers
seems even more bizarre. True, Norske Skog can manufacture MWC’s at Boyer, but its
production range is focused on light-weight coated grades. A reduction in tariffs over a
longer period for LWCs would appear to have made more (or at least equal) sense.
The five-year reduction in tariffs on copy paper and converted toilet paper make more
sense, but there is no such treatment of imported envelopes, stationery and pre-converted
packaging products or other pre-converted tissue products.
All pulp and recovered paper imports remain duty free. Some plastics take a full five years for
the tariff reductions to be completed, while other plastics also see an immediate reduction.
For several years, some importers appear to have over-used the ‘other’ import codes, where
those have provided a zero tariff and the more specific products have had a 5% tariff imposed
on them. It is to be hoped that this practice will end with a reduction of tariffs to zero, meaning
no one code is used ahead of another for any reason other than straight product definition.
very few tariffs for paper and paperboard imported from Australia
SAMPLE

11
Exports from AustraliaThe headlines say that 85% of Australia’s exports to China are tariff free immediately, rising
to 95% after five years. However, this excludes almost all paper, paperboard and paper
products for which the duties will remain in place. A very small number will reduce over five
years, but most are for products that are simply not exported from Australia to China (such
as ‘paper fans’ and moulded fibre trays, plates and cups made from bamboo).
Tariffs on imports to China of Australian paper, paperboard and paper products range from
2% to 7.5%.
Providing a product by product listing of the tariffs remaining in place in China is simply
impossible in Pulp & Paper Edge, because it is so long. Subscribers are invited to contact
us for details.
We have been overwhelmed with comments from those seeking to understand how
ChAFTA could present such an imbalance in outcomes for a particular sector. There is no
easy answer, but the simplest way to consider it is that for China, its domestic paper and
paper products industry is important to it.
Government procurementAlthough no preferential arrangements have been put in place for procurement by the
Australian Government, Article 16.8 of the Agreement states that as soon as China signs up
to the reciprocal agreement at the World Trade Organisation, negotiations will commence.
Given the details of China’s tariff reduction commitments – or the lack of them – there will be
plenty of people hoping those negotiations never come.
Further informationThousands of pages of material are available at www.dfat.gov.au. IndustryEdge understands
that reviewing this material is complex and that subscribers will have other questions, both
about detailed items in ChAFTA and about matters not yet covered here.
We welcome the opportunity to assist you with your questions and if detailed analysis is
required, we can support you with that also.
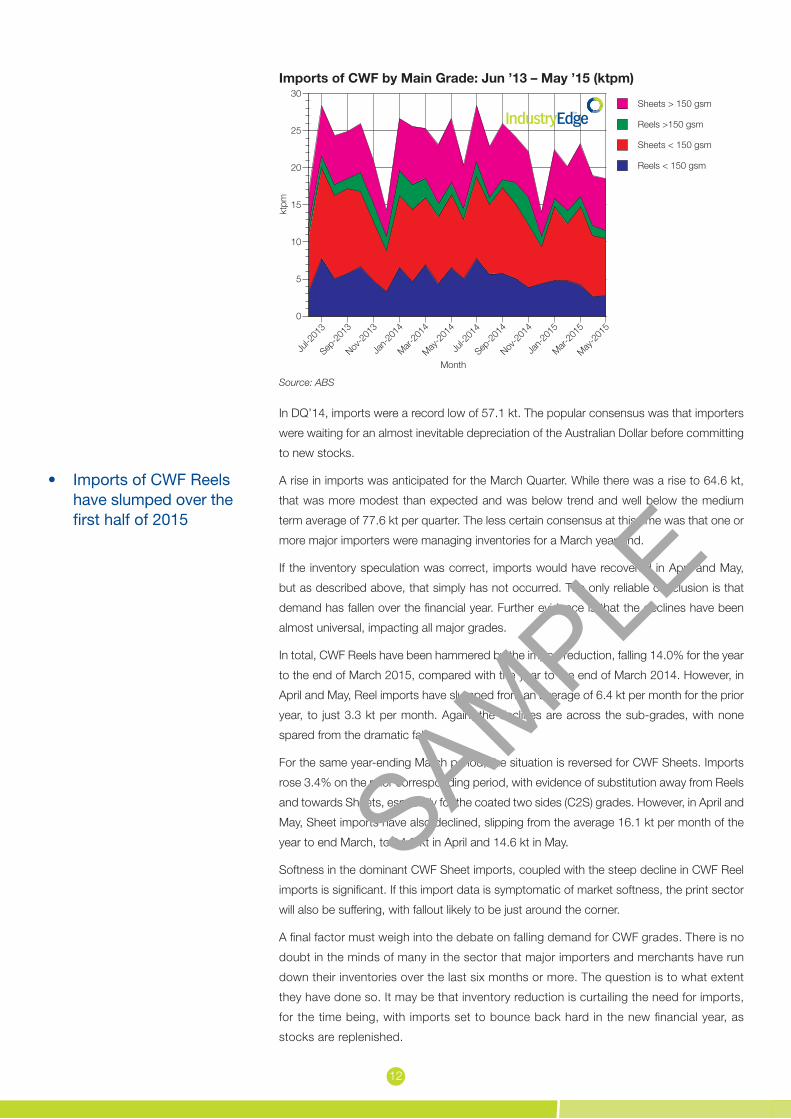
Coated woodfree slump continuesWithout a massive and unlikely rise in imports in June, full year imports of coated woodfree
(CWF) grades are set to slump to their lowest annual volume in decades. Imports are set to
fall by as much as 36.5 kt or 12.5% for 2014-15, compared with 2013-14. Latest projections
are that imports will fall to approximately 256.8 kt, however there is every prospect they will
be lower still, based on the latest monthly import data.
April and May import data show imports continuing to decline. In April, CWF imports totalled
18.5 kt and in May, just 18.0 kt. On average over the financial year to date, imports have
amounted to 21.4 kt per month. The following chart shows monthly imports, by main grade,
up to date to the end of May.
Australia will fall approximately 12.5% in 2014-15 compared with the prior year
SAMPLE
12
Imports of CWF by Main Grade: Jun ’13 – May ’15 (ktpm)
Source: ABS
In DQ’14, imports were a record low of 57.1 kt. The popular consensus was that importers
were waiting for an almost inevitable depreciation of the Australian Dollar before committing
to new stocks.
A rise in imports was anticipated for the March Quarter. While there was a rise to 64.6 kt,
that was more modest than expected and was below trend and well below the medium
term average of 77.6 kt per quarter. The less certain consensus at this time was that one or
more major importers were managing inventories for a March year-end.
If the inventory speculation was correct, imports would have recovered in April and May,
but as described above, that simply has not occurred. The only reliable conclusion is that
demand has fallen over the financial year. Further evidence is that the declines have been
almost universal, impacting all major grades.
In total, CWF Reels have been hammered by the import reduction, falling 14.0% for the year
to the end of March 2015, compared with the year to the end of March 2014. However, in
April and May, Reel imports have slumped from an average of 6.4 kt per month for the prior
year, to just 3.3 kt per month. Again, the declines are across the sub-grades, with none
spared from the dramatic falls.
For the same year-ending March period, the situation is reversed for CWF Sheets. Imports
rose 3.4% on the prior corresponding period, with evidence of substitution away from Reels
and towards Sheets, especially for the coated two sides (C2S) grades. However, in April and
May, Sheet imports have also declined, slipping from the average 16.1 kt per month of the
year to end March, to 14.9 kt in April and 14.6 kt in May.
Softness in the dominant CWF Sheet imports, coupled with the steep decline in CWF Reel
imports is significant. If this import data is symptomatic of market softness, the print sector
will also be suffering, with fallout likely to be just around the corner.
A final factor must weigh into the debate on falling demand for CWF grades. There is no
doubt in the minds of many in the sector that major importers and merchants have run
down their inventories over the last six months or more. The question is to what extent
they have done so. It may be that inventory reduction is curtailing the need for imports,
for the time being, with imports set to bounce back hard in the new financial year, as
stocks are replenished.
Jul-2
013
Sep-2
013
Nov-2
013
Jan-
2014
Mar-20
14
May-2
014
Jul-2
014
Sep-2
014
Nov-2
014
Jan-
2015
Mar-20
15
May-2
015
0
5
10
15
20
25
30
ktpm
Month
Reels < 150 gsm
Sheets < 150 gsm
Reels >150 gsm
Sheets > 150 gsm
have slumped over the first half of 2015
SAMPLE

13
That outcome is certainly possible, but its unlikely anyone will be holding their breath and
waiting for it to happen.
CWF import prices tick up – LWCs and MWCs remain lowCoated paper prices have succumbed to the sustained depreciation of the Australian
dollar, finally beginning to increase in the last quarter. However, not all grades have started
to move, with a distinct difference between Coated Woodfree (CWF) grades and Coated
Mechanical (CM) grades.
The chart below indexes the price of the main coated paper grades, against the Producer
Price Index for the Manufacturing Division. Up to date to MQ’15, it shows clearly how some
coated paper prices have started to increase, but not for all grades.
Import Prices of Coated Paper by Main Grade: MQ’09 – MQ’15 Index (Base MQ’09 = 100)
MQ'09
SQ'09
MQ'10
SQ'10
MQ'11
SQ'11
MQ'12
SQ'12
MQ'13
SQ'13
MQ'14
SQ'14
MQ'1540
50
60
70
80
90
100
110
Inde
x (B
ase:
MQ
'09
= 10
0)
Quarter
LWC
MWC
CWF Reels <150 gsm
CWF Sheets< 150 gsm
CWF Reels >150 gsm
CWF Sheets> 150 gsm
Source: ABS
Compared with MQ’14, the average price change to MQ’15 of each of the grades detailed
above is shown in the following table.
Coated Paper Import Price Changes: MQ’14 to MQ’15 (%)
Grade % Change MQ’14 – MQ’15
LWC -1.3
MWC -2.4
CWF Reels < 150 gsm 1.4
CWF Sheets < 150 gsm 6.4
CWF Sheers > 150 gsm 8.3
Source: ABS
The clear difference between the Light Weight Coated Mechanical (LWC ) and Medium Weight
Coated Mechanical (MWC) grades and the Coated Woodfree grades can be plainly seen.
It is important to note that the structure of the Australian market is different for CWF and
CM grades.
increased modestly but CM grades are lower than a year ago
SAMPLE

14
CWF grades remain fully imported. The major impact of which, from a pricing perspective,
is that price competition remains alive and well. Unsurprisingly, it is this grade that suffers
most, of all paper grades, from restrictions on trade transparency. That is a consequence of
extensive competition based on little more than price.
Imported CM grade prices continue to languish under the competitive pressures associated
with the return of domestic production. Reports suggest that despite efforts in June, the
local product has not been entirely successful at achieving higher prices.
As IndustryEdge recently reported, price leadership in the Australian Coated Mechanical
market has shifted from imports to domestic production. Despite the pressure on import
prices created by a depreciating Australian dollar, it seems importers will have to wait until
domestic prices increase for their turn to come.
While that is a challenge for CM importers, many are importing from a lower Euro,
which initially reduced some of the pressures they face. Although its likely to turn
down again, the Euro’s recent gains against the Australian dollar have bitten into
already super tight margins.
Coated Woodfree importers are earning a bit more than a year ago, but in all cases, over the
medium to long term, coated paper importers remain way behind square on prices.
US case finds against APP and APRIL – Questions about Australia’s systemIn late June, the US Department of Commerce issued a preliminary finding that cut size
paper from China and Indonesia had been subsidised over 2014. Effective immediately, a
range of additional duties – up to 131.12% - is now being imposed on imports.
The nature of the subsidies is important.
In Indonesia, subsidies are partly linked to bans on log exports and other administrative
measures that are used by Government to artificially restrain prices, especially for paper
producers. Also relevant were debt structuring and forgiveness activities that would
have reduced the cost of capital of Indonesia’s domestic producers. Cross–ownership
of firms in the wood fibre supply chain was also referred to as a means of artificially
managing prices through the supply chain.
In China, government intervention distorted markets for major production inputs, including
domestic coal, caustic soda and calcium carbonate. As with Indonesia, emphasis was
applied on debt based subsidies.
In some cases, the subsidies have been imposed because companies failed or refused
to provide information to US investigators, (including UPM’s Changshu mill in China,
which was directly embroiled in the unsuccessful Australian copy paper anti-dumping
case in 2014).
duties are as high as 131.12% from the recent US case on cut size paper
SAMPLE

15
The following table sets out the preliminary countervailing duties imposed by the US.
US Countervailing Duties on Cut Size Paper: Jun ‘15
Company Countervailing Duty (%)
Indonesia
APRIL Fine Paper, inc. cross-owned affiliates 43.19
Great Champ Trading 125.97*
APP group companies 131.12*
Other companies 43.19
China
Asia Symbol/APRIL, inc. owned businesses 5.82
Sun Paper 126.42*
UPM Changshu 126.42*
Others 5.82
Source: US Department of Commerce * adverse findings due to non-participation
Companies that did not provide required information were subject to adverse findings and
the imposition of massive countervailing duties that in the case of Indonesia will almost
certainly knock them out of the US market. Whether it has the same impact for the Chinese
businesses that did not participate is a little less certain because the Chinese production
cost base is lower than that in Indonesia.
The 5.82% duties imposed on Chinese producers, after investigation, is likely to normalise
prices, but the 43.19% duties imposed on Indonesian producers, after investigation, will all
but remove them from the US market.
The US case has added interest for Australia, because it comes less than a year after
an unsuccessful Australian anti-dumping case, related to the same products, that also
involved UPM Changshu and Sun Paper. The table below shows the investigation
findings in that case.
Australian Dumping Margin Findings: Aug ‘14
Company Dumping Margin (%)
UPM (China) -0.95
APRIL Fine Paper Trading -5.51
Zhanjiang Chenming Pulp & Paper -6.95
Sun Paper Industry -1.05
Gold Huangsheng Paper 0.91
Source: Ant-Dumping Commission
The stunning difference between the two cases raises questions about Australia’s approach
to assessing subsidies and imposing countervailing duties. There is a view in Australia that
subsidy assessments will simply not be successful, no matter how obvious and large they
are. What seems reasonably clear is that when it comes to trade fairness, the real action is
increasingly related to subsidies and not as much to dumping.
The challenges of proving subsidies are in operation aside, IndustryEdge reminds subscribers
that in a November 2014 interview with its CEO, Mr Kunihiko Kashima, Australian Paper
advised it would recommence the proceedings at some point in the near future. Unconfirmed
rumours have circulated that a case was submitted some time in late 2014 or early 2015 –
focusing on Chinese subsidies – but it was not approved by the Anti-Dumping Commission
for further investigation. Perhaps the US case makes it time for that decision to be revisited.
SAMPLE

16
A final determination on the US anti-dumping cases will be delivered in November 2015.
The preliminary findings relate only to countervailing duties and not allegations of dumping.
Other countries were trawled into the anti-dumping element of the case, including Australia,
Brazil and Portugal.
Analysis shows exports of copy paper from Australia to the US were essentially forced,
because they were a response to a loss of domestic sales opportunities that arose only
because of the cheap imports into Australia. The chart below shows Australia’s exports of
the main uncoated woodfree grades to the US, since the beginning of 2012.
Australian Exports of Uncoated Woodfree Papers by Main Grade: Jan ’12 – May ’15 (ktpm and USD/t)
Source: ABS
It is not possible to escape the reality that subsidies do not discriminate between markets.
That is, subsidies impact every tonne produced, before export and therefore, regardless of
the market for which they are destined.
In 2014, the Australian Anti-Dumping Commission found some instances of dumping, but
none sufficient to impose anti-dumping duties. Less than a year later, the US Department of
Commerce found evidence of what by any measure are massive subsidies.
The stubborn and nagging doubt is whether Australia’s system of anti-dumping and
countervailing duties measures remains inadequate, despite rounds of changes over recent
years. There are those who will say that given the nature of the proposed China Australia
Free Trade Agreement, improved trade fairness measures will be all the more urgent.
Jan-
2012
May-2
012
Sep-2
012
Jan-
2013
May-2
013
Sep-2
013
Jan-
2014
May-2
014
Sep-2
014
Jan-
2015
May-2
015
0
2
4
6
8
10
12
14
16
18
0
200
400
600
800
1,000
1,200kt
pm
US
DFo
b/t
Month
Reels & Sheets < 150 gsm
Cut Reams
Reels & Sheets < 150 gsm
Cut Reams
SAMPLE

17
Personal Care Market Growth an Ageing StoryWithin Australia and New Zealand’s total tissue products market, the Personal Care segment
is estimated to be worth AUD1.2 billion per annum (based on 2013 retail sales).
Comprised of Feminine, Incontinence and Baby Hygiene products, this market has remained
relatively stable despite currency fluctuations and other financial pressures. The stability of
this segment is likely due to the essential nature of these grocery items.
The combined value of the Feminine and Incontinence Hygiene product markets in Australia
and New Zealand was estimated at AUD560 million in 2013.
Australian listed company Asaleo Care (formerly SCA) manufactures a range of personal
care and hygiene tissue products at its Springvale plant in Victoria.
Asaleo Care leads both the Feminine and Incontinence Hygiene markets with its Libra and
TENA brands.
A summary of the segment is displayed in the table below.
Feminine Hygiene Incontinence Hygiene
Market Value: $335 million Market Value: $225 million
Key Products: Key Products:
- Pads - Tampons - Liners
- Pads (for both men and women) - Tampons (for both men and women - Liners (for both men and women
Key Brands: Key Brands:
- Libra ~ 14% of market (Asaleo care)- U by Kotex ~ 17% of market) (Kimberly-Clark) - Carefree & Stayfree ~ 6% of market (Johnson & Johnson) - Private Labels ~ 6% of market
- TENA ~ 46% of market (Asale Care) - Poise ~ 32 % of market (Kimberly-Clark) - Depend ~ 16% of market (Kimberly Clark) - Private Labels ~ 1% of market
Source: IndustryEdge estimates and Asaleo Care `Estimates based on 2013 retail Sales
As is evident in the table above, both the feminine care hygiene and incontinence hygiene
sub-markets are dominated by branded, premium-price products, with private labels having
minimal impact. It would appear that within this particular segment of the tissue market,
consumers are motivated more by brand-loyalty to reliable, quality products, than by the
cheaper prices of private labels.
Stability in ‘Fem Care’ productsSales of feminine hygiene products maintained a steady, gradual growth trend during the
decade 2003 - 2013. In CY2003, retail sales of feminine hygiene products totalled AUD299
million. By CY2014, sales had grown to an estimated AUD338 million. Of this, sales in retail
outlets accounted for 81% or AUD267 million.
Overall, sales volumes averaged growth of 0.9% per annum since 2003, which matches
the population growth within the section of the female population who typically use these
products. As a non-discretionary product, it is reasonable to assume that sale trends in
feminine hygiene products will continue to mirror any changes in the female population.
SAMPLE

18
The following chart show imports of feminine hygiene products.
Imports of Feminine Hygiene by Product: MQ’09 – MQ’15 (AUDM)
Source: ABS
Valued at AUD34.3 million in MQ’15, the dominant country for supply of imports is Thailand,
which held 40.5% of the total. Other than consistent supplies from Belgium, the majority of
the supply is from Asia.
As a proportion of the total market, the value of imports is estimated by IndustryEdge to
approximate 40%, based only on extrapolation of the import values.
Strong growth in ‘Adult Incontinence’In the adult incontinence sector, growth averaged 12.3% per annum over the decade to
2013. This is displayed in the chart on the next page, which is drawn from data supplied
to the investor community by Asaleo Care, in its June 2014 prospectus. It is notable that
this data includes New Zealand.
Australian and New Zealand Incontinence Hygiene Products Retail Sales: 2003 – 2013 (AUDM)
Source: Asaleo Care
2003
2004
2005
2006
2007
2008
2009
2010
2011
2012
2013
0
20
40
60
80
100
120
AU
DM
Year
MQ'09
SQ'09
MQ'10
SQ'10
MQ'11
SQ'11
MQ'12
SQ'12
MQ'13
SQ'13
MQ'14
SQ'14
MQ'150
5
10
15
20
25
30
35
40
45
AU
DM
Quarter
Sanitary towels
Tampons
value of the adult incontinence hygiene sector has been 12.3% per annum over the decade SA
MPLE
19
In the decade 2003 to 2013, Australian and New Zealand retail sales of incontinence
hygiene products displayed strong growth. From AUD37 million in 2003, sales grew every
year, averaging 12.3% per annum growth, to reach AUD117 million in 2013, more than
triple their value a decade prior.
Demand is not met entirely by the domestically manufactured products. In May 2015,
Australia also imported a total of AUDCif 8.0M worth of incontinence hygiene products from
18 different countries around the world. The highest levels of imports entered Australia from
the Netherland (16.1%), Denmark (15.5%), Germany (14.7%) and Vietnam (10.4%). As
the overall population continues to age, it can be reasonably assumed demand for these
products will continue to grow.
This strong growth can be attributed in the main to the aging population of both countries,
with the numbers of people aged 65 years and over growing each year.
The Australian Bureau of Statistics (ABS) projects the ‘65 and over’ population increasing
rapidly over the next twenty or more years. From 3.2 million in June 2012, (14% of the total
Australian population), the ABS projects that this group will almost double to between 5.7
and 5.8 million by 2031, and continue to grow beyond then.
The ever-increasing average age of the population of both Australia and New Zealand
presents a significant opportunity for manufacturers of incontinence hygiene products, be
they domestic producers or international exporters.
The personal hygiene markets are, based on the latest data, worth a total that is above
AUD450M per annum and growing in line with population growth and its ever ageing profile.
growth and demographic profiles, adult incontinence product users will double in little more than a decade
Emporia price falls to lowest in market as parent company builds more machines in ChinaDespite its advertising efforts and focus on the elusive ‘premium’ toilet tissue market, Solaris Paper’s Emporia product lowered its
colours in June, offering bundle pack prices for approximately 40 cents per roll during a promotional campaign.
Emporia’s sales will have improved from the promotion, but its position is not understood to be impacting the major producers.
Sales data is not available to IndustryEdge, but leaving aside the possibility of year-end stock liquidation, the signs do not look
positive for the admittedly well-packaged entrant to the branded market. Establishing new brands in an era when ‘generics’ and
‘private label’ brands are undermining brand power and category value is inevitably difficult.
Meantime, the company’s parent, Asia Pulp & Paper, (APP) has commissioned six new tissue machines in China in 1H’15, totaling
approximately 300 kt per annum of additional capacity. According to RISI, four of the machines have capacity of 60 kt per annum
each and the other two approximately 27 kt per annum each.
APP is not alone in adding capacity to an already massively over-supplied China. It is however completing another 60 kt per annum
machine at a greenfields site in Central China. At approximately 30% of the production capacity in China, APP’s exports to its
affiliates, including Solaris, are likely to remain important. Whether it is their Emporia retail brand or the ‘Livi’ Away From Home range,
they will be keen to grow their market share, no matter how difficult that proves.
SAMPLE
20
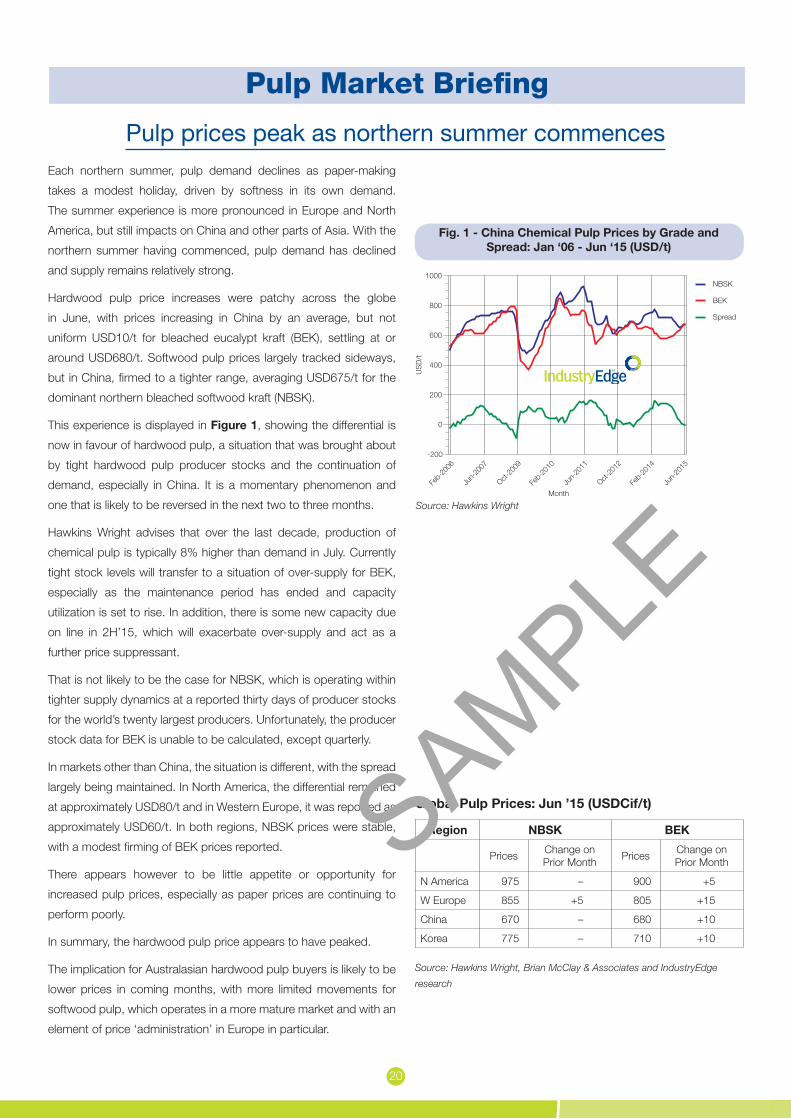
Each northern summer, pulp demand declines as paper-making
takes a modest holiday, driven by softness in its own demand.
The summer experience is more pronounced in Europe and North
America, but still impacts on China and other parts of Asia. With the
northern summer having commenced, pulp demand has declined
and supply remains relatively strong.
Hardwood pulp price increases were patchy across the globe
in June, with prices increasing in China by an average, but not
uniform USD10/t for bleached eucalypt kraft (BEK), settling at or
around USD680/t. Softwood pulp prices largely tracked sideways,
but in China, firmed to a tighter range, averaging USD675/t for the
dominant northern bleached softwood kraft (NBSK).
This experience is displayed in Figure 1, showing the differential is
now in favour of hardwood pulp, a situation that was brought about
by tight hardwood pulp producer stocks and the continuation of
demand, especially in China. It is a momentary phenomenon and
one that is likely to be reversed in the next two to three months.
Hawkins Wright advises that over the last decade, production of
chemical pulp is typically 8% higher than demand in July. Currently
tight stock levels will transfer to a situation of over-supply for BEK,
especially as the maintenance period has ended and capacity
utilization is set to rise. In addition, there is some new capacity due
on line in 2H’15, which will exacerbate over-supply and act as a
further price suppressant.
That is not likely to be the case for NBSK, which is operating within
tighter supply dynamics at a reported thirty days of producer stocks
for the world’s twenty largest producers. Unfortunately, the producer
stock data for BEK is unable to be calculated, except quarterly.
In markets other than China, the situation is different, with the spread
largely being maintained. In North America, the differential remained
at approximately USD80/t and in Western Europe, it was reported as
approximately USD60/t. In both regions, NBSK prices were stable,
with a modest firming of BEK prices reported.
There appears however to be little appetite or opportunity for
increased pulp prices, especially as paper prices are continuing to
perform poorly.
In summary, the hardwood pulp price appears to have peaked.
The implication for Australasian hardwood pulp buyers is likely to be
lower prices in coming months, with more limited movements for
softwood pulp, which operates in a more mature market and with an
element of price ‘administration’ in Europe in particular.
Pulp Market Briefing
Pulp prices peak as northern summer commences
Feb-
2006
Jun-
2007
Oct-20
09
Feb-
2010
Jun-
2011
Oct-20
12
Feb-
2014
Jun-
2015
-200
0
200
400
600
800
1000
US
D/t
Month
NBSK
BEK
Spread
Fig. 1 - China Chemical Pulp Prices by Grade and Spread: Jan ‘06 - Jun ‘15 (USD/t)
Source: Hawkins Wright
Global Pulp Prices: Jun ’15 (USDCif/t)
Region NBSK BEK
Prices Change on Prior Month Prices Change on
Prior Month
N America 975 – 900 +5
W Europe 855 +5 805 +15
China 670 – 680 +10
Korea 775 – 710 +10
Source: Hawkins Wright, Brian McClay & Associates and IndustryEdge
research
SAMPLE

21
Jan-
2013
May-2
013
Sep-2
013
Jan-
2014
May-2
014
Sep-2
014
Jan-
2015
May-2
015
0
20
40
60
80
100
120
140
160
0
20
40
60
80
100
120
140
160
180
200
ktpm
AU
DFo
b/t
Month
China/HK
India
Indonesia
Thailand
Vietnam
Other
TWA
After falling to 100.5 kt in April 2015, exports of recovered paper
rebounded to record 128.1 kt in May 2015.
All grades experienced increased exports compared with the prior
month, with the average price falling AUD15.15/t or 8.2% lower.
The lower prices assisted in lifting total exports, but the prices are
still 4.5% higher on average than a year ago. In part, the pricing is
accounted for by the depreciated Australian Dollar, which sees buyers
– primarily in China – paying less and sellers receiving more than a
year before.
However, the primary reason average prices are higher than a year
ago is because of the make-up of the exports having changed over
the year. As Figure 1 displays, exports of the more valuable Bleached
Chemical (used office) grade have increased 20.8% compared with
May 2014. The driver for this has been a reduction in the storage of
suitable material for Australian Paper’s deinking facility at Maryvale.
That supply side factor has been important in adjusting the price,
but so too have demand side pressures in China. Chinese recycled
paperboard producers have curtailed their demand sharply over 2015.
The result has been that despite recording exports of 50.8 kt in May
2015, that volume is 11.8% less than for May 2014.
On a full year basis, Australian recovered paper exports to China
are estimated to decline 15.8%, falling to 876.3 kt in 2014-15,
down 164.0 kt compared with the prior year. This expected
annual outcome is displayed in Figure 2, clearly showing that
exports to China have fallen to a level not seen since 2006-07.
The 83.7 kt lift in exports to Indonesia has played a significant
part in replacing the volumes to China. That 33.4% year-on-
year increase is important, but the 450% increase in exports to
Thailand is very large, even though it comes off a low base, to
record a likely 82.0 kt in 2014-15.
Prices into Thailand and Indonesia have been modestly softer than
those for the same grades into China.
Recovery proportions and export volumes are both impacted by
consumption in Australia. Although it has crossed the 1.5 Mt barrier
once, in 2012-13, aggregate recovered paper exports appear to
be bound between 1.4 and 1.5 Mt per annum. This has been
maintained in the current year, even though there has been some
turmoil in the complexions of the trade.
The necessary shift in exports brought about by softer Chinese
demand is expected to continue through at least the remainder
of 2015.
Recovered Paper Market Briefing
Exports return to trend as price tumbles
Fig. 1 - Australian Recovered Paper Exports by Country: Jan ’13 - May ’15 (ktpm & AUDFob/t)
Source: ABS
Current Month % Change
MoM1 QoQ2 YoY3
Total Australian exports (kt) 128.1 26.8 -16.5 -1.1
Average export price (AUDFob/t) 170.33 -8.2 2.5 4.5
Unbleached kraft exports (kt) 50.8 26.1 -21.7 -11.8
Mechanical exports (kt) 26.1 31.9 -12.2 6.0
Bleached chemical exports (kt) 12.3 30.5 -24.9 20.8
Other exports (kt) 38.9 23.2 -7.1 9.9
Australian Recovered Fibre Exports: May ’15 (kt, AUDFob/t & %)*
Source: ABS and IndustryEdge research
Notes: 1. MoM compares the current month with the immediate prior month,
2. QoQ compares the latest 3 months with the immediate prior 3 months, 3.
YoY compares the latest 12 months with the immediate prior 12 months.
2005
2006
2007
2008
2009
2010
2011
2012
2013
2014
2015
(e)
0
200
400
600
800
1,000
1,200
1,400
1,600
ktpa
Y/E June
China/HK
India
Indonesia
Malaysia
Philippines
Thailand
Others
Fig. 2 - Australian Recovered Paper Exports by Country: 2005 - 2015 (e) (ktpq)
Source: ABS
SAMPLE

22
6-Ja
n-20
14
21-M
ar-20
14
6-Ju
n-20
14
22-A
ug-2
014
7-Nov
-201
4
2-Fe
b-20
15
22-A
pr-2
015
10-Ju
l-201
50
500
1,000
1,500
2,000
2,500
US
D
Daily
Shipping costs, measured by the Baltic Dry Index (BDI) continued to
rise across June and into early July, growing at its fastest rate since
October 2014. From 9th June to 10th July, the BDI rose a significant
42.8%, reaching 874 points. This is the highest the BDI has been
since 12th December 2014, as Figure 1 shows.
July is typically a month of growth in shipping costs as the northern
hemisphere returns from summer holidays and global production
returns to meet demand. That outcome may be challenged later in
July 2015 as new shipping capacity is scheduled to come on line on
some key routes, including the pacific trade between South America
and North Asia.
Despite shipping costs being linked to fuel costs, the BDI continues
to diverge from the Bunker Fuel Index (BFI), which tracks the cost
of shipping fuels. The BFI declined 5.9% over the month to 8th July,
ending at USD503.16/t. This is the lowest the BFI has been since
10th April and appears to signal that a modest increase in the fuel
component of shipping costs was a ‘dead cat bounce’.
The BFI is displayed in Figure 2. Comparing the two charts, the
divergence in trends is easily observable. One reason for the
divergence cited by commentators is that Greek ship owners
have been unable to buy fuel, reducing demand, while at the
same time, as their vessels idle, the remainder of the global fleet
is in greater demand. As World Maritime News reports, it is all
about supply and demand:
“With over-production on one hand, partly due to the uprising
of shale gas in the United States of America, and weak demand
on the other hand, brought on by the slow economical growth
within the Eurozone.”
The BDI and BFI provide the best trend data on which to assess the
changing costs of shipping, but do not directly reflect movements in
containerised shipping costs. On that front, the world’s busiest port,
Shanghai, reported that container volumes have continued to rise,
growing 0.7% in June 2015, compared with June 2014, but were
2.5% lower than in May 2015. Shanghai’s throughout in June 2015
was a staggering 3.08 million teu (twenty-foot equivalent units).
In summary, modest growth in shipments and recovering shipping
costs appear to be well within check because of European demand
weakness and over-supply of fuel.
Shipping & Freight Briefing
Fig. 1 Baltic Dry Index (Bulk Dry Shipping): 1 Jan ‘14 - 10 Jul ’15 (USD)
Source: EODData
9-Ja
n-20
13
13-Ju
n-20
13
8-Nov
-201
3
10-A
pr-2
014
11-S
ep-2
014
11-F
eb-2
015
10-Ju
l-201
5400
500
600
700
800
900
1,000
1,100
1,200
1,300
US
D/M
t
Daily
Fig. 2 Average Global Bunker Fuel Index Price: 2 Jan’13 - 10 Jul ‘15 (USD/Mt)
Source: BunkerIndex
SAMPLE
23
Jan-
2013
May-2
013
Sep-2
013
Jan-
2014
May-2
014
Sep-2
014
Jan-
2015
May-2
015
0
100
200
300
400
500
600
700
kbdm
t
Month
Japan
Taiwan
China
Korea
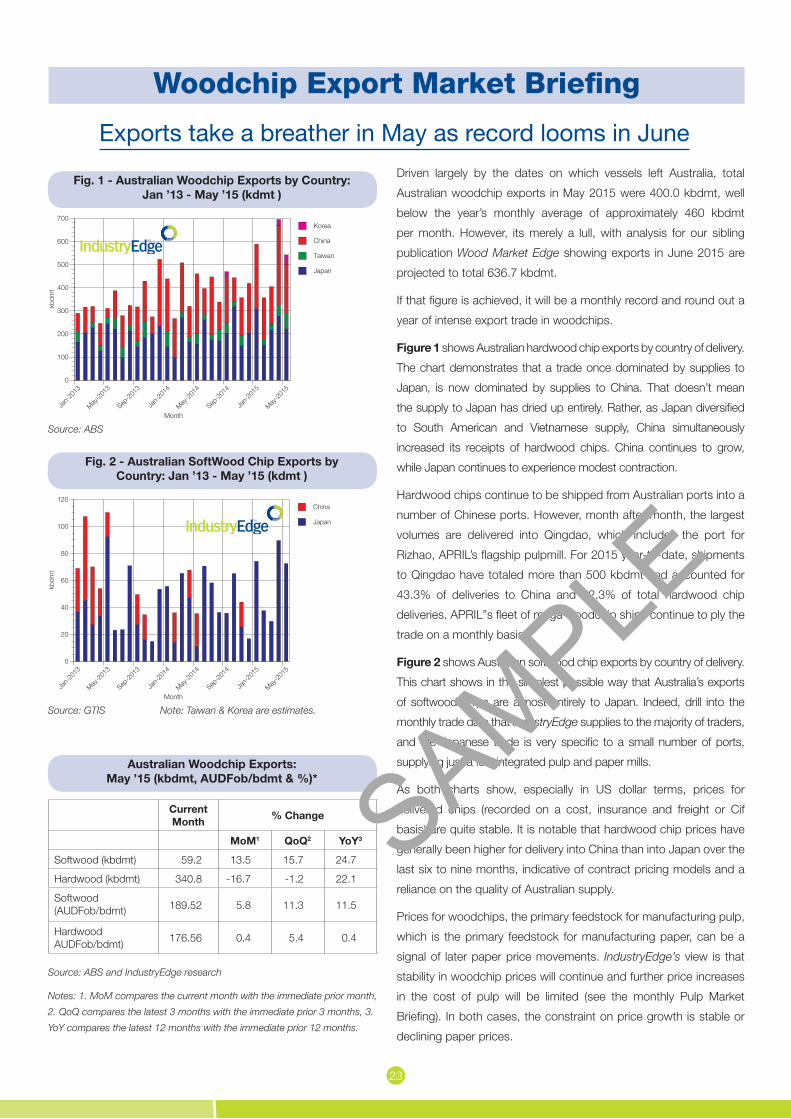
Driven largely by the dates on which vessels left Australia, total
Australian woodchip exports in May 2015 were 400.0 kbdmt, well
below the year’s monthly average of approximately 460 kbdmt
per month. However, its merely a lull, with analysis for our sibling
publication Wood Market Edge showing exports in June 2015 are
projected to total 636.7 kbdmt.
If that figure is achieved, it will be a monthly record and round out a
year of intense export trade in woodchips.
Figure 1 shows Australian hardwood chip exports by country of delivery.
The chart demonstrates that a trade once dominated by supplies to
Japan, is now dominated by supplies to China. That doesn’t mean
the supply to Japan has dried up entirely. Rather, as Japan diversified
to South American and Vietnamese supply, China simultaneously
increased its receipts of hardwood chips. China continues to grow,
while Japan continues to experience modest contraction.
Hardwood chips continue to be shipped from Australian ports into a
number of Chinese ports. However, month after month, the largest
volumes are delivered into Qingdao, which includes the port for
Rizhao, APRIL’s flagship pulpmill. For 2015 year-to-date, shipments
to Qingdao have totaled more than 500 kbdmt and accounted for
43.3% of deliveries to China and 22.3% of total hardwood chip
deliveries. APRIL”s fleet of mega woodchip ships continue to ply the
trade on a monthly basis.
Figure 2 shows Australian softwood chip exports by country of delivery.
This chart shows in the simplest possible way that Australia’s exports
of softwood chips are almost entirely to Japan. Indeed, drill into the
monthly trade data that IndustryEdge supplies to the majority of traders,
and the Japanese trade is very specific to a small number of ports,
supplying just a few integrated pulp and paper mills.
As both charts show, especially in US dollar terms, prices for
delivered chips (recorded on a cost, insurance and freight or Cif
basis) are quite stable. It is notable that hardwood chip prices have
generally been higher for delivery into China than into Japan over the
last six to nine months, indicative of contract pricing models and a
reliance on the quality of Australian supply.
Prices for woodchips, the primary feedstock for manufacturing pulp,
which is the primary feedstock for manufacturing paper, can be a
signal of later paper price movements. IndustryEdge’s view is that
stability in woodchip prices will continue and further price increases
in the cost of pulp will be limited (see the monthly Pulp Market
Briefing). In both cases, the constraint on price growth is stable or
declining paper prices.
Woodchip Export Market Briefing
Exports take a breather in May as record looms in June
Fig. 1 - Australian Woodchip Exports by Country: Jan ’13 - May ’15 (kdmt )
Source: ABS
Current Month % Change
MoM1 QoQ2 YoY3
Softwood (kbdmt) 59.2 13.5 15.7 24.7
Hardwood (kbdmt) 340.8 -16.7 -1.2 22.1
Softwood (AUDFob/bdmt) 189.52 5.8 11.3 11.5
Hardwood AUDFob/bdmt) 176.56 0.4 5.4 0.4
Australian Woodchip Exports: May ’15 (kbdmt, AUDFob/bdmt & %)*
Source: ABS and IndustryEdge research
Notes: 1. MoM compares the current month with the immediate prior month,
2. QoQ compares the latest 3 months with the immediate prior 3 months, 3.
YoY compares the latest 12 months with the immediate prior 12 months.
Jan-
2013
May-2
013
Sep-2
013
Jan-
2014
May-2
014
Sep-2
014
Jan-
2015
May-2
015
0
20
40
60
80
100
120
kbdm
t
Month
Japan
China
Fig. 2 - Australian SoftWood Chip Exports by Country: Jan ’13 - May ’15 (kdmt )
Source: GTIS Note: Taiwan & Korea are estimates.
SAMPLE

24
JJJJJJJJJJJJJJJJJJJJJ
JJJJJJJJ
JJJJJJJJJJJJJJJJJJ
JJJJJJJJ
J
JJJJJJJJJJJJJ
JJJJJJJJJJJ
JJJJJJ
JJJJJJJJ
JJJJJJ
JJJJJJJJJJJ
J
JJJJJJJJJJJJJJJJJJJJJJJJ
BBBBBBBBBBBBBBBBBBBB
B
BBBBBBBB
BBBBBBBBBBBBBBBBBBB
BBBBBBBBBBBBBB
BBBBBBBBBBB
BBBBBBBBB
BBBBBBBBBBBBBBBBBBBBBBBBB
BB
BB
BBBBBB
B
BB
BBBBB
BBBBBBBBBBB
HHHHHHH
HHHH
HHHHHHHHHHHHHHH
HHHHHHHHHHHHHHHHHHHHHHHHHHHHHHHHHHHHHHHHHHHH
HHHHHHHHHH
HHHHHHHHHHHHHHHHHHHHH
HHHHHHHH
HHHHHHHHH
HHHHHHH
HH
HHHHH
HHHH
EEE
E
EEEE
E
EEEE
EEEEE
EEEEE
EEE
E
EE
E
EEEEEEEEEEEEEEEEEEE
EEEEEEEEEEEEEEEEEEEE
EEEEEEEEEEEEEE
EEEEEEEEEEEEEEEEE
EEEEEEEEEEEEEEEEEEEEEEEEEEEEE
EEEEEEE
GGG
GGGGGGGGG
GGGGGG
GGGGG
GGGGGGGGGGGGGGGGG
G
GGGG
GG
GGGGGGGGGG
GGGGGGGGGGGGGGGGGGGGGGGGGGGGGGGGGGGGG
G
GGGGG
GGGGGGGGG
G
G
G
GGGGGG
GG
GGGGGG
GGGGGGGGGG
CCCCCCCC
CCCCCCCCCCCCCCC
CCCCCCCCCCCCCCCC
CCCCCCCCCCC
CCCCCCCCCC
CCCCCCCCC
CCCCCCCCCC
CCCCCCCCCCCCCCCC
CCCCC
CCCCCCCCCCCCCCCCCC
CC
CCCCCCCCCCCCCCC
C
5-Dec
-201
2
12-Ju
n-20
13
18-D
ec-2
013
25-Ju
n-20
14
31-D
ec-2
014
8-Ju
l-201
560
70
80
90
100
110
Inde
x (B
ase:
5 D
ec '1
2 =
100)
(US
D)
Weekly
AustralianDollar
JCanadianDollar
BEuropean Euro
HBritishPound
EJapaneseYen
G
NewZealandDollar
C
SouthKoreanWon
Hardwood pulp prices across the world increased again in June
2015, continuing their nine-month upwards trend. The highest
prices, as always, were found in the USA where they reached
USD900/t, the first time prices have been this high in four years.
Overall, American prices have grown an average of 1% per month
since Sep ’14. Western European prices followed suit, reaching
a two-year high of USD805/t. South Korean prices increased to
USD710/t and Chinese prices reached USD680/t.
Prices for imported packaging continued to display month-by-
month fluctuations over the past year, with no obvious pattern.
Despite tsometimes dramatic variations, overall, prices moved
sideways. Viewed across the 12 months ending May ’15,
corrugating medium prices fell slightly (-2%), while kraftliner
and cartonboard prices held steady. Across the last six years,
corrugating medium prices have been most stable. Kraftliner
prices, low for almost four years, have recovered somewhat in
the last 18 months, now sitting at 91% of their Jan ’09 value.
Despite the AUD’s small recovery in April and May ‘15, prices
of imported A4 White reams continued their long-term growth.
Across the twelve months ending May ‘15, A4 Ream import
prices grew 9.5% to reach their highest level in six years. CWF
Reels < 150 gsm prices increased 1.1% over the past year, while
newsprint continued its long running downwards trend, falling
3.2%. LWC < 60 gsm dropped slightly (1.6%), but appear to be
levelling out higher than two years prior.
Source: Hawkins Wright
May
-200
9
Feb-
2010
Nov-2
012
Aug-
2011
May
-201
2
Feb-
2013
Nov-2
013
Aug-
2014
May
-201
560
65
70
75
80
85
90
95
100
105
110
Ind
ex (B
ase:
Jan
'09 =
100)
Month
A4 White
CWF Reels < 150 gsm
Newsprint
LWC < 60 gsm
AUD/USD
Apr-2
007
Jun-
2008
Aug-2
009
Oct-20
10
Dec-2
011
Feb-
2013
Apr-2
014
Jun-
2015
350
450
550
650
750
850
950
1050
US
D/t
Month
USA
Sth Korea
West Europe
China
May-2
009
Feb-
2010
Nov-2
012
Aug-2
011
May-2
012
Feb-
2013
Nov-2
013
Aug-2
014
May-2
015
60
65
70
75
80
85
90
95
100
105
110
Inde
x (B
ase:
Jan
'09
= 10
0)
Month
Kraftliner
CorrugatingMedium
Ctd Carton
AUD/USD
Eucalyptus Pulp Prices by Region: Jan ‘07 - Jun ‘15
Australian Packaging Import Price Index: Jan’09 - May’15
Main Trading Currencies: 5 Dec ‘12 - 8 Jul ‘15
Australian P&C Import Price Index: Jan’09 - May’15
Source: ABS & Uni of BC
Source: ABS & Uni of BC
Against the US Dollar, all currencies except the British Pound
and the Japanese Yen, traded lower over the last month, driven
primarily by Eurozone weakness, exemplified by the Greek
debt crisis. The Pound was stable and the Yen rose 1.8%. The
Australian Dollar declined 3.1%, the Canadian Dollar a similar
3.0%, the Euro 2.1% and the South Korean Won 1.3%. The NZ
Dollar declined 5.3%, coming off a prolonged period of strength.
Source: Uni of BC
SAMPLE
25
Jan-
2013
May-2
013
Sep-2
013
Jan-
2014
May-2
014
Sep-2
014
Jan-
2015
May-2
015
1,000
1,500
2,000
2,500
3,000
3,500
4,000
AU
DFo
b/t
Month
Toilet
Facial
TWA
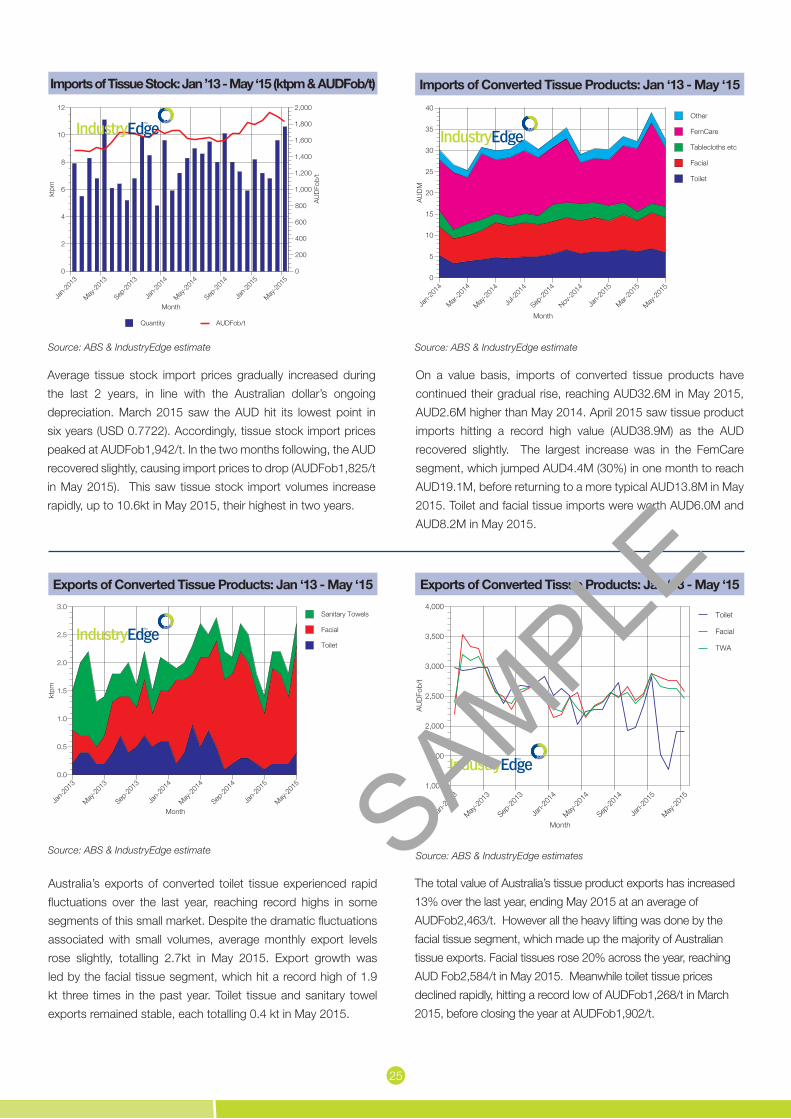
On a value basis, imports of converted tissue products have
continued their gradual rise, reaching AUD32.6M in May 2015,
AUD2.6M higher than May 2014. April 2015 saw tissue product
imports hitting a record high value (AUD38.9M) as the AUD
recovered slightly. The largest increase was in the FemCare
segment, which jumped AUD4.4M (30%) in one month to reach
AUD19.1M, before returning to a more typical AUD13.8M in May
2015. Toilet and facial tissue imports were worth AUD6.0M and
AUD8.2M in May 2015.
Australia’s exports of converted toilet tissue experienced rapid
fluctuations over the last year, reaching record highs in some
segments of this small market. Despite the dramatic fluctuations
associated with small volumes, average monthly export levels
rose slightly, totalling 2.7kt in May 2015. Export growth was
led by the facial tissue segment, which hit a record high of 1.9
kt three times in the past year. Toilet tissue and sanitary towel
exports remained stable, each totalling 0.4 kt in May 2015.
The total value of Australia’s tissue product exports has increased
13% over the last year, ending May 2015 at an average of
AUDFob2,463/t. However all the heavy lifting was done by the
facial tissue segment, which made up the majority of Australian
tissue exports. Facial tissues rose 20% across the year, reaching
AUD Fob2,584/t in May 2015. Meanwhile toilet tissue prices
declined rapidly, hitting a record low of AUDFob1,268/t in March
2015, before closing the year at AUDFob1,902/t.
Source: ABS & IndustryEdge estimate Source: ABS & IndustryEdge estimate
Source: ABS & IndustryEdge estimate Source: ABS & IndustryEdge estimates
Jan-
2013
May-2
013
Sep-2
013
Jan-
2014
May-2
014
Sep-2
014
Jan-
2015
May-2
015
0
2
4
6
8
10
12
0
200
400
600
800
1,000
1,200
1,400
1,600
1,800
2,000
ktpm
AU
DFo
b/t
Month
Quantity AUDFob/t
Jan-
2013
May-2
013
Sep-2
013
Jan-
2014
May-2
014
Sep-2
014
Jan-
2015
May-2
015
0.0
0.5
1.0
1.5
2.0
2.5
3.0
ktpm
Month
Toilet
Facial
Sanitary Towels
Average tissue stock import prices gradually increased during
the last 2 years, in line with the Australian dollar’s ongoing
depreciation. March 2015 saw the AUD hit its lowest point in
six years (USD 0.7722). Accordingly, tissue stock import prices
peaked at AUDFob1,942/t. In the two months following, the AUD
recovered slightly, causing import prices to drop (AUDFob1,825/t
in May 2015). This saw tissue stock import volumes increase
rapidly, up to 10.6kt in May 2015, their highest in two years.
Jan-
2014
Mar-20
14
May-2
014
Jul-2
014
Sep-2
014
Nov-2
014
Jan-
2015
Mar-20
15
May-2
015
0
5
10
15
20
25
30
35
40
AU
DM
Month
Toilet
Facial
Tablecloths etc
FemCare
Other
Imports of Tissue Stock: Jan ’13 - May ‘15 (ktpm & AUDFob/t) Imports of Converted Tissue Products: Jan ‘13 - May ‘15
Exports of Converted Tissue Products: Jan ‘13 - May ‘15 Exports of Converted Tissue Products: Jan ‘13 - May ‘15
SAMPLE
26
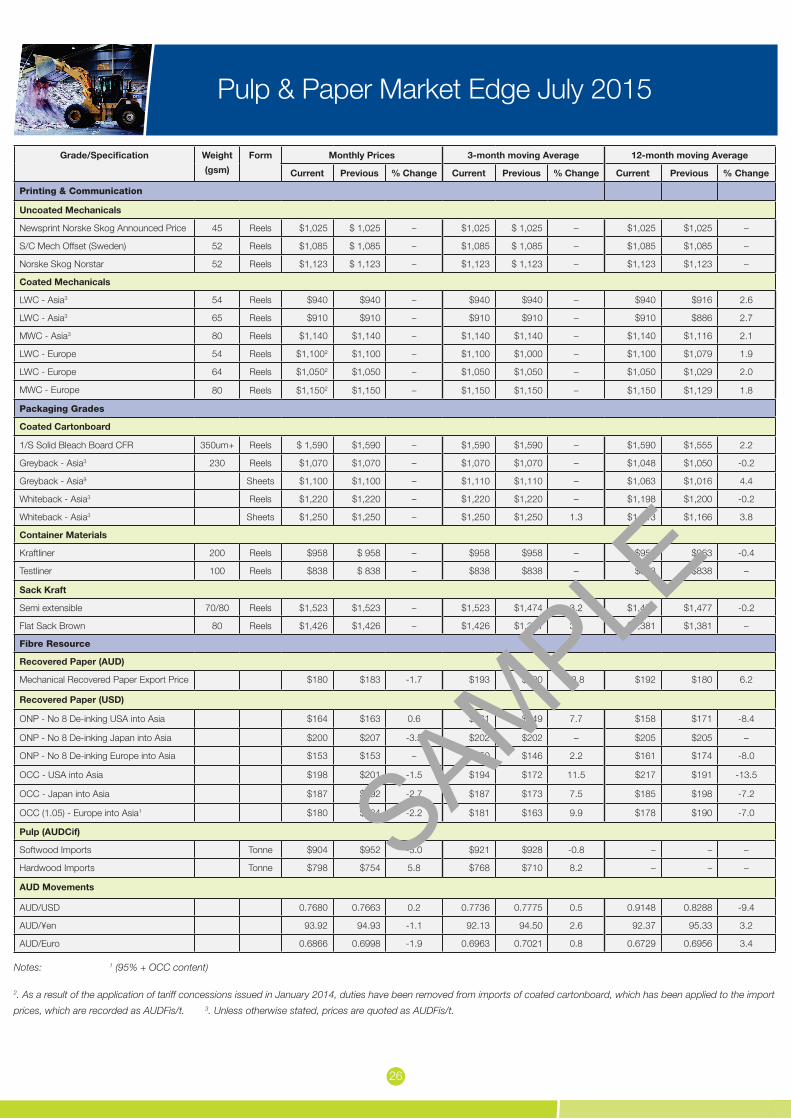
Pulp & Paper Market Edge July 2015
Grade/Specification Weight
(gsm)
Form Monthly Prices 3-month moving Average 12-month moving Average
Current Previous % Change Current Previous % Change Current Previous % Change
Printing & Communication
Uncoated Mechanicals
Newsprint Norske Skog Announced Price 45 Reels $1,025 $ 1,025 – $1,025 $ 1,025 – $1,025 $1,025 –
S/C Mech Offset (Sweden) 52 Reels $1,085 $ 1,085 – $1,085 $ 1,085 – $1,085 $1,085 –
Norske Skog Norstar 52 Reels $1,123 $ 1,123 – $1,123 $ 1,123 – $1,123 $1,123 –
Coated Mechanicals
LWC - Asia3 54 Reels $940 $940 – $940 $940 – $940 $916 2.6
LWC - Asia3 65 Reels $910 $910 – $910 $910 – $910 $886 2.7
MWC - Asia3 80 Reels $1,140 $1,140 – $1,140 $1,140 – $1,140 $1,116 2.1
LWC - Europe 54 Reels $1,1002 $1,100 – $1,100 $1,000 – $1,100 $1,079 1.9
LWC - Europe 64 Reels $1,0502 $1,050 – $1,050 $1,050 – $1,050 $1,029 2.0
MWC - Europe 80 Reels $1,1502 $1,150 – $1,150 $1,150 – $1,150 $1,129 1.8
Packaging Grades
Coated Cartonboard
1/S Solid Bleach Board CFR 350um+ Reels $ 1,590 $1,590 – $1,590 $1,590 – $1,590 $1,555 2.2
Greyback - Asia3 230 Reels $1,070 $1,070 – $1,070 $1,070 – $1,048 $1,050 -0.2
Greyback - Asia3 Sheets $1,100 $1,100 – $1,110 $1,110 – $1,063 $1,016 4.4
Whiteback - Asia3 Reels $1,220 $1,220 – $1,220 $1,220 – $1,198 $1,200 -0.2
Whiteback - Asia3 Sheets $1,250 $1,250 – $1,250 $1,250 1.3 $1,213 $1,166 3.8
Container Materials
Kraftliner 200 Reels $958 $ 958 – $958 $958 – $959 $963 -0.4
Testliner 100 Reels $838 $ 838 – $838 $838 – $838 $838 –
Sack Kraft
Semi extensible 70/80 Reels $1,523 $1,523 – $1,523 $1,474 3.2 $1,474 $1,477 -0.2
Flat Sack Brown 80 Reels $1,426 $1,426 – $1,426 $1,381 3.2 $1,381 $1,381 –
Fibre Resource
Recovered Paper (AUD)
Mechanical Recovered Paper Export Price $180 $183 -1.7 $193 $200 -3.8 $192 $180 6.2
Recovered Paper (USD)
ONP - No 8 De-inking USA into Asia $164 $163 0.6 $161 $149 7.7 $158 $171 -8.4
ONP - No 8 De-inking Japan into Asia $200 $207 -3.5 $202 $202 – $205 $205 –
ONP - No 8 De-inking Europe into Asia $153 $153 – $150 $146 2.2 $161 $174 -8.0
OCC - USA into Asia $198 $201 -1.5 $194 $172 11.5 $217 $191 -13.5
OCC - Japan into Asia $187 $192 -2.7 $187 $173 7.5 $185 $198 -7.2
OCC (1.05) - Europe into Asia1 $180 $184 -2.2 $181 $163 9.9 $178 $190 -7.0
Pulp (AUDCif)
Softwood Imports Tonne $904 $952 -5.0 $921 $928 -0.8 – – –
Hardwood Imports Tonne $798 $754 5.8 $768 $710 8.2 – – –
AUD Movements
AUD/USD 0.7680 0.7663 0.2 0.7736 0.7775 0.5 0.9148 0.8288 -9.4
AUD/¥en 93.92 94.93 -1.1 92.13 94.50 2.6 92.37 95.33 3.2
AUD/Euro 0.6866 0.6998 -1.9 0.6963 0.7021 0.8 0.6729 0.6956 3.4
Notes: 1 (95% + OCC content)
2. As a result of the application of tariff concessions issued in January 2014, duties have been removed from imports of coated cartonboard, which has been applied to the import
prices, which are recorded as AUDFis/t. 3. Unless otherwise stated, prices are quoted as AUDFis/t.
SAMPLE