pumped storage units to stabilize mixed islanded power ... · islanded power network: a transient...
TRANSCRIPT

Pumped storage units to stabilize mixed islanded power network: a transient analysis
C. Nicolet Power Vision Engineering sàrl 1 ch. Champs-Courbes 1024 Ecublens Switzerland
Y. Vaillant Laboratory for Hydraulic Machines 33 bis av. Cour EPFL 1007 Lausanne Switzerland
B. Kawkabani Laboratory of Electrical Machines EPFL 1015 Lausanne Switzerland
P. Allenbach Laboratory of Electrical Machines EPFL 1015 Lausanne Switzerland
J.-J. Simond Laboratory of Electrical Machines EPFL 1015 Lausanne, Switzerland
F. Avellan Laboratory for Hydraulic Machines 33 bis av. Cour EPFL 1007 Lausanne Switzerland
Abstract This paper presents the modeling, numerical simulations and analysis of the stability of a mixed islanded power network of 1’750 MW comprising 1’300 MW of classical thermal power plant, 200 MW of wind power and 250 MW of hydropower. First, the modeling of each power plant is fully described. The model of the thermal power plants includes constant pressure steam tank, a high-pressure steam turbine, a re-heater, and 2 low pressure steam turbines, the rotating inertias, and a 1’400 MVA turbo-generator with proportional power controller and a voltage regulator. The 200 MW wind farm is modeled through an equivalent machine approach of 100 wind turbines of 2MW. The wind farm model comprises a stochastic model of wind evolution with wind gust, a power coefficient based model of wind turbine with a-priori controller and a synchronous generator with voltage regulator. Finally, the 250 MW hydraulic power plant model comprises the upstream reservoir, a 2'000 meters gallery, a surge tank, the 900 meters long penstock feeding a 3-machine-type unit with one pump and one Francis turbine on the same shaft line and connected together via a by-pass to be operated in hydraulic short circuit and connected to the downstream tank through a 250 meters long tailrace water tunnel. The 3 power plants are connected to a passive consumer load via a 500 KV electrical line network. Then, the capability of the pumped storage plant to compensate wind power variations is investigated through SIMSEN time domain simulation of the entire mixed islanded power network. Two different cases are considered: (i) wind power fluctuations compensated by the power adjustment of the pump operating in hydraulic short-circuit operation with the turbine, (ii) safety wind farm shutdown due to wind velocity increase above maximum permissible value compensated by pump to turbine mode change-over. Safe and stable operation for the 2 above mentioned cases are presented and discussed.
1. Introduction As wind energy is a highly variable energy source, islanded power networks featuring high level of wind power penetration are subjected to undesired perturbation jeopardizing the power network stability [18]. Consequently, pumped storage plants can significantly improve the stability of mixed islanded power network due to their production flexibility. Moreover, 3-machine-type units, with turbine, generator, fluid coupling clutch and pump, offer numbers of operation advantages despite a higher investment cost compared to variable-speed pump turbine. The operation advantages of the 3-machine-type units are the following [4]: (i) increased efficiency in pump and turbine modes, (ii) high operational flexibility due to rapid change of operation mode from pump to turbine and vice-versa, (iii) easy and short time start-up in pump mode, (iv) adjustable pump power in hydraulic short-circuit operation, (v) efficient condenser modes. The high dynamic performances of such pumped storage plants are of highest interest for improving stability of mixed islanded power network, but require reliable simulation model of the entire power network for safety and optimization purposes. This paper presents the modeling, numerical simulations and analysis of the stability of a mixed islanded power network of 1’750 MW comprising 1’300 MW of classical thermal power plant, 200 MW of wind power and 250 MW of hydropower presented in Figure 1. First, the modeling of each power plant is fully described. The model of the thermal power plants includes constant pressure steam tank, a high-pressure steam turbine, a re-heater, and 2 low pressure steam turbines, the rotating inertias, and a 1’400 MVA turbo-generator with proportional power controller and a voltage regulator. The 200 MW wind farm is modeled through an equivalent machine approach of 100 wind turbines of 2MW. The wind farm model comprises a stochastic model of wind evolution with wind gust, a power coefficient based model of wind turbine with a-priori controller and a synchronous generator with voltage regulator. Finally, the 250 MW hydraulic power plant model comprises the upstream reservoir, a 2'000 meters gallery, a surge tank, the 900 meters long penstock feeding a 3-machine-type unit with one pump and one

Francis turbine on the same shaft line and connected together via a by-pass to be operated in hydraulic short circuit and connected to the downstream tank through a 250 meters long tailrace water tunnel. The 3 power plants are connected to a passive consumer load via a 500 KV electrical line network. Then, the capability of the pumped storage plant to compensate wind power variations is investigated through SIMSEN time domain simulation of the entire mixed islanded power network. Two different cases are considered: (i) wind power fluctuations compensated by the power adjustment of the pump operating in hydraulic short-circuit with the turbine, (ii) safety wind farm shutdown due to wind velocity increase above maximum permissible value compensated by pump to turbine mode change-over. Safe and stable operation for the 2 above mentioned cases are presented and discussed.
Figure 1 Mixed islanded power network.
2. Modeling of the Hydraulic Machinery and Systems By assuming uniform pressure and velocity distributions in the cross section and neglecting the convective terms, the one-dimensional momentum and continuity balances for an elementary pipe filled with water of length dx, cross section A and wave speed a, see Figure 2, yields to the following set of hyperbolic partial differential equations [19]:
2
2
0
1 02λ
∂ ∂+ ⋅ = ∂ ∂
∂ ∂ + ⋅ + ⋅ =∂ ∂
h a Qt gA x
Qh Q Qx gA t gDA
(1)
The system (1) is solved using the Finite Difference Method with a 1st order centered scheme discretization in space and a scheme of Lax for the discharge variable. This approach leads to a system of ordinary differential equations that can be represented as a T-shaped equivalent scheme [8], [13], [17] as presented in Figure 3. The RLC parameters of this equivalent scheme are given by:
22
λ ⋅ ⋅=
⋅ ⋅ ⋅
Q dxR
g D A =
⋅dxL
g A 2
⋅ ⋅=
g A dxCa
(2)
Where λ is the local loss coefficient. The hydraulic resistance R, the hydraulic inductance L, and the hydraulic capacitance C correspond respectively to energy losses, inertia and storage effects. The model of a pipe of length L is made of a series of nb elements based on the equivalent scheme of Figure 3. The system of equations relative to this model is set-up using Kirchoff laws. The model of the pipe, as well as the model of valve, surge tank, Francis turbine, etc, is implemented in the EPFL software SIMSEN, developed for the simulation of the dynamic behavior of hydroelectric power plants, [11], [14]. The time domain integration of the full system is achieved in SIMSEN by a Runge-Kutta 4th order procedure.

Figure 2 Elementary hydraulic pipe of
length dx. Figure 3 Equivalent circuit of an elementary pipe of
length dx. As presented in Table 1, the modeling approach based on equivalent schemes of hydraulic components is extended to all the standard hydraulic components such as valve, surge tanks, air vessels, cavitation development, Francis pump-turbines, Pelton turbines, Kaplan turbines, pump, etc, see [11].
Table 1 Modeling of hydraulic components with related equivalent schemes.

3. Hydraulic Power Plant Model The layout of the hydraulic power plant is presented in Figure 4. The power plant is made of an upstream reservoir, a 1'950 meters long gallery, a 885 meters long penstock connected to a 3 machine-type unit of 250 MW and connected to the downstream reservoir by a tailrace water tunnel of 250 meters long. The 3 machines-type arrangement is composed of a Francis turbine of 250 MW, the synchronous generator of 280 MVA, a pump of 250 MW and a clutch between the generator and the pump. Moreover there are 2 protection valves for both hydraulic machines. The turbine is equipped with a PID turbine speed governor and the generator is controlled by an ABB Unitrol voltage regulator. Table 2 gives the main characteristics of the hydraulic power plant of Figure 4. The clutch characteristic is taken from [2].
Figure 4 Hydraulic power plant model.
Table 2 Hydraulic power plant characteristics.
Turbine Pump GeneratorPR=250 MW NR=500 rpm QR=55 m3/s HR=315 m ν=0.22 Jturbine=1.05*105 kgm2
PR=250 MW NR=-500 rpm QR=-55 m3/s HR=315 m ν =0.22 Jpump=1.05*105 kgm2
Rated apparent power: 280 MVA Rated phase to phase voltage: 17.5kV Frequency: 50 Hz Number of pairs of poles: 6 Stator windings: Y Jrotor=8.1*105 kgm2
4. Thermal Power Plant Model The model of the 1.3 GW thermal power plant is based on steam flux and takes into account a constant pressure steam vessel, a regulating valve, a high pressure steam turbine, a steam transit through a re-heater and two low pressure steam turbines as presented in Figure 5. The model is based on valve and torque characteristics deduced from [3], on first order transfer functions for the turbine dynamics with τHP , τLP time constants, a re-heater modeled by a time delay b, and on a proportional regulator of constant Kp. The shaft line comprises 4 rotating inertias connected by 3 shaft with given stiffness and damping. And finally a turbo generator with 2 pairs of poles is also included in the model with the ABB Unitrol voltage regulator. The parameters of the model are given in Table 3 and details of the model can be found in [12].
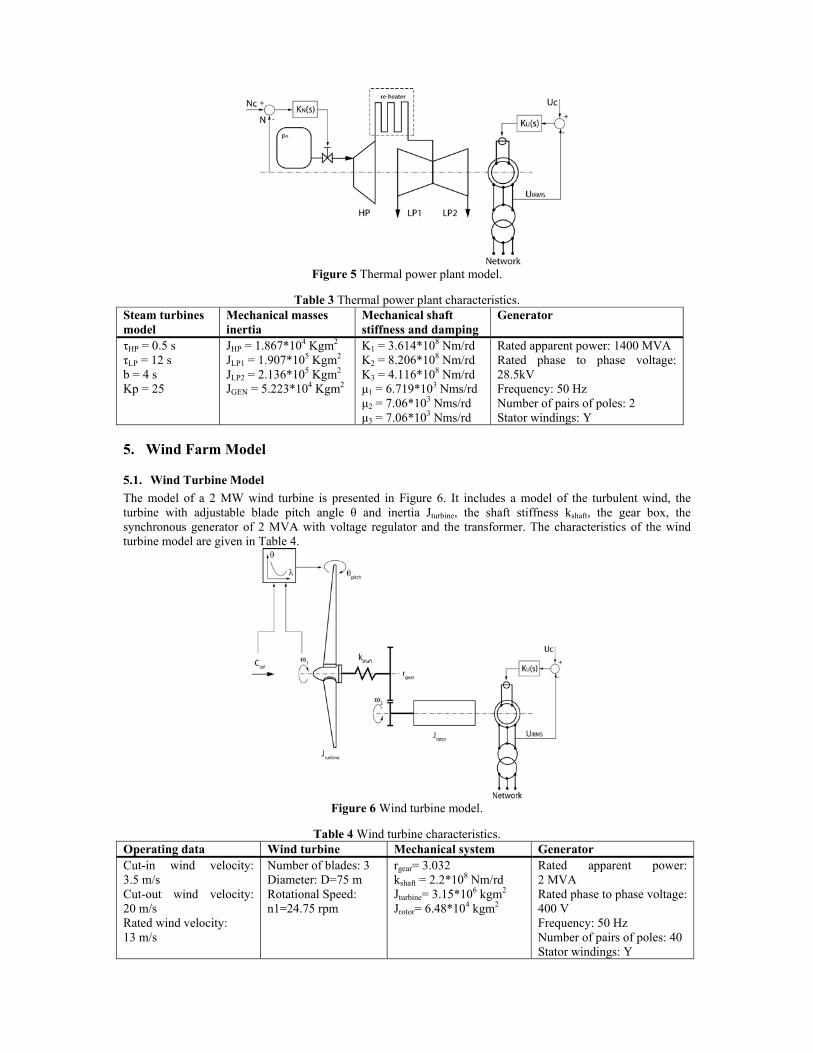
Figure 5 Thermal power plant model.
Table 3 Thermal power plant characteristics.
Steam turbines model
Mechanical masses inertia
Mechanical shaft stiffness and damping
Generator
τHP = 0.5 s τLP = 12 s b = 4 s Kp = 25
JHP = 1.867*104 Kgm2 JLP1 = 1.907*105 Kgm2 JLP2 = 2.136*105 Kgm2 JGEN = 5.223*104 Kgm2
K1 = 3.614*108 Nm/rd K2 = 8.206*108 Nm/rd K3 = 4.116*108 Nm/rd µ1 = 6.719*103 Nms/rd µ2 = 7.06*103 Nms/rd µ3 = 7.06*103 Nms/rd
Rated apparent power: 1400 MVA Rated phase to phase voltage: 28.5kV Frequency: 50 Hz Number of pairs of poles: 2 Stator windings: Y
5. Wind Farm Model
5.1. Wind Turbine Model The model of a 2 MW wind turbine is presented in Figure 6. It includes a model of the turbulent wind, the turbine with adjustable blade pitch angle θ and inertia Jturbine, the shaft stiffness kshaft, the gear box, the synchronous generator of 2 MVA with voltage regulator and the transformer. The characteristics of the wind turbine model are given in Table 4.
Figure 6 Wind turbine model.
Table 4 Wind turbine characteristics.
Operating data Wind turbine Mechanical system Generator Cut-in wind velocity: 3.5 m/s Cut-out wind velocity: 20 m/s Rated wind velocity: 13 m/s
Number of blades: 3 Diameter: D=75 m Rotational Speed: n1=24.75 rpm
rgear= 3.032 kshaft = 2.2*108 Nm/rd Jturbine= 3.15*106 kgm2
Jrotor= 6.48*104 kgm2
Rated apparent power: 2 MVA Rated phase to phase voltage: 400 V Frequency: 50 Hz Number of pairs of poles: 40 Stator windings: Y

The turbulent wind model is composed of a wind mean value and a wind gust, as suggested by Slootweg et al. [15]. The turbulent gust is modeled by a Pseudo-Random-Binary-Sequence, PRBS, obtained by a shift register method, see [6]. The mechanical power transmitted by the fluid to the wind turbine can be expressed as:
3inf
12ρ= ⋅ ⋅ ⋅P Aref Cp C (3)
Where Aref is the swept area and Cp is the power coefficient and ρ is the air density. Heier [7] provides an empiric approximation of the wind turbine power coefficient:
21/116( , ) 0.5 0.4 5 λλ θ θλ
− = − − ⋅
i
i
Cp e (4)
With:
3
11 0.0350.08 1
λ
λ θ θ
=−
+ +
i (5)
Where λ is the tip speed ratio given by:
1
inf inf2ω
λ⋅
= =⋅
reft DUC C
(6)
Where Ut is the blade tip velocity, Cinf is the wind velocity and ω1 is the wind turbine rotating pulsation. Figure 7 presents the power coefficient Cp of a wind turbine as function of the tip speed ratio λ and of the blade pitch angle θ obtained according to equation (4).
0 4 8 12 16 20Tip Speed Ratio: λ = Ut/Cinf [-]
0
0.2
0.4
Cp [
-]
0°1°2°5°10°15°20°25°35°50°
Figure 7 Wind turbine characteristic according to equation (4).
Then, the wind turbine output power is calculated from Figure 7 and thus equation (4), as function of the tip speed ratio as presented in Figure 8, see also [16]. The blade pitch angle given as function of the tip speed ratio is also represented in Figure 8. For tip speed ratio above 8, the pitch angle is selected to provide the highest power coefficient while below 8 it is selected to generate the 2 MW output power limit. The blade pitch angle is driven by a look-up table as function of the tip speed ratio as represented in Figure 6.

0 4 8 12 16 20Tip Speed Ratio: λ = Ut/Cinf [-]
0
0.4
0.8
1.2
P/P n
[-]
0
20
40
60
80
C [m
/s]
; θ [d
eg]
P/PnPmax/PnCinfCmaxTheta
Figure 8 Wind turbine power, pitch angle and wind velocity and related limits
as function of the tip speed ratio.
5.2. Aggregated Wind Farm model For power grid stability purposes, it is possible to use an aggregated wind farm model, consisting of one wind turbine equivalent to n single wind turbines as presented in Figure 9, see [1]. Then according to the energy conservation and in order to keep the same torsional mode eigenfrequency, the active power Pn, rotating inertias J, the shaft stiffness kshaft and the swept area Aref are multiplied by the number of wind turbines n. The parameters of the synchronous generator being given in per unit, they are kept constant. For the present study, only one equivalent machine can be used as no electrical faults are considered [1].
Figure 9 Wind turbine farm of 100 x 2 MW modeled as an equivalent wind turbine of 200 MW.

6. Mixed Islanded Power Network Model Figure 10 presents the full SIMSEN model of the mixed islanded power network of Figure 1 based on the hydraulic, thermal and wind power plant models described above. The model also includes the 500 kV transmission lines and the passive consumer load. The models of the electrical machines are based on 2 equivalent rotor circuits in the direct axis and 1 equivalent rotor circuit in the quadrature axis considering saturation, leakage and damping effects of windings, allowing taking into account a subtransient behavior, see [5].
Figure 10 Mixed Islanded Power Network SIMSEN model.
7. Transient Behavior of Mixed Islanded Power Network Two different cases are considered for the analysis of the dynamic behavior of the mixed islanded power network of Figure 10:
- wind power fluctuations compensated by pump power adjustment with hydraulic short-circuit operation;
- wind farm shutdown due to wind velocity increase above maximum permissible value compensated by pump to turbine mode change-over.
7.1. Fluctuating Wind Power Compensated by Hydraulic Short Circuit Operation The first case study consists of the compensation of the output power increase of the wind farm due to wind velocity increase from a mean value of Cinf=7.5 m/s to Cinf=15 m/s. The initial conditions of the power flow of
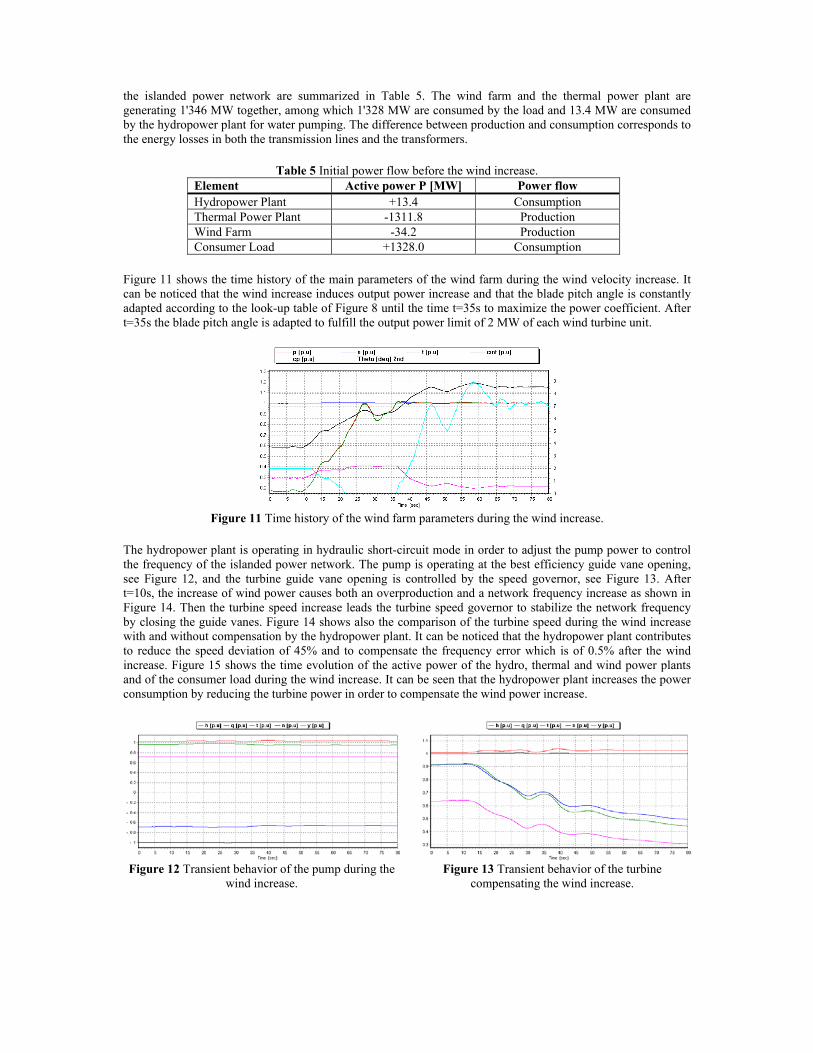
the islanded power network are summarized in Table 5. The wind farm and the thermal power plant are generating 1'346 MW together, among which 1'328 MW are consumed by the load and 13.4 MW are consumed by the hydropower plant for water pumping. The difference between production and consumption corresponds to the energy losses in both the transmission lines and the transformers.
Table 5 Initial power flow before the wind increase. Element Active power P [MW] Power flow Hydropower Plant +13.4 Consumption Thermal Power Plant -1311.8 Production Wind Farm -34.2 Production Consumer Load +1328.0 Consumption
Figure 11 shows the time history of the main parameters of the wind farm during the wind velocity increase. It can be noticed that the wind increase induces output power increase and that the blade pitch angle is constantly adapted according to the look-up table of Figure 8 until the time t=35s to maximize the power coefficient. After t=35s the blade pitch angle is adapted to fulfill the output power limit of 2 MW of each wind turbine unit.
Figure 11 Time history of the wind farm parameters during the wind increase.
The hydropower plant is operating in hydraulic short-circuit mode in order to adjust the pump power to control the frequency of the islanded power network. The pump is operating at the best efficiency guide vane opening, see Figure 12, and the turbine guide vane opening is controlled by the speed governor, see Figure 13. After t=10s, the increase of wind power causes both an overproduction and a network frequency increase as shown in Figure 14. Then the turbine speed increase leads the turbine speed governor to stabilize the network frequency by closing the guide vanes. Figure 14 shows also the comparison of the turbine speed during the wind increase with and without compensation by the hydropower plant. It can be noticed that the hydropower plant contributes to reduce the speed deviation of 45% and to compensate the frequency error which is of 0.5% after the wind increase. Figure 15 shows the time evolution of the active power of the hydro, thermal and wind power plants and of the consumer load during the wind increase. It can be seen that the hydropower plant increases the power consumption by reducing the turbine power in order to compensate the wind power increase.
Figure 12 Transient behavior of the pump during the wind increase.
Figure 13 Transient behavior of the turbine compensating the wind increase.

Figure 14 Comparison of the turbine rotational speed (network frequency) with and without wind
compensation.
Figure 15 Active power of the wind farm, hydropower plant, thermal power plant and of the consumer load
during wind increase.
7.2. Wind Farm Shutdown Compensation by Pump to Turbine Change-over The second case study consists of the shutdown of the wind farm after 10 minutes due to wind velocity increases up to Cinf=22 m/s which is over Cinf=20 m/s the maximum value allowed for a safe wind farm operation. At t=10s, the normal shutdown of the wind farm is initiated. The initial conditions of the power flow are presented in Table 6. The hydropower plant operating in hydraulic short-circuit is consuming 153.3 MW of wind power over-production. The shutdown of the wind farm causes the loss of 187.1 MW of generation that is compensated by the hydropower plant operation mode change-over from pump to turbine mode starting also at t=10s. The global procedure is the following:
- t=10s: the wind turbine blade angle is increased to reduce the wind power production, see Figure 16; - t=10s: the pump protection valve is closed with bilinear closure law in 20s, see Figure 16; - t=20s: the fluid coupling between the generator and the pump is disabled linearly in 25s; - t=28.5s: the circuit breaker between the wind farm and the power network, see Figure 10, is tripped.
Table 6 Initial power flow before wind farm shutdown.
Element Active power P [MW] Power flow Hydropower Plant +153.3 Consumption Thermal Power Plant -1295.5 Production Wind Farm -187.1 Production Consumer Load +1324.1 Consumption
Figure 17 shows the time evolution of the wind farm during the shutdown. After t=10s, the blade pitch angle is increasing linearly, reducing the active power. At t=28.5s, the circuit breaker is tripped and the rotational speed of the wind turbines decreases due to the negative torque of the turbines. Figure 18 and Figure 19 show respectively the pump and turbine transients. After t=10 s, the discharge of the pump is reduced to zero by the valve closure that increases the pump head and reduces the pump torque. After t=30 s, due to the fluid coupling disabling, the rotational speed of the pump starts to reduce. Consequently, the turbine speed governor acts on the turbine guide vanes to compensate both pump and wind farm power variations. Figure 20 shows the time evolution of the discharge in the penstock, turbine and pump during the transient. Initially the discharge is negative in the penstock due to pump operation. After pump shutdown, the discharge becomes positive and finally corresponds to the turbine discharge when the pump valve is closed.
Figure 16 Time evolution of the valve opening of the pump, of the clutch state and of the wind turbine pitch
angle of the blade.
Figure 17 Wind farm transient during shutdown.

Figure 18 Pump transient behavior due to pump shutdown and wind farm shutdown.
Figure 19 Turbine transient behavior during pump to turbine change-over and wind farm shutdown.
Figure 20 Discharge in the turbine, pump and penstock during pump
to turbine change-over and wind farm shutdown. The time evolution of the active power during the transient is presented in Figure 21. It can be seen that the wind power is reduced almost linearly in 18.5 s until the tripping of the circuit breaker, while the hydropower plant power change is carried out within 35 s. Figure 22 shows the comparison of the network frequency with and without compensation of the wind farm shutdown by the hydropower plant. It can be seen that the hydropower plant operation mode change-over enables to reduce frequency deviation but mainly to recover nominal frequency 40 s after the wind farm safety shutdown.
Figure 21 Active power of the wind farm, hydropower plant, thermal power plant and of the consumer load during pump to turbine change-over and wind farm
shutdown.
Figure 22 Comparison of the turbine rotational speed (network frequency) with and without pump to turbine
change-over during wind farm shutdown.
8. Conclusions This paper presents the modeling with a high level of complexity for all the energy sources including control systems of a mixed islanded power network comprising hydraulic, thermal and wind power plants and a consumer load. The simulation of the dynamic behavior of the entire power network enables to demonstrate the capability of a 3 type-machine hydro unit to compensate efficiently wind power fluctuations in an islanded power network. This analysis using multi-physics simulation approach is crucial to:
- determine and validate the appropriate governor parameters; - determine pump/turbine operation mode change-over procedures; - assess the power network stability; - check the safety of the installations.
However dynamic performances of the 3 type-machine units could be probably significantly improved using new technologies such as Power System Stabilizers PSS see [9], [12] or variable speed technologies [4], [10] and contribute to make hydropower the ideal companion of wind power.
9. Acknowledgements The authors would like to thank Dr. Jean-Jacques Hérou from EDF-CIH, and Mr. Bob Greiveldinger for their great contribution to the modelling of the thermal power plant. For this paper, the authors took advantages of the development of the SIMSEN hydraulic extension, developed with the financial support of: CTI, Swiss Federal Commission for Technology and Innovation, contract awards No 5750.1 EBS, EOS, BKW FMB Energie AG, SIG, SIL, Groupe E, Electricité Suisse and PSEL Funds for Projects and Studies of the Swiss Electric Utilities, contract awards No 215 Scapin. The authors also would like to thank EDF-CIH, VOITH-Siemens Hydro Power Generation and ALSTOM Power Hydro (CTI project 8330) for their financial support and their scientific contribution in the development of the hydraulic extension of SIMSEN.
10. Nomenclature A: pipe cross section [m2] Ag: gallery cross section [m2] AST: surge tank cross section [m2] Dref: machine reference diameter [m] H: net head [m] Q: discharge [m3/s] N: rotational speed [rpm] P: power [W] T: Torque [Nm] a: pipe wave speed [m/s] h: piezometric head h=z+p/(ρg) [m] g: gravity [m/s2]
p: static pressure [Pa] lg: length of the gallery [m]
p: pressure [Pa] t: time [s] x: position [m] y: turbine guide vane opening [-] Z: elevation above a datum [m] ν: specific speed
3/41/2( / ) (2 )ν ω π= ⋅ ⋅R R RQ g H [-]
ω: rotational pulsation [rd/s] R: subscript for rated
References [1] Akhmatov, V., Knudsen, H, “An aggregate model of a grid-connected, large-scale, offshore wind farm for power
stability investigations-importance of windmill mechanical system”, Electrical power and Energy Systems 24, 2002.
[2] Bénéteau P., Esnault F., “Hydrodynamique transmission de puissance cours et applications”, Sciences Industrielles, ELLIPSES, 1997.
[3] Bölcs, A., “Turbomachines thermiques”, Vol. I, LTT/EPFL, 1993.
[4] Bucher, R., “Enhanced energy balancing and grid stabilisation through 3-machine-type variable-speed pumped-storage units”, Proc. Int. Conf. Hydro 2007, Granada, Spain, October 2007.
[5] Canay, I. M., “Extended synchronous machine model for calculation of transient processes and stability”, Electric machines and Electromechanics, vol. 1, pp. 137-150, 1977.
[6] Godfrey, K., “Design and application of multifrequency signals”, Computing & Control Engineering Journal, Vol. 2, Issue 4, July 1991, pp.187–195.
[7] Heier, S., “Grid integration of wind energy conversion systems”, Chichester : Wiley, 1998.
[8] Jaeger, R. C., "Fluid transients in hydro-electric engineering practice ".Glasgow: Blackie, 1977.
[9] Kamwa, I., Grondin, R. , Trudel, G., “IEEE PSS2B versus PSS4B:the limits of performance of modern power system stabilizers,” IEEE Transactions on Power Systems, vol. 20, pp.903 – 915, May 2005.
[10] Kopf, E., Brausewetter, S., Giese, M., Moser, F., “Optimized control strategies for variable speed machines,” In Proceeding of the 22nd IAHR Symposium on Hydraulic Machinery and Systems, Stockholm, Sweden, June –July 2004.
[11] Nicolet, C., “Hydroacoustic modelling and numerical simulation of unsteady operation of hydroelectric systems”, Thesis EPFL n° 3751, 2007, (http://library.epfl.ch/theses/?nr=3751).
[12] Nicolet, C., Greiveldinger, B., Hérou, J.-J., Kawkabani, B., Allenbach, P., Simond, J.-J., Avellan, F., “High Order Modeling of Hydraulic Power Plant in Islanded Power Network”, IEEE Transactions on Power Systems, Vol. 22, Number 4, November 2007, pp.: 1870-1881.
[13] Paynter, H. M., “Surge and water hammer problems”. Transaction of ASCE, vol. 146, p 962-1009, 1953.

[14] Sapin, A., “Logiciel modulaire pour la simulation et l’étude des systèmes d’entraînement et des réseaux électriques”, Thesis EPFL n° 1346, 1995, (http://library.epfl.ch/theses/?nr=1346).
[15] Slootweg, J. G. , De Haan, S. W. H., Polinder, H., Kling, W. L., “General model for representing variable speed wind turbines in power system dynamics simulations”, IEEE Transactions On Power Systems, Vol. 18, No. 1, February 2003.
[16] Slootweg J.G., Polinder H., Kling W.L., “Representing wind turbines electrical generating systems in fundamental frequency simulations”, IEEE Transactions on energy conversion, VOL. 18, NO. 4, 2003
[17] Souza, O.H., Jr.; Barbieri, N.; Santos, A.H.M.; “Study of hydraulic transients in hydropower plants through simulation of nonlinear model of penstock and hydraulic turbine model,” IEEE Transactions on Power Systems, vol. 14, issue 4, pp. 1269 – 1272, 1999.
[18] Wiik, J., Gjerde, J. O., Gjengedal, T., “Impacts from Large Scale Integration of Wind Farms into Weak Power Systems, IEEE 2000.
[19] Wylie, E. B. & Streeter, V.L., “Fluid transients in systems”. Prentice Hall, Englewood Cliffs, N.J, 1993.
The Authors Christophe Nicolet graduated from the Ecole polytechnique fédérale de Lausanne, EPFL, in Switzerland, and received his Master degree in Mechanical Engineering in 2001. He obtained his PhD in 2007 from the same institution in the Laboratory for Hydraulic Machines. Since, he is managing director and principal consultant of Power Vision Engineering Sàrl in Ecublens, Switzerland. He is also lecturer at EPFL in the field of “Flow Transients in systems”. Yves Vaillant graduated from the EPFL and received his Master degree in Mechanical Engineering in 2005, and the Civil Electromechanical Engineering degree in Université de Liège, Belgium in 2006. He worked for Westinghouse Electric Company, located in Nivelles (Belgium) and is now employed as electrical engineer by VA Tech Hydro LTD, located in Zürich. Basile Kawkabani received his master degree in 1978 from SUPELEC, Ecole Supérieure d’Electricité in Paris France, and his Ph.D. degree in 1984 from the Swiss Federal Institute of Technology in Lausanne Switzerland. Since 1990, he is lecturer and senior researcher at the EPFL Laboratory for Electrical Machines. His interests include modelling of power systems, power system stability and control. Philippe Allenbach got the Master degree in Electrical Engineering from the EPFL. Research assistant at the University of Tokyo (1987-1991), research assistant at the EPFL since1991 in the laboratories of computer aided learning (LEAO) and electrical machines (LME). He is involved in the development of SIMSEN. Jean-Jacques Simond graduated in Electrical Engineering in 1967 and got his doctoral degree in 1976 from EPFL, the Swiss Federal Institute of Technology in Lausanne. Till 1990 he was working for BBC / ABB first as R&D engineer and later as head of the technical department for Hydro- and Diesel-generators. He is Professor and director of the Laboratory of Electrical Machines of the EPFL since 1990. He is also consultant for international electrical machines manufacturers and utilities. Prof. François Avellan graduated in Hydraulic Engineering from INPG, Ecole Nationale Supérieure d'Hydraulique, Grenoble France, in 1977 and, in 1980, got his doctoral degree in engineering from University of Aix-Marseille II, France. Research associate at EPFL in 1980, he is director of the Laboratory for Hydraulic Machines since 1994 and was appointed Ordinary Professor in 2003. Prof. F. Avellan is the Chairman of the IAHR Section on Hydraulic Machinery and Systems.