pumping system energy audits & how they benefit utilities alvarez- energy audits.pdf · pumping...
TRANSCRIPT

Pumping System Energy Audits & How They
Benefit Utilities
Presented by: Rick Alvarez
Background ◦ Cost of Pumping ◦ Pump and System Curves ◦ Best Efficiency, POR, AOR
Energy Audit Procedures ◦ Data forms ◦ Equipment
Collected Data and How to Interpret It ◦ Actual operating conditions vs. Duty Point
Real World Findings Summary

Energy used to operate pumps ◦ Dependent on flow rate, total pressure and
overall pump efficiency
Labor and parts to maintain pumps

The cost of operating pumps can be expressed as a cost/volume pumped or energy used/volume pumped (specific energy)
Individual numbers (such as power consumption, shaft power, flow, etc.) do not take into account the productive work done, and don’t provide a complete picture
Convenient units for specific energy are kWH/MG (kilowatt hours per million gallons pumped)

A pump curve shows the relationship between flow and pressure developed by a pump
Pre
ssure
Head (
FT
)
Flow (GPM)

Pump Performance Curve
Pre
ssure
Head (
FT
)
Flow (GPM)
Pump curves also give the pump efficiency and input power characteristics
Pow
er
(HP)
Eff
icie
ncy (
%)
Efficiency
Power
Pump Curve

•Static Head = vertical rise in the system
(relatively constant)
•Friction loss = dependent on flow rate,
pipe size and pipe material of the piping
system
Design Flow
Total Head
Friction Loss Head
Static Head
System Curve A system curve is a function of the static head (lift) and friction losses thru the system
Flow (GPM)
Head (FT)

A pumps duty point is the point at which the system curve crosses the pump curve
Duty point
Pump curve
System curve
Flow (GPM)
Pre
ssure
Head (
FT
)
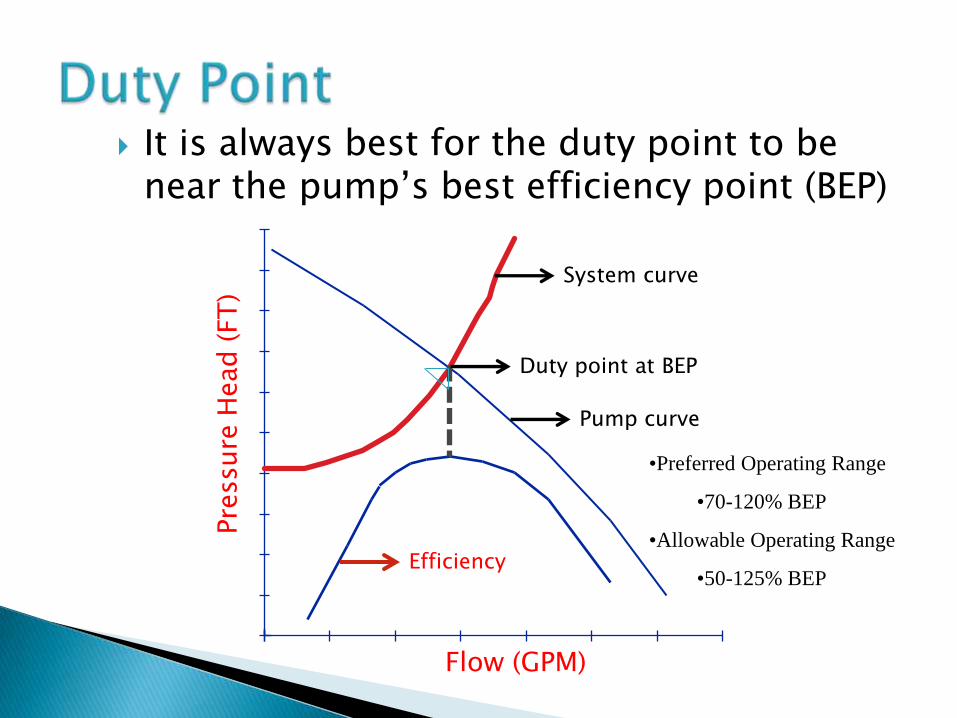
It is always best for the duty point to be near the pump’s best efficiency point (BEP)
Pre
ssure
Head (
FT
)
Flow (GPM)
Efficiency
System curve
Pump curve
Duty point at BEP
•Preferred Operating Range
•70-120% BEP
•Allowable Operating Range
•50-125% BEP

Gather existing information ◦ Pump data (curves, model #s, etc.)
◦ Site data (see the form on the next slide)
Perform flow testing ◦ Inflow and drawdown for each pump
Collect input kW data on each pump
Verify all data on Energy Audit form
Usually less than 15 minutes per site

•Form contains all
pertinent info
•Pump Data
•Measurement data
•Calculations
•Must be complete in
order to be accurate!
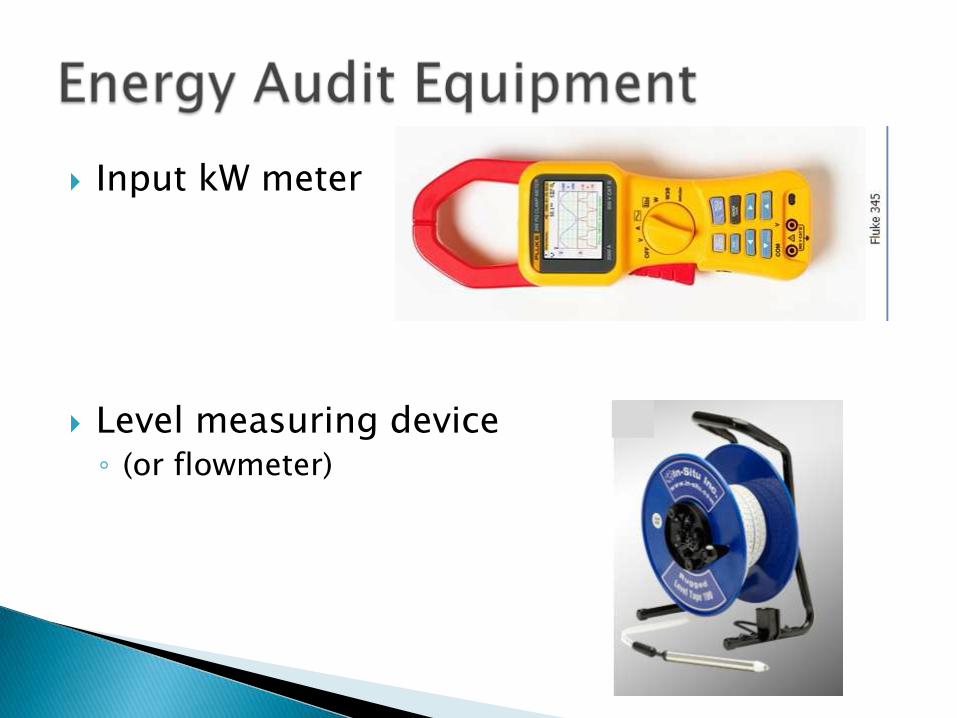
Input kW meter
Level measuring device ◦ (or flowmeter)

What do you get? ◦ Complete report showing performance of each
pump
◦ Summary of possible inefficiencies in your pumping equipment
◦ Recommendations on repair or replacement of equipment

•Explanation of
tests that were
performed
•Background on
test procedures,
equipment

•Summary of
Design versus
Actual performance
•Offers comparison
of all stations
within a system

Curve is marked with BEP and also with current operating condition
This shows a pump operating at BEP, and therefore very efficiently

Curve is marked with BEP and also with current operating condition
This shows a pump that is running outside AOR, indicating a problem with the sytem or the pump.

Shows problem sites where pumps are operating outside AOR
Also shows recommended replacement pumps and potential savings
Cost of pumping= Energy + Maintenance ◦ Pumps that operate outside AOR cost more to
operate (inside POR is optimal)
Energy
Inefficient pumps use more energy (More $$)
Maintenance
More vibration
Premature seal wear/failure
Premature bearing wear/failure
Major repairs (More $$)

How does an energy audit benefit YOU? ◦ Alerts you to pending problems
Actual versus design
Operation outside AOR
◦ Can prevent catastrophic failures
Identified problems can be addressed before an emergency occurs
◦ Helps you focus your resources (staff and $$)
Limited hours in a day, limited $$
Use your resources where they’re needed most
◦ Provide ROI data to support equipment requests

•Electric Supplier Incentives
•All companies participate
•DTE, Consumers, AEP,
etc.
•Incentives are paid for
upgrading the efficiency of
your pumping equipment
•Typical incentives are
$0.08/kWh for first year
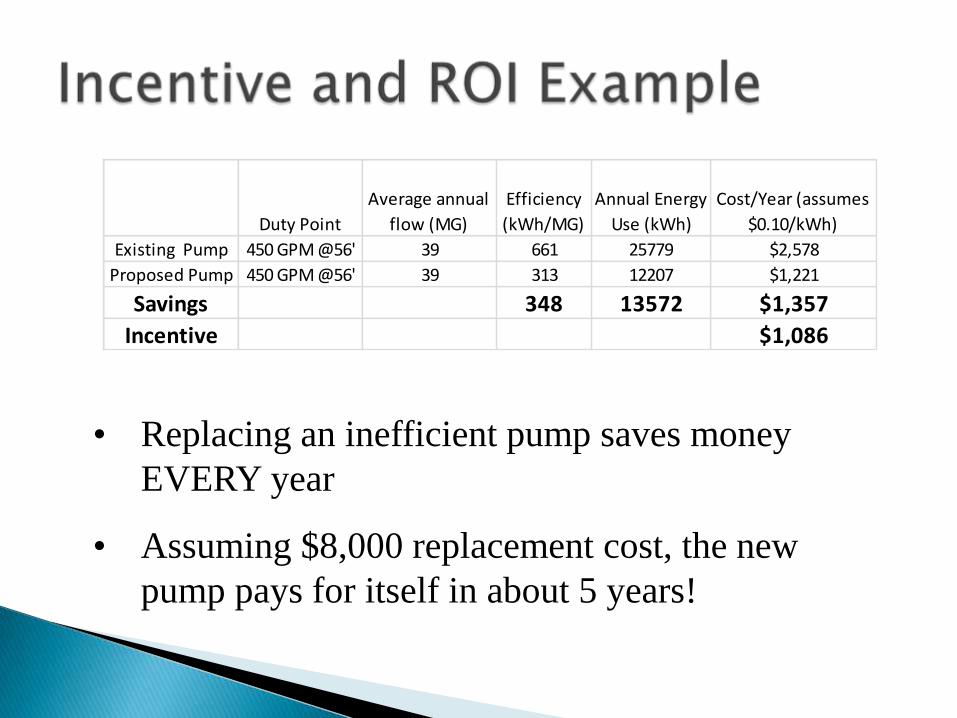
Duty Point
Average annual
flow (MG)
Efficiency
(kWh/MG)
Annual Energy
Use (kWh)
Cost/Year (assumes
$0.10/kWh)
Existing Pump 450 GPM @56' 39 661 25779 $2,578
Proposed Pump 450 GPM @56' 39 313 12207 $1,221
Savings 348 13572 $1,357
Incentive $1,086
• Replacing an inefficient pump saves money
EVERY year
• Assuming $8,000 replacement cost, the new
pump pays for itself in about 5 years!

Aging pumps and collection systems may not be performing as originally designed
Energy audits can provide valuable information about the operation of your pumping equipment
Typically done at little or no cost
Information can be used to reduce energy and maintenance costs, SAVING YOU $$$$
