pumping test effects on groundwater and …
TRANSCRIPT

PUMPING TEST EFFECTS ON GROUNDWATER
AND SETTLEMENT FOR WATERVIEW TUNNEL
Parviz Namjou, Clare Maginness, Alan Pattle
Pattle Delamore Partners Ltd, Auckland
ABSTRACT
The New Zealand Transport Agency has applied to construct 5 km of new state highway in Auckland as part of
the Waterview Connection project including a 2.5 km tunnel section excavated primarily within the East Coast
Bays Formation (ECBF) of the Waitemata Group. Depending on the approach to tunnel construction, any
inflows to the tunnel and the subsequent drawdown of groundwater levels may cause settlement of compressible
soils, which may result in settlement of overlying structures. Other effects include the potential to reduce base
flows in nearby Oakley Creek and the potential to spread contaminants from former landfill areas.
This paper describes two contrasting long duration pumping tests with an unusually comprehensive monitoring
regime. The approach was designed to help assess the potential effects of constructing the tunnel in “open
mode”. Although the pumping bores are close together, the response to pumping was very different with the first
test located in an area of significantly higher permeability.
The data from the pumping tests on the behaviour and variability of the Waitemata Group and overlying
formations will inform selection of the construction method for the tunnel and improve understanding of the
potential effects, and will also be of benefit to future projects within the same hydrogeological setting.
KEYWORDS
Groundwater, drawdown, pumping test, monitoring, Waitemata Formation, Tauranga Group, ground
settlement, tunnel.
1 INTRODUCTION
The New Zealand Transport Agency (NZTA) has applied to construct 5 km of new state highway in Auckland as
part of the Waterview Connection project including a 2.5 km tunnel section with three lanes in both directions.
The new highway would link State Highway 16 and State Highway 20 between their current Great North Road
and Maioro Street exits. The NZTA has applied for designation and resource consents under the new national
consenting process through the Environmental Protection Authority (EPA). Waterview is the first roading
project to use this process for projects of national significance. Figure 1 shows the location within Auckland.
The Waterview tunnel section comprises two separate tunnels which will be bored with a Tunnel Boring
Machine (TBM) rather than through the cut and cover approach. The tunnel would primarily be excavated
within the East Coast Bays Formation of the Waitemata Group. Different approaches to tunnelling can be used
depending on the expected groundwater regime and water pressures. TBMs can be operated either as a sealed
system in “closed mode” where ground and groundwater pressures are balanced at the tunnel face and water is
prevented from entering the tunnel; or in “open mode” where groundwater inflows occur at the face prior to
installation of a lining.
If the tunnel is constructed in “open mode”, any groundwater inflows to the tunnel will lead to drawdown in
groundwater levels. Drawdown of groundwater levels may cause settlement of compressible soils due to a
reduction in pore water pressure, which may result in settlement of overlying structures. Other effects include
the potential to reduce base flows in nearby Oakley Creek and the potential to spread contaminants from former
landfill areas.
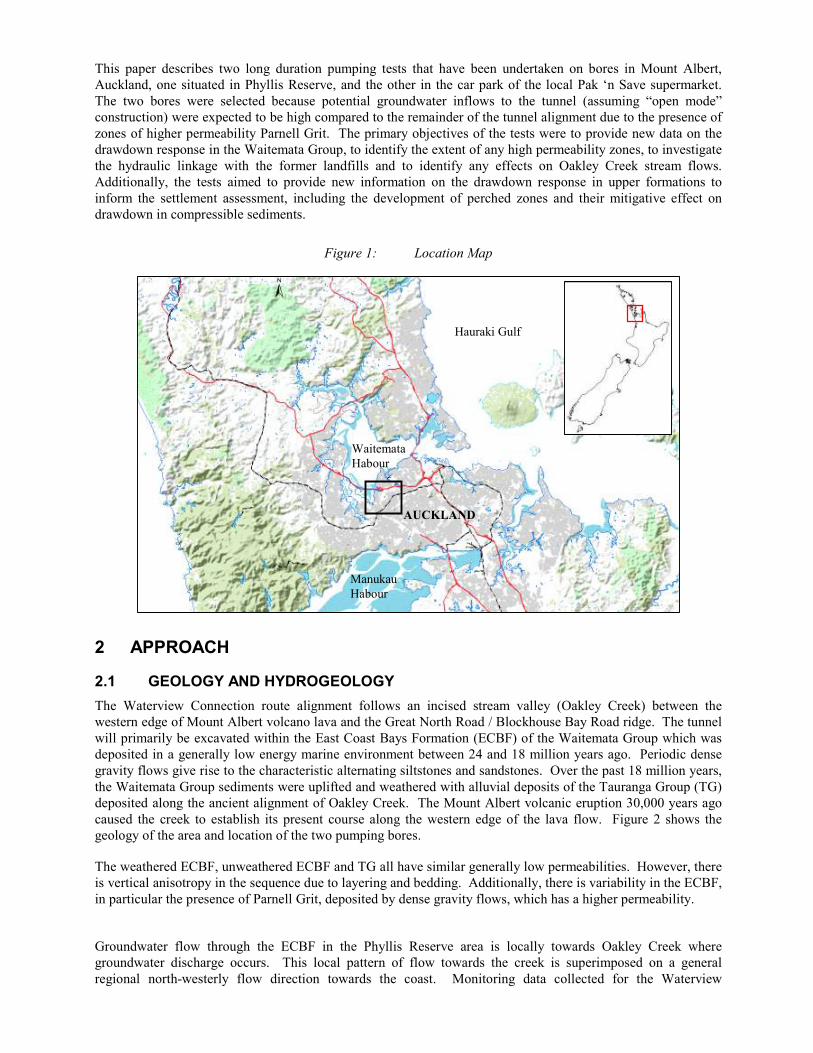
This paper describes two long duration pumping tests that have been undertaken on bores in Mount Albert,
Auckland, one situated in Phyllis Reserve, and the other in the car park of the local Pak ‘n Save supermarket.
The two bores were selected because potential groundwater inflows to the tunnel (assuming “open mode”
construction) were expected to be high compared to the remainder of the tunnel alignment due to the presence of
zones of higher permeability Parnell Grit. The primary objectives of the tests were to provide new data on the
drawdown response in the Waitemata Group, to identify the extent of any high permeability zones, to investigate
the hydraulic linkage with the former landfills and to identify any effects on Oakley Creek stream flows.
Additionally, the tests aimed to provide new information on the drawdown response in upper formations to
inform the settlement assessment, including the development of perched zones and their mitigative effect on
drawdown in compressible sediments.
Figure 1: Location Map
2 APPROACH
2.1 GEOLOGY AND HYDROGEOLOGY
The Waterview Connection route alignment follows an incised stream valley (Oakley Creek) between the
western edge of Mount Albert volcano lava and the Great North Road / Blockhouse Bay Road ridge. The tunnel
will primarily be excavated within the East Coast Bays Formation (ECBF) of the Waitemata Group which was
deposited in a generally low energy marine environment between 24 and 18 million years ago. Periodic dense
gravity flows give rise to the characteristic alternating siltstones and sandstones. Over the past 18 million years,
the Waitemata Group sediments were uplifted and weathered with alluvial deposits of the Tauranga Group (TG)
deposited along the ancient alignment of Oakley Creek. The Mount Albert volcanic eruption 30,000 years ago
caused the creek to establish its present course along the western edge of the lava flow. Figure 2 shows the
geology of the area and location of the two pumping bores.
The weathered ECBF, unweathered ECBF and TG all have similar generally low permeabilities. However, there
is vertical anisotropy in the sequence due to layering and bedding. Additionally, there is variability in the ECBF,
in particular the presence of Parnell Grit, deposited by dense gravity flows, which has a higher permeability.
Groundwater flow through the ECBF in the Phyllis Reserve area is locally towards Oakley Creek where
groundwater discharge occurs. This local pattern of flow towards the creek is superimposed on a general
regional north-westerly flow direction towards the coast. Monitoring data collected for the Waterview
Hauraki Gulf
Waitemata
Habour
AUCKLAND
Manukau
Habour

Connection project indicates that seasonal variations in the water levels are generally less than 0.5 m in the
ECBF.
The basalt is considered to be a separate unconfined aquifer system, and basalt groundwater levels respond
directly to rainfall. The relatively high hydraulic conductivity basalt is underlain by the lower hydraulic
conductivity TG silts and clays. The dominant flow in the basalt is in a north westerly direction to discharge
zones along Oakley Creek. Additionally, groundwater is expected to flow from the basalt aquifer into the closed
landfill underlying Phyllis Reserve.
Figure 2: Geology and location of pumping bores
Prior to the two long term pumping tests, data on aquifer properties in the Waterview area was available from in-
situ packer tests undertaken during drilling, slug tests, and six previously conducted pumping tests on wells
screened in the basalt, ECBF and Parnell Grit. The previous pumping tests were all less than seven days in
duration and showed that when dewatered the ECBF locally under-drains the TG, resulting in drawdown in
water levels within the TG.
2.2 TEST SET UP
2.2.1 PUMPING BORES
Prior to starting the main pumping test, a step test on the Phyllis Reserve pumping bore (DH944) (shown in
Photograph 1) was used to measure well performance. The well was pumped up to a maximum pumping rate of
BASALT
DH944
DH950
TAURANGA
GROUP
EAST COAST
BAYS
FORMATION
Approximate Waterview
Tunnel Alignment
Phyllis Street Reserve
closed landfill
Oakley Creek and flow
gauging stations
1 km
BASALT

1400 m3/d. Following the step test, the bore water level was allowed to recover to its natural condition. The
main pumping test commenced on 7 February 2011 at 2:56 pm.
The Pak ‘n Save pumping bore (DH950) (shown in Photograph 2) was tested on 14 and 15 April 2011 to
determine the pumping rate that could be sustained during the constant rate pumping test. The constant rate
pumping test commenced on 16 April at 9:51 am.
The two bores were pumped continuously for 30 days (DH944) and 17 days (DH950) respectively to allow
drawdown effects to spread widely. The water levels recovered back to natural conditions before the start of the
test on DH950.
Photograph 1: Phyllis Street pumping test: pumped
bore DH944
Photograph 2: Pak ‘n Save pumping test: pumped
bore DH950
Table 1 summarises the construction details and geology of the two pumping bores
Table 1: Pumping bore details
DH944: Phyllis Reserve DH950: Pak ‘n Save
Ground level 31.1 mRL 40.1 mRL
Geology 0 – 12.6 mBGL: landfill debris
12.6 – 15.2 mBGL: TG
15.2 – 21.1 mBGL residually weathered ECBF
21.1 – 21.7 mBGL: highly weathered EBF
21.7 – 100 mBGL: moderately, slightly and
unweathered ECBF
0 – 5.3 mBGL: basalt
5.3 – 14.9 mBGL: TG
14.9 – 99.6 mBGL slightly and
unweathered ECBF
Bore
construction
details
0 - 38 mBGL: Plain casing
38 - 50 mBGL: Slotted casing
50 - 56 mBGL: Blank casing to house the pump
56 - 100 mBGL: Open hole
0 - 54.3 mBGL: Plain casing
54.3 - 99.6 mBGL: Open hole
Pump details Pump intake: 54 mBGL (-22.89 mRL)
Grundfos SP-45-9 (three phase) pump
The pump intake: 72.5 mBGL (-
32.41 mRL)
Grundfos SP-8A-25 (three phase) pump

2.2.2 MONITORING REGIME
A comprehensive regime of groundwater monitoring was implemented, with piezometers located up to
approximately 1 km from the pumping bores at varying depths to cover all geological formations. The
piezometer locations are shown in Figure 3. During the Phyllis Reserve pumping test on DH944, groundwater
levels were recorded at 81 bores, many of which recorded groundwater levels at multiple depths, giving a total of
136 individual piezometers. A total of 90 individual piezometers were monitored in the test on DH950. Two
types of piezometer were monitored: standpipes and vibrating wire pressure transducers. Barometric pressure
transducers were positioned in the area to allow data to be corrected for atmospheric pressure changes during the
tests.
During the tests manual measurements of the electrical conductivity, pH and temperature of the water pumped
from the bores were taken. Additionally, three samples of the water from the pumping bores were taken for
laboratory analysis to record any changes in water chemistry during the pumping test. The discharge from the
pumping bores was recorded throughout the two tests using volumetric measurements. Rainfall data and data on
the flow in Oakley Creek were obtained from NIWA after the end of the two tests.
A baseline settlement monitoring network for the Waterview Tunnel was installed during 2011. Monitoring
locations surrounding the two pumping bores were surveyed before, during and at the end of the test to record
any vertical deformation of the land surface.
Figure 3: Groundwater monitoring regime: both tests
DH944
DH950
500 m
Standpipe piezometer
Vibrating wire piezometer

2.3 RESULTS
2.3.1 RESPONSE IN PUMPING BORES
Although the two pumping bores are less than 1 km apart, the results showed that the response to pumping was
very different in each test. The first test on DH944 in Phyllis Reserve was undertaken in an area of higher
permeability with a pumping rate of between 1400 m3/d and 630 m3/d. In contrast, in the second test on DH950
flow rates above 40 m3/d could not be sustained due to the lower permeability in this area. DH950 was pumped
for 17 days at approximately 25 m3/d. In both tests, the maximum drawdown in the pumping bores had been
reached by the end of the test.
Figure 4 shows the drawdown in DH944 and discharge during the main 30 day pumping test. The semi-log plot
of drawdown shown in Figure 5 indicates a dual porosity effect, with the influence of delayed yield causing the
rate of drawdown to decrease after approximately 20,000 seconds (0.2 days). Prior to this, flow towards the well
is likely to be predominantly through fractures, with increasing flow from the matrix after 0.2 days (and
potentially also from overlying less permeable formations) causing the reduction in the rate of drawdown.
Between approximately 2.6 days (225,000 seconds) and 3 days after pumping, the gradient of the drawdown
curve steepened beyond the theoretical prediction. This suggests that the cone of depression may have
intercepted a boundary or a zone with reduced permeability. The maximum drawdown in the pumping bore
stabilised at approximately 35 m after three days of pumping until the end of the test. The pumping bore
discharge gradually reduced after the maximum drawdown was reached, generally in accordance with the typical
decay of groundwater inflows during a constant head test.
Figure 4: Drawdown in DH944 and pumping rate versus time
-20
-15
-10
-5
0
5
10
15
20
25
30
7-Feb 9-Feb 12-Feb 14-Feb 17-Feb 19-Feb 22-Feb 24-Feb 27-Feb 1-Mar 4-Mar
Date
Piezometric Level (m
RL)
400
600
800
1000
1200
1400
1600
Pumping rate (m3/d)
DH944 water level (automatic readings) DH944 water level (manual readings)Pumping started Ground levelPumping rate
The initial discharge rate (1400 m3/d) rapidly reduced within a few hours of the test following the pump
performance curve to approximately 1273 m3/d which was constantly maintained for 2.6 days
Discharge rate at end of test
approximately 630 m3/d
Maximum drawdown in pumping bore (35 m)
reached after approximately three days. Test changes
to a constant drawdown regime and pump rate
follows logarithmic rate reduction
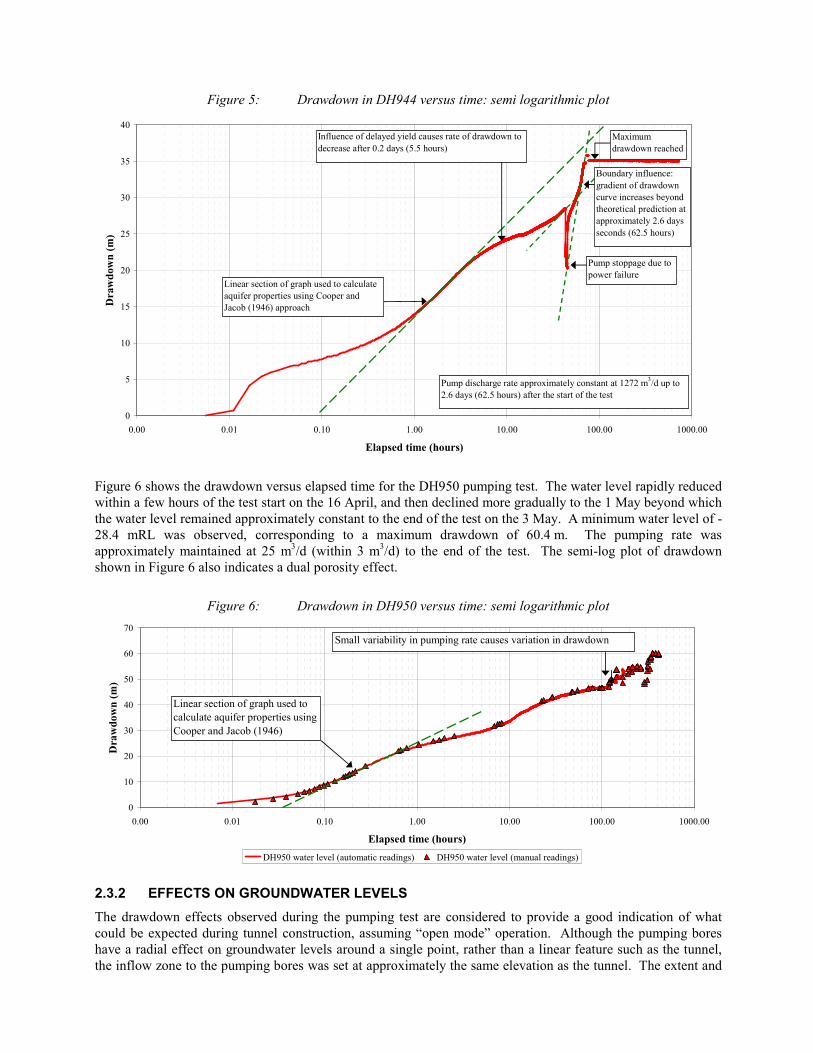
Figure 5: Drawdown in DH944 versus time: semi logarithmic plot
0
5
10
15
20
25
30
35
40
0.00 0.01 0.10 1.00 10.00 100.00 1000.00
Elapsed time (hours)
Drawdown (m)
Linear section of graph used to calculate
aquifer properties using Cooper and
Jacob (1946) approach
Maximum
drawdown reached
Pump discharge rate approximately constant at 1272 m3/d up to
2.6 days (62.5 hours) after the start of the test
Influence of delayed yield causes rate of drawdown to
decrease after 0.2 days (5.5 hours)
Pump stoppage due to
power failure
Boundary influence:
gradient of drawdown
curve increases beyond
theoretical prediction at
approximately 2.6 days
seconds (62.5 hours)
Figure 6 shows the drawdown versus elapsed time for the DH950 pumping test. The water level rapidly reduced
within a few hours of the test start on the 16 April, and then declined more gradually to the 1 May beyond which
the water level remained approximately constant to the end of the test on the 3 May. A minimum water level of -
28.4 mRL was observed, corresponding to a maximum drawdown of 60.4 m. The pumping rate was
approximately maintained at 25 m3/d (within 3 m
3/d) to the end of the test. The semi-log plot of drawdown
shown in Figure 6 also indicates a dual porosity effect.
Figure 6: Drawdown in DH950 versus time: semi logarithmic plot
0
10
20
30
40
50
60
70
0.00 0.01 0.10 1.00 10.00 100.00 1000.00
Elapsed time (hours)
Drawdown (m)
DH950 water level (automatic readings) DH950 water level (manual readings)
Linear section of graph used to
calculate aquifer properties using
Cooper and Jacob (1946)
approach
Small variability in pumping rate causes variation in drawdown
2.3.2 EFFECTS ON GROUNDWATER LEVELS
The drawdown effects observed during the pumping test are considered to provide a good indication of what
could be expected during tunnel construction, assuming “open mode” operation. Although the pumping bores
have a radial effect on groundwater levels around a single point, rather than a linear feature such as the tunnel,
the inflow zone to the pumping bores was set at approximately the same elevation as the tunnel. The extent and

magnitude of drawdown will also influence the extent and magnitude of potential settlement, discussed in
Section 2.3.6.
Figure 7 shows the estimated contours of maximum drawdown in the unweathered ECBF piezometers for the
two tests on the same plot. In the Phyllis Reserve pumping test on DH944, drawdown was observed in
piezometers up to 550 m away, with variations depending on depth and formation. The Hantush Jacob method
for a leaky aquifer (Kruseman and de Ridder, 1994) was used to extrapolate the maximum estimated extent of
drawdown as 900 m. In contrast, during the Pak ‘n Save test, no bores more than 200 m from the pumping bore
showed a response to pumping.
Figure 7: Maximum drawdown in unweathered ECBF piezometers from both tests
The results show that when dewatered, the ECBF locally under-drains the TG, resulting in drawdown in water
levels within the TG, and also in the overlying basalt where these units are present. The magnitude of drawdown
in the TG and basalt is less than in the underlying ECBF. This response is illustrated in Figure 8 showing the
water levels in monitoring bore DH833 situated 164 m to the east of DH944; here a maximum drawdown of 13.9
m was observed in the ECBF, with 4.3 m drawdown in the overlying TG, and approximately 2.7 m drawdown in
the basalt.
0.5 m
2 m
5 m
10 m
> 20 m
2 m
5 m
Pak ‘n Save DH950
Maximum drawdown
in pumping bore:
60.4 m
Phyllis Reserve DH944
Maximum drawdown in
pumping bore: 35 m
500 m from pumping
bore
500 m from pumping
bore
200 m from pumping
bore
200 m from pumping
bore

Figure 8: Drawdown in monitoring bore DH833a versus time during pumping test on DH950
Comparison of Figures 8 and 4 also shows that while the pumping bore reached a maximum drawdown after
approximately three days, groundwater levels in many of the monitoring bores continued to decline for much of
the 30 day pumping period, only levelling off and reaching equilibrium at the end of the test. This highlights the
benefit of pumping for a long duration to fully establish the effects on each formation.
The drawdown response in the compressible formations of residually weathered ECBF (defined as being
weathered to soils) and TG was reviewed in detail to identify where these layers may have become perched or
depressurised as a result of pumping. These conditions are relevant to the assessment of ground settlement
caused by groundwater drawdowns. Perched conditions are defined here as where the compressible layer
remained saturated or partly saturated, while the top of the underlying layer became unsaturated. This is
illustrated in Figure 8 above where the water level in the ECBF fell below the base of the Tauranga Group after
approximately the 25th February. Perched and depressurised conditions indicate that these layers would no
longer be influenced by additional drawdown in the unweathered ECBF. If recharge is less than the vertical
leakage from the TG, the TG would be expected to drain over time.
During the Phyllis Reserve test on DH944, review of the groundwater level data in different piezometers showed
that, where present, perched conditions had developed in the residually weathered ECBF in most piezometers
within 200 m and about 40% of locations within 500 m of the pumping bore by the end of the test. Perched
conditions developed in the TG (where present) in most bores within approximately 200 m of the pumping bore.
The TG does not appear to have become fully depressurised in any locations whereas the ER became
depressurised in six piezometers all located within 300 m of the pumping bore.
0
5
10
15
20
25
30
26 Jan 11 05 Feb 11 15 Feb 11 25 Feb 11 07 Mar 11 17 Mar 11
Date
Piezometric Level (mRL)
Start of pumping End of pumping DH833a DH833b
DH833c Ground level Base of Basalt Base of TG
DH833b (basalt)
DH833c (Tauranga Group)
DH833a (ECBF)
Base of Tauranga Group
Base of Basalt

2.3.3 AQUIFER PROPERTIES DERIVED FROM TEST RESULTS
The properties of the unweathered ECBF aquifer have been derived using the drawdown response in the
monitoring piezometers using the Cooper and Jacob (1946) approach assuming a constant discharge from the
pumping bores. The Cooper and Jacob approach assumes that flow occurs horizontally through the aquifer. 57
piezometers were analysed following the test on DH944 and 11 were analysed following the test on DH950. The
results are presented in Table 2.
Table 2: Aquifer properties from pumping test results
DH944: Phyllis Reserve DH950: Pak ‘n Save
Transmissivity of pumping
bore
18 m2/d 0.3 m2/d
Unweathered ECBF
transmissivity
11 m2/d - 206 m2/d
Geometric mean of 38 m2/d
0.3 m2/d - 4.1 m2/d
Geometric mean of 1.5 m2/d
2.3.4 EFFECTS ON WATER QUALITY
Two closed landfills owned by Auckland Council (Phyllis Reserve and Habitat Reserve) are situated close to the
Waterview tunnel alignment. The Phyllis Reserve landfill was filled between the middle of the 1940s and late
1980s with a range of refuse types including household waste, construction / demolition waste, green waste and
cleanfill.
The samples taken of water pumped from both bores showed that the key landfill-derived contaminants were
found to be present in low concentrations below ANZECC guideline values with the exception of zinc in DH950.
The water quality results indicate that there was no significant effect of any landfill leachate on groundwater
quality as a result of groundwater drawdown during the pumping test.
Elevated concentrations of dissolved and total zinc were detected in water samples collected during the test on
DH950. The source of the elevated zinc in these water samples was found to be the galvanised iron pipe used as
a riser from the submerged pump which the water sample had to pass though before the sample was collected.
The reported zinc concentrations in these samples are not representative of the groundwater quality found within
the ECBF in this area.
Iron flakes were observed in the water pumped from the DH950 bore due to precipitation of iron minerals as
shown in Photograph 3. This was also noticed for the test on DH944 but to a lesser extent. The iron
precipitation may be due to the pump “snoring” when the water level has been drawn down close to the pump
and oxygen is being entrained.
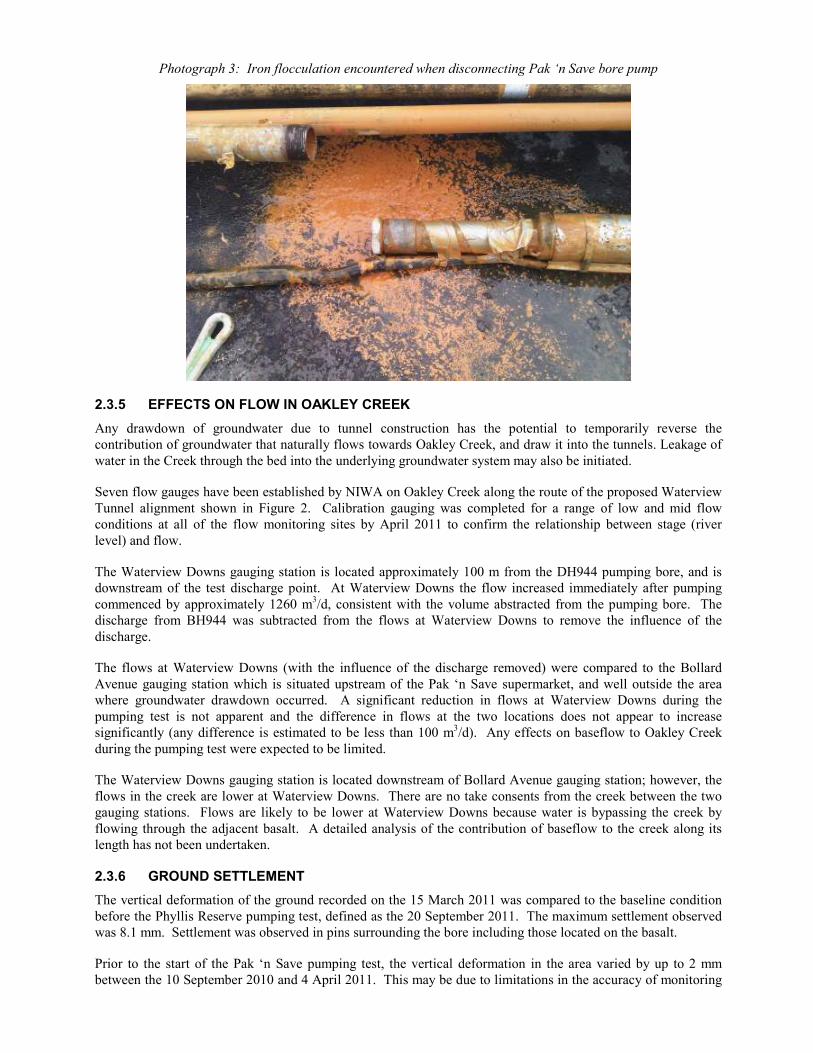
Photograph 3: Iron flocculation encountered when disconnecting Pak ‘n Save bore pump
2.3.5 EFFECTS ON FLOW IN OAKLEY CREEK
Any drawdown of groundwater due to tunnel construction has the potential to temporarily reverse the
contribution of groundwater that naturally flows towards Oakley Creek, and draw it into the tunnels. Leakage of
water in the Creek through the bed into the underlying groundwater system may also be initiated.
Seven flow gauges have been established by NIWA on Oakley Creek along the route of the proposed Waterview
Tunnel alignment shown in Figure 2. Calibration gauging was completed for a range of low and mid flow
conditions at all of the flow monitoring sites by April 2011 to confirm the relationship between stage (river
level) and flow.
The Waterview Downs gauging station is located approximately 100 m from the DH944 pumping bore, and is
downstream of the test discharge point. At Waterview Downs the flow increased immediately after pumping
commenced by approximately 1260 m3/d, consistent with the volume abstracted from the pumping bore. The
discharge from BH944 was subtracted from the flows at Waterview Downs to remove the influence of the
discharge.
The flows at Waterview Downs (with the influence of the discharge removed) were compared to the Bollard
Avenue gauging station which is situated upstream of the Pak ‘n Save supermarket, and well outside the area
where groundwater drawdown occurred. A significant reduction in flows at Waterview Downs during the
pumping test is not apparent and the difference in flows at the two locations does not appear to increase
significantly (any difference is estimated to be less than 100 m3/d). Any effects on baseflow to Oakley Creek
during the pumping test were expected to be limited.
The Waterview Downs gauging station is located downstream of Bollard Avenue gauging station; however, the
flows in the creek are lower at Waterview Downs. There are no take consents from the creek between the two
gauging stations. Flows are likely to be lower at Waterview Downs because water is bypassing the creek by
flowing through the adjacent basalt. A detailed analysis of the contribution of baseflow to the creek along its
length has not been undertaken.
2.3.6 GROUND SETTLEMENT
The vertical deformation of the ground recorded on the 15 March 2011 was compared to the baseline condition
before the Phyllis Reserve pumping test, defined as the 20 September 2011. The maximum settlement observed
was 8.1 mm. Settlement was observed in pins surrounding the bore including those located on the basalt.
Prior to the start of the Pak ‘n Save pumping test, the vertical deformation in the area varied by up to 2 mm
between the 10 September 2010 and 4 April 2011. This may be due to limitations in the accuracy of monitoring

results, or to natural variations. After the test start, the vertical deformation results show a slight downward
trend, suggesting that settlement may have occurred; however, any impacts are generally less than 2 mm which
may be within the range of accuracy of the monitoring.
3 DISCUSSION
3.1 GROUNDWATER DRAWDOWN
Groundwater flow, and correspondingly the drawdown effect in the ECBF are influenced by a number of
geological factors including:
- Local structural variations. Disrupted beds, folds and slumps have been inferred in the Phyllis Reserve
area, interpreted as disturbance of soft sediment. These features may have increased the hydraulic
conductivity of the ECBF in the Phyllis Reserve area, compared to less disturbed areas such as around
the Pak ‘n Save pumping bore DH950.
- Lithological features. The Phyllis Reserve area has a greater proportion of Parnell Grit (PG) material,
with a distinctive coarser grained lithology and higher permeability compared to the Pak ‘n Save site.
The depositional environment of the PG means that the PG intervals are variable and not necessarily
laterally traceable between bores.
- Weathering. Where weathering of the ECBF to soils has occurred, the permeability is expected to be
lower than the parent rock due to the loss of secondary permeability. The weathering profile is
affected by paleo-topography and along the tunnel alignment is generally thickest (up to 10 m) on the
spur crests (where erosion is least) and generally thin or non-existent (i.e. Tauranga Group sitting
directly on unweathered ECBF) in the valleys between spurs which are interpreted as erosional
features. However, some parts of the tunnel alignment, including the area around Phyllis Reserve,
have anomalously deep weathering (Aurecon, January 2011).
The pumping tests provide a good insight into the behaviour and variability of the Waitemata Group and
overlying formations. The results showed that in a higher permeability area of the ECBF formation drawdowns
were observed at distances up to 550 m from the pumping bore, with the estimated maximum extent of
drawdown estimated to be 900 m, whereas in the lower permeability area drawdowns were only observed at
distances up to 200 m. The TG responded to underdrainage from the ECBF and perched conditions developed.
3.2 GROUND SETTLEMENT DUE TO GROUNDWATER DRAWDOWN
Settlement of compressible formations can occur as a result of a reduction in pore pressure due to groundwater
drawdowns. One dimensional consolidation theory has been used to predict ground settlement due to the
groundwater drawdown observed during the Phyllis Reserve pumping test using the coefficient of volume
compressibility method. The coefficients of compressibility (mν values) required for these calculations were
available from laboratory oedometer testing carried out for NZTA in 2010 across a range of effective stresses.
The predicted total settlement is generally higher (up to five times higher) than that observed during the pumping
test, for various reasons including development of perched conditions and geological conditions that did not
match the one dimensional theory of consolidation. The magnitude of groundwater related settlement is
influenced by the drawdown magnitude and development of perched and depressurised zones, and the
compressibility of the residually weathered ECBF and TG formations.
Perched conditions in the TG and ER indicate that these layers would no be longer influenced by additional
drawdown in the unweathered ECBF, and, therefore, limited additional settlement would be expected over time.
Settlement was observed in numerous monitoring pins located on basalt however, the basalt itself is considered
to be incompressible. The pumping test results and comparison with settlement predictions suggest that the
overlying basalt may be attenuating the settlement through a rafting effect.
The TG thickness increases to the east of Phyllis Reserve, with increasing distance from the pumping bore due to

to the depositional environment of the alluvial deposits in the Oakley Creek palaeo-valley. Therefore, a location
further from the pumping bore with less drawdown but a greater thickness of TG would potentially have more
settlement than if the TG thickness was constant. The thickness of the residually weathered ECBF layer is also
variable and relates to the palaeo-topography of the ECBF erosion surface. There may also be some variability
in the interpretation and logging of weathering between different bores.
In addition to settlement due to the Phyllis Reserve pumping test, groundwater drawdown related settlement may
have occurred due to the pumping test undertaken in February 2010 on BH709a where drawdown of 16.85 m in
the pumped bore was achieved; however, no settlement monitoring was undertaken during this test.
Given that the drawdown effects during the pumping tests are considered to provide a good indication of what
could be expected during tunnel construction (assuming “open mode” operation), the observed settlement would
also be indicative of tunnel effects.
4 CONCLUSIONS / RECOMMENDATIONS
The pumping tests provide a good insight into the behaviour of the Waitemata Group and overlying formations.
The contrasting results from the two tests show that the response to pumping can be variable over a short
distance. During the Phyllis Reserve test undertaken in an area of higher permeability, the drawdown effects
spread over a wide area and pumping from the ECBF induced vertical flow from the overlying formations where
perched conditions developed. In contrast, the Pak ‘n Save test was undertaken in an area of lower permeability
and a much smaller area was influenced by pumping.
The actual ground settlements that occurred during the pumping tests were less than predicted using the observed
drawdowns, for various reasons including development of perched conditions and geological conditions that did
not match the one dimensional theory of consolidation.
The results provide additional insight into the potential groundwater and settlement effects of constructing the
Waterview Tunnel in “open mode”. The actual amount of groundwater inflow that will occur to the tunnels
during construction will depend on the tunnelling method used and the type of strata encountered. Larger tunnel
inflows, and larger associated drawdowns within the surrounding strata, may result in settlement of the
compressible soils, which could affect overlying structures.
The comprehensive nature of the monitoring undertaken during the two tests and the long duration of pumping
enabled a full understanding of the vertical and lateral effects of pumping to be generated which is of particular
importance for a project such as the Waterview Tunnel.
ACKNOWLEDGEMENTS
The project was funded by the New Zealand Transport Agency and the work was undertaken for Aurecon. We
wish to acknowledge and thank both organisations for their continued support.
REFERENCES
Kruseman, G. and de Ridder, N. Analysis and Evaluation of Pumping Test Data, 1994.
National Water Quality Management Strategy, Paper No. 4, Australian and New Zealand Guidelines for Fresh
and Marine Water Quality, 2000.
NZ Transport Agency, Western Ring Route – Waterview Connection, Assessment of Environmental Effects,
2010