purchasing power - union of concerned scientists · purchasing power how institutional “good...
TRANSCRIPT

Purchasing PowerHow Institutional “Good Food” Procurement Policies Can Shape a Food System That’s Better for People and Our Planet
Lance Cheung/U
SDA
Food purchasing, or “procurement”—the process by which food-serving institu-tions such as schools and hospitals purchase raw and prepared foods and beverages—offers a powerful opportunity to address issues of equity, sustainability, human health, and animal welfare in the food supply chain. Incorporating “good food” standards into traditional food purchasing contracts results in increased transparency and accountability across the supply chain, as it requires food distributors and food service management companies to report more information from production to purchase, and gives buyers more control over the foods they serve and the systems they support.
Public institutions commonly utilizing formal procurement procedures include school systems, universities, hospitals, correctional facilities, senior care residences, and other city or county departments and facilities. The economic footprint of these food service contracts is substantial—institutional food service facilities1 supply about $120 billion worth of food each year to some of the nation’s most vulnerable populations (ERS 2016a). The federal government also makes significant investments in food procurement, spending a total of $20 billion on school meal and snack programs alone in 2014 (CBO 2015).
HIGHLIGHTS
The nation’s schools, universities, hospitals,
and other public institutions have the
collective buying power to change the face
of the US food system. By adopting
purchasing policies to demand sustainable,
healthy food that is produced fairly and
humanely, these institutions can promote
integrity and transparency in the supply
chain and help transition the food system to
one that provides greater public benefits.
The Good Food Purchasing Program is a
comprehensive purchasing strategy that is
being adopted by cities nationwide and now
influences a total of $280 million in annual
food purchases. In the Los Angeles Unified
School District alone, the program has helped
to direct $30 million annually to purchases
of local food, generate wage increases and
new local jobs, reduce schools’ carbon
footprints and water usage, exceed federal
child nutrition standards, and influence
national supply chains. With continued
adoption and expansion, “good food”
purchasing policies can act as a catalyst for
seismic shifts in the US food system.
Large-scale food service contracts have the power to change industry practices for the better. The Los Angeles Unified School District's efforts to meet Good Food Purchasing Program standards have helped drive the nation’s major poultry producers to strengthen their commitment to reduce the use of antibiotics in their chickens; as of 2017, more than 20 percent of all US ready-to-cook chicken is produced without antibiotics.
2 union of concerned scientists
This report is intended for institutional leaders and community advocates interested in aligning food purchases with social and environmental values to provide greater public benefit. Connecting some of the most pressing challenges in the food system to potential solutions offered by food procurement poli-cies, the report provides an introduction to the Good Food Purchasing Program and a case study of its adoption in the Los Angeles Unified School District (LAUSD). The results highlight the benefits to institutions that have already adopted the program, including school districts in San Francisco, Oakland, and Chicago, and the potential to expand these benefits nationwide. An accompanying toolkit, available online, provides additional information for use by institutions preparing to adopt new food procurement policies.
The Food System Is Not Working for Most of Us
The US food system—a complex network of practices and policies that determine how food is produced, distributed, and consumed—by and large does not serve the best interests of the US population. Simply put, the prevailing system compromises public health and well-being while exploiting people, primarily those of color, and the environment. Often, the beneficiaries of this system are large agribusiness and food corporations that make outsized profits and wield polit-ical influence to protect their business models. Meanwhile,
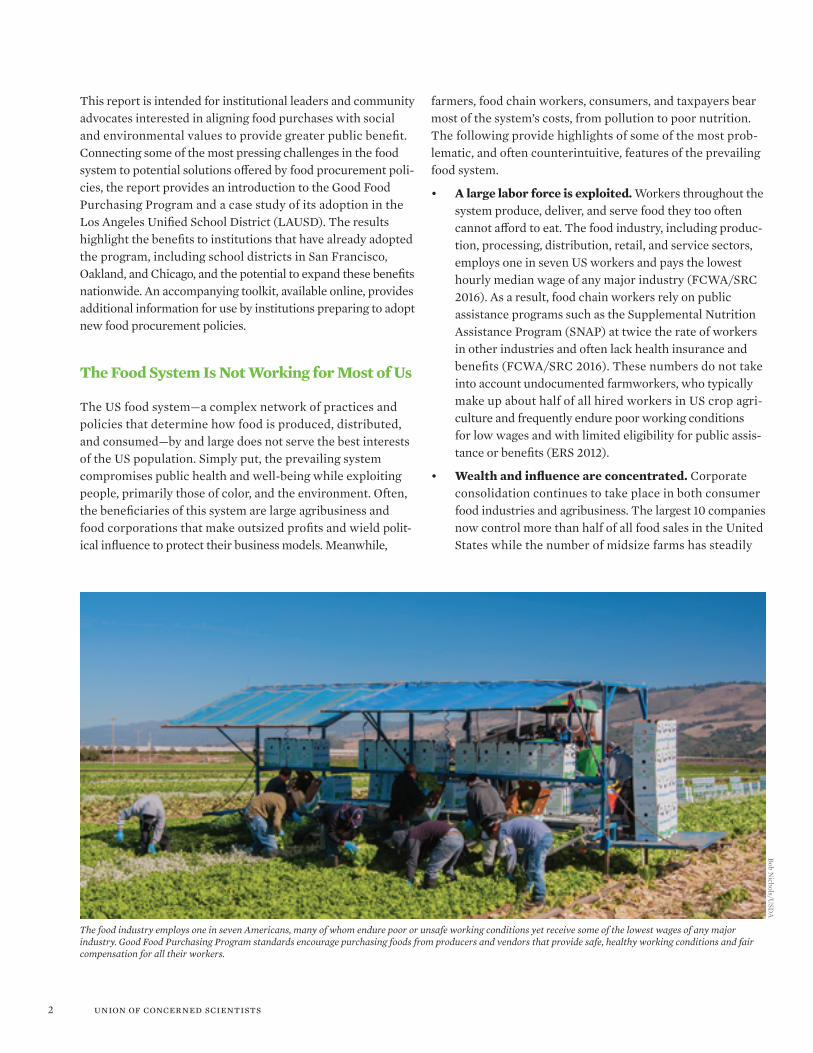
The food industry employs one in seven Americans, many of whom endure poor or unsafe working conditions yet receive some of the lowest wages of any major industry. Good Food Purchasing Program standards encourage purchasing foods from producers and vendors that provide safe, healthy working conditions and fair compensation for all their workers.
Bob Nichols/U
SDA
farmers, food chain workers, consumers, and taxpayers bear most of the system’s costs, from pollution to poor nutrition. The following provide highlights of some of the most prob-lematic, and often counterintuitive, features of the prevailing food system.
• A large labor force is exploited. Workers throughout the system produce, deliver, and serve food they too often cannot afford to eat. The food industry, including produc-tion, processing, distribution, retail, and service sectors, employs one in seven US workers and pays the lowest hourly median wage of any major industry (FCWA/SRC 2016). As a result, food chain workers rely on public assistance programs such as the Supplemental Nutrition Assistance Program (SNAP) at twice the rate of workers in other industries and often lack health insurance and benefits (FCWA/SRC 2016). These numbers do not take into account undocumented farmworkers, who typically make up about half of all hired workers in US crop agri-culture and frequently endure poor working conditions for low wages and with limited eligibility for public assis-tance or benefits (ERS 2012).
• Wealth and influence are concentrated. Corporate consolidation continues to take place in both consumer food industries and agribusiness. The largest 10 companies now control more than half of all food sales in the United States while the number of midsize farms has steadily
3Purchasing Power
decreased over the last two decades, accompanied by the loss of jobs and economic opportunity in rural communities (Mulik 2016; Stuckler and Nestle 2012). The share of each food dollar that farmers receive is now less than 16 cents— the lowest farm share in more than a decade (ERS 2017).
• Industrial agriculture pollutes our environment. The industrial agriculture system that dominates a majority of America’s farmland relies heavily on mono-cultures and costly chemical inputs such as synthetic fertilizers and pesticides. The environmental threats introduced by these systems are numerous, and include reduced soil fertility, increased soil erosion, loss of biodi-versity, and water pollution (Smith, King, and Williams 2015; Veenstra and Burras 2015; Montgomery 2007). Industrialized animal agriculture also generates substan-tial water pollution and contributes between 8 and 18 percent of total global heat-trapping emissions (Herrero et al. 2015).
• The resulting food supply undercuts dietary recom-mendations and compromises public health. While federal dietary guidelines recommend making “half your plate fruits and vegetables,” only 2 percent of US cropland is used to grow fruits and vegetables (DHHS/USDA 2015). Nearly 60 percent of crop land is used to produce indus-trial commodity crops such as corn and soybeans that are used as livestock feed, ingredients for processed food, and inputs for the biofuel industry (Mulik and O’Hara 2013). The high availability and affordability of processed foods relative to healthier options influences consumer food preferences and contributes to poor nutrition and high rates of diet-related chronic disease: fewer than 1 in 10 Americans meet recommendations for fruit and vegetable intake, and half of all Americans now live with a diet- related chronic disease (DHHS/USDA 2015; CDC 2013a). The burden of poor health is borne disproportionately by both low-income populations and communities of color, many of whom experience higher rates of diet-related disease and premature death (CDC 2013a).
• Routine mistreatment of animals threatens human and animal health. Enabled by a lack of transparency and federal regulation, mistreatment of animals is common in industrial livestock production. Practices such as
Research has shown a clear link between antibiotic use in livestock and the increasing public health threat of antibiotic resistance in human medicine.
confinement in small spaces and promotion of animal growth often occur at the expense of animal health and are closely tied to the overuse of antibiotics (CLF 2013). Scientific research has shown a clear link between the use of antibiotics in livestock and antibiotic resistance in humans, calling attention to a serious threat to the effective-ness of modern medicine (FDA 2015). According to estimates by the Centers for Disease Control and Prevention, 2 million individuals are sickened by antibiotic-resistant bacteria each year, resulting in 23,000 deaths. The direct health care costs associated with antibiotic resistance are estimated at $20 billion each year, with an additional $35 billion a year in lost productivity (CDC 2013b). The magnitude of these health care costs is enormous—particularly when compared with the price premiums often associated with antibiotic-free meat. Just one percent of the $20 billion in annual medical costs attributed to antibiotic-resistant infections would cover the costs of substituting antibiotic-free chicken for conventional chicken in the largest 10 school districts in the US for the next 18 years, from 2018 through 2035.
• Racial inequity features prominently in every facet of the food chain. From production to consumption, the food chain systematically harms communities of color. While the frontline workers of the food system are racially and ethnically diverse, only one in seven food industry CEOs is a person of color. Significant wage gaps also persist by race and gender: Latino men, African American men, Asian American men, and Native American men earn between 44 and 76 cents of each dollar earned by white men, and white women, African American women, Latinas, Asian American women, and Native American women earn between 36 and 58 cents of each dollar earned by white men (FCWA/SRC 2016). The structural inequalities and exploitative labor practices embedded in the food industry and other major industries are reflected in rates of poverty and measures of food access and health. Low-income communities and communities of color often have poor access to affordable, healthy foods and face higher rates of diet-related chronic disease such as obesity, type 2 diabetes, and heart disease (Haynes- Maslow 2016).

4 union of concerned scientists
The Power of Institutional Food Purchasing
“Good food” procurement policies have the power to improve institutional food service and prompt progressive shifts in the overall food system through high-value contracts involv-ing high-profile players. Leveraging procurement often works because:
• Large contracts create competition around certain standards. Large institutions, such as hospital systems or public school districts, can guarantee multimillion- dollar contracts for a period of one or more years. Formal procurement procedures for these institutions are typically structured to ensure fair competition among potential bidders and are generally awarded to the lowest bidder able to meet the standards identified in the contract. Because a single contract can generate substantial revenue, vendors have an incentive to compete to meet as many standards as possible at the lowest price.
• Large food service companies have access to many food producers and distribution channels. Much of the food service contract revenue in the United States is generated by only a handful of companies. Aramark, Compass Group, and Sodexo fulfill food service manage-ment contracts for nearly half of all institutional food service outlets in North America, with a combined total revenue of $33 billion per year, while food distributors Sysco and US Foods fulfill contracts for three-quarters of the North American market for broadline distribution services (Fitch and Santo 2016). In some cases, the con-solidation of food service companies fosters resistance to change and presents challenges to implementing new institutional food procurement policies. However, this consolidation also provides an opportunity: large-scale companies have clout to influence existing food suppliers to shift their practices, are able to identify new farms and food suppliers that can meet “good food” procurement
Large-scale food service companies have clout to influence existing suppliers to shift their practices, and infrastructure to support national networks of small-scale producers.
standards, and have the infrastructure to distribute these products. Large-scale operations can support, connect, and strengthen a national network of small-scale “good food” producers.
• Fewer, bigger sales can offer major benefits to farmers operating small and midsize farms. These farmers benefit from purchase orders from institutions or food distribution companies in several ways. The purchase orders ensure a stable and consistent level of demand for certain products, streamline the sales and delivery process for farmers (which saves time and resources by allowing them to make larger deliveries to fewer purchasers), and increase market access for local food sales. According to estimates by the US Department of Agriculture (USDA), more than half of all local food sales are marketed through intermediate channels, including sales directly to institutions through both informal agreements and formal contracts (Low and Vogel 2011). In 2012, interme-diate channels helped more than 22,000 farms sell $3.3 billion in local food (Fitch and Santo 2016).
Tim
Youngquist/Iowa State U
niversity
The Good Food Purchasing Program encourages sourcing foods from local small and midsize farms that embrace sustainable growing practices. One such practice is incorporating native perennial plants (shown here) in and around crop fields to improve soil health, increase biodiversity, and reduce erosion and fertilizer runoff.

5Purchasing Power
• The benefits of a better supply chain are amplified across institutions and regions. When a vendor improves its products or practices in response to the procurement policy of one institution, other institutions may also reap the rewards. For example, when Gold Star Foods, the company providing the majority of wheat products to LAUSD, responded to updated procurement standards with a healthier bread recipe and the use of locally sourced, sustainably grown wheat, better bread products were also received by 115 school districts outside of Los Angeles (PolicyLink 2015).
Food service operations nationwide have implemented a variety of formal and informal procurement strategies, aided by an evolving set of certifications that continue to define the charac-teristics of “good food.” This report's appendices, available online at www.ucsusa.org/PurchasingPower, provide a review of some of the procurement strategies identified in the literature that have demonstrated economic, environmental, or health benefits.
Case Study: The Good Food Purchasing Program
The Good Food Purchasing Program (GFPP) is an institutional food procurement model developed by the Los Angeles Food Policy Council in 2012 with input from more than 100 stake-holders and procurement experts. That same year, a collective of departments and agencies in the city of Los Angeles became the first public institutions to adopt the GFPP, followed by LAUSD. The second largest school district in the country, LAUSD serves more than 739,000 meals and snacks per day with an annual food budget of more than $150 million. After the program found success in Los Angeles, the Center for Good Food Purchasing was created in 2015 to help expand the scale and impact of the program by linking it to place-based efforts in cities across the country. The GFPP has since been adopted by the San Francisco Unified School District and Oakland Unified School District in 2016 and Chicago Public Schools in 2017, and active campaigns are under way in Austin, Cincinnati, Denver, Madison, New York, the Twin Cities, and Washington, DC.
The GFPP awards progressive certifications to public institutions leveraging their purchasing power to achieve a more transparent, equitable, and sustainable food system. It provides a set of flexible metrics-based standards and bench-marks to track progress (PolicyLink 2015). Five key “value categories” drive the program’s vision and provide the basis for its procurement framework: (1) local economies, (2) envi-ronmental sustainability, (3) nutrition, (4) valued workforce, and (5) animal welfare (see the table, p. 6). With these equally weighted categories, the GFPP’s procurement model became
The second largest school district in the country, LAUSD serves more than 739,000 meals and snacks per day with an annual food budget of more than $150 million.
the first of its kind to promote an inclusive set of values to holistically address the systemic inequities embedded in the US food system.
Building a diverse, multi-sectoral coalition to drive policy adoption and implementation is a core tenet of the GFPP model. The Center for Good Food Purchasing, in addition to conducting baseline assessments, tracking progress, and offering technical assistance to participating institutions, part-ners with the workers’ rights nonprofit Food Chain Workers Alliance to support local leaders in building strategic coalitions with representation from each of the five value categories, including labor unions, environmental organizations, and nutrition advocates such as parent groups or worksite wellness teams. With support from the Center for Good Food Purchasing and the Food Chain Workers Alliance, the local coalition develops a campaign, identifies key strategies for adoption, and works to build widespread political support for the GFPP. After the policy is adopted, the diverse interests in the coalition are critical to holding both institutional and city leaders publicly accountable for commitments made through the policy. The Center for Good Food Purchasing and the Food Chain Workers Alliance also offer a peer-to-peer network to support coalitions in participating cities in sharing best practices and strategies for overcoming challenges associated with institu-tional food procurement and maintaining the momentum of a “good food” campaign.
Evaluating the Impact of the Good Food Purchasing Program in the LA Unified School District
In 2012, LAUSD was the second institution to adopt the GFPP. With more than 1,300 schools, LAUSD is the largest public school system in the state of California and the second largest in the nation (LAUSD 2016). Its 665,000 students are ethnically and socioeconomically diverse, with a student population that

6 union of concerned scientists
The Good Food Purchasing Program Standards
Source: AdApted from cGfp 2017A.
Value Vision Definition
Local Economies Support diverse, family- and cooperatively owned, small and midsize agricultural and food processing operations within the local area or region.
Based on a combination of farm size, ownership structure, and distance from purchasing institution.
Nutrition Promote health and well-being by (1) offering generous portions of vegetables, fruit, whole grains, and minimally processed foods, (2) reducing salt, added sugars, saturated fats, and red meat consumption, and (3) eliminating artificial additives.
Based on a checklist that includes targets related to procurements and preparation of healthy food, and healthy food service environment.
Valued Workforce Source foods and ingredients from producers and vendors that provide safe and healthy working conditions and fair compensation for all food chain workers from production to consumption.
Based on the institution’s, vendors’, and suppliers’ adherence to basic labor laws, as well as adoption of third-party certifications and/or union contracts and worker cooperatives.
Environmental Sustainability
Source from producers that reduce or elimi-nate synthetic pesticides and fertilizers; avoid synthetic hormones, routine antibiotics, and genetically modified foods; conserve soil and water; enhance wildlife habitats and biodiver-sity; and reduce energy and water consump-tion, food waste, and heat-trapping emissions. Limit menu items with large carbon and water footprints and prioritize menus with smaller portions of animal proteins.
Based on farming practices that exemplify principles of environmental sustainability, as determined by (1) compliance with certifications that incorporate organic, pesticide-free, or biodynamic practices, or (2) reduction in carbon and water footprint and implementation of strategies to reduce food waste.
Animal Welfare Source from producers that provide healthy and humane conditions for farm animals.
Based on livestock production practices that promote animal welfare, as determined by compliance with third-party certifications OR purchasing strategies that replace a portion of animal protein purchased with plant-based protein.
is 74.0 percent Latino, 9.8 percent white, 8.4 percent African American, and 6.0 percent Asian American, and an estimated one in four students who is, or has a parent who is, an undocu-mented immigrant (Romero 2017). Eight in 10 LAUSD students come from households with incomes low enough to qualify for free or reduced-price school lunch (CDE 2017).
Below, we estimate the potential impacts of GFPP adoption on the Los Angeles area economy, workforce, and environment, as well as public health and animal welfare. These estimates are grounded in scientific evidence and data provided by LAUSD and the Center for Good Food Purchasing. (See the report appendices online at www.ucsusa.org/PurchasingPower for information on data sources, calculations, and assumptions.) Since there are a number of ways an institution can meet the
GFPP standards and variation is inherent among cities and regions, not all of our estimates may be generalizable. The magnitude of the estimated impacts offers compelling evidence in support of the GFPP regardless.
LocaL Economy and Labor Impacts
The 23,000 farms spread across the Los Angeles regional “foodshed”—the 10-county area within 200 miles of the Los Angeles urban core—constitute $16.1 billion of the $54 billion California agriculture sector and account for one in every seven food chain jobs across the region (LAFPC 2013; LAFPC n.d.). Although increases in food sales at retail outlets and growth in employment have outpaced those of the overall

7Purchasing Power
“Our truck driver members likely would have never won their union contract without the procurement
policy at LAUSD and the coalition of organizations that helped put the
policy in place, and that continue to ensure it’s being implemented as
effectively as possible.”
— Shaun Martinez, Teamsters Strategic Campaigner
{
}
economy during the last decade, the success of food and agriculture industries rarely benefits the workers and local communities that sustain them (Jayaraman 2014). California’s farmworkers, upward of three quarters of whom are immi-grants, earn a median personal income of $14,000 and often lack access to health insurance and benefits (CRB 2013). And even as the food retail industry has grown over the past decade—with food industry jobs now accounting for a full 13 percent of employment in LA County—hourly wages have remained stagnant or fallen (Jayaraman 2014; LAFPC 2013).
Daniel Blackwood is a driver for Gold Star Foods, LAUSD’s food distributor. Following the adoption of the Good Food Purchasing Program, Blackwood helped to unionize Gold Star drivers to secure wage increases, job protections, and safer working conditions.
Annie Bernstein, Real Food M
edia
Leaders at the Teamsters labor union and the Food Chain Workers Alliance have been instrumental in building the coalition needed to enforce the GFPP standards in Los Angeles. As part of the local coalition, the Teamsters and their allies utilized LAUSD’s policy to organize the drivers at Gold Star Foods and win a contract securing significant wage increases for the lowest-paid drivers, whistleblower and job protections, and safer working conditions for 165 employees (PolicyLink 2015). Now in its fifth year of the GFPP, LAUSD sources 20 percent of food locally and directs more than 12 percent of its total food budget to producers meeting the program’s labor standards, including one Equitable Food Initiative–certified2 supplier and two distributors with union contracts repre-senting $24 million combined in purchases (CGFP 2017b). Since the adoption of the GFPP, companies have reported more than 221 jobs created across the supply chain (PolicyLink 2015; Watanabe 2013).
Research shows that every dollar that schools spend on local foods adds between $1.60 and $3.12 to the local economy in the form of business profits, employee wages, investor dividends, interests/rents, and government revenue from sales and excise taxes (Christensen et al. 2017; Roche et al. 2016;
Kane et al. 2010). Studies have also suggested that increased production by local food producers helps to generate additional jobs (Christensen et al. 2017; Roche et al. 2016; Pesch 2014; Gunter 2011; Kane et al. 2010). For example, a study of the Sacramento region found that for every $1 million in food produced by local farmers and sold through direct marketing channels, such as farmers markets, 31.8 jobs are generated, and for every $1 million sold through indirect marketing chan-nels, such as large-scale distributors, 10.5 jobs are generated (Hardesty et al. 2016).
Figure 1 (p. 8) illustrates the potential economic and job creation benefits that we calculate would accrue in the Los Angeles area if LAUSD—which currently sources 20 percent of its food locally—directed more of its $150 million food budget to local purchases. See the report appendices online for details.

8 union of concerned scientists
fiGure 1. Increasing Local Food Purchases by LAUSD Bring Money and Jobs to Local Communities
If LAUSD directed incrementally larger shares of its $150 million annual food budget to local purchases (its current share is 20 percent), millions of dollars would be added to the Los Angeles economy. This, in turn, increases production by local food producers, generating additional jobs. Notes: Low end of economic benefits range assumes a $1.60 multiplier applied to each dollar spent locally in LAUSD’s $150 million annual budget, under each given percentage; high end assumes a $3.12 multiplier. Jobs numbers assume 10.5 jobs are generated for every $1 million of output produced by farmers and sold through indirect marketing, and assumes a wholesale trade sector margin of 17 percent.
SourceS: chriStenSen et Al. 2017; hArdeSty et Al. 2016; roche et Al. 2016; KAne et Al. 2010.
a. Benefits to Local Economy b. Jobs Generated
20% 50% 75% 100%$0
$100
$200
$300
$400
$500
Percent of Food Purchased Locally
20% 50% 75% 100%0
200
400
600
800
1,000
1,200
1,400
Percent of Food Purchased Locally
20% 50% 75% 100%$0
$100
$200
$300
$400
$500
Percent of Food Purchased Locally
20% 50% 75% 100%0
200
400
600
800
1,000
1,200
1,400
Percent of Food Purchased Locally
EnvIronmEntaL sustaInabILIty ImprovEmEnts
By some measures, California is a leader in sustainable farming practices. Home to more than 2,800 organic farms covering 687,000 acres, California consistently tops US organic farming lists. Sales of organic crops, livestock, and poultry products in California totaled $2.2 billion in 2014, accounting for 41 percent of all US organic sales and leading second-place Washington by a full $1.6 billion (NASS 2015). However, despite the relatively high adoption rates of organic farming practices, agriculture continues to pose substantial environmental threats throughout the state. For example, in 2011 nearly 30,000 tons of pesticides were applied in the LA foodshed alone, contributing to ground-water contamination and putting farmworker health at risk. In addition, less than one-half of 1 percent of all agricultural water used in the LA foodshed came from rainfall, making the area’s agricultural economy heavily dependent on river water, Sierra Nevada runoff, and variable and increasingly scarce groundwater (LAFPC 2013).
While certified organic farms cannot fully solve the persis-tent environmental challenges posed by today’s agriculture,
they offer an important starting point in the move toward more regenerative farms and ranches.3 In the meantime, another effective strategy to improve sustainability is to rely more on food products that are generally known to have lower environmental impacts, especially those purchased from non-industrial farms—a factor particularly important for meat. LAUSD is working to meet the GFPP’s environmental
LAUSD is sourcing more food from certified sustainable producers and shifting school menus toward products with smaller carbon footprints and less water use.
Economic Benefits Range
9Purchasing Power
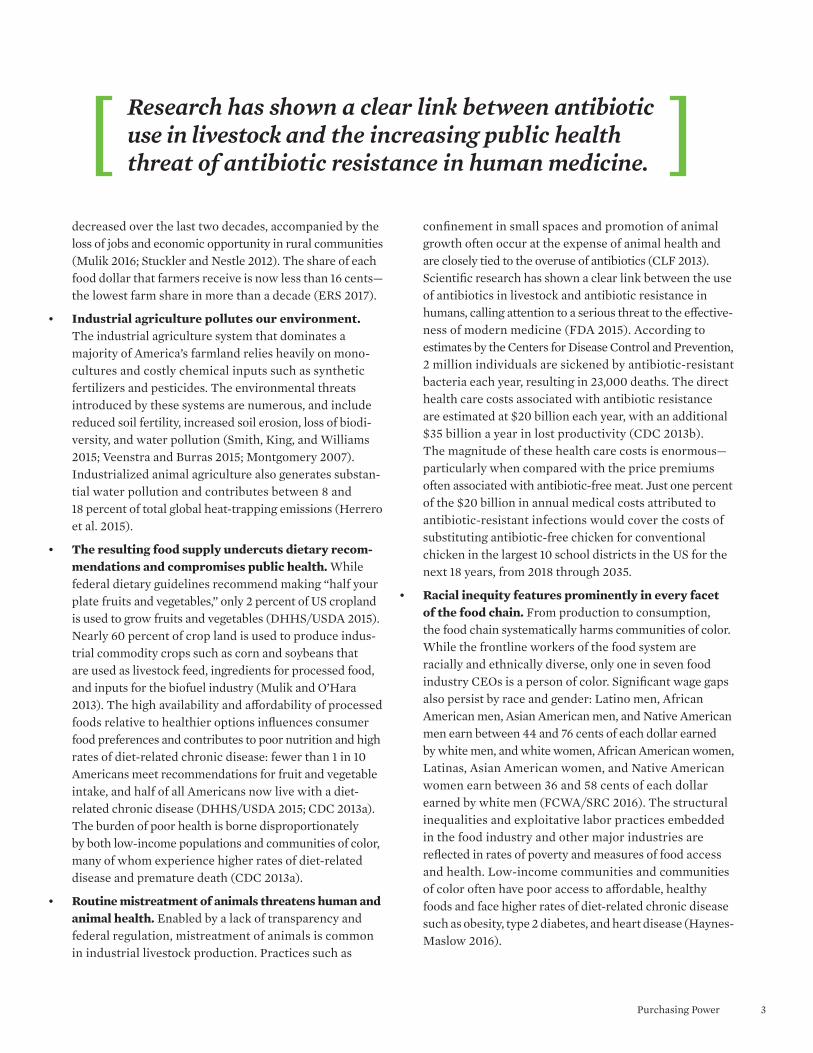
standards by sourcing more food from certified sustainable producers and shifting school menus toward products with smaller carbon footprints and less water use. During the last year, the district invested more than $1.5 million, representing almost 6 percent of the total food budget, in bread made with Food Alliance–certified4 wheat from the Shepherd’s Grain farmer cooperative in Oregon. LAUSD has also implemented a “meatless Monday” policy to reduce total meat purchases, consumption, and environmental impacts such as pollution and intensive use of natural resources. Building on the success of meatless Monday, an LAUSD pilot program to offer vegan meals is now under way (McKinney 2017).
The following calculations project the impact of altered purchasing patterns—in particular, the reduction of meats such as beef, pork, and poultry and substitution with other protein products—on the carbon footprint and water use in LAUSD between the 2012–2013 and 2014–2015 school years, based on data available from comparable time periods (April through June). Due to data availability, we were limited to estimating the impacts of meat reduction; the actual environ-mental impact of sustainable sourcing is no doubt broader.5
Among the ways LAUSD is working to meet Good Food Purchasing Program standards is by sourcing more food from certified sustainable producers. During the last year, the district invested more than $1.5 million in bread made with sustainably grown wheat from the Shepherd’s Grain farmer cooperative in Oregon.
pxhe
re
In general, carbon footprint estimates are subject to variability, as a range of methodologies have been developed to calculate carbon footprints; applying different methods would result in lower or higher estimated impacts. See the report appendices online for details.
• LAUSDreduced purchases of industrially produced beef by 35 percent from 2013 (April to June) to 2015 (April to June) and purchases of all industrially pro-duced meat (beef, poultry, and pork) by 28 percent.
• Thisreductioninpurchasesofindustriallyproducedmeat likely reduced the Lausd carbon footprint by about 22 percent annually, which translates to 9 million kilograms (kg) of carbon dioxide (co2 ) emissions avoided per year—equivalent to taking 1,930 cars off the road (EPA 2017).
• Morethan14gallonsofwaterwereestimatedtobesaved per meal, resulting in a total annual water savings of more than 1 billion gallons—enough water to fill 1,760 olympic-sized swimming pools every year.
10 union of concerned scientists
HEaLtH and nutrItIon GaIns
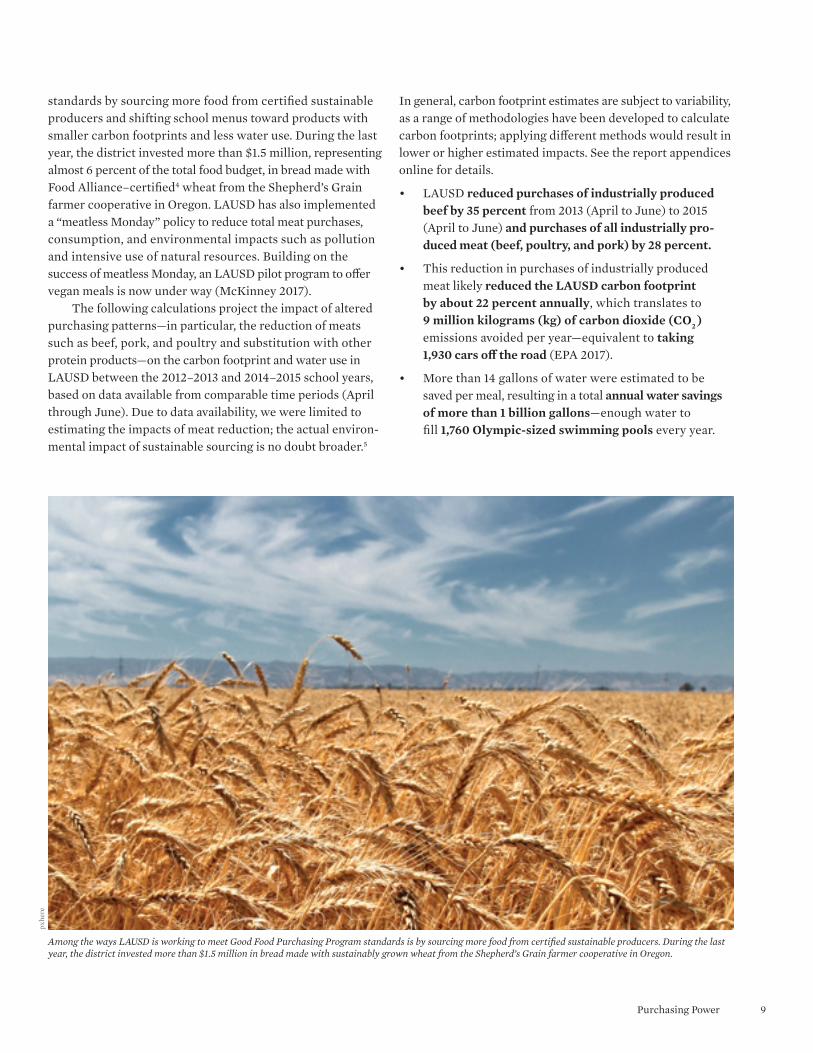
The food services division at LAUSD has received widespread recognition both for the quality and quantity of meals served in schools. The district operates the largest school breakfast program and second largest school lunch program in the United States and has been awarded multiple bronze medals by the Healthier US School Challenge (LAUSD n.d.). While healthy school meals are important for all students, they are critical in schools serving a high percentage of low-income students: nearly one-third of all households in Los Angeles with incomes under 185 percent of the federal poverty level (the threshold for reduced-price lunches) experience food insecurity, and many students rely on school meals to help meet their nutritional needs (ERS 2016b). Healthy school meals also play a role in protecting the health of students at higher risk of diet-related chronic disease, including immi-grants, children of immigrants, and students of color whose health is uniquely compromised by the stress of accultura-tion, experiences of racism and discrimination, and dispari-ties in the quality and accessibility of health care (APA 2017; Artiga and Damico 2017; Calvo and Hawkins 2016).
The GFPP’s nutrition targets are rooted in the federal Dietary Guidelines for Americans and encourage institutions to promote foods such as fruits, vegetables, whole grains, and lean proteins, while limiting sodium, added sugars, saturated fat, trans fat, and processed meats (DHHS/USDA 2015). LAUSD currently meets two-thirds of the GFPP’s nutrition targets, including the preferential purchase of seasonal and minimally processed fresh fruits and vegetables, display of fruits and vegetables in highly visible locations, reduction of processed meat purchases, and prioritization of low-calorie and low-sugar beverages. Through the GFPP, LAUSD has also committed to adhering to the Healthy, Hunger-Free Kids Act, the 2010 landmark legislation that strengthened national
school nutrition standards, despite recent USDA policy changes (including the delay of phased sodium-reduction targets and the provision of waivers for whole grain requirements) that threaten to weaken national standards.
We have calculated the following short- and long-term projected health outcomes for LAUSD students based on the nutrition standards adopted by LAUSD. See the report appendices online for details.
• moving forward with sodium targets specified in the Healthy, Hunger-Free Kids act could reduce sodium intake by 11.5 to 14.6 percent among students eating school breakfast and lunch, with potential reductions in blood pressure for an estimated 160,000 students. Prehypertension and hypertension affect about one in five adolescents and correlate with hypertension in adulthood. Sodium reduction and other early dietary interventions to maintain normal blood pressure can help to lower the future risk of long-term health complications, such as cardiovascular disease (Appel et al. 2015; Redwine and Falkner 2013; He and MacGregor 2006).
Healthy school meals help protect the health of students who are at higher risk of diet-related chronic disease, including students of color, immigrants, and children of immigrants.
USD
A
The Good Food Purchasing Program’s nutrition targets encourage institutions to make fruits, vegetables, and whole grains readily available. Increasing consumption of these foods can help reduce the risk of diet-related diseases, especially among low-income populations and communities of color that often have poor access to affordable, healthy foods.

11Purchasing Power
• For every graduating class across all Lausd schools, up to 95 fewer lifetime cases of colorectal cancer would be expected if processed meats were absent from school lunches, as compared with being available daily. The National School Lunch Program’s meal pattern requirements for meat or meat alternatives can be met with a 56 gram serving of processed meat. The World Health Organization has identified processed meat— including deli meats, hot dogs, sausages, bacon, and meat sauces—as a Group 1 carcinogen, with the lifetime risk of colorectal cancer increasing by about 18 percent per every 50 grams of processed meat eaten daily (Bouvard et al. 2015). As part of its continued efforts to serve less processed meat, LAUSD now offers processed meats in only two to three lunches per week.
• maintaining the Healthy, Hunger-Free Kids act’s whole grain standards in Lausd lunchrooms can reduce nutritional disparities between more than half a million low-income students and their higher-income peers. Low-income adolescents consume an average of 0.5 serving of whole grains per day, falling far short of the minimum three servings recommended by the Dietary Guidelines for Americans (DHHS/USDA 2015). Whole grain intake, which is associated with reductions in metabolic risk factors for a number of chronic diseases, has remained static among low-income youth over the last decade—even as intake among high-income youth nearly doubled from 0.6 to 1 serving per day over the same time period (Tester et al. 2017; Steffen et al. 2003). Providing whole grains in school lunches is of critical importance for low-income youth facing higher rates of food insecurity and risk of obesity and type 2 diabetes (Pulgaron and Delamater 2014).
anImaL WELFarE ImprovEmEnts
Antibiotic use in livestock production can increase the risk of pathogens developing resistance to antibiotics we rely on to protect human health. Antibiotics are often added to animal feed to enhance growth or administered to entire herds or flocks to prevent disease, rather than targeted to sick animals. General-ized applications of antibiotics can compromise animal welfare by promoting rapid and unsustainable growth and enabling animal confinement in exceedingly small spaces. Threats to animal health, in addition to those posed to human health, have prompted responses from consumers, advocates, and the federal government. The national Keep Antibiotics Working coalition and other advocates have called for a federal prohibition on the use of antibiotics in animals that are not sick, while the Food and Drug Administration has issued
voluntary guidelines for industry to curb the use of medically important antimicrobial drugs in animal agriculture in the absence of formal regulation (FDA 2017; KAW 2017).
Animal welfare standards for institutional food procure-ment have proven to be challenging to implement, due to the limited availability of antibiotic-free and humanely raised meat in the supply chain and its potential higher costs. However, due in large part to the work of advocates and consumer groups, antibiotic-free chicken is becoming increasingly available. As of 2015, just five companies accounted for two-thirds of all chicken produced in the United States (see Figure 2). In that year, antibiotic-free chicken production publicly reported by Tyson Foods, Pilgrim’s Pride, and Perdue Farms accounted for only 5 percent of all US chicken production. By 2017, this number had increased to 20 percent—a fourfold increase over the course of just two years (see Figure 3, p. 12).
In demonstrating demand for antibiotic-free chicken, LAUSD has helped to accelerate trends among large poultry producers: between 2014 and 2017, three of the five largest US chicken producers made public commitments to significantly reduce antibiotic use. A school food contract of this magnitude
Just five companies produce nearly two-thirds of all ready-to-cook chicken products sold in the United States. The LA Unified School District has helped bring sea change to the poultry industry by negotiating contracts for antibiotic-free chicken with some of the largest producers in the country.Source: WAtt GlobAl mediA 2015.
fiGure 2. Top US Producers of Chicken by Volume, 2015
Tyson Foods23%
Pilgrim’s Pride19%
Other Producers
35%
Sanderson Farms9%
Koch Foods6%
Perdue Farms8%

12 union of concerned scientists
for antibiotic-free chicken signaled a sea change not just for Perdue Farms—the fourth-largest chicken producer in the United States—but for the industry as a whole, as other companies following suit begin to shift the market landscape of antibiotic-free poultry (see the timeline, p. 13) (WATT Global Media 2015).
Magnifying Impact: What If All of Los Angeles County Adopted the Good Food Purchasing Program?
A campaign is currently under way to secure the adoption of the GFPP by Los Angeles County. With more than 10 million residents, LA County is more populous than many US states and would be the largest entity to date to implement a comprehensive food procurement policy. Expansion of the GFPP to the county would cover more than 800,000 students enrolled in LA County public schools in addition to those students enrolled in LAUSD schools, and would reach public hospitals, correctional facilities, and county departments serving a total of 37 million meals each year to more than 100,000 county employees and hundreds of thousands of visitors and California residents (LACDPH 2014).
While LA County benefits from a diverse supply of agricultural products, a relatively high number of organic farms, and progressive social programs and policies, it too experiences a number of problems that the GFPP can help address: persistent challenges to sustainable food production, significant health disparities and economic inequity along racial and sociodemographic lines, and the systemic worker abuse and exploitation endemic to the US food system. LA County
fiGure 3. Antibiotic-Free Chicken Comprises a Growing Share of the US Chicken Market
Between 2015 and 2017, the reported production of antibiotic-free chicken in the United States by Perdue Farms, Pilgrim’s Pride, and Tyson Foods jumped from 5 percent to 20 percent of all ready- to-cook chicken—a fourfold increase over just two years—thanks to major poultry producers increasing their commitment to reduce antibiotic use.Note: Percentages based on publicly available information from producers and/or spokespersons, and include only "no antibiotics ever" (NAE) production from the top five US chicken producers. Tyson Foods has confirmed that the transition of its retail brand to NAE is now complete and the company is now the world’s largest producer of NAE chicken, based on volume. 2017 data is based on this information. Tyson Foods declined to provide estimates for NAE chicken produced in 2015 or 2016. Contributions of NAE chicken to US market based on 2015 ready-to-cook chicken production by volume.
SourceS: perdue fArmS 2017; tySon foodS 2017; pilGrim’S pride 2016; polAnSeK 2016; chArleS 2015; SzAl 2015; WAtt GlobAl mediA 2015.
Animal welfare is one of the five core values of the Good Food Purchasing Program. Restricting antibiotic use in livestock and poultry can not only improve conditions for animals, but also protect human health by keeping antibiotics effective for medical treatment.
Michael C
zarick, University of G
eorgia College of
Agricultural and Environm
ental Sciences
2015 2016 20170%
10%
20%
30%
40%
50%
Tyson Foods
Pilgrim’s Pride
Perdue Farms
5%
10%
20%
2015 2016 20170%
10%
20%
30%
40%
50%
2015 2016 20170%
10%
20%
30%
40%
50%

13Purchasing Power
households tend to experience somewhat higher rates of poverty, lower educational attainment, and poorer self- reported health, compared with national averages. More than 21 percent of adults in LA County report their health as “fair” or “poor,” compared with about 17 percent of adults nationwide (LACDPH 2017). However, vast disparities also exist among LA County subpopulations, attributable in part to the many barriers facing immigrant communities. Nearly half of all LA County residents are Latino, and about one in 10 is an undocumented immigrant (OHAE 2017; Pastor and Marcelli 2013). The rate of uninsured Latino adults in LA County nears 18 percent—almost triple that of white, African American, and Asian county residents—and research has shown that children in LA County are four times less likely to see a doctor when needed because of medical costs, compared with national averages (LACDPH 2017; OHAE 2017).
The following economic, environmental, and health outcomes are among the benefits projected to accrue to LA County public schools and other LA County facilities if they adopt the GFPP.6
projEctEd bEnEFIts oF tHE adoptIon oF tHE Good Food purcHasInG proGram In La county pubLIc scHooLs
Economic and Labor impacts
Figure 4 (p. 14) illustrates the potential economic and job creation benefits that we calculate would accrue in the Los Angeles County region if LA County public schools directed 20 percent or more of its food budget to local purchases. See the report appendices online for details.
EnvironmEntaL impacts
• IfallschoolsinLACountyadoptedtheGFPPandimple-mented similar meat reduction strategies as LAUSD, they could reduce their total carbon footprints by more than 33 million kg co2 annually— equivalent to taking 7,240 cars off the road.
• Similarmeatreductionstrategiescouldalso reduce water use by more than 4 billion gallons—enough water to fill 6,550 olympic-sized swimming pools.
Landmark LAUSD Contract Helps Propel Market for Antibiotic-Free Chicken
Early 2016LAUSD engages in contract negotiations with Tyson Foods and Pilgrim's Pride in an effort to source antibiotic- free chicken. “Good food” advocates oppose these contracts, and the companies end negotiations. LAUSD approves a short-term contract with Gold Star Foods for antibiotic-free chicken and significantly reduces the amount of chicken on its menus.
October 2016Perdue Farms ends the routine use of antibiotics in its entire operation. More than 95 percent of its chickens are now raised without antibiotics.
2014 2015 2016 2017
October 2017All chicken sold under the Tyson Foods label are raised without any antibiotics. While Tyson Foods has declined to comment on the percentage of its chicken production that is sold under the Tyson Foods label, the company reports that it is now the largest producer of antibiotic- free chicken in the world.
September 2014Perdue Farms eliminates the use of antibiotics from all hatcheries and is the first major meat-processing company to eliminate routine use of human antibiotics in chicken production.
April 2015Tyson Foods commits to elimi-nating all human antibiotics in its meat processing by 2017, and adopts the USDA-verified “certified responsible antibiotic use” label, developed by School Food Focus and Pew Charitable Trusts.
April 2015Pilgrim’s Pride announces plans to eliminate all antibiotics from a quarter of its chicken by 2019. About 5 percent of its chickens produced receive no antibiotics at this time.
December 2016Pilgrim’s Pride chickens no longer receive any medically important human antibiotics, and about 12 percent of its chickens receive no antibiotics of any kind.
March 2017LAUSD negotiates and approves new contracts of up to $50 million for antibiotic-free chicken with Perdue Farms, Goodman Food Products, and Somma Food Group, as well as an additional contract with Gold Star Foods. Chicken fully returns to LAUSD menus.
July 2015Perdue Farms eliminates the use of human antibiotics in about 96 percent of chickens, and raises half of all its chickens with no antibiotics of any kind.
October 2014Tyson Foods eliminates the use of antibiotics from all 35 broiler chicken hatcheries. Adult chickens continue to receive antibiotics.
SourceS: mcKinney 2017; perdue fArmS 2017; tySon foodS 2017; pilGrim’S pride 2016; bunGe 2015.
14 union of concerned scientists
of the policy on adults regularly eating meals at LA County facilities, as well as environmental and economic impacts, should these facilities implement similar procurement strategies as LAUSD.
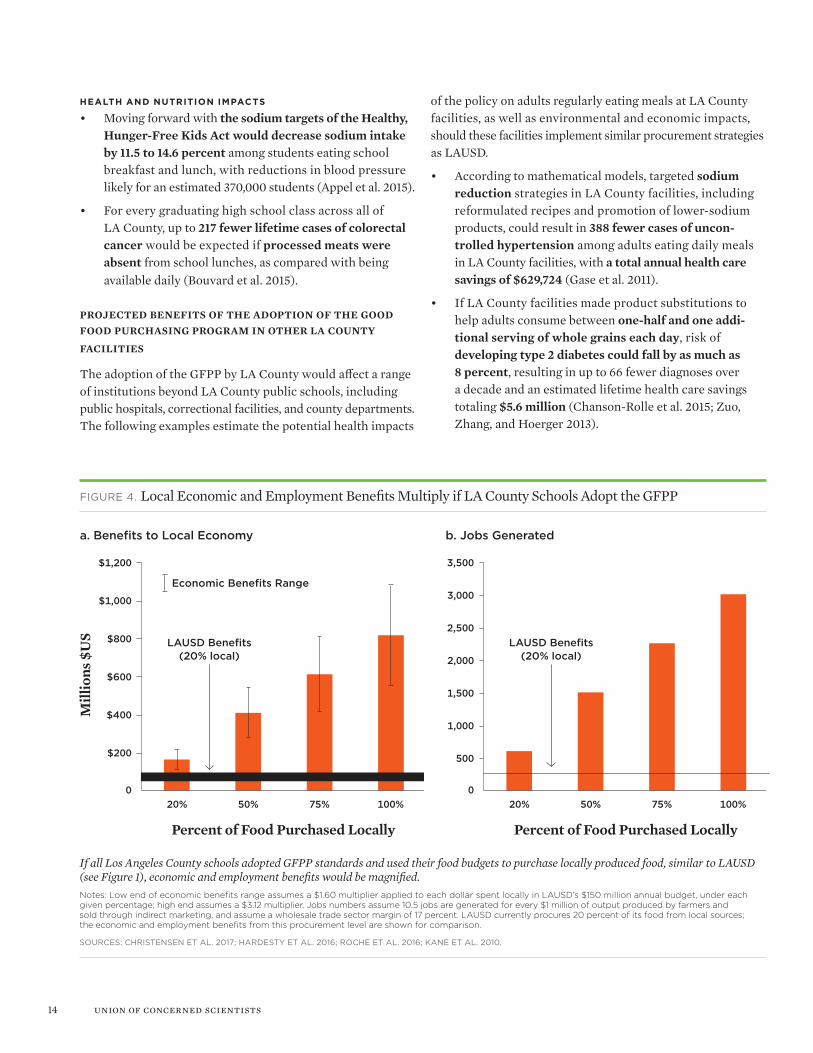
• Accordingtomathematicalmodels,targetedsodium reduction strategies in LA County facilities, including reformulated recipes and promotion of lower-sodium products, could result in 388 fewer cases of uncon-trolled hypertension among adults eating daily meals in LA County facilities, with a total annual health care savings of $629,724 (Gase et al. 2011).
• IfLACountyfacilitiesmadeproductsubstitutionstohelp adults consume between one-half and one addi-tional serving of whole grains each day, risk of developing type 2 diabetes could fall by as much as 8 percent, resulting in up to 66 fewer diagnoses over a decade and an estimated lifetime health care savings totaling $5.6 million (Chanson-Rolle et al. 2015; Zuo, Zhang, and Hoerger 2013).
HEaLtH and nutrition impacts
• Movingforwardwiththe sodium targets of the Healthy, Hunger-Free Kids act would decrease sodium intake by 11.5 to 14.6 percent among students eating school breakfast and lunch, with reductions in blood pressure likely for an estimated 370,000 students (Appel et al. 2015).
• Foreverygraduatinghighschoolclassacrossallof LA County, up to 217 fewer lifetime cases of colorectal cancer would be expected if processed meats were absent from school lunches, as compared with being available daily (Bouvard et al. 2015).
projEctEd bEnEFIts oF tHE adoptIon oF tHE Good Food purcHasInG proGram In otHEr La county
FacILItIEs
The adoption of the GFPP by LA County would affect a range of institutions beyond LA County public schools, including public hospitals, correctional facilities, and county departments. The following examples estimate the potential health impacts
fiGure 4. Local Economic and Employment Benefits Multiply if LA County Schools Adopt the GFPP
If all Los Angeles County schools adopted GFPP standards and used their food budgets to purchase locally produced food, similar to LAUSD (see Figure 1), economic and employment benefits would be magnified. Notes: Low end of economic benefits range assumes a $1.60 multiplier applied to each dollar spent locally in LAUSD’s $150 million annual budget, under each given percentage; high end assumes a $3.12 multiplier. Jobs numbers assume 10.5 jobs are generated for every $1 million of output produced by farmers and sold through indirect marketing, and assume a wholesale trade sector margin of 17 percent. LAUSD currently procures 20 percent of its food from local sources; the economic and employment benefits from this procurement level are shown for comparison.
SourceS: chriStenSen et Al. 2017; hArdeSty et Al. 2016; roche et Al. 2016; KAne et Al. 2010.
a. Benefits to Local Economy b. Jobs Generated
20% 50% 75% 100%0
$200
$400
$600
$800
$1,000
$1,200
Percent of Food Purchased Locally
20% 50% 75% 100%0
500
1,000
1,500
2,000
2,500
3,000
3,500
Percent of Food Purchased Locally
20% 50% 75% 100%0
$200
$400
$600
$800
$1,000
$1,200
Percent of Food Purchased Locally
20% 50% 75% 100%0
500
1,000
1,500
2,000
2,500
3,000
3,500
Percent of Food Purchased Locally
LAUSD Benefits (20% local)
LAUSD Benefits (20% local)
Economic Benefits Range

15Purchasing Power
• IfLACountyfacilitiesadoptedstrategiestohelpadultsconsume one additional serving of fruits and vegetables each day, risk of cardiovascular mortality could decrease by as much as 4 percent. This would result in an estimated 16 fewer deaths over the course of a decade among those adults eating daily meals at LA County facilities (Wang et al. 2014).
• AdoptingsimilarmeatreductionstrategiesasLAUSD, LA County facilities could benefit from a carbon footprint savings of more than 4 million kg co2 annually, equiva-lent to taking 870 cars off the road, and an annual water savings of 520 million gallons—enough water to fill 790 olympic-sized swimming pools every year.
• IfLACountyfacilitiessourced20 percent of its food locally, the projected benefits to the local economy would be $6 million to $13 million annually, and more than 35 jobs could be generated. If the county sourced 100 percent of its food locally, the projected benefits to the local economy would be $33 million to $64 million annually, and nearly 180 jobs could be generated.
Challenges and Barriers
Despite the early success of models like the GFPP, there are a number of barriers to institutional “good food” procure-ment: institutions have different needs, regional supply chains often lack necessary infrastructure, implementation costs must be managed, and vendors may be resistant to requests for information. Some of these challenges can be addressed with resources or technical support provided by national organizations and coalitions, including the Center for Good Food Purchasing, Real Food Challenge, and Health Care Without Harm. Other challenges are more deeply rooted in food systems policies and practices and may require systemic solutions through improved local, state, and federal policy.
Establishing procedures for collecting data on food purchasing and service is also an important—and challenging— component of implementing a food procurement policy. Consistent annual data collection is essential for tracking progress, identifying areas for improvement, and demonstrating outcomes for stakeholders and potential funders. Resources and funding opportunities available to help institutions implement and evaluate programs include grants from phil-anthropic organizations and government agencies, loans from cooperative banks and investment firms, and funds built into municipal and city budgets.
For more information on the challenges and barriers associated with institutional food procurement, as well as a list
of sample questions and tools for collecting data, see our “Good Food” Procurement Toolkit at www.ucsusa.org/PurchasingPower.
Conclusion
Leveraging the collective purchasing power of schools, universities, hospitals, and public facilities, institutional food procurement policies can be a powerful tool for transforming the US food system. The GFPP is an example of one such policy that helps institutions enhance integrity and transparency throughout the supply chain to advance measures of equity and sustainability. As our analysis has shown, the adoption of the GFPP has resulted in a number of actual and projected impacts in the LAUSD, including:
• Directing$30milliontolocalfoodpurchases,witha projected benefit to the local economy of $48 million to $94 million annually
• Supportingthecreationofmorethan221well-payingjobs and securing a union contract for 165 employees of a major food distributor
• Shiftingdietarypatternsthatcorrelatewithreduced cardiovascular risk factors and lifetime cancer risk among youth
• Securingmorethan$50millionincontractswith antibiotic-free poultry producers
In addition to its anticipated expansion to LA County, the GFPP is now at the center of active campaigns and imple-mentation efforts in 25 institutions across 12 cities nationwide, including Austin, Chicago, Cincinnati, Denver, New York City, Oakland, San Francisco, and Washington, DC. The combined food budgets of these institutions represent nearly $1 billion in annual purchasing power, about 2.5 percent of the total value of all US food service contracts (McKinney 2017). Expansion of the GFPP in these cities and beyond will be propelled by (1) policy innovations that can reduce barriers to “good food”
If broad-based demand for a better food system maintains momentum, the benefits of “good food” procurement policies can be realized in every corner of the country.
16 union of concerned scientists
procurement, (2) diverse sources of funding that can support the implementation and evaluation of “good food” policies, (3) institutionalized procedures for robust and consistent data collection, and (4) continued advocacy for the importance and numerous advantages of an equitable and sustainable food system for all. If broad-based demand for a better food system maintains momentum, it is entirely possible that the vast poten-tial benefits of “good food” procurement policies—including stronger economies, more sustainable farming practices, better jobs and livelihoods for workers, and healthier kids and families—can be realized in every corner of the country.
Sarah Reinhardt is a food systems and health analyst in the UCS Food and Environment Program. Kranti Mulik is a senior economist in the program.
acknowLEdgmEntsThis report was made possible in part through the generous support of Gaia Fund, the Grantham Foundation for the Protection of the Environment, The Martin Foundation, The New York Community Trust, the Panta Rhea Foundation, The 11th Hour Project of The Schmidt Family Foundation, two anonymous donors, and UCS members.
For their reviews of the report, the authors would like to thank Alexa Delwiche, executive director, Center for Good Food Purchasing; Colleen McKinney, associate director, Center for Good Food Purchasing; Jose Oliva, codirector, Food Chain Workers Alliance; Clare Fox, executive director, Los Angeles Food Policy Council; and Julian Kraus-Polk, program consultant, Friends of the Earth. The time they spent reviewing and contributing to the report was considerable, and their comments and suggestions greatly improved it. At UCS, the author thanks Marcia DeLonge, Mike Lavender, Glynis Lough, Leslie Morrison, Ricardo Salvador, and Karen Perry Stillerman for their help in developing and refining this report.
Organizational affiliations are listed for identification purposes only. The opin-ions expressed herein do not necessarily reflect those of the organizations that funded the work or the individuals who reviewed it. The Union of Concerned Scientists bears sole responsibility for the report’s contents.
EndnotEs1 We define institutional (noncommercial) food service facilities by US
Department of Agriculture data categories of schools and colleges, recreational places, hotels and motels, and “all other” (which includes military exchanges and clubs; railroad dining cars; airlines; food service in manufacturing plants, institutions, hospitals, boarding houses, fraternities and sororities, and civic and social organizations; and food supplied to military forces, civilian employees and child day care centers). Previous versions of this report included meals and snacks from stores, bars, and vending machines, for a total of nearly $150 billion.
2 The Equitable Food Initiative program certifies the achievement of standards for working conditions, including labor standards, fair wages, benefits, and freedom from discrimination; pesticide standards, including full reporting on pesticide use and risks to workers and the environment; and food safety standards, including worker hygiene, water use, soil amendments, and land use (EFI 2017).
3 Organic farming can address some, though not all of the challenges related to industrial agriculture. For example, a comparison of organic and conventional systems in Europe showed that, in general, organic farming practices have positive impacts on a per unit area but not per product unit (such as per kilogram) (Tuomisto et al. 2012). Organic farms tend to have higher soil organic matter and lower nutrient losses (such as nitrogen leaching), nitrous oxide emissions, and ammonia emissions per unit of field area. However, a meta-analysis that compared environmental impacts of organic and conventional farming in Europe found that nutrient losses per product unit were higher in organic systems (Tuomisto et al. 2012). Similarly, certified organic systems still use organic pesticides, and some research shows that organic pesticides can have higher environmental impacts than conventional pesticides (Bahlai et al. 2010).
Therefore, it is very important to have standards for sourcing food from farms that use sustainable practices, those taking a systems approach to farming where the focus is on building healthier soils by adopting practices such as no till, cover cropping, and crop rotations and using better livestock management practices. Research has shown that adopting no-till crop rotations can reduce heat-trapping emissions, soil erosion, and surface water cleanup costs (Mulik 2016). Similarly, adoption of practices such as cover cropping and crop rotation can actually reduce the incidence of floods and droughts (Basche 2017).
4 The nonprofit Food Alliance operates a voluntary certification for farms, ranches, and food handlers that meet sustainable agriculture standards, such as farming practices that protect soil and conserve water. This certification is recognized by the GFPP.
5 The GFPP’s environmental standards, in addition to awarding points for reductions in meat purchases, encourage sourcing meat from sustainable livestock producers with environmentally sustainable practices, including diversified crop-livestock systems, with potential additional environmental benefits. Similarly, sourcing from small and midsize farms may contribute to improved soil health, as these farmers are more likely to adopt practices such as no till, cover cropping, and crop rotations.
6 Due to the flexibility offered within each of the value categories in the GFPP, the specific path to program compliance by LA County may differ from that of LAUSD and the city of Los Angeles. See the report appendices online for details.
rEfErEncEsAmerican Psychological Association (APA). 2017. Fact sheet: Health
disparities and stress. Washington, DC. Online at http://apa.org/topics/health-disparities/fact-sheet-stress.aspx, accessed August 18, 2017.
Appel, J.L., A.H. Lichtenstein, E.A. Callahan, A. Sinaiko, L.V. Horn, and L. Whitsel. 2015. Reducing sodium intake in children: A public health investment. Journal of Clinical Hypertension 17(9):657–662. Online at https://ncbi.nlm.nih.gov/pmc/articles/PMC5034752, accessed August 21, 2017.
Artiga, S., and A. Damico. 2017. Health coverage and care for immi-grants. Issue brief, July. Menlo Park, CA: The Henry J. Kaiser Family Foundation. Online at http://files.kff.org/attachment/issue-brief-health-coverage-and-care-for-immigrants, accessed September 18, 2017.
Bahlai, C.A., Y. Xue, C.M. McCreary, A.W. Schaafsma, and R.H. Hallett. 2010. Choosing organic pesticides over synthetic pesticides may not effectively mitigate environmental risk in soybeans. PLoS ONE 5(6):e11250. Online at https://doi.org/10.1371/journal.pone.0011250, accessed September 8, 2017.
Basche, A. 2017. Turning soils into sponges: How farmers can fight floods and droughts. Cambridge, MA: Union of Concerned Scientists. Online at www.ucsusa.org/sites/default/files/attach/ 2017/08/turning-soils-into-sponges-full-report-august-2017.pdf, accessed September 8, 2017.
Bouvard, V., D. Loomis, K.Z. Guyton, Y. Grosse, F.E. Ghissassi, L. Benbrahim-Tallaa, N. Guha, H. Mattock, and K. Straif. 2015. Carcinogenicity of consumption of red and processed meat. The Lancet Oncology 16(16):1599–1600. Online at http://thelancet.com/journals/lanonc/article/PIIS1470-2045(15)00444-1/fulltext, accessed August 18, 2017.
Bunge, J. 2015. Pilgrim’s expects 25% of its chicken will be antibiotic- free by 2019. The Wall Street Journal, April 20. Online at www.wsj.com/articles/pilgrims-expects-25-of-its-chicken-will-be-antibiotic- free-by-2019-1429564675, accessed October 23, 2017.
California Department of Education (CDE). 2017. Student poverty FRPM data. Online at http://cde.ca.gov/ds/sd/sd/filessp.asp, accessed August 8, 2017.

17Purchasing Power
California Research Bureau (CRB). 2013. Farmworkers in California: A brief introduction. Sacramento, CA: California State Library. Online at http://library.ca.gov/crb/13/S-13-017.pdf, accessed August 21, 2017.
Calvo, R., and S.S. Hawkins. 2016. Disparities in quality of healthcare of children from immigrant families in the US. Maternal and Child Health Journal 19(10):2223–2232. Online at www.ncbi.nlm.nih.gov/ pmc/articles/PMC4575861, accessed September 18, 2017.
Center for a Livable Future (CLF). 2013. Industrial food animal production in America: Examining the impact of the Pew Commission’s priority recommendations. Baltimore, MD: Johns Hopkins University. Online at https://jhsph.edu/research/centers- and-institutes/johns-hopkins-center-for-a-livable-future/_ pdf/research/clf_reports/CLF-PEW-for%20Web.pdf, accessed July 11, 2017.
Center for Good Food Purchasing (CGFP). 2017a. The good food purchasing values. Online at http://goodfoodpurchasing.org/program-overview/#values, accessed July 10, 2017.
Center for Good Food Purchasing (CGFP). 2017b. The Good Food Purchasing Program in Los Angeles Unified School District (2014-2015). Presented at the LAUSD School Board Meeting, Los Angeles, January 24.
Centers for Disease Control and Prevention (CDC). 2013a. Health disparities and inequalities report–United States, 2013. Morbidity and Mortality Weekly Report 62(3):1–189. Online at https://cdc.gov/ mmwr/pdf/other/su6203.pdf, accessed August 16, 2017.
Centers for Disease Control and Prevention (CDC). 2013b. Antibiotic resistance threats in the United States, 2013. Washington, DC: US Department of Health and Human Services. Online at https://cdc.gov/drugresistance/threat-report-2013/pdf/ar-threats-2013- 508.pdf#page=6, accessed August 20, 2017.
Chanson-Rolle, A., A. Meynier, F. Aubin, J. Lappi, K. Poutanen, S. Vinoy, and V. Braesco. 2015. Systematic review and meta-analysis of human studies to support a quantitative recommendation for whole grain intake in relation to type 2 diabetes. PLoS ONE 10(6):e0131377. Online at https://ncbi.nlm.nih.gov/pmc/articles/PMC4476805, accessed September 19, 2017.
Charles, D. 2015. Subway joins the fast-food, antibiotic-free meat club. National Public Radio, October 20. Online at http://npr.org/sections/thesalt/2015/10/20/450314991/subway-joins-the-fast-food-antibiotic-free-meat-club, accessed August 25, 2017.
Christensen, L.O., B. Jablonski, L. Stephens, and A. Joshi. 2017. Economic impacts of farm to school case studies and assessment tools. Fort Collins, CO, and Chicago, IL: Colorado State University and National Farm to School Network. Online at www.farmtoschool.org/Resources/EconomicImpactReport.pdf, accessed October 17, 2017.
Congressional Budget Office (CBO). 2015. Child nutrition programs: Spending and policy options. Washington, DC: Congress of the United States. Online at https://cbo.gov/sites/default/files/114th- congress-2015-2016/reports/50737-childnutrition.pdf, accessed August 17, 2017.
Department of Health and Human Services and US Department of Agriculture (DHHS/USDA). 2015. 2015-2020 Dietary Guidelines for Americans, 8th edition. Washington, DC. Online at https://health.gov/dietaryguidelines/2015/resources/2015-2020_Dietary_Guidelines.pdf, accessed August 16, 2017.
Economic Research Service (ERS). 2017. Food dollar series. Washington, DC: US Department of Agriculture. Online at https://data.ers.usda.gov/reports.aspx?ID=17885, accessed July 12, 2017.
Economic Research Service (ERS). 2016a. Food expenditures. Washington, DC: US Department of Agriculture. Online at www.ers.usda.gov/dataproducts/food-expenditures.aspx, accessed February 15, 2018.
Economic Research Service (ERS). 2016b. Food security in the US: Key statistics and graphics. Washington, DC: US Department of Agriculture. Online at https://ers.usda.gov/topics/food-nutrition- assistance/food-security-in-the-us/key-statistics-graphics.aspx, accessed August 18, 2017.
Economic Research Service (ERS). 2012. The potential impact of changes in immigration policy on US agriculture and the market for hired farm labor. Washington, DC: US Department of Agriculture. Online at www.ers.usda.gov/webdocs/publications/44981/20514_err135_1_.pdf ?v=41219, accessed October 6, 2017.
Environmental Protection Agency (EPA). 2017. Greenhouse gas equivalencies calculator. Washington, DC. Online at www.epa.gov/ energy/greenhouse-gas-equivalencies-calculator, accessed October 3, 2017.
Equitable Food Initiative (EFI). 2017. Working together to produce food that’s better for everyone. Washington, DC. Online at http://equitablefood.org/about, accessed October 6, 2017.
Fitch, C., and R. Santo. 2016. Instituting change: An overview of institutional food procurement and recommendations for improvement. Baltimore, MD: Johns Hopkins Center for a Livable Future. Online at https://jhsph.edu/research/centers-and-institutes/johns-hopkins-center-for-a-livable-future/_pdf/research/Instituting-change.pdf, accessed August 16, 2017.
Food and Drug Administration (FDA). 2017. FDA’s strategy on anti-microbial resistance—Questions and answers. Online at www.fda.gov/animalveterinary/guidancecomplianceenforcement/ guidanceforindustry/ucm216939.htm, accessed September 8, 2017.
Food and Drug Administration (FDA). 2015. Summary report on antimicrobials sold or distributed for use in food-producing animals. Washington, DC: US Department of Health and Human Services. Online at www.fda.gov/downloads/ForIndustry/UserFees/ AnimalDrugUserFeeActADUFA/UCM534243.pdf, accessed July 11, 2017.
Food Chain Workers Alliance and Solidarity Research Cooperative (FCWA/SRC). 2016. No piece of the pie: US food workers in 2016. Los Angeles, CA: Food Chain Workers Alliance.
Food Marketing Institute (FMI). 2015. U.S. grocery shopper trends 2015 executive summary. Arlington, VA. Online at https://fmi.org/docs/default-source/document-share/fmitrends15-exec-summ-06- 02-15.pdf, accessed August 18, 2017.
Gase, L.N., T. Kuo, D. Dunet, S.M. Schmidt, P.A. Simon, and J.E. Fielding. 2011. Estimating the potential health impact and costs of implementing a local policy for food procurement to reduce the consumption of sodium in the county of Los Angeles. American Journal of Public Health 101(8):1501–1507. Online at https://ncbi.nlm.nih.gov/pmc/articles/PMC3134507/, accessed August 19, 2017.
Gunter, A.L. 2011. Rebuilding local food systems: Marketing and economic implications for communities. Master’s thesis, Colorado State University.
Hardesty, S., L.O. Christensen, E. McGuire, G. Feenstra, C. Ingels, J. Muck, J. Boorinakis-Harper, C. Fake, and S. Oneto. 2016. Economic impact of local food producers in the Sacramento region. Davis, CA: University of California–Davis. Online at http://sfp.ucdavis.edu/files/238053.pdf, accessed October 2, 2017.

18 union of concerned scientists
Haynes-Maslow, L. 2016. The devastating consequences of unequal food access: The role of race and income in diabetes. Cambridge, MA: Union of Concerned Scientists. Online at www.ucsusa.org/sites/ default/files/attach/2016/04/ucs-race-income-diabetes-2016.pdf, accessed October 1, 2017.
He, F.J., and G.A. MacGregor. 2006. Importance of salt in deter-mining blood pressure in children. Hypertension 48:861–869. Online at http://hyper.ahajournals.org/content/48/5/861.long, accessed September 19, 2017.
Herrero, M., S. Wirsenius, B. Henderson, C. Rigolot, P. Thornton, P. Havlik, I. de Boer, and P.J. Gerber. 2015. Livestock and the envi-ronment: What have we learned in the past decade? Annual Review of Environment and Resources 40:177–202. doi:10.1146/annurev-environ-031113-093503.
Jayaraman, S. 2014. Shelved: How wages and working conditions for California's food retail workers have declined as the industry has thrived. Berkeley, CA: University of California Food Labor Research Center. Online at http://laborcenter.berkeley.edu/pdf/ 2014/Food-Retail-Report.pdf, accessed August 21, 2017.
Johnson, R. 2016. The US trade situation for fruit and vegetable prod-ucts. RL34468. Washington, DC: US Congressional Research Service.
Kane, D., S. Kruse, M.M. Ratcliffe, S.A. Sobell, and N. Tessman. 2010. The impact of seven cents. Portland, OR: Ecotrust. Online at https://ecotrust.org/media/7-Cents-Report_FINAL_110630.pdf, accessed October 3, 2017.
Keep Antibiotics Working (KAW). 2017. About: The issues. Online at www.keepantibioticsworking.org/the-issues, accessed October 10, 2017.
Los Angeles County Department of Public Health (LACDPH). 2017. Key indicators of health by service planning area. Los Angeles, CA. Online at http://publichealth.lacounty.gov/ha/docs/2015LACHS/ KeyIndicator/PH-KIH_2017-sec%20UPDATED.pdf, accessed August 19, 2017.
Los Angeles County Department of Public Health (LACDPH). 2014. Los Angeles County uses the power of the purse to get healthy food in county vending machines and cafeterias. Los Angeles, CA. Online at http://publichealth.lacounty.gov/chronic/docs/CTG _Healthy_Food_Procurement.pdf, accessed August 19, 2017.
Los Angeles Food Policy Council (LAFPC). 2013. Los Angeles food system snapshot 2013. Los Angeles, CA. Online at http:// goodfoodla.org/wp-content/uploads/2013/11/LA-Food-System-Snapshot-Oct-2013-small.pdf, accessed August 21, 2017.
Los Angeles Food Policy Council (LAFPC). No date. Los Angeles food system snapshot 2017. Los Angeles, CA.
Los Angeles Unified School District (LAUSD). 2016. Fingertip facts, 2016-2017. Los Angeles, CA: LAUSD Office of Communications. Online at https://achieve.lausd.net/site/handlers/filedownload.ashx? moduleinstanceid=36671&dataid=47885&FileName= Fingertip%20Facts2016-17FINAL.pdf, accessed August 8, 2017.
Los Angeles Unified School District (LAUSD). No date. Food services: About us. Online at https://achieve.lausd.net/Page/11672, accessed August 8, 2017.
Low, S.A., and S. Vogel. 2011. Direct and intermediated marketing of local foods in the United States. Washington, DC: US Department of Agriculture, Economic Research Service. Online at https://ers.usda.gov/webdocs/publications/44924/8276_err128_2_.pdf?v=41056, accessed August 17, 2017.
McKinney, C. 2017. Personal communication with the authors. July. Colleen McKinney is the associate director of the Center for Good Food Purchasing.
Montgomery, D.R. 2007. Soil erosion and agricultural sustainability. Proceedings of the National Academy of Sciences 104(33):13268–13272. Online at http://dx.doi.org/10.1073/pnas.0611508104, accessed October 3, 2017.
Mulik, K. 2016. Growing economies: Connecting local farmers and large-scale food buyers to create local jobs and revitalize America's heartland. Cambridge, MA: Union of Concerned Scientists. Online at www.ucsusa.org/sites/default/files/attach/2016/01/ucs-growing- economies-2016.pdf, accessed August 16, 2017.
Mulik, K., and J. O’Hara. 2013. The healthy farmland diet: How growing less corn would improve our health and help America's heartland. Cambridge, MA: Union of Concerned Scientists. Online at www.ucsusa.org/sites/default/files/legacy/assets/documents/food_and_agriculture/healthy-farmland-diet.pdf, accessed August 8, 2017.
National Agricultural Statistics Service (NASS). 2015. 2012 Census of agriculture highlights: Organic farming. Washington, DC: US Department of Agriculture. Online at https://agcensus.usda.gov/Publications/2012/Online_Resources/Highlights/Organics/2014_Organic_Survey_Highlights.pdf, accessed August 21, 2017.
Office of Health Assessment and Epidemiology (OHAE). 2017. Key indicators of health by service planning area. Los Angeles, CA: Los Angeles County Department of Public Health.
Organic Trade Association (OTA). 2017. Robust organic sector stays on upward climb, posts new records in US sales. Press release, May 4. Washington, DC. Online at https://ota.com/news/press- releases/19681, accessed August 18, 2017.
Pastor, M., and E.A. Marcelli. 2013. What’s at stake for the state: Undocumented Californians, immigration reform, and our future together. Los Angeles, CA: University of Southern California. Online at www.publichealth.lacounty.gov/ha/KeyIndicator/2017/PH-KIH_2017-sec_printing.pdf, accessed August 2, 2017.
Perdue Farms. 2017. Perdue’s journey away from antibiotics. Kings Mountain, NC. Online at https://perduefarms.com/news/press- releases/perdues-journey-away-from-antibiotics, accessed October 9, 2017.
Pesch, R. 2014. Assessing the potential farm-to-institution market in central and northeast Minnesota. St. Paul, MN: University of Minnesota Extension. Online at www.extension.umn.edu/community/ research/reports/docs/2014-Asessing-the-Potential-Farm-to- Institution-Market.pdf, accessed October 2, 2017.
Pilgrim’s Pride. 2016. 2016 Sustainability report. Greeley, CO. Online at http://pilgrims.com/our-company/sustainability-report.aspx, accessed August 25, 2017.
Polansek, T. 2017. Tyson Foods accelerates shift away from antibiotics in chicken. Reuters, February 21. Online at www.reuters.com/article/us-tyson-foods-livestock-antibiotics/tyson-foods-accelerates- shift-away-from-antibiotics-in-chicken-idUSKBN16026O, accessed October 10, 2017.
PolicyLink. 2015. The Los Angeles Good Food Purchasing Program: Changing local food systems, one school, supplier, and farmer at a time. Oakland, CA. Online at http://policylink.org/sites/default/files/LA_GFFP_FINAL_0.pdf, accessed August 16, 2017.
Pulgaron, E.R., and A.M. Delamater. 2014. Obesity and type 2 diabetes in children: Epidemiology and treatment. Current Diabetes Reports 14(8):508. Online at https://ncbi.nlm.nih.gov/pmc/articles/ PMC4099943/, accessed August 18, 2017.
Redwine, K.M., and B. Falkner. 2013. Progression of prehypertension to hypertension in adolescents. Current Hypertension Reports 14(6):619–625. Online at www.ncbi.nlm.nih.gov/pmc/articles/PMC3741046/, accessed September 18, 2017.

printed on recycled paper using vegetable-based inks © NOVEmBER 2017 (UPDATED JUNE 2018) union of concerned scientists
nationaL HEadquartErs Two Brattle SquareCambridge, MA 02138-3780Phone: (617) 547-5552Fax: (617) 864-9405
wasHington, dc, officE1825 K St. NW, Suite 800Washington, DC 20006-1232Phone: (202) 223-6133Fax: (202) 223-6162
wEst coast officE500 12th St., Suite 340Oakland, CA 94607-4087Phone: (510) 843-1872Fax: (510) 451-3785
midwEst officEOne N. LaSalle St., Suite 1904Chicago, IL 60602-4064Phone: (312) 578-1750Fax: (312) 578-1751
The Union of Concerned Scientists puts rigorous, independent science to work to solve our planet’s most pressing problems. Joining with people across the country, we combine technical analysis and effective advocacy to create innovative, practical solutions for a healthy, safe, and sustainable future.
find this document online: www.ucsusa.org/PurchasingPower
Roche, E., F. Becot, J. Kolodinsky, and D. Conner. 2016. Economic contri-bution and potential impact of local food purchases made by Vermont schools. Burlington, VT: University of Vermont Center for Rural Studies. Online at http://agriculture.vermont.gov/sites/ag/files/ CRS_Economic%20Contribution%20of%20Farm%20to%20School_FINAL.pdf, accessed October 2, 2017.
Romero, E.F. 2017. LAUSD pledges to stand with immigrant families, launching new campaign and resource guides. LA School Report, August 8. Online at http://laschoolreport.com/lausd-pledges-to-stand- with-immigrant-families-with-launch-of-new-campaign-and-resource- guides, accessed August 18, 2017.
Smith, D.R., K.W. King, and M.R. Williams. 2015. What is causing the harmful algal blooms in Lake Erie? Journal of Soil and Water Conservation 70(2):27A–29A. Online at http://dx.doi.org/10.2489/jswc. 70.2.27, accessed October 20, 2017.
Steffen, L.M., D.R. Jacobs, M.A. Murtaugh, A. Moran, J. Steinberger, C. Hong, and A.R. Sinaiko. 2003. Whole grain intake is associated with lower body mass and greater insulin sensitivity among adolescents. American Journal of Epidemiology 158(3):243–250. Online at https://academic.oup.com/aje/article-lookup/doi/10.1093/aje/kwg146, accessed August 18, 2017.
Stuckler, D., and M. Nestle. 2012. Big food, food systems, and global health. PLoS Med 9(6):e1001242. Online at https://doi.org/10.1371/journal.pmed.1001242, accessed July 12, 2017.
Szal, A. 2015. Pilgrim’s Pride to cut antibiotics from 25 percent of chickens. Advantage Business Media, April 22. Online at https://mbtmag.com/news/2015/04/pilgrim%E2%80%99s-pride-cut-antibiotics-25-percent-chickens, accessed October 23, 2017.
Tester, J.M., C.W. Leung, T.M. Leak, and B.A. Laraia. 2017. Recent uptrend in whole-grain intake is absent for low-income adolescents, National Health and Nutrition Examination Survey, 2005-2012. Preventing Chronic Disease 14(E55). Online at https://ncbi.nlm.nih.gov/pmc/ articles/PMC5510329, accessed August 18, 2017.
Tuomisto, H.L., D. Hodge, P. Riordan, and D.W. Macdonald. 2012. Does organic farming reduce environmental impacts? A meta-analysis of European research. Journal of Environmental Management 112:309–320. Online at https://doi.org/10.1016/j.jenvman.2012.08.018, accessed September 8, 2017.
Tyson Foods. 2017. Antibiotic use. Springdale, AR. Online at http:// tysonfoods.com/media/position-statements/antibiotic-use, accessed October 9, 2017.
Veenstra, J.J., and C.L. Burras. 2015. Soil profile transformation after 50 years of agricultural land use. Soil Science Society of America Journal 79(4):1154–1162. doi:10.2136/sssaj2015.01.0027.
Wang, X., Y. Ouyang, J. Liu, M. Zhu, G. Zhao, W. Bao, and F.B. Hu. 2014. Fruit and vegetable consumption and mortality from all causes, cardiovascular disease, and cancer: Systemic review and dose-response meta-analysis of prospective cohort studies. British Medical Journal 349:g4490. Online at www.ncbi.nlm.nih.gov/pubmed/25073782, accessed September 20, 2017.
Watanabe, T. 2013. LA Unified’s local food push is healthy for area economy too. Los Angeles Times, November 24. Online at http:// articles.latimes.com/2013/nov/24/local/la-me-lausd-food-20131124/2m, accessed August 22, 2017.
WATT Global Media. 2015. The world’s leading broiler, turkey and egg producers. Rockford, IL. Online at http://wattagnet.com/directories/ 80-the-world-s-leading-broiler-turkery-and-egg-producers, accessed September 20, 2017.
Zuo, X., P. Zhang, and T.J. Hoerger. 2013. Lifetime direct medical costs of treating type 2 diabetes and diabetic complications. American Journal of Preventive Medicine 45(3):253–261. Online at https://ncbi.nlm.nih.gov/pubmed/23953350, accessed August 21, 2017.