purpose of the webinar series - doe.sd.govdoe.sd.gov/sped/documents/sppwebinar.pdf · 12/11/2017 3...
TRANSCRIPT

12/11/2017
1
Technical Assistance for Excellence in Special Education
South Dakota LEA Director Webinar Series
Webinar #4: State Performance
Plan (SPP) and Annual
Performance Report (APR)
• Identify the components of the general supervision system;
• Provide an overview of regulations related to selected general supervision topics to LEA Directors;
• Provide an opportunity for Q&A on the specific topics in general supervision.
Purpose of the Webinar Series
September 25, 2017 Accountability/RDA
October 30, 2017 Child Count
November 14, 2017 Dispute Resolution
December 12, 2017 SPP/APR
January 23, 2018 Budget/Fiscal
Webinar Schedule
12/11/2017
2
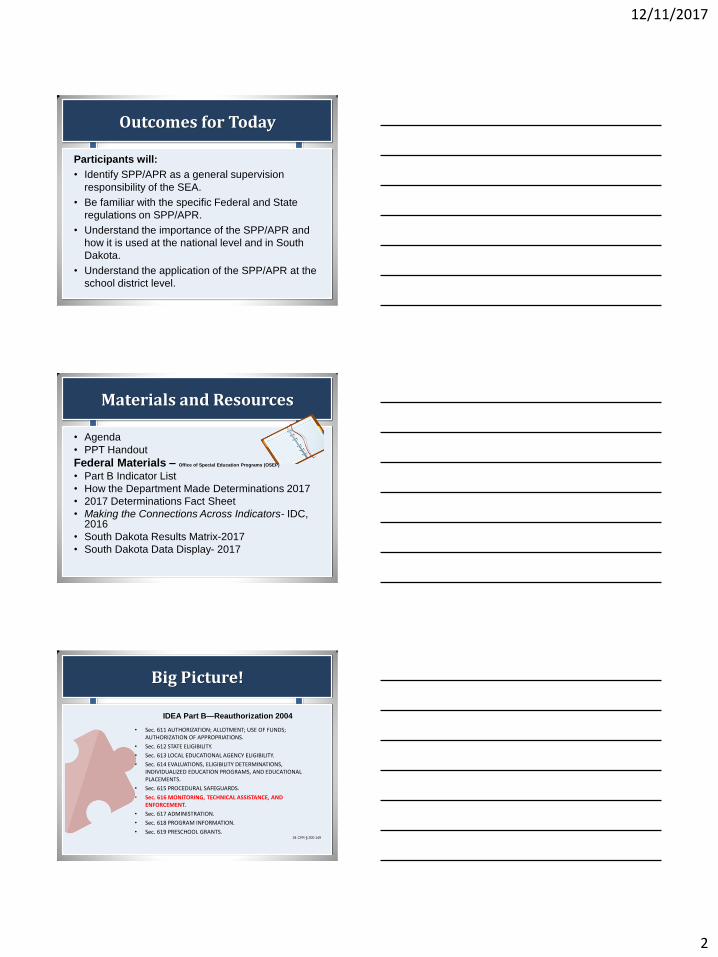
Participants will:
• Identify SPP/APR as a general supervision
responsibility of the SEA.
• Be familiar with the specific Federal and State
regulations on SPP/APR.
• Understand the importance of the SPP/APR and
how it is used at the national level and in South
Dakota.
• Understand the application of the SPP/APR at the
school district level.
Outcomes for Today
• Agenda
• PPT Handout
Federal Materials – Office of Special Education Programs (OSEP)
• Part B Indicator List
• How the Department Made Determinations 2017
• 2017 Determinations Fact Sheet
• Making the Connections Across Indicators- IDC, 2016
• South Dakota Results Matrix-2017
• South Dakota Data Display- 2017
Materials and Resources
Big Picture!
IDEA Part B—Reauthorization 2004
• Sec. 611 AUTHORIZATION; ALLOTMENT; USE OF FUNDS; AUTHORIZATION OF APPROPRIATIONS.
• Sec. 612 STATE ELIGIBILITY.
• Sec. 613 LOCAL EDUCATIONAL AGENCY ELIGIBILITY.
• Sec. 614 EVALUATIONS, ELIGIBILITY DETERMINATIONS, INDIVIDUALIZED EDUCATION PROGRAMS, AND EDUCATIONAL PLACEMENTS.
• Sec. 615 PROCEDURAL SAFEGUARDS.
• Sec. 616 MONITORING, TECHNICAL ASSISTANCE, AND ENFORCEMENT.
• Sec. 617 ADMINISTRATION.
• Sec. 618 PROGRAM INFORMATION.
• Sec. 619 PRESCHOOL GRANTS. 34 CFR § 300.149

12/11/2017
3
SPP & State Goals with
Measurable Targets
Fiscal Management
Integrated Onsite & Offsite
Monitoring Activities
Effective Policies &
Procedures
Data on Processes &
Results
Improvement, Correction,
Incentives & Sanctions
Components of General Supervision
Effective Dispute
Resolution
Targeted Technical
Assistance & Professional
Development
Accountability!!!
Section 616 of the 2004 Amendment says,
“The primary focus of Federal and State
monitoring activities:
A. Improving educational results and functional
outcomes for all children with disabilities; and
B. Ensuring that States meet those requirements…with a
particular emphasis on those requirements that are
most closely related to improving educational
results for children with disabilities.”
What It’s All About!
What is the SPP/APR?
Interactive Poll
In
Interactive Poll

12/11/2017
4
What is the SPP/APR?
Under Section 616 of the IDEA,
States are required to “…have
in place a performance plan
that evaluates [the state’s]
efforts to implement [IDEA]…”
What is the SPP/APR?
Requirements of the SPP/APR:
Six-year plan that includes:
• Indicators and Targets
• Data collection and report to OSEP
• Public reporting
What is the SPP/APR?
Requirements of the SPP/APR:
• SPP/APR must be approved annually
• OSEP’s “Review and Determination”
– Levels of Determination
• State determined by OSEP
• Districts determined by State

12/11/2017
5
What is the SPP/APR?
Requirements of the SPP/APR:
– Levels of Determination
• Meets Requirements
• Needs Assistance
• Needs Intervention
• Needs Substantial Intervention
Indicators
SD State Performance Plan

12/11/2017
6
Indicator 1: Graduation Rate (Results)
Percent of youth with IEP’s graduating from high school with a regular diploma in 4 years.
• Data Source
– SIMS (Infinite Campus)
– Data includes any student who started 9th grade four years earlier and graduated with a regular high school diploma.
• Collection Method: Information is collected through SIMS/Campus utilizing the enrollment tab. It is the ESEA graduation calculation.
• Collection Dates: Student who started 9th grade four years earlier and how many graduated with regular diploma in 4 years
• Data Submission Date: Second Friday in June
THE APPEAL WINDOW is late July, early August (refer to Spring SIMS newsletter)
Graduation Calculation Guide
• A ÷ (B+C-D-E) x 100
A. Students with IEPs (SWD) in grades 9-12 who graduated in 4 years (cohort).
B. 9th grade SWD (cohort)*
C. SWD who transferred into cohort
D. SWD who transferred out of cohort
E. SWD who emigrated or died
• original cohort includes graduates, dropped, and served until age 21
Considerations
• Individual With Disabilities Education Act
ESEA: Graduate
in 4 years
Rights of Students with
Disabilities
12/11/2017
7
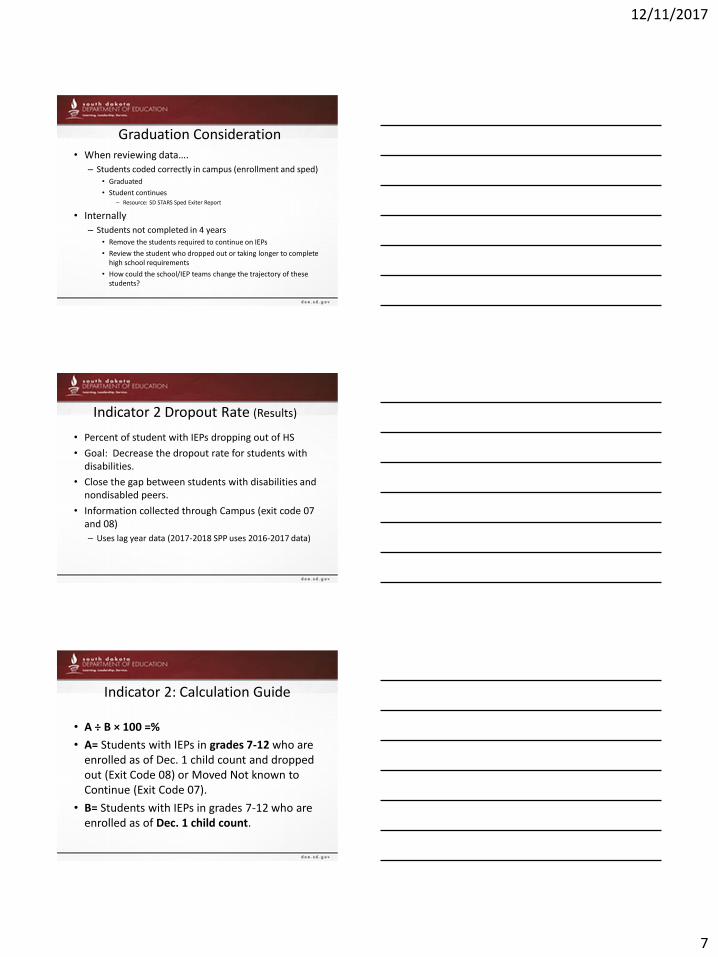
Graduation Consideration • When reviewing data….
– Students coded correctly in campus (enrollment and sped) • Graduated
• Student continues – Resource: SD STARS Sped Exiter Report
• Internally
– Students not completed in 4 years • Remove the students required to continue on IEPs
• Review the student who dropped out or taking longer to complete high school requirements
• How could the school/IEP teams change the trajectory of these students?
Indicator 2 Dropout Rate (Results)
• Percent of student with IEPs dropping out of HS
• Goal: Decrease the dropout rate for students with disabilities.
• Close the gap between students with disabilities and nondisabled peers.
• Information collected through Campus (exit code 07 and 08)
– Uses lag year data (2017-2018 SPP uses 2016-2017 data)
Indicator 2: Calculation Guide
• A ÷ B × 100 =%
• A= Students with IEPs in grades 7-12 who are enrolled as of Dec. 1 child count and dropped out (Exit Code 08) or Moved Not known to Continue (Exit Code 07).
• B= Students with IEPs in grades 7-12 who are enrolled as of Dec. 1 child count.

12/11/2017
8
Indicator 2 Considerations
• Suspension/Expulsion is closely tied to dropout rates
• Strong transition plans for students encourage graduation
Indicator 3: Statewide Assessment 3B: Participation on Statewide Assessment
3C: Proficiency
• Data source: Smarter Balance/MSAA along with SIMS
• Reports: SD STARS and State Report Card
• Collection Dates: Campus student data updated by 2nd Friday in June and assessment window
• Submission Date: Student Data finalized in campus by 2nd Friday in June
Indicator 3: Participation
Calculation Guide
• A ÷ B x 100 = % Participation
A. # of students with IEPs participating in the assessment
B. # of students with IEPs in grades 3-8 & 11 during the testing window (reading & math calculated separately)
• Participation rate is based on all students with IEPs in the district as of May 1 in grade 3-8 & 11.
12/11/2017
9
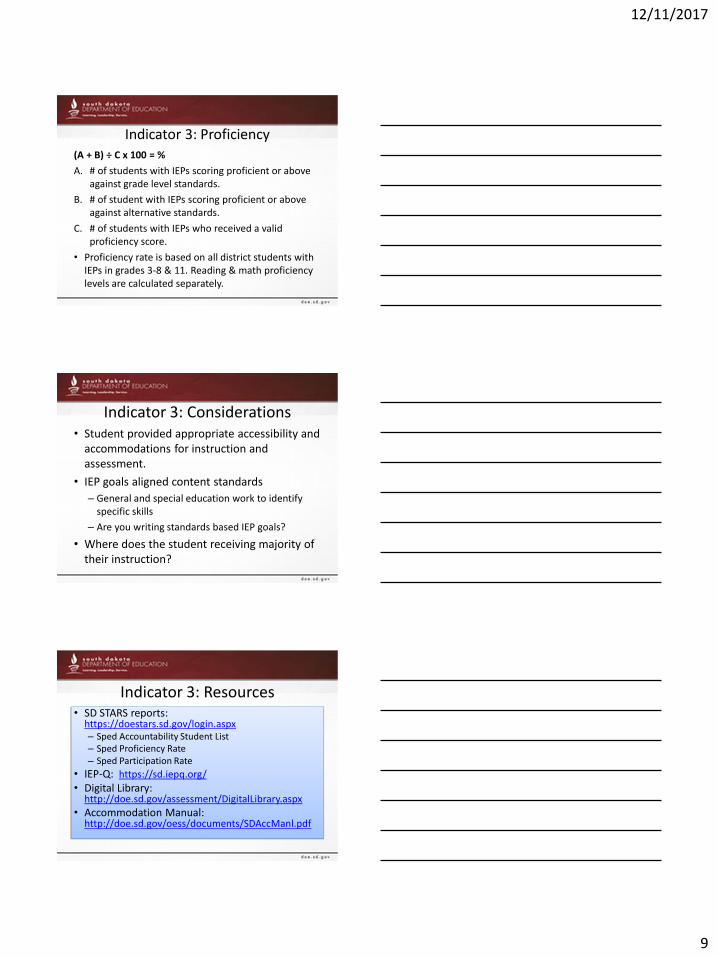
Indicator 3: Proficiency (A + B) ÷ C x 100 = %
A. # of students with IEPs scoring proficient or above against grade level standards.
B. # of student with IEPs scoring proficient or above against alternative standards.
C. # of students with IEPs who received a valid proficiency score.
• Proficiency rate is based on all district students with IEPs in grades 3-8 & 11. Reading & math proficiency levels are calculated separately.
Indicator 3: Considerations • Student provided appropriate accessibility and
accommodations for instruction and assessment.
• IEP goals aligned content standards
– General and special education work to identify specific skills
– Are you writing standards based IEP goals?
• Where does the student receiving majority of their instruction?
Indicator 3: Resources • SD STARS reports:
https://doestars.sd.gov/login.aspx – Sped Accountability Student List – Sped Proficiency Rate – Sped Participation Rate
• IEP-Q: https://sd.iepq.org/
• Digital Library: http://doe.sd.gov/assessment/DigitalLibrary.aspx
• Accommodation Manual: http://doe.sd.gov/oess/documents/SDAccManl.pdf

12/11/2017
10
Indicator 4A Suspension/Expulsion (Results)
• Goal: identify the % of districts with significant discrepancy in rates of suspension and expulsions of students with IEPs for greater than 10 days.
• Data collection
– Secure website
– Passwords sent out in May
– Due date: June 30
– Collection for one school year
– Keep documentation for collection as well as Manifestation Determination tracking
Indicator 4A Suspension/Expulsion
• Calculation Guide
• A= Students with IEPs suspended/expelled in the district > 10 school days in the school year
• C= District Child Count
• 4A: (A ÷ C) x 100 = % discrepancy
• A discrepancy >5% of the district child count
constitutes a significant discrepancy.
Indicator 4B Suspension/Expulsion by
Race/Ethnicity (Compliance)
• B= Students with IEPs per race and ethnic group suspended/ expelled in the district >10 school days during the school year
• C= District Child Count
• 4B: (B ÷ C) x 100 = % discrepancy
* A discrepancy >5% of the district child count
constitutes a significant discrepancy.

12/11/2017
11
Indicator 4A/B: Examples
• Calculation Example 4A
28 students with IEPs suspended or expelled >10 school days during the year.
340 Total SPED Child Count
(28 ÷ 340) x 100 = 8.23% is a significant discrepancy
• Calculation Example 4B
5 Native American Students with IEPs suspended or expelled >10 school days during the year.
340 Total SPED Child Count
(5 ÷ 340) x 100 = 1.47% is not a significant discrepancy
Indicator 4A/B Considerations
• When students miss instruction they fall further behind
• Look for alternatives
Indicator 5 Least-Restrictive Environment Ages 6-21 (Results)
• Regular Classroom with Modifications A/D*100
• Self-Contained Classroom B/D*100
• Out of District C/D*100

12/11/2017
12
Indicator 5 Least-Restrictive Environment Ages 6-21
• A=Students with IEPS served in regular classroom 80% or more of the day
• B=Students with IEPs served regular classroom less than 40% of the day
• C=Students with IEPs served in separate schools, residential facilities, or homebound/hospital placements
• D=Total students ages 6-21 with IEPs
Indicator 5 Least-Restrictive Environment Ages 6-21
• Collection Dates: July 1-June30 when student enters SPED or placement changes
• Deadline: Districts verify and sign off on Dec. 1 Child Count annually
Indicator 5 Least-Restrictive Environment Ages 6-21
• Considerations Consider scheduling, staffing, or other accommodations that could
help a student be successful in the general education classroom
Analyze Child Count data to determine if any specific disability category, grade level, school building, etc. has a higher rate of removal
• Resources
SD DOE State Performance Plan webpage: o http://doe.sd.gov/oess/sped-SPP.aspx
IRIS Center:
o https://iris.peabody.vanderbilt.edu

12/11/2017
13
Indicator 6: LRE 3-5 (Results)
Measurement: Percent of children ages 3 through 5 with IEPs attending:
A. Regular early childhood program, receiving the majority of special education and related services in the regular early childhood program
B. Separate special education class, separate school or residential facility.
6A: (A1 +B1) ÷ F x 100 = % receiving the majority of services in the Reg EC program
6B: [(C1+ C2 + C3 + D1 + D2) ÷ F] x 100 = % receiving majority of services in a separate class,
school, or residential facility
Entering and Accessing Data:
Collection Method: IEP LRE Placement data is entered into SIMS/Infinite Campus throughout the year.
Collection Dates: Dec. 1 Child Count
Submission Date: Dec. 1 Child Count
Resources:
SD DOE State Performance Plan webpage: http://doe.sd.gov/oess/sped-SPP.aspx
Decision Tree for Coding Age 3-5 LRE: http://www.doe.sd.gov/oess/documents/CodingLRE.pdf
Interactive B6 Reporting Tool for determining LRE: https://b6tools.ideadata.org/SD
Indicator 7: Preschool Outcomes (Results)
Measurement: Percent of preschool children aged
3 through 5 with IEPs who demonstrate improved:
A. Positive social-emotional skills (including social relationships);
B. Acquisition and use of knowledge and skills (including early language/communication and early literacy); and
C. Use of appropriate behaviors to meet their needs.
Summary Statement 1: Of those preschool children who entered or exited the program below age expectations, the percent who substantially increased their rate of growth by the time they turned 6 or exited the program.
Summary Statement 2: Percent of children who were functioning within age expectations by the time they turned 6 or exited the program.
Collection Method: Battelle Developmental
Inventory-2:
• The Battelle Developmental Inventory-2 (BDI-2) is given to children when they Enter and Exit the Part B 619 Program (3-5).
• Entry and exit scores are entered into the online Data Manager for comparison.
https://www.bdi2datamanager.com/
Collection Dates: July 1 – June 30
Submission Date: August 1
Resources: SD DOE State Performance Plan webpage: http://doe.sd.gov/oess/sped-SPP.aspx
SD DOE Early Intervention – Preschool Section 619 resource webpage : http://doe.sd.gov/oess/sped-earlyIntervention619.aspx
Indicator 8 Parent Involvement (Results)
• A/B*100= % of parents responded positively – A= # of respondent parents of students with IEPs
reporting that districts facilitated parent involvement as a means of improving services and results for their child with an IEP.
– B=Total number of respondent parents of students with IEPs
• Submission Timeline – Surveys may be distributed throughout the school year prior to April 30. Paper surveys must be postmarked and online surveys submitted by May 31

12/11/2017
14
Indicator 8 Parent Involvement (Results)
• Considerations
Strive to increase response rates
Review the districts method of survey distribution and contemplate other methods
• Resources
SD DOE State Performance Plan webpage o http://doe.sd.gov/oess/sped-SPP.aspx
PACER Center o http://www.pacer.org/
South Dakota Parent Connection o http://www.sdparent.org/web/index.php?siteid=2825
Indicator 9 & 10 (Compliance)
• Indicator 9 Measurement: Percent of districts with disproportionate representation of racial and ethnic groups in special education and related services that is the result of inappropriate identification.
• Indicator 10 Measurement: Percent of districts with disproportionate representation of racial and ethnic groups in specific disability categories that is the result of inappropriate identification.
Indicator 9 & 10 • Step 1: Risk
– Total number of students with IEPs in race/ethnic group divided by total number of enrolled in race/ethnic group
• Step 2: Weighted risk ratio*
– Risk of race/ethnic group divided by risk of Caucasian group
– A Weighted Risk Ratio is determined only if there are 20 or more students in the group of interest (based on child count data) and if there are also 20 or more students in the comparison group.

12/11/2017
15
Indicator 9 and 10 Methodology
If district meets these thresholds for disproportionality,
• Threshold: Weighted Risk Ratio: 3.0
• Minimum N: 20
• Minimum Cell : 20
• Year(s): Annually
Then district will be reviewed to ensure appropriate policy and procedures are being followed.
Ind 9 and 10 Considerations
• Review policy and procedures followed same way for all students.
• Is there a higher percentage identified then others?
• Does staff (classroom and special education staff) have training in correctly identification of the disability category?
Significant Disproportionality
Note:
• If district is over a 3.5 weighted risk ratio or higher, they must use 15% of federal flow through funds toward reducing disproportionality.

12/11/2017
16
Indicator 9 & 10
• Note: The calculation for these Indicators is being updated.
• The state is working with stakeholder groups to update policy and procedures.
• New process and date of implementation will be posted for public hearing before can go into effect.
Indicator 11: Initial Evaluations (Compliance)
Measurement: Percent of children who were evaluated within 25 school days of receiving parental consent to evaluate.
• District evaluation timeline records &/or dates are collected throughout the year. Individual student data collected is entered directly into the Launchpad Secure website http://doe.sd.gov/oess/sped-SPP.aspx
• Collection Method: Launchpad
• Collection Dates: Student data is collected between July 1st - June 30th of each year.
• Submission Date: All individual student data must be entered in Launchpad and signed off by August 1st.
Calculation Guide
A= # of students for whom parental consent to evaluate was received
B= # of students whose evaluations were completed within 25 school days
C= % of initial evaluations completed within 25 school days
(B ÷ A) x 100 = C % of initial evaluations met timeline
Resources:
SD DOE State Performance Plan webpage: http://doe.sd.gov/oess/sped-SPP.aspx
Launchpad Submission Guide: http://doe.sd.gov/oess/documents/Launchpad.pdf
Indicator 12: Transition Part C to B (Compliance)
Measurement: Percent of children referred by Part C prior to age 3, who are found eligible for Part B, and who have an IEP developed and implemented by their third birthday.
• Part B Special Education programs verifies district submission with the Part C exit data report.
• District evaluation timeline records &/or dates is collected throughout the year and individual student data collected is entered into the Launchpad Secure website: https://apps.sd.gov/DP42LaunchPad/Logon.aspx
• Collection Method: Launchpad
• Collection Dates: Student data is collected between July 1st - June 30th of each year.
• Submission Date: All individual student data must be entered into Launchpad and signed off by September 1.
– Launchpad submission and sign off can be completed anytime May 1 through August 31.
– District calendars must be uploaded and include snow days/makeup days, and for PK students, indicate day’s students attend, if different than the district calendar.
Resources:
SD DOE State Performance Plan webpage: http://doe.sd.gov/oess/sped-SPP.aspx
Launchpad Submission Guide: http://doe.sd.gov/oess/documents/Launchpad.pdf
SD DOE Early Intervention Preschool 619 webpage: http://doe.sd.gov/oess/sped-earlyIntervention619.aspx

12/11/2017
17
Indicator 13 – Secondary Transition (Compliance)
• Measurement: Percent of youth with IEPs (aged 16 and above) whose IEP includes: – appropriate measurable postsecondary goals that are annually
updated and based upon an age-appropriate transition assessment; – transition services, including courses of study, that will reasonably
enable the student to meet those postsecondary goals; – and annual IEP goals related to the student's transition needs.
• Districts must document: – evidence that the student was invited to the IEP team meeting where
transition services were discussed – when appropriate, a representative of any participating agency was
invited to the IEP team meeting
Indicator 13 – Secondary Transition Calculation Guide
(A ÷ B) x 100 = % of the IEPs reviewed by the onsite review team met compliance. A= # of students with IEPs age 16 and above whose IEP includes an appropriate transition plan that meets the indicator 13 checklist B= # of students with an IEP age 16 and above
Submission Timeline
• Review Team examines transition IEPs during the SPED on-site accountability review.
• The submission date is the date of the on-site accountability review
• 4-year cycle for district reviews
Indicator 13 – Secondary Transition
Considerations
• Do you work with your regional TSLP prior to the onsite visit? • Have you seen or do you know where to find a copy of the
Ind. 13 checklist? • Are you aware of the TA Guide for Transition in the IEP? • Are you working with outside agencies (when appropriate)?
Resources SD DOE State Performance Plan webpage: http://doe.sd.gov/oess/sped-SPP.aspx Indicator 13 Checklist: http://www.doe.sd.gov/oess/documents/SPP_Indicator13_checklist.pdf Transition Service Liaison Project: http://tslp.org/schools/ National Technical Assistance Center on Transition (NTACT): http://transitionta.org/ Tab at NTACT for additional resources for Indicator 13: http://www.transitionta.org/transitionplanning

12/11/2017
18
Indicator 14 – Post-School Outcomes (Results)
Measurement: Percent of youth who are no longer in high school, had Individualized Education Programs (IEPs) in effect at the time they left school, and were:
A. Enrolled in higher education, or:
B. Enrolled in higher education or competitively employed, or:
C. Enrolled in higher education, other postsecondary education or training program, competitively employed, or in other employment: within one year of leaving high school.
Indicator 14 - Calculation 14A. (A ÷ B) x 100 = % in higher ed. 14B. [(A + C) ÷ B] x 100 = % in higher ed. and competitively employed 14C. [(A + C + D + E) ÷ B] x 100 = % in higher ed., some other post sec. ed. or training program., competitively employed, or other employment A= # of exiter respondents enrolled in higher education B= total # of exiter respondents C= # of exiter respondents competitively employed D= # of exiter respondents enrolled in some other postsecondary education or training program E= # of exiter respondents in some other employment * All respondents are surveyed one year after exiting high school.
Indicator 14 – Submission Timeline
Part 1: After students exit high school - Appendix A (District responsibility)
– April-June - Districts may enter demographic data and exiter information of any exiters from Campus in Appendix A.
OR August-September - DOE will upload demographic data of all exiters from Campus, then districts will enter the IEP information in Launchpad.
– Deadline: Oct. 1
Part 2: One year after students exit high school – Appendix B – Black Hills State University will collect post-school outcomes data
in April-September

12/11/2017
19
Indicator 14 Considerations • Does the transition plan meet the needs and interests of the
student? • Programs provided as part of the transition plan (i.e. VR, Project
Skills, Self-Advocacy) • Coding exiter information after leaving HS • Prepare students for the survey call • Volunteer to collect the Indicator 14 Survey data (Appendix B) • Check data on PSO website
Resources 1. SD STARS Special Ed Exiter Report: http://doe.sd.gov/SDSTARS/ 2. SD DOE State Performance Plan webpage: http://doe.sd.gov/oess/sped-SPP.aspx 3. Indicator 14 Data Analysis Site: www.sdposthighsurvey.org 4. Indicator 14 Data Analysis Site Training: http://doe.sd.gov/oess/sped-SPP.aspx 5. Transition Liaison: www.tslp.org
Indicator 15 & 16: Dispute Resolution (Compliance)
• Indicator 15: Hearings
• Indicator 16: Mediations
• Information is collected and reported by state
• State complaint & Hearing logs can be found at
http://www.doe.sd.gov/oess/sped-complaints.aspx
Indicator 17: State Systemic Improvement Plan (Results)
The State’s SPP/APR includes an SSIP that is a comprehensive, ambitious, yet achievable multi-year plan for improving results for children with disabilities.

12/11/2017
20
Indicator 17: State Systemic Improvement Plan
• Based on stakeholder input and feedback, South Dakota identified reading proficiency among students with learning disabilities entering grade four as the main focus for the SSIP.
• General Education and Special Education Initiative
• Pilot Program until 2020, possibility of branching out statewide.
Our SiMR (state) State-identified Measureable Result
Students with specific learning disabilities will increase reading proficiency by fourth grade
from 4.84% in spring 2015 to 36.56% by spring of 2019 as measured by statewide assessments.
Pilot Districts
Andes Central, Kadoka,
Rapid City, Sioux Falls, Vermillion

12/11/2017
21
Resources
• DOE Special Programs SPP-APR website – http://www.doe.sd.gov/oess/sped-SPP.aspx
– Reports
– TA Guides
– Collection Calendar
– Indicator webinars
– Sped Contact Card for each indicator
• Sped Director Calls – http://www.doe.sd.gov/oess/speddirectors.aspx
– February call we will go over FFY16 SPP reported to OSEP
South Dakota and the SPP/APR
Making The Connection
• SPP as a guide and a resource.
• How does the SPP impact the focus of the district throughout the year?
12/11/2017
22
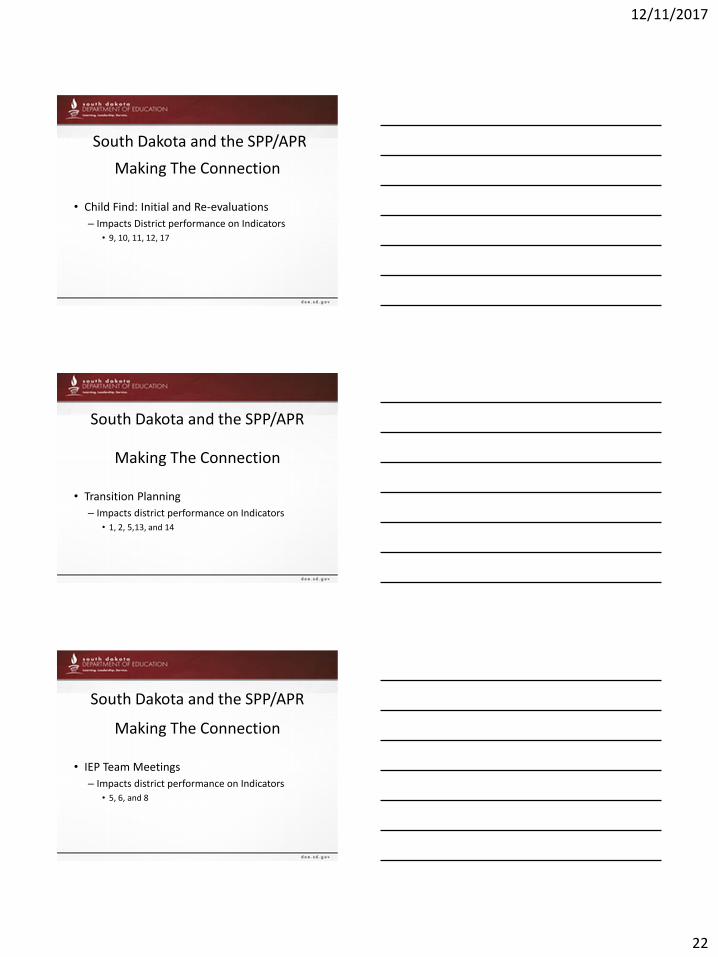
South Dakota and the SPP/APR
Making The Connection
• Child Find: Initial and Re-evaluations
– Impacts District performance on Indicators
• 9, 10, 11, 12, 17
South Dakota and the SPP/APR
Making The Connection
• Transition Planning
– Impacts district performance on Indicators
• 1, 2, 5,13, and 14
South Dakota and the SPP/APR
Making The Connection
• IEP Team Meetings
– Impacts district performance on Indicators
• 5, 6, and 8

12/11/2017
23
South Dakota and the SPP/APR
Making The Connection
• Parent Involvement
– Impacts district performance on Indicators
• 8, 15, 16, and 17
South Dakota and the SPP/APR
Making The Connection
• Early Intervening Services
– Impacts district performance on Indicators
• 3, 4, 10, and 11
South Dakota and the SPP/APR
South Dakota’s Determination: • Based on the APR submitted in February 2017
• Data set is from FFY 15 (15-16 school year) except lag indicators which are FFY 14 (14-15 school year)
– South Dakota received : • 17 out of 18 points for Compliance for a score of 94%
• 18 out of 24 points for Results for a score of 75%
– The scores are averaged to yield the final percent and determination of
• 84.72% - Meets Requirements
(Last year – 85%- Meets Requirements)

12/11/2017
24
Areas to Improve
• Graduation (decreased) and dropout (increased), SD ranks in the middle third in comparison to all states.
• Appropriate measurable postsecondary goals on IEPs for youth 16 and older has continued to decline. This is reviewed during on-site reviews. Districts should work with their TSLP liaison prior to on-site reviews to ensure compliance.
Areas to Improve
• Participation rate in the SBAC assessment by students with disabilities in 4th grade decreased. Participation on SBAC should increase in all grades by reducing the number of students being tested on the MSAA. Under ESSA, states are capped at 1% participation in the alternate assessment.
District Determinations • South Dakota Determination Criteria
– Determination is based on the required components by the United States Office of Special Education Programs (OSEP) which includes:
– Compliance Indicators 9, 10, 11, 12, 13, and 15
– Valid, Reliable, and Timely Data
– Uncorrected Non-Compliance
– Any Audit Findings
• OSEP has allowed State Education Agencies to have a performance of 95% to 100% to meet the Compliance Indicator criteria for Levels of Determination
• Districts are still required to meet the annual compliance targets of 100% for indicators 11, 12, 13 and 15 and 0% for indicators 9 and 10. Any local program within the range of 95-99.9% still needs to correct those few issues and work to 100%.

12/11/2017
25
District Determinations Levels of Determination
• State Education Agencies must place local education agencies (LEA) in a Determination level based on their performance on the State Performance Plan according to Section 616(d) of the IDEA and ARSD:
• 24:05:20:23.04. State enforcement -- Determinations. On an annual basis, based on local district performance data, information obtained through monitoring visits, and other information available, the department shall determine whether each school district meets the requirements and purposes of Part B of the IDEA.
District Determinations
Area Definition/ Criteria Points Earned
Compliance Indicators Meet 95% to 100% 3
Correction of Non-Compliance
Completing Corrective Action Plans within 12 months.
2
Meeting Timeline Valid, Reliable, and Timely Data 1
Total Points a District can earn
42 points
Table 1-1
District Determinations Levels of Determination
Determination Level Maximum Points Earned Minimum Points Earned
Meets Requirements 42 36
Needs Assistance 35 30
Needs Intervention 29 22
Needs Substantial Intervention
21 0
12/11/2017
26
District Determinations
• District determination reports are sent to each individual LEA
• District SPP data is publicly reported
• District reports show whether they met targets and how they are performing compared to state targets
• http://www.doe.sd.gov/oess/sped-SPP.aspx
District Determinations
• Based on whether a district met targets or not they may be placed on a corrective action plan or require follow up information
• Elements of corrections for each indicator
Making The Connection
• SPP as a guide and a resource.
• How does the SPP impact the focus of the
district throughout the year?
South Dakota and the SPP/APR

12/11/2017
27
Making The Connection
• Child Find: Initial and Re-evaluations
– Impacts District performance on Indicators
• 9, 10, 11, 12, 17
South Dakota and the SPP/APR
Making The Connection
• Transition Planning
– Impacts district performance on Indicators
• 1, 2, 5,13, and 14
South Dakota and the SPP/APR
Making The Connection
• IEP Team Meetings
– Impacts district performance on Indicators
• 5, 6, and 8
South Dakota and the SPP/APR

12/11/2017
28
Making The Connection
• Parent Involvement
– Impacts district performance on Indicators
• 8, 15, 16, and 17
South Dakota and the SPP/APR
Making The Connection
• Early Intervening Services
– Impacts district performance on Indicators
• 3, 4, 10, and 11
South Dakota and the SPP/APR
South Dakota and the SPP/APR
South Dakota’s Determination: • Based on the APR submitted in February 2017
• Data set is from FFY 15 (15-16 school year) except lag indicators which are FFY 14 (14-15 school year)
– South Dakota received : • 17 out of 18 points for Compliance for a score of 94%
• 18 out of 24 points for Results for a score of 75%
– The scores are averaged to yield the final percent and determination of
• 84.72% - Meets Requirements
(Last year – 85%- Meets Requirements)

12/11/2017
29
South Dakota and the SPP/APR
Areas To Improve: • Although graduation rate and drop out rate
improved, SD ranks in the middle third compared to
all states. We want to be ranked in the top third.
• Participation rate in the Smarter Balanced
assessment by students with disabilities needs to
increase lowering students being tested on the
MSAA. Under ESSA, states are capped at 1%
participation in the alternate assessment.
South Dakota and the SPP/APR
District Determinations
• District determination reports are sent to each individual LEA
• District SPP data is publicly reported
• District reports show whether they met targets and how they are performing compared to state targets
• http://www.doe.sd.gov/oess/sped-SPP.aspx
South Dakota and the SPP/APR
District Determinations
• Based on whether a district met targets or
not they may be placed on a corrective
action plan or require follow up information
• Elements of corrections for each indicator

12/11/2017
30
• What questions do you have for the South
Dakota Department of Education on the
topic of SPP/APR?
Post Poll
Q&A on South Dakota’s SPP/APR
• Familiarize yourself with the appropriate
regulations.
• Be aware of what the state SPP/APR
looks like and how your district contributes
to it.
• Be familiar with resources available.
• Be proactive!
Summary and Next Steps
• Survey Monkey Link:
https://www.surveymonkey.com/r/GS2B5YV
Thanks in advance for taking a few
moments to complete!
Webinar Evaluation

12/11/2017
31
Keep the main thing
the main thing!