pyramid servings data - ars home : usda ars servings data results from usda’s 1995 and 1996...
TRANSCRIPT

PYRAMID SERVINGS DATAResults from USDA’s 1995 and 1996 Continuing Survey of Food Intakes by Individuals
Table Set 7
Food Surveys Research Group Beltsville Human Nutrition Research Center
Agricultural Research Service U.S. Department of Agriculture
10300 Baltimore Ave., Bldg. 005, Rm 102, BARC-West Beltsville, Maryland 20705-2350
http://www.barc.usda.gov/bhnrc/foodsurvey/home.htmFebruary 1999

1
The Pyramid provides guidance for individuals 2 years of age and over(USDA 1992). According to the Pyramid, everyone should eat at least thelowest number of servings within recommended ranges. Except for thedairy group, the number of servings that is right for a person depends onhis or her calorie needs; people who need more calories should eat moreservings. For the dairy group, the recommended number of servingsdepends on age and for women, on whether or not they are pregnant orlactating.
Generally speaking, the bottom of the recommended range of servings isabout right for many sedentary women and older adults, the middle isabout right for most children, teenage girls, active women, and manysedentary men, and the top of the range is about right for teenage boys,many active men, and some very active women. Preschool children withlow calorie needs (less than 1,600 calories) should eat at least the lowestnumber of servings in the ranges, but they can eat smaller servings fromall except the dairy group
How Do American Diets Stack Up Compared to Food Guide Pyramid Recommendations?
This table set presents data comparing food intakes of Americans to recommendations in the U.S. Department of Agriculture's Food Guide Pyramid -- ageneral guide designed to help Americans choose what and how much to eat to get the nutrients they need without excess calories or fat (see box). ThePyramid specifies numbers of servings to eat from five major food groups (grain, vegetable, fruit, dairy, and meat) and gives advice about intakes offats and added sugars as well.
The data are derived from the 1995 and the 1996 Continuing Surveyof Food Intakes by Individuals (CSFII) conducted by the AgriculturalResearch Service of the U.S. Department of Agriculture. The tableset includes data presented separately for each survey year. The datain these tables provide national probability estimates for the U.S.population based on food intakes reported by individuals 2 years ofage and older on 2 nonconsecutive days (4,699 individuals in 1995and 4,605 individuals in 1996--breast-fed children are excluded). Sample sizes on which the estimates are based are provided inappendix A. Daggers are used in the tables to flag estimates that maytend to be less statistically reliable than those that are not flagged. Statistical guidelines are provided in appendix B. References areprovided in appendix C.
USDA has developed a method for converting data from the CSFIIinto Pyramid servings. The method adheres to Pyramid principles,uses the serving sizes specified by the Pyramid, and strictlycategorizes foods according to Pyramid criteria. Since many peopleeat foods that count toward more than one food group--like pizza,soups, and pies--the method separates foods into their ingredientsbefore servings are counted.
2
List of Tables
1995 Pyramid servings PageAverage daily servings from Pyramid food groups Table 1A. Grain group- - - - - - - - - - - - - - - - - 4 Table 2A. Vegetable group - - - - - - - - - - - - 6 Table 3A. Fruit group - - - - - - - - - - - - - - - - - 8 Table 4A. Dairy group - - - - - - - - - - - - - - - - 10 Table 5A. Meat and meat alternates group - - - - 12 Percentages of individuals consuming various numbers of servings from Pyramid food groups Table 1B. Grain group - - - - - - - - - - - - - - - - - 5 Table 2B. Vegetable group - - - - - - - - - - - - - - 7 Table 3B. Fruit group - - - - - - - - - - - - - - - - - 9 Table 4B. Dairy group - - - - - - - - - - - - - - - - - 11 Table 5B. Meat and meat alternates group - - - - 13 The Pyramid tip Table 6. Calories, total fat, discretionary fat, and added sugars - - - - - - - - - - - - - - 14
1996 Pyramid servings Average daily servings from Pyramid food groups Table 1A. Grain group - - - - - - - - - - - - - - 16 Table 2A. Vegetable group - - - - - - - - - - - - - 18 Table 3A. Fruit group - - - - - - - - - - - - - - - - 20 Table 4A. Dairy group - - - - - - - - - - - - - - - - 22 Table 5A. Meat and meat alternates group - - - 24
PagePercentages of individuals consuming various numbers of servings from Pyramid food groups Table 1B. Grain group - - - - - - - - - - - - - - - 17 Table 2B. Vegetable group - - - - - - - - - - - - 19 Table 3B. Fruit group - - - - - - - - - - - - - - - 21 Table 4B. Dairy group - - - - - - - - - - - - - - - 23 Table 5B. Meat and meat alternates group - - 25 The Pyramid tip Table 6. Calories, total fat, discretionary fat, and added sugars - - - - - - - - - - - 26
Appendixes A. Counts of individuals - - - - - - - - - - - - - - 27 B. Statistical notes - - - - - - - - - - - - - - - - 29 C. References - - - - - - - - - - - - - - - - - - - 30
Suggested citation. U.S. Department of Agriculture, AgriculturalResearch Service. 1997. Pyramid Servings Data: Results from USDA’s1995 and 1996 Continuing Survey of Food Intakes by Individuals. On1994-96 Continuing Survey of Food Intakes by Individuals and 1994-96Diet and Health Knowledge Survey. CD-ROM.

3
1995 PYRAMID SERVINGS DATA TABLES

Table 1A.--Grain Group: How many servings a day did Americans eat, on average, in 1995? USDA's Food Guide Pyramid recommends eating between 6 and 11 servings of grain products each day, depending on calorie needs.
PercentageSex and age Nonwhole-grain Whole-grain Total of(years) products products grain products population
------------------------------------------- Servings ‡ --------------------------------------------Percent
Males:5.21.16.33.4x 2-5...........................................5.91.27.24.7x 6-11.........................................7.61.18.75.9x 12-19.......................................7.81.39.08.2x 20-29.......................................8.61.09.57.8x 30-39.......................................6.41.07.47.1x 40-49.......................................6.21.17.34.7x 50-59.......................................6.01.17.13.5x 60-69.......................................4.81.26.03.5x 70 and over.............................7.01.18.134.8x 20 and over..........................
Females:5.01.06.03.1x 2-5...........................................5.2.96.04.5x 6-11.........................................5.3.96.25.8x 12-19.......................................5.4.96.27.2x 20-29.......................................4.9.85.79.0x 30-39.......................................4.7.85.56.8x 40-49.......................................4.7.95.65.7x 50-59.......................................3.9.94.84.2x 60-69.......................................3.81.04.95.1x 70 and over.............................4.7.95.537.8x 20 and over..........................
5.81.06.8100.0xAll Individuals 2 and over............
‡ One serving is 1 slice of bread; 1 small roll; 1/2 bagel, English muffin, or croissant; 1 ounce of ready-to-eat cereal; 1/2 cup cooked cereal, rice, or pasta; 1 small muffin; or amounts of other grain products such as pretzels and cakes that contain an amount of grain equivalent to that in a standard slice of bread. For children 2 to 5 years old who consume less than 1,600 calories per day, 1 serving is two-thirds of the standard serving size to allow for their lower energy needs. Whole- and nonwhole-grain servings were calculated based on the proportionof whole- and nonwhole-grain ingredients in foods as consumed.
SOURCE: 1995 Continuing Survey of Food Intakes by Individuals, 2-day average, excluding breast-fed children USDA, ARS, Beltsville Human Nutrition Research Center, Food Surveys Research Group
4

Table 1B.--Grain Group: In 1995, what percentage of Americans consumed less than 1 serving of grain products a day? What percentage consumed the number of servings recommended by USDA's Food Guide Pyramid?
Percentage of individuals...... PercentageSex and age of(years)
Consuming number of Consuming at least Consuming less than population servings recommended minimum number of 1 serving a day based on caloric intake ‡ servings recommended
(6 a day)
------------------------------------------------------- Percent ----------------------------------------------------Percent
Males:4852† 03.4x 2-5...........................................4968† 04.7x 6-11.........................................4375† 15.9x 12-19.......................................5377† 18.2x 20-29.......................................4274† 07.8x 30-39.......................................3662† 17.1x 40-49.......................................4167† 14.7x 50-59.......................................4160† 03.5x 60-69.......................................3748† 03.5x 70 and over.............................4367† 134.8x 20 and over..........................
Females:4549† 03.1x 2-5...........................................4149† 04.5x 6-11.........................................3048† 05.8x 12-19.......................................3946† 07.2x 20-29.......................................3139† 19.0x 30-39.......................................2734† 16.8x 40-49.......................................3339† 05.7x 50-59.......................................2225† 14.2x 60-69.......................................2427† 25.1x 70 and over.............................3036† 137.8x 20 and over..........................
38531100.0xAll Individuals 2 and over............
‡ Recommended servings were derived from sample patterns in "The Food Guide Pyramid" (USDA 1992). Individuals consuming less than 2,200 caloriesmet the recommendation if they ate at least 6 grain servings a day; individuals consuming 2,200 up to 2,800 calories met the recommendation if they ateat least 9 grain servings a day; and individuals consuming 2,800 calories or more met the recommendation if they ate at least 11 grain servings a day.
† See "Statistical notes," appendix B.
SOURCE: 1995 Continuing Survey of Food Intakes by Individuals, 2-day average, excluding breast-fed children USDA, ARS, Beltsville Human Nutrition Research Center, Food Surveys Research Group
5

Table 2A.--Vegetable Group: How many servings a day did Americans eat, on average, in 1995? USDA's Food Guide Pyramid recommends eating between 3 and 5 servings of vegetables each day, depending on cal orie needs.
Starchy vegetables Other Cooked Deep Dark Total PercentageSex and age vegetables Tomatoes dry beans yellow green leafy vegetables of(years)
Other White and peas vegetables vegetables population starchy ‡ potatoes
------------------------------------------------------------------------------------- Servings § -----------------------------------------------------------------------------------Percent
Males:.4.3.21.0.1.1.12.23.4x 2-5............................................5.4.2.9.1.1.12.24.7x 6-11..........................................8.5.21.8.2.1† .13.95.9x 12-19.......................................
1.2.6.21.7.2.1.14.18.2x 20-29.......................................1.5.6.21.8.3.2.34.97.8x 30-39.......................................1.3.7.31.0.3.2.23.97.1x 40-49.......................................1.5.5.31.2.3.2.24.24.7x 50-59.......................................1.4.6.21.1.2.2.23.93.5x 60-69.......................................1.2.4.3.9.2.3.23.43.5x 70 and over.............................1.3.6.21.4.2.2.24.234.8x 20 and over..........................
Females:.4.3.2.9.1.1.12.13.1x 2-5............................................4.3.21.0.1.1.12.24.5x 6-11..........................................7.4.21.1.1.1.12.65.8x 12-19.......................................
1.0.4.21.0.1.2.23.07.2x 20-29.......................................1.0.4.2.9.2.2.23.09.0x 30-39.......................................1.1.4.2.9.2.2.23.16.8x 40-49.......................................1.2.5.2.7.2.2.23.35.7x 50-59.......................................1.2.4.2.7.2.2.23.14.2x 60-69.......................................1.0.4.3.7.1.2.33.05.1x 70 and over.............................1.1.4.2.8.2.2.23.137.8x 20 and over..........................
1.0.5.21.1.2.2.23.3100.0xAll Individuals 2 and over............
‡ Examples are corn, green peas, and lima beans (immature).
§ One serving is 1 cup of raw leafy vegetables; 1/2 cup of cooked or chopped raw vegetables; 1 ounce of vegetable chips; or 3/4 cup of vegetable juice. For children 2 to 5 years old who consume less than 1,600 calories per day, 1 serving is two-thirds of the standard serving size to allow for their lower energy needs.
† See "Statistical notes," appendix B.
SOURCE: 1995 Continuing Survey of Food Intakes by Individuals, 2-day average, excluding breast-fed children USDA, ARS, Beltsville Human Nutrition Research Center, Food Surveys Research Group
6
Table 2B.--Vegetable Group: In 1995, what percentage of Americans consumed less than 1 serving of vegetables a day? What percentage consumed the number of servings recommended by USDA's Food Guide Pyramid?
Percentage of individuals...... PercentageSex and age of(years)
Consuming number of Consuming at least Consuming less than population servings recommended minimum number of 1 serving a day based on caloric intake ‡ servings recommended
(3 a day)
------------------------------------------------------- Percent ----------------------------------------------------Percent
Males:2324193.4x 2-5...........................................1625254.7x 6-11.........................................3856105.9x 12-19.......................................507188.2x 20-29.......................................6574† 47.8x 30-39.......................................456197.1x 40-49.......................................566664.7x 50-59.......................................526093.5x 60-69.......................................485293.5x 70 and over.............................5366734.8x 20 and over..........................
Females:2021183.1x 2-5...........................................1721184.5x 6-11.........................................2739145.8x 12-19.......................................3945† 77.2x 20-29.......................................3240109.0x 30-39.......................................464876.8x 40-49.......................................484995.7x 50-59.......................................4546114.2x 60-69.......................................414285.1x 70 and over.............................4145937.8x 20 and over..........................
414910100.0xAll Individuals 2 and over............
‡ Recommended servings were derived from sample patterns in "The Food Guide Pyramid" (USDA 1992). Individuals consuming less than 2,200 caloriesmet the recommendation if they ate at least 3 vegetable servings a day; individuals consuming 2,200 up to 2,800 calories met the recommendation if they ate at least 4 vegetable servings a day; and individuals consuming 2,800 calories or more met the recommendation if they ate at least 5 vegetable servingsa day.
† See "Statistical notes," appendix B.
SOURCE: 1995 Continuing Survey of Food Intakes by Individuals, 2-day average, excluding breast-fed children USDA, ARS, Beltsville Human Nutrition Research Center, Food Surveys Research Group
7

Table 3A.--Fruit Group: How many servings a day did Americans eat, on average, in 1995? USDA's Food Guide Pyramid recommends eating between 2 and 4 servings of fruits each day, depending on calorie needs.
PercentageSex and age Other Citrus fruits, Total of(years) fruits melons, berries fruits population
------------------------------------ Servings ‡ ------------------------------------Percent
Males:1.5.82.23.4 2-5..............................................................9.91.84.7 6-11.................................................................61.01.65.9 12-19..............................................................5.81.38.2 20-29..............................................................6.71.37.8 30-39............................................................7.71.47.1 40-49.............................................................9.91.84.7 50-59.............................................................
1.0.91.83.5 60-69.............................................................1.1.92.03.5 70 and over..................................................7.81.534.8 20 and over.............................................
Females:1.4.92.33.1 2-5..............................................................8.71.64.5 6-11.................................................................6.91.55.8 12-19..............................................................5.61.17.2 20-29..............................................................5.71.29.0 30-39............................................................6.91.56.8 40-49.............................................................7.81.65.7 50-59..............................................................9.91.74.2 60-69.............................................................
1.1.92.05.1 70 and over..................................................7.81.537.8 20 and over.............................................
.8.81.6100.0All Individuals 2 and over..............................
‡ One serving is a whole fruit such as a medium apple, banana, or orange; a grapefruit half; 1/2 cup of berries, melon, or chopped raw fruit; 1/2 cup of cooked or canned fruit; 1/4 cup of dried fruit; or 3/4 cup of fruit juice. For children 2 to 5 years old who consume less than 1,600 calories, 1 serving is two-thirds of the standard serving size to allow for their lower energy needs.
SOURCE: 1995 Continuing Survey of Food Intakes by Individuals, 2-day average, excluding breast-fed children USDA, ARS, Beltsville Human Nutrition Research Center, Food Surveys Research Group
8

Table 3B.--Fruit Group: In 1995, What percentage of Americans consumed less than 1 serving of fruit a day? What percentage consumed the number of servings recommended by USDA's Food Guide Pyramid?
Percentage of individuals...... PercentageSex and age of(years)
Consuming number of Consuming at least Consuming less than population servings recommended minimum number of 1 serving a day based on caloric intake ‡ servings recommended
(2 a day)
-------------------------------------------------------- Percent -----------------------------------------------------Percent
Males:4546293.4 2-5.............................................................2535394.7 6-11................................................................1826515.9 12-19.............................................................1827578.2 20-29.............................................................1522557.8 30-39...........................................................1826547.1 40-49............................................................2330494.7 50-59.............................................................2936423.5 60-69.............................................................3640363.5 70 and over.................................................21285134.8 20 and over.............................................
Females:4950243.1 2-5.............................................................2328454.5 6-11................................................................2326505.8 12-19.............................................................1618607.2 20-29.............................................................1820569.0 30-39...........................................................2021556.8 40-49............................................................2728475.7 50-59.............................................................3335384.2 60-69.............................................................4243265.1 70 and over.................................................24264937.8 20 and over.............................................
242948100.0All Individuals 2 and over..............................
‡ Recommended servings were derived from sample patterns in "The Food Guide Pyramid" (USDA 1992). Individuals consuming less than 2,200 calories met the recommendation if they ate at least 2 fruit servings a day; individuals consuming 2,200 up to 2,800 calories met the recommendation if they ate atleast 3 fruit servings a day; and individuals consuming 2,800 calories or more met the recommendation if they ate at least 4 fruit servings a day.
SOURCE: 1995 Continuing Survey of Food Intakes by Individuals, 2-day average, excluding breast-fed children USDA, ARS, Beltsville Human Nutrition Research Center, Food Surveys Research Group
9

Table 4A.--Dairy Group: How many servings a day did Americans eat, on average, in 1995? USDA's Food Guide Pyramid recommends eating 2 or 3 servings of dairy products each day, depending on age and physiological status.
PercentageSex and age Cheese Yogurt Milk Total of(years)
dairy ‡ population
-------------------------------------------- Servings § ---------------------------------------------Percent
Males:.3*1.51.93.4x 2-5............................................5† *1.62.14.7x 6-11..........................................8† *1.72.55.9x 12-19........................................8† *.81.78.2x 20-29........................................8† *1.11.87.8x 30-39........................................5† *1.01.67.1x 40-49........................................4† *.81.34.7x 50-59........................................4† *.91.33.5x 60-69........................................2† *1.11.43.5x 70 and over..............................6*1.01.634.8x 20 and over..........................
Females:.3*1.51.83.1x 2-5............................................4† *1.41.84.5x 6-11..........................................5† *1.01.55.8x 12-19........................................4† *.81.27.2x 20-29........................................4.1.71.29.0x 30-39........................................4*.61.06.8x 40-49........................................4.1.71.15.7x 50-59........................................2*.71.04.2x 60-69........................................2*.91.25.1x 70 and over..............................4*.71.137.8x 20 and over..........................
.5*1.01.5100.0xAll Individuals 2 and over............
‡ Includes small amounts of miscellaneous dairy products, such as whey and nonfat sour cream, that are not included in the subgroups(milk, yogurt, cheese).
§ One serving is 1 cup of milk; 1 cup of yogurt; 1-1/2 ounces of natural cheese; 2 ounces of processed cheese; 1/2 cup of ricotta cheese; or 2 cups of cottage cheese. Dairy desserts, such as ice cream, ice milk, frozen yogurt, custard, and pudding, were separated into ingredients,and servings from dairy ingredients (usually milk) are tabulated. Serving sizes are the same for all individuals regardless of age.
† See "Statistical notes," appendix B.
* Value less than 0.05 but greater than 0.
SOURCE: 1995 Continuing Survey of Food Intakes by Individuals, 2-day average, excluding breast-fed children USDA, ARS, Beltsville Human Nutrition Research Center, Food Surveys Research Group
10

Table 4B.--Dairy Group: In 1995, what percentage of Americans consumed less than 1 serving of dairy products a day? What percentage consumed at least 2 servings a day? What percentage consumed the number of servings recommended by USDA's Food Guide Pyramid?
Percentage of individuals...... PercentageSex and age of(years)
Consuming number of Consuming at least Consuming less than population servings recommended the minimum number 1 serving a day based on age and of servings recommended physiological status ‡ (2 a day)
------------------------------------------------------- Percent -----------------------------------------------------Percent
Males:4040193.4x 2-5...........................................4549124.7x 6-11.........................................2853215.9x 12-19.......................................2128358.2x 20-29.......................................2828427.8x 30-39.......................................2727477.1x 40-49.......................................1717494.7x 50-59.......................................2424463.5x 60-69.......................................2626433.5x 70 and over.............................24264334.8x 20 and over..........................
Females:3838253.1x 2-5...........................................3235224.5x 6-11.........................................1127405.8x 12-19.......................................† 814467.2x 20-29.......................................1920519.0x 30-39.......................................1515586.8x 40-49.......................................1515535.7x 50-59.......................................1111584.2x 60-69.......................................1717545.1x 70 and over.............................14165337.8x 20 and over..........................
222641100.0xAll Individuals 2 and over............
‡ The recommendation for an individual is based on age and physiological status. Women who were pregnant or lactating and individuals 11 to 24 years of age were counted as meeting the recommendation if they consumed at least 3 dairy servings a day; all other individuals were counted as meeting the recommendation if they consumed at least 2 dairy servings a day.
SOURCE: 1995 Continuing Survey of Food Intakes by Individuals, 2-day average, excluding breast-fed children USDA, ARS, Beltsville Human Nutrition Research Center, Food Surveys Research Group
11

Table 5A.--Meat Group: How many ounces a day of cooked lean meat or the equivalent in meat alternates did Americans eat, on average, in 1995? USDA's Food Guide Pyramid recommends eating between 5 and 7 ounces of cooked lean meat or the equivalent in meat alternates each day, depending on calorie needs.
Frankfurter Total PercentageSex and age Nuts and Soybean Eggs and lunch Organ Fish Poultry Meat meat and of(years) seeds products § meat meat alternates ‡ population
------------------------------------------------------------------- Ounces Cooked Lean Meat Equivalents ¶ ------------------------------------------------------------------Percent
Males:.2† *.2.7† *.2.7.92.93.4 2-5..............................................................2† *.3.9† *.3.91.44.04.7 6-11.................................................................1† *.41.0† *.41.42.65.95.9 12-19..............................................................2† *.41.1† *.51.43.06.68.2 20-29..............................................................2† *.4† 1.6† *.61.73.58.17.8 30-39............................................................1† *.51.0† *.41.62.76.47.1 40-49.............................................................2† *.5.9† *.71.72.56.54.7 50-59..............................................................1† *.5.9† .1.51.22.35.73.5 60-69..............................................................1† *.5.6† *.61.01.84.63.5 70 and over..................................................2† *.41.1† *.51.52.86.634.8 20 and over.............................................
Females:.2† *.2.6† *.2.7.82.73.1 2-5..............................................................2† *.3.7† *.3.61.23.24.5 6-11.................................................................1† *.3.5† *.3.91.43.65.8 12-19..............................................................1† *.3.5† *.41.21.44.07.2 20-29..............................................................1† *.3.6† *.61.01.64.39.0 30-39............................................................1† *.3.6† *.41.21.54.26.8 40-49.............................................................1† *.3.5† *.41.01.53.85.7 50-59..............................................................1† *.4.5† *.41.11.43.94.2 60-69..............................................................1*.3.5† *.41.11.13.45.1 70 and over..................................................1*.3.5*.51.11.44.037.8 20 and over.............................................
.1*.4.8*.41.21.94.9100.0All Individuals 2 and over..............................
‡ Excludes cooked dry beans and peas, which are tabulated with vegetables in Table 2A; according to USDA's Food Guide Pyramid they can be counted as a vegetable or a meat alternate.
§ Includes tofu and simulated meat products made from soy.
¶ Only the lean portion of meat, poultry, fish, and simulated meat products is tabulated here. One egg, 1/2 cup of tofu, 2 tablespoons of peanut butter, 1/3 cup of nuts, and 1/4 cup of seeds are each equivalent to 1 ounce of cooked lean meat. Fat in excess of amounts in the leanest meats is tabulated as discretionary fat in Table 6.
* Value less than 0.05 but greater than 0.
† See "Statistical notes," appendix B.
SOURCE: 1995 Continuing Survey of Food Intakes by Individuals, 2-day average, excluding breast-fed children USDA, ARS, Beltsville Human Nutrition Research Center, Food Surveys Research Group
12
Table 5B.--Meat Group: In 1995, what percentage of Americans consumed less than 1 ounce of cooked lean meat or the equivalent in meat alternates a day? What percentage consumed the amount recommended by USDA's Food Guide Pyramid?
Percentage of individuals...... PercentageSex and age of(years)
Consuming at least the population Consuming number of minimum number of ounce Consuming less than ounce equivalents recommended equivalents recommended 1 ounce equivalent a day based on caloric intake ‡ (5 a day)
---------------------------------------------------------------------------- Percent --------------------------------------------------------------------------Percent
Males:161193.4 2-5.............................................................2529† 54.7 6-11................................................................3551† 35.9 12-19.............................................................5364† 28.2 20-29.............................................................5971† 17.8 30-39...........................................................5364† 27.1 40-49............................................................5463† 14.7 50-59.............................................................4755† 23.5 60-69.............................................................3338† 23.5 70 and over.................................................5262234.8 20 and over.............................................
Females:14793.1 2-5.............................................................912† 64.5 6-11................................................................
192385.8 12-19.............................................................2226† 87.2 20-29.............................................................2831† 69.0 30-39...........................................................293166.8 40-49............................................................232465.7 50-59.............................................................2426† 34.2 60-69.............................................................171785.1 70 and over.................................................2426637.8 20 and over.............................................
33385100.0All Individuals 2 and over..............................
‡ Recommended amounts were derived from sample patterns in "The Food Guide Pyramid" (USDA 1992). Individuals consuming less than 2,200 calories met the recommendation if theyate at least 5 ounces of cooked lean meat equivalents a day; individuals consuming 2,200 up to 2,800 calories met the recommendation if they ate at least 6 ounces of cooked lean meat equivalents a day; and individuals consuming 2,800 calories or more met the recommendation if they ate at least 7 ounces of cooked lean meat equivalents a day. The recommendationwas adjusted for children 2 to 5 years old who consumed less than 1,600 calories. To allow for their lower energy needs, the minimum recommendation was lowered by one-third to 3.3ounce equivalents.
† See "Statistical notes," appendix B.
SOURCE: 1995 Continuing Survey of Food Intakes by Individuals, 2-day average, excluding breast-fed children USDA, ARS, Beltsville Human Nutrition Research Center, Food Surveys Research Group
13

Table 6.--Pyramid Tip: How many calories and how much fat and sugar a day did Americans eat, on average, in 1995? USDA's Food Guide Pyramid recommends that fats and sugars be used sparingly; they contain calories and little else of nutritional value.
Percentage Added Discretionary Added Discretionary Total Food ofSex and age sugars fat sugars § fat ‡ fat energy population(years)
--- Teaspoons ¶ --- ---------- Grams --------- -------------------------- Percent of Kilocalories ------------------------- KilocaloriesPercent
Males:15.542.816.125.032.11,5323.4 2-5.............................................................24.956.319.324.531.92,0434.7 6-11................................................................33.576.919.725.333.02,6935.9 12-19.............................................................27.972.617.224.532.72,6268.2 20-29.............................................................28.487.015.025.934.52,9067.8 30-39...........................................................21.363.814.524.333.22,3087.1 40-49............................................................18.666.012.425.634.62,2704.7 50-59.............................................................16.659.612.325.033.92,0833.5 60-69.............................................................13.649.411.823.932.31,7933.5 70 and over.................................................22.869.514.524.933.62,43734.8 20 and over.............................................
Females:15.241.316.525.132.01,4623.1 2-5.............................................................21.349.318.925.232.01,7534.5 6-11................................................................24.651.820.724.931.91,8455.8 12-19.............................................................20.949.417.424.131.51,8117.2 20-29.............................................................16.648.715.625.433.61,6689.0 30-39...........................................................16.048.615.025.834.01,6576.8 40-49............................................................13.444.613.124.832.91,5935.7 50-59.............................................................11.438.612.723.432.01,4344.2 60-69.............................................................10.637.312.023.331.41,4055.1 70 and over.................................................15.545.614.724.632.71,62137.8 20 and over.............................................
20.356.615.824.832.92,000100.0All Individuals 2 and over..............................
‡ Discretionary fat includes fats added to foods in preparation and at the table (i.e., cream, butter, margarine, cream cheese, oil, lard, meat drippings, cocoa, and chocolate) and fat from grainproducts, vegetables, fruits, dairy products, and meats and meat alternates beyond amounts people would consume if they seleted only the lowest-fat foods in each food group.
§ Includes white sugar, brown sugar, raw sugar, corn syrup, honey, molasses, and artificial sweeteners containing carbohydrate that were eaten separately or used as ingredients in processed or prepared foods such as breads, cakes, soft drinks, jams, and ice cream. Does not include sugars such as fructose and lactose that occur naturally in foods such as fruit and milk.
¶ Quantities are standardized on a carbohydrate equivalent basis. One teaspoon of added sugars is defined as the quantity of a sweetener that contains the same amount of carbohydrate as 1teaspoon (4 grams) of table sugar (sucrose).
SOURCE: 1995 Continuing Survey of Food Intakes by Individuals, 2-day average, excluding breast-fed children USDA, ARS, Beltsville Human Nutrition Research Center, Food Surveys Research Group
14

15
1996 PYRAMID SERVINGS DATA TABLES
Table 1A.--Grain Group: How many servings a day did Americans eat, on average, in 1996? USDA's Food Guide Pyramid recommends eating between 6 and 11 servings of grain products each day, depending on calorie needs.
PercentageSex and age Nonwhole-grain Whole-grain Total of(years) products products grain products population
------------------------------------------- Servings ‡ --------------------------------------------Percent
Males:5.61.06.73.2x 2-5...........................................5.9.96.94.7x 6-11.........................................8.41.29.66.0x 12-19.......................................7.5.98.57.5x 20-29.......................................7.21.18.38.2x 30-39.......................................6.91.28.17.3x 40-49.......................................5.91.17.04.8x 50-59.......................................5.71.16.93.5x 60-69.......................................4.81.26.03.4x 70 and over.............................6.61.17.734.8x 20 and over..........................
Females:5.3.96.33.2x 2-5...........................................5.3.86.14.5x 6-11.........................................5.4.96.35.8x 12-19.......................................5.2.86.17.2x 20-29.......................................5.3.96.28.7x 30-39.......................................4.9.95.87.4x 40-49.......................................4.51.05.55.2x 50-59.......................................4.5.85.34.1x 60-69.......................................3.81.04.85.1x 70 and over.............................4.8.95.737.8x 20 and over..........................
5.81.06.8100.0xAll Individuals 2 and over............
‡ One serving is 1 slice of bread; 1 small roll; 1/2 bagel, English muffin, or croissant; 1 ounce of ready-to-eat cereal; 1/2 cup cooked cereal, rice, or pasta; 1 small muffin; or amounts of other grain products such as pretzels and cakes that contain an amount of grain equivalent to that in a standard slice of bread. For children 2 to 5 years old who consume less than 1,600 calories per day, 1 serving is two-thirds of the standard serving size to allow for their lower energy needs. Whole- and nonwhole-grain servings were calculated based on the proportionof whole- and nonwhole-grain ingredients in foods as consumed.
SOURCE: 1996 Continuing Survey of Food Intakes by Individuals, 2-day average, excluding breast-fed children USDA, ARS, Beltsville Human Nutrition Research Center, Food Surveys Research Group
16
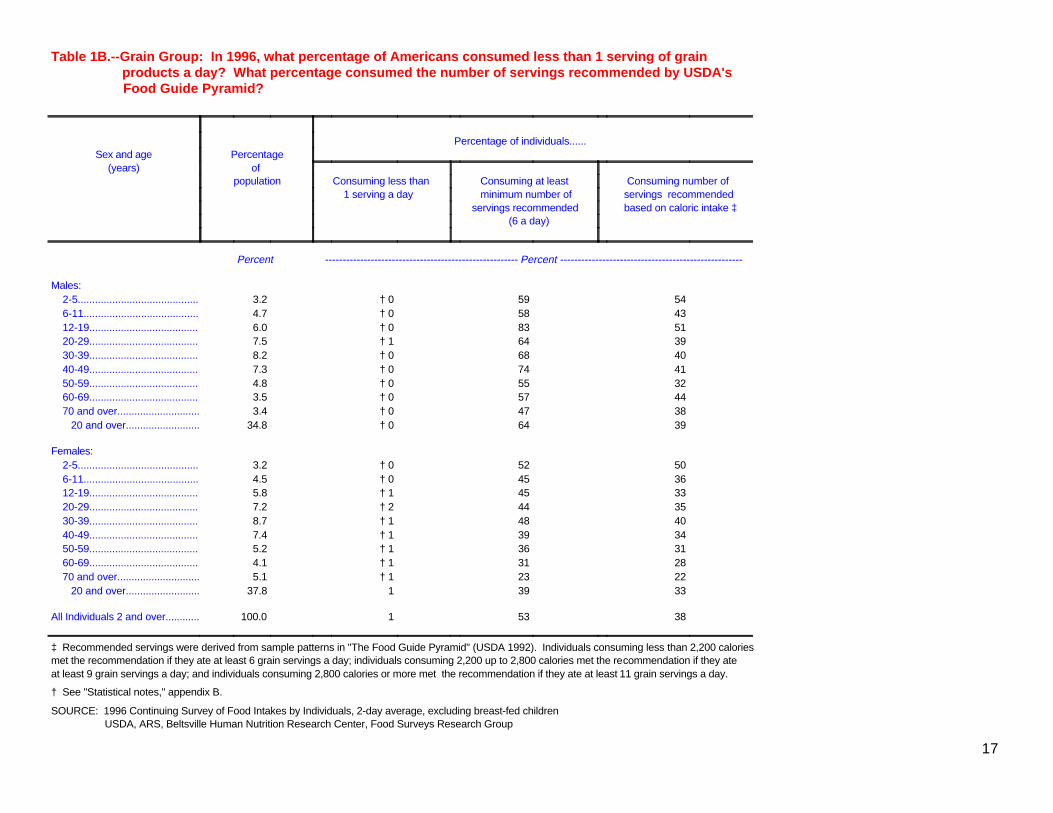
Table 1B.--Grain Group: In 1996, what percentage of Americans consumed less than 1 serving of grain products a day? What percentage consumed the number of servings recommended by USDA's Food Guide Pyramid?
Percentage of individuals...... PercentageSex and age of(years)
Consuming number of Consuming at least Consuming less than population servings recommended minimum number of 1 serving a day based on caloric intake ‡ servings recommended
(6 a day)
------------------------------------------------------- Percent ----------------------------------------------------Percent
Males:5459† 03.2x 2-5...........................................4358† 04.7x 6-11.........................................5183† 06.0x 12-19.......................................3964† 17.5x 20-29.......................................4068† 08.2x 30-39.......................................4174† 07.3x 40-49.......................................3255† 04.8x 50-59.......................................4457† 03.5x 60-69.......................................3847† 03.4x 70 and over.............................3964† 034.8x 20 and over..........................
Females:5052† 03.2x 2-5...........................................3645† 04.5x 6-11.........................................3345† 15.8x 12-19.......................................3544† 27.2x 20-29.......................................4048† 18.7x 30-39.......................................3439† 17.4x 40-49.......................................3136† 15.2x 50-59.......................................2831† 14.1x 60-69.......................................2223† 15.1x 70 and over.............................3339137.8x 20 and over..........................
38531100.0xAll Individuals 2 and over............
‡ Recommended servings were derived from sample patterns in "The Food Guide Pyramid" (USDA 1992). Individuals consuming less than 2,200 caloriesmet the recommendation if they ate at least 6 grain servings a day; individuals consuming 2,200 up to 2,800 calories met the recommendation if they ateat least 9 grain servings a day; and individuals consuming 2,800 calories or more met the recommendation if they ate at least 11 grain servings a day.
† See "Statistical notes," appendix B.
SOURCE: 1996 Continuing Survey of Food Intakes by Individuals, 2-day average, excluding breast-fed children USDA, ARS, Beltsville Human Nutrition Research Center, Food Surveys Research Group
17

Table 2A.--Vegetable Group: How many servings a day did Americans eat, on average, in 1996? USDA's Food Guide Pyramid recommends eating between 3 and 5 servings of vegetables each day, depending on cal orie needs.
Starchy vegetables Other Cooked Deep Dark Total PercentageSex and age vegetables Tomatoes dry beans yellow green leafy vegetables of(years)
Other White and peas vegetables vegetables population starchy ‡ potatoes
------------------------------------------------------------------------------------- Servings § -----------------------------------------------------------------------------------Percent
Males:.3.3.2.9.1.1.12.03.2x 2-5............................................5.4.21.0.1.1.12.44.7x 6-11..........................................8.6.11.7.2.1.13.66.0x 12-19.......................................
1.1.7.11.9.3.1.14.47.5x 20-29.......................................1.3.7.21.5.3.1.14.38.2x 30-39.......................................1.3.6.31.3.3.2.24.17.3x 40-49.......................................1.2.6.41.2.3.2.24.24.8x 50-59.......................................1.1.5.31.0.3.2.33.83.5x 60-69.......................................1.3.4.2.9.2.3.23.53.4x 70 and over.............................1.2.6.31.4.3.2.24.134.8x 20 and over..........................
Females:.5.4.2.9.2.1.12.33.2x 2-5............................................5.3.2.9.1.1† .12.34.5x 6-11..........................................6.5.11.1.2.1.22.85.8x 12-19.......................................
1.0.5.21.0.3.2.13.27.2x 20-29.......................................1.1.5.21.0.2.2.23.38.7x 30-39.......................................1.2.4.2.9.2.2.23.27.4x 40-49.......................................1.2.4.2.8.2.2.23.25.2x 50-59.......................................1.1.4.2.7.1.2.22.94.1x 60-69.......................................1.0.4.2.7.1.2.22.85.1x 70 and over.............................1.1.5.2.9.2.2.23.237.8x 20 and over..........................
1.0.5.21.1.2.2.23.4100.0xAll Individuals 2 and over............
‡ Examples are corn, green peas, and lima beans (immature).
§ One serving is 1 cup of raw leafy vegetables; 1/2 cup of cooked or chopped raw vegetables; 1 ounce of vegetable chips; or 3/4 cup of vegetable juice. For children 2 to 5 years old who consume less than 1,600 calories per day, 1 serving is two-thirds of the standard serving size to allow for their lower energy needs.
† See "Statistical notes," appendix B.
SOURCE: 1996 Continuing Survey of Food Intakes by Individuals, 2-day average, excluding breast-fed children USDA, ARS, Beltsville Human Nutrition Research Center, Food Surveys Research Group
18
Table 2B.--Vegetable Group: In 1996, what percentage of Americans consumed less than 1 serving of vegetables a day? What percentage consumed the number of servings recommended by USDA's Food Guide Pyramid?
Percentage of individuals...... PercentageSex and age of(years)
Consuming number of Consuming at least Consuming less than population servings recommended minimum number of 1 serving a day based on caloric intake ‡ servings recommended
(3 a day)
------------------------------------------------------- Percent ----------------------------------------------------Percent
Males:2223263.2x 2-5...........................................2229214.7x 6-11.........................................3456116.0x 12-19.......................................456077.5x 20-29.......................................506748.2x 30-39.......................................506177.3x 40-49.......................................577064.8x 50-59.......................................525863.5x 60-69.......................................5256133.4x 70 and over.............................5063734.8x 20 and over..........................
Females:2728163.2x 2-5...........................................2629244.5x 6-11.........................................3340135.8x 12-19.......................................4448137.2x 20-29.......................................455078.7x 30-39.......................................444797.4x 40-49.......................................4851105.2x 50-59.......................................414294.1x 60-69.......................................4141115.1x 70 and over.............................4447937.8x 20 and over..........................
425011100.0xAll Individuals 2 and over............
‡ Recommended servings were derived from sample patterns in "The Food Guide Pyramid" (USDA 1992). Individuals consuming less than 2,200 caloriesmet the recommendation if they ate at least 3 vegetable servings a day; individuals consuming 2,200 up to 2,800 calories met the recommendation if they ate at least 4 vegetable servings a day; and individuals consuming 2,800 calories or more met the recommendation if they ate at least 5 vegetable servingsa day.
SOURCE: 1996 Continuing Survey of Food Intakes by Individuals, 2-day average, excluding breast-fed children USDA, ARS, Beltsville Human Nutrition Research Center, Food Surveys Research Group
19

Table 3A.--Fruit Group: How many servings a day did Americans eat, on average, in 1996? USDA's Food Guide Pyramid recommends eating between 2 and 4 servings of fruits each day, depending on calorie needs.
PercentageSex and age Other Citrus fruits, Total of(years) fruits melons, berries fruits population
------------------------------------ Servings ‡ ------------------------------------Percent
Males:1.4.72.23.2x 2-5............................................8.51.34.7x 6-11..........................................6.71.36.0x 12-19........................................5.71.27.5x 20-29........................................5.61.18.2x 30-39........................................8.71.57.3x 40-49........................................9.91.74.8x 50-59.......................................
1.1.92.03.5x 60-69.......................................1.2.92.13.4x 70 and over..............................7.71.534.8x 20 and over..........................
Females:1.4.92.33.2x 2-5............................................9.61.44.5x 6-11..........................................6.71.25.8x 12-19........................................7.61.37.2x 20-29........................................6.71.38.7x 30-39........................................7.61.37.4x 40-49........................................8.81.65.2x 50-59........................................8.81.64.1x 60-69........................................9.81.75.1x 70 and over..............................7.71.437.8x 20 and over..........................
.8.71.5100.0xAll Individuals 2 and over............
‡ One serving is a whole fruit such as a medium apple, banana, or orange; a grapefruit half; 1/2 cup of berries, melon, or chopped raw fruit; 1/2 cup of cooked or canned fruit; 1/4 cup of dried fruit; or 3/4 cup of fruit juice. For children 2 to 5 years old who consume less than 1,600 calories, 1 serving is two-thirds of the standard serving size to allow for their lower energy needs.
SOURCE: 1996 Continuing Survey of Food Intakes by Individuals, 2-day average, excluding breast-fed children USDA, ARS, Beltsville Human Nutrition Research Center, Food Surveys Research Group
20

Table 3B.--Fruit Group: In 1996, What percentage of Americans consumed less than 1 serving of fruit a day? What percentage consumed the number of servings recommended by USDA's Food Guide Pyramid?
Percentage of individuals...... PercentageSex and age of(years)
Consuming number of Consuming at least Consuming less than population servings recommended minimum number of 1 serving a day based on caloric intake ‡ servings recommended
(2 a day)
-------------------------------------------------------- Percent -----------------------------------------------------Percent
Males:4445323.2x 2-5...........................................1922494.7x 6-11.........................................1122576.0x 12-19.......................................1321637.5x 20-29.......................................1421648.2x 30-39.......................................1827527.3x 40-49.......................................1929474.8x 50-59.......................................3340363.5x 60-69.......................................3843363.4x 70 and over.............................20275334.8x 20 and over..........................
Females:4747283.2x 2-5...........................................1923474.5x 6-11.........................................1622555.8x 12-19.......................................1923547.2x 20-29.......................................2225558.7x 30-39.......................................1719567.4x 40-49.......................................2729455.2x 50-59.......................................2930384.1x 60-69.......................................3434375.1x 70 and over.............................24264937.8x 20 and over..........................
222750100.0xAll Individuals 2 and over............
‡ Recommended servings were derived from sample patterns in "The Food Guide Pyramid" (USDA 1992). Individuals consuming less than 2,200 calories met the recommendation if they ate at least 2 fruit servings a day; individuals consuming 2,200 up to 2,800 calories met the recommendation if they ate atleast 3 fruit servings a day; and individuals consuming 2,800 calories or more met the recommendation if they ate at least 4 fruit servings a day.
SOURCE: 1996 Continuing Survey of Food Intakes by Individuals, 2-day average, excluding breast-fed children USDA, ARS, Beltsville Human Nutrition Research Center, Food Surveys Research Group
21
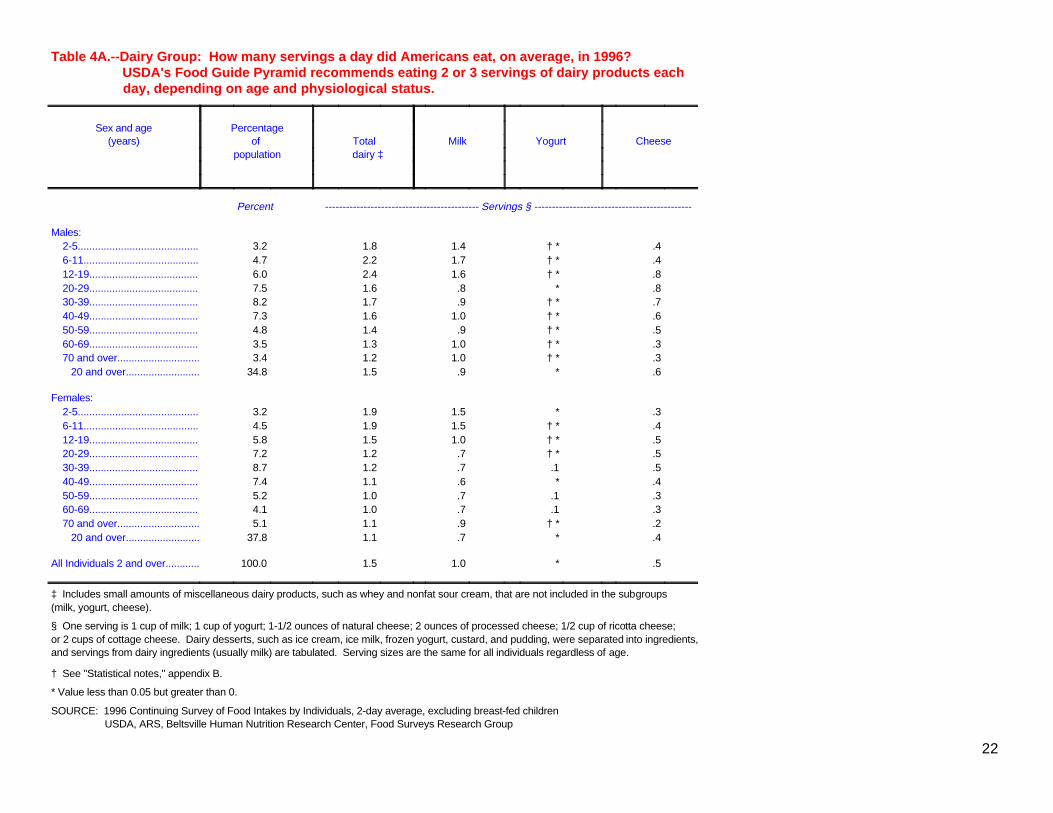
Table 4A.--Dairy Group: How many servings a day did Americans eat, on average, in 1996? USDA's Food Guide Pyramid recommends eating 2 or 3 servings of dairy products each day, depending on age and physiological status.
PercentageSex and age Cheese Yogurt Milk Total of(years)
dairy ‡ population
-------------------------------------------- Servings § ---------------------------------------------Percent
Males:.4† *1.41.83.2x 2-5............................................4† *1.72.24.7x 6-11..........................................8† *1.62.46.0x 12-19........................................8*.81.67.5x 20-29........................................7† *.91.78.2x 30-39........................................6† *1.01.67.3x 40-49........................................5† *.91.44.8x 50-59........................................3† *1.01.33.5x 60-69........................................3† *1.01.23.4x 70 and over..............................6*.91.534.8x 20 and over..........................
Females:.3*1.51.93.2x 2-5............................................4† *1.51.94.5x 6-11..........................................5† *1.01.55.8x 12-19........................................5† *.71.27.2x 20-29........................................5.1.71.28.7x 30-39........................................4*.61.17.4x 40-49........................................3.1.71.05.2x 50-59........................................3.1.71.04.1x 60-69........................................2† *.91.15.1x 70 and over..............................4*.71.137.8x 20 and over..........................
.5*1.01.5100.0xAll Individuals 2 and over............
‡ Includes small amounts of miscellaneous dairy products, such as whey and nonfat sour cream, that are not included in the subgroups(milk, yogurt, cheese).
§ One serving is 1 cup of milk; 1 cup of yogurt; 1-1/2 ounces of natural cheese; 2 ounces of processed cheese; 1/2 cup of ricotta cheese; or 2 cups of cottage cheese. Dairy desserts, such as ice cream, ice milk, frozen yogurt, custard, and pudding, were separated into ingredients,and servings from dairy ingredients (usually milk) are tabulated. Serving sizes are the same for all individuals regardless of age.
† See "Statistical notes," appendix B.
* Value less than 0.05 but greater than 0.
SOURCE: 1996 Continuing Survey of Food Intakes by Individuals, 2-day average, excluding breast-fed children USDA, ARS, Beltsville Human Nutrition Research Center, Food Surveys Research Group
22

Table 4B.--Dairy Group: In 1996, what percentage of Americans consumed less than 1 serving of dairy products a day? What percentage consumed at least 2 servings a day? What percentage consumed the number of servings recommended by USDA's Food Guide Pyramid?
Percentage of individuals...... PercentageSex and age of(years)
Consuming number of Consuming at least Consuming less than population servings recommended the minimum number 1 serving a day based on age and of servings recommended physiological status ‡ (2 a day)
------------------------------------------------------- Percent -----------------------------------------------------Percent
Males:3939213.2x 2-5...........................................5055154.7x 6-11.........................................2951176.0x 12-19.......................................2129387.5x 20-29.......................................3333368.2x 30-39.......................................2929417.3x 40-49.......................................2323504.8x 50-59.......................................2323443.5x 60-69.......................................2020463.4x 70 and over.............................26284134.8x 20 and over..........................
Females:4343163.2x 2-5...........................................3942214.5x 6-11.........................................1025405.8x 12-19.......................................
816417.2x 20-29.......................................1920558.7x 30-39.......................................1314587.4x 40-49.......................................1313625.2x 50-59.......................................1212614.1x 60-69.......................................1414545.1x 70 and over.............................14155437.8x 20 and over..........................
232741100.0xAll Individuals 2 and over............
‡ The recommendation for an individual is based on age and physiological status. Women who were pregnant or lactating and individuals 11 to 24 years of age were counted as meeting the recommendation if they consumed at least 3 dairy servings a day; all other individuals were counted as meeting the recommendation if they consumed at least 2 dairy servings a day.
SOURCE: 1996 Continuing Survey of Food Intakes by Individuals, 2-day average, excluding breast-fed children USDA, ARS, Beltsville Human Nutrition Research Center, Food Surveys Research Group
23

Table 5A.--Meat Group: How many ounces a day of cooked lean meat or the equivalent in meat alternates did Americans eat, on av erage, in 1996? USDA's Food Guide Pyramid recommends eating between 5 and 7 ounces of cooked lean meat or the equivalent in meat alternates each day, depending on calorie needs.
Frankfurter Total PercentageSex and age Nuts and Soybean Eggs and lunch Organ Fish Poultry Meat meat and of(years) seeds products § meat meat alternates ‡ population
------------------------------------------------------------------- Ounces Cooked Lean Meat Equivalents ¶ ------------------------------------------------------------------Percent
Males:.2† *.3.6† *.1.7.82.63.2x 2-5............................................1† *.2.8† *.2.71.43.44.7x 6-11..........................................2† *.41.1† *.31.12.85.96.0x 12-19........................................2† *.5.9† *.41.52.96.37.5x 20-29........................................2† *.41.2† *.61.42.96.88.2x 30-39........................................1† *.51.1† *.61.52.66.47.3x 40-49........................................2† *.5.9† .1.81.12.76.24.8x 50-59........................................1† *.6.8† *.71.12.15.43.5x 60-69........................................2† *.4.6† *.4.81.74.13.4x 70 and over..............................2*.51.0*.51.32.66.134.8x 20 and over..........................
Females:.1† *.2.6† *.2.6.82.53.2x 2-5............................................1† *.2.6† *.1.71.22.94.5x 6-11..........................................1† *.2.6† *.2.91.53.55.8x 12-19........................................1† *.3.5† *.3.91.53.67.2x 20-29........................................1† *.2.5† *.41.01.63.98.7x 30-39........................................1† *.3.5† *.4.91.53.77.4x 40-49........................................1† *.3.4† *.71.01.33.75.2x 50-59........................................1† *.4.6† *.6.91.43.94.1x 60-69........................................1† *.3.3† *.5.91.33.45.1x 70 and over..............................1*.3.5*.4.91.43.737.8x 20 and over..........................
.1*.3.7*.41.01.94.5100.0xAll Individuals 2 and over............
‡ Excludes cooked dry beans and peas, which are tabulated with vegetables in Table 2A; according to USDA's Food Guide Pyramid they can be counted as a vegetable or a meat alternate.
§ Includes tofu and simulated meat products made from soy.
¶ Only the lean portion of meat, poultry, fish, and simulated meat products is tabulated here. One egg, 1/2 cup of tofu, 2 tablespoons of peanut butter, 1/3 cup of nuts, and 1/4 cup of seeds are each equivalent to 1 ounce of cooked lean meat. Fat in excess of amounts in the leanest meats is tabulated as discretionary fat in Table 6.
* Value less than 0.05 but greater than 0.
† See "Statistical notes," appendix B.
SOURCE: 1996 Continuing Survey of Food Intakes by Individuals, 2-day average, excluding breast-fed children USDA, ARS, Beltsville Human Nutrition Research Center, Food Surveys Research Group
24

Table 5B.--Meat Group: In 1996, what percentage of Americans consumed less than 1 ounce of cooked lean meat or the equivalent in meat alternates a day? What percentage consumed the amount recommended by USDA's Food Guide Pyramid?
Percentage of individuals...... PercentageSex and age of(years)
Consuming at least the population Consuming number of mimimum number of ounce Consuming less than ounce equivalents recommended equivalents recommended 1 ounce equivalent a day based on caloric intake ‡ (5 a day)
---------------------------------------------------------------------------- Percent --------------------------------------------------------------------------Percent
Males:138163.2x 2-5...........................................151984.7x 6-11.........................................4455† 26.0x 12-19.......................................4660† 37.5x 20-29.......................................5564† 18.2x 30-39.......................................5666† 27.3x 40-49.......................................5159† 24.8x 50-59.......................................4349† 23.5x 60-69.......................................2629† 53.4x 70 and over.............................4958234.8x 20 and over..........................
Females:147143.2x 2-5...........................................89† 54.5x 6-11.........................................
171985.8x 12-19.......................................2124117.2x 20-29.......................................2225† 48.7x 30-39.......................................212457.4x 40-49.......................................212375.2x 50-59.......................................282864.1x 60-69.......................................1616† 65.1x 70 and over.............................2123637.8x 20 and over..........................
30355100.0xAll Individuals 2 and over............
‡ Recommended amounts were derived from sample patterns in "The Food Guide Pyramid" (USDA 1992). Individuals consuming less than 2,200 calories met the recommendation if theyate at least 5 ounces of cooked lean meat equivalents a day; individuals consuming 2,200 up to 2,800 calories met the recommendation if they ate at least 6 ounces of cooked lean meat equivalents a day; and individuals consuming 2,800 calories or more met the recommendation if they ate at least 7 ounces of cooked lean meat equivalents a day. The recommendationwas adjusted for children 2 to 5 years old who consumed less than 1,600 calories. To allow for their lower energy needs, the minimum recommendation was lowered by one-third to 3.3ounce equivalents.
† See "Statistical notes," appendix B.
SOURCE: 1996 Continuing Survey of Food Intakes by Individuals, 2-day average, excluding breast-fed children USDA, ARS, Beltsville Human Nutrition Research Center, Food Surveys Research Group
25

Table 6.--Pyramid Tip: How many calories and how much fat and sugar a day did Americans eat, on average, in 1996? USDA's Food Guide Pyramid recommends that fats and sugars be used sparingly; they contain calories and little e lse of nutritional value.
Added Discretionary Added Discretionary Total Food PercentageSex and age sugars fat sugars § fat ‡ fat energy of(years)
population
--- Teaspoons ¶ --- ---------- Grams --------- -------------------------- Percent of Kilocalories ------------------------- KilocaloriesPercent
Males:15.744.716.325.832.61,5523.2x 2-5...........................................22.553.218.724.932.11,9074.7x 6-11.........................................33.779.219.625.733.52,7396.0x 12-19.......................................28.073.317.125.133.22,6207.5x 20-29.......................................25.372.415.925.434.02,5188.2x 30-39.......................................22.872.314.125.734.22,4627.3x 40-49.......................................19.464.514.325.534.32,2164.8x 50-59.......................................15.153.911.723.432.22,0193.5x 60-69.......................................14.150.512.725.133.21,7793.4x 70 and over.............................22.467.514.825.233.72,36334.8x 20 and over..........................
Females:14.840.516.124.831.51,4553.2x 2-5...........................................20.349.318.525.532.31,7244.5x 6-11.........................................23.650.220.924.731.91,8095.8x 12-19.......................................20.948.518.723.931.31,7747.2x 20-29.......................................18.348.816.124.131.71,7588.7x 30-39.......................................14.947.914.726.033.71,6227.4x 40-49.......................................13.943.813.924.532.11,5595.2x 50-59.......................................11.238.512.323.532.01,4384.1x 60-69.......................................11.737.113.323.932.01,3935.1x 70 and over.............................15.945.215.224.432.11,62337.8x 20 and over..........................
20.155.716.124.932.71,969100.0xAll Individuals 2 and over............
‡ Discretionary fat includes fats added to foods in preparation and at the table (i.e., cream, butter, margarine, cream cheese, oil, lard, meat drippings, cocoa, and chocolate) and fat from grainproducts, vegetables, fruits, dairy products, and meats and meat alternates beyond amounts people would consume if they seleted only the lowest-fat foods in each food group.
§ Includes white sugar, brown sugar, raw sugar, corn syrup, honey, molasses, and artificial sweeteners containing carbohydrate that were eaten separately or used as ingredients in processed or prepared foods such as breads, cakes, soft drinks, jams, and ice cream. Does not include sugars such as fructose and lactose that occur naturally in foods such as fruit and milk.
¶ Quantities are standardized on a carbohydrate equivalent basis. One teaspoon of added sugars is defined as the quantity of a sweetener that contains the same amount of carbohydrate as 1teaspoon (4 grams) of table sugar (sucrose).
SOURCE: 1996 Continuing Survey of Food Intakes by Individuals, 2-day average, excluding breast-fed children USDA, ARS, Beltsville Human Nutrition Research Center, Food Surveys Research Group
26

27
Appendix A. Pyramid Servings: Counts of 2-day respondents and population percentages, by sex and age, 1995 and 1996
Interpreting information in Appendix A--
! Appendix A shows unweighted counts of survey respondents in each sex-age group shown in the tables and the weightedpercentages of the population that they represent. Breast-fed children are excluded from the unweighted counts and the weightedpercentages of the population they represent. Weights are used to account for differential rates of selection and nonresponse, tocalibrate the sample to match population characteristics known to be correlated with eating behavior, and to equalize intakes overthe 4 quarters of the year and the 7 days of the week.

Appendix A.-- Pyramid Servings: Counts of 2-day respondents and population percentages, by sex and age, 1995 and 1996
1996 1995
Sex and age2-day percentage of 2-day count 2-day percentage 2-day count(years)population (weighted) (unweighted)of population (weighted) (unweighted)
--------------------------------------------------------------------------- Percent -----------------------------------------------------------------------------
Males:3.22513.4389x 2-5...........................................4.72524.7222x 6-11.........................................6.02395.9189x 12-19.......................................7.52898.2190x 20-29.......................................8.23387.8187x 30-39.......................................7.32607.1267x 40-49.......................................4.82514.7342x 50-59.......................................3.52763.5302x 60-69.......................................3.41863.5316x 70 and over.............................
34.81,60034.8 1,604x 20 and over..........................
Females:3.23343.1300x 2-5...........................................4.52224.5230x 6-11.........................................5.82405.8201x 12-19.......................................7.22627.2157x 20-29.......................................8.72699.0227x 30-39.......................................7.43226.8261x 40-49.......................................5.22345.7318x 50-59.......................................4.12354.2288x 60-69.......................................5.11455.1313x 70 and over.............................
37.81,46737.81,564x 20 and over..........................
100.04,605100.04,699xAll Individuals 2 and over............
SOURCE: 1995 and 1996 Continuing Survey of Food Intakes by Individuals, excluding 2 breast-fed children in 1995 and 3 breast-fed children in 1996. USDA, ARS, Beltsville Human Nutrition Research Center, Food Surveys Research Group.
28
29
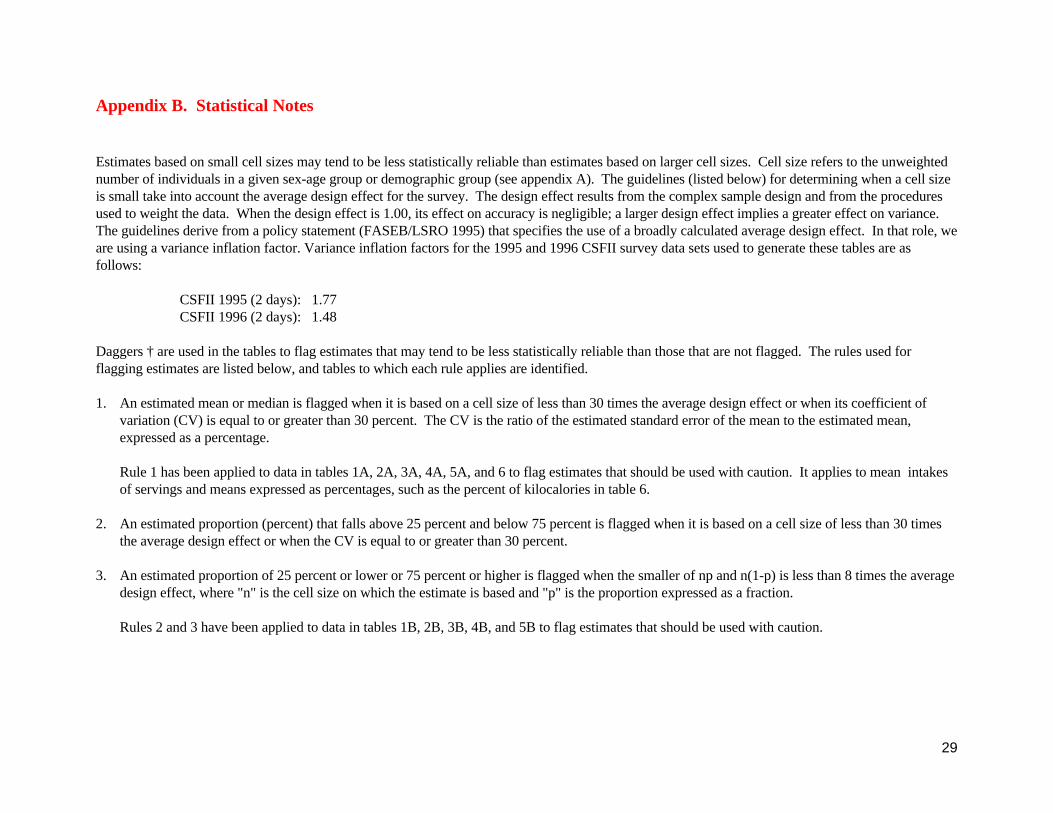
Appendix B. Statistical Notes
Estimates based on small cell sizes may tend to be less statistically reliable than estimates based on larger cell sizes. Cell size refers to the unweightednumber of individuals in a given sex-age group or demographic group (see appendix A). The guidelines (listed below) for determining when a cell sizeis small take into account the average design effect for the survey. The design effect results from the complex sample design and from the proceduresused to weight the data. When the design effect is 1.00, its effect on accuracy is negligible; a larger design effect implies a greater effect on variance. The guidelines derive from a policy statement (FASEB/LSRO 1995) that specifies the use of a broadly calculated average design effect. In that role, weare using a variance inflation factor. Variance inflation factors for the 1995 and 1996 CSFII survey data sets used to generate these tables are asfollows:
CSFII 1995 (2 days): 1.77 CSFII 1996 (2 days): 1.48
Daggers † are used in the tables to flag estimates that may tend to be less statistically reliable than those that are not flagged. The rules used forflagging estimates are listed below, and tables to which each rule applies are identified.
1. An estimated mean or median is flagged when it is based on a cell size of less than 30 times the average design effect or when its coefficient ofvariation (CV) is equal to or greater than 30 percent. The CV is the ratio of the estimated standard error of the mean to the estimated mean,expressed as a percentage.
Rule 1 has been applied to data in tables 1A, 2A, 3A, 4A, 5A, and 6 to flag estimates that should be used with caution. It applies to mean intakesof servings and means expressed as percentages, such as the percent of kilocalories in table 6.
2. An estimated proportion (percent) that falls above 25 percent and below 75 percent is flagged when it is based on a cell size of less than 30 times
the average design effect or when the CV is equal to or greater than 30 percent.
3. An estimated proportion of 25 percent or lower or 75 percent or higher is flagged when the smaller of np and n(1-p) is less than 8 times the averagedesign effect, where "n" is the cell size on which the estimate is based and "p" is the proportion expressed as a fraction.
Rules 2 and 3 have been applied to data in tables 1B, 2B, 3B, 4B, and 5B to flag estimates that should be used with caution.

30
Appendix C. References
FASEB/LSRO (Federation of American Societies for Experimental Biology, Life Sciences Research Office). 1995. Third report onnutrition monitoring in the United States: Volume 1. Prepared for the Interagency Board for Nutrition Monitoring and RelatedResearch. U.S. Government Printing Office, Washington, DC, pages III-1 to III-10. Highlights, executive summary, and orderinginformation also available online: <http://www.barc.usda.gov/bhnrc/foodsurvey/new3.htm> [visited 1997, October 27]. III-10.
USDA (U.S. Department of Agriculture). 1992. The Food Guide Pyramid. Home and Garden Bulletin 252.