q1 2014 - navidar group | investment banking firm offering ... · navidar is an investment banking...
TRANSCRIPT

Quarterly
Review of the
IT Services &
Business
Services Sector
Q1 2014
Member: FINRA/SIPC

2
About Navidar
Navidar is an investment banking firm providing companies and investors in dynamic industries with strategic
M&A advice, capital raising solutions, vital insights and breakthrough opportunities.
■ Big Firm Experience Combined with Senior Banker Attention
■ Global Relationships With Top Tier Investors and World-Leading Companies
■ Greater Creativity & Customized Solutions
■ Focused on the Middle Corridor of the United States
Navidar’s Recent Transaction Experience
Note: Transactions above only represent a sample of past transactions executed by Navidar.
Sellside Advisor
Has been acquired by
Private Equity Placement Sellside Advisor
Has been acquired by
Has acquired
Buyside Advisor Sellside Advisor
Has been acquired by
Sellside Advisor
Has been acquired by
Sellside Advisor
Has been acquired by
Capital Structure Review
NOL Shareholder Rights
Plan
Has been acquired by
Sellside Advisor
Sellside Advisor
Has been acquired by
Debt Placement
Private Equity Placement Private Equity Placement
Buyside Advisor
Has acquired
World Golf Systems Group PLC
Recapitalization Private Equity Placement

3
Navidar at a Glance
Experienced Strategic Advisors
Advising Dynamic Companies
Executed Over 300 Deals,
Nearly $70B of Transaction Value
Creative Insights & Customized Solutions
International Expertise
$8.4B of Transaction Value
Contact Us
Austin Office
400 W. 15th Street,
Suite 325
Austin, TX 78701
T: (512) 765-6970
Stephen Day
Managing Principal
Tim Walsh
Managing Principal
Indianapolis Office
11711 N. Meridian Street,
Suite 325
Carmel, IN 46032
T: (317) 559-3910
Christopher Day
Managing Principal
Christopher Day
Managing Principal
Minneapolis Office
120 Sixth Street South,
Suite 1200
Minneapolis, MN 55402
T: (612) 314-0010
Christopher Day
Managing Principal
Steve Schmidt
Managing Director
Financing
$31.5B
47%
M&A
$35.9B
53%
M&A
Corporate
Finance
Advisory
Capital
Raising
Pu
blic C
om
pa
nies
Pri
va
te C
om
pa
nie
s
Asia
$4.9B
58%
Europe,
$2.2B,
26%
Canada,
$1.3B,
16%
Technology Internet/
E-Commerce
SaaS
SoftwareBusiness
Services
MedTech and
HCITSpecialty
Manufacturing
Technology Internet/
E-Commerce
SaaS
SoftwareBusiness
Services
MedTech and
HCITSpecialty
Manufacturing
4
Q1 2014 IT Services & Business Services Sector Review
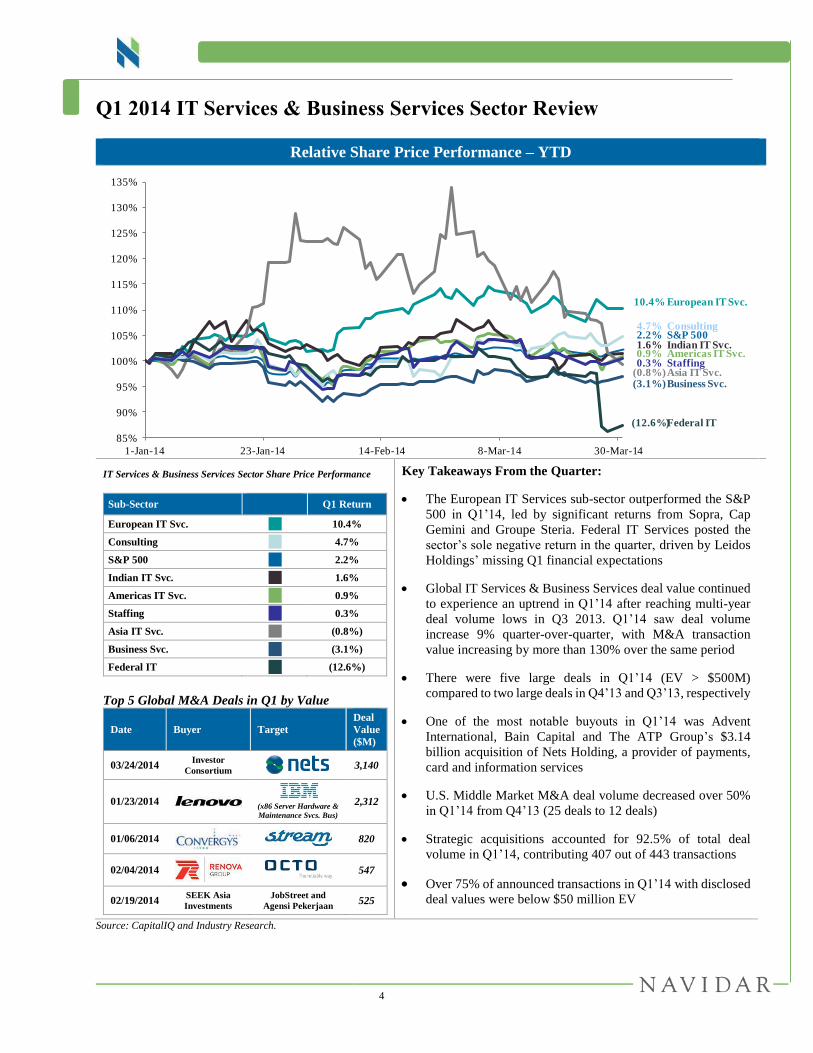
Relative Share Price Performance – YTD
IT Services & Business Services Sector Share Price Performance
Top 5 Global M&A Deals in Q1 by Value
Sub-Sector Q1 Return
European IT Svc. 10.4%
Consulting 4.7%
S&P 500 2.2%
Indian IT Svc. 1.6%
Americas IT Svc.
0.9%
Staffing
0.3%
Asia IT Svc. (0.8%)
Business Svc. (3.1%)
Federal IT (12.6%)
Date Buyer Target
Deal
Value
($M)
03/24/2014 Investor
Consortium 3,140
01/23/2014
(x86 Server Hardware &
Maintenance Svcs. Bus)
2,312
01/06/2014 820
02/04/2014
547
02/19/2014 SEEK Asia
Investments
JobStreet and
Agensi Pekerjaan 525
Key Takeaways From the Quarter:
The European IT Services sub-sector outperformed the S&P
500 in Q1’14, led by significant returns from Sopra, Cap
Gemini and Groupe Steria. Federal IT Services posted the
sector’s sole negative return in the quarter, driven by Leidos
Holdings’ missing Q1 financial expectations
Global IT Services & Business Services deal value continued
to experience an uptrend in Q1’14 after reaching multi-year
deal volume lows in Q3 2013. Q1’14 saw deal volume
increase 9% quarter-over-quarter, with M&A transaction
value increasing by more than 130% over the same period
There were five large deals in Q1’14 (EV > $500M)
compared to two large deals in Q4’13 and Q3’13, respectively
One of the most notable buyouts in Q1’14 was Advent
International, Bain Capital and The ATP Group’s $3.14
billion acquisition of Nets Holding, a provider of payments,
card and information services
U.S. Middle Market M&A deal volume decreased over 50%
in Q1’14 from Q4’13 (25 deals to 12 deals)
Strategic acquisitions accounted for 92.5% of total deal
volume in Q1’14, contributing 407 out of 443 transactions
Over 75% of announced transactions in Q1’14 with disclosed
deal values were below $50 million EV
Source: CapitalIQ and Industry Research.
85%
90%
95%
100%
105%
110%
115%
120%
125%
130%
135%
1-Jan-14 23-Jan-14 14-Feb-14 8-Mar-14 30-Mar-14
2.2%
(3.1%)
0.9%
10.4%
1.6%
4.7%
(12.6%)
(0.8%)
S&P 500
Business Svc.
Americas IT Svc.
European IT Svc.
Indian IT Svc.
Consulting
Federal IT
Asia IT Svc.0.3% Staffing

5
IT Services & Business Services Sector M&A Review
Source: CapitalIQ and Industry Research.
(1) Defined as deal value of $500M EV and less.
Global IT Services & Business Services M&A Deals – Since 2011 Commentary
Global IT Services & Business
Services Global deal value returned
to 2013 highs after three consecutive
quarters of decline
Transaction volume increased 13%
year-over-year in Q1’14 to 440 deals.
Total disclosed M&A deal value
increased by more than 130% over the
same period, from $4.0 billion to $9.5
billion
U.S. IT Services & Business Services
M&A deal volume, after declining
over the last two quarters, gained
significant momentum in Q1’14
Deal volume increased 31% quarter-
over-quarter in Q1’14, from 144 to
189 deals, respectively. Q1’14 deal
volume nearly reached multi-year
highs experienced in Q4’12
M&A transaction volume increased
9% in Q1’14, from 173 to 189 deals.
Total Disclosed deal value increased
by more than 180%, from $1.3 billion
to $3.7 billion, driven by Lenovo’s
$2.3 billion acquisition of IBM’s x86
Server Hardware and Maintenance
Services Business
U.S. Middle Market deal volume
experienced a sharp decline in Q1’14
from the 12-month high of Q4’13
Q1’14 deal volume decreased over
50% quarter-over-quarter
Total disclosed M&A deal value
increased by over 55% Q-o-Q
U.S. IT Services & Business Services M&A Deals – Since 2011
U.S. Middle Market IT Svc. & Business Svc. M&A – Since 2011(1)
Valu
e (
$b
n)
$6.4
$9.5
$6.3
$3.9
$16.9
$7.2
$5.6 $6.6
$4.0
$8.9
$4.6 $4.1
$9.5
434
465
389
421
454
407
430
472
389
359
348
403440
0
100
200
300
400
500
$0
$5
$10
$15
$20
$25
Q1 Q2 Q3 Q4 Q1 Q2 Q3 Q4 Q1 Q2 Q3 Q4 Q1
No
. of D
eals
2011 2012 2013 2014
Val
ue
($b
n)
$1.9
$3.6 $4.0
$1.6
$5.6
$1.0 $1.2
$1.9
$1.3
$4.0
$2.5
$2.0
$3.7
156
159
133
158
173
136
171
194173
143 142
144
189
0
50
100
150
200
$0
$2
$4
$6
$8
Q1 Q2 Q3 Q4 Q1 Q2 Q3 Q4 Q1 Q2 Q3 Q4 Q1
No
. of D
eals
2011 2012 2013 2014
Val
ue
($m
n)
$1,273
$1,125
$1,397 $1,554 $1,594
$354
$1,206
$992
$1,268
$128
$1,219 $1,450
$609
37
33
26
32
22
16
26
15
21
13
13
25
12
0
10
20
30
40
$0
$500
$1,000
$1,500
$2,000
$2,500
$3,000
$3,500
$4,000
Q1 Q2 Q3 Q4 Q1 Q2 Q3 Q4 Q1 Q2 Q3 Q4 Q1
No
. of D
eals
2011 2012 2013 2014

6
IT Services & Business Services Sector M&A Review (Cont.)
Source: CapitalIQ and Industry Research. Note: EV = Enterprise Value (Equity Value + Debt + Minority Interest – Cash and Cash Equivalents) and LTM = Last Twelve Months.
Top 10 Global IT Services & Business Services M&A Transactions in Q1 2014
Announced
Date Buyer Target
Trn. Value
($U.S.Dmm)
LTM
EV/Rev. (x)
LTM
EV/EBITDA (x)
03/28/2014 Vivendi (France) Groupe Telindus (France) 131 NA NA
03/24/2014
Advent International (U.S.); Bain
Capital (U.S.); ATP Group (Denmark)
Nets Holding (Denmark) 3,140 NA NA
03/13/2014 Sonda (Chile) CTIS Tecnologia (Brazil) 206 0.6x NA
03/11/2014 Sverica International (U.S.);
Blackstone Group (U.S.) Accuvant (U.S.) 225 NA NA
02/19/2014 SEEK Asia Investments (Singapore) JobStreet (Singapore) and Agensi
Pekerjaan (Malaysia) 525 NA NA
02/14/2014 GTCR (U.S.) Cision (Sweden) 174 1.3x 11.8x
02/04/2014 Renova Group (U.S.) Octo Telematics (Italy) 547 NA NA
01/23/2014 Lenovo U.S. (U.S.) IBM (x86 Server Hardware &
Maintenance Svcs. Business) (U.S.) 2,312 NA NA
01/08/2014 Marlin Equity Partners (U.S.) Compuware (Certain biz. units) (U.S.)
160 NA NA
01/06/2014 Convergys (U.S.) Stream Global Services (U.S.) 820 0.8x 7.2x
U.S. IT Services & Business Services M&A Deal Volume by Size
Q1 2014 Q1 2013 Q4 2013
$ in millions except # Number of
Deals
Total Deal
Value
Number of
Deals
Total Deal
Value
Number of
Deals
Total Deal
Value
< $50M 9 124 15 294 17 231
$50M to $100M NA NA 2 139 4 317
$100M to $250M 3 485 3 563 3 500
$250M to $500M NA NA 1 272 1 403
$500M to $1000M 1 820 NA NA 1 525
> $1B 1 2,312 NA NA NA NA
Undisclosed 175 NA 152 NA 118 NA
Total 189 3,741 173 1,268 144 1,975
7
IT Services & Business Services Sector M&A Review (Cont.)
Review of Selected IT Services & Business Services Transactions in Q1
Lenovo acquired IBM’s x86 Server Hardware & Maintenance Services Business for $2.3B EV.
Acquisition strengthens Lenovo's position in low-end servers and increases Lenovo’s share in the overall
server market from 2% to 14%
Divestiture of hardware business allows IBM the flexibility to focus on new strategic areas of its business,
including systems and software innovations for cognitive computing, Big Data and Cloud
Headquartered in Armonk, NY, IBM manufactures and markets computer hardware and software and offers
infrastructure, hosting and consulting services in products and services ranging from mainframe computers to
nanotechnology. IBM’s x86 Server Hardware & Maintenance Services Business’ products includes System X,
BladeCenter and Flex System blade servers and switches, iDataPlex servers and associated software for blade
networking and maintenance operations.
Convergys acquired Stream Global Services for $820M EV, which implied 0.83x LTM Revenue and
7.2x LTM EBITDA.
Acquisition expands and diversifies Convergys’ client base, while Stream’s technical support services
expertise provides new opportunities to offer Convergys’ suite of capabilities to a broader set of clients
Stream extends Convergys’ global reach, breadth of languages and service capabilities by integrating
Stream’s delivery capacity in the Americas, Europe, Asia-Pacific, Middle East and Africa
Headquartered in Eagan, MN, Stream Global Services is a leading global business process outsourcing provider
specializing in customer relationship management, customer care, technical support, and sales for Fortune 1000 clients
across major industry verticals. Stream is a trusted partner to some of the world’s leading technology, computing,
telecom, retail, entertainment & media and financial services institutions. Stream’s service programs are delivered
through a set of standardized best practices and sophisticated technologies by a highly-skilled multilingual workforce
of over 40,000 employees located in 56 service centers worldwide. The Company, founded in 2007, had LTM revenue
of $984 million.
Renova acquired Octo Telematics for $547M EV.
Acquisition provides an entry point for Octo Telematics’ technologies into the underserved Russian
market, offering significant synergies in collaboration with the Russian satellite system GLONASS
As a result of the acquisition, Octo Telematics enables Renova to further establish and grow its client list
with eight out of the world’s ten largest car insurers as clients
Based in Italy, Octo Telematics provides telematics services and applications for insurance companies, car rental
agencies, fleet management centers, motor manufacturers and government clients in Italy and internationally. The
Company’s solutions serve the entire lifecycle of insurance telematics needs, from the design and system development
to implementation and management. Octo Telematics’ solutions provide actionable driving behavior insights, support
for the eCall emergency response system, stolen vehicle tracking and recovery, road charging, traffic analytics, as well
as crash alerts and data capture. As of 2012, the Company generated approximately $138 million in revenue.
Source: Company Press Releases, Equity Research, Industry Research and Online Publications.
Note: EV = Enterprise Value (Equity Value + Debt + Minority Interest – Cash and Cash Equivalents) and NTM = Next Twelve Months.

8
IT Services & Business Services Sector M&A Review (Cont.)
Seek Asia Investment acquired JobStreet and Agensi Pekerjaan for $525M EV.
Acquisition provides significant synergies with previous acquisition of JobsDB, a competing Asian online
employment business, to create a compelling, turn-key online employment marketplace in the Asian region
Combined entity of JobStreet and JobsDB serves the total Asian labor market of more than 140 million
people, 14x the size of Seek Asia Investment’s core, Australian market
JobStreet, based in Singapore, provides online recruitment services, human resource management and employment
agency and consulting services. The Company had 2013 revenue of approximately $2.6 million and employed over
500 employees worldwide.
Agensi Pekerjaan, based in Malaysia, provides temporary and contract staffing services, business process outsourcing
and consultancy services.
Sonda acquired CTIS Tecnologia for $206M EV, which implied 0.58x LTM Revenue.
Acquisition of CTIS Tecnologia expands Sonda’s highly-recurring customer base, increases Sonda’s
geographic coverage into Brazil and bolsters operations in Latin America’s largest IT market
Headquartered in Brazil, CTIS Tecnologia is an IT consultancy, systems integrator and technology vendor. CTIS'
offerings include CTIS IT Services, providing IT consulting solutions, CTIS Digital, providing service and
procurement solutions to big-box stores and CTIS Printing Center, offering high-volume graphics solutions for small
and medium-sized businesses. The highly-recurring revenue nature of CTIS’ business allows the Company to enjoy
long-term contracts with enterprise customers and cross-sell a wide variety of complementary systems integration
services and sales. CTIS Tecnologia, founded in 1983, generated 2013 revenue of approximately $358 million.
NeuStar acquired .CO Internet for $109M EV, which implied 5.2x LTM Revenue.
Combining .CO Internet’s innovative domain marketing capabilities with NeuStar’s distribution network
and technical resources broadens NeuStar’s registry services and the .co brand worldwide
Acquisition of .CO Internet expands NeuStar's registry services business, which maintains the .biz and .us
top-level domains and has been selected to provide services for up to 350 new domain extensions as a result
of ongoing global domain name expansion efforts
Based in Colombia, .CO Internet is the exclusive operator of the worldwide registry for Internet addresses with the
“.co” top-level domain. Since its global launch in 2010, “.co” has grown to more than 1.6 million Web addresses
registered by individuals and businesses in over 200 countries and territories worldwide. Prior to the sale transaction,
NeuStar had an existing partnership with .CO Internet to provide registry services and infrastructure support for .co
extensions, the top-level domain assigned to Colombia. .CO Internet, founded in 1996, had LTM revenue of $566.8M.
Camber acquired Avaya Government Solutions for $100M EV.
Acquisition provides Camber a highly diverse government marketplace business, an expanded set of skills
and capabilities and a larger catalog of contract vehicles for use throughout the Federal government
Acquisition expands the opportunities to support and grow the IT consulting services within Camber’s
organization, while supporting Avaya to streamline its focus on providing turn-key solutions to government
Located in Santa Clara, CA, Avaya Government Solutions provides high-end, full-lifecycle IT consulting to
government agencies. The Company’s solutions focus on developing and delivering software, network engineering
and program consulting services and secure collaboration tools, all within an enterprise-wide CMMI Level-3 certified
environment. Avaya Government provides support services to address the entire lifecycle of clients’ needs from
planning through implementation, operation, maintenance and ensuring the security of mission-critical systems.
Source: Company Press Releases, Equity Research, Industry Research and Online Publications. Note: EV = Enterprise Value (Equity Value + Debt + Minority Interest – Cash and Cash Equivalents) and NTM = Next Twelve Months.

9
IT Services & Business Services Sector M&A Review (Cont.)
ICF International acquired CityTech. Valuation was not disclosed.
A leading partner with Adobe, CityTech adds expertise to ICF's content management offerings and
strengthens ICF’s portfolio of integrated digital and interactive offerings for governments and enterprises
Based in Chicago, IL, CityTech provides digital interactive consultancy services specializing in enterprise applications
development, Web experience management, mobile application development, Cloud enablement, managed services
and customer experience management solutions. CityTech, founded in 2003, had 2013 revenues of approximately $16
million and employed about 100 professionals worldwide.
EnerNOC acquired Activation Energy. Valuation was not disclosed.
Acquisition provides EnerNOC an entry point into the Irish capacity market and further strengthens
EnerNOC's ability to deliver its full suite of energy intelligence software applications throughout Europe
Based in Ireland, Activation Energy provides energy services to a range of public, commercial and industrial energy
clients in Ireland. Activation Energy's demand response portfolio includes sites operated by Lisheen Mines, Castlecool
Cold Storage, Xerox and CIX. Activation Energy was the first company to launch a demand-side management service
in the Irish market and was a 2013 award winner at the annual Energy Show Awards hosted by the Sustainable Energy
Authority of Ireland.
Accenture acquired ClientHouse. Valuation was not disclosed.
Acquisition strengthens Accenture’s positioning as a leading, global provider of Salesforce and SaaS
implementation solutions, with particular geographic focus on Germany and Europe and specific industry
focus on leading companies in the life sciences, biotechnology and information technology industries
Headquartered in Germany, ClientHouse is a leading, independent provider of Salesforce and Veeva Systems
implementation services. The Company provides strategy and business process consulting services, Cloud and
customer relationship management integration solutions, including project management, requirements analysis,
solution design, configuration, user acceptance tests and system handover. In addition, ClientHouse specializes in
Force.com development, data migration and training and support services. The Company, founded in 2003, serves a
marquee client base including Bausch & Lomb, Allianz, Baxter, Avis, Mercedes-Benz, AstraZeneca, DHL, Pfizer,
Audi, Abbott Laboratories and Demandware.
Source: Company Press Releases, Equity Research, Industry Research and Online Publications. Note: EV = Enterprise Value (Equity Value + Debt + Minority Interest – Cash and Cash Equivalents) and NTM = Next Twelve Months.
10
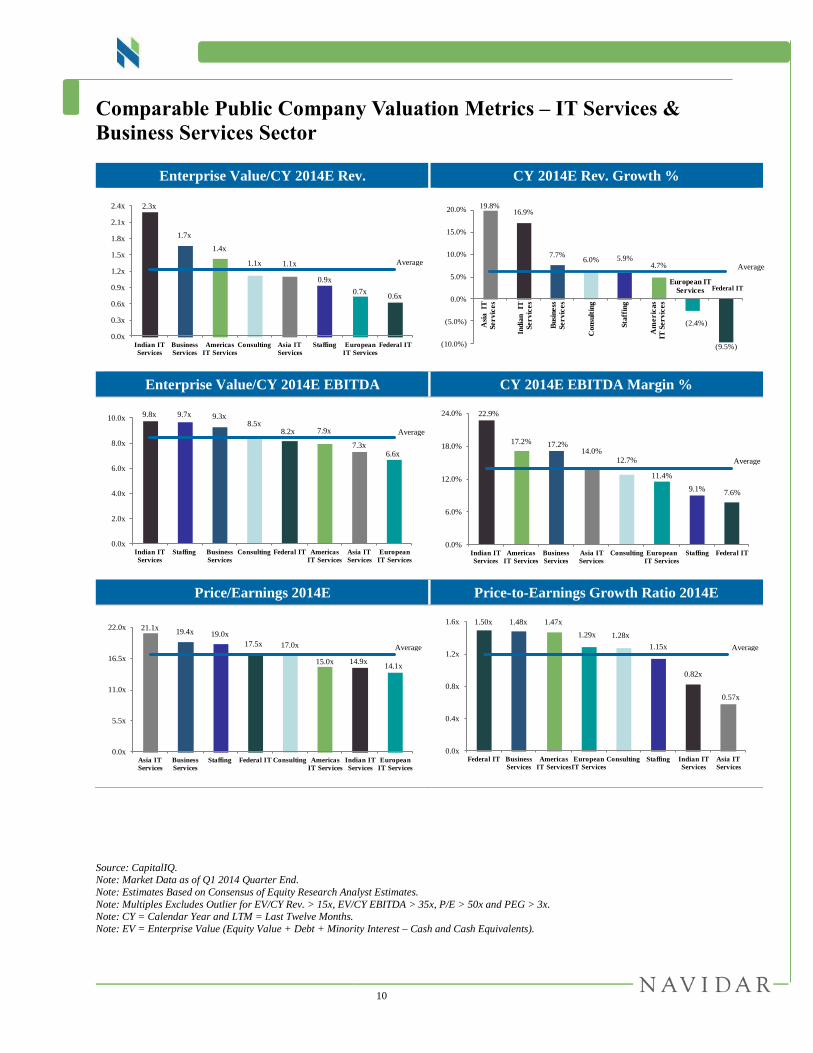
Comparable Public Company Valuation Metrics – IT Services &
Business Services Sector
Enterprise Value/CY 2014E Rev. CY 2014E Rev. Growth %
Enterprise Value/CY 2014E EBITDA CY 2014E EBITDA Margin %
Price/Earnings 2014E Price-to-Earnings Growth Ratio 2014E
Source: CapitalIQ. Note: Market Data as of Q1 2014 Quarter End.
Note: Estimates Based on Consensus of Equity Research Analyst Estimates.
Note: Multiples Excludes Outlier for EV/CY Rev. > 15x, EV/CY EBITDA > 35x, P/E > 50x and PEG > 3x. Note: CY = Calendar Year and LTM = Last Twelve Months.
Note: EV = Enterprise Value (Equity Value + Debt + Minority Interest – Cash and Cash Equivalents).
2.3x
1.7x
1.4x
1.1x 1.1x
0.9x
0.7x0.6x
0.0x
0.3x
0.6x
0.9x
1.2x
1.5x
1.8x
2.1x
2.4x
Indian IT
Services
Business
Services
Americas
IT Services
Consulting Asia IT
Services
Staffing European
IT Services
Federal IT
19.8%16.9%
7.7%6.0% 5.9%
4.7%
(2.4%)
(9.5%)(10.0%)
(5.0%)
0.0%
5.0%
10.0%
15.0%
20.0%
Asi
a
IT
Se
rv
ice
s
Ind
ian
IT
Se
rv
ice
s
Co
nsu
ltin
g
Am
er
ica
s
IT S
er
vic
es
Bu
sin
ess
Se
rv
ice
s
Sta
ffin
g
Federal ITEuropean IT
Services
9.8x 9.7x 9.3x8.5x
8.2x 7.9x
7.3x6.6x
0.0x
2.0x
4.0x
6.0x
8.0x
10.0x
Indian IT
Services
Staffing Business
Services
Consulting Federal IT Americas
IT Services
Asia IT
Services
European
IT Services
22.9%
17.2% 17.2%14.0%
12.7%
11.4%
9.1%7.6%
0.0%
6.0%
12.0%
18.0%
24.0%
Indian IT
Services
Americas
IT Services
Business
Services
Asia IT
Services
Consulting European
IT Services
Staffing Federal IT
21.1x19.4x 19.0x
17.5x 17.0x
15.0x 14.9x14.1x
0.0x
5.5x
11.0x
16.5x
22.0x
Asia IT
Services
Business
Services
Staffing Federal IT Consulting Americas
IT Services
Indian IT
Services
European
IT Services
1.50x 1.48x 1.47x
1.29x 1.28x
1.15x
0.82x
0.57x
0.0x
0.4x
0.8x
1.2x
1.6x
Federal IT Business
Services
Americas
IT Services
European
IT Services
Consulting Staffing Indian IT
Services
Asia IT
Services
Average
Average
Average
Average
Average
Average

11
Comparable Public Company Valuation Metrics – IT Services &
Business Services Sector (Cont.)
LTM Gross Margin % 5-Year Net Income Growth %
LTM Sales & Marketing Expense as a % of Revenue LTM G&A Expense as a % of Revenue
Source: CapitalIQ.
Note: Market Data as of Q1 2014 Quarter End. Note: Estimates Based on Consensus of Equity Research Analyst Estimates.
Note: Multiples Excludes Outlier for EV/CY Rev. > 15x, EV/CY EBITDA > 35x, P/E > 50x and PEG > 3x.
Note: CY = Calendar Year and LTM = Last Twelve Months.
34.6% 34.3% 33.8%30.9% 30.5%
27.1%
19.0% 17.8%
0.0%
7.0%
14.0%
21.0%
28.0%
35.0%
Indian IT
Services
Consulting Business
Services
Americas
IT Services
Asia IT
Services
Staffing European
IT Services
Federal IT
36.1%
18.4%17.9% 13.6% 13.5%
13.4%11.4%
7.9%
0.0%
8.0%
16.0%
24.0%
32.0%
40.0%
Asia IT
Services
Indian IT
Services
Staffing European
IT Services
Business
Services
Consulting Americas
IT Services
Federal IT
10.0%
7.4%
4.3%
3.8%
2.2%1.6%
1.1%
0.0%
2.0%
4.0%
6.0%
8.0%
10.0%
12.0%
Americas IT
Services
Asia IT
Services
European IT
Services
Staffing Business
Services
Indian IT
Services
Consulting
15.9%14.5%
10.0% 9.7%
7.3%5.1%
4.6%3.2%
0.0%
4.0%
8.0%
12.0%
16.0%
Asia IT
Services
Consulting Americas
IT Services
Staffing Federal IT European
IT Services
Business
Services
Indian IT
Services
Average
Average
Average
Average
12
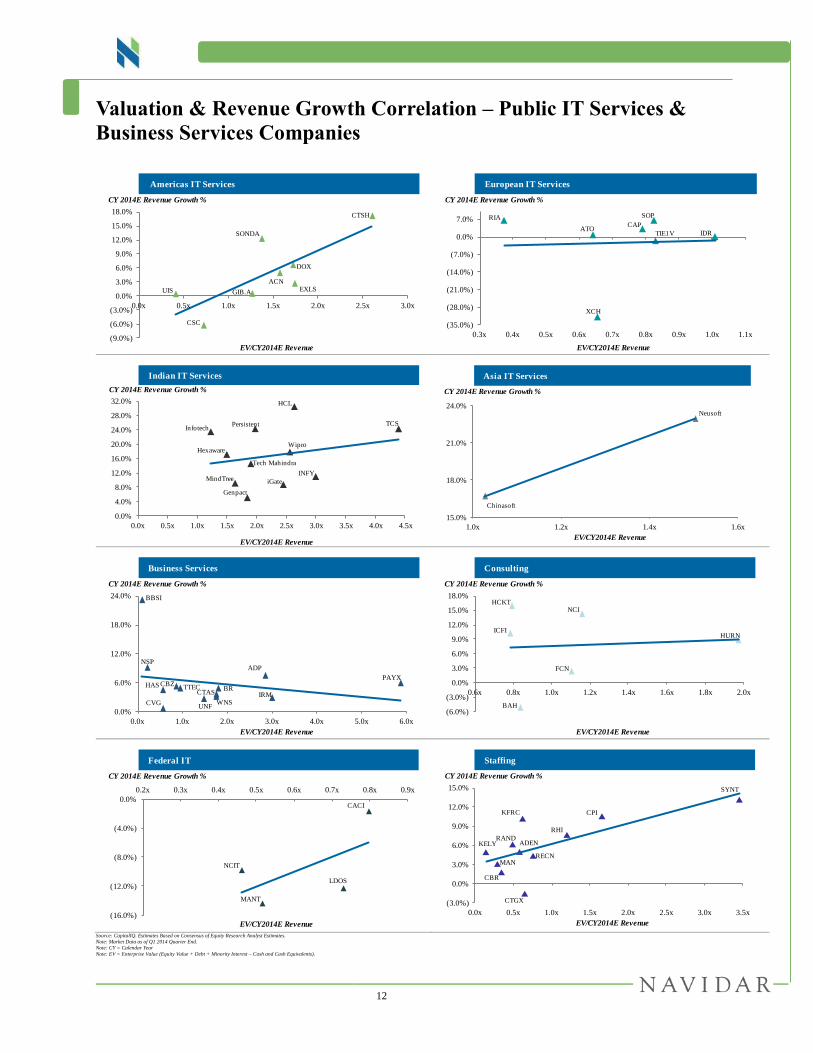
Valuation & Revenue Growth Correlation – Public IT Services &
Business Services Companies
Source: CapitalIQ. Estimates Based on Consensus of Equity Research Analyst Estimates.
Note: Market Data as of Q1 2014 Quarter End.
Note: CY = Calendar Year
Note: EV = Enterprise Value (Equity Value + Debt + Minority Interest – Cash and Cash Equivalents).
CTSH
EXLS
DOX
ACN
GIB.A
SONDA
CSC
UIS
(9.0%)
(6.0%)
(3.0%)
0.0%
3.0%
6.0%
9.0%
12.0%
15.0%
18.0%
0.0x 0.5x 1.0x 1.5x 2.0x 2.5x 3.0x
CY 2014E Revenue Growth %
EV/CY2014E Revenue
Americas IT Services
CAPATO
IDRTIE1V
SOPRIA
XCH
(35.0%)
(28.0%)
(21.0%)
(14.0%)
(7.0%)
0.0%
7.0%
0.3x 0.4x 0.5x 0.6x 0.7x 0.8x 0.9x 1.0x 1.1x
CY 2014E Revenue Growth %
EV/CY2014E Revenue
European IT Services
TCS
INFY
Wipro
HCL
Tech Mahindra
Genpact
iGate
Infotech
MindTree
Hexaware
Persistent
0.0%
4.0%
8.0%
12.0%
16.0%
20.0%
24.0%
28.0%
32.0%
0.0x 0.5x 1.0x 1.5x 2.0x 2.5x 3.0x 3.5x 4.0x 4.5x
CY 2014E Revenue Growth %
EV/CY2014E Revenue
Indian IT Services
Neusoft
Chinasoft
15.0%
18.0%
21.0%
24.0%
1.0x 1.2x 1.4x 1.6x
CY 2014E Revenue Growth %
EV/CY2014E Revenue
Asia IT Services
ADP
PAYX
IRMCTASBR
HAS
UNFCVG
TTEC
WNS
NSP
BBSI
CBZ
0.0%
6.0%
12.0%
18.0%
24.0%
0.0x 1.0x 2.0x 3.0x 4.0x 5.0x 6.0x
CY 2014E Revenue Growth %
EV/CY2014E Revenue
Business Services
BAH
FCN
HURN
NCI
ICFI
HCKT
(6.0%)
(3.0%)
0.0%
3.0%
6.0%
9.0%
12.0%
15.0%
18.0%
0.6x 0.8x 1.0x 1.2x 1.4x 1.6x 1.8x 2.0x
CY 2014E Revenue Growth %
EV/CY2014E Revenue
Consulting
LDOS
CACI
MANT
NCIT
(16.0%)
(12.0%)
(8.0%)
(4.0%)
0.0%
0.2x 0.3x 0.4x 0.5x 0.6x 0.7x 0.8x 0.9x
CY 2014E Revenue Growth %
EV/CY2014E Revenue
Federal IT
ADEN
CPI
RAND
RHI
MAN
SYNT
KELY
KFRC
RECN
CTGX
CBR
(3.0%)
0.0%
3.0%
6.0%
9.0%
12.0%
15.0%
0.0x 0.5x 1.0x 1.5x 2.0x 2.5x 3.0x 3.5x
CY 2014E Revenue Growth %
EV/CY2014E Revenue
Staffing

13
Appendix
14
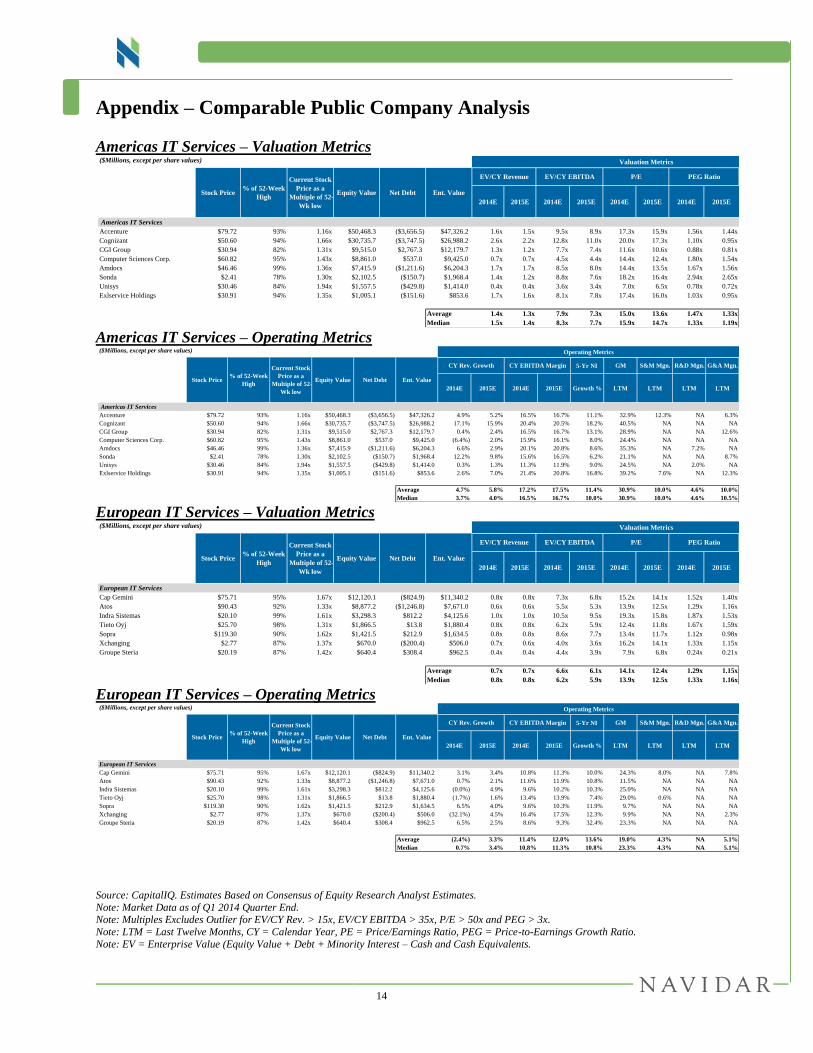
Appendix – Comparable Public Company Analysis
Americas IT Services – Valuation Metrics
Americas IT Services – Operating Metrics
European IT Services – Valuation Metrics
European IT Services – Operating Metrics
Source: CapitalIQ. Estimates Based on Consensus of Equity Research Analyst Estimates.
Note: Market Data as of Q1 2014 Quarter End. Note: Multiples Excludes Outlier for EV/CY Rev. > 15x, EV/CY EBITDA > 35x, P/E > 50x and PEG > 3x.
Note: LTM = Last Twelve Months, CY = Calendar Year, PE = Price/Earnings Ratio, PEG = Price-to-Earnings Growth Ratio.
Note: EV = Enterprise Value (Equity Value + Debt + Minority Interest – Cash and Cash Equivalents.
($Millions, except per share values) Valuation Metrics
2014E 2015E 2014E 2015E 2014E 2015E 2014E 2015E
Americas IT Services
Accenture $79.72 93% 1.16x $50,468.3 ($3,656.5) $47,326.2 1.6x 1.5x 9.5x 8.9x 17.3x 15.9x 1.56x 1.44x
Cognizant $50.60 94% 1.66x $30,735.7 ($3,747.5) $26,988.2 2.6x 2.2x 12.8x 11.0x 20.0x 17.3x 1.10x 0.95x
CGI Group $30.94 82% 1.31x $9,515.0 $2,767.3 $12,179.7 1.3x 1.2x 7.7x 7.4x 11.6x 10.6x 0.88x 0.81x
Computer Sciences Corp. $60.82 95% 1.43x $8,861.0 $537.0 $9,425.0 0.7x 0.7x 4.5x 4.4x 14.4x 12.4x 1.80x 1.54x
Amdocs $46.46 99% 1.36x $7,415.9 ($1,211.6) $6,204.3 1.7x 1.7x 8.5x 8.0x 14.4x 13.5x 1.67x 1.56x
Sonda $2.41 78% 1.30x $2,102.5 ($150.7) $1,968.4 1.4x 1.2x 8.8x 7.6x 18.2x 16.4x 2.94x 2.65x
Unisys $30.46 84% 1.94x $1,557.5 ($429.8) $1,414.0 0.4x 0.4x 3.6x 3.4x 7.0x 6.5x 0.78x 0.72x
Exlservice Holdings $30.91 94% 1.35x $1,005.1 ($151.6) $853.6 1.7x 1.6x 8.1x 7.8x 17.4x 16.0x 1.03x 0.95x
Average 1.4x 1.3x 7.9x 7.3x 15.0x 13.6x 1.47x 1.33x
Median 1.5x 1.4x 8.3x 7.7x 15.9x 14.7x 1.33x 1.19x
Stock Price% of 52-Week
High
Current Stock
Price as a
Multiple of 52-
Wk low
Equity Value Net Debt Ent. Value
EV/CY Revenue EV/CY EBITDA P/E PEG Ratio
($Millions, except per share values) Operating Metrics
5-Yr NI
2014E 2015E 2014E 2015E Growth % LTM LTM LTM LTM
Americas IT Services
Accenture $79.72 93% 1.16x $50,468.3 ($3,656.5) $47,326.2 4.9% 5.2% 16.5% 16.7% 11.1% 32.9% 12.3% NA 6.3%
Cognizant $50.60 94% 1.66x $30,735.7 ($3,747.5) $26,988.2 17.1% 15.9% 20.4% 20.5% 18.2% 40.5% NA NA NA
CGI Group $30.94 82% 1.31x $9,515.0 $2,767.3 $12,179.7 0.4% 2.4% 16.5% 16.7% 13.1% 28.9% NA NA 12.6%
Computer Sciences Corp. $60.82 95% 1.43x $8,861.0 $537.0 $9,425.0 (6.4%) 2.0% 15.9% 16.1% 8.0% 24.4% NA NA NA
Amdocs $46.46 99% 1.36x $7,415.9 ($1,211.6) $6,204.3 6.6% 2.9% 20.1% 20.8% 8.6% 35.3% NA 7.2% NA
Sonda $2.41 78% 1.30x $2,102.5 ($150.7) $1,968.4 12.2% 9.8% 15.6% 16.5% 6.2% 21.1% NA NA 8.7%
Unisys $30.46 84% 1.94x $1,557.5 ($429.8) $1,414.0 0.3% 1.3% 11.3% 11.9% 9.0% 24.5% NA 2.0% NA
Exlservice Holdings $30.91 94% 1.35x $1,005.1 ($151.6) $853.6 2.6% 7.0% 21.4% 20.8% 16.8% 39.2% 7.6% NA 12.3%
Average 4.7% 5.8% 17.2% 17.5% 11.4% 30.9% 10.0% 4.6% 10.0%
Median 3.7% 4.0% 16.5% 16.7% 10.0% 30.9% 10.0% 4.6% 10.5%
CY Rev. Growth CY EBITDA Margin
Stock Price% of 52-Week
High
Current Stock
Price as a
Multiple of 52-
Wk low
Equity Value Net Debt Ent. Value
GM S&M Mgn. R&D Mgn. G&A Mgn.
($Millions, except per share values) Valuation Metrics
2014E 2015E 2014E 2015E 2014E 2015E 2014E 2015E
European IT Services
Cap Gemini $75.71 95% 1.67x $12,120.1 ($824.9) $11,340.2 0.8x 0.8x 7.3x 6.8x 15.2x 14.1x 1.52x 1.40x
Atos $90.43 92% 1.33x $8,877.2 ($1,246.8) $7,671.0 0.6x 0.6x 5.5x 5.3x 13.9x 12.5x 1.29x 1.16x
Indra Sistemas $20.10 99% 1.61x $3,298.3 $812.2 $4,125.6 1.0x 1.0x 10.5x 9.5x 19.3x 15.8x 1.87x 1.53x
Tieto Oyj $25.70 98% 1.31x $1,866.5 $13.8 $1,880.4 0.8x 0.8x 6.2x 5.9x 12.4x 11.8x 1.67x 1.59x
Sopra $119.30 90% 1.62x $1,421.5 $212.9 $1,634.5 0.8x 0.8x 8.6x 7.7x 13.4x 11.7x 1.12x 0.98x
Xchanging $2.77 87% 1.37x $670.0 ($200.4) $506.0 0.7x 0.6x 4.0x 3.6x 16.2x 14.1x 1.33x 1.15x
Groupe Steria $20.19 87% 1.42x $640.4 $308.4 $962.5 0.4x 0.4x 4.4x 3.9x 7.9x 6.8x 0.24x 0.21x
Average 0.7x 0.7x 6.6x 6.1x 14.1x 12.4x 1.29x 1.15x
Median 0.8x 0.8x 6.2x 5.9x 13.9x 12.5x 1.33x 1.16x
Stock Price% of 52-Week
High
Current Stock
Price as a
Multiple of 52-
Wk low
Equity Value Net Debt Ent. Value
EV/CY Revenue EV/CY EBITDA P/E PEG Ratio
($Millions, except per share values) Operating Metrics
5-Yr NI
2014E 2015E 2014E 2015E Growth % LTM LTM LTM LTM
European IT Services
Cap Gemini $75.71 95% 1.67x $12,120.1 ($824.9) $11,340.2 3.1% 3.4% 10.8% 11.3% 10.0% 24.3% 8.0% NA 7.8%
Atos $90.43 92% 1.33x $8,877.2 ($1,246.8) $7,671.0 0.7% 2.1% 11.6% 11.9% 10.8% 11.5% NA NA NA
Indra Sistemas $20.10 99% 1.61x $3,298.3 $812.2 $4,125.6 (0.0%) 4.9% 9.6% 10.2% 10.3% 25.0% NA NA NA
Tieto Oyj $25.70 98% 1.31x $1,866.5 $13.8 $1,880.4 (1.7%) 1.6% 13.4% 13.9% 7.4% 29.0% 0.6% NA NA
Sopra $119.30 90% 1.62x $1,421.5 $212.9 $1,634.5 6.5% 4.0% 9.6% 10.3% 11.9% 9.7% NA NA NA
Xchanging $2.77 87% 1.37x $670.0 ($200.4) $506.0 (32.1%) 4.5% 16.4% 17.5% 12.3% 9.9% NA NA 2.3%
Groupe Steria $20.19 87% 1.42x $640.4 $308.4 $962.5 6.5% 2.5% 8.6% 9.3% 32.4% 23.3% NA NA NA
Average (2.4%) 3.3% 11.4% 12.0% 13.6% 19.0% 4.3% NA 5.1%
Median 0.7% 3.4% 10.8% 11.3% 10.8% 23.3% 4.3% NA 5.1%
CY Rev. Growth CY EBITDA Margin
Stock Price% of 52-Week
High
Current Stock
Price as a
Multiple of 52-
Wk low
Equity Value Net Debt Ent. Value
GM S&M Mgn. R&D Mgn. G&A Mgn.

15
Appendix – Comparable Public Company Analysis (Cont.)
Indian IT Services – Valuation Metrics
Indian IT Services – Operating Metrics
Source: CapitalIQ. Estimates Based on Consensus of Equity Research Analyst Estimates. Note: Market Data as of Q1 2014 Quarter End.
Note: Multiples Excludes Outlier for EV/CY Rev. > 15x, EV/CY EBITDA > 35x, P/E > 50x and PEG > 3x.
Note: LTM = Last Twelve Months, CY = Calendar Year, PE = Price/Earnings Ratio, PEG = Price-to-Earnings Growth Ratio. Note: EV = Enterprise Value (Equity Value + Debt + Minority Interest – Cash and Cash Equivalents).
(1) CY Revenue Growth and EV/CY Revenue Multiple Adjusted for Acquisitions.
($Millions, except per share values) Valuation Metrics
2014E 2015E 2014E 2015E 2014E 2015E 2014E 2015E
Indian IT Services
Tata Consultancy Services $35.52 89% 1.56x $69,570.5 ($1,926.9) $67,710.0 4.4x 3.8x 14.9x 13.2x 19.3x 16.7x 0.81x 0.70x
Infosys $54.72 85% 1.50x $31,267.4 ($4,236.0) $26,896.7 3.0x 2.7x 11.1x 9.7x 15.8x 13.8x 1.13x 0.99x
Wipro $9.06 89% 1.72x $22,182.8 ($2,026.9) $20,113.2 2.6x 2.4x 11.2x 10.4x 15.7x 13.3x 0.97x 0.83x
HCL Technologies $23.21 88% 2.06x $16,230.8 ($861.3) $15,342.2 2.6x 2.4x 10.6x 9.9x 15.3x 13.7x 0.59x 0.53x
Tech Mahindra (1)
$29.95 93% 2.00x $6,992.3 ($524.2) $6,473.3 1.9x 1.7x 8.7x 7.8x 14.2x 11.6x 0.68x 0.56x
Genpact $17.42 82% 1.27x $4,037.7 $86.8 $4,125.8 1.8x 1.7x 10.8x 9.5x 17.2x 15.6x 1.25x 1.12x
iGATE $31.54 76% 2.26x $1,852.7 $795.8 $3,063.7 2.4x 2.2x 10.5x 9.0x 16.4x 13.0x 1.13x 0.90x
MphasiS $6.74 79% 1.18x $1,417.3 ($257.8) $1,147.5 NM NM NM NM NM NM NM NM
MindTree $22.01 76% 1.68x $916.5 ($102.1) $811.1 1.6x 1.2x 8.4x 6.2x 11.5x 9.7x 0.53x 0.44x
Hexaware Technologies $2.51 90% 2.08x $754.4 ($103.3) $647.8 1.5x 1.3x 7.0x 6.6x 11.4x 10.2x 0.75x 0.67x
Persistent Systems $17.48 86% 2.20x $699.4 ($78.8) $618.1 2.0x 1.7x 7.8x 6.3x 14.8x 11.5x 0.66x 0.52x
Infotech Enterprises $5.46 84% 2.08x $611.0 ($99.1) $508.8 1.2x 1.1x 6.4x 5.6x 12.0x 9.5x 0.55x 0.43x
Average 2.3x 2.0x 9.8x 8.6x 14.9x 12.6x 0.82x 0.70x
Median 2.0x 1.7x 10.5x 9.0x 15.3x 13.0x 0.75x 0.67x
Stock Price% of 52-Week
High
Current Stock
Price as a
Multiple of 52-
Wk low
Equity Value Net Debt Ent. Value
EV/CY Revenue EV/CY EBITDA P/E PEG Ratio
($Millions, except per share values) Operating Metrics
5-Yr NI
2014E 2015E 2014E 2015E Growth % LTM LTM LTM LTM
Indian IT Services
Tata Consultancy Services $35.52 89% 1.56x $69,570.5 ($1,926.9) $67,710.0 24.3% 14.9% 29.5% 28.9% 23.8% 38.3% 0.1% NA 2.3%
Infosys $54.72 85% 1.50x $31,267.4 ($4,236.0) $26,896.7 11.0% 9.6% 26.9% 28.0% 14.0% 34.6% 5.2% NA 5.6%
Wipro $9.06 89% 1.72x $22,182.8 ($2,026.9) $20,113.2 17.8% 7.2% 22.8% 23.0% 16.1% 31.3% 6.9% NA 5.5%
HCL Technologies $23.21 88% 2.06x $16,230.8 ($861.3) $15,342.2 30.5% 11.9% 24.8% 23.9% 25.9% 35.5% 0.1% NA 2.3%
Tech Mahindra (1)
$29.95 93% 2.00x $6,992.3 ($524.2) $6,473.3 14.6% 10.4% 21.9% 22.2% 20.8% 37.8% 0.1% NA 1.3%
Genpact $17.42 82% 1.27x $4,037.7 $86.8 $4,125.8 5.0% 8.5% 17.1% 17.9% 13.8% 38.1% NA NA NA
iGATE $31.54 76% 2.26x $1,852.7 $795.8 $3,063.7 8.7% 9.1% 23.2% 25.0% 14.5% 39.3% 0.6% NA NA
MphasiS $6.74 79% 1.18x $1,417.3 ($257.8) $1,147.5 NM NA NA NA 10.3% 30.0% NA NA 4.3%
MindTree $22.01 76% 1.68x $916.5 ($102.1) $811.1 9.1% 33.0% 19.5% 19.9% 21.9% 36.2% NA NA NA
Hexaware Technologies $2.51 90% 2.08x $754.4 ($103.3) $647.8 17.1% 11.9% 21.4% 20.1% 15.2% 30.7% 0.1% NA 2.1%
Persistent Systems $17.48 86% 2.20x $699.4 ($78.8) $618.1 24.9% 18.8% 25.3% 26.2% 22.3% 34.4% 0.3% NA 2.1%
Infotech Enterprises $5.46 84% 2.08x $611.0 ($99.1) $508.8 23.5% 15.0% 19.1% 19.1% 21.9% 29.6% 0.6% NA 3.4%
Average 17.0% 13.7% 22.9% 23.1% 18.4% 34.6% 1.6% NA 3.2%
Median 17.1% 11.9% 22.8% 23.0% 18.5% 35.1% 0.3% NA 2.3%
CY Rev. Growth CY EBITDA Margin
Stock Price% of 52-Week
High
Current Stock
Price as a
Multiple of 52-
Wk low
Equity Value Net Debt Ent. Value
GM S&M Mgn. R&D Mgn. G&A Mgn.

16
Appendix – Comparable Public Company Analysis (Cont.)
Asia IT Services – Valuation Metrics
Asia IT Services – Operating Metrics
Source: CapitalIQ. Estimates Based on Consensus of Equity Research Analyst Estimates.
Note: Market Data as of Q1 2014 Quarter End. Note: Multiples Excludes Outlier for EV/CY Rev. > 15x, EV/CY EBITDA > 35x, P/E > 50x and PEG > 3x.
Note: LTM = Last Twelve Months, CY = Calendar Year, PE = Price/Earnings Ratio, PEG = Price-to-Earnings Growth Ratio.
Note: EV = Enterprise Value (Equity Value + Debt + Minority Interest – Cash and Cash Equivalents).
($Millions, except per share values) Valuation Metrics
2014E 2015E 2014E 2015E 2014E 2015E 2014E 2015E
Asia IT Services
Neusoft $1.98 67% 1.66x $2,424.9 ($183.4) $2,276.2 1.5x 1.3x NM NM 22.3x 16.7x 0.59x 0.44x
Chinasoft International $0.32 77% 1.49x $593.8 $11.9 $634.2 1.0x 0.9x 7.3x 6.4x 18.9x 15.5x 0.55x 0.45x
iSoftStone Holdings $5.06 91% 1.22x $294.7 $73.4 $375.4 0.7x NM NM NM 22.0x NM NM NM
Average 1.1x 1.1x 7.3x 6.4x 21.1x 16.1x 0.57x 0.45x
Median 1.0x 1.1x 7.3x 6.4x 22.0x 16.1x 0.57x 0.45x
Stock Price% of 52-Week
High
Current Stock
Price as a
Multiple of 52-
Wk low
Equity Value Net Debt Ent. Value
EV/CY Revenue EV/CY EBITDA P/E PEG Ratio
($Millions, except per share values) Operating Metrics
5-Yr NI
2014E 2015E 2014E 2015E Growth % LTM LTM LTM LTM
Asia IT Services
Neusoft $1.98 67% 1.66x $2,424.9 ($183.4) $2,276.2 22.9% 20.3% NA NA 38.0% 28.7% 8.7% NA 14.5%
Chinasoft International $0.32 77% 1.49x $593.8 $11.9 $634.2 16.7% 17.9% 14.0% 13.5% 34.2% 31.4% 5.5% 1.6% 16.0%
iSoftStone Holdings $5.06 91% 1.22x $294.7 $73.4 $375.4 NA NM NA NA NM 31.4% 8.0% 1.5% 17.3%
Average 19.8% 19.1% 14.0% 13.5% 36.1% 30.5% 7.4% 1.6% 15.9%
Median 19.8% 19.1% 14.0% 13.5% 36.1% 31.4% 8.0% 1.6% 16.0%
CY Rev. Growth CY EBITDA Margin
Stock Price% of 52-Week
High
Current Stock
Price as a
Multiple of 52-
Wk low
Equity Value Net Debt Ent. Value
GM S&M Mgn. R&D Mgn. G&A Mgn.
17
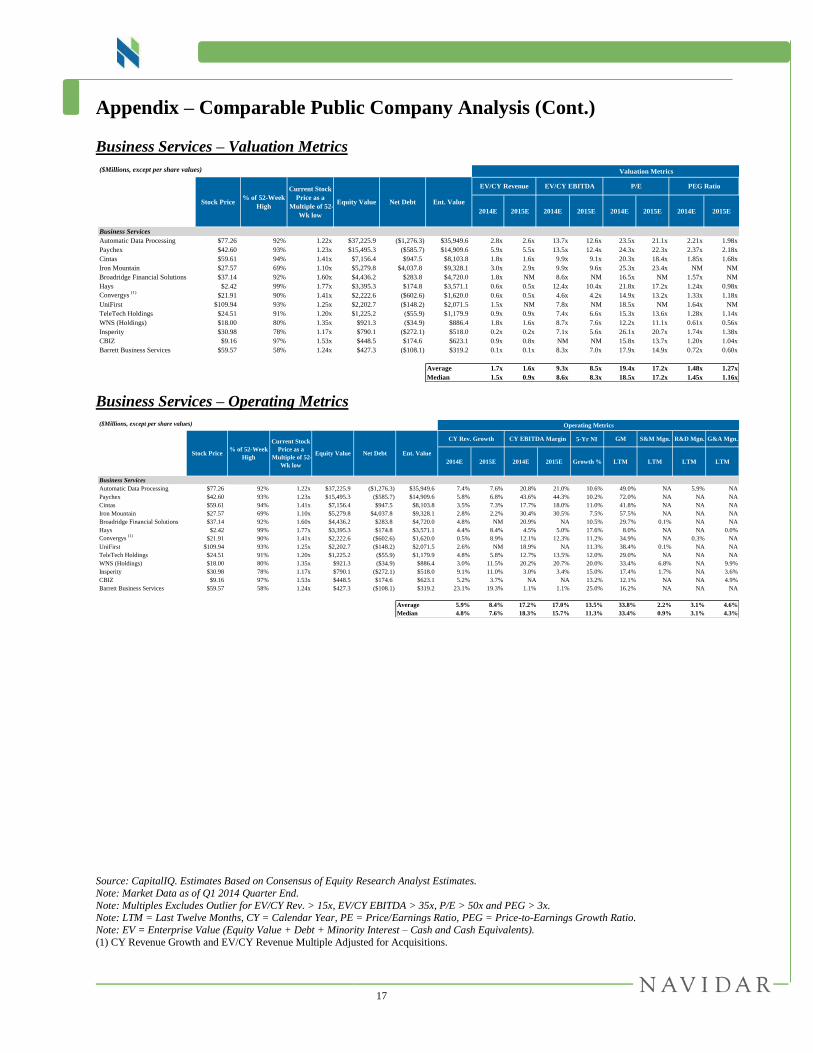
Appendix – Comparable Public Company Analysis (Cont.)
Business Services – Valuation Metrics
Business Services – Operating Metrics
Source: CapitalIQ. Estimates Based on Consensus of Equity Research Analyst Estimates.
Note: Market Data as of Q1 2014 Quarter End.
Note: Multiples Excludes Outlier for EV/CY Rev. > 15x, EV/CY EBITDA > 35x, P/E > 50x and PEG > 3x. Note: LTM = Last Twelve Months, CY = Calendar Year, PE = Price/Earnings Ratio, PEG = Price-to-Earnings Growth Ratio.
Note: EV = Enterprise Value (Equity Value + Debt + Minority Interest – Cash and Cash Equivalents).
(1) CY Revenue Growth and EV/CY Revenue Multiple Adjusted for Acquisitions.
($Millions, except per share values) Valuation Metrics
2014E 2015E 2014E 2015E 2014E 2015E 2014E 2015E
Business Services
Automatic Data Processing $77.26 92% 1.22x $37,225.9 ($1,276.3) $35,949.6 2.8x 2.6x 13.7x 12.6x 23.5x 21.1x 2.21x 1.98x
Paychex $42.60 93% 1.23x $15,495.3 ($585.7) $14,909.6 5.9x 5.5x 13.5x 12.4x 24.3x 22.3x 2.37x 2.18x
Cintas $59.61 94% 1.41x $7,156.4 $947.5 $8,103.8 1.8x 1.6x 9.9x 9.1x 20.3x 18.4x 1.85x 1.68x
Iron Mountain $27.57 69% 1.10x $5,279.8 $4,037.8 $9,328.1 3.0x 2.9x 9.9x 9.6x 25.3x 23.4x NM NM
Broadridge Financial Solutions $37.14 92% 1.60x $4,436.2 $283.8 $4,720.0 1.8x NM 8.6x NM 16.5x NM 1.57x NM
Hays $2.42 99% 1.77x $3,395.3 $174.8 $3,571.1 0.6x 0.5x 12.4x 10.4x 21.8x 17.2x 1.24x 0.98x
Convergys (1)
$21.91 90% 1.41x $2,222.6 ($602.6) $1,620.0 0.6x 0.5x 4.6x 4.2x 14.9x 13.2x 1.33x 1.18x
UniFirst $109.94 93% 1.25x $2,202.7 ($148.2) $2,071.5 1.5x NM 7.8x NM 18.5x NM 1.64x NM
TeleTech Holdings $24.51 91% 1.20x $1,225.2 ($55.9) $1,179.9 0.9x 0.9x 7.4x 6.6x 15.3x 13.6x 1.28x 1.14x
WNS (Holdings) $18.00 80% 1.35x $921.3 ($34.9) $886.4 1.8x 1.6x 8.7x 7.6x 12.2x 11.1x 0.61x 0.56x
Insperity $30.98 78% 1.17x $790.1 ($272.1) $518.0 0.2x 0.2x 7.1x 5.6x 26.1x 20.7x 1.74x 1.38x
CBIZ $9.16 97% 1.53x $448.5 $174.6 $623.1 0.9x 0.8x NM NM 15.8x 13.7x 1.20x 1.04x
Barrett Business Services $59.57 58% 1.24x $427.3 ($108.1) $319.2 0.1x 0.1x 8.3x 7.0x 17.9x 14.9x 0.72x 0.60x
Average 1.7x 1.6x 9.3x 8.5x 19.4x 17.2x 1.48x 1.27x
Median 1.5x 0.9x 8.6x 8.3x 18.5x 17.2x 1.45x 1.16x
Stock Price% of 52-Week
High
Current Stock
Price as a
Multiple of 52-
Wk low
Equity Value Net Debt Ent. Value
EV/CY Revenue EV/CY EBITDA P/E PEG Ratio
($Millions, except per share values) Operating Metrics
5-Yr NI
2014E 2015E 2014E 2015E Growth % LTM LTM LTM LTM
Business Services
Automatic Data Processing $77.26 92% 1.22x $37,225.9 ($1,276.3) $35,949.6 7.4% 7.6% 20.8% 21.0% 10.6% 49.0% NA 5.9% NA
Paychex $42.60 93% 1.23x $15,495.3 ($585.7) $14,909.6 5.8% 6.8% 43.6% 44.3% 10.2% 72.0% NA NA NA
Cintas $59.61 94% 1.41x $7,156.4 $947.5 $8,103.8 3.5% 7.3% 17.7% 18.0% 11.0% 41.8% NA NA NA
Iron Mountain $27.57 69% 1.10x $5,279.8 $4,037.8 $9,328.1 2.8% 2.2% 30.4% 30.5% 7.5% 57.5% NA NA NA
Broadridge Financial Solutions $37.14 92% 1.60x $4,436.2 $283.8 $4,720.0 4.8% NM 20.9% NA 10.5% 29.7% 0.1% NA NA
Hays $2.42 99% 1.77x $3,395.3 $174.8 $3,571.1 4.4% 8.4% 4.5% 5.0% 17.6% 8.0% NA NA 0.0%
Convergys (1)
$21.91 90% 1.41x $2,222.6 ($602.6) $1,620.0 0.5% 8.9% 12.1% 12.3% 11.2% 34.9% NA 0.3% NA
UniFirst $109.94 93% 1.25x $2,202.7 ($148.2) $2,071.5 2.6% NM 18.9% NA 11.3% 38.4% 0.1% NA NA
TeleTech Holdings $24.51 91% 1.20x $1,225.2 ($55.9) $1,179.9 4.8% 5.8% 12.7% 13.5% 12.0% 29.0% NA NA NA
WNS (Holdings) $18.00 80% 1.35x $921.3 ($34.9) $886.4 3.0% 11.5% 20.2% 20.7% 20.0% 33.4% 6.8% NA 9.9%
Insperity $30.98 78% 1.17x $790.1 ($272.1) $518.0 9.1% 11.0% 3.0% 3.4% 15.0% 17.4% 1.7% NA 3.6%
CBIZ $9.16 97% 1.53x $448.5 $174.6 $623.1 5.2% 3.7% NA NA 13.2% 12.1% NA NA 4.9%
Barrett Business Services $59.57 58% 1.24x $427.3 ($108.1) $319.2 23.1% 19.3% 1.1% 1.1% 25.0% 16.2% NA NA NA
Average 5.9% 8.4% 17.2% 17.0% 13.5% 33.8% 2.2% 3.1% 4.6%
Median 4.8% 7.6% 18.3% 15.7% 11.3% 33.4% 0.9% 3.1% 4.3%
CY Rev. Growth CY EBITDA Margin
Stock Price% of 52-Week
High
Current Stock
Price as a
Multiple of 52-
Wk low
Equity Value Net Debt Ent. Value
GM S&M Mgn. R&D Mgn. G&A Mgn.

18
Appendix – Comparable Public Company Analysis (Cont.)
Consulting – Valuation Metrics
Consulting – Operating Metrics
Federal IT – Valuation Metrics
Federal IT – Operating Metrics
Source: CapitalIQ. Estimates Based on Consensus of Equity Research Analyst Estimates.
Note: Market Data as of Q1 2014 Quarter End. Note: Multiples Excludes Outlier for EV/CY Rev. > 15x, EV/CY EBITDA > 35x, P/E > 50x and PEG > 3x.
Note: LTM = Last Twelve Months, CY = Calendar Year, PE = Price/Earnings Ratio, PEG = Price-to-Earnings Growth Ratio.
Note: EV = Enterprise Value (Equity Value + Debt + Minority Interest – Cash and Cash Equivalents). (1) CY Revenue Growth and EV/CY Revenue Multiple Adjusted for Acquisitions.
($Millions, except per share values) Valuation Metrics
2014E 2015E 2014E 2015E 2014E 2015E 2014E 2015E
Consulting
Booz Allen Hamilton Holding $22.00 98% 1.74x $3,178.8 $1,271.3 $4,450.2 0.8x 0.8x 8.8x 8.5x 14.7x 14.3x 1.47x 1.43x
Huron Consulting Group $63.38 90% 1.64x $1,435.4 $111.5 $1,546.9 2.0x 1.9x 10.4x 9.4x 20.1x 18.1x 1.55x 1.39x
FTI Consulting $33.34 71% 1.18x $1,354.8 $507.9 $1,862.7 1.1x 1.1x 8.7x 8.0x 18.7x 16.3x 1.30x 1.14x
Navigant Consulting $18.66 94% 1.71x $915.7 $55.1 $970.8 1.2x 1.1x 7.8x 7.4x 17.0x 15.3x 1.13x 1.02x
ICF International $39.81 90% 1.60x $787.2 $31.0 $818.2 0.8x 0.7x 8.1x 7.4x 17.1x 15.6x 1.28x 1.17x
The Hackett Group $5.98 80% 1.35x $182.9 $0.8 $183.7 0.8x 0.7x 7.4x 6.0x 14.2x 11.3x 0.95x 0.75x
Average 1.1x 1.1x 8.5x 7.8x 17.0x 15.2x 1.28x 1.15x
Median 1.0x 0.9x 8.4x 7.7x 17.0x 15.4x 1.29x 1.15x
Stock Price% of 52-Week
High
Current Stock
Price as a
Multiple of 52-
Wk low
Equity Value Net Debt Ent. Value
EV/CY Revenue EV/CY EBITDA P/E PEG Ratio
($Millions, except per share values) Operating Metrics
5-Yr NI
2014E 2015E 2014E 2015E Growth % LTM LTM LTM LTM
Consulting
Booz Allen Hamilton Holding $22.00 98% 1.74x $3,178.8 $1,271.3 $4,450.2 (5.3%) 0.5% 9.5% 9.8% 10.0% 23.6% NA NA 11.7%
Huron Consulting Group $63.38 90% 1.64x $1,435.4 $111.5 $1,546.9 8.8% 6.6% 19.0% 19.7% 13.0% 38.4% 0.9% NA NA
FTI Consulting $33.34 71% 1.18x $1,354.8 $507.9 $1,862.7 2.3% 3.4% 12.7% 13.4% 14.3% 36.9% 1.3% NA NA
Navigant Consulting $18.66 94% 1.71x $915.7 $55.1 $970.8 14.2% 6.1% 14.8% 14.8% 15.0% 34.1% NA NA 17.3%
ICF International $39.81 90% 1.60x $787.2 $31.0 $818.2 10.2% 5.3% 9.7% 10.1% 13.3% 37.7% NA NA NA
The Hackett Group $5.98 80% 1.35x $182.9 $0.8 $183.7 15.9% 6.3% 10.7% 12.4% 15.0% 34.9% NA NA NA
Average 7.7% 4.7% 12.7% 13.3% 13.4% 34.3% 1.1% NA 14.5%
Median 9.5% 5.7% 11.7% 12.9% 13.8% 35.9% 1.1% NA 14.5%
CY Rev. Growth CY EBITDA Margin
Stock Price% of 52-Week
High
Current Stock
Price as a
Multiple of 52-
Wk low
Equity Value Net Debt Ent. Value
GM S&M Mgn. R&D Mgn. G&A Mgn.
($Millions, except per share values) Valuation Metrics Operating Metrics
2014E 2015E 2014E 2015E 2014E 2015E 2014E 2015E
Federal IT
Leidos Holdings $35.37 55% 1.04x $2,796.7 $903.0 $3,699.7 0.7x 0.7x 8.4x 8.1x 14.7x 13.9x 1.84x 1.74x
CACI International (1)
$73.80 91% 1.37x $1,731.7 $1,354.5 $3,088.2 0.8x 0.8x 8.4x 8.4x 12.5x 12.3x 1.16x 1.15x
ManTech International $29.41 95% 1.23x $1,089.4 ($69.0) $1,020.4 0.5x 0.5x 7.4x 7.2x 19.6x 17.3x NM 2.66x
NCI $10.63 81% 2.59x $137.4 $1.0 $138.3 0.5x 0.4x 8.4x 8.0x 23.1x 20.4x NM NM
Average 0.6x 0.6x 8.2x 7.9x 17.5x 16.0x 1.50x 1.85x
Median 0.6x 0.6x 8.4x 8.0x 17.2x 15.6x 1.50x 1.74x
Stock Price% of 52-
Week High
Current
Stock Price
as a Multiple
of 52-Wk low
Equity Value Net Debt Ent. Value
EV/CY Revenue EV/CY EBITDA P/E PEG Ratio
($Millions, except per share values) Operating Metrics
5-Yr NI
2014E 2015E 2014E 2015E Growth % LTM LTM LTM LTM
Federal IT
Leidos Holdings $35.37 55% 1.04x $2,796.7 $903.0 $3,699.7 (12.2%) (0.2%) 8.6% 9.0% 8.0% 13.3% NA NA NA
CACI International (1)
$73.80 91% 1.37x $1,731.7 $1,354.5 $3,088.2 (1.6%) (1.2%) 9.5% 9.7% 10.8% 31.3% NA NA NA
ManTech International $29.41 95% 1.23x $1,089.4 ($69.0) $1,020.4 (14.3%) (1.9%) 7.0% 7.3% 6.5% 13.6% NA NA 7.5%
NCI $10.63 81% 2.59x $137.4 $1.0 $138.3 (9.7%) 3.6% 5.5% 5.6% 6.5% 12.9% NA NA 7.0%
Average (9.5%) 0.1% 7.6% 7.9% 7.9% 17.8% NA NA 7.3%
Median (11.0%) (0.7%) 7.8% 8.1% 7.3% 13.4% NA NA 7.3%
CY Rev. Growth CY EBITDA Margin
Stock Price% of 52-
Week High
Current
Stock Price
as a Multiple
of 52-Wk low
Equity Value Net Debt Ent. Value
GM S&M Mgn.R&D Mgn.G&A Mgn.

19
Appendix – Comparable Public Company Analysis (Cont.)
Staffing – Valuation Metrics
Staffing – Operating Metrics
Source: CapitalIQ. Estimates Based on Consensus of Equity Research Analyst Estimates.
Note: Market Data as of Q1 2014 Quarter End. Note: Multiples Excludes Outlier for EV/CY Rev. > 15x, EV/CY EBITDA > 35x, P/E > 50x and PEG > 3x.
Note: LTM = Last Twelve Months, CY = Calendar Year, PE = Price/Earnings Ratio, PEG = Price-to-Earnings Growth Ratio.
Note: EV = Enterprise Value (Equity Value + Debt + Minority Interest – Cash and Cash Equivalents).
($Millions, except per share values) Valuation Metrics
2014E 2015E 2014E 2015E 2014E 2015E 2014E 2015E
Staffing
Adecco $83.21 92% 1.55x $14,822.5 $1,508.0 $16,347.2 0.6x 0.5x 10.7x 9.2x 16.1x 13.5x 0.85x 0.72x
Capita $18.27 94% 1.29x $12,019.3 ($266.5) $11,853.8 1.7x 1.6x 10.8x 10.1x 17.1x 15.8x 1.66x 1.53x
Randstad Holding $58.57 85% 1.52x $10,379.0 $1,046.1 $11,847.0 0.5x 0.5x 10.5x 9.0x 15.7x 13.2x 0.97x 0.82x
ManpowerGroup $78.83 90% 1.55x $6,271.6 ($219.7) $6,051.9 0.3x 0.3x 7.7x 7.0x 16.6x 14.7x 1.46x 1.29x
Robert Half International $41.95 97% 1.37x $5,766.7 ($274.3) $5,492.4 1.2x 1.1x 10.6x 9.4x 20.3x 17.6x 1.22x 1.06x
Syntel $89.90 92% 1.46x $3,754.2 ($522.9) $3,231.3 3.5x 3.1x 11.1x 10.1x 16.8x 15.3x 1.18x 1.07x
Kelly Services $23.73 91% 1.45x $888.2 ($97.4) $790.8 0.1x 0.1x 10.1x 6.0x 27.0x 13.1x 1.69x 0.82x
Kforce $21.32 94% 1.74x $724.5 $63.1 $787.7 0.6x 0.6x 10.3x 8.7x 18.0x 14.9x 0.55x 0.46x
Resources Connection $14.09 88% 1.33x $550.1 ($107.3) $439.6 0.8x 0.7x 9.1x 8.7x 24.4x 22.5x 0.97x 0.90x
Ciber $4.58 92% 1.49x $350.8 ($44.4) $306.9 0.3x 0.3x 6.6x 5.8x 18.7x 13.9x 1.07x 0.79x
Computer Task Group $16.99 65% 1.25x $313.6 ($46.2) $267.3 0.6x 0.6x 9.2x 7.8x 18.4x 15.6x 0.98x 0.84x
Average 0.9x 0.9x 9.7x 8.3x 19.0x 15.5x 1.15x 0.94x
Median 0.6x 0.6x 10.3x 8.7x 18.0x 14.9x 1.07x 0.84x
Stock Price% of 52-Week
High
Current Stock
Price as a
Multiple of 52-
Wk low
Equity Value Net Debt Ent. Value
EV/CY Revenue EV/CY EBITDA P/E PEG Ratio
($Millions, except per share values) Operating Metrics
5-Yr NI
2014E 2015E 2014E 2015E Growth % LTM LTM LTM LTM
Staffing
Adecco $83.21 92% 1.55x $14,822.5 $1,508.0 $16,347.2 5.0% 7.7% 5.4% 5.9% 18.9% 18.3% 0.4% NA NA
Capita $18.27 94% 1.29x $12,019.3 ($266.5) $11,853.8 10.6% 6.8% 15.3% 15.3% 10.4% 27.4% NA NA 14.6%
Randstad Holding $58.57 85% 1.52x $10,379.0 $1,046.1 $11,847.0 6.2% 7.1% 4.7% 5.1% 16.2% 18.2% 10.2% NA 4.8%
ManpowerGroup $78.83 90% 1.55x $6,271.6 ($219.7) $6,051.9 3.1% 4.9% 3.7% 4.0% 11.3% 16.6% NA NA NA
Robert Half International $41.95 97% 1.37x $5,766.7 ($274.3) $5,492.4 7.7% 8.4% 11.4% 11.8% 16.6% 40.6% 0.9% NA NA
Syntel $89.90 92% 1.46x $3,754.2 ($522.9) $3,231.3 13.2% 11.7% 31.2% 30.8% 14.3% 44.2% NA NA NA
Kelly Services $23.73 91% 1.45x $888.2 ($97.4) $790.8 5.0% 5.4% 1.4% 2.2% 16.0% 16.4% NA NA NA
Kforce $21.32 94% 1.74x $724.5 $63.1 $787.7 10.3% 9.2% 6.0% 6.5% 32.5% 32.1% NA NA NA
Resources Connection $14.09 88% 1.33x $550.1 ($107.3) $439.6 4.4% 1.5% 8.3% 8.6% 25.0% 38.0% NA NA NA
Ciber $4.58 92% 1.49x $350.8 ($44.4) $306.9 1.8% 1.8% 5.2% 5.8% 17.5% 25.4% NA NA NA
Computer Task Group $16.99 65% 1.25x $313.6 ($46.2) $267.3 (1.5%) 6.2% 7.0% 7.8% 18.7% 21.2% NA NA NA
Average 6.0% 6.4% 9.1% 9.4% 17.9% 27.1% 3.8% NA 9.7%
Median 5.0% 6.8% 6.0% 6.5% 16.6% 25.4% 0.9% NA 9.7%
CY Rev. Growth CY EBITDA Margin
Stock Price% of 52-Week
High
Current Stock
Price as a
Multiple of 52-
Wk low
Equity Value Net Debt Ent. Value
GM S&M Mgn. R&D Mgn. G&A Mgn.
20
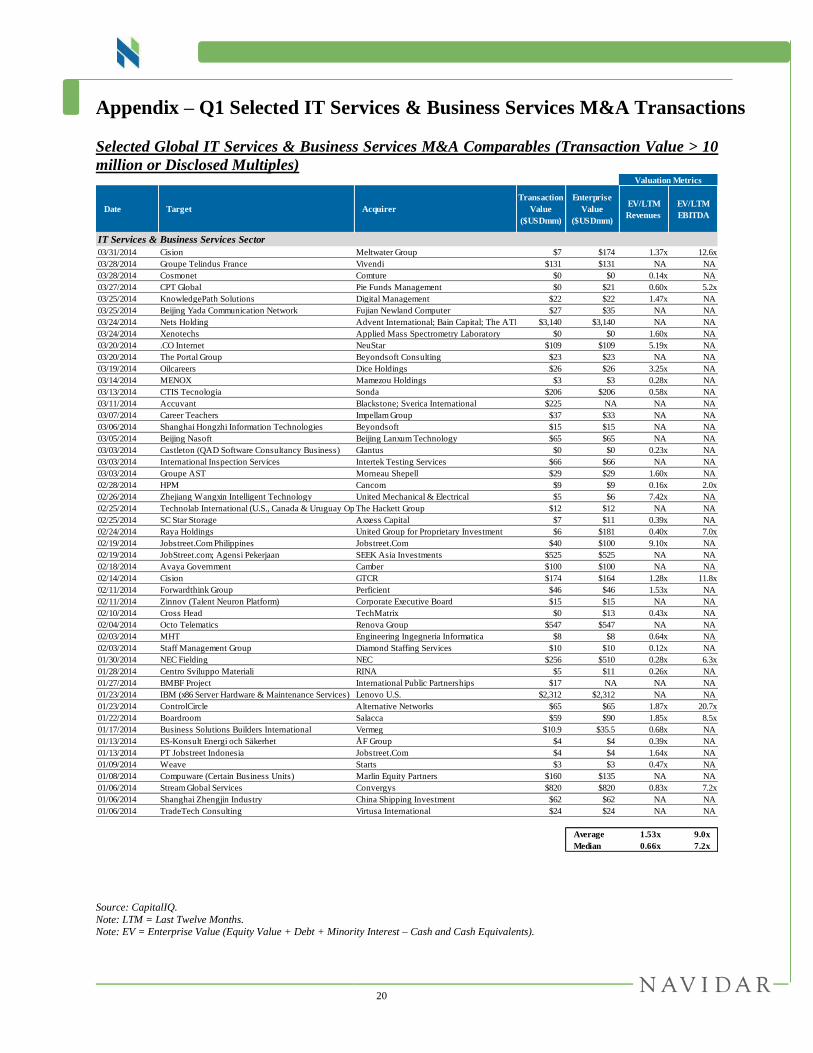
Appendix – Q1 Selected IT Services & Business Services M&A Transactions
Selected Global IT Services & Business Services M&A Comparables (Transaction Value > 10
million or Disclosed Multiples)
Source: CapitalIQ. Note: LTM = Last Twelve Months. Note: EV = Enterprise Value (Equity Value + Debt + Minority Interest – Cash and Cash Equivalents).
Valuation Metrics
Date Target Acquirer
Transaction
Value
($USDmm)
Enterprise
Value
($USDmm)
EV/LTM
Revenues
EV/LTM
EBITDA
IT Services & Business Services Sector
03/31/2014 Cision Meltwater Group $7 $174 1.37x 12.6x
03/28/2014 Groupe Telindus France Vivendi $131 $131 NA NA
03/28/2014 Cosmonet Comture $0 $0 0.14x NA
03/27/2014 CPT Global Pie Funds Management $0 $21 0.60x 5.2x
03/25/2014 KnowledgePath Solutions Digital Management $22 $22 1.47x NA
03/25/2014 Beijing Yada Communication Network Fujian Newland Computer $27 $35 NA NA
03/24/2014 Nets Holding Advent International; Bain Capital; The ATP Group$3,140 $3,140 NA NA
03/24/2014 Xenotechs Applied Mass Spectrometry Laboratory $0 $0 1.60x NA
03/20/2014 .CO Internet NeuStar $109 $109 5.19x NA
03/20/2014 The Portal Group Beyondsoft Consulting $23 $23 NA NA
03/19/2014 Oilcareers Dice Holdings $26 $26 3.25x NA
03/14/2014 MENOX Mamezou Holdings $3 $3 0.28x NA
03/13/2014 CTIS Tecnologia Sonda $206 $206 0.58x NA
03/11/2014 Accuvant Blackstone; Sverica International $225 NA NA NA
03/07/2014 Career Teachers Impellam Group $37 $33 NA NA
03/06/2014 Shanghai Hongzhi Information Technologies Beyondsoft $15 $15 NA NA
03/05/2014 Beijing Nasoft Beijing Lanxum Technology $65 $65 NA NA
03/03/2014 Castleton (QAD Software Consultancy Business) Glantus $0 $0 0.23x NA
03/03/2014 International Inspection Services Intertek Testing Services $66 $66 NA NA
03/03/2014 Groupe AST Morneau Shepell $29 $29 1.60x NA
02/28/2014 HPM Cancom $9 $9 0.16x 2.0x
02/26/2014 Zhejiang Wangxin Intelligent Technology United Mechanical & Electrical $5 $6 7.42x NA
02/25/2014 Technolab International (U.S., Canada & Uruguay Operations)The Hackett Group $12 $12 NA NA
02/25/2014 SC Star Storage Axxess Capital $7 $11 0.39x NA
02/24/2014 Raya Holdings United Group for Proprietary Investment $6 $181 0.40x 7.0x
02/19/2014 Jobstreet.Com Philippines Jobstreet.Com $40 $100 9.10x NA
02/19/2014 JobStreet.com; Agensi Pekerjaan SEEK Asia Investments $525 $525 NA NA
02/18/2014 Avaya Government Camber $100 $100 NA NA
02/14/2014 Cision GTCR $174 $164 1.28x 11.8x
02/11/2014 Forwardthink Group Perficient $46 $46 1.53x NA
02/11/2014 Zinnov (Talent Neuron Platform) Corporate Executive Board $15 $15 NA NA
02/10/2014 Cross Head TechMatrix $0 $13 0.43x NA
02/04/2014 Octo Telematics Renova Group $547 $547 NA NA
02/03/2014 MHT Engineering Ingegneria Informatica $8 $8 0.64x NA
02/03/2014 Staff Management Group Diamond Staffing Services $10 $10 0.12x NA
01/30/2014 NEC Fielding NEC $256 $510 0.28x 6.3x
01/28/2014 Centro Sviluppo Materiali RINA $5 $11 0.26x NA
01/27/2014 BMBF Project International Public Partnerships $17 NA NA NA
01/23/2014 IBM (x86 Server Hardware & Maintenance Services) Lenovo U.S. $2,312 $2,312 NA NA
01/23/2014 ControlCircle Alternative Networks $65 $65 1.87x 20.7x
01/22/2014 Boardroom Salacca $59 $90 1.85x 8.5x
01/17/2014 Business Solutions Builders International Vermeg $10.9 $35.5 0.68x NA
01/13/2014 ES-Konsult Energi och Säkerhet ÅF Group $4 $4 0.39x NA
01/13/2014 PT Jobstreet Indonesia Jobstreet.Com $4 $4 1.64x NA
01/09/2014 Weave Starts $3 $3 0.47x NA
01/08/2014 Compuware (Certain Business Units) Marlin Equity Partners $160 $135 NA NA
01/06/2014 Stream Global Services Convergys $820 $820 0.83x 7.2x
01/06/2014 Shanghai Zhengjin Industry China Shipping Investment $62 $62 NA NA
01/06/2014 TradeTech Consulting Virtusa International $24 $24 NA NA
Average 1.53x 9.0x
Median 0.66x 7.2x

21
Appendix – IT Services & Business Services Public Equity Market Performance
Americas IT Services European IT Services
Indian IT Services Asia IT Services
Business Services Consulting
Federal IT Staffing
Source: CapitalIQ.
94%
97%
100%
103%
106%
2-Jan-14 24-Jan-14 15-Feb-14 9-Mar-14 31-Mar-14
S&P 500 Americas IT Services
0.9%
2.2%
95%
100%
105%
110%
115%
2-Jan-14 24-Jan-14 15-Feb-14 9-Mar-14 31-Mar-14
FTSE 100 European IT Services
10.4%
(1.8%)
94%
97%
100%
103%
106%
109%
1-Jan-14 23-Jan-14 14-Feb-14 8-Mar-14 30-Mar-14
BSE Sensex Indian IT Services
1.6%
5 .9%
80%
90%
100%
110%
120%
130%
140%
2-Jan-14 24-Jan-14 15-Feb-14 9-Mar-14 31-Mar-14
Hang Seng Asia IT Services
(0.8%)
(5.1%)
91%
94%
97%
100%
103%
2-Jan-14 24-Jan-14 15-Feb-14 9-Mar-14 31-Mar-14
S&P 500 Business Services
(3.1%)
2.2%
94%
97%
100%
103%
106%
2-Jan-14 24-Jan-14 15-Feb-14 9-Mar-14 31-Mar-14
S&P 500 Consulting
4.7%
2.2%
85%
90%
95%
100%
105%
2-Jan-14 24-Jan-14 15-Feb-14 9-Mar-14 31-Mar-14
S&P 500 Federal IT
(12.6%)
2.2%
94%
97%
100%
103%
106%
2-Jan-14 24-Jan-14 15-Feb-14 9-Mar-14 31-Mar-14
NASDAQ Staffing
0.3%
1.3%
22
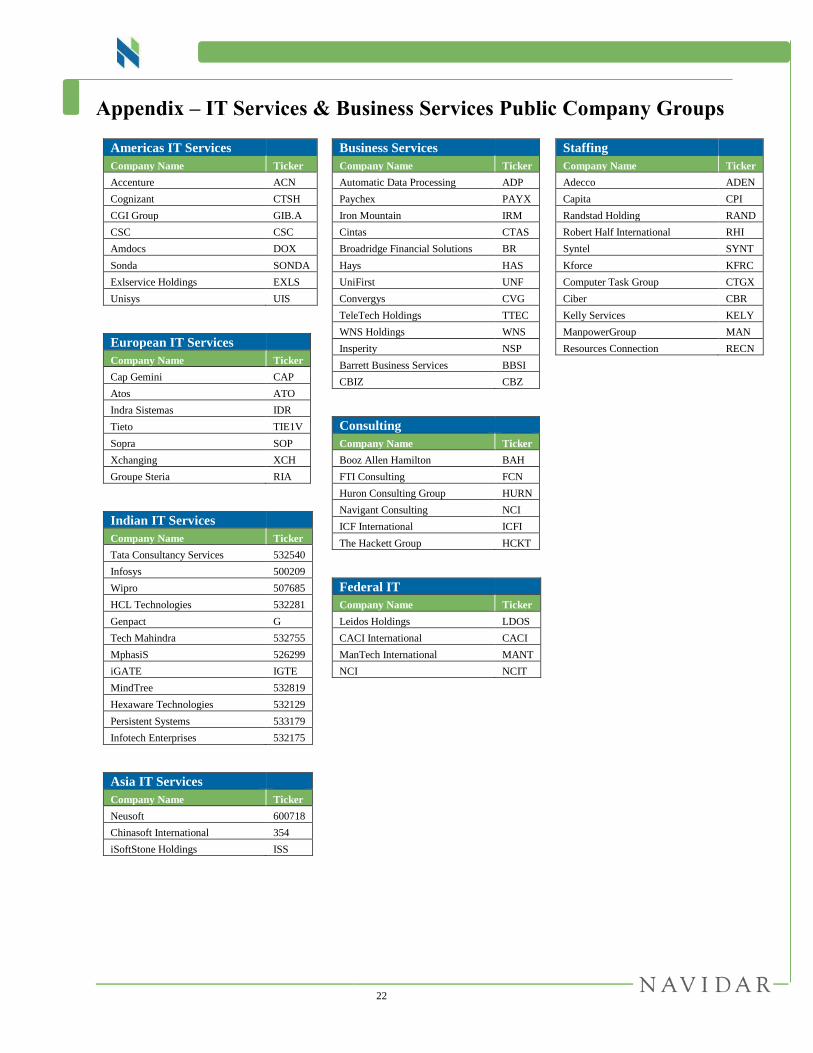
Appendix – IT Services & Business Services Public Company Groups
Americas IT Services
Company Name Ticker
Accenture ACN
Cognizant CTSH
CGI Group GIB.A
CSC CSC
Amdocs DOX
Sonda SONDA
Exlservice Holdings EXLS
Unisys UIS
European IT Services
Company Name Ticker
Cap Gemini CAP
Atos ATO
Indra Sistemas IDR
Tieto TIE1V
Sopra SOP
Xchanging XCH
Groupe Steria RIA
Indian IT Services
Company Name Ticker
Tata Consultancy Services 532540
Infosys 500209
Wipro 507685
HCL Technologies 532281
Genpact G
Tech Mahindra 532755
MphasiS 526299
iGATE IGTE
MindTree 532819
Hexaware Technologies 532129
Persistent Systems 533179
Infotech Enterprises 532175
Asia IT Services
Company Name Ticker
Neusoft 600718
Chinasoft International 354
iSoftStone Holdings ISS
Business Services
Company Name Ticker
Automatic Data Processing ADP
Paychex PAYX
Iron Mountain IRM
Cintas CTAS
Broadridge Financial Solutions BR
Hays HAS
UniFirst UNF
Convergys CVG
TeleTech Holdings TTEC
WNS Holdings WNS
Insperity NSP
Barrett Business Services BBSI
CBIZ CBZ
Consulting
Company Name Ticker
Booz Allen Hamilton BAH
FTI Consulting FCN
Huron Consulting Group HURN
Navigant Consulting NCI
ICF International ICFI
The Hackett Group HCKT
Federal IT
Company Name Ticker
Leidos Holdings LDOS
CACI International CACI
ManTech International MANT
NCI NCIT
Staffing
Company Name Ticker
Adecco ADEN
Capita CPI
Randstad Holding RAND
Robert Half International RHI
Syntel SYNT
Kforce KFRC
Computer Task Group CTGX
Ciber CBR
Kelly Services KELY
ManpowerGroup MAN
Resources Connection RECN

23
Disclaimer
This Quarterly Report (the “Quarterly”) has been prepared solely for informational purposes and may not be used or
relied upon for any purpose other than as specifically contemplated by a written agreement with us.
This Quarterly is not intended to provide the sole basis for evaluating and should not be considered a recommendation
with respect to, any transaction or other matter. This Quarterly does not constitute an offer, or the solicitation of an
offer, to buy or sell any securities or other financial product, to participate in any transaction or to provide any
investment banking or other services and should not be deemed to be a commitment or undertaking of any kind on the
part of Navidar Group LLC (“Navidar”) or any of its affiliates to underwrite, place or purchase any securities or to
provide any debt or equity financing or to participate in any transaction, or a recommendation to buy or sell any
securities, to make any investment or to participate in any transaction or trading strategy.
Although the information contained in this Quarterly has been obtained or compiled from sources deemed reliable,
neither Navidar nor any of its affiliates make any representation or warranty, express or implied, as to the accuracy or
completeness of the information contained herein and nothing contained herein is, or shall be relied upon as, a promise
or representation whether as to the past, present or future performance. The information set forth herein may include
estimates and/or involve significant elements of subjective judgment and analysis. No representations are made as to
the accuracy of such estimates or that all assumptions relating to such estimates have been considered or stated or that
such estimates will be realized. The information contained herein does not purport to contain all of the information
that may be required to evaluate a participation in any transaction and any recipient hereof should conduct its own
independent analysis of the data referred to herein. We assume no obligation to update or otherwise revise these
materials.
Navidar and its affiliates do not provide legal, tax or accounting advice. Prior to making any investment or
participating in any transaction, you should consult, to the extent necessary, your own independent legal, tax,
accounting and other professional advisors to ensure that any transaction or investment is suitable for you in the light
of your financial capacity and objectives.