q1 – 2016 - telenor · telenor first quarter 2016 1 during the first quarter of 2016, telenor...
TRANSCRIPT

Interim reportJanuary – March 2016
Q1 – 2016

Contents
Highlights 1
Interimreport 2Telenor’s operations 2
Group overview 8
Outlook for 2016 10
Interimcondensedfinancialinformation 11Notes to the interim consolidated financial statements 16
Definitions 20

1 TELENOR FIRST QUARTER 2016
Duringthefirstquarterof2016,TelenorGroupdelivered5%EBITDAand2%revenuegrowthonanorganicbasis,andachievedahealthyoperatingcashflowofmorethanNOK6billion.Weconnectedmorethanfivemillionnewcustomersaswecontinuetoimproveournetworkandservicequalityacrossourfootprint.Withintensecompetitioninseveralmarkets,drivingprofitablegrowthandkeepingacloseeyeoncostscontinuestobeapriorityformeandmymanagementacrossourEuropeanandAsianmarkets.
– Sigve Brekke, President and CEO
Highlights for Q1 2016
Telenor reported first-quarter revenues of NOK 33 billion. Mobile subscription and traffic revenue growth remained healthy at 6%, while total revenues were impacted by lower handset sales and declining revenues from fixed legacy products. The EBITDA margin improved one percentage point to 35%. Adjusted for one-time effects, operating profit was NOK 6.4 billion while profit after taxes and non-controlling interests was NOK 3.6 billion.
5.4 million new mobile subscribers were added, of which 2.2 million in Pakistan, 1.8 million in Myanmar and 1.5 million in India. The total customer base now stands at 208 million and about 40% are active internet users.
In Myanmar, Telenor further improved its market position and the cash flow was positive after seven quarters of operations. Grameenphone in Bangladesh had a solid performance, with an EBITDA and revenue growth of 12% and 9% respectively. In Pakistan, the positive revenue momentum continued and total revenues increased by 9%.
In Norway, subscription and traffic revenues continued to grow, while total revenues dropped as a result of lower fixed revenues, as well as a decline in interconnect rates and handset sales. The EBITDA margin remained strong during the quarter. Through today’s launch
of new tariffs, Telenor Norway will give customers improved value and predictability, through increased data speeds, new data buckets and the removal of roaming charges within the entire EU. In Sweden, we plan to further increase our fibre investments amid rising demand. We currently serve around 1.5 million households and aim to expand our fibre offering to an additional 500,000 homes by 2020.
Fierce competition in our Thai and Malaysian markets continued in the first quarter. Digi reported solid postpaid subscriber growth from stronger data network and new price plans. In Thailand, dtac’s EBITDA margin widened by one percentage point due to lower handset subsidies. The network expansion programme continued, with 4,700 new sites rolled out during the quarter.
Going forward, Telenor’s key priority will continue to be securing profitable growth and cost efficiency.
Based on the first quarter performance, the financial guidance for 2016 remains unchanged. We expect an organic revenue growth in the range of 2% to 4% and an EBITDA margin of 33% to 34%. The capex to sales ratio is expected to be 17% to 19%.
Key figures Telenor Group
Firstquarter Year
(NOKinmillions) 20162015
Re-presented 2015
Revenues 33013 31446 128175
Organicrevenuegrowth(%) 1.5% 7.3% 4.7%
EBITDAbeforeotherincomeandotherexpenses 11685 10795 44197
EBITDAbeforeotherincomeandotherexpenses/Revenues(%) 35.4 34.3 34.5
Profitaftertaxesandnon-controllinginterests 4256 3852 3414
Capexexcl.licencesandspectrum/Revenues(%) 16.8 14.8 18.4
Mobilesubscriptions-Changeinquarter/Total(mill.) 5.4 5.9 203
Please refer to page 10 for the full outlook for 2016, and page 20 for definitions.

2 TELENOR FIRST QUARTER 2016
Norway
Firstquarter Year
(NOKinmillions) 2016 2015 2015
Revenues mobile operation
Subscriptionandtraffic 2831 2792 11544
Interconnectrevenues 144 211 745
Othermobilerevenues 251 299 998
Non-mobilerevenues 355 385 1795
Total revenues mobile operation 3 581 3 687 15 082
Revenues fixed operation
Telephony 478 570 2139
InternetandTV 1335 1352 5414
Dataservices 127 130 506
Otherfixedrevenues 420 433 1698
Total retail revenues 2 360 2 484 9 758
Wholesalerevenues 389 452 1703
Total revenues fixed operation 2 749 2 937 11 460
Total revenues 6 330 6 624 26 542
EBITDA before other items 2 772 2 792 11 088
Operatingprofit 1772 1869 7218
EBITDAbeforeotheritems/Totalrevenues(%) 43.8 42.2 41.8
Capex 908 848 4844
MobileARPU-monthly(NOK) 315 312 320
FixedTelephonyARPU 261 276 270
FixedInternetARPU 344 346 345
TVARPU 283 285 291
No. of subscriptions - Change in quarter/Total (in thousands):
Mobile (34) (10) 3163
Fixedtelephony (20) (24) 620
FixedInternet (1) (1) 854
TV 3 (5) 527
• The number of mobile subscriptions decreased by 34,000 during the quarter, mainly from a reduction in the number of data cards and prepaid subscriptions. At the end of the quarter, the subscription base was 2% lower than last year.
• Mobile ARPU increased by 1% or NOK 4 from increased share of contract subscriptions and demand for subscriptions with larger data volumes, more than offsetting the negative effects of reduced inter-connect rates and lower roaming prices. Excluding the price changes in interconnect, ARPU increased by 3%.
• Mobile subscription and traffic revenues increased by 1%. Total mobile revenues decreased by 3% as the growth in subscription and traffic revenues was more than offset by lower interconnect, whole-sale and handset revenues.
• Total fixed revenues decreased by 6% primarily due to reduced revenues from fixed telephony, broadband and wholesale prod-ucts. During the quarter, 12,000 high-speed internet subscriptions were added, taking the total number of high-speed connections to 556,000.
• Total reported revenues decreased by 4% compared to last year.• EBITDA decreased by 1% as the decrease in revenues was partly off-
set by reduced handset and interconnect costs and lower personnel, commissions cost in combination with fewer fault corrections. The EBITDA margin improved by 2 percentage points to 44% or to 43% excluding a one-off related to reversal of project costs.
• Capital expenditure was driven by continued 4G network expansion and fixed high-speed broadband roll-out, in combination with trans-formation initiatives within the fixed business.
• From 1 January 2016, the mobile interconnect rate was reduced from NOK 0.083 to NOK 0.075.
Interim report Telenor’soperationsThe comments below are related to Telenor’s development in the first quarter of 2016 compared to the first quarter of 2015, unless otherwise stated. All comments on EBITDA are made on development in EBITDA before other income and other expenses. Please refer to page 8 for ‘Specification of other income and other expenses’. Additional information is available at: www.telenor.com/ir

3 TELENOR FIRST QUARTER 2016
Sweden
Firstquarter Year
(NOKinmillions) 2016 2015 2015
Revenues mobile operation
Subscriptionandtraffic 1578 1416 5944
Interconnectrevenues 144 133 552
Othermobilerevenues 80 82 367
Non-mobilerevenues 491 583 2553
Total revenues mobile operation 2 293 2 214 9 416
Revenues fixed operation 828 770 3 160
Total revenues 3 121 2 984 12 576
EBITDA before other items 893 854 3 667
Operatingprofit 479 491 2094
EBITDAbeforeotheritems/Totalrevenues(%) 28.6 28.6 29.2
Capex 336 308 1302
Investmentsinbusinesses - 3 3
MobileARPU-monthly(NOK) 225 207 213
No. of subscriptions - Change in quarter/Total (in thousands):
Mobile 3 (23) 2548
Fixedtelephony (9) (21) 244
FixedInternet 1 (5) 639
TV (3) (3) 487
Exchangerate(SEK) 1.0213 0.9310 0.9572
• The number of mobile subscriptions increased by 3,000 during the quarter, driven by continued growth in the business segment. The subscription base was 3% higher than at the end of first quarter last year.
• Mobile ARPU in local currency decreased by 1% as price pressure in the business segment more than offset the continued solid trend in the contract consumer segment.
• Total mobile revenues in local currency decreased by 6%. The reported handset revenues declined due to the high handset sales in first quarter last year, and change in accounting treatment for handsets sold through external channels. Mobile subscription and traffic revenues increased by 2%.
• 11,000 high-speed fixed internet subscriptions were added this quarter, taking the total number of high-speed internet subscriptions to 486,000. The decline in ADSL continued. The number of TV subscribers decreased by 3,000 due to reduction in Coax.
• Fixed revenues in local currency decreased by 2% due to declining fixed telephony revenues.
• The EBITDA margin remained stable. EBITDA in local currency decreased by 5% as operating expenditure related to sales and marketing activities as well as salaries more than offset the effects from higher mobile service revenues and improved handset margin.
• Capital expenditure in the quarter was mainly related to network modernisation and 4G coverage expansion as well as fibre roll-out.
Denmark
Firstquarter Year
(NOKinmillions) 2016 2015 2015
Revenues mobile operation
Subscriptionandtraffic 771 718 2939
Interconnectrevenues 43 42 173
Othermobilerevenues 33 28 149
Non-mobilerevenues 251 308 1300
Total revenues mobile operation 1 097 1 097 4 561
Revenues fixed operation 159 159 640
Total revenues 1 256 1 256 5 201
EBITDA before other items 162 208 591
Operatingprofit(loss) 80 1 (2516)
EBITDAbeforeotheritems/Totalrevenues(%) 12.9 16.6 11.4
Capex 118 134 497
MobileARPU-monthly(NOK) 152 144 146
No. of subscriptions - Change in quarter/Total (in thousands):
Mobile 13 22 1784
Fixedtelephony (1) (2) 76
FixedInternet (2) 4 159
Exchangerate(DKK) 1.2769 1.1721 1.2004
• The number of mobile subscriptions increased by 13,000 during the quarter driven by growth in the business segment. The development in consumer contract and prepaid segments remained stable. The subscription base was 2% higher than at the end of first quarter last year.
• From 31 March, pay-as-you-go cards will no longer be part of Telenor Denmark’s product offering. Subscription and ARPU figures have been updated retrospectively.
• In February the Bibob brand was closed down and activities merged with the CBB brand. Bibob’s customers were offered to continue on similar service plans under the CBB brand.
• Mobile ARPU in local currency declined by 3% as a consequence of conversion to lower priced tariffs and lower interconnect rates.
• Total revenues in local currency decreased by 8% mainly as a result of lower mobile ARPU and 9% decline in fixed revenues. Mobile subscription and traffic revenues decreased by 2%.
• The EBITDA margin decreased by 4 percentage points, mainly explained by increased operating expenditure related to the implementation of new business support systems.
• Operating profit in local currency increased by DKK 61 million. A DKK 114 million reduction in depreciation & amortisation following write-down of assets in the fourth quarter last year in the amount of DKK 1.7 billion was partly outbalanced by DKK 53 million EBITDA decrease first quarter this year.
• The capital expenditure was mainly related to the ongoing network roll-out.
• See Other units for additional information on investments in common business support systems.
• From 1 January 2016, the mobile termination rate was reduced from DKK 0.0602 to DKK 0.0541 per voice minute.

4 TELENOR FIRST QUARTER 2016
Hungary
Firstquarter Year
(NOKinmillions) 2016 2015 2015
Revenues
Subscriptionandtraffic 908 836 3526
Interconnectrevenues 68 152 349
Othermobilerevenues 18 18 81
Non-mobilerevenues 124 90 535
Total revenues 1 117 1 098 4 490
EBITDA before other items 354 354 1 382
Operatingprofit 190 208 760
EBITDAbeforeotheritems/Totalrevenues(%) 31.7 32.2 30.8
Capex 46 67 314
No.ofsubscriptions-Changeinquarter/Total(inthousands): (13) (27) 3164
ARPU-monthly(NOK) 103 102 100
Exchangerate(HUF) 0.0305 0.0283 0.0289
• The number of subscriptions decreased by 13,000 in the quarter mainly due to loss of prepaid customers. The subscription base was 2% lower than at the end of first quarter last year.
• ARPU in local currency decreased by 6% due to significant reduction in interconnect rates from 1 April 2015. ARPU excluding interconnect increased by 3%.
• Total revenues in local currency decreased by 6% from lower interconnect revenues partly offset by 1% increase in subscription and traffic revenues and revenues related to network sharing.
• The EBITDA margin remained stable as the interconnect reductions was offset by cost related to the business support system. EBITDA in local currency decreased by 7%.
• Capital expenditure in local currency was 36% lower than first quarter last year mainly due to lower IT investments as well as higher 4G roll-out last year.
• See Other units for additional information on investments in common business support systems.
Bulgaria
Firstquarter Year
(NOKinmillions) 2016 2015 2015
Revenues
Subscriptionandtraffic 568 527 2180
Interconnectrevenues 60 41 195
Othermobilerevenues 6 6 34
Non-mobilerevenues 124 111 531
Total revenues 758 685 2 940
EBITDA before other items 286 253 1 134
Operatingprofit(loss) 137 173 615
EBITDAbeforeotheritems/Totalrevenues(%) 37.8 37.0 38.6
Capex 33 113 525
No.ofsubscriptions-Changeinquarter/Total(inthousands): (60) (87) 3583
ARPU-monthly(NOK) 59 49 52
Exchangerate(BGN) 4.8708 4.4646 4.5777
• The number of subscriptions decreased by 60,000 during the quarter, mainly within prepaid, due to aggressive competition and market trends of SIM consolidation. The subscription base decreased by 8% compared to end of first quarter last year.
• ARPU in local currency increased by 10%, mainly due to increased demand for high-end bundled subscriptions supported by the new portfolio with 4G focus and increased share of contract subscriptions. Mobile subscription and traffic revenues decreased by 1% mainly due to lower customer base.
• Total revenues in local currency increased by 1% from higher handset sales and interconnect revenues.
• The EBITDA margin increased by 1 percentage point mainly due to operational efficiency efforts, which more than compensated for the market pressure on service revenues.
• Capital expenditure in the first quarter was mainly related to new sites, 4G roll-out and IT, and was below last year’s level due to the network modernisation programme in 2015.
Montenegro&Serbia
Firstquarter Year
(NOKinmillions) 2016 2015 2015
Revenues
Subscriptionandtraffic 607 572 2467
Interconnectrevenues 203 168 790
Othermobilerevenues 14 21 100
Non-mobilerevenues 128 93 458
Total revenues 952 853 3 815
EBITDA before other items 296 285 1 329
Operatingprofit 169 184 902
EBITDAbeforeotheritems/Totalrevenues(%) 31.1 33.4 34.8
Capex 82 105 776
No.ofsubscriptions-Changeinquarter/Total(inthousands): (59) (55) 3443
ARPU-monthly(NOK) 79 69 77
Exchangerate(RSD) 0.0777 0.0719 0.0742
Exchangerate(EUR) 9.5264 8.7318 8.9530
• The number of subscriptions decreased by 59,000 during the quarter, driven by seasonal churn of prepaid subscriptions. The subscription base decreased by 4% compared to the end of first quarter last year.
• ARPU in local currency increased by 6% due to increase in interconnect revenues and higher share of post-paid subscriptions.
• Total revenues in local currency increased by 3% driven by increased interconnect revenues and higher handset sales, in addition to increased mobile banking revenues.
• The EBITDA margin decreased by 2 percentage points due to growth in low margin revenues and increasing operating expenditures due to network roll-out.
• Capital expenditure was mainly related to mobile site roll-out, equipment for the technical premises in Montenegro and investments related to the banking business.
• On 1 January 2016, the mobile interconnect rates in Montenegro were reduced from EUR 0.019 to EUR 0.0118.

5 TELENOR FIRST QUARTER 2016
dtac-Thailand
Firstquarter Year
(NOKinmillions) 2016 2015 2015
Revenues
Subscriptionandtraffic 3923 3925 15375
Interconnectrevenues 287 388 1327
Othermobilerevenues 71 63 204
Non-mobilerevenues 979 1067 3781
Total revenues 5 260 5 443 20 687
EBITDA before other items 1 778 1 760 6 580
Operatingprofit 515 779 2333
EBITDAbeforeotheritems/Totalrevenues(%) 33.8 32.3 31.8
Capex 1139 1314 4766
No.ofsubscriptions-Changeinquarter/Total(inthousands): 225 419 25252
ARPU-monthly(NOK) 55 51 52
Exchangerate(THB) 0.2425 0.2377 0.2355
• The number of subscriptions increased by 225,000 during the quarter, of which 108,000 were contract subscriptions. The subscription base was 10% lower than at the end of first quarter last year as the requirement to register all prepaid subscribers by 31 July 2015 impacted the subscriber development negatively last year.
• ARPU in local currency increased by 6%. Adjusted for the clearing of nonregistered prepaid SIM cards, ARPU increased by 1%. Growth in data revenues was offset by the negative trend on voice revenues.
• Total revenues in local currency decreased by 5% driven by lower handset sales, interconnect rate reduction and lower subscriber base. Subscription and traffic revenues in local currency decreased by 2%.
• The EBITDA margin improved by 1 percentage point as lower sales of subsidised handsets was partly offset by increased operating expenditures. EBITDA in local currency declined by 1% mainly driven by increased operating expenditures related to network expansion and market activities.
• Operating profit in local currency decreased by 38% as increased network investments negatively impacted depreciations.
• Capital expenditure was mainly related to roll-out of 4,700 new sites of which 3,900 were 4G sites.
• From 1 July 2015, the mobile interconnect rate was reduced from THB 0.45 to 0.34 THB
Digi-Malaysia
Firstquarter Year
(NOKinmillions) 2016 2015 2015
Revenues
Subscriptionandtraffic 3045 3218 12425
Interconnectrevenues 144 159 596
Othermobilerevenues 26 28 137
Non-mobilerevenues 189 432 1148
Total revenues 3 405 3 837 14 306
EBITDA before other items 1 431 1 672 6 224
Operatingprofit 1110 1371 4923
EBITDAbeforeotheritems/Totalrevenues(%) 42.0 43.6 43.5
Capex 351 412 1870
No.ofsubscriptions-Changeinquarter/Total(inthousands): 211 271 12125
ARPU-monthly(NOK) 86 97 93
Exchangerate(MYR) 2.0602 2.1420 2.0691
• The strong development in the contract segment continued this quarter with 62,000 new subscriptions. The total number of subscriptions increased by 211,000 this quarter, and the subscription base is now 6% higher than at the end of first quarter last year.
• ARPU in local currency decreased by 8% due to competitive price pressure.
• Total revenues in local currency decreased by 8% mainly due to reduced handset sales. Subscription and traffic revenues in local currency decreased by 2%.
• The EBITDA margin decreased by 2 percentage points, caused by lower margin on international voice traffic due to price competition, weakening of the Malaysian Ringgit resulting in higher international termination costs and higher termination rates to some key destinations. In addition, higher operating expenditures related to market incentives and network roll-out impacted EBITDA.
• Capital expenditure was related to roll-out of 4G and high capacity backhaul transmission, as well as IT modernisation. The 4G population coverage at end of first quarter reached 73%.
Grameenphone-Bangladesh
Firstquarter Year
(NOKinmillions) 2016 2015 2015
Revenues
Subscriptionandtraffic 2633 2130 9266
Interconnectrevenues 266 264 1101
Othermobilerevenues 14 15 36
Non-mobilerevenues 131 108 479
Total revenues 3 045 2 516 10 881
EBITDA before other items 1 684 1 363 5 806
Operatingprofit 1124 955 3829
EBITDAbeforeotheritems/Totalrevenues(%) 55.3 54.2 53.4
Capex 1004 370 1996
No.ofsubscriptions-Changeinquarter/Total(inthousands): (395) 502 56679
ARPU-monthly(NOK) 17 15 16
Exchangerate(BDT) 0.1102 0.0997 0.1036
• The number of subscriptions decreased by 0.4 million during the quarter, negatively impacted by the ongoing biometric verification. The subscription base was 8% higher than at the end of first quarter last year.
• ARPU in local currency increased by 1% driven by high growth in voice traffic and increased data usage, partly offset by discounted add-ons and bundles. Subscription and traffic revenues in local currency increased by 12%.
• Total revenues in local currency increased by 9% mainly as a result of strong subscription growth and higher ARPU.
• The EBITDA margin increased by 1 percentage point due to lower subscriber acquisition cost, partly offset by higher regulatory, commissions and personnel cost in addition to one-off costs related to biometric verification.
• Capital expenditure was prioritised towards expanding 3G network coverage and capacity, with the aim to have 3G at all network sites by June 2016. At the end of the quarter, the 3G population coverage was 80%.
• Bangladesh Telecommunication Regulatory Commission (BTRC) has introduced a new SIM registration process through an online National Identity Database and Biometric Verification System. BTRC has directed all mobile operators in Bangladesh to perform a biometric re-registration of the complete customer base within end of April 2016.
6 TELENOR FIRST QUARTER 2016
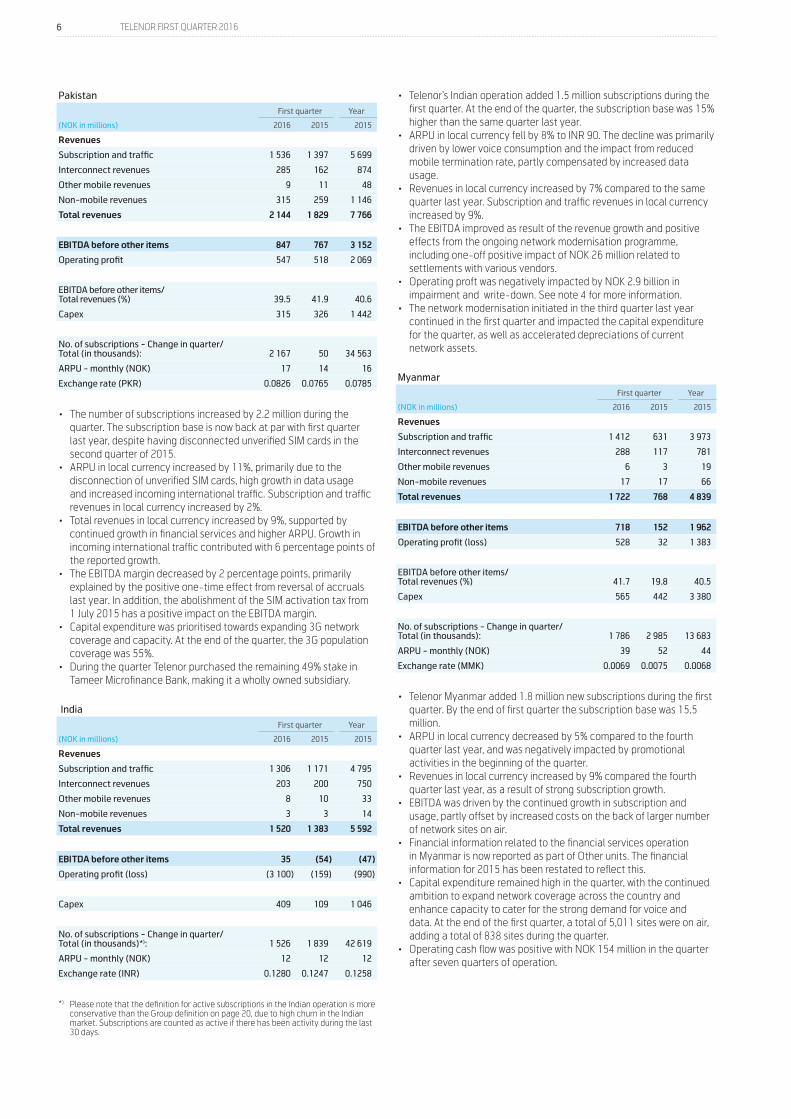
Pakistan
Firstquarter Year
(NOKinmillions) 2016 2015 2015
Revenues
Subscriptionandtraffic 1536 1397 5699
Interconnectrevenues 285 162 874
Othermobilerevenues 9 11 48
Non-mobilerevenues 315 259 1146
Total revenues 2 144 1 829 7 766
EBITDA before other items 847 767 3 152
Operatingprofit 547 518 2069
EBITDAbeforeotheritems/Totalrevenues(%) 39.5 41.9 40.6
Capex 315 326 1442
No.ofsubscriptions-Changeinquarter/Total(inthousands): 2167 50 34563
ARPU-monthly(NOK) 17 14 16
Exchangerate(PKR) 0.0826 0.0765 0.0785
• The number of subscriptions increased by 2.2 million during the quarter. The subscription base is now back at par with first quarter last year, despite having disconnected unverified SIM cards in the second quarter of 2015.
• ARPU in local currency increased by 11%, primarily due to the disconnection of unverified SIM cards, high growth in data usage and increased incoming international traffic. Subscription and traffic revenues in local currency increased by 2%.
• Total revenues in local currency increased by 9%, supported by continued growth in financial services and higher ARPU. Growth in incoming international traffic contributed with 6 percentage points of the reported growth.
• The EBITDA margin decreased by 2 percentage points, primarily explained by the positive one-time effect from reversal of accruals last year. In addition, the abolishment of the SIM activation tax from 1 July 2015 has a positive impact on the EBITDA margin.
• Capital expenditure was prioritised towards expanding 3G network coverage and capacity. At the end of the quarter, the 3G population coverage was 55%.
• During the quarter Telenor purchased the remaining 49% stake in Tameer Microfinance Bank, making it a wholly owned subsidiary.
India
Firstquarter Year
(NOKinmillions) 2016 2015 2015
Revenues
Subscriptionandtraffic 1306 1171 4795
Interconnectrevenues 203 200 750
Othermobilerevenues 8 10 33
Non-mobilerevenues 3 3 14
Total revenues 1 520 1 383 5 592
EBITDA before other items 35 (54) (47)
Operatingprofit(loss) (3100) (159) (990)
Capex 409 109 1046
No.ofsubscriptions-Changeinquarter/Total(inthousands)*): 1526 1839 42619
ARPU-monthly(NOK) 12 12 12
Exchangerate(INR) 0.1280 0.1247 0.1258
*) Please note that the definition for active subscriptions in the Indian operation is more conservative than the Group definition on page 20, due to high churn in the Indian market. Subscriptions are counted as active if there has been activity during the last 30 days.
• Telenor’s Indian operation added 1.5 million subscriptions during the first quarter. At the end of the quarter, the subscription base was 15% higher than the same quarter last year.
• ARPU in local currency fell by 8% to INR 90. The decline was primarily driven by lower voice consumption and the impact from reduced mobile termination rate, partly compensated by increased data usage.
• Revenues in local currency increased by 7% compared to the same quarter last year. Subscription and traffic revenues in local currency increased by 9%.
• The EBITDA improved as result of the revenue growth and positive effects from the ongoing network modernisation programme, including one-off positive impact of NOK 26 million related to settlements with various vendors.
• Operating proft was negatively impacted by NOK 2.9 billion in impairment and write-down. See note 4 for more information.
• The network modernisation initiated in the third quarter last year continued in the first quarter and impacted the capital expenditure for the quarter, as well as accelerated depreciations of current network assets.
Myanmar
Firstquarter Year
(NOKinmillions) 2016 2015 2015
Revenues
Subscriptionandtraffic 1412 631 3973
Interconnectrevenues 288 117 781
Othermobilerevenues 6 3 19
Non-mobilerevenues 17 17 66
Total revenues 1 722 768 4 839
EBITDA before other items 718 152 1 962
Operatingprofit(loss) 528 32 1383
EBITDAbeforeotheritems/Totalrevenues(%) 41.7 19.8 40.5
Capex 565 442 3380
No.ofsubscriptions-Changeinquarter/Total(inthousands): 1786 2985 13683
ARPU-monthly(NOK) 39 52 44
Exchangerate(MMK) 0.0069 0.0075 0.0068
• Telenor Myanmar added 1.8 million new subscriptions during the first quarter. By the end of first quarter the subscription base was 15.5 million.
• ARPU in local currency decreased by 5% compared to the fourth quarter last year, and was negatively impacted by promotional activities in the beginning of the quarter.
• Revenues in local currency increased by 9% compared the fourth quarter last year, as a result of strong subscription growth.
• EBITDA was driven by the continued growth in subscription and usage, partly offset by increased costs on the back of larger number of network sites on air.
• Financial information related to the financial services operation in Myanmar is now reported as part of Other units. The financial information for 2015 has been restated to reflect this.
• Capital expenditure remained high in the quarter, with the continued ambition to expand network coverage across the country and enhance capacity to cater for the strong demand for voice and data. At the end of the first quarter, a total of 5,011 sites were on air, adding a total of 838 sites during the quarter.
• Operating cash flow was positive with NOK 154 million in the quarter after seven quarters of operation.

7 TELENOR FIRST QUARTER 2016
Broadcast
Firstquarter Year
(NOKinmillions) 2016 2015 2015
Revenues
CanalDigitalDTH 1147 1114 4572
SatelliteBroadcasting 237 244 1012
Norkring 500 288 1120
Other/Eliminations (119) (116) (468)
Total revenues 1 765 1 530 6 236
EBITDA before other items
CanalDigitalDTH 210 167 781
SatelliteBroadcasting 154 159 670
Norkring 375 138 607
Other/Eliminations (6) (8) (26)
Total EBITDA before other items 732 457 2 032
Operating profit
CanalDigitalDTH 198 158 735
SatelliteBroadcasting 71 103 388
Norkring 179 73 325
Other/Eliminations (6) (8) (26)
Total operating profit 442 326 1 422
EBITDAbeforeotheritems/Totalrevenues(%) 41.5 29.9 32.6
Capex 95 75 1785
No. of subscriptions - Change in quarter/Total (in thousands):
DTHTV (20) (7) 897
• Total revenues increased by 15% primarily a result of a positive one-time effect related to a settlement in Norkring. Consequently EBITDA grew 60%, improving the margin by 12 percentage points. Excluding the one-time item, revenues grew by 2% and EBITDA grew by 14%.
• Revenues in Canal Digital DTH increased by 3% due to currency effects which were partly offset by lower hardware sales and lower sales to the business segment. The effects of a lower DTH subscriber base were mainly compensated by price.
• The EBITDA margin in Canal Digital DTH was 18%, which is 3 percentage points higher than the same quarter last year. The improvement was mainly driven by positive currency effects and operational efficiency improvements.
• Revenues in Telenor Satellite decreased by 3% primarily due to reduced sales of data communication services, partly compensated by positive currency effects. The EBITDA margin was on level with last year due to lower use of leased capacity.
• Revenues in Norkring increased by 74% primarily due to a one-off settlement related to changes in a customer contract. As a result, EBITDA margin increased by 27 percentage points partly helped by reduced operating cost.
• Operating profit in Broadcast increased by 36% as the EBITDA growth was partly offset by a NOK 128 million impairment of excess values as a consequence of the one time effect.
• Capital expenditure increased due to extension of the DAB network and other network investments in Norkring.
Otherunits
Firstquarter Year
(NOKinmillions) 2016 2015 2015
Revenues
Globalwholesale 703 717 2676
Corporatefunctions 739 613 2734
DigitalBusinesses 220 128 543
Other/eliminations 173 158 711
Total revenues 1 835 1 617 6 665
EBITDA before other items
Globalwholesale 29 130 243
Corporatefunctions (337) (270) (1143)
DigitalBusinesses 11 53 128
Other/eliminations (8) 18 71
Total EBITDA before other items (306) (68) (701)
Operating profit (loss)
Globalwholesale 17 122 211
Corporatefunctions (467) (359) (1621)
DigitalBusinesses (2) 52 120
Other/eliminations (22) (5) 5
Total operating profit (loss) (474) (189) (1 285)
Capex 175 102 649
Investmentsinbusinesses 3138 305 500
• In Global Wholesale, the revenue and EBITDA decline is primarily attributable to price reductions for traffic into Pakistan.
• Revenues in Corporate Functions increased due to higher internal trade related to services and systems. EBITDA decreased due to increased corporate activities including strategy and transformation processes, legal and advisory costs and higher cost in Group support units.
• Digital Businesses include Telenor Connexion, Tapad and staff units in Telenor ASA. Revenues increased mainly due to higher traffic in Telenor Connexion and because Tapad was included from 18 February this year. EBITDA decreased due to cost related to the acquisition of Tapad and negative EBITDA in Tapad, partly offset by improved EBITDA in Telenor Connexion.
• Financial information related to the financial services operation in Myanmar is now reported as part of Other units. The financial information for 2015 has been restated to reflect this.
• Operating profit decreased mainly due to depreciations related to the launch of new business support systems in Denmark.
• NOK 115 million were invested in the development of new business support systems for Denmark and Hungary in the first quarter. This investment accumulates to NOK 691 million.
• Investments in businesses in 2016 were mainly related to acquisition of Tapad and 2015 mainly related to the financing of joint ventures in online classifieds (SnT Classifieds and Search units) in cooperation with Schibsted Classifieds Media, Singapore Press Holdings and Naspers Limited.

8 TELENOR FIRST QUARTER 2016
Groupoverview
The comments below are related to Telenor’s development in 2016 compared to 2015 unless otherwise stated. Telenor Denmark is no longer classified as a discontinued operation. Consequently, historical Group figures are re-presented accordingly.
Revenues• Revenues increased by 5% or NOK 1.6 billion of which NOK 1.0 billion was due to positive currency effects. Significant positive contribution from
Myanmar and Grameenphone was countered by tough market conditions in Thailand, Denmark and Malaysia in addition to the declining fixed revenues and loss of a wholesale contract in Norway last year.
EBITDA before other income and other expenses• EBITDA before other items increased by NOK 0.9 billion or 8%, of which NOK 0.3 billion was due to positive currency effects. The underlying EBITDA
improvement was mainly driven by Myanmar and Bangladesh.
Specification of other income and other expenses
Firstquarter Year
(NOKinmillions) 20162015
Re-presented 2015
EBITDAbeforeotherincomeandexpenses 11685 10795 44197
EBITDAbeforeotherincomeandexpenses(%) 35.4 34.3 34.5
Gainsondisposalsoffixedassetsandoperations 9 90 113
Write-downofnon-currentreceivablesinIndia (611) - -
Lossesondisposalsoffixedassetsandoperations (75) (85) (525)
Workforcereductions,onerous(loss)contractsandonetimepensioncosts (15) (43) (460)
EBITDA 10 994 10 757 43 325
EBITDAmargin(%) 33.3 34.2 33.8
In the first quarter of 2016 ‘Other income and other expenses’ consisted mainly of:• Write-down of non-current receivables in India (NOK 0.6 billion). See note 4 for further information.• Losses on disposals of fixed assets and scrapping mainly in dtac (NOK 36 million) and India (NOK 24 million).• Workforce reduction in Telenor Norway (NOK 75 million), offset by positive impact of settlement with a vendor from exiting some of the old service
areas in India (NOK 83 million).
During the first quarter of 2015, there were no significant transactions reported in ‘Other income and other expenses’.
Impairment• As a consequence of recent development in observed spectrum trading prices and updated assumptions of contractual obligations, Telenor
recognised an impairment loss amounting to NOK 2.3 billion related to tangible and intangible assets in Telenor India. See note 4 for more information.
Operating profit• Reported operating profit decreased by NOK 3.0 billion as higher EBITDA before other items was countered by impairment and write-down in India
and increased depreciation and amortisation. Currency effects positively impacted operating profit by NOK 0.2 billion.
Associated companies and joint ventures
Firstquarter Year
(NOKinmillions) 2016 2015 2015
Telenor's share of
Profitaftertaxes 146 456 (1455)
AmortisationofTelenor'snetexcessvalues (6) (23) (50)
Impairmentlosses 4035 (4) (5565)
Gains(losses)ondisposalofownershipinterests - 224 251
Profit (loss) from associated companies 4 175 653 (6 819)
• Profit after tax from associated companies and joint ventures in the first quarter of 2016 includes positive contribution from VimpelCom of NOK 190 million for Telenor’s 33.0% share of VimpelCom’s result for the fourth quarter of 2015.
• The result from online classifieds joint ventures was negative NOK 46 million in the first quarter of 2016 compared to negative NOK 40 million in the first quarter of 2015.
• As previously disclosed in connection with Telenor’s decision to divest its shares in VimpelCom, the carrying amount of VimpelCom is measured at the lower of carrying amount under equity method before impairment and fair market value. In 2015, impairment loss of NOK 5.5 billion was recognised based on VimpelCom’s share price of USD 3.28 as of the end of 2015. VimpelCom’s share price as of 31 March 2016 was USD 4.26, and hence there is a reversal of impairment of NOK 4.4 billion recognised in the first quarter of 2016.
• Pursuant to Telenor’s agreement to sell its 48% ownership in Amedia for NOK 190 million to Sparebankstiftelsen DNB (Foundation) , an impairment loss of NOK 363 million is recognised in the first quarter of 2016. The transaction is expected to be closed in the second quarter of 2016.

9 TELENOR FIRST QUARTER 2016
Financial items
Firstquarter Year
(NOKinmillions) 20162015
Re-presented 2015
Financialincome 116 114 491
Financialexpenses (667) (652) (2727)
Netcurrencygains(losses) (540) (191) (961)
Netchangeinfairvalueoffinancialinstruments 81 180 277
Netgains(lossesandimpairment)offinancialassetsandliabilities 2 (2) -
Net financial income (expenses) (1 008) (550) (2 921)
Grossinterestexpenses (549) (552) (2327)
Netinterestexpenses (494) (498) (2070)
• The interest expenses for the first quarter of NOK 549 million, includes a refund of interest cost paid on a tax liability of NOK 53 million (one-time effect). Adjusted for this one-time effect, gross interest expenses were at a higher level than the same quarter last year, mainly due to a higher level of interest-bearing debt.
• In the first quarter of 2016, Telenor has recognised a currency loss of NOK 577 million, mainly related to a partial repayment of internal loans which were considered as part of net investment hedges. The translation effects previously recognised in OCI related to the repayment have been recycled through profit or loss.
• Other currency gains were mainly caused by a strengthening of NOK and MMK towards other currencies over the quarter, somewhat offset by currency losses on intercompany positions.
Taxes• For the first quarter of 2016 the estimated effective tax rate is 24%. The effective tax rate is low mainly due to the reversal of write-down of the
VimpelCom investment. The effect is mostly offset by the impairment in India and Amedia.• The effective tax rate for 2016 is estimated to be around 29%.Investments
Firstquarter Year
(NOKinmillions) 20162015
Re-presented 2015
Capex 5578 4722 25193
Capexexcl.licencesandspectrum 5546 4657 23612
Capexexcl.licencesandspectrum/Revenues(%) 16.8 14.8 18.4
• Capital expenditure (excl. licences and spectrum) in 2016 grew by NOK 0.9 billion mainly do to higher investments in Grameenphone and India. Currency effects increased capital expenditure by NOK 0.1 billion.
Cash flow• Net cash inflow from operating activities during the first quarter of 2016 was NOK 11.2 billion, an increase of NOK 2.8 billion compared to the first
quarter of 2015. Profit before taxes adjusted for items without cash effect or not related to operating activites1) was NOK 0.3 billion higher during 2016. In addition, taxes paid were lower with NOK 0.2 billion and changes in working capital and other was higher with NOK 2.2 billion mainly due to working capital improvement in dtac and Norway.
• Net cash outflow to investing activities during the first quarter of 2016 was NOK 9.4 billion, an increase of NOK 5.5 billion compared to the first quarter of 2015. The increase is mainly explained by acquisition of Tapad Inc. of NOK 2.7 billion and NOK 1.3 billion higher cash outflow related to capex and licence investments during 2016. In addition there was a disposal of the associated company Evry ASA resulting in cash inflow of NOK 1.3 billion during the first quarter of 2015.
• Net cash outflow to financing activities during the first quarter of 2016 was NOK 1.5 billion. This is mainly explained by net repayments of borrowings of NOK 0.6 billion and dividends paid to and purchase of shares from non-controlling interest of NOK 0.7 billion.
• Cash and cash equivalents increased by NOK 0.2 billion during the first quarter of 2016 to NOK 14.0 billion as of 31 March 2016.
1) Items without cash effect or not related to operating activities adjusted for include: - Depreciation, amortization and impairment losses - Net (gains) losses from disposals, impairments and change in fair value of financial assets and liabilities - Loss (profit) from associated companies and joint ventures - Currency (gains) losses not related to operating activities
Financial position• During the first quarter, total assets increased by NOK 0.1 billion to NOK 205.0 billion. The increase is mainly due to reversal of impairment of
VimpelCom (see note 3 for further information), increase in assets due to acquisition of Tapad Inc. (see note 2 for further information) and further investments in network. Those effects were partially offset by strengthening of Norwegian Krone against most relevant currencies and impairment loss recognised on Telenor India.
• Net interest bearing debt decreased by NOK 0.5 billion to NOK 53.6 billion. Interest bearing liabilities excluding licences decreased with NOK 0.2 billion, while fair value of hedging instruments increased with NOK 0.4 billion.
• Total equity increased by NOK 3.5 billion to NOK 66.6 billion mainly due to positive net income from operations of NOK 5.1 billion partially offset by dividends to non-controlling interests of NOK 0.5 billion, negative currency translation effects of NOK 0.6 billion and pension re-measurement of NOK 0.4 billion.
Transactions with related partiesFor detailed information on related party transactions refer to Note 32 in Telenor’s Annual Report 2015.

10 TELENOR FIRST QUARTER 2016
Outlookfor2016
Based on the current Group structure, Telenor expects:• Organic revenue growth in the range of 2% to 4%.• EBITDA margin before other income and other expenses in the range of 33% to 34%. • Capital expenditure as a proportion of revenues, excluding licences and spectrum, in the range of 17% to 19%.
Risk and uncertaintiesThe existing risks and uncertainties described below are expected to remain for the next three months.
A growing share of Telenor’s revenues and profits is derived from operations outside Norway. Currency fluctuations may influence the reported figures in Norwegian Kroner to an increasing extent. Political risk, including regulatory conditions, may also influence the results.
For additional explanations regarding risks and uncertainties, please refer to the Report of the Board of Directors for 2015, section Risk Factors and Risk Management, and Telenor’s Annual Report 2015 Note 28 Managing Capital and Financial Risk Management and Note 33 Legal Disputes and Contingencies. Readers are also referred to the disclaimer at the end of this section.
New developments of risks and uncertainties since the publication of Telenor’s Annual Report for 2015 are:
LegaldisputesNo significant developments in the quarter.
FinancialaspectsIn relation to the licence issuance in Myanmar, a performance bond of USD 180 million has been issued to Myanmar authorities as a guarantee towards coverage and quality of service commitments during the next four years of the licence.
DisclaimerThis report contains statements regarding the future in connection with Telenor’s growth initiatives, profit figures, outlook, strategies and objectives. In particular, the section ‘Outlook for 2016’ contains forward-looking statements regarding the Group’s expectations. All statements regarding the future are subject to inherent risks and uncertainties, and many factors can lead to actual profits and developments deviating substantially from what has been expressed or implied in such statements.
Fornebu, 26 April 2016The Board of Directors of Telenor ASA

11 TELENOR FIRST QUARTER 2016
ConsolidatedincomestatementTelenorGroup
Firstquarter Year
(NOKinmillionsexceptearningspershare) 20162015
Re-presented 2015
Revenues 33013 31446 128175
Costsofmaterialsandtrafficcharges (8442) (8990) (35147)
Salariesandpersonnelcosts (3381) (3078) (12406)
Otheroperatingexpenses (9506) (8583) (36425)
Otherincome 9 90 113
Otherexpenses (700) (128) (985)
EBITDA 10 994 10 757 43 325
Depreciationandamortisation (5044) (4180) (18384)
Impairmentlosses (2430) (13) (2181)
Operating profit 3 520 6 564 22 761
Shareofnetincomefromassociatedcompaniesandjointventures 4175 428 (7070)
Gain(loss)ondisposalofassociatedcompanies - 224 251
Netfinancialincome(expenses) (1008) (550) (2921)
Profit before taxes 6 688 6 667 13 020
Incometaxes (1601) (1850) (6317)
Net income 5 086 4 817 6 704
Net income attributable to:
Non-controllinginterests 830 967 3289
EquityholdersofTelenorASA 4256 3852 3414
Earnings per share in NOK
Basicfromtotaloperations 2.83 2.57 2.27
Dilutedfromtotaloperations 2.83 2.57 2.27
The interim financial information has not been subject to audit or review.
Interim condensed financial information

12 TELENOR FIRST QUARTER 2016
ConsolidatedstatementofcomprehensiveincomeTelenorGroup
Firstquarter Year
(NOKinmillions) 20162015
Re-presented 2015
Net income 5 086 4 817 6 703
Translationdifferencesonnetinvestmentinforeignoperations (2744) 2927 7774
Incometaxes 82 11 (3)
Amountreclassifiedfromothercomprehensiveincometoincomestatementonpartialdisposal (658) - (15)
Netgain(loss)onhedgeofnetinvestment 2224 (751) (5491)
Incometaxes (556) 202 1232
Amountreclassifiedfromothercomprehensiveincometoincomestatementonpartialdisposal 1082 - -
Netgain(loss)onavailable-for-sale-investment (6) 12 (17)
Shareofothercomprehensiveincome(loss)ofassociatedcompaniesandjointventures 352 (1132) (3357)
Amountreclassifiedfromothercomprehensiveincometoincomestatementondisposal - (23) (23)
Items that may be reclassified subsequently to income statement (224) 1 247 99
Remeasurementofdefinedbenefitpensionplans (447) 340 1111
Incometaxes 91 (92) (249)
Items that will not be reclassified to income statement (355) 248 862
Other comprehensive income (loss), net of taxes (579) 1 495 961
Total comprehensive income 4 509 6 313 7 665
Total comprehensive income attributable to:
Non-controllinginterests 616 1366 3762
EquityholdersofTelenorASA 3892 4947 3903
The interim financial information has not been subject to audit or review.
13 TELENOR FIRST QUARTER 2016
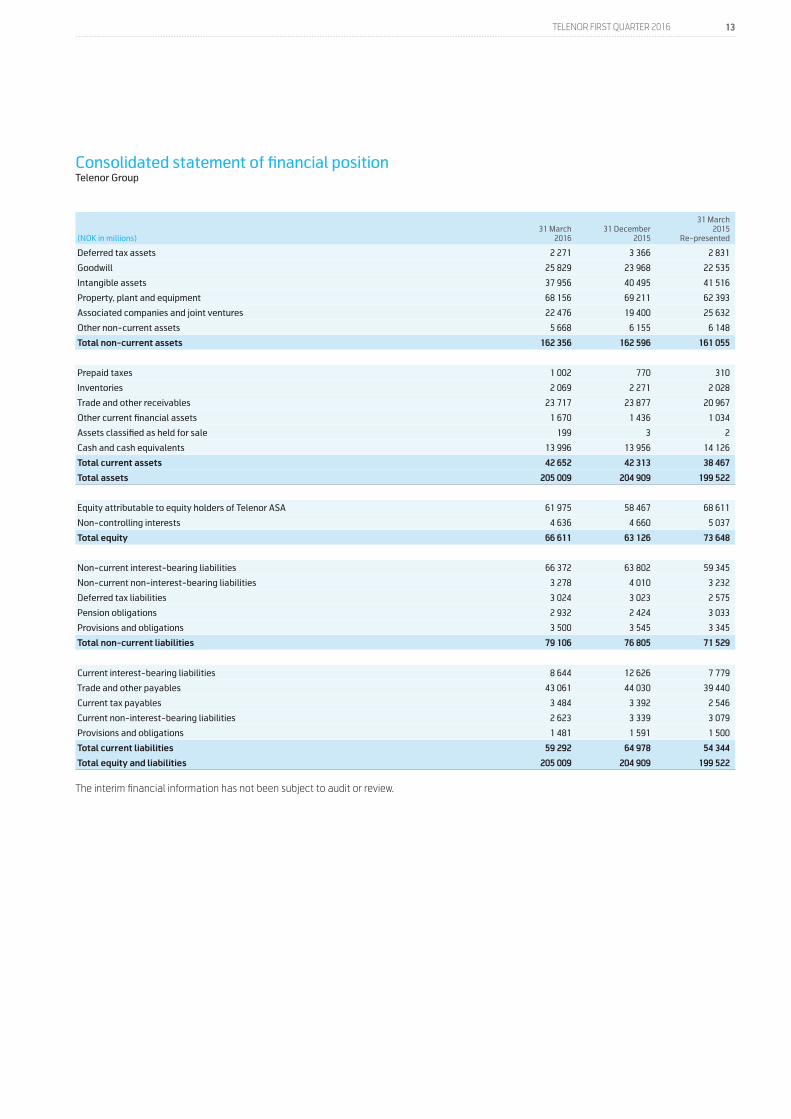
ConsolidatedstatementoffinancialpositionTelenorGroup
(NOKinmillions)31March
201631December
2015
31March2015
Re-presented
Deferredtaxassets 2271 3366 2831
Goodwill 25829 23968 22535
Intangibleassets 37956 40495 41516
Property,plantandequipment 68156 69211 62393
Associatedcompaniesandjointventures 22476 19400 25632
Othernon-currentassets 5668 6155 6148
Total non-current assets 162 356 162 596 161 055
Prepaidtaxes 1002 770 310
Inventories 2069 2271 2028
Tradeandotherreceivables 23717 23877 20967
Othercurrentfinancialassets 1670 1436 1034
Assetsclassifiedasheldforsale 199 3 2
Cashandcashequivalents 13996 13956 14126
Total current assets 42 652 42 313 38 467
Total assets 205 009 204 909 199 522
EquityattributabletoequityholdersofTelenorASA 61975 58467 68611
Non-controllinginterests 4636 4660 5037
Total equity 66 611 63 126 73 648
Non-currentinterest-bearingliabilities 66372 63802 59345
Non-currentnon-interest-bearingliabilities 3278 4010 3232
Deferredtaxliabilities 3024 3023 2575
Pensionobligations 2932 2424 3033
Provisionsandobligations 3500 3545 3345
Total non-current liabilities 79 106 76 805 71 529
Currentinterest-bearingliabilities 8644 12626 7779
Tradeandotherpayables 43061 44030 39440
Currenttaxpayables 3484 3392 2546
Currentnon-interest-bearingliabilities 2623 3339 3079
Provisionsandobligations 1481 1591 1500
Total current liabilities 59 292 64 978 54 344
Total equity and liabilities 205 009 204 909 199 522
The interim financial information has not been subject to audit or review.

14 TELENOR FIRST QUARTER 2016
ConsolidatedstatementofcashflowsTelenorGroup
Firstquarter Year
(NOKinmillions) 20162015
Re-presented 2015
Profitbeforetaxesfromtotaloperation 6688 6667 13020
Incometaxespaid (1269) (1512) (5141)
Net(gains)lossesfromdisposals,impairmentsandchangeinfairvalueoffinancialassetsandliabilities (35) (183) 81
Depreciation,amortisationandimpairmentlosses 7474 4193 20565
Loss(profit)fromassociatedcompaniesandjointventures (4175) (653) 6819
Dividendsreceivedfromassociatedcompanies - - 189
Currency(gains)lossesnotrelatedtooperatingactivities 646 224 667
Changesinworkingcapitalandother 1888 (343) 906
Net cash flow from operating activities 11 216 8 394 37 107
Purchasesofproperty,plantandequipment(PPE)andintangibleassets (6223) (4898) (21168)
Purchasesofsubsidiaries,associatedcompaniesandjointventures,netofcashacquired (2732) (308) (497)
ProceedsfromPPE,intangibleassetsandbusinesses,netofcashdisposed 14 1313 1462
Proceedsfromandpurchasesofotherinvestments (430) (21) (79)
Net cash flow from investing activities (9 372) (3 913) (20 281)
Proceedsfromandrepaymentsofborrowings (600) (2071) (540)
Dividendspaidtoandpurchasesofsharesfromnon-controllinginterests (694) (611) (3777)
DividendspaidtoequityholdersofTelenorASA (235) - (10724)
Net cash flow from financing activities (1 530) (2 682) (15 041)
Effectsofexchangeratechangesoncashandcashequivalents (102) 189 81
Net change in cash and cash equivalents 213 1 988 1 866
Cashandcashequivalentsatthebeginningoftheperiod 13760 11893 11893
Cash and cash equivalents at the end of the period1) 13 973 13 881 13 760
1) As of 31 March 2016, restricted cash was NOK 444 million, while as of 31 March 2015, restricted cash was NOK 507 million
The interim financial information has not been subject to audit or review.

15 TELENOR FIRST QUARTER 2016
ConsolidatedstatementofchangesinequityTelenorGroup
Attributabletoequityholdersoftheparent
(NOKinmillions)Totalpaid
incapitalOther
reservesRetainedearnings
Cumulativetranslationdifferences Total
Non-controlling
interestsTotal
equity
Equity as of 1 January 2015 9 078 (20 377) 73 974 1 080 63 755 4 750 68 505
Netincomefortheperiod - - 3414 - 3414 3289 6703
Othercomprehensiveincomefortheperiod - (2534) - 3022 488 473 961
Total comprehensive income for the period - (2 534) 3 414 3 022 3 903 3 762 7 665
Transactionswithnon-controllinginterests - (2) - - (2) 24 22
Equityadjustmentsinassociatedcompaniesandjointventures - 1732 - - 1732 - 1732
Dividends - - (10959) - (10959) (3876) (14835)
Share-basedpayment,exerciseofshareoptionsanddistributionofshares - 37 - - 37 - 37
Equity as of 31 December 2015 9 078 (21 143) 66 429 4 102 58 467 4 660 63 126
Netincomefortheperiod - - 4256 - 4256 830 5086
Othercomprehensiveincomefortheperiod - 31 - (395) (365) (214) (579)
Total comprehensive income for the period - 31 4 256 (395) 3 892 616 4 404
Transactionswithnon-controllinginterests - (156) - - (156) (139) (296)
Equityadjustmentsinassociatedcompaniesandjointventures - (229) - - (229) - (229)
Dividends - - - - - (501) (501)
Share-basedpayment,exerciseofshareoptionsanddistributionofshares - 2 - - 2 - 2
Equity as of 31 March 2016 9 078 (21 495) 70 685 3 706 61 976 4 636 66 611
Attributabletoequityholdersoftheparent
(NOKinmillions)Totalpaid
incapitalOther
reservesRetainedearnings
Cumulativetranslationdifferences Total
Non-controlling
interestsTotal
equity
Equity as of 1 January 2015 9 078 (20 377) 73 974 1 080 63 755 4 750 68 505
Netincomefortheperiod - - 3851 - 3851 967 4818
Othercomprehensiveincomefortheperiod - (894) - 1990 1096 399 1495
Total comprehensive income for the period - (894) 3 851 1 990 4 947 1 366 6 313
Equityadjustmentsinassociatedcompanies - (96) - - (96) - (96)
Dividends - - - - - (1079) (1079)
Share-basedpayment,exerciseofshareoptionsanddistributionofshares - 4 - - 4 - 4
Equity as of 31 March 2015 - Re-presented 9 078 (21 362) 77 825 3 069 68 611 5 037 73 648

16 TELENOR FIRST QUARTER 2016
Note 1 – General accounting principlesTelenor (the Group) consists of Telenor ASA (the Company) and its subsidiaries. Telenor ASA is a limited liability company, incorporated in Norway. The condensed consolidated interim financial statements consist of the Group and the Group’s interests in associated companies and joint arrangements. As a result of rounding differences, numbers or percentages may not add up to the total.
These interim condensed consolidated financial statements for the three months ending 31 March 2016, have been prepared in accordance with IAS 34 Interim Financial Reporting. The interim condensed consolidated financial statements do not include all the information and disclosures required in the annual financial statements and should be read in conjunction with the Group’s Annual Financial Statements 2015. The accounting policies adopted in the preparation of the interim consolidated financial statements are consistent with those followed in the preparation of the Group’s Annual Financial Statements for the year ended 31 December 2015.
For the first quarter 2015, Telenor Denmark was presented as discontinued operations due to the planned merger between Telenor and TeliaSonera. On 11 September 2015, Telenor and TeliaSonera announced the withdrawal of the proposed merger and Telenor Denmark ceased to be classified as discontinued operations. Telenor Denmark is consolidated as continuing business with retrospective effect and financial statements for the first quarter 2015 have been re-presented.
For information about the standards and interpretations effective from 1 January 2016, please refer to Note 1 in the Group’s Annual Report 2015. The standards and interpretations effective from 1 January 2016 do not have a significant impact on the Group’s consolidated interim financial statements.
Note 2 – Business combinationOn 18 February 2016, the Group acquired approximately 95% of the interests in Tapad Inc., a leading marketing technology firm based in New York, for a cash consideration of NOK 2.7 billion. For the remaining 5% of the interests, Telenor has entered into a put and call arrangement with the non-controlling shareholders. Effectively, the acquisition is recognised as the Group has acquired 100% of the interests in Tapad Inc. A liability of NOK 133 million was recognised on the acquisition date, reflecting the put option’s redemption amount. Any subsequent change to the redemption amount will be recognised in the income statement. The Group currently holds approximately 95% of the voting rights in Tapad Inc. The acquisition related transaction cost was approximately NOK 63 million, recognised as other operating expenses.
Tapad Inc. delivers unified cross-device marketing technology solutions that give publishers, marketers and technology providers a holistic view of consumers across devices and screens, including smartphones, tablets, home computers and smart TVs. Tapad Inc. currently has more than 160 of the top U.S. brands among its customers and benefits from over 50 data technology licensing partnerships. The acquisition enables Telenor to take a position within the rapidly growing market for advertising technology and secures important competence within digital marketing and analytics. Tapad Inc. has approximately 160 employees, with offices in 13 key cities in the U.S. and Europe.
The purchase price allocation, which was performed with assistance from third-party valuation experts, has been determined to be preliminary pending upon the final assessment of identifiable assets. The preliminary fair values of the identifiable assets and liabilities of the business as at the date of acquisition were:
NOKinmillionsPreliminaryfairvalues
asofacquisitiondate
Technology 720
Otherintangibleassets 98
Property,plant&equipment 65
Otherassets 179
Total assets 1 062
Deferredtaxliability 272
Non-currentliabilities 82
Currentliabilities 310
Total liabilities 663
Net identifiable assets 399
Goodwill 2492
Total consideration for the shares, 2 890
Ofwhichcash 2740
Ofwhichliability 151
The goodwill of NOK 2.5 billion comprises of the value of expected synergies arising from the acquisition, database of search-based and customer related information, assembled workforce and deferred tax on excess values. None of the goodwill is expected to be deductible for income tax purposes.
For the period between the date of acquisition and 31 March 2016, Tapad Inc. contributed NOK 67 million to Revenue and NOK 26 million negative to Telenor Group’s profit before taxes. If the business combination had taken place at the beginning of the year, Revenue would have been NOK 33 059 million and Profit before taxes for the Group would have been NOK 6 655 million.
Note 3 – Associated companies and joint venturesVimpelComLtd.On 5 October 2015, Telenor Group announced its intention to divest all its shares in VimpelCom. Accordingly, the carrying amount of VimpelCom is measured at the lower of carrying amount based on the equity method before impairment and market value. An impairment loss of NOK 5.5 billion was recognized in 2015 based on VimpelCom’s share price of USD 3.28 as of the end of 2015. In the first quarter of 2016, reversal of impairment charge of NOK 4.4 billion is made based on VimeplCom’s share price of USD 4.26 as of 31 March 2016. After the reversal of impairment, the carrying amount of the investment in VimpelCom is NOK 20.5 billion, equivalent to USD 4.26 per share.
VimpelCom will continue to be classified as an associated company until it is highly probable that a sale within 12 months will occur. The cumulative income and expenses recognised in other comprehensive income amounting to a net loss of NOK 10.2 billion as per 31 March 2016, will be proportionately recycled to the income statement upon disposal. Total equity for the Group will not be impacted by the recycling effects.
Notestotheinterimconsolidatedfinancialstatements

17 TELENOR FIRST QUARTER 2016
Note 4 – ImpairmentThe Group has applied fair value less cost of disposal when determining recoverable amount of Telenor India. Key assumptions in determining the fair value less cost of disposal (level 3) have been spectrum prices and contractual obligations in India. As a consequence of the development in spectrum trading prices and updated assumptions of the contractual obligations, the Group has reassessed the fair value less cost of disposal of Telenor India. An impairment loss of NOK 2.3 billion has been recognised in the first quarter of 2016, of which NOK 1.4 billion mainly relates to network equipment and the remaining NOK 0.9 billion mainly relates to spectrum. The recoverable amount of tangible and intangible assets in Telenor India after impairment is NOK 4.5 billion. In addition, NOK 0.6 billion in non-interest-bearing receivables have been written down during the quarter.
Note 5 – Interest-bearing liabilitiesFair value of interest-bearing liabilities recognised at amortised cost:
31March2016
NOKinmillions Carryingamount Fairvalue
Interest-bearingfinancialliabilities (75015) (79620)
ofwhichfairvaluelevel1 (53831)
ofwhichfairvaluelevel2 (25789)
31December2015
NOKinmillions Carryingamount Fairvalue
Interest-bearingfinancialliabilities (76428) (80422)
ofwhichfairvaluelevel1 (54423)
ofwhichfairvaluelevel2 (25999)
31March2015
NOKinmillions Carryingamount Fairvalue
Interest-bearingfinancialliabilities (66753) (71928)
ofwhichfairvaluelevel1 (47563)
ofwhichfairvaluelevel2 (24365)
Note 6 – Fair value of financial instrumentsFinancial derivatives are recognised at fair value based on observable market data (level 2). See note 29 in the Annual Report 2015 for valuation methodologies. The financial derivatives are classified in the statement of financial position as disclosed in the table:
NOKinmillions31March
201631December
201531March
2015
Othernon-currentassets 3858 3547 3331
Otherfinancialcurrentassets 390 391 166
Non-currentnon-interest-bearingfinancialliabilities (2770) (3615) (2825)
Non-currentinterest-bearingfinancialliabilities - - -
Currentnon-interest-bearingliabilities (627) (960) (1445)
Total 851 ( 637) ( 774)

18 TELENOR FIRST QUARTER 2016
Note 7 – Events after the reporting periodOn 22 April 2016, the Board of Directors of Digi declared the first interim dividend for 2016 of MYR 0.051 per share which corresponds to approximately NOK 0.8 billion total dividend and approximately NOK 0.4billion for Telenor ownership share.
Note 8 – Segment table and reconciliation of ebitda before other income and other expensesTelenor Denmark is no longer classified as “Discontinued Operation”. Consequently, the figures for previous periods were re-presented accordingly.
As of third quarter 2015 international voice traffic previously reported as part of Telenor Pakistan is now reported under Global Wholesale, which is part of Other Units. The financial information for previous periods is restated accordingly.
Financial information related to the financial services operation in Myanmar is now reported as part of Other units. The financial information for 2015 has been restated to reflect this.
The operationsFirstquarter
Totalrevenues ofwhichinternal EBITDAbeforeotherincomeandotherexpenses1) EBITDA Operatingprofit(loss) Investments2)
(NOKinmillions) 2016 2015 Growth 2016 2015 2016 Margin 2015 Margin 2016 Margin 2015 Margin 2016 Margin 2015 Margin 2016 2015
Norway 6330 6624 (4.4%) 75 73 2772 43.8% 2792 42.2% 2695 42.6% 2761 41.7% 1772 28.0% 1869 28.2% 908 848
Sweden 3121 2984 4.6% 14 19 893 28.6% 854 28.6% 893 28.6% 857 28.7% 479 15.4% 491 16.5% 336 311
Denmark 1256 1256 (0.0%) 28 20 162 12.9% 208 16.6% 153 12.2% 202 16.1% 80 6.4% 1 0.1% 118 134
Hungary 1117 1098 1.8% 15 7 354 31.7% 354 32.2% 351 31.4% 348 31.7% 190 17.0% 208 18.9% 46 67
Bulgaria 758 685 10.7% 4 2 286 37.8% 253 37.0% 287 37.8% 256 37.4% 137 18.1% 173 25.3% 33 113
Montenegro&Serbia 952 853 11.6% 41 31 296 31.1% 285 33.4% 296 31.1% 285 33.4% 169 17.7% 184 21.6% 82 105
DTAC-Thailand 5260 5443 (3.4%) 27 17 1778 33.8% 1760 32.3% 1741 33.1% 1751 32.2% 515 9.8% 779 14.3% 1139 1314
Digi-Malaysia 3405 3837 (11.2%) 2 1 1431 42.0% 1672 43.6% 1431 42.0% 1672 43.6% 1110 32.6% 1371 35.7% 351 412
Grameenphone-Bangladesh 3045 2516 21.0% - - 1684 55.3% 1363 54.2% 1683 55.3% 1363 54.2% 1124 36.9% 955 38.0% 1004 370
Pakistan 2144 1829 17.3% 20 36 847 39.5% 767 41.9% 843 39.3% 773 42.3% 547 25.5% 518 28.3% 315 326
India 1520 1383 9.9% - - 35 2.3% (54) nm (516) nm (50) nm (3100) nm (159) nm 409 109
Myanmar 1722 768 124.4% 63 18 718 41.7% 152 19.8% 718 41.7% 152 19.8% 528 30.6% 32 4.2% 565 442
Broadcast 1765 1530 15.3% 41 41 732 41.5% 457 29.9% 731 41.4% 458 30.0% 442 25.0% 326 21.3% 95 75
Otherunits 1835 1617 13.5% 888 710 (306) nm (68) nm (313) nm (70) nm (474) nm (189) nm 3312 406
Eliminations (1217) (976) 24.7% (1217) (976) - - - - - - - - 1 (0.1%) 3 (0.3%) - -
Group 33 013 31 446 5.0% - - 11 685 35.4% 10 795 34.3% 11 605 35.2% 10 757 34.2% 3 520 10.7 % 6 564 20.9 % 8 715 5 030
1) The segment profit is EBITDA before other income and other expenses. 2) Investments consist of capex and investments in businesses, licences and spectrum.

19 TELENOR FIRST QUARTER 2016
The operationsFirstquarter
Totalrevenues ofwhichinternal EBITDAbeforeotherincomeandotherexpenses1) EBITDA Operatingprofit(loss) Investments2)
(NOKinmillions) 2016 2015 Growth 2016 2015 2016 Margin 2015 Margin 2016 Margin 2015 Margin 2016 Margin 2015 Margin 2016 2015
Norway 6330 6624 (4.4%) 75 73 2772 43.8% 2792 42.2% 2695 42.6% 2761 41.7% 1772 28.0% 1869 28.2% 908 848
Sweden 3121 2984 4.6% 14 19 893 28.6% 854 28.6% 893 28.6% 857 28.7% 479 15.4% 491 16.5% 336 311
Denmark 1256 1256 (0.0%) 28 20 162 12.9% 208 16.6% 153 12.2% 202 16.1% 80 6.4% 1 0.1% 118 134
Hungary 1117 1098 1.8% 15 7 354 31.7% 354 32.2% 351 31.4% 348 31.7% 190 17.0% 208 18.9% 46 67
Bulgaria 758 685 10.7% 4 2 286 37.8% 253 37.0% 287 37.8% 256 37.4% 137 18.1% 173 25.3% 33 113
Montenegro&Serbia 952 853 11.6% 41 31 296 31.1% 285 33.4% 296 31.1% 285 33.4% 169 17.7% 184 21.6% 82 105
DTAC-Thailand 5260 5443 (3.4%) 27 17 1778 33.8% 1760 32.3% 1741 33.1% 1751 32.2% 515 9.8% 779 14.3% 1139 1314
Digi-Malaysia 3405 3837 (11.2%) 2 1 1431 42.0% 1672 43.6% 1431 42.0% 1672 43.6% 1110 32.6% 1371 35.7% 351 412
Grameenphone-Bangladesh 3045 2516 21.0% - - 1684 55.3% 1363 54.2% 1683 55.3% 1363 54.2% 1124 36.9% 955 38.0% 1004 370
Pakistan 2144 1829 17.3% 20 36 847 39.5% 767 41.9% 843 39.3% 773 42.3% 547 25.5% 518 28.3% 315 326
India 1520 1383 9.9% - - 35 2.3% (54) nm (516) nm (50) nm (3100) nm (159) nm 409 109
Myanmar 1722 768 124.4% 63 18 718 41.7% 152 19.8% 718 41.7% 152 19.8% 528 30.6% 32 4.2% 565 442
Broadcast 1765 1530 15.3% 41 41 732 41.5% 457 29.9% 731 41.4% 458 30.0% 442 25.0% 326 21.3% 95 75
Otherunits 1835 1617 13.5% 888 710 (306) nm (68) nm (313) nm (70) nm (474) nm (189) nm 3312 406
Eliminations (1217) (976) 24.7% (1217) (976) - - - - - - - - 1 (0.1%) 3 (0.3%) - -
Group 33 013 31 446 5.0% - - 11 685 35.4% 10 795 34.3% 11 605 35.2% 10 757 34.2% 3 520 10.7 % 6 564 20.9 % 8 715 5 030
1) The segment profit is EBITDA before other income and other expenses. 2) Investments consist of capex and investments in businesses, licences and spectrum.
Reconciliation
Firstquarter Year
(NOKinmillions) 20162015
Re-presented 2015
Net income 5 086 4 817 6 704
Incometaxes (1601) (1850) (6317)
Profit before taxes 6 688 6 667 13 020
Netfinancialincome(expenses) (1008) (550) (2921)
Profit(loss)fromassociatedcompaniesandjointventures 4175 653 (6819)
Depreciationandamortisation (5044) (4180) (18384)
Impairmentlosses (2430) (13) (2181)
EBITDA 10 994 10 757 43 325
Otherincome 9 90 113
Otherexpenses (700) (128) (985)
EBITDA before other income and other expenses 11 685 10 795 44 197

20 TELENOR FIRST QUARTER 2016
Definitions• Organic revenue is defined as revenue adjusted for the effects of
acquisition and disposal of operations and currency effects.• Capital expenditure (capex) is investments in tangible and intangible
assets.• Operating cash flow is defined as EBITDA before other income and
expenses less capex, excluding licences and spectrum.• Investments in businesses comprise acquisitions of shares and
participations, including acquisitions of subsidiaries and businesses not organised as separate companies.
Mobileoperations
RevenuesSubscriptionandtrafficConsist of subscription and connection fees, revenues from voice (outgoing traffic) and non-voice traffic, outbound roaming and other mobile service revenues. Subscription and traffic includes only revenues from the company’s own subscriptions.
InterconnectConsist of revenues from incoming traffic related to the company’s own subscriptions. Revenues from incoming traffic related to service provider or MVNO subscriptions are not included.
OthermobileConsist of inbound roaming, national roaming, telemetric and revenues related to service providers and MVNOs (Mobile Virtual Network Operators). Telemetric is defined as machine-to-machine SIM cards (M2M), for example vending machines and meter readings.
Non-mobileConsist of revenues from customer equipment and businesses that are not directly related to mobile operations.
Mobilerevenuesfromcompany’sownsubscriptionsConsist of ‘Subscription and traffic’ and ‘Interconnect’ and do not include revenues from inbound roaming, national roaming, service providers, MVNOs, sale of customer equipment and incoming traffic related to service provider subscriptions.
Key FiguresSubscriptionsContract subscriptions are counted until the subscription is terminated or until there has been no revenues or outgoing/incoming traffic during the last three months. Prepaid subscriptions are counted as active if there has been outgoing or incoming traffic or if the SIM card has been reloaded during the last three months. Service provider and MVNO subscriptions are not included. Data only SIM cards are included, but SIM cards used for telemetric applications and twin/multi SIM cards are excluded. Total subscriptions are voice SIM cards plus data only SIM cards used for mobile broadband.
ActivemobileinternetusersActive mobile internet users are subscriptions with at least 150 KB of data during the last three months.
Averagetrafficminutespersubscriptionpermonth(AMPU)Traffic minutes per subscription per month are calculated based on total outgoing and incoming rated minutes from the company’s own subscriptions less data only subscriptions. This includes zero rated minutes and outgoing minutes from own subscriptions while roaming. Outgoing and incoming minutes related to inbound roaming, national roaming, service providers and MVNOs are not included.
Averagerevenuepersubscriptionpermonth(ARPU)ARPU is calculated based on mobile revenues from the company’s own subscriptions, divided by the average number of subscriptions for the relevant period.
Fixedoperations
RevenuesTelephonyConsist of subscription and connection fees, traffic (fixed to fixed, fixed to mobile, to other countries, value added services, other traffic) for PSTN/ISDN and Voice over Internet Protocol (VoIP).
InternetandTVConsist of subscription, traffic charges and connection fees for xDSL and fibre, in addition to revenues from TV services. High speed connections include fibre, cable and VDSL.
DataservicesConsist of Nordic Connect/IP-VPN and security.
OtherConsist of leased lines, managed services and other retail products.
WholesaleConsist of sale to service providers of telephony (PSTN/ISDN), Bitstream, LLUB, national and international interconnect, transit traffic, leased lines and other wholesale products.
Key FiguresSubscriptionsTelephony consist of PSTN, ISDN and VoIP subscriptions. Internet consists of broadband access over xDSL, fibre and cable TV. TV consists of TV services over fibre and cable. Subscriptions are counted until the subscription is terminated.
Averagerevenuepersubscriptionpermonth(ARPU)ARPU is calculated based on revenues from the company’s own subscriptions, divided by the average number of subscriptions for the relevant period. Internet ARPU is calculated based on Internet revenues as defined above except TV service revenues. TV ARPU is calculated based on revenues from TV services.
Broadcast
RevenuesCanalDigitalDTHConsist of revenues from Nordic DTH subscribers, households in SMATV networks and DTT subscribers in Finland.
SatelliteConsist of revenues from satellite services from the satellite position 1-degree west.
NorkringConsist of revenues from terrestrial radio and TV transmission in Norway and Belgium.


2161
099
• Bo
lt Co
mm
unic
atio
n AS
• b
oltc
omm
unic
atio
n.no
First quarter 2016Published by Telenor ASAN-1331 Fornebu, NorwayPhone: +47 67 89 00 00
InvestorRelations:Phone: +47 67 89 24 70e-mail: [email protected]
www.telenor.com