telenor group first quarter
TRANSCRIPT

TELENOR GROUP – FIRST QUARTER Sigve Brekke, CEO

DISCLAIMER The following presentation is being made only to, and is only
directed at, persons to whom such presentation may lawfully be
communicated (’relevant persons’). Any person who is not a
relevant person should not act or rely on this presentation or any
of its contents. Information in the following presentation relating to
the price at which relevant investments have been bought or sold
in the past or the yield on such investments cannot be relied upon
as a guide to the future performance of such investments.
This presentation does not constitute an offering of securities or
otherwise constitute an invitation or inducement to any person to
underwrite, subscribe for or otherwise acquire securities in any
company within the Telenor Group. The release, publication or
distribution of this presentation in certain jurisdictions may be
restricted by law, and therefore persons in such jurisdictions into
which this presentation is released, published or distributed
should inform themselves about, and observe, such restrictions.
This presentation contains statements regarding the future in
connection with the Telenor Group’s growth initiatives, profit
figures, outlook, strategies and objectives. In particular, the slide
“Outlook for 2016” contains forward-looking statements regarding
the Telenor Group’s expectations. All statements regarding the
future are subject to inherent risks and uncertainties, and many
factors can lead to actual profits and developments deviating
substantially from what has been expressed or implied in such
statements.
2

HIGHLIGHTS Q1 2016 A SOLID START TO THE YEAR
• 5.4 million new mobile subscribers
• 6% organic growth in mobile subscription and traffic revenues
• 5% organic EBITDA growth
• Operating cash flow of NOK 6.1 billion
3

Q1 2016
FIXED
• 6% revenue decline, primarily driven by telephony, ADSL
and wholesale
• 12k new high-speed internet subscribers, compensating
for ADSL decline
REVENUE GROWTH IN NORWAY IMPACTED BY LOWER
HANDSET SALES AND DECLINING FIXED LEGACY REVENUES
MOBILE
• 1% organic growth in mobile subscription and traffic
revenues
• Lower handset sales volumes
• New tariffs launched - includes EU roaming
4 Organic revenue growth Organic growth assuming fixed currency, adjusted for acquisitions and
disposals. EBITDA margin before other items.
264 265 274 281 276 278
24 24 26 34 22 22
Q4 14 Q1 15 Q2 15 Q3 15 Q4 15 Q1 16
Domestic Roaming Interconnect
3 730 3 685 3 787 3 752 3 857 3 581
2 999 2 937 2 813 2 836 2 875 2 749
Q4 14 Q1 15 Q2 15 Q3 15 Q4 15 Q1 16
Mobile Fixed
-4%
Revenues (NOK m) Mobile ARPU (NOK)

Q1 2016
LONG TERM EFFICIENCY INITIATIVES
• Reduce complexity of products, processes and IT systems
• Scope extended to include cable operation
• Net positive effect from 2017
SOLID PROFITABILITY IN NORWAY, PROGRESS ON LONG
TERM EFFICIENCY INITIATIVES
44% EBITDA MARGIN
• Mobile gross profit stable despite lower roaming and
wholesale contribution
• Opex impacted by lower commissions and operation &
maintenance costs
5 EBITDA margin before other items.
Long term efficiency programme (NOK m) EBITDA development YoY (NOK m)
2 792
-188
2 772 168
Q1 15 Gross profit Opex Q1 16
Th
ou
san
ds
~900
Project cost
Opex savings
(200) (350) (380)
2015 2017 2018 2019 2016 2014 2020

Q1 2016
FIXED
• 11k new high-speed internet subscribers
• Aiming to cover 500k new single dwelling households by
2020
CONTINUED GROWTH IN CONSUMER MOBILE IN SWEDEN
MOBILE
• 2% organic growth in mobile subscription and traffic
revenues driven by consumer
• 3k net subscriber growth
• Total mobile revenues impacted by handset sales
6 Organic revenue growth Organic growth assuming fixed currency, adjusted for acquisitions and
disposals. EBITDA margin before other items.
Revenues (NOK m) and EBITDA margin (%) Mobile organic subscription & traffic revenue growth
3 114 2 984 2 996 3 188
3 409 3 121
25% 29% 28% 32% 28% 29%
Q4 14 Q1 15 Q2 15 Q3 15 Q4 15 Q1 16
1.6 %
-0.1 %
0.2 %
2.5 % 2.1 %
1.7 %
Q4 14 Q1 15 Q2 15 Q3 15 Q4 15 Q1 16
-5%

Q1 2016
CONTINUATION OF TRENDS IN OTHER EUROPEAN MARKETS
DENMARK
• Continued intense competition
• Launch of new business support system
HUNGARY
• Solid trends in postpaid consumer segment, offset by
pressure in prepaid and SME
MONTENEGRO AND SERBIA
• 6% organic ARPU growth from increased IC revenues and
higher postpaid share
BULGARIA
• Cost control supporting EBITDA margin
7 Organic revenue growth Organic growth assuming fixed currency, adjusted for acquisitions and
disposals. EBITDA margin before other items.
Revenues (NOK m) and EBITDA margin (%)
Denmark Hungary
Bulgaria MNE & Serbia
1 256 1 256
17% 13%
Q1 15 Q1 16
1 098 1 117
32% 32%
Q1 15 Q1 16
853 952
33% 31%
Q1 15 Q1 16
685 758
37% 38%
Q1 15 Q1 16
-8% -6%
3% 1%

Q1 2016
SUBSCRIBER GROWTH AMIDST INTENSE COMPETITION
IN THAILAND
• 225k net subscriber growth
• 2% organic decline in subscription and traffic revenues
• EBITDA margin improvement from lower device subsidies
• 3G population coverage at 94%, 4G now in all 77
provinces
• Solid spectrum portfolio until concession expiry in
September 2018
8 Organic growth assuming fixed currency, adjusted for acquisitions and
disposals. EBITDA margin before other items.
Revenues (NOK m) and EBITDA margin (%)
5 265 5 443 5 112
4 600
5 533 5 260
27% 32% 31%
36% 29%
34%
Q4 14 Q1 15 Q2 15 Q3 15 Q4 15 Q1 16
-5%
Organic revenue growth

Q1 2016
SOLID POSTPAID PERFORMANCE IN MALAYSIA
• 221k net subscriber growth and maintained market share
in highly competitive market
• 2% organic decline in subscription and traffic revenues
• 7% organic growth in postpaid service revenues and
stable postpaid ARPU*
• 3G/4G population coverage at 88%/73%
• EBITDA continues to be impacted by margin pressure on
international traffic
9 Organic growth assuming fixed currency, adjusted for acquisitions and disposals.
EBITDA margin before other items. *) Service revenues according to local definition.
Revenues (NOK m) and EBITDA margin (%)
3 667 3 837 3 649 3 390 3 430 3 405
45% 44% 45% 44% 40% 42%
Q4 14 Q1 15 Q2 15 Q3 15 Q4 15 Q1 16
Postpaid subscribers (‘000)
Organic revenue growth
-8%
1 721 1 758 1 771 1 776 1 840 1 902
Q4 14 Q1 15 Q2 15 Q3 15 Q4 15 Q1 16

Q1 2016
Revenues (NOK m) and EBITDA margin (%) Revenues (NOK m) and EBITDA margin (%)
STRONG PERFORMANCE IN BANGLADESH AND PAKISTAN
BANGLADESH (GRAMEENPHONE)
• 12% organic subscription and traffic revenue growth
• 55% EBITDA margin
• SIM re-registration >50% completed
10 Organic growth assuming fixed currency, adjusted for acquisitions and
disposals. EBITDA margin before other items.
2 306 2 516 2 630
2 811 2 924 3 045
50% 54% 54% 51% 55% 55%
Q4 14 Q1 15 Q2 15 Q3 15 Q4 15 Q1 16
9% 1 581 1 829 1 900 1 988 2 049 2 144
31% 42%
32%
46% 43% 40%
Q4 14 Q1 15 Q2 15 Q3 15 Q4 15 Q1 16
PAKISTAN
• 2.2 million net subscriber growth
• 2% organic subscription and traffic revenue growth
• 40% EBITDA margin
Organic revenue growth
9%

Q1 2016
FIRST QUARTER WITH POSITIVE OPERATING CASH FLOW
IN MYANMAR
CONTINUED SUBSCRIBER GROWTH
• 1.8 million net subscriber growth
• 52% active data users
• SIM market share estimated at 38%
STRONG FINANCIAL PERFORMANCE
• 42% EBITDA margin
• 10% operating cash flow margin
NETWORK ROLLOUT ACCORDING TO PLAN
• 5,000 network sites on air
• 62% population coverage
• Aiming for around 9,000 sites
11 Organic growth assuming fixed currency, adjusted for acquisitions and
disposals. EBITDA margin before other items.
Revenues (NOK m) and EBITDA margin
3.4
6.4
9.5
11.8 13.7
15.5
Q4 14 Q1 15 Q2 15 Q3 15 Q4 15 Q1 16
Subscribers (m)
287
768
1 142
1 433 1 496 1 722
20% 42% 48% 43% 42%
Q4 14 Q1 15 Q2 15 Q3 15 Q4 15 Q1 16
Q1 2016
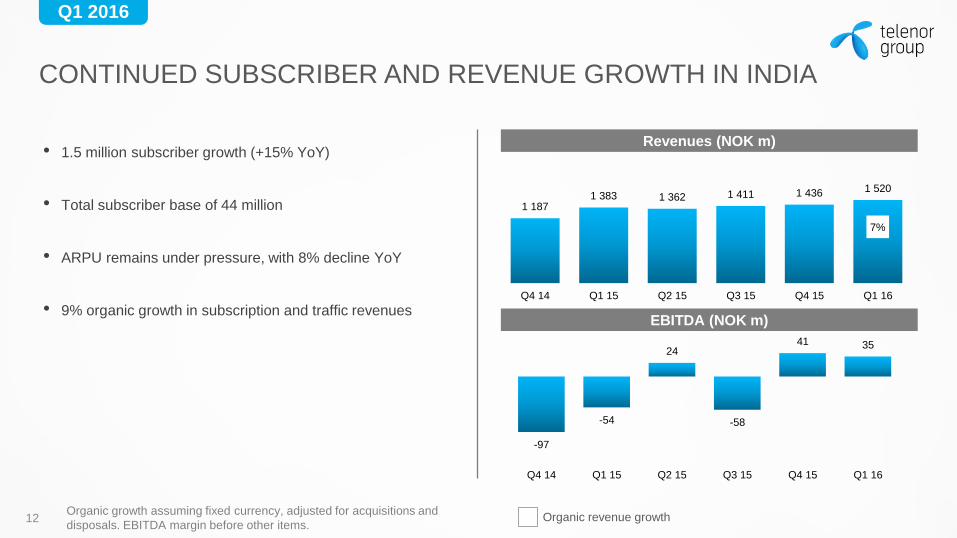
CONTINUED SUBSCRIBER AND REVENUE GROWTH IN INDIA
• 1.5 million subscriber growth (+15% YoY)
• Total subscriber base of 44 million
• ARPU remains under pressure, with 8% decline YoY
• 9% organic growth in subscription and traffic revenues
12 Organic growth assuming fixed currency, adjusted for acquisitions and
disposals. EBITDA margin before other items. Organic revenue growth
-97
-54
24
-58
41 35
Q4 14 Q1 15 Q2 15 Q3 15 Q4 15 Q1 16
EBITDA (NOK m)
1 187 1 383 1 362 1 411 1 436 1 520
Q4 14 Q1 15 Q2 15 Q3 15 Q4 15 Q1 16
Revenues (NOK m)
7%

CAPITAL MARKETS DAY Date: 22 September 2016
Venue: London
SAVE THE DATE
13

TELENOR GROUP – FIRST QUARTER Morten Karlsen Sørby, Acting CFO

Q1 2016
FINANCIAL HIGHLIGHTS
• 6% organic growth in mobile subscription & traffic
revenues
• 35% EBITDA margin and 5% organic growth in EBITDA
• Operating cash flow of NOK 6.1 billion
• Outlook for 2016 maintained
15 Organic growth assuming fixed currency, adjusted for acquisitions and
disposals. EBITDA before other items. Capex excl. spectrum and licence fees.
YTD
Organic revenue growth 1.5%
EBITDA margin 35.4%
Capex / sales 16.8%
Revenues (NOK bn) EBITDA (NOK bn)
31.4 33.0
Q1 15 Q1 16
10.8 11.7
Q1 15 Q1 16
Q1 2016
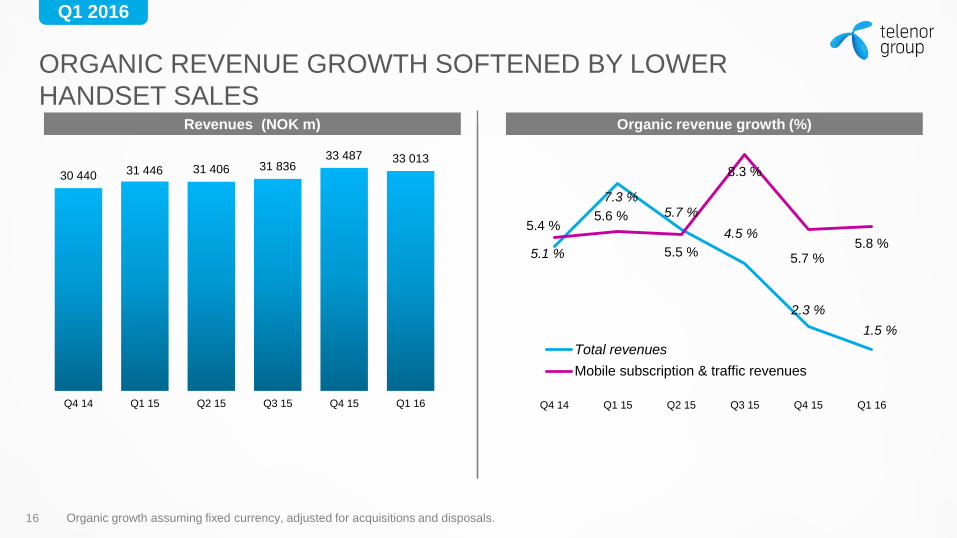
ORGANIC REVENUE GROWTH SOFTENED BY LOWER
HANDSET SALES
16
30 440 31 446 31 406 31 836 33 487 33 013
Q4 14 Q1 15 Q2 15 Q3 15 Q4 15 Q1 16
5.1 %
7.3 % 5.7 %
4.5 %
2.3 %
1.5 %
5.4 % 5.6 %
5.5 %
8.3 %
5.7 % 5.8 %
Q4 14 Q1 15 Q2 15 Q3 15 Q4 15 Q1 16
Total revenues
Mobile subscription & traffic revenues
Organic growth assuming fixed currency, adjusted for acquisitions and disposals.
Organic revenue growth (%) Revenues (NOK m)

Q1 2016
35% EBITDA MARGIN AND 5% ORGANIC EBITDA GROWTH
17 EBITDA and EBITDA margin before other items
EBITDA change YoY (NOK m) EBITDA (NOK m) and EBITDA margin
9 318
10 795 10 695
11 848
10 860
11 685
31% 34% 34%
37%
32% 35%
Q4 14 Q1 15 Q2 15 Q3 15 Q4 15 Q1 16
10 795 11 685 566 321 275
-41 -241
Q1 15 Myanmar GP Broadcast Digi Others Q1 16
Th
ou
san
ds

Q1 2016
CAPEX OF NOK 5.5 BILLION
18 Capex and capex/sales ratio excl. licences
Capex distribution Capex (NOK m) and capex/sales
5 792
4 657
6 719
5 705
6 530
5 546
19%
15%
21%
18% 20%
17%
Q4 14 Q1 15 Q2 15 Q3 15 Q4 15 Q1 16
Other 11 %
Pakistan 6 %
Sweden 6 %
Malaysia 6 %
India 7 %
Myanmar 10 % Norway
16 %
Bangladesh 18 %
Thailand 20 %

Q1 2016
OPERATING CASH FLOW OF NOK 6.1 BILLION
19 Operating cash flow = EBITDA before other items – capex excl. licences
OCF reconciliation (NOK bn) OCF (NOK m) and OCF margin
3 526
6 138
3 976
6 142
4 329
6 139
12%
20%
13%
19%
13%
19%
Q4 14 Q1 15 Q2 15 Q3 15 Q4 15 Q1 16
6 138 6 139
2116
-1 226
-889
Q1 15 Gross profit Opex Capex Q1 16
Q1 2016
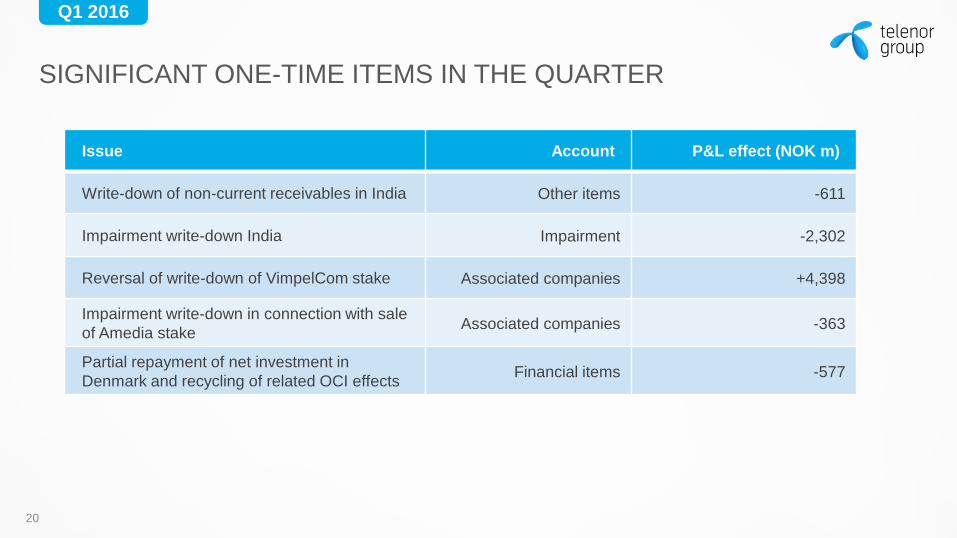
SIGNIFICANT ONE-TIME ITEMS IN THE QUARTER
20
Issue Account P&L effect (NOK m)
Write-down of non-current receivables in India Other items -611
Impairment write-down India Impairment -2,302
Reversal of write-down of VimpelCom stake Associated companies +4,398
Impairment write-down in connection with sale
of Amedia stake Associated companies -363
Partial repayment of net investment in
Denmark and recycling of related OCI effects Financial items -577

Q1 2016
NORMALISED NET INCOME OF NOK 3.6 BILLION
21
NOK m Q1 16 Q1 15
Revenues 33 013 31 446
EBITDA before other items 11 685 10 795
Other items -691 -38
EBITDA 10 994 10 757
Depreciation and amortisation -5 044 -4 180
Impairment losses -2 430 -13
EBIT 3 520 6 564
Associated companies 4 175 428
Net financials -1 008 -550
Profit before taxes 6 688 6 667
Taxes -1 601 -1850
Non-controlling interests 830 967
Net income to Telenor 4 256 3 852
EPS (NOK) 2.83 2.57
India (-611m), Norway (-77m), dtac (-37m)
• VimpelCom (4 582m)
• Amedia (-363m)
• Online classifieds (-46m)
• India (-2,302m), Broadcast (-128m)
Telenor ASA (-577m)
Broadcast (+211m)

Q1 2016
NET DEBT OF NOK 53.6 BN AND NET DEBT/EBITDA OF 1.2X
22
Net debt 31 Dec 2015 54.1
EBITDA (11.0)
Income taxes paid 1.3
Net interest paid 0.5
Capex paid 6.2
Investments in Tapad 2.7
Divi. paid and minority share purchase 0.7
Net revenue share dtac (0.4)
Currency effects (1.6)
Licence obligations paid in Myanmar 1.1
Net change during Q116 (0.5)
Net debt 31 Mar 2016 53.6
46.8 43.9
47.1 46.6
54.1 53.6
1.2 1.1
1.2 1.1
1.2 1.2
Q4 14 Q1 15 Q2 15 Q3 15 Q4 15 Q1 16
Change in net debt (NOK bn) Net debt (NOK bn) and net debt/EBITDA*
*) 12 months rolling EBITDA. Net debt excl. licence commitments of NOK 3.6 bn

Q1 2016
OUTLOOK FOR 2016 MAINTAINED
23
Organic revenue growth
EBITDA margin
Capex/sales ratio
Organic revenue growth in fixed currency, adj. for acquisitions and disposals.
EBITDA before other items. Capex excl. licence fees.
2-4% 1.5%
33-34% 35.4%
17-19% 16.8%
2016 YTD
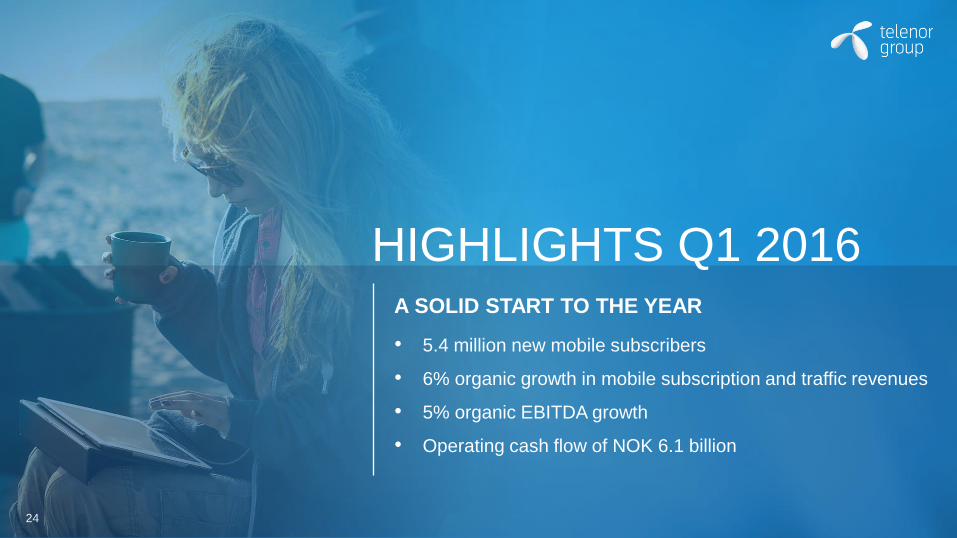
HIGHLIGHTS Q1 2016 A SOLID START TO THE YEAR
• 5.4 million new mobile subscribers
• 6% organic growth in mobile subscription and traffic revenues
• 5% organic EBITDA growth
• Operating cash flow of NOK 6.1 billion
24

TELENOR GROUP – FIRST QUARTER Q&A

TELENOR GROUP – FIRST QUARTER APPENDIX

27
208 million consolidated mobile subscribers
Revenues in 2015: NOK 128 bn (USD 14 bn)
Market cap: NOK 202 bn (USD 22 bn)
TELENOR GROUP

Q1 2016
Capex and capex/sales ratio excl. licences
GEOGRAPHIC SPLIT OF KEY FINANCIALS 2015
28
21%
19%
52%
8%
REVENUES
Norway Europe Asia Other
28%
18% 55%
-1%
EBITDA
Norway Europe Asia Other
29%
23% 53%
OPERATING CASH FLOW
Norway Europe Asia Other

Q1 2016
PRIORITIES FOR CAPITAL ALLOCATION
29
Maintain a solid balance sheet
Competitive shareholder
remuneration
Disciplined and selective M&A
1
2
3
Net debt/EBITDA below 2.0x
50-80% dividend payout of
normalised net income
Aim for YoY growth in dividends
Value driven, within core
assets and regions

Q1 2016
NORWAY
30
Revenues (NOK m) and EBITDA margin Mobile subscribers (‘000)
EBITDA and capex (NOK m) Mobile ARPU (NOK/month)
3 218 3 209 3 215 3 190 3 163 3 129
Q4 14 Q1 15 Q2 15 Q3 15 Q4 15 Q1 16
6 730 6 624 6 605 6 594 6 719 6 330
41% 42% 41% 45% 39%
44%
Q4 14 Q1 15 Q2 15 Q3 15 Q4 15 Q1 16
-4%
Organic growth Organic growth assuming fixed currency, adjusted for acquisitions and
disposals. EBITDA margin before other items.
309 312 323 331 314 315
Q4 14 Q1 15 Q2 15 Q3 15 Q4 15 Q1 16
1% 2 747 2 792 2 723
2 955 2 617 2 772
1 182 848
1 039 1 009 1 363
889
Q4 14 Q1 15 Q2 15 Q3 15 Q4 15 Q1 16
EBITDA CAPEX
-1%

Q1 2016
SWEDEN
31
Revenues (NOK m) and EBITDA margin Mobile subscribers (‘000)
EBITDA and capex (NOK m) Mobile ARPU (SEK/month)
2 509 2 486 2 480 2 504 2 548 2 551
Q4 14 Q1 15 Q2 15 Q3 15 Q4 15 Q1 16
3 114 2 984 2 996 3 188
3 409 3 121
25% 29% 28% 32% 28% 29%
Q4 14 Q1 15 Q2 15 Q3 15 Q4 15 Q1 16
-5%
Organic growth Organic growth assuming fixed currency, adjusted for acquisitions and
disposals. EBITDA margin before other items.
225 222 225 233 226 220
Q4 14 Q1 15 Q2 15 Q3 15 Q4 15 Q1 16
-1% 785
854 837
1 023 954
893
516
308 348 255
392 336
Q4 14 Q1 15 Q2 15 Q3 15 Q4 15 Q1 16
EBITDA CAPEX
-5%

Q1 2016
DANMARK
32
Revenues (NOK m) and EBITDA margin Mobile subscribers (‘000)
EBITDA and capex (NOK m) Mobile ARPU (DKK/month)
1 748 1 770 1 780 1 789 1 784 1 797
Q4 14 Q1 15 Q2 15 Q3 15 Q4 15 Q1 16
1 360 1 256 1 241 1 273
1 431
1 256
13% 17%
10% 10% 10% 13%
Q4 14 Q1 15 Q2 15 Q3 15 Q4 15 Q1 16
-8%
Organic growth Organic growth assuming fixed currency, adjusted for acquisitions and
disposals. EBITDA margin before other items.
130 123
112 124 119 119
Q4 14 Q1 15 Q2 15 Q3 15 Q4 15 Q1 16
-3% 785
854 837
1 023 954
893
516
308 348 255
392 336
Q4 14 Q1 15 Q2 15 Q3 15 Q4 15 Q1 16
EBITDA CAPEX
-29%
From 31 March 2016, pay-as-you-go cards will no longer be part of Telenor Denmark’s
product offering. Subscription and ARPU figures have been updated retrospectively.

Q1 2016
BROADCAST
33
Revenues (NOK m) and EBITDA margin DTH subscribers (‘000)
EBITDA and capex (NOK m) DTH ARPU (NOK/month)
912 905 902 900 897 878
Q4 14 Q1 15 Q2 15 Q3 15 Q4 15 Q1 16
1 550 1 530 1 518 1 591 1 597 1 765
30% 30% 32% 37%
32%
42%
Q4 14 Q1 15 Q2 15 Q3 15 Q4 15 Q1 16
15%
Organic growth Organic growth assuming fixed currency, adjusted for acquisitions and
disposals. EBITDA margin before other items. Capex excl. licence fees
377 368 371 390 389 389
Q4 14 Q1 15 Q2 15 Q3 15 Q4 15 Q1 16
6%
458 458 481 589
507
732
79 75 83 90 95
Q4 14 Q1 15 Q2 15 Q3 15 Q4 15 Q1 16
EBITDA CAPEX
60%
1 537

Q1 2016
HUNGARY
34
Revenues (NOK m) and EBITDA margin Mobile subscribers (‘000)
EBITDA and capex (NOK m) Mobile ARPU (HUF/month)
3 255 3 228 3 220 3 201 3 164 3 151
Q4 14 Q1 15 Q2 15 Q3 15 Q4 15 Q1 16
1 150 1 098 1 050 1 167 1 175 1 117
24% 32% 31% 36%
24% 32%
Q4 14 Q1 15 Q2 15 Q3 15 Q4 15 Q1 16
-6%
Organic growth Organic growth assuming fixed currency, adjusted for acquisitions and
disposals. EBITDA margin before other items.
3 685 3 592 3 371 3 504 3 440 3 365
Q4 14 Q1 15 Q2 15 Q3 15 Q4 15 Q1 16
-6% 279
354 331
417
280
354
163
67 87 70 90
46
Q4 14 Q1 15 Q2 15 Q3 15 Q4 15 Q1 16
EBITDA CAPEX
-7%

Q1 2016
MONTENEGRO AND SERBIA
35
Revenues (NOK m) and EBITDA margin Mobile subscribers (‘000)
EBITDA and capex (NOK m) Mobile ARPU (EUR/month)
3 585 3 530 3 518 3 593 3 443 3 384
Q4 14 Q1 15 Q2 15 Q3 15 Q4 15 Q1 16
883 853 918
1 061 982 952
32% 33% 35% 38% 32% 31%
Q4 14 Q1 15 Q2 15 Q3 15 Q4 15 Q1 16
3%
Organic growth Organic growth assuming fixed currency, adjusted for acquisitions and
disposals. EBITDA margin before other items.
8.9 8.4
8.8 9.3
8.5 8.4
Q4 14 Q1 15 Q2 15 Q3 15 Q4 15 Q1 16
6% 287 285 325
404
314 296
120
45
102 109 142
82
Q4 14 Q1 15 Q2 15 Q3 15 Q4 15 Q1 16
EBITDA CAPEX
-4%

Q1 2016
BULGARIA
36
Revenues (NOK m) and EBITDA margin Mobile subscribers (‘000)
EBITDA and capex (NOK m) Mobile ARPU (BGN/month)
3 901 3 814 3 762 3 762 3 583 3 524
Q4 14 Q1 15 Q2 15 Q3 15 Q4 15 Q1 16
734 685 675
772 809 758
34% 37% 40% 41% 36% 38%
Q4 14 Q1 15 Q2 15 Q3 15 Q4 15 Q1 16
1%
Organic growth Organic growth assuming fixed currency, adjusted for acquisitions and
disposals. EBITDA margin before other items.
11.5 11.0 11.3 11.6 11.9 12.1
Q4 14 Q1 15 Q2 15 Q3 15 Q4 15 Q1 16
10% 253 253 272
314 295 286
373
113 93 84
216
33
Q4 14 Q1 15 Q2 15 Q3 15 Q4 15 Q1 16
EBITDA CAPEX
4%

Q1 2016
THAILAND (DTAC)
37
Revenues (NOK m) and EBITDA margin Mobile subscribers (‘000)
EBITDA and capex (NOK m) Mobile ARPU (THB/month)
28 008 28 427 26 943 24 851 25 252 25 477
Q4 14 Q1 15 Q2 15 Q3 15 Q4 15 Q1 16
5 265 5 443 5 112
4 600
5 533 5 260
27% 32% 31%
36% 29%
34%
Q4 14 Q1 15 Q2 15 Q3 15 Q4 15 Q1 16
-5%
Organic growth Organic growth assuming fixed currency, adjusted for acquisitions and
disposals. EBITDA margin before other items.
221 214 215 220 234 228
Q4 14 Q1 15 Q2 15 Q3 15 Q4 15 Q1 16
6% 1 476
1 760 1 566 1 656 1 598
1 778
904
1 314
731
1 789
933 1 139
Q4 14 Q1 15 Q2 15 Q3 15 Q4 15 Q1 16
EBITDA CAPEX
-1%

Q1 2016
MALAYSIA (DIGI)
38
Revenues (NOK m) and EBITDA margin Mobile subscribers (‘000)
EBITDA and capex (NOK m) Mobile ARPU (MYR/month)
11 421 11 692 11 815 11 676 12 125 12 336
Q4 14 Q1 15 Q2 15 Q3 15 Q4 15 Q1 16
3 667 3 837 3 649
3 390 3 430 3 405
45% 44% 45% 44% 40% 42%
Q4 14 Q1 15 Q2 15 Q3 15 Q4 15 Q1 16
-8%
Organic growth Organic growth assuming fixed currency, adjusted for acquisitions and
disposals. EBITDA margin before other items.
47 46 45 45 44 42
Q4 14 Q1 15 Q2 15 Q3 15 Q4 15 Q1 16
-8%
1 640 1 672 1 660 1 507
1 385 1 431
479 412 425 454 578
351
Q4 14 Q1 15 Q2 15 Q3 15 Q4 15 Q1 16
EBITDA CAPEX
-11%

Q1 2016
BANGLADESH (GRAMEENPHONE)
39
Revenues (NOK m) and EBITDA margin Mobile subscribers (‘000)
EBITDA and capex (NOK m) Mobile ARPU (BDT/month)
51 504 52 006 53 129 55 511 56 679 56 285
Q4 14 Q1 15 Q2 15 Q3 15 Q4 15 Q1 16
2 306 2 516 2 630
2 811 2 924 3 045
50% 54% 54% 51% 55% 55%
Q4 14 Q1 15 Q2 15 Q3 15 Q4 15 Q1 16
9%
Organic growth Organic growth assuming fixed currency, adjusted for acquisitions and
disposals. EBITDA margin before other items.
161 155 159 156 152 156
Q4 14 Q1 15 Q2 15 Q3 15 Q4 15 Q1 16
1% 1 161
1 363 1 417 1 432 1 595 1 684
500 370
638 488 501
1 004
Q4 14 Q1 15 Q2 15 Q3 15 Q4 15 Q1 16
EBITDA CAPEX
12%

Q1 2016
PAKISTAN
40
Revenues (NOK m) and EBITDA margin Mobile subscribers (‘000)
EBITDA and capex (NOK m) Mobile ARPU (PKR/month)
36 503 36 553 31 591 33 244 34 563
36 730
Q4 14 Q1 15 Q2 15 Q3 15 Q4 15 Q1 16
1 581 1 829 1 900 1 988 2 049 2 144
31% 42%
32%
46% 43% 40%
Q4 14 Q1 15 Q2 15 Q3 15 Q4 15 Q1 16
9%
Organic growth Organic growth assuming fixed currency, adjusted for acquisitions and
disposals. EBITDA margin before other items.
184 186
217 214 212 206
Q4 14 Q1 15 Q2 15 Q3 15 Q4 15 Q1 16
11%
493
767
598
909 878 847
616
326 292 266
558
315
Q4 14 Q1 15 Q2 15 Q3 15 Q4 15 Q1 16
EBITDA CAPEX
2%

Q1 2016
INDIA
41
Revenues (NOK m) and EBITDA margin Mobile subscribers (‘000)
EBITDA and capex (NOK m) Mobile ARPU (INR/month)
36 665 38 505 39 849 40 855 42 619 44 144
Q4 14 Q1 15 Q2 15 Q3 15 Q4 15 Q1 16
1 187 1 383 1 362 1 411 1 436
1 520
-8%
-4%
2%
-4%
3% 2%
Q4 14 Q1 15 Q2 15 Q3 15 Q4 15 Q1 16
7%
Organic growth Organic growth assuming fixed currency, adjusted for acquisitions and
disposals. EBITDA margin before other items.
101 98 95 91 88 90
Q4 14 Q1 15 Q2 15 Q3 15 Q4 15 Q1 16
-8%
- 97 - 54
24
- 58
41 35 106 104
248 190
489
409
Q4 14 Q1 15 Q2 15 Q3 15 Q4 15 Q1 16
EBITDA CAPEX

Q1 2016
MYANMAR
42
Revenues (NOK m) and EBITDA margin Mobile subscribers (‘000)
EBITDA and capex (NOK m) Mobile ARPU (MMK/month)
3 406
6 391
9 513 11 793
13 683 15 469
Q4 14 Q1 15 Q2 15 Q3 15 Q4 15 Q1 16
7%
Organic growth Organic growth assuming fixed currency, adjusted for acquisitions and
disposals. EBITDA margin before other items.
6 211 6 914
6 473 6 633 5 997
5 692
Q4 14 Q1 15 Q2 15 Q3 15 Q4 15 Q1 16
-18%
- 248
152
479
691 640 718
541 442
863 723 769
552
Q4 14 Q1 15 Q2 15 Q3 15 Q4 15 Q1 16
EBITDA CAPEX
2%
287
768
1 142
1 433 1 496
1 722
20%
42% 48%
43% 42%
Q4 14 Q1 15 Q2 15 Q3 15 Q4 15 Q1 16
146%

Q1 2016
CHANGES IN REVENUES AND EBITDA
43 Organic growth YoY in fixed currency and adjusted for acquisitions and disposals.
EBITDA before other items.
Revenues EBITDA
Reported Organic Reported Organic
Norway -4.4 % -4.4 % -0.7 % -0.7 %
Sweden 4.6 % -4.7 % 4.6 % -4.6 %
Denmark 0.0 % -8.2 % -22.3 % -28.7 %
Hungary 1.8 % -5.7 % 0.1 % -7.2 %
Montenegro and Serbia 11.6 % 3.1 % 3.7 % -4.3 %
Bulgaria 10.7 % 1.4 % 13.1 % 3.7 %
Thailand -3.4 % -5.3 % 1.1 % -0.9 %
Malaysia -11.2 % -7.7 % -14.4 % -11.0 %
Bangladesh 21.0 % 9.5 % 23.6 % 11.8 %
Pakistan 17.3 % 8.6 % 10.5 % 2.3 %
India 9.9 % 7.0 % nm nm
Broadcast 15.3 % 15.3 % 60.3 % 60.3 %
Telenor Group 5.0 % 1.5 % 8.2 % 5.0 %

Q1 2016
DEBT MATURITY AND NET DEBT
44 Per 31 Mar 2016. Excl. licence commitments of NOK 3.6 bn
Net debt in partly owned subsidiaries is shown on 100% figures
Debt maturity profile (NOK bn)
(NOK m) Q1 2016 Q4 2015 Q1 2015
Digi 2 441 2 205 1 539
dtac 7 584 9 193 6 231
Grameenphone 2 746 3 385 2 662
Net debt in partly owned subsidiaries (NOK m)
10 09
04 07
05
12
07
02 01
02
07
01
03
2016 2017 2018 2019 2020 2021 2022 2023 ->
Subsidiaries
Telenor ASA