q1'18 earnings presentation - santander.com · support the transformation of manufacturers ......
TRANSCRIPT

Santander Consumer Finance
Q1'18 Earnings Presentation
24 April 2018

2
Banco Santander, S.A. ("Santander") cautions that this presentation contains forward-looking statements. These forward-looking statements are found in various placesthroughout this presentation and include, without limitation, statements concerning our future business development and economic performance. While these forward-lookingstatements represent our judgment and future expectations concerning the development of our business, a number of risks, uncertainties and other important factors could causeactual developments and results to differ materially from our expectations. These factors include, but are not limited to: (1) general market, macro-economic, governmental andregulatory trends; (2) movements in local and international securities markets, currency exchange rates and interest rates; (3) competitive pressures; (4) technologicaldevelopments; and (5) changes in the financial position or credit worthiness of our customers, obligors and counterparties. The risk factors that we have indicated in our past andfuture filings and reports, including those with the Securities and Exchange Commission of the United States of America (the “SEC”) could adversely affect our business andfinancial performance. Other unknown or unpredictable factors could cause actual results to differ materially from those in the forward-looking statements.
Forward-looking statements speak only as of the date on which they are made and are based on the knowledge, information available and views taken on the date on which theyare made; such knowledge, information and views may change at any time. Santander does not undertake any obligation to update or revise any forward-looking statement,whether as a result of new information, future events or otherwise.
The information contained in this presentation is subject to, and must be read in conjunction with, all other publicly available information, including, where relevant any fullerdisclosure document published by Santander. Any person at any time acquiring securities must do so only on the basis of such person's own judgment as to the merits or thesuitability of the securities for its purpose and only on such information as is contained in such public information having taken all such professional or other advice as it considersnecessary or appropriate in the circumstances and not in reliance on the information contained in the presentation. In making this presentation available, Santander gives noadvice and makes no recommendation to buy, sell or otherwise deal in shares in Santander or in any other securities or investments whatsoever.
Neither this presentation nor any of the information contained therein constitutes an offer to sell or the solicitation of an offer to buy any securities. No offering of securities shallbe made in the United States except pursuant to registration under the U.S. Securities Act of 1933, as amended, or an exemption therefrom. Nothing contained in thispresentation is intended to constitute an invitation or inducement to engage in investment activity for the purposes of the prohibition on financial promotion in the U.K. FinancialServices and Markets Act 2000.
Note: Statements as to historical performance or financial accretion are not intended to mean that future performance, share price or future earnings (including earnings pershare) for any period will necessarily match or exceed those of any prior year. Nothing in this presentation should be construed as a profit forecast.
The businesses included in each of our geographic segments and the accounting principles under which their results are presented here may differ from the included businessesand local applicable accounting principles of our public subsidiaries in such geographies. Accordingly, the results of operations and trends shown for our geographic segmentsmy differ materially from those of such subsidiaries.
Disclaimer

3
1. Macroeconomic environment and financial system
2. Strategy and business
3. Results
4. Appendix
Index

Macroeconomic environment
and financial system
01

5
The Euro Area growth is expected to be slightly lower than in 2017
(1) Source: Santander Research Department (Eurozone indicators).(2) Source: ACEA. Forecast from MSI and market consensus (for SCF countries, including SC UK)
Macroeconomic environment
1.8
2.5 2.42.0
1.5
2016 2017 2018 (e) 2019 (e) 2020 (e)
14.1 14.5 14.7 14.5 14.2
2016 2017 2018 (e) 2019 (e) 2020 (e)
0.0 0.00 0.0
0.50.85
2016 2017 2018 2019 (e) 2020 (e)
10.09.1
8.3 7.8 7.4
2016 2017 2018 (e) 2019 (e) 2020 (e)
Annual GDP Growth (real, %) 1 New car sales (millions)2
Unemployment rates (%) 1 Interest rates (%,year-end) 1

Strategy and
business
02

7
SCF is the consumer finance leader in Europe
Our Franchise
(1) EUR mn(2) Top 3 market share in main markets: New production of auto loans as of H1’17 (last available)(3) SCF countries including SC UK (4) Million(5) Constant euros
STRATEGIC PRIORITIES
Support the transformation of manufacturersand dealers
KEY DATA Q1’18 YoY Var.5
Develop innovative products and digitalisethe customer cycle processes
Implement open e-commerce platforms in thebusinesses and sign new agreements withdistributors
Develop channels, business intelligence anddigital value-added propositions
Gross loans1 92,142
Deposits1 36,848
Underlying profit1 323
RoTE 16.64% -45 bp
Efficiency ratio 44.6% -28 bp
Market share2 Top 3
Countries3 15
Active Customers4 19.4 -1%
+7%
+4%
+4%

8
Commercial strategy and business transformation
Present in 15 European countries
130,000 point of sale partners
More than 100 agreements with car and bike manufacturers in 15 countries
19.4 million active customers
Solid business model: geographic diversification with leading positions, advanced captive car
finance and strong foothold in consumer, a common risk system that enables SCF to maintain
high credit quality and a sound funding structure
E-commerce open platform
Helping
partners to
start, run and
grow their
businesses
Digital interaction
Mobile payments
Optimising
efficiency
on Direct
business
Meeting customer &
market payment
demands while
leveraging dominant
position in stores
Analytics & digital marketing
Integrating and
monitoring all
touch-points to
track, interpret
data and react in
real time
Germany’s
Best Automotive Bank
by markt intern (2017)
First position
Financial Institutions
Polish Market
Poland (2017)
Awards and recognitions
TOP EMPLOYER EUROPE 2018
(Austria, Belgium, Germany, Italy,
the Netherlands and Poland)

9
Activity
Volume performance
86.4 88.8 88.7 92.6 92.1
Mar-17 Jun-17 Sep-17 Dec-17 Mar-18
Total loans (Constant EUR bn1)
(1) End period exchange rate as at Mar-18.(*) Austria, Belgium, France, Italy, The Netherlands, Poland, Portugal and Switzerland.
+6.7%
35.4 35.4 35.7 35.5 36.8
Mar-17 Jun-17 Sep-17 Dec-17 Mar-18
Total deposits (Constant EUR bn1)
+4.0%
Geographical diversification
Spain, 15%
Germany, 37%
Nordics, 16%
Others(*), 32%
Wholesale Market Funding* (EUR bn)
-1.8%
23.2 23.1 21.5 22.5 22.9
8.2 8.4 7.8 8.3 8.0
Mar-17 Jun-17 Sep-17 Dec-17 Mar-18
Secured
Unsecured
*Excluding interbank and central bank funding
Results
03

11
Slight increase in NII QoQ. YoY increased due to volume growth and lower cost of funding
Net interest income
(1) Average exchange rate as at 3M’18 (2) Group criteria(3) Quarter average(4) Restated figures with new criteria basically due to the inclusion of financial fees
NIM2 (%)
3.43% 3.59% 3.65% 3.63% 3.57%
Official interest rate3 (%)
0.00% 0.00% 0.00% 0.00% 0.00%
Q1'17 Q2'17 Q3'17 Q4'17 Q1'18
881 873 895 906 9154.75 4.74 4.66 4.61 4.60
Q1'17 Q2'17 Q3'17 Q4'17 Q1'18
Net interest income (Constant EUR mn1) Yield on loans (%)4

12
Gross income
Q1'17 Q2'17 Q3'17 Q4'17 Q1'18
1,108 1,0941,131 1,132 1,140
Gross income (Constant EUR mn1)
Q1’18 Q1’17 YoY(%) QoQ(%)
(1) Average exchange rate as at 3M’18 (2) Other includes Gains (losses) on financial transactions and Other operating income
Net interest income 915 881 3.9 1.0
Net fees 215 231 -7.1 5.3
Subtotal 1,130 1,111 1.6 1.8
Other (1) 10 3- - -52.8
Gross income 1,140 1,108 2.8 0.7
Higher net interest income YoY was partially offset by a drop in fee income
13
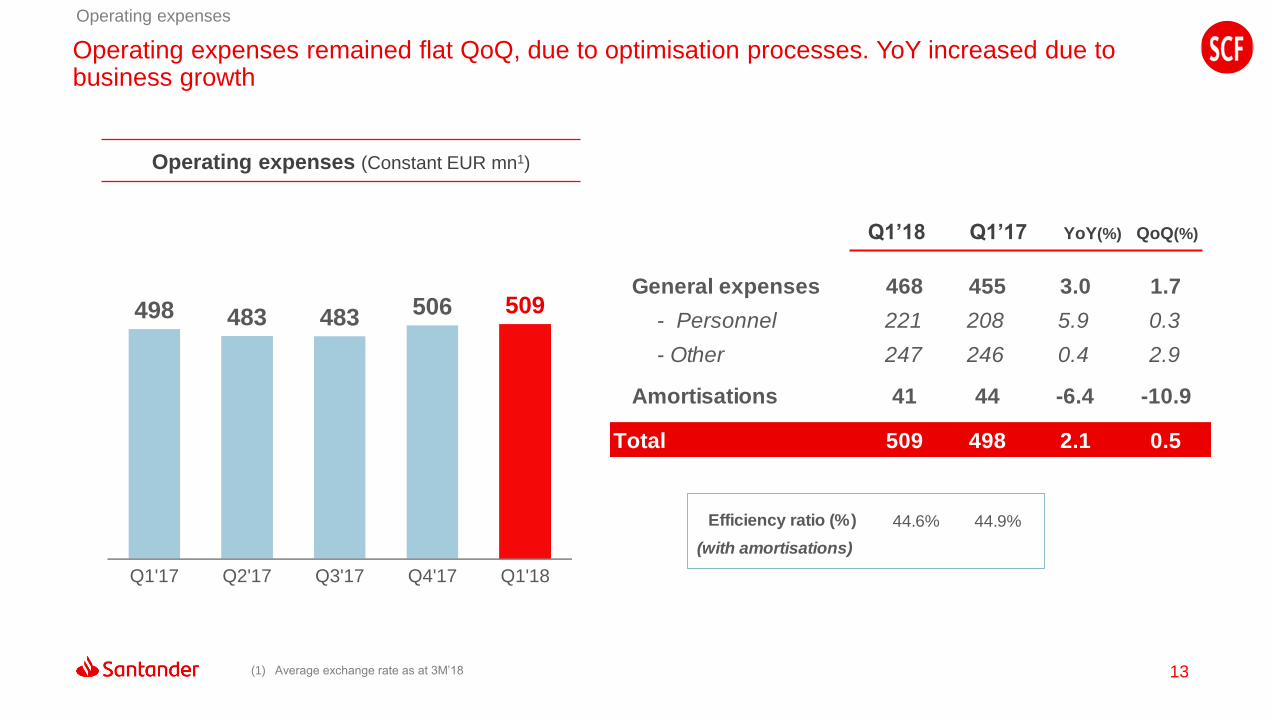
Operating expenses
Q1'17 Q2'17 Q3'17 Q4'17 Q1'18
498 483 483 506 509
Operating expenses (Constant EUR mn1)
Q1’18 Q1’17 YoY(%) QoQ(%)
(1) Average exchange rate as at 3M’18
General expenses 468 455 3.0 1.7
- Personnel 221 208 5.9 0.3
- Other 247 246 0.4 2.9
Amortisations 41 44 -6.4 -10.9
Total 509 498 2.1 0.5
Efficiency ratio (%) 44.6% 44.9%
(with amortisations)
Operating expenses remained flat QoQ, due to optimisation processes. YoY increased due to business growth

14
Net operating income after loan-loss provisions (LLPs)
Q1'17 Q2'17 Q3'17 Q4'17 Q1'18
60 58
89
58
120
LLPs and cost of credit (Constant EUR mn1, %)
0.39 0.37 0.34 0.30 0.36Cost of
credit
Net LLPs
Q1’18 Q1’17 YoY(%) QoQ(%)
(1) Average exchange rate as at 3M’18
Net operating income 631 610 3.4 0.9
Loan-loss provisions -120 -60 - -
Net operat. income
after provisions511 551 -7.2 -10.0
NPL ratio 2.48% 2.62%
Coverage ratio 107.2% 108.9%
Higher provisions YoY and QoQ due to positive impacts from bad debt sales and other releases in 2017. NPL ratio improved 14 bps YoY

15
PBT 535 513 4.2 4.5
Tax on profit -147 -147 -0.2 5.8
Consolidated
profit388 366 6.0 4.0
Attributable profit 323 310 4.0 3.8
Attributable profit up 4% YoY, backed by lower provisions in connection with legal matters and claims than in 2017 and other releases
Attributable profit
Q1'17 Q2'17 Q3'17 Q4'17 Q1'18
310 317 308 311 323
Underlying attributable profit (Constant EUR mn1)
Attributable profit (Constant EUR mn1)
Q1’18 Q1’17 YoY(%) QoQ(%)
Effective tax rate
(1) Average exchange rate as at 3M’18
310 317 223 311 323
27.4% 28.6%

16
Concluding remarks
European leadership with high geographic diversification.
Critical mass and top positions in its geographies.
Advanced captive car finance model and a strong foothold in consumer lending.
Healthy risk performance and sound funding structure.
Strategy
9% YoY increase in new lending. Auto loans (+12%) and credit cards (+12%)*.
SCF has a diversified and stable funding mix, having banking licenses in most of the countries
where it operates.
Focused on capital optimisation while maintaining strong leadership, in an environment
characterised by an excess of liquidity in the markets and low GDP growth.
Activity
Positive trend in NII, driven by increase in volumes. Net fees increased QoQ due to seasonal
factors in Germany in Q4’17.
Expenses under control. Slight increase YoY due to business growth.
LLPs increased, both YoY and QoQ, due to positive impacts from bad debt sales and other
releases in 2017. Cost of credit at historically low levels.
Results
SCF continues to deliver recurrent profits through the cycle
(*) Average exchange rate as at 3M’18 in new lending

Appendix
04
18
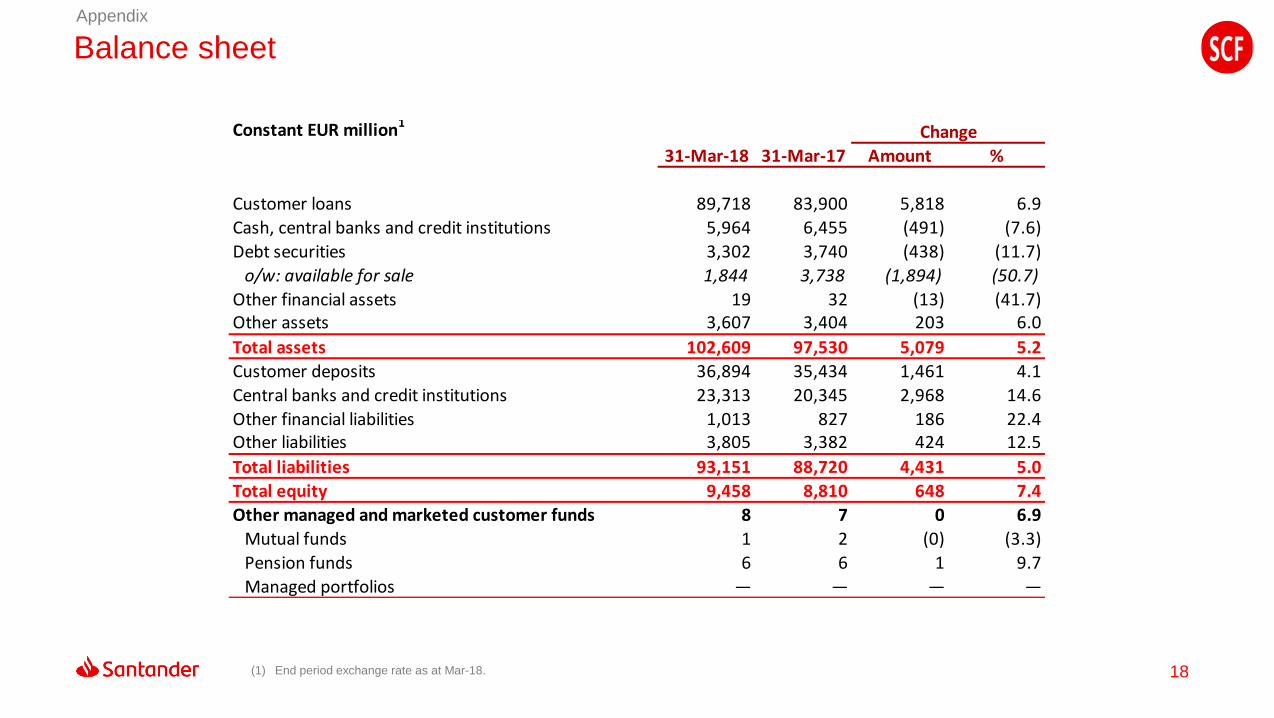
Balance sheetAppendix
(1) End period exchange rate as at Mar-18.
Constant EUR million1Change
31-Mar-18 31-Mar-17 Amount %
Customer loans 89,718 83,900 5,818 6.9
Cash, central banks and credit institutions 5,964 6,455 (491) (7.6)
Debt securities 3,302 3,740 (438) (11.7)
o/w: available for sale 1,844 3,738 (1,894) (50.7)
Other financial assets 19 32 (13) (41.7)Other assets 3,607 3,404 203 6.0
Total assets 102,609 97,530 5,079 5.2
Customer deposits 36,894 35,434 1,461 4.1
Central banks and credit institutions 23,313 20,345 2,968 14.6
Other financial liabilities 1,013 827 186 22.4Other liabilities 3,805 3,382 424 12.5
Total liabilities 93,151 88,720 4,431 5.0
Total equity 9,458 8,810 648 7.4
Other managed and marketed customer funds 8 7 0 6.9
Mutual funds 1 2 (0) (3.3)
Pension funds 6 6 1 9.7
Managed portfolios — — — —

19
ChangeConstant euros1
Q1'18 Q1'17 Amount %
Net interest income 915 881 34 3.9
Net fees 215 231 (16) (7.1)
Gains (losses) on financial transactions 4 (2) 6 —
Other operating income 6 (1) 8 —
Gross income 1,140 1,108 31 2.8
Operating expenses (509) (498) (11) 2.1
General administrative expenses (468) (455) (13) 3.0
Personnel (221) (208) (12) 5.9
Other general administrative expenses (247) (246) (1) 0.4
Depreciation and amortisation (41) (44) 3 (6.4)
Net operating income 631 610 21 3.4
Net loan-loss provisions (120) (60) (60) 100.9
Other income 24 (37) 61 —
Underlying profit before taxes 535 513 22 4.2
Tax on profit (147) (147) 0 (0.2)
Underlying profit from continuing operations 388 366 22 6.0
Net profit from discontinued operations — — — —
Underlying consolidated profit 388 366 22 6.0
Minority interests 66 56 10 17.1
Underlying attributable profit to the Group 323 310 13 4.0Net capital gains and provisions — — — —
Attributable profit to the Group 323 310 13 4.0
Income statementAppendix
(1) Average exchange rate as at 3M’18

20
Income statementAppendix
(1) Average exchange rate as at 3M’18
Constant EUR million1Q1'17 Q2'17 Q3'17 Q4'17 Q1'18
Net interest income 881 873 895 906 915
Net fees 231 219 223 204 215
Gains (losses) on financial transactions (2) 2 (1) 3 4
Other operating income (1) (0) 15 19 6
Gross income 1,108 1,094 1,131 1,132 1,140
Operating expenses (498) (483) (483) (506) (509)
General administrative expenses (455) (439) (437) (460) (468)
Personnel (208) (211) (204) (220) (221)
Other general administrative expenses (246) (227) (233) (240) (247)
Depreciation and amortisation (44) (45) (45) (46) (41)
Net operating income 610 611 649 626 631
Net loan-loss provisions (60) (58) (89) (58) (120)
Other income (37) (35) (30) (56) 24
Underlying profit before taxes 513 519 530 512 535
Tax on profit (147) (140) (160) (138) (147)
Underlying profit from continuing operations 366 379 369 373 388
Net profit from discontinued operations — — — — —
Underlying consolidated profit 366 379 369 373 388
Minority interests 56 62 61 62 66
Underlying attributable profit to the Group 310 317 308 311 323Net capital gains and provisions — — (85) (0) —
Attributable profit to the Group 310 317 223 311 323

Thank you.
Our purpose is to help people
and business prosper.
Our culture is based on believing
that everything we do should be: