q2 2016 results conference call & webcast
TRANSCRIPT
1www.kinross.com
1
KINROSS GOLD CORPORATIONQ2 2016 Results Conference Call & Webcast
July 28
2016
2www.kinross.com
2
CAUTIONARY STATEMENT ON FORWARD-LOOKING INFORMATION
All statements, other than statements of historical fact, contained or incorporated by reference in or made in giving this presentation and responses to questions,including but not limited to any information as to the future performance of Kinross, constitute “forward looking statements” within the meaning of applicable securitieslaws, including the provisions of the Securities Act (Ontario) and the provisions for “safe harbour” under the United States Private Securities Litigation Reform Act of1995 and are based on expectations, estimates and projections as of the date of this presentation. Forward-looking statements contained in this presentation includethose statements on slides with, and statements made under, the headings “2016 Production & Cost Outlook”, “Tasiast Update”, “Attractive Growth Opportunities”,“Strong Balance Sheet”, and “Principles for Building Value”, and include without limitation statements with respect to our guidance for production, production costs ofsales, all-in sustaining cost and capital expenditures, project schedules, mine life, continuous improvement and other cost savings opportunities, as well asreferences and other statements with respect to other possible events and opportunities, including, without limitation, estimates and the realization of such estimates(such as mineral or gold reserves and resources, and mine life); future development, mining activities, production and growth (including but not limited to cost andtiming); success of exploration or development of operations; the future price of gold and silver; currency fluctuations; expected capital requirements; governmentregulation; and environmental risks and proceedings. The words “2016E”, “ahead”, “anticipate”, “assumption”, “believe”, “budget”, “contemplate”, “contingent”,“encouraging”, “enhancing”, “estimate”, “expect”, “explore”, “feasibility”, “flexibility”, “focus”, “forecast”, “forward”, “future”, “guidance”, “initiative”, “indicate”, “likely”,“objective”, “on track”, “opportunity”, “outlook”, “phased”, “plan”, “positioned”, “possible”, “potential”, “principles”, “priority”, “project”, “risk”, “schedule”, “scoping”,“strategy”, “study”, “target”, “trend” or “upside”, or variations of or similar such words and phrases, or statements that certain actions, events or results may, can,could, would, should, might, occur or will be taken or realized, and similar expressions identify forward looking statements. Forward-looking statements arenecessarily based upon a number of estimates and assumptions that, while considered reasonable by Kinross as of the date of such statements, are inherentlysubject to significant business, economic and competitive uncertainties and contingencies. Statements representing management’s financial and other outlook havebeen prepared solely for purposes of expressing their current views regarding the Company’s financial and other outlook and may not be appropriate for any otherpurpose. Many of these uncertainties and contingencies can affect, and could cause, Kinross’ actual results to differ materially from those expressed or implied in anyforward looking statements made by, or on behalf of, Kinross. There can be no assurance that forward looking statements will prove to be accurate, as actual resultsand future events could differ materially from those anticipated in such statements. All of the forward looking statements made in this presentation are qualified bythese cautionary statements, and those made in our filings with the securities regulators of Canada and the U.S., including but not limited to those cautionarystatements made in the “Risk Factors” section of our most recently filed Annual Information Form, the “Risk Analysis” section of our FYE 2015 and Q2 2016Management’s Discussion and Analysis, and the “Cautionary Statement on Forward-Looking Information” in our news release dated July 27, 2016, to which readersare referred and which are incorporated by reference in this presentation, all of which qualify any and all forward‐looking statements made in this presentation. Thesefactors are not intended to represent a complete list of the factors that could affect Kinross. Kinross disclaims any intention or obligation to update or revise anyforward‐looking statements or to explain any material difference between subsequent actual events and such forward‐looking statements, except to the extentrequired by applicable law.
Other information
Where we say "we", "us", "our", the "Company", or "Kinross" in this presentation, we mean Kinross Gold Corporation and/or one or more or all of its subsidiaries, asmay be applicable.
The technical information about the Company’s mineral properties contained in this presentation (other than exploration activities) has been prepared under thesupervision of Mr. John Sims, an officer of the Company who is a “qualified person” within the meaning of National Instrument 43-101 (“NI 43-101”). The technicalinformation about the Company’s exploration activities contained in this presentation has been prepared under the supervision of Mr. Sylvain Guerard, an officer ofthe Company who is a “qualified person” within the meaning of NI 43-101.
3www.kinross.com
3Q2 2016 RESULTS HIGHLIGHTS 3

4www.kinross.com
4
SECOND QUARTER HIGHLIGHTS
FINANCIAL STRENGTH & FLEXIBILITY
$750
$968
31-Mar-16 30-Jun-16
• Generated robust free cash flow, increasing cash balance by $218 MILLION in Q2 2016
• Results driven by:
Strong performance from mines in Russia, US, and Brazil
Benefits from favourable oil prices and FX versus budget assumptions
Continued disciplined capital spending and focus on controlling costs
Gold price strengthU
S$
mill
ions
CASH AND CASH EQUIVALENTS
5www.kinross.com
5
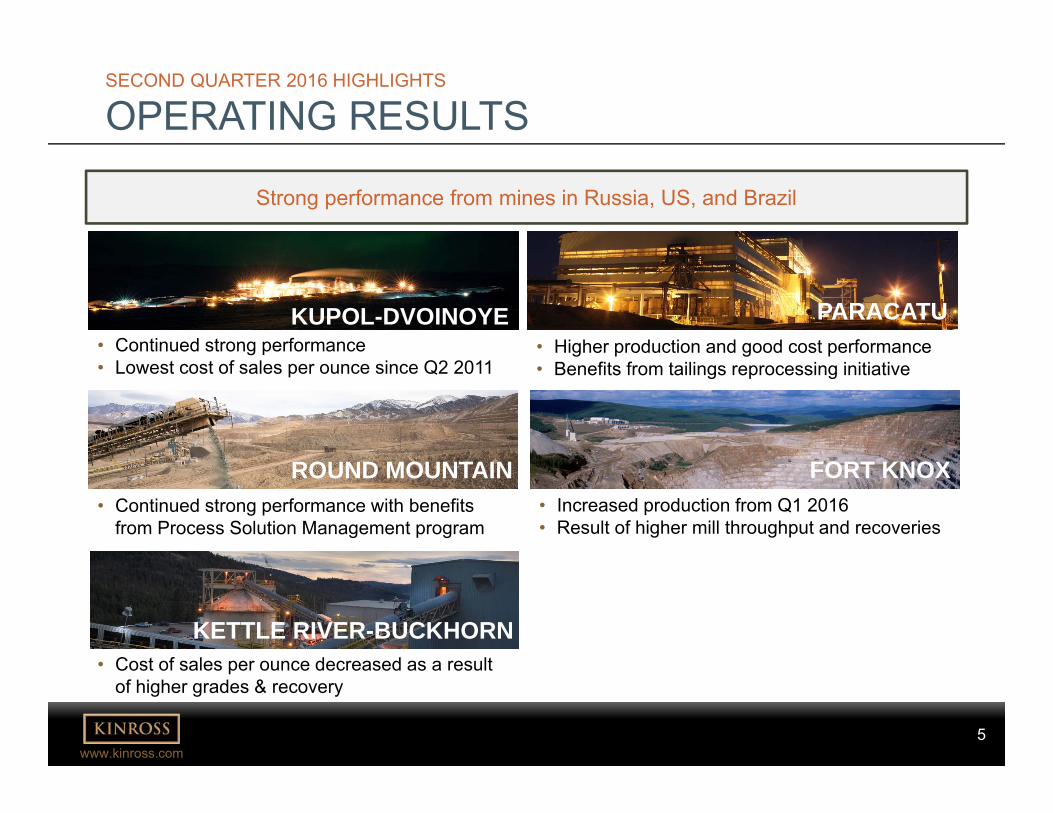
SECOND QUARTER 2016 HIGHLIGHTS
OPERATING RESULTS
Strong performance from mines in Russia, US, and Brazil
• Increased production from Q1 2016• Result of higher mill throughput and recoveries
FORT KNOX
• Continued strong performance• Lowest cost of sales per ounce since Q2 2011
KUPOL-DVOINOYE• Higher production and good cost performance• Benefits from tailings reprocessing initiative
PARACATU
• Continued strong performance with benefits from Process Solution Management program
ROUND MOUNTAIN
• Cost of sales per ounce decreased as a result of higher grades & recovery
KETTLE RIVER-BUCKHORN

6www.kinross.com
6
On track to meet 2016 guidance targets
SECOND QUARTER 2016 HIGHLIGHTS
2016 PRODUCTION & COST OUTLOOK(4)
2015 2016E
Gold Equivalent Production(1)
(millions)
2015 2016E
$696$675 to $735
Production Cost of Sales(2)
($ per ounce)All-in Sustaining Cost(3)
($ per ounce)
2015 2016E
$975 $890 to $9902.7 – 2.9
2.6
(1) Refer to endnote #1.(2) Refer to endnote #2.
(3) Refer to endnote #3. (4) Refer to endnote #4.

7www.kinross.com
7
SECOND QUARTER 2016 HIGHLIGHTS
TASIAST UPDATE
• Temporarily suspended mining and processing operations at Tasiast on June 18, 2016 due to expatriate work permit issues
• Agreed on required “Mauritanization” plan to increase number of skilled nationals working at Tasiast
• Have begun to remobilize the work force and expect normal operations to resume in August
• Phase One’s ramp up to full production may be extended into Q2 2018
• Government support for Tasiast and the expansion remains strong
Normal operations expected to resume in first half of August

8www.kinross.com
8
ATTRACTIVE GROWTH OPPORTUNITIES
NEVADA MINE OPERATIONSNevada mine tour highlights growth potential at Bald Mountain and Round Mountain
BALD MOUNTAIN
• Near-term opportunities which could double mineral reserve estimates by end of Q1 2017
• Additional opportunities to extend mine life estimates
• Excellent exploration potential with over 20 target areas identified and additional brownfield and greenfield opportunities
ROUND MOUNTAIN
• Strong near-term cash flow contributor
• Additional upside opportunities with continuous improvement initiatives
• Phase W scoping study encouraging - longer-term option to extend mine life estimates

9www.kinross.com
9FINANCIAL HIGHLIGHTS
9

10www.kinross.com
10
SECOND QUARTER 2016 HIGHLIGHTS
FINANCIAL RESULTS
Q2 2015 Q2 2016
Attributable gold equivalent ounces (oz.)(1)
Produced 660,898 671,267
Sold 626,246 686,752
Average realized gold price ($/oz.) $1,194 $1,266
Production cost of sales ($/oz.)(2)
Gold equivalent $724 $731
By-product $712 $711
All-in sustaining cost ($/oz.)(3) $1,011 $988
Capital expenditures ($M) $128.5 $114.0
Revenue ($M) $755.2 $876.4
Adjusted operating cash flow ($M)(5) $161.4 $187.2
per share $0.14 $0.15
Adjusted net loss attributable to common shareholders($M)(5) ($13.6) ($9.8)
per share ($0.01) ($0.01)
(1) Refer to endnote #1.(2) Refer to endnote #2.
(3) Refer to endnote #3.(5) Refer to endnote #5.
11www.kinross.com
11
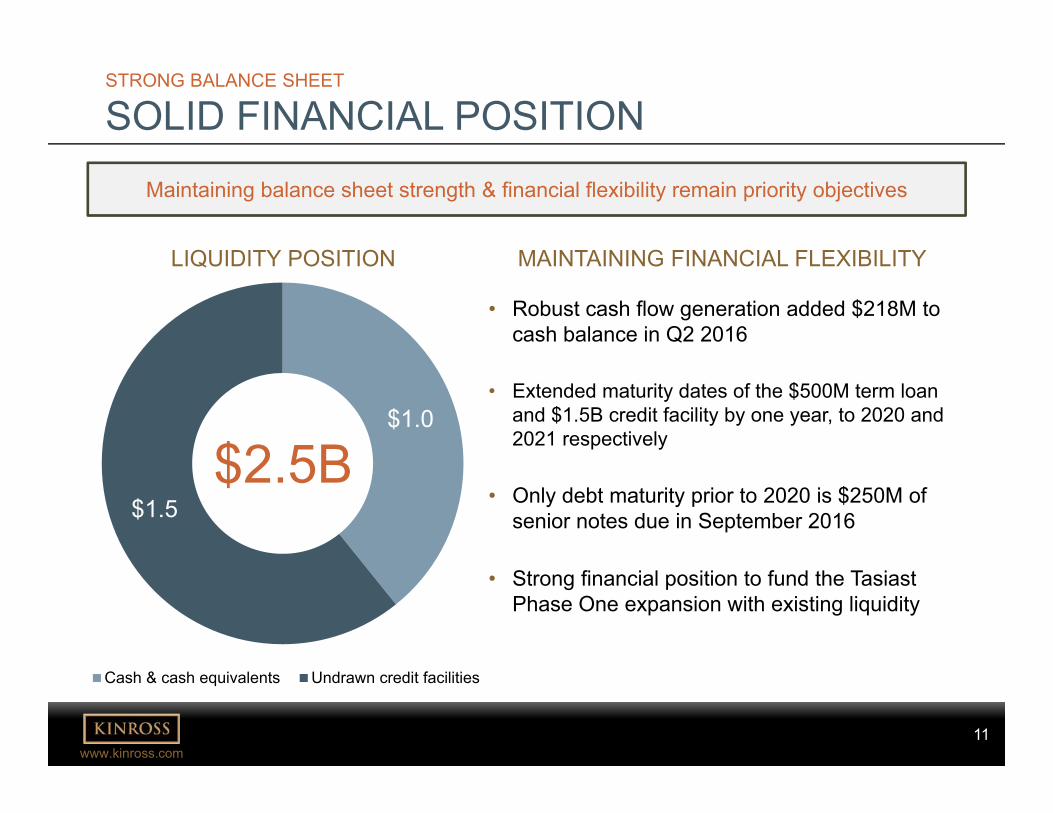
STRONG BALANCE SHEET
SOLID FINANCIAL POSITION
$1.0
$1.5
Cash & cash equivalents Undrawn credit facilities
LIQUIDITY POSITION
Maintaining balance sheet strength & financial flexibility remain priority objectives
MAINTAINING FINANCIAL FLEXIBILITY
• Robust cash flow generation added $218M to cash balance in Q2 2016
• Extended maturity dates of the $500M term loan and $1.5B credit facility by one year, to 2020 and 2021 respectively
• Only debt maturity prior to 2020 is $250M of senior notes due in September 2016
• Strong financial position to fund the Tasiast Phase One expansion with existing liquidity
$2.5B
12www.kinross.com
12OPERATING HIGHLIGHTS
12
13www.kinross.com
13
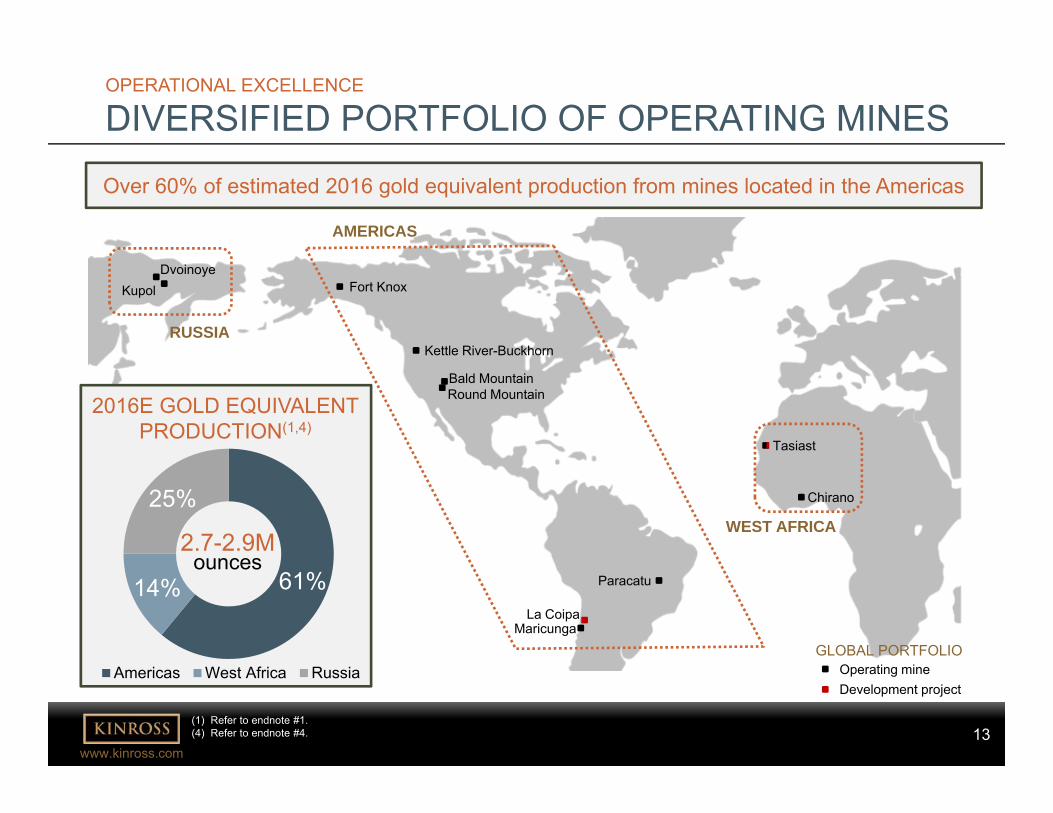
2016E GOLD EQUIVALENT PRODUCTION(1,4)
OPERATIONAL EXCELLENCE
DIVERSIFIED PORTFOLIO OF OPERATING MINES
GLOBAL PORTFOLIOOperating mineDevelopment project
Round Mountain
Kettle River-Buckhorn
Fort Knox
La Coipa
Paracatu
Maricunga
KupolDvoinoye
Chirano
Tasiast
AMERICASRUSSIA
WEST AFRICA
(3) Refer to endnote #3.
Over 60% of estimated 2016 gold equivalent production from mines located in the Americas
61%14%
25%
Americas West Africa Russia
2.7-2.9M ounces
(1) Refer to endnote #1.(4) Refer to endnote #4.
Bald Mountain
AMERICAS
RUSSIA
14www.kinross.com
14
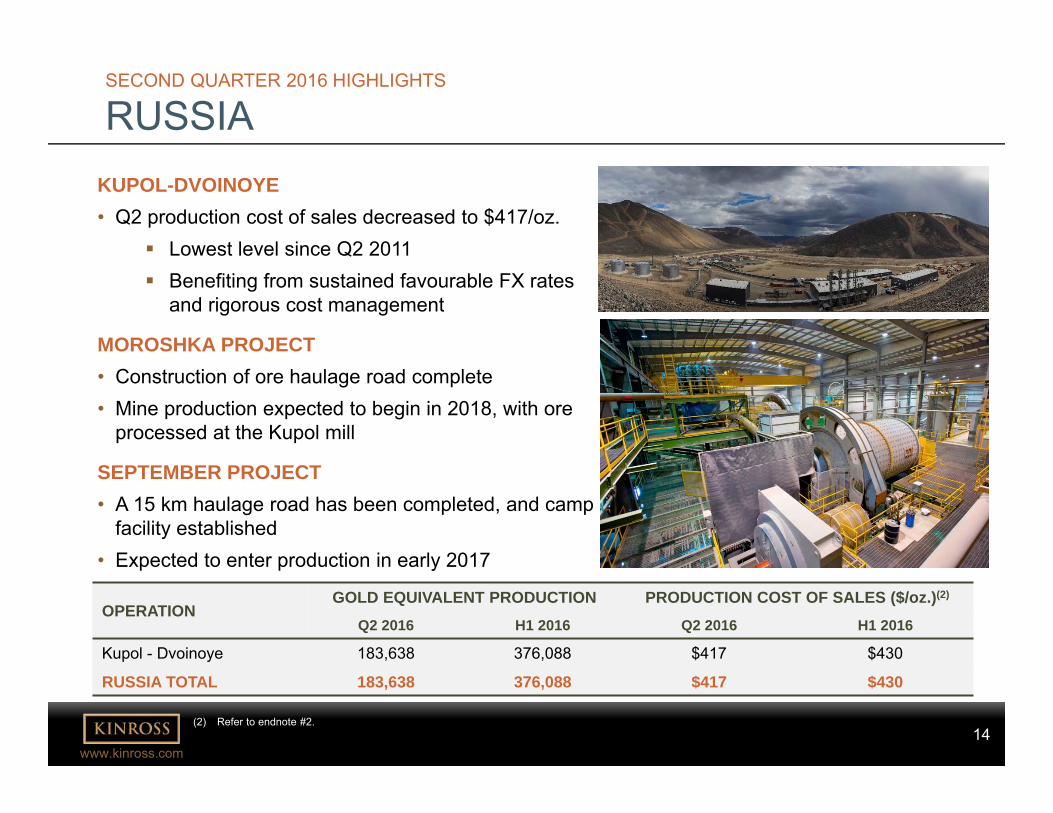
SECOND QUARTER 2016 HIGHLIGHTS
RUSSIAKUPOL-DVOINOYE• Q2 production cost of sales decreased to $417/oz.
Lowest level since Q2 2011 Benefiting from sustained favourable FX rates
and rigorous cost management
MOROSHKA PROJECT• Construction of ore haulage road complete• Mine production expected to begin in 2018, with ore
processed at the Kupol mill
SEPTEMBER PROJECT• A 15 km haulage road has been completed, and camp
facility established • Expected to enter production in early 2017
(2) Refer to endnote #2.
OPERATIONGOLD EQUIVALENT PRODUCTION PRODUCTION COST OF SALES ($/oz.)(2)
Q2 2016 H1 2016 Q2 2016 H1 2016
Kupol - Dvoinoye 183,638 376,088 $417 $430
RUSSIA TOTAL 183,638 376,088 $417 $430
15www.kinross.com
15
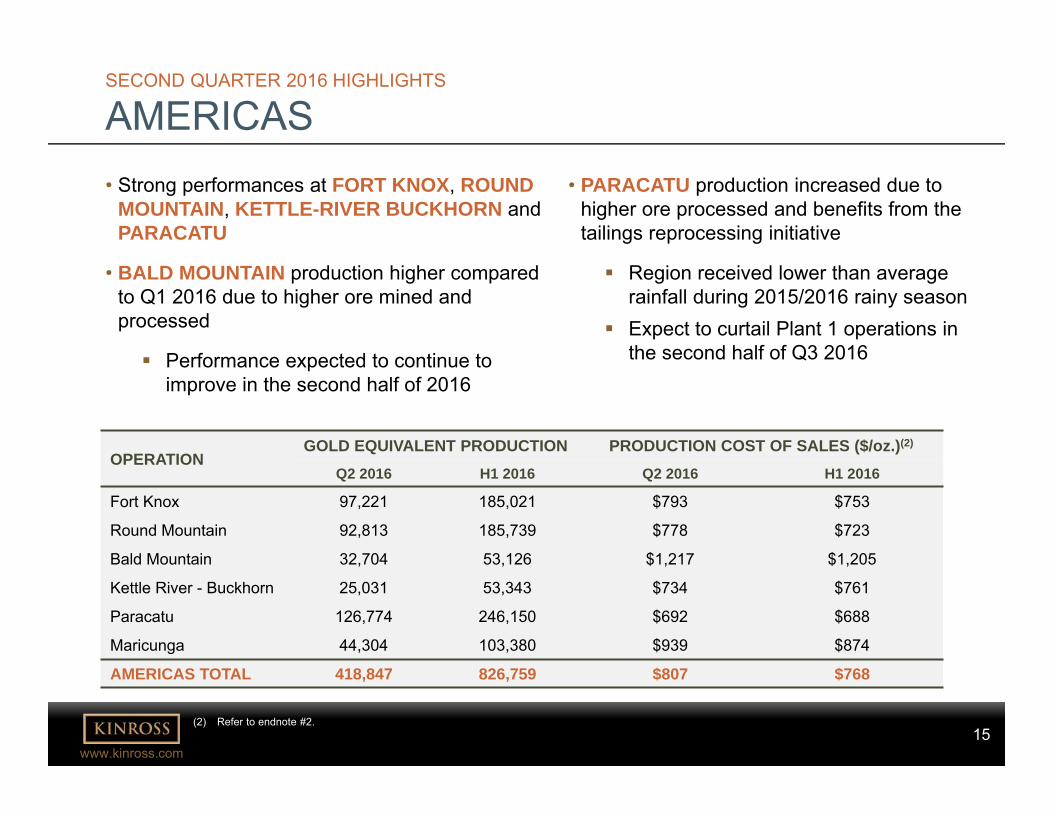
SECOND QUARTER 2016 HIGHLIGHTS
AMERICAS• PARACATU production increased due to
higher ore processed and benefits from the tailings reprocessing initiative
Region received lower than average rainfall during 2015/2016 rainy season
Expect to curtail Plant 1 operations in the second half of Q3 2016
OPERATIONGOLD EQUIVALENT PRODUCTION PRODUCTION COST OF SALES ($/oz.)(2)
Q2 2016 H1 2016 Q2 2016 H1 2016
Fort Knox 97,221 185,021 $793 $753
Round Mountain 92,813 185,739 $778 $723
Bald Mountain 32,704 53,126 $1,217 $1,205
Kettle River - Buckhorn 25,031 53,343 $734 $761
Paracatu 126,774 246,150 $692 $688
Maricunga 44,304 103,380 $939 $874
AMERICAS TOTAL 418,847 826,759 $807 $768
(2) Refer to endnote #2.
• Strong performances at FORT KNOX, ROUND MOUNTAIN, KETTLE-RIVER BUCKHORN and PARACATU
• BALD MOUNTAIN production higher compared to Q1 2016 due to higher ore mined and processed
Performance expected to continue to improve in the second half of 2016
16www.kinross.com
16
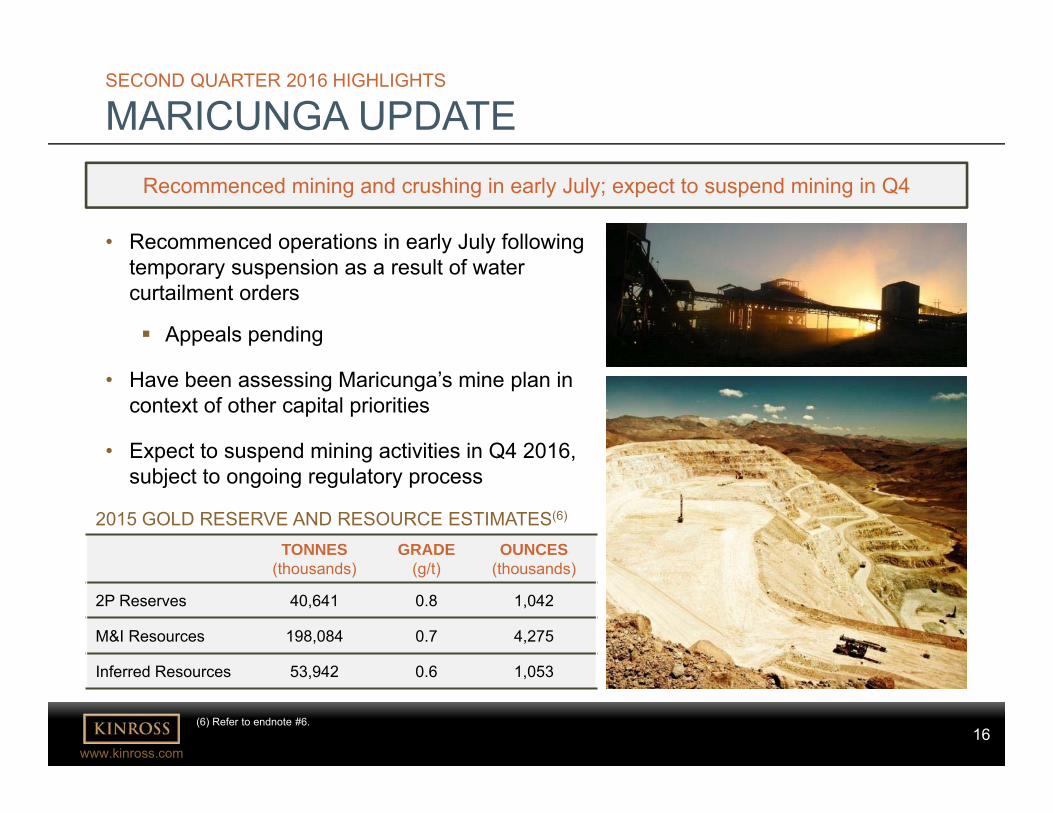
• Recommenced operations in early July following temporary suspension as a result of water curtailment orders
Appeals pending
• Have been assessing Maricunga’s mine plan in context of other capital priorities
• Expect to suspend mining activities in Q4 2016, subject to ongoing regulatory process
SECOND QUARTER 2016 HIGHLIGHTS
MARICUNGA UPDATE
TONNES(thousands)
GRADE (g/t)
OUNCES(thousands)
2P Reserves 40,641 0.8 1,042
M&I Resources 198,084 0.7 4,275
Inferred Resources 53,942 0.6 1,053
2015 GOLD RESERVE AND RESOURCE ESTIMATES(6)
Recommenced mining and crushing in early July; expect to suspend mining in Q4
(6) Refer to endnote #6.

17www.kinross.com
17
SECOND QUARTER 2016 HIGHLIGHTS
WEST AFRICA• TASIAST Q2 production lower due to 18-day
strike and temporary suspension of mining and processing
• CHIRANO production decreased as site transitions from mining in the Awkaabaunderground to Paboase
Resulted in fewer tonnes mined and lower grades
Recovery plan implemented in March; beginning to see improvements
Expect higher production and lower costs in the second half of the year
OPERATIONGOLD EQUIVALENT PRODUCTION(1) PRODUCTION COST OF SALES ($/oz.)(2)
Q2 2016 H1 2016 Q2 2016 H1 2016
Tasiast 29,577 76,655 $1,240 $1,073
Chirano (90%)(1) 39,205 79,228 $1,142 $1,061
WEST AFRICA TOTAL(1) 68,782 155,883 $1,184 $1,067
(1) Refer to endnote #1.(2) Refer to endnote #2.

18www.kinross.com
18
• Focus on operational excellence
• Quality over quantity
• Disciplined capital allocation
• Maintaining a strong balance sheet
18
PRINCIPLES FOR BUILDING VALUE
19www.kinross.com
19APPENDIX

20www.kinross.com
20
ENDNOTES1) Unless otherwise noted, gold equivalent production, gold equivalent ounces sold and production cost of sales figures
in this presentation are based on Kinross’ 90% share of Chirano production and sales.
2) Attributable production cost of sales per gold equivalent ounce sold and per gold ounce sold on a by-product basis arenon-GAAP measures. For more information and a reconciliation of this non-GAAP measure for the three and sixmonths ended June 30, 2016 and 2015, please refer to the news release dated July 27, 2016, under the heading“Reconciliation of non-GAAP financial measures”, available on our website at www.kinross.com.
3) All-in sustaining cost is a non-GAAP measure. For more information and a reconciliation of this non-GAAP measurefor the three and six months ended June 30, 2016 and 2015, please refer to the news release dated July 27, 2016under the heading “Reconciliation of non-GAAP financial measures”, available on our website at www.kinross.com.
4) For more information regarding Kinross’ production, cost and capital expenditures outlook for 2016, please refer to thenews releases dated February 10, 2016 and July 27, 2016, both of which are available on our website atwww.kinross.com. Kinross’ outlook for 2016 represents forward-looking information and users are cautioned thatactual results may vary. Please refer to the Cautionary Statement on Forward-Looking Information on slide 2 of thispresentation and in our news release dated July 27, 2016, available on our website at www.kinross.com.
5) Adjusted net earnings attributable to common shareholders and adjusted operating cash flow are non-GAAP financialmeasures. For more information and a reconciliation of these non-GAAP measures for the three and six monthsended June 30, 2016 and 2015, please refer to the news release dated July 27, 2016, under the heading“Reconciliation of non-GAAP financial measures”, available on our website at www.kinross.com.
6) For more information regarding Kinross’ 2015 mineral reserve and mineral resource estimates, please refer to ourAnnual Mineral Reserve and Mineral Resource Statement as at December 31, 2015 contained in our AnnualInformation Form filed March 30, 2016, which is available on our website at www.kinross.com.

21www.kinross.com
21
KINROSS GOLD CORPORATION 25 York Street, 17th Floor │Toronto, ON │ M5J 2V5
www.kinross.com