q2 fy’18 - jindal steel and power · mini & other producers grew by 1.8% ... brm 1.0 mtpa...
TRANSCRIPT

Q2 FY’18
Industry Update &
Key Performance Highlights
9th November, 2017

DISCLAIMERThis presentation may contain certain forward looking statements concerning JSPL’s futurebusiness prospects and business profitability, which are subject to a number of risks anduncertainties and the actual results could materially differ from those in such forward lookingstatements.
The risks and uncertainties relating to these statements include, but are not limited to, risks anduncertainties regarding fluctuations in earnings, our ability to manage growth, competition(both domestic and international), economic growth in India and the target countries forexports, ability to attract and retain highly skilled professionals, time and cost over runs oncontracts, our ability to manage our international operations, government policies and actionswith respect to investments, fiscal deficits, regulations, etc., interest and other fiscal costsgenerally prevailing in the economy. Past performance may not be indicative of futureperformance. We do not undertake to update our forward-looking statements.
This presentation is not intended, and does not, constitute or form part of any offer, invitation orthe solicitation of an offer to purchase, otherwise acquire, subscribe for, sell or otherwisedispose of, any securities in JSPL or any of it’s subsidiary undertakings or any other invitation orinducement to engage in investment activities, neither shall this presentation nor the fact of it’sdistribution form the basis of, or be relied on in connection with, any contract or investmentdecision. Few numbers in this presentation are purely indicative & provisional and could changelater.
2
OUTLOOK
Q2 FY’18
INDUSTRYDEVELOPMENTS
BRIEF BACKGROUND OPERATIONALPERFORMANCE
PRESENTATION OUTLINE
3

Source: Ministry of Finance 4
ElectricityMining
India: IIP exhibited an uptickFactory out put rose to 9 month high at 4.3% in Aug’17
Manufacturing
3.2%
0.3% 0.4%
4.5%
9.4%
April '17 May '17 June '17 July '17 Aug '17
3.2%
2.6%
-0.5% -0.3%
3.1%
April '17 May '17 June '17 July '17 Aug '17
5.4%
8.3%
2.1%
6.6%
8.3%
April '17 May '17 June '17 July '17 Aug '17
Overall IIP Trend
3.4%
2.9%
-0.2%
0.9%
4.3%
April '17 May '17 June '17 July '17 Aug '17
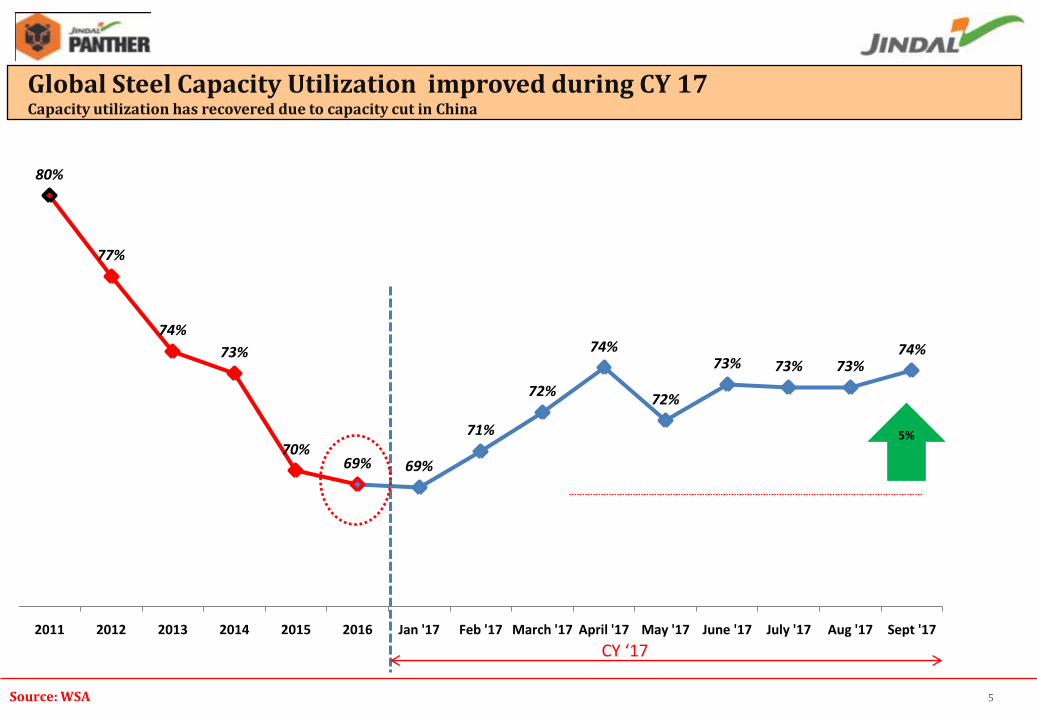
Source: WSA 5
80%
77%
74%
73%
70%69% 69%
71%
72%
74%
72%
73% 73% 73%74%
2011 2012 2013 2014 2015 2016 Jan '17 Feb '17 March '17 April '17 May '17 June '17 July '17 Aug '17 Sept '17
5%
CY ‘17
Global Steel Capacity Utilization improved during CY 17Capacity utilization has recovered due to capacity cut in China

Source: WSA 6
World Crude Steel Production firmed up led by higher output from major producers
799
808
105.1
104.8
89
96
1615
1629
0.8 % 1200
1267
5.6%
601
639
6.3%
78.4
78.30.2 %
71
75
CY ‘15
No #1 China
No #2 Japan
No #3 India
CY ‘16
0.3%
7.4 %
9 Month CY ‘16 9 month CY ‘17
5.7%
World
1.2 %
India is all set to become 2nd biggest steel producer in the world

7
Steel industry’s contribution to
National GDP
Nearly 2%
Steel Industry’s contribution to
Index of Industrial Production (IIP)
6.68%
Employment by the steel industry
Current Market value of the Indian
Steel Industry
$75 bn
Total Investment
expected till 2025-
2030
$187 Bn
India’s per capita steel consumption is expected to increase to 158 Kg in 2031 from current 61 Kg
> Indian steel industry continues to capitalize on its competencies to invest further.
Domestic Steel Industry continues to grow and play major role in Nation Building
116144
300
FY '16 FY '20e FY '31 (GoI Vision)
Crude Steel Capacity Projection
81.5
230
FY '16 FY '31e
Finished Steel Consumption
In Million MT (Mt)
Source: WSA
Source: JPC 8
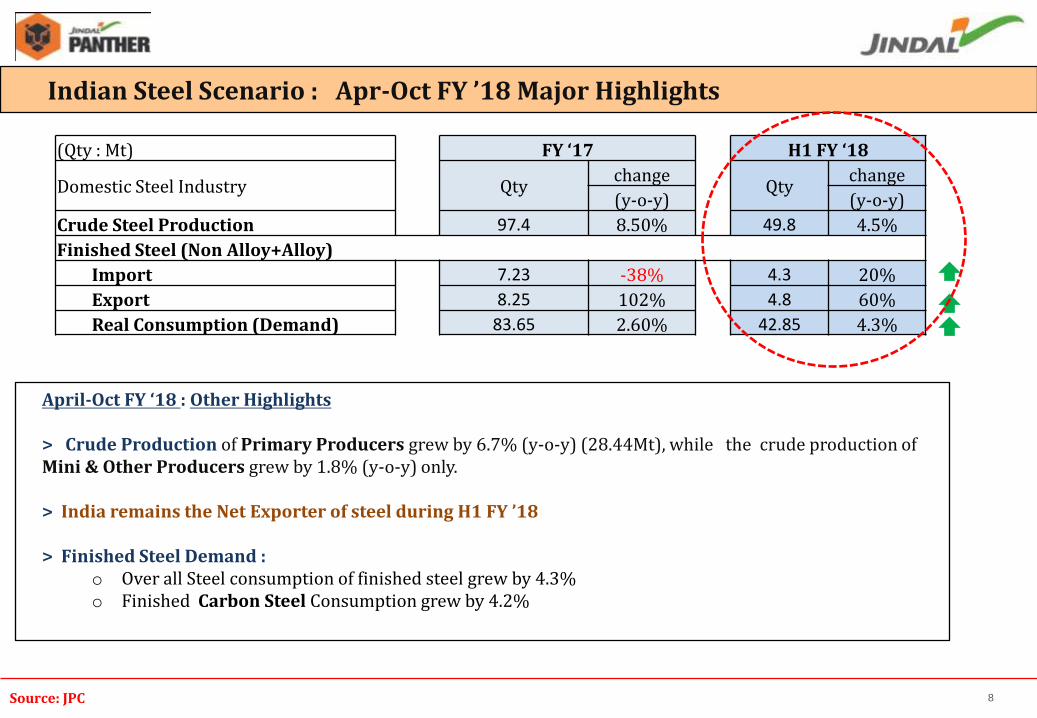
Indian Steel Scenario : Apr-Oct FY ’18 Major Highlights
April-Oct FY ‘18 : Other Highlights
> Crude Production of Primary Producers grew by 6.7% (y-o-y) (28.44Mt), while the crude production of Mini & Other Producers grew by 1.8% (y-o-y) only.
> India remains the Net Exporter of steel during H1 FY ’18
> Finished Steel Demand : o Over all Steel consumption of finished steel grew by 4.3%o Finished Carbon Steel Consumption grew by 4.2%
(Qty : Mt) FY ‘17 H1 FY ‘18
Domestic Steel Industry Qtychange
Qtychange
(y-o-y) (y-o-y)
Crude Steel Production 97.4 8.50% 49.8 4.5%
Finished Steel (Non Alloy+Alloy)
Import 7.23 -38% 4.3 20%
Export 8.25 102% 4.8 60%
Real Consumption (Demand) 83.65 2.60% 42.85 4.3%

OUTLOOK
Q2 FY’18
INDUSTRYDEVELOPMENTS
BRIEF BACKGROUND OPERATIONALPERFORMANCE
PRESENTATION OUTLINE
9

INDUSTRY UPDATESTEEL SECTOR
10

11Source: Ministry of Steel/ MECON
50.5 Mt
Current Demand (FY '16)
8.2 Mt
Construction & InfrastructureSteel/O&G/Highway/Bridge/Airport/
ports/Urban Infra/PreFab buildings/Power/
Real Estate(resid+Industrial)
Automotive
Projected Demand (FY31)
> Major steel demand will come from Infrastructure & Construction sector > JSPL having its requisite product mix will likely to be benefited most.
Indian domestic Finished Steel Demand will likely to remain healthy Sector Wise Finished Steel Consumption Projection
138 Mt
28 Mt
7%
9%
Growth CAGR (%)
2.4 MtPackaging and OthersPetroleum, non-petroleum, LPG Gas Cylinders
6 Mt
18 Mt
Engineering & FabricationCapital Goods/Consumer Durable/Electrical Goods
/Tube /Wire/Pressure Vessels/Defence/General Fabrication/General Enginnering
50Mt8%
2.4 MtOther TransportRail lines, Wagons Coaches, Ship Building, Coastal
8 Mt9%
7%
81.5 MtTotal 230 Mt8%
Per Capita Steel Consumption 61 1587%
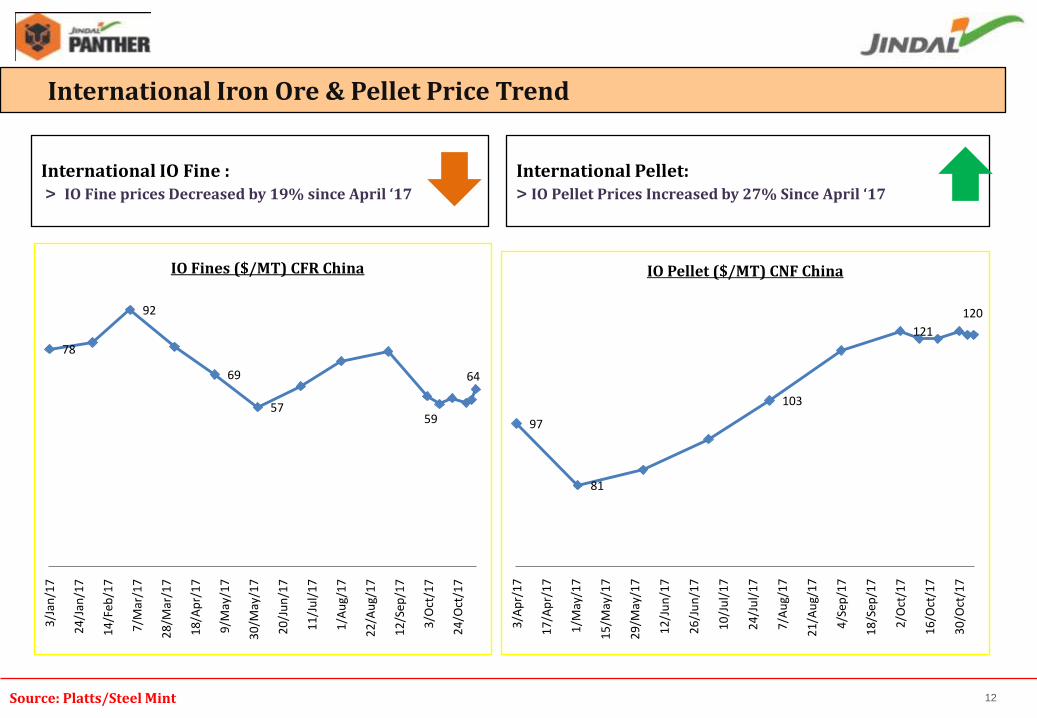
Source: Platts/Steel Mint 12
International Iron Ore & Pellet Price Trend
78
92
69
5759
64
3/J
an/1
7
24
/Jan
/17
14
/Feb
/17
7/M
ar/1
7
28
/Mar
/17
18
/Ap
r/1
7
9/M
ay/1
7
30
/May
/17
20
/Ju
n/1
7
11
/Ju
l/1
7
1/A
ug/
17
22
/Au
g/1
7
12
/Sep
/17
3/O
ct/1
7
24
/Oct
/17
IO Fines ($/MT) CFR China
International IO Fine : > IO Fine prices Decreased by 19% since April ‘17
International Pellet: > IO Pellet Prices Increased by 27% Since April ‘17
97
81
103
121
120
3/A
pr/
17
17
/Ap
r/1
7
1/M
ay/1
7
15
/May
/17
29
/May
/17
12
/Ju
n/1
7
26
/Ju
n/1
7
10
/Ju
l/1
7
24
/Ju
l/1
7
7/A
ug/
17
21
/Au
g/1
7
4/S
ep/1
7
18
/Sep
/17
2/O
ct/1
7
16
/Oct
/17
30
/Oct
/17
IO Pellet ($/MT) CNF China

Source: Platts/Steel Mint 13
Domestic Iron Ore Trend
1200
1100
1300
1350
1400 1400 1400
1000
1050
1100
1150
1200
1250
1300
1350
1400
1450
IO Fines (Rs/MT)
2300
2825
2550
2800 2800 2800 2800
2200
2300
2400
2500
2600
2700
2800
2900
IO Lumps (Rs/MT)

Source: Platts, Argus 14
International Coal : Price Trend
International Coal Prices trend
(From April ‘17 till 7th Nov’17:)
> Steam Coal RB1 Coal : Up by $16/MT (FOB S. Africa)
93
232
186164 158
260
171146
166197 203
183 180
Ap
r-1
6
Oct
-16
Jan
-17
Feb
-17
Mar
-17
Ap
r-1
7
May
-17
Jun
-17
Jul-
17
Au
g-1
7
Sep
-17
Oct
-17
Late
st
Prime Hard Coking Coal ($/MT FOB Australia)
52
8386
8379 77
72 72 72
8792 91
94A
pr-
16
Oct
-16
Jan
-17
Feb
-17
Mar
-17
Ap
r-1
7
May
-17
Jun
-17
Jul-
17
Au
g-1
7
Sep
-17
Oct
-17
Late
st
Steam Coal RB1 ($/MT FOB S Africa)
International Coal Prices trend
(From April ‘17 till 7th Nov’17:)
> Prime Hard Coking Coal: down by $80/MT (FOB Australia)

INDUSTRY UPDATEPOWER SECTOR
15

Source: IEX 16
Major Updates: Exchange Prices
2.372.39
2.46 2.71
2.9
2.592.45
3.07
4.084.08
2.242.11
2.4
2.69
2.06
2.23
2.1 2.082.35
2.4
2.252.14
2.59
2.31
2.2
2.472.25
2.18
2.2 2.39
3.4
2.89
2.54 2.45
1.3
1.8
2.3
2.8
3.3
3.8
Jan Feb Mar Apr May Jun Jul Aug Sep Oct Nov Dec
RTC Power Exchange Prices – W3 Area – Regional Periphery Prices (Rs./kWh)
2017 2016 2015

Frequency Distribution of Capacity Sold over IEX
108
267
2,314
1,308
584
345 329
71 10 9
-
500
1,000
1,500
2,000
2,500
Frequency Distribution of Capacity sold over IEX at various Prices
MW
Source: IEX 17

OUTLOOK
Q2’FY18
INDUSTRYDEVELOPMENTS
BRIEF BACKGROUND
PRESENTATION OUTLINE
OPERATIONALPERFORMANCE
18
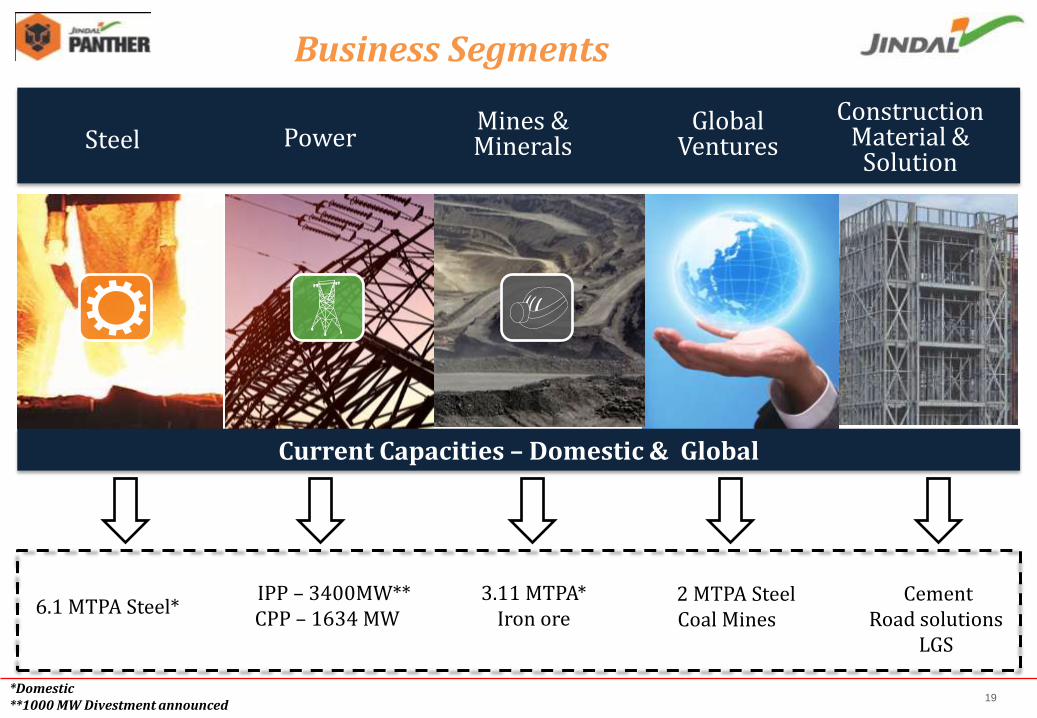
Steel PowerMines & Minerals
Global Ventures
Current Capacities – Domestic & Global
Business Segments
*Domestic**1000 MW Divestment announced
Construction Material &
Solution
6.1 MTPA Steel* 3.11 MTPA*
Iron ore IPP – 3400MW**CPP – 1634 MW
2 MTPA SteelCoal Mines
CementRoad solutions
LGS
19

Capacity in deail
Iron Making
(9.95 MTPA)
BF 5.33 MTPA
DRI 3.12 MTPA
HBI 1.50 MTPA
Liquid Steel
(8.10 MTPA)
SMS 8.10 MTPA
Finished Steel
(6.55 MTPA)
WRM 0.60 MTPA
RUBM 0.75 MTPA
MLSM 0.60 MTPA
Plate Mill 2.20 MTPA
BRM 2.4 MTPA
Steel Capacities across Life Cycle
*BoF in Angul 2.5 MTPA - To be commissioned*BRM in Angul 1.4 MTPA - To be commissioned
20

Capacity in deail
Raigarh(Chhattisgarh)
SMS 3.6MTPA
BF 2.125 MTPA
DRI 1.32 MTPA
Plate Mill 1.00 MTPA
RUBM 0.75 MTPA
MLSM 0.60 MTPA
CPP 824 MW
Angul
(Odisha)
SMS 2.5 MTPA
*SMS 2.5 MTPA
DRI 1.8 MTPA
BF 3.2 MTPA
CGP 225,000 Nm3/Hr
Plate Mill 1.2 MTPA
*BRM 1.4 MTPA
CPP 810 MW
Barbil
(Odisha)
Pellet Plant
9 MTPA
Patratu (Jharkhand)
WRM 0.60
MTPA
BRM 1.0 MTPA
Oman
SMS 2.0 MTPA
HBI 1.5 MTPA
BRM 1.4 MTPA
JPL
Tamnar 3400 MW
Mining
Iron Ore 3.11
MTPA
Coal Overseas
6.60 MTPA
Detailed plant wise capacities
Power Hot Metal Liquid Steel Finished Steel
*To be commissioned
21

Standalone Q2 FY 18 –Snapshot of Key Financials (Figures in Rs. Crores)
Particulars Q2FY18 Q1FY18 Q2FY17 %QoQ %YoY
Total Revenue 3,668 3,832 3,488 -4% +5%
EBITDA 784 750 531 +5% +48%
EBITDA % 21% 20% 15%
Depreciation 496 481 524 +3% -5%
Finance Cost 578 532 654 +9% -12%
PBT (Before Exceptional) (290) (263) (647) -10% +55%
Exceptional 150 -- --
Profit/(Loss) Before Tax (440) (263) (647) -67% +32%
Profit/(Loss) After Tax (255) (178) (407) -43% +37%
Cash Profit 408 218 (123) +87% +146%
22

Angul
Tamnar
RaigarhCaptive power projects (within JSPL)
ProjectCapacity
(MW)Fuel Configuration Status
DCPP, Raigarh 540 Coal 4x135 MW Operational
JSPL, Raigarh 284Coal & waste heat
1x24 MW (Waste heat)
2x55 MW 6x25 MW
Operational
Angul, Odisha 810 Coal 6 x135 MW Operational
Independent Power Projects (IPP)
ProjectCapacity
(MW)Fuel Configuration Status
Tamnar 1* 1,000 Coal 4x250 MW Operational
Tamnar 2 2,400 Coal 4x600 MW Operational
IPP CPP
One of the largest thermal portfolios in India
JSPL - Power Capacities
*Divestment announced 23

96.43% subsidiary of JSPL
JINDAL POWER LIMITED
EUP -I1000MW (4 X 250)
EUP -II1200MW (2 X 600)
EUP -III1200MW (2 X 600)
24
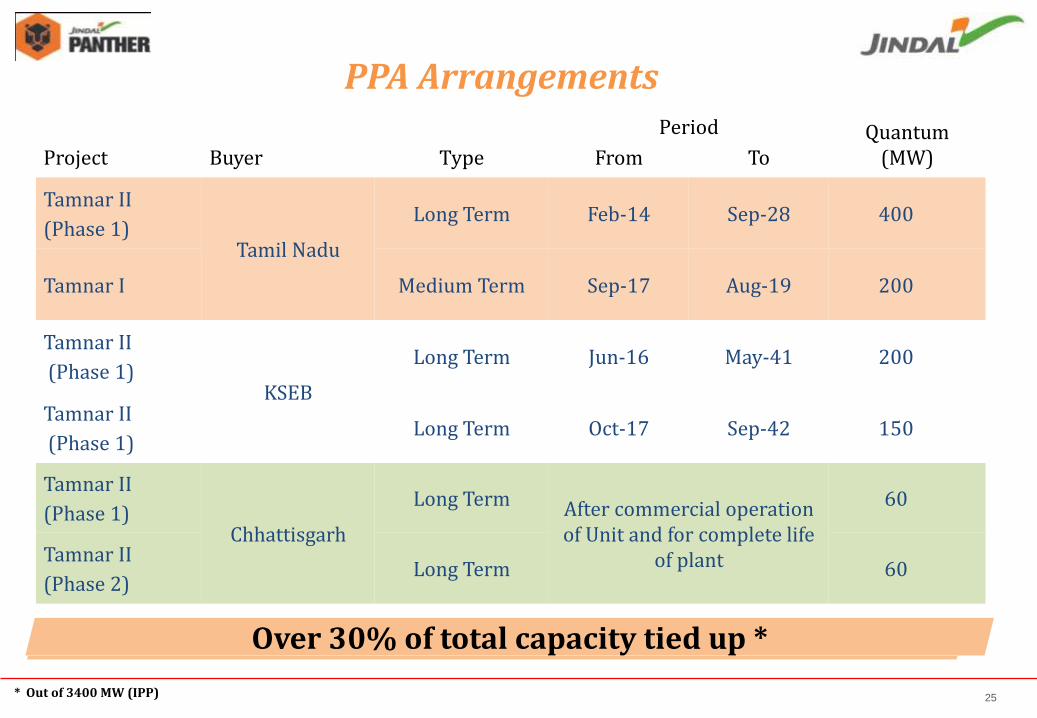
Project Buyer Type
Period Quantum (MW)From To
Tamnar II
(Phase 1)Tamil Nadu
Long Term Feb-14 Sep-28 400
Tamnar I Medium Term Sep-17 Aug-19 200
Tamnar II
(Phase 1)KSEB
Long Term Jun-16 May-41 200
Tamnar II
(Phase 1)Long Term Oct-17 Sep-42 150
Tamnar II
(Phase 1)Chhattisgarh
Long Term After commercial operation of Unit and for complete life
of plant
60
Tamnar II
(Phase 2)Long Term 60
PPA Arrangements
Over 30% of total capacity tied up *
* Out of 3400 MW (IPP) 25
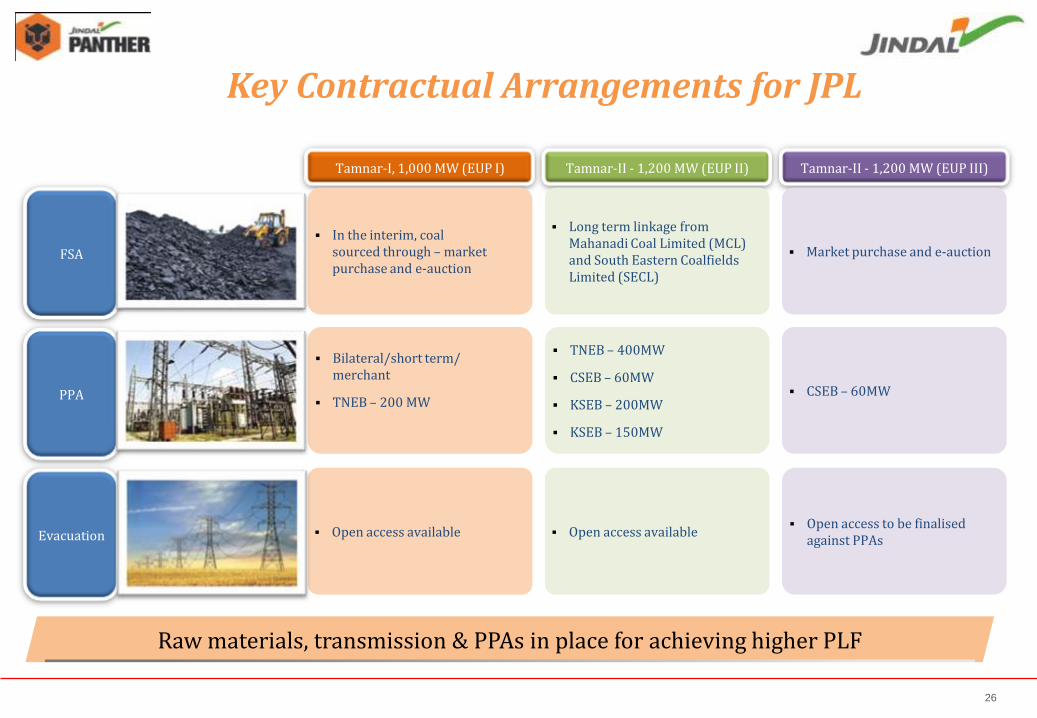
Tamnar-I, 1,000 MW (EUP I)
In the interim, coal sourced through – market purchase and e-auction
Bilateral/short term/merchant
TNEB – 200 MW
Open access available
Tamnar-II - 1,200 MW (EUP II)
Long term linkage from Mahanadi Coal Limited (MCL) and South Eastern Coalfields Limited (SECL)
TNEB – 400MW
CSEB – 60MW
KSEB – 200MW
KSEB – 150MW
Open access available
Tamnar-II - 1,200 MW (EUP III)
Market purchase and e-auction
CSEB – 60MW
Open access to be finalised against PPAs
FSA
PPA
Evacuation
Raw materials, transmission & PPAs in place for achieving higher PLF
Key Contractual Arrangements for JPL
26
27
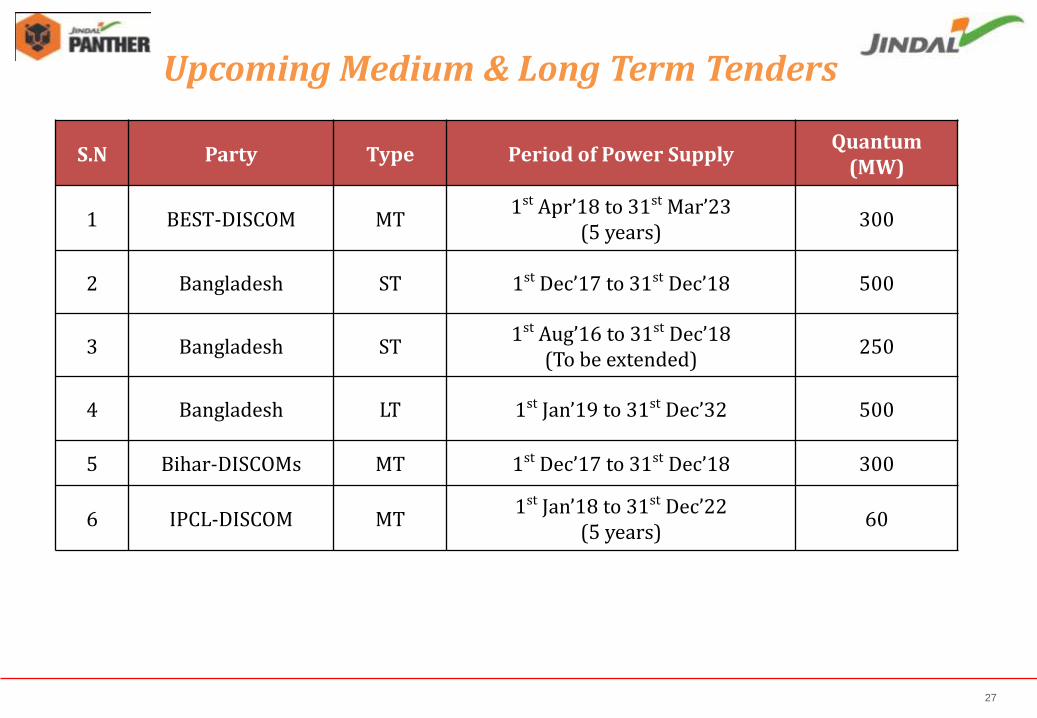
S.N Party Type Period of Power SupplyQuantum
(MW)
1 BEST-DISCOM MT1st Apr’18 to 31st Mar’23
(5 years)300
2 Bangladesh ST 1st Dec’17 to 31st Dec’18 500
3 Bangladesh ST1st Aug’16 to 31st Dec’18
(To be extended)250
4 Bangladesh LT 1st Jan’19 to 31st Dec’32 500
5 Bihar-DISCOMs MT 1st Dec’17 to 31st Dec’18 300
6 IPCL-DISCOM MT1st Jan’18 to 31st Dec’22
(5 years)60
Upcoming Medium & Long Term Tenders

JPL Q2 FY18 – Snapshot of Key Financials (Figures in Rs. Crores)
Particulars Q2FY18 Q1FY18 Q2FY17 %QoQ %YoY
Net Sales 878 1,079 734 -19% +20%
EBITDA 345 468 182 -26% +89%
EBITDA % 39% 43% 25%
Depreciation + Amortization 377 373 354 +1% +7%
Interest 227 227 179 -- +27%
Profit/(Loss) Before Tax (190) (62) (246) -204% +23%
Profit/(Loss) After Tax (176) (32) (205) -445% +14%
Cash Profit 187 310 107 -40% +74%
Generation (MU) 2,427 3,186 2,313 -24% +5%
28

Developing a 3 MTPA coal
mine in Mozambique’s coal-
rich Moatize region
Mozambique, Africa
JSPL’s Kiepersol Colliery produces Anthracite
coal, sold domestically and internationally.
South Africa, Africa
Acquired 60.3% stake in
Wollongong Coal
Australia
1.5 MT HBI , 2 MT SMS Plant &
1.4MTPA Rebar Mill – an
Integrated Steel Plant
Shadeed, Oman
Summary of International Operations
29

Oman
Holding structure for global operations
Jindal Steel & Power Ltd
Listed Operating Entity in India
Australia
Coking Coal
South Africa
Anthracite Coal
Mozambique
Thermal/ Coking Coal
Jindal Steel & Power (Mauritius) Ltd
Holding company for overseas business
2 MTPA Steel plant
30
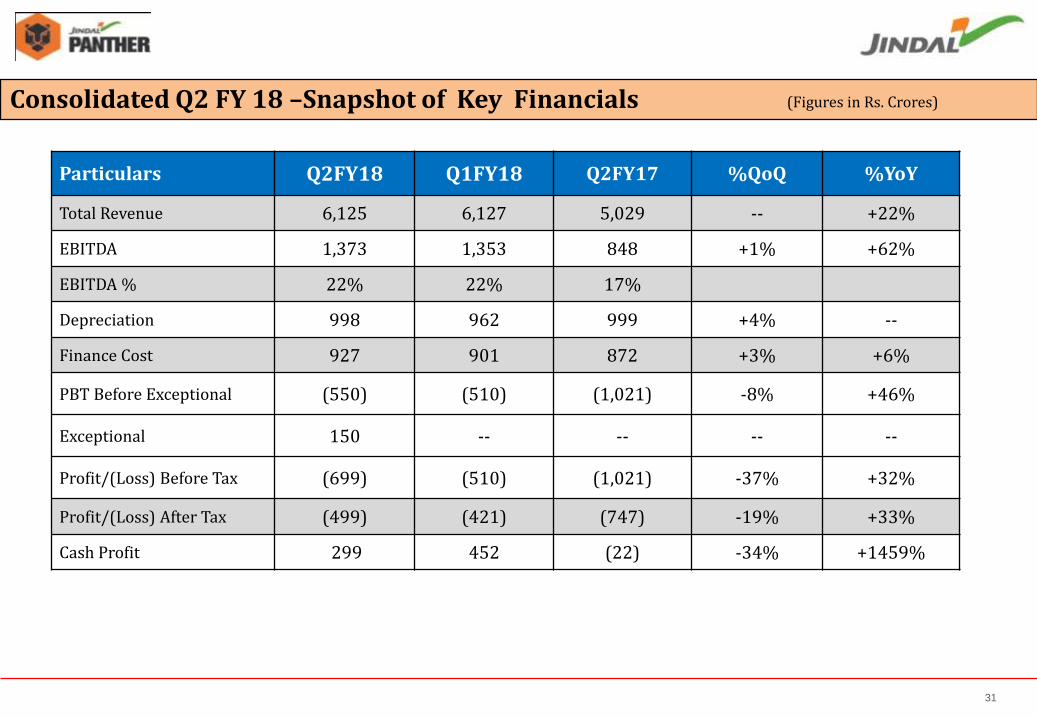
Consolidated Q2 FY 18 –Snapshot of Key Financials
Particulars Q2FY18 Q1FY18 Q2FY17 %QoQ %YoY
Total Revenue 6,125 6,127 5,029 -- +22%
EBITDA 1,373 1,353 848 +1% +62%
EBITDA % 22% 22% 17%
Depreciation 998 962 999 +4% --
Finance Cost 927 901 872 +3% +6%
PBT Before Exceptional (550) (510) (1,021) -8% +46%
Exceptional 150 -- -- -- --
Profit/(Loss) Before Tax (699) (510) (1,021) -37% +32%
Profit/(Loss) After Tax (499) (421) (747) -19% +33%
Cash Profit 299 452 (22) -34% +1459%
(Figures in Rs. Crores)
31

OUTLOOK
Q2 FY’18
INDUSTRYDEVELOPMENTS
BRIEF BACKGROUND
PRESENTATION OUTLINE
OPERATIONALPERFORMANCE
32

JSPL Performance Highlights
India’s largest Blast Furnace commissioned at Angul.
JSPL’s Standalone EBITDA increased by 48% Y-o-Y for Q2FY18
JSPL’s Consolidated Steel Production for Q2FY18 was 1.32 Million Tonne up 14% YoY (1.16 Million Tonne in Q2FY17)
JSPL’s Consolidated EBITDA increased by 62% Y-o-Y for Q2FY18
Oman ‘s EBITDA increased by 316% Y-o-Y in 2QFY18
33

JPL Performance Highlights
Increase in Generation by 5% Y-o-Y in 2QFY18
Increase in turnover by 20% from Rs 734 Cr in 2QFY17 to Rs 878 Cr in 2QFY18
Increase in EBITDA by 89% Y-o-Y in Q2FY18
Rating Agency ICRA has reaffirmed A- rating for JPL
Extension of TNEB Medium Term PPA beyond August 2017
34

0
0.2
0.4
0.6
0.8
1
1.2
1.4
1.6
0.84 0.88 0.840.91 0.90 0.89
0.35 0.28 0.31
0.39 0.36 0.43
Jindal Shadeed JSPL
1.301.19 1.16 1.15
Consolidated Steel Production
(Figures in Million Tonnes)
1.26
Consolidated Steel Sales
0
0.2
0.4
0.6
0.8
1
1.2
1.4
1.6
0.78 0.81 0.84 0.920.81 0.83
0.33 0.27 0.32
0.390.34
0.43
Jindal Shadeed JSPL
1.311.11 1.08 1.16 1.15
35
1.32 1.27

Key Customers & Adding…
36

For any information please contact: -
Mr. Nishant Baranwal – Head, Investor RelationsTel : +91 11-41462198Mobile:+91 8800690255Email: - [email protected]
Ms. Shweta Bagaria – Assistant Manager, Investor RelationsTel: +91-124-6612073Mobile: +91 95995 53717Email: [email protected]
37

THANK YOU
38