q3 2021 commercial real estate outlook
TRANSCRIPT

Q3 2021 Commercial real estate outlook
Heating upMidway through 2021, activity in the U.S. economy and commercial real estate market is heating up alongside the weather. With the fundamental picture brightening, the focus has begun to shift toward assessing the long-term impact of pandemic trends on various property sectors.
FS Investment Solutions, LLC 201 Rouse Boulevard, Philadelphia, PA 19112 www.fsinvestmentsolutions.com 877-628-8575 Member FINRA/SIPC© 2021 FS Investments www.fsinvestments.com OUTLOOK-CRE-Q32021
Learn moreRead more from our research team
Sign up to receive our latest Insights articles
This information is educational in nature and does not constitute a financial promotion, investment advice or an inducement or incitement to participate in any product, offering or investment. FS Investments is not adopting, making a recommendation for or endorsing any investment strategy or particular security. All views, opinions and positions expressed herein are that of the author and do not necessarily reflect the views, opinions or positions of FS Investments. All opinions are subject to change without notice, and you should always obtain current information and perform due diligence before participating in any investment. FS Investments does not provide legal or tax advice and the information herein should not be considered legal or tax advice. Tax laws and regulations are complex and subject to change, which can materially impact any investment result. FS Investments cannot guarantee that the information herein is accurate, complete, or timely. FS Investments makes no warranties with regard to such information or results obtained by its use, and disclaims any liability arising out of your use of, or any tax position taken in reliance on, such information.
Any projections, forecasts and estimates contained herein are based upon certain assumptions that the author considers reasonable. Projections are necessarily speculative in nature, and it can be expected that some or all of the assumptions underlying the projections will not materialize or will vary significantly from actual results. The inclusion of projections herein should not be regarded as a representation or guarantee regarding the reliability, accuracy or completeness of the information contained herein, and neither FS Investments nor the author are under any obligation to update or keep current such information.
All investing is subject to risk, including the possible loss of the money you invest.
Read our analysis
Macro view »
Capital markets: Equity »
Capital markets: Debt »
Multifamily »
Office »
Industrial »
Retail »
Hotel »
Investment ResearchRobert Hoffman, CFA Managing Director
Lara Rhame Chief U.S. Economist Managing Director
Andrew Korz Director
Kara O’Halloran, CFA Director
Contact [email protected]
Andrew KorzDirector, Investment Research
Andrew is a Director on the Investment Research team at FS Investments, where he leads research efforts on the energy sector and the U.S. commercial real estate market. He also assists in the development of the firm’s long-term views on the economy and the impacts on the investing environment. Andrew holds a BBA in Finance and Economics from Villanova University and has prior experience with structuring and pricing interest rate derivatives.
Christopher BoleFinancial Writer, Fund Communications
Christopher is an Associate on the Fund Communications team at FS Investments, where he focuses on the U.S. commercial real estate market and the firm’s business development companies (BDCs). Previously, Christopher led the investment communications efforts at Delaware Investments, concentrating on the firm’s fixed income products. Christopher is an active member of his community, serving on the Board of the Spruce Hill Community Association in West Philadelphia.
Robert HoffmanManaging Director, Investment Research
As Managing Director of Investment Research, Robert leads the team that analyzes the fundamentals behind market movements, macroeconomic trends and the performance of specific industries — as well as their potential impact on investors. His over two-decade tenure in the financial services industry includes experience as a loan portfolio manager and senior credit analyst focused on corporate loan issues. Robert serves as the firm’s primary subject matter expert on the corporate credit markets and select alternative investment solutions, developing targeted communications and educational resources.
Commercial real estate
1
CRE outlook Q3 2021
FS Investments
With the summer upon us, activity in the U.S. economy has begun to heat up, and so too have debates around the long-term impacts of the COVID-19 pandemic on the commercial real estate (CRE) market. Sentiment continues to strengthen alongside fundamentals, and we expect to see capital markets activity follow suit in the second half of the year. Sectors that suffered the most acute pandemic impact, including retail and hotels, are seeing the most rapid improvement in outlook. As the warmer weather coincides with a sunnier outlook for CRE, there remain significant uncertainties around the impact of the pandemic on different geographies and sectors that will both challenge investors and offer opportunities.
Economic activity accelerated during Q2 as expanding vaccination and declining COVID cases allowed people to reengage with the economy in ways that they were unable to over the previous 16 months. Sporting events are back to near full capacity, concerts have returned, and the number of daily U.S. air travelers surpassed 2 million for the first time since March 2020.1 This rapid acceleration is apparent in economic data, where retail sales continue to hit record highs and the ISM Manufacturing PMI is hovering above 60, an extraordinarily strong number. The positive sentiment surrounding both consumers and businesses is likely to lead to impressive GDP growth numbers over the next few quarters: Economists project annualized growth of 10% in Q2 and overall growth of 6.6% and 4.1%, respectively, in 2021 and 2022.2
While this strength is undoubtedly positive, the economy was not built to grow this quickly. As such, the rebound has been uneven in certain segments of the economy, most notably the labor market. Nonfarm payrolls have rebounded but remain 5% below pre-COVID levels, and many businesses have complained about a shortage of available workers.3 There are myriad reasons for this, and while we do expect the labor market to continue to heal in the coming quarters, labor costs will be an important data point to watch. Additionally, we have seen supply-side shortages lead to spikes in input prices; lumber and steel prices have risen 90% and 81%, respectively, since mid-2020, leading to concerns around inflation.2
1 Transportation Security Administration, as of June 22, 2021. 2 Bloomberg Finance, L.P., as of June 22, 2021. 3 Bureau of Labor Statistics, as of May 31, 2021.
Key takeaways • Growth in the U.S. economy has been both incredibly strong and uneven. • Property prices continue to rise, though growth in deal activity has been more gradual. • With current fundamentals and market sentiment on the rise, investors are attempting to
separate the durable pandemic trends from the ephemeral ones.
Commercial real estate
2
CRE outlook Q3 2021
FS Investments
Inflation has been the macroeconomic topic du jour, with the recent 5% y/y growth in the May CPI fueling concerns around rising prices.2 Certainly, the unprecedented policy actions of the past year make it difficult to shrug off inflation worries as completely baseless. However, much of the recent uptick in the CPI can be attributed to base effects and smaller, idiosyncratic supply issues. Traditionally, commercial real estate has been looked at as an attractive hedge against inflation. From a demand standpoint, property owners have historically been able to raise rents to offset higher inflation—CRE rents have shown a 0.34 correlation to 1-year lagged changes in CPI.3 From a supply standpoint, higher input costs can lead to less new construction, raising the value of existing buildings.
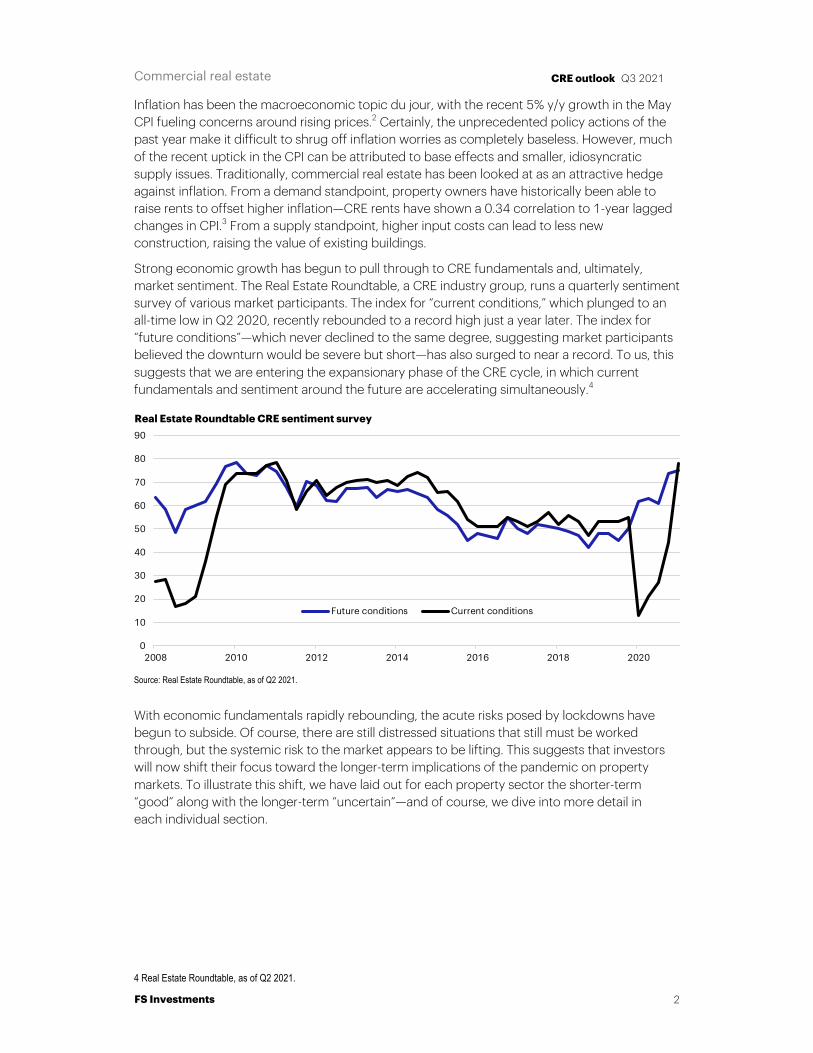
Strong economic growth has begun to pull through to CRE fundamentals and, ultimately, market sentiment. The Real Estate Roundtable, a CRE industry group, runs a quarterly sentiment survey of various market participants. The index for “current conditions,” which plunged to an all-time low in Q2 2020, recently rebounded to a record high just a year later. The index for “future conditions”—which never declined to the same degree, suggesting market participants believed the downturn would be severe but short—has also surged to near a record. To us, this suggests that we are entering the expansionary phase of the CRE cycle, in which current fundamentals and sentiment around the future are accelerating simultaneously.4
With economic fundamentals rapidly rebounding, the acute risks posed by lockdowns have begun to subside. Of course, there are still distressed situations that still must be worked through, but the systemic risk to the market appears to be lifting. This suggests that investors will now shift their focus toward the longer-term implications of the pandemic on property markets. To illustrate this shift, we have laid out for each property sector the shorter-term “good” along with the longer-term “uncertain”—and of course, we dive into more detail in each individual section.
4 Real Estate Roundtable, as of Q2 2021.
0
10
20
30
40
50
60
70
80
90
2008 2010 2012 2014 2016 2018 2020
Source: Real Estate Roundtable, as of Q2 2021.
Real Estate Roundtable CRE sentiment survey
Future conditions Current conditions
Commercial real estate
3
CRE outlook Q3 2021
FS Investments
Capital markets activity is beginning to pick up, although the rebound in transaction volume is trailing the recovery in fundamentals. Year-to-date transaction volume of $170 billion is an improvement over 2020 but remains 16% below the 2019 pace. Part of the reason for this is a lack of entity-level deals, as these company-level M&A transactions, which in a normal year comprise around a tenth of dollar volume, have been totally absent in 2021. Property values have risen 8.9% y/y through May and, absent a small blip in spring 2020, have not deviated from their upward path since the pandemic began.5
5 Real Capital Analytics, as of May 31, 2021.
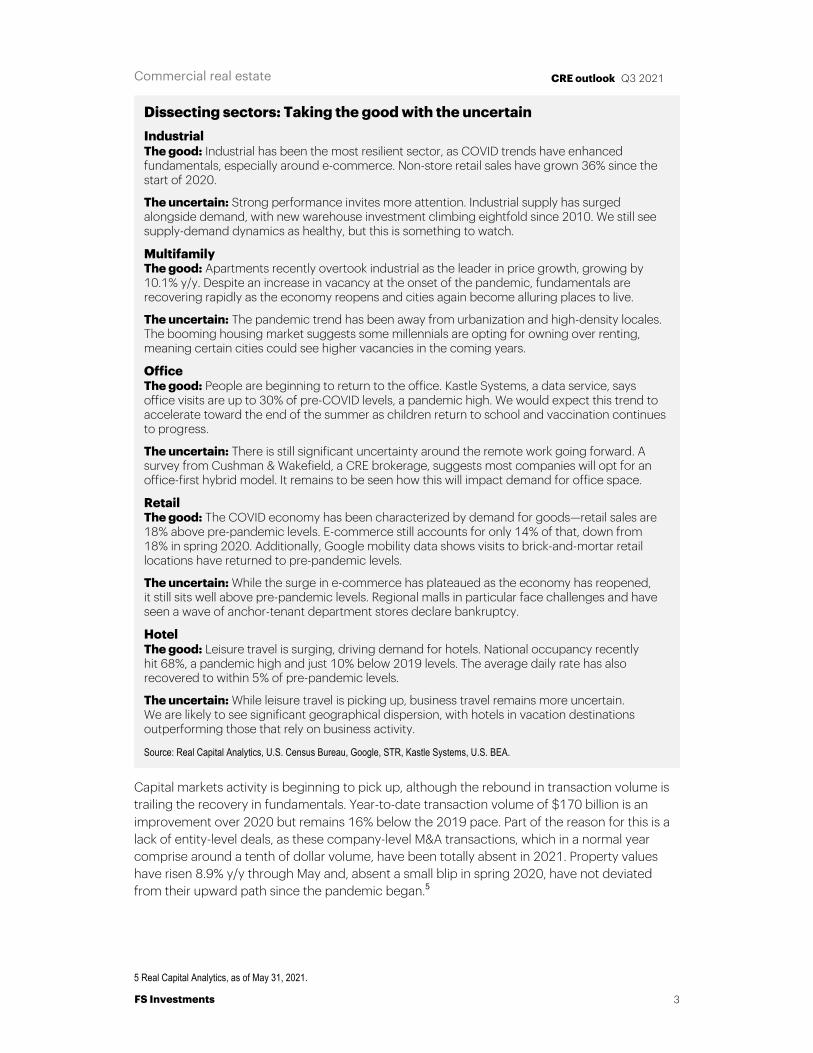
Dissecting sectors: Taking the good with the uncertain Industrial The good: Industrial has been the most resilient sector, as COVID trends have enhanced fundamentals, especially around e-commerce. Non-store retail sales have grown 36% since the start of 2020.
The uncertain: Strong performance invites more attention. Industrial supply has surged alongside demand, with new warehouse investment climbing eightfold since 2010. We still see supply-demand dynamics as healthy, but this is something to watch.
Multifamily The good: Apartments recently overtook industrial as the leader in price growth, growing by 10.1% y/y. Despite an increase in vacancy at the onset of the pandemic, fundamentals are recovering rapidly as the economy reopens and cities again become alluring places to live.
The uncertain: The pandemic trend has been away from urbanization and high-density locales. The booming housing market suggests some millennials are opting for owning over renting, meaning certain cities could see higher vacancies in the coming years.
Office The good: People are beginning to return to the office. Kastle Systems, a data service, says office visits are up to 30% of pre-COVID levels, a pandemic high. We would expect this trend to accelerate toward the end of the summer as children return to school and vaccination continues to progress.
The uncertain: There is still significant uncertainty around the remote work going forward. A survey from Cushman & Wakefield, a CRE brokerage, suggests most companies will opt for an office-first hybrid model. It remains to be seen how this will impact demand for office space.
Retail The good: The COVID economy has been characterized by demand for goods—retail sales are 18% above pre-pandemic levels. E-commerce still accounts for only 14% of that, down from 18% in spring 2020. Additionally, Google mobility data shows visits to brick-and-mortar retail locations have returned to pre-pandemic levels.
The uncertain: While the surge in e-commerce has plateaued as the economy has reopened, it still sits well above pre-pandemic levels. Regional malls in particular face challenges and have seen a wave of anchor-tenant department stores declare bankruptcy.
Hotel The good: Leisure travel is surging, driving demand for hotels. National occupancy recently hit 68%, a pandemic high and just 10% below 2019 levels. The average daily rate has also recovered to within 5% of pre-pandemic levels.
The uncertain: While leisure travel is picking up, business travel remains more uncertain. We are likely to see significant geographical dispersion, with hotels in vacation destinations outperforming those that rely on business activity.
Source: Real Capital Analytics, U.S. Census Bureau, Google, STR, Kastle Systems, U.S. BEA.
Commercial real estate
4
CRE outlook Q3 2021
FS Investments
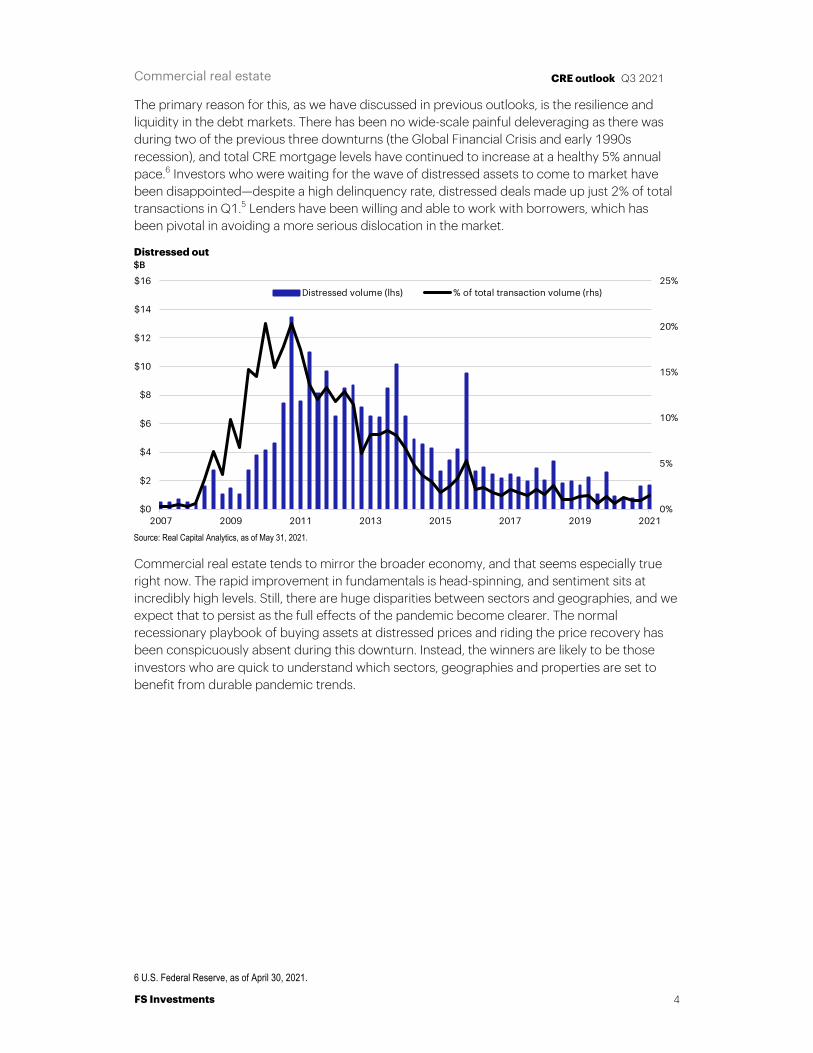
The primary reason for this, as we have discussed in previous outlooks, is the resilience and liquidity in the debt markets. There has been no wide-scale painful deleveraging as there was during two of the previous three downturns (the Global Financial Crisis and early 1990s recession), and total CRE mortgage levels have continued to increase at a healthy 5% annual pace.6 Investors who were waiting for the wave of distressed assets to come to market have been disappointed—despite a high delinquency rate, distressed deals made up just 2% of total transactions in Q1.5 Lenders have been willing and able to work with borrowers, which has been pivotal in avoiding a more serious dislocation in the market.
Commercial real estate tends to mirror the broader economy, and that seems especially true right now. The rapid improvement in fundamentals is head-spinning, and sentiment sits at incredibly high levels. Still, there are huge disparities between sectors and geographies, and we expect that to persist as the full effects of the pandemic become clearer. The normal recessionary playbook of buying assets at distressed prices and riding the price recovery has been conspicuously absent during this downturn. Instead, the winners are likely to be those investors who are quick to understand which sectors, geographies and properties are set to benefit from durable pandemic trends.
6 U.S. Federal Reserve, as of April 30, 2021.
0%
5%
10%
15%
20%
25%
$0
$2
$4
$6
$8
$10
$12
$14
$16
2007 2009 2011 2013 2015 2017 2019 2021
$B
Source: Real Capital Analytics, as of May 31, 2021.
Distressed out
Distressed volume (lhs) % of total transaction volume (rhs)
Commercial real estate
5
CRE outlook Q3 2021
FS Investments
Macro view
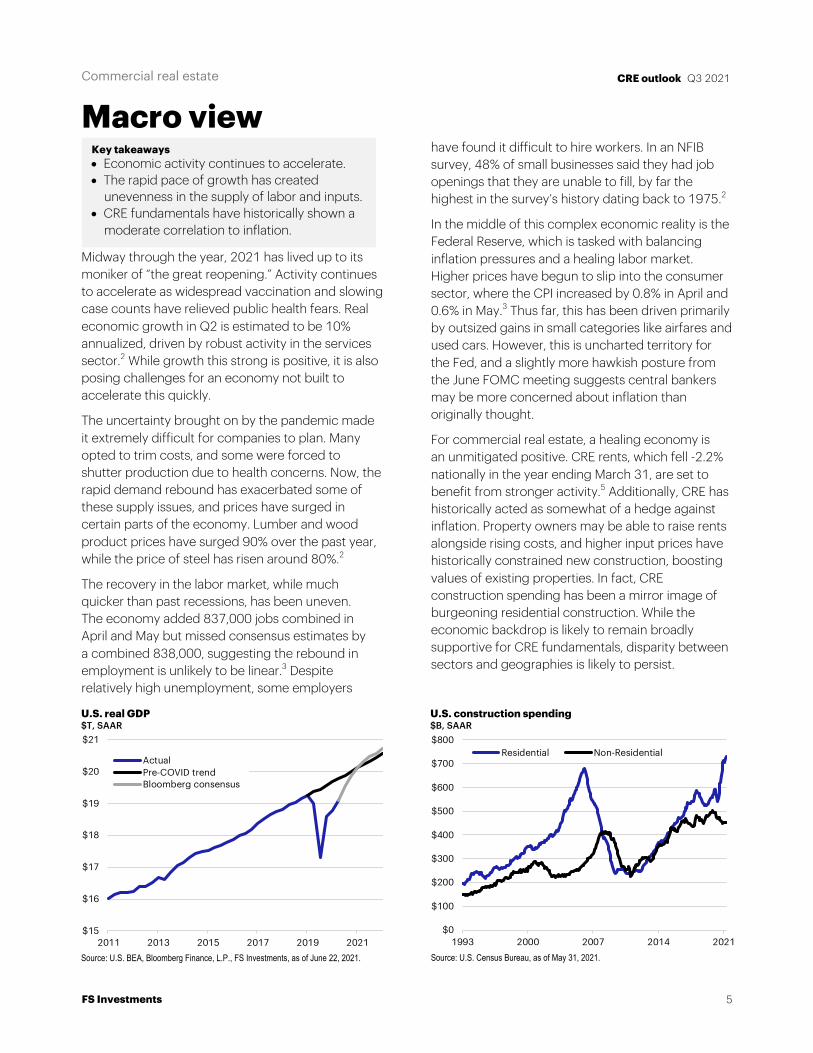
Midway through the year, 2021 has lived up to its moniker of “the great reopening.” Activity continues to accelerate as widespread vaccination and slowing case counts have relieved public health fears. Real economic growth in Q2 is estimated to be 10% annualized, driven by robust activity in the services sector.2 While growth this strong is positive, it is also posing challenges for an economy not built to accelerate this quickly.
The uncertainty brought on by the pandemic made it extremely difficult for companies to plan. Many opted to trim costs, and some were forced to shutter production due to health concerns. Now, the rapid demand rebound has exacerbated some of these supply issues, and prices have surged in certain parts of the economy. Lumber and wood product prices have surged 90% over the past year, while the price of steel has risen around 80%.2
The recovery in the labor market, while much quicker than past recessions, has been uneven. The economy added 837,000 jobs combined in April and May but missed consensus estimates by a combined 838,000, suggesting the rebound in employment is unlikely to be linear.3 Despite relatively high unemployment, some employers
have found it difficult to hire workers. In an NFIB survey, 48% of small businesses said they had job openings that they are unable to fill, by far the highest in the survey’s history dating back to 1975.2
In the middle of this complex economic reality is the Federal Reserve, which is tasked with balancing inflation pressures and a healing labor market. Higher prices have begun to slip into the consumer sector, where the CPI increased by 0.8% in April and 0.6% in May.3 Thus far, this has been driven primarily by outsized gains in small categories like airfares and used cars. However, this is uncharted territory for the Fed, and a slightly more hawkish posture from the June FOMC meeting suggests central bankers may be more concerned about inflation than originally thought.
For commercial real estate, a healing economy is an unmitigated positive. CRE rents, which fell -2.2% nationally in the year ending March 31, are set to benefit from stronger activity.5 Additionally, CRE has historically acted as somewhat of a hedge against inflation. Property owners may be able to raise rents alongside rising costs, and higher input prices have historically constrained new construction, boosting values of existing properties. In fact, CRE construction spending has been a mirror image of burgeoning residential construction. While the economic backdrop is likely to remain broadly supportive for CRE fundamentals, disparity between sectors and geographies is likely to persist.
Key takeaways • Economic activity continues to accelerate. • The rapid pace of growth has created
unevenness in the supply of labor and inputs. • CRE fundamentals have historically shown a
moderate correlation to inflation.
$15
$16
$17
$18
$19
$20
$21
2011 2013 2015 2017 2019 2021
U.S. real GDP$T, SAAR
ActualPre-COVID trendBloomberg consensus
Source: U.S. BEA, Bloomberg Finance, L.P., FS Investments, as of June 22, 2021.
$0
$100
$200
$300
$400
$500
$600
$700
$800
1993 2000 2007 2014 2021
U.S. construction spending$B, SAAR
Residential Non-Residential
Source: U.S. Census Bureau, as of May 31, 2021.
Commercial real estate
6
CRE outlook Q3 2021
FS Investments
Capital markets: Equity
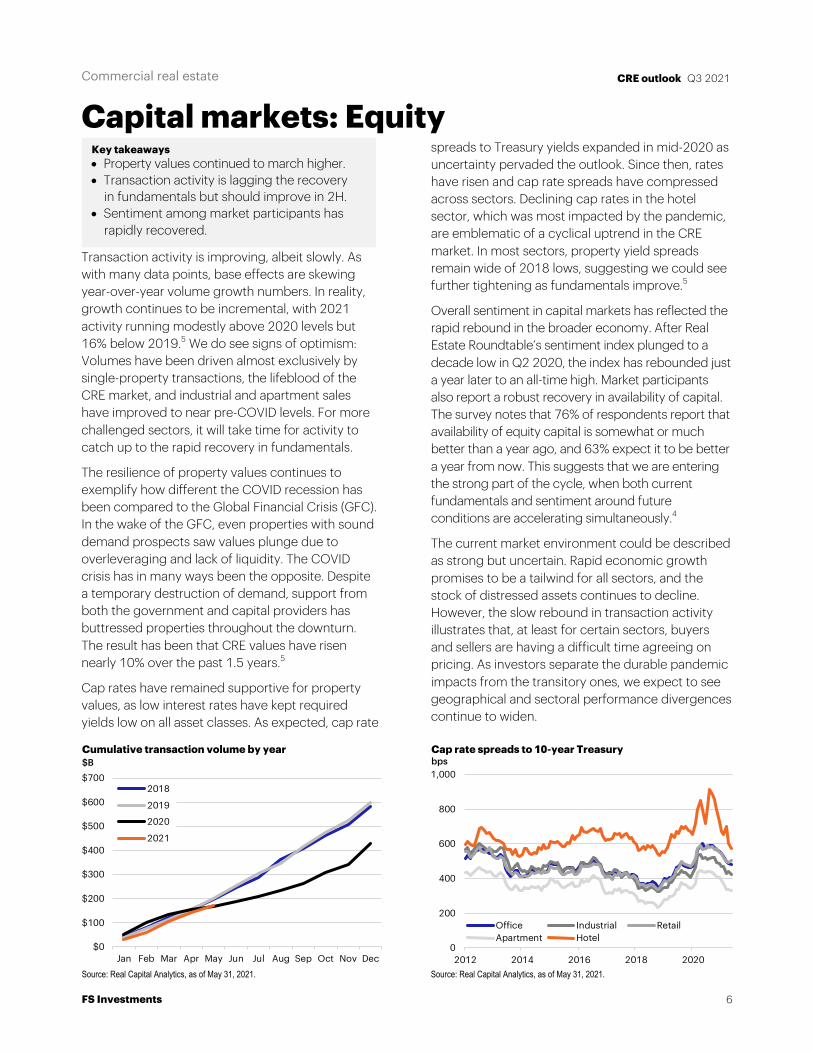
Transaction activity is improving, albeit slowly. As with many data points, base effects are skewing year-over-year volume growth numbers. In reality, growth continues to be incremental, with 2021 activity running modestly above 2020 levels but 16% below 2019.5 We do see signs of optimism: Volumes have been driven almost exclusively by single-property transactions, the lifeblood of the CRE market, and industrial and apartment sales have improved to near pre-COVID levels. For more challenged sectors, it will take time for activity to catch up to the rapid recovery in fundamentals.
The resilience of property values continues to exemplify how different the COVID recession has been compared to the Global Financial Crisis (GFC). In the wake of the GFC, even properties with sound demand prospects saw values plunge due to overleveraging and lack of liquidity. The COVID crisis has in many ways been the opposite. Despite a temporary destruction of demand, support from both the government and capital providers has buttressed properties throughout the downturn. The result has been that CRE values have risen nearly 10% over the past 1.5 years.5
Cap rates have remained supportive for property values, as low interest rates have kept required yields low on all asset classes. As expected, cap rate
spreads to Treasury yields expanded in mid-2020 as uncertainty pervaded the outlook. Since then, rates have risen and cap rate spreads have compressed across sectors. Declining cap rates in the hotel sector, which was most impacted by the pandemic, are emblematic of a cyclical uptrend in the CRE market. In most sectors, property yield spreads remain wide of 2018 lows, suggesting we could see further tightening as fundamentals improve.5
Overall sentiment in capital markets has reflected the rapid rebound in the broader economy. After Real Estate Roundtable’s sentiment index plunged to a decade low in Q2 2020, the index has rebounded just a year later to an all-time high. Market participants also report a robust recovery in availability of capital. The survey notes that 76% of respondents report that availability of equity capital is somewhat or much better than a year ago, and 63% expect it to be better a year from now. This suggests that we are entering the strong part of the cycle, when both current fundamentals and sentiment around future conditions are accelerating simultaneously.4
The current market environment could be described as strong but uncertain. Rapid economic growth promises to be a tailwind for all sectors, and the stock of distressed assets continues to decline. However, the slow rebound in transaction activity illustrates that, at least for certain sectors, buyers and sellers are having a difficult time agreeing on pricing. As investors separate the durable pandemic impacts from the transitory ones, we expect to see geographical and sectoral performance divergences continue to widen.
Key takeaways • Property values continued to march higher. • Transaction activity is lagging the recovery
in fundamentals but should improve in 2H. • Sentiment among market participants has
rapidly recovered.
$0
$100
$200
$300
$400
$500
$600
$700
Jan Feb Mar Apr May Jun Jul Aug Sep Oct Nov Dec
$BCumulative transaction volume by year
2018
2019
2020
2021
Source: Real Capital Analytics, as of May 31, 2021.
0
200
400
600
800
1,000
2012 2014 2016 2018 2020
Cap rate spreads to 10-year Treasurybps
Office Industrial RetailApartment Hotel
Source: Real Capital Analytics, as of May 31, 2021.
Commercial real estate
7
CRE outlook Q3 2021
FS Investments
Capital markets: Debt
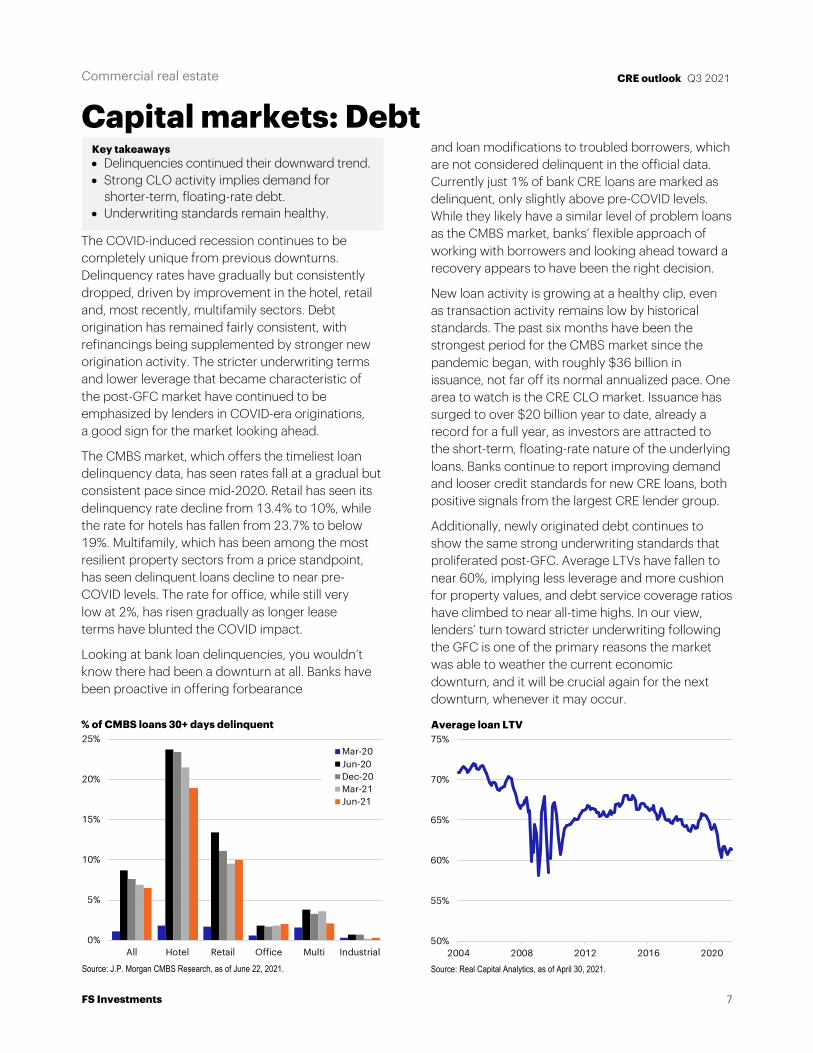
The COVID-induced recession continues to be completely unique from previous downturns. Delinquency rates have gradually but consistently dropped, driven by improvement in the hotel, retail and, most recently, multifamily sectors. Debt origination has remained fairly consistent, with refinancings being supplemented by stronger new origination activity. The stricter underwriting terms and lower leverage that became characteristic of the post-GFC market have continued to be emphasized by lenders in COVID-era originations, a good sign for the market looking ahead.
The CMBS market, which offers the timeliest loan delinquency data, has seen rates fall at a gradual but consistent pace since mid-2020. Retail has seen its delinquency rate decline from 13.4% to 10%, while the rate for hotels has fallen from 23.7% to below 19%. Multifamily, which has been among the most resilient property sectors from a price standpoint, has seen delinquent loans decline to near pre-COVID levels. The rate for office, while still very low at 2%, has risen gradually as longer lease terms have blunted the COVID impact.
Looking at bank loan delinquencies, you wouldn’t know there had been a downturn at all. Banks have been proactive in offering forbearance
and loan modifications to troubled borrowers, which are not considered delinquent in the official data. Currently just 1% of bank CRE loans are marked as delinquent, only slightly above pre-COVID levels. While they likely have a similar level of problem loans as the CMBS market, banks’ flexible approach of working with borrowers and looking ahead toward a recovery appears to have been the right decision.
New loan activity is growing at a healthy clip, even as transaction activity remains low by historical standards. The past six months have been the strongest period for the CMBS market since the pandemic began, with roughly $36 billion in issuance, not far off its normal annualized pace. One area to watch is the CRE CLO market. Issuance has surged to over $20 billion year to date, already a record for a full year, as investors are attracted to the short-term, floating-rate nature of the underlying loans. Banks continue to report improving demand and looser credit standards for new CRE loans, both positive signals from the largest CRE lender group.
Additionally, newly originated debt continues to show the same strong underwriting standards that proliferated post-GFC. Average LTVs have fallen to near 60%, implying less leverage and more cushion for property values, and debt service coverage ratios have climbed to near all-time highs. In our view, lenders’ turn toward stricter underwriting following the GFC is one of the primary reasons the market was able to weather the current economic downturn, and it will be crucial again for the next downturn, whenever it may occur.
Key takeaways • Delinquencies continued their downward trend. • Strong CLO activity implies demand for
shorter-term, floating-rate debt. • Underwriting standards remain healthy.
0%
5%
10%
15%
20%
25%
All Hotel Retail Office Multi Industrial
% of CMBS loans 30+ days delinquent
Mar-20Jun-20Dec-20Mar-21Jun-21
Source: J.P. Morgan CMBS Research, as of June 22, 2021.
50%
55%
60%
65%
70%
75%
2004 2008 2012 2016 2020
Average loan LTV
Source: Real Capital Analytics, as of April 30, 2021.
Commercial real estate
8
CRE outlook Q3 2021
FS Investments
Multifamily
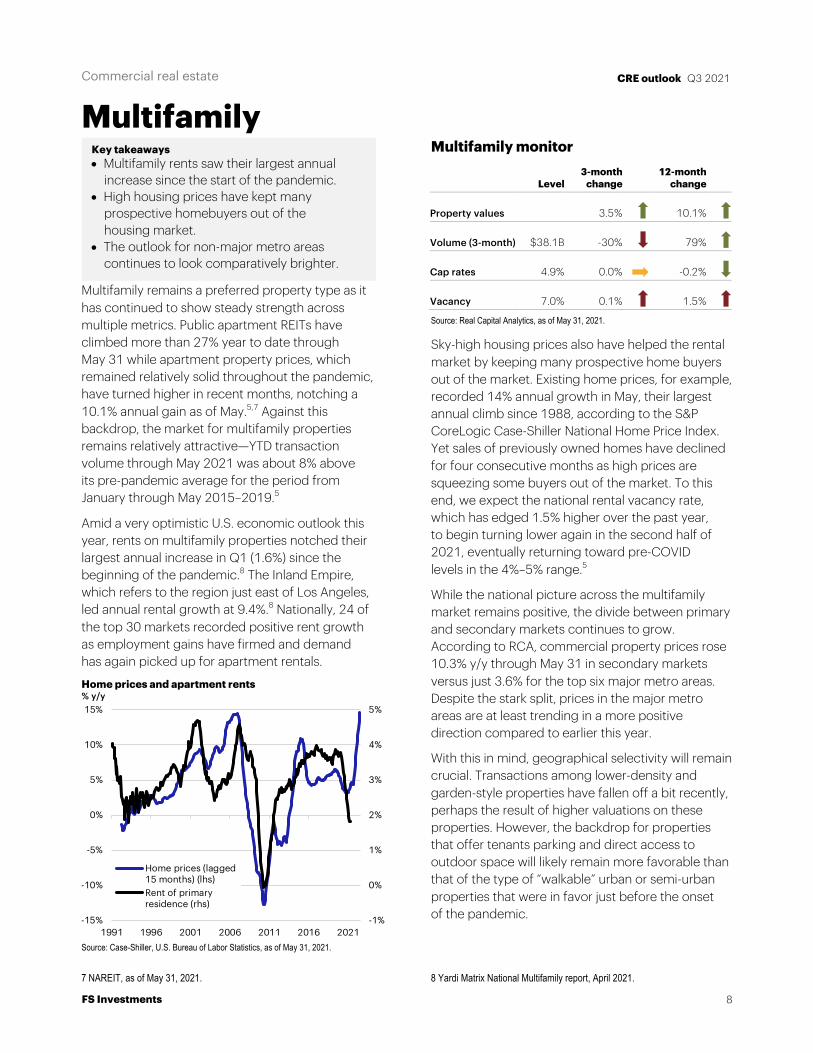
Multifamily remains a preferred property type as it has continued to show steady strength across multiple metrics. Public apartment REITs have climbed more than 27% year to date through May 31 while apartment property prices, which remained relatively solid throughout the pandemic, have turned higher in recent months, notching a 10.1% annual gain as of May.5,7 Against this backdrop, the market for multifamily properties remains relatively attractive—YTD transaction volume through May 2021 was about 8% above its pre-pandemic average for the period from January through May 2015–2019.5
Amid a very optimistic U.S. economic outlook this year, rents on multifamily properties notched their largest annual increase in Q1 (1.6%) since the beginning of the pandemic.8 The Inland Empire, which refers to the region just east of Los Angeles, led annual rental growth at 9.4%.8 Nationally, 24 of the top 30 markets recorded positive rent growth as employment gains have firmed and demand has again picked up for apartment rentals.
7 NAREIT, as of May 31, 2021.
Multifamily monitor
Source: Real Capital Analytics, as of May 31, 2021.
Sky-high housing prices also have helped the rental market by keeping many prospective home buyers out of the market. Existing home prices, for example, recorded 14% annual growth in May, their largest annual climb since 1988, according to the S&P CoreLogic Case-Shiller National Home Price Index. Yet sales of previously owned homes have declined for four consecutive months as high prices are squeezing some buyers out of the market. To this end, we expect the national rental vacancy rate, which has edged 1.5% higher over the past year, to begin turning lower again in the second half of 2021, eventually returning toward pre-COVID levels in the 4%–5% range.5
While the national picture across the multifamily market remains positive, the divide between primary and secondary markets continues to grow. According to RCA, commercial property prices rose 10.3% y/y through May 31 in secondary markets versus just 3.6% for the top six major metro areas. Despite the stark split, prices in the major metro areas are at least trending in a more positive direction compared to earlier this year.
With this in mind, geographical selectivity will remain crucial. Transactions among lower-density and garden-style properties have fallen off a bit recently, perhaps the result of higher valuations on these properties. However, the backdrop for properties that offer tenants parking and direct access to outdoor space will likely remain more favorable than that of the type of “walkable” urban or semi-urban properties that were in favor just before the onset of the pandemic.
8 Yardi Matrix National Multifamily report, April 2021.
Level 3-month
change 12-month
change
Property values 3.5% 10.1%
Volume (3-month) $38.1B -30% 79%
Cap rates 4.9% 0.0% -0.2%
Vacancy 7.0% 0.1% 1.5%
Key takeaways • Multifamily rents saw their largest annual
increase since the start of the pandemic. • High housing prices have kept many
prospective homebuyers out of the housing market.
• The outlook for non-major metro areas continues to look comparatively brighter.
-1%
0%
1%
2%
3%
4%
5%
-15%
-10%
-5%
0%
5%
10%
15%
1991 1996 2001 2006 2011 2016 2021
Home prices and apartment rents% y/y
Home prices (lagged15 months) (lhs)Rent of primaryresidence (rhs)
Source: Case-Shiller, U.S. Bureau of Labor Statistics, as of May 31, 2021.
Commercial real estate
9
CRE outlook Q3 2021
FS Investments
Office
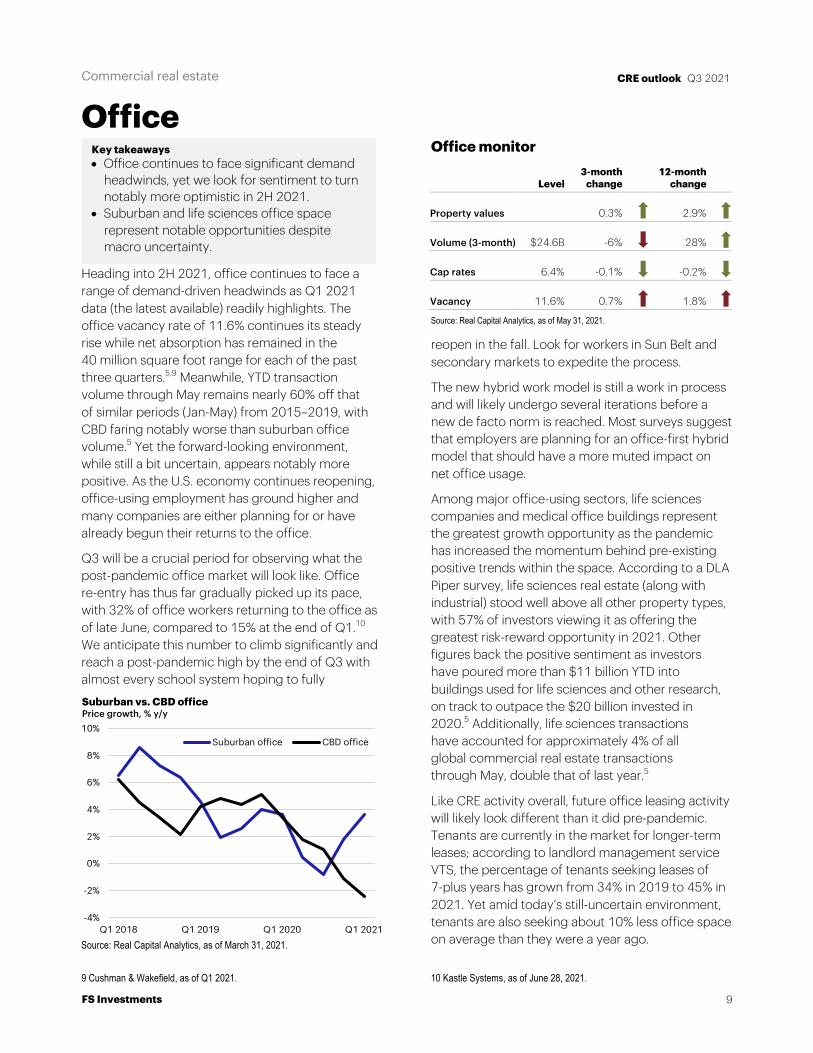
Heading into 2H 2021, office continues to face a range of demand-driven headwinds as Q1 2021 data (the latest available) readily highlights. The office vacancy rate of 11.6% continues its steady rise while net absorption has remained in the 40 million square foot range for each of the past three quarters.5,9 Meanwhile, YTD transaction volume through May remains nearly 60% off that of similar periods (Jan-May) from 2015–2019, with CBD faring notably worse than suburban office volume.5 Yet the forward-looking environment, while still a bit uncertain, appears notably more positive. As the U.S. economy continues reopening, office-using employment has ground higher and many companies are either planning for or have already begun their returns to the office.
Q3 will be a crucial period for observing what the post-pandemic office market will look like. Office re-entry has thus far gradually picked up its pace, with 32% of office workers returning to the office as of late June, compared to 15% at the end of Q1.10 We anticipate this number to climb significantly and reach a post-pandemic high by the end of Q3 with almost every school system hoping to fully
9 Cushman & Wakefield, as of Q1 2021.
Office monitor
Source: Real Capital Analytics, as of May 31, 2021.
reopen in the fall. Look for workers in Sun Belt and secondary markets to expedite the process.
The new hybrid work model is still a work in process and will likely undergo several iterations before a new de facto norm is reached. Most surveys suggest that employers are planning for an office-first hybrid model that should have a more muted impact on net office usage.
Among major office-using sectors, life sciences companies and medical office buildings represent the greatest growth opportunity as the pandemic has increased the momentum behind pre-existing positive trends within the space. According to a DLA Piper survey, life sciences real estate (along with industrial) stood well above all other property types, with 57% of investors viewing it as offering the greatest risk-reward opportunity in 2021. Other figures back the positive sentiment as investors have poured more than $11 billion YTD into buildings used for life sciences and other research, on track to outpace the $20 billion invested in 2020.5 Additionally, life sciences transactions have accounted for approximately 4% of all global commercial real estate transactions through May, double that of last year.5
Like CRE activity overall, future office leasing activity will likely look different than it did pre-pandemic. Tenants are currently in the market for longer-term leases; according to landlord management service VTS, the percentage of tenants seeking leases of 7-plus years has grown from 34% in 2019 to 45% in 2021. Yet amid today’s still-uncertain environment, tenants are also seeking about 10% less office space on average than they were a year ago.
10 Kastle Systems, as of June 28, 2021.
Level 3-month
change 12-month
change
Property values 0.3% 2.9%
Volume (3-month) $24.6B -6% 28%
Cap rates 6.4% -0.1% -0.2%
Vacancy 11.6% 0.7% 1.8%
Key takeaways • Office continues to face significant demand
headwinds, yet we look for sentiment to turn notably more optimistic in 2H 2021.
• Suburban and life sciences office space represent notable opportunities despite macro uncertainty.
-4%
-2%
0%
2%
4%
6%
8%
10%
Q1 2018 Q1 2019 Q1 2020 Q1 2021
Suburban vs. CBD officePrice growth, % y/y
Suburban office CBD office
Source: Real Capital Analytics, as of March 31, 2021.
Commercial real estate
10
CRE outlook Q3 2021
FS Investments
Industrial
Industrial enters the third quarter in among the best shape of any of the major property types. Annual property prices grew at a 9.5% clip as of May 2021, besting all other property types except multifamily.5 The drivers behind industrial’s growth—a pandemic-driven spike in e-commerce sales along with significant growth in third-party logistics providers—are well known by this point. Perhaps more importantly, industrial’s forward-looking demand drivers remain firm even as the outlook for brick-and-mortar retail brightens.
New leasing activity has exceeded 100 million square feet in each quarter since Q1 2016, and in Q1 2021 was just shy of its all-time record of 194.2 million square feet (reached in Q4 2020).9 Industrial absorption has also remained strong, as Q1 saw the most space absorbed in the first quarter of any year.9
Industrial monitor
Source: Real Capital Analytics, as of May 31, 2021.
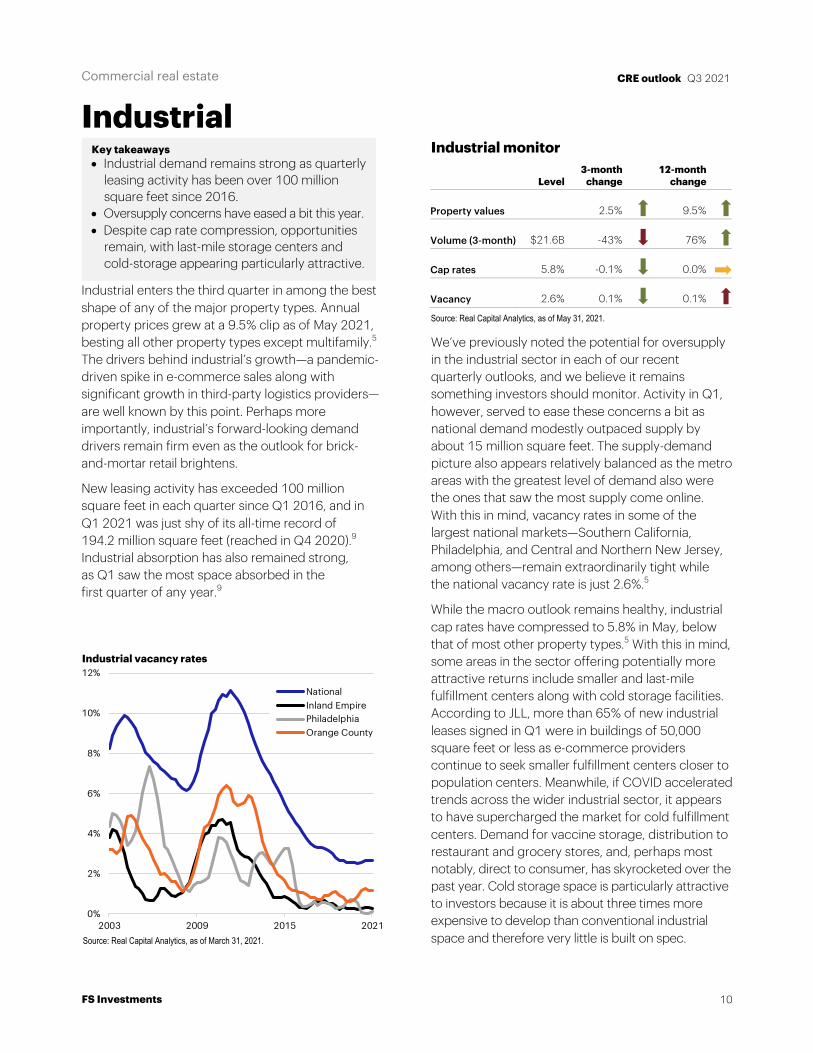
We’ve previously noted the potential for oversupply in the industrial sector in each of our recent quarterly outlooks, and we believe it remains something investors should monitor. Activity in Q1, however, served to ease these concerns a bit as national demand modestly outpaced supply by about 15 million square feet. The supply-demand picture also appears relatively balanced as the metro areas with the greatest level of demand also were the ones that saw the most supply come online. With this in mind, vacancy rates in some of the largest national markets—Southern California, Philadelphia, and Central and Northern New Jersey, among others—remain extraordinarily tight while the national vacancy rate is just 2.6%.5
While the macro outlook remains healthy, industrial cap rates have compressed to 5.8% in May, below that of most other property types.5 With this in mind, some areas in the sector offering potentially more attractive returns include smaller and last-mile fulfillment centers along with cold storage facilities. According to JLL, more than 65% of new industrial leases signed in Q1 were in buildings of 50,000 square feet or less as e-commerce providers continue to seek smaller fulfillment centers closer to population centers. Meanwhile, if COVID accelerated trends across the wider industrial sector, it appears to have supercharged the market for cold fulfillment centers. Demand for vaccine storage, distribution to restaurant and grocery stores, and, perhaps most notably, direct to consumer, has skyrocketed over the past year. Cold storage space is particularly attractive to investors because it is about three times more expensive to develop than conventional industrial space and therefore very little is built on spec.
Level 3-month
change 12-month
change
Property values 2.5% 9.5%
Volume (3-month) $21.6B -43% 76%
Cap rates 5.8% -0.1% 0.0%
Vacancy 2.6% 0.1% 0.1%
Key takeaways • Industrial demand remains strong as quarterly
leasing activity has been over 100 million square feet since 2016.
• Oversupply concerns have eased a bit this year. • Despite cap rate compression, opportunities
remain, with last-mile storage centers and cold-storage appearing particularly attractive.
0%
2%
4%
6%
8%
10%
12%
2003 2009 2015 2021
Industrial vacancy rates
NationalInland EmpirePhiladelphiaOrange County
Source: Real Capital Analytics, as of March 31, 2021.
Commercial real estate
11
CRE outlook Q3 2021
FS Investments
Retail
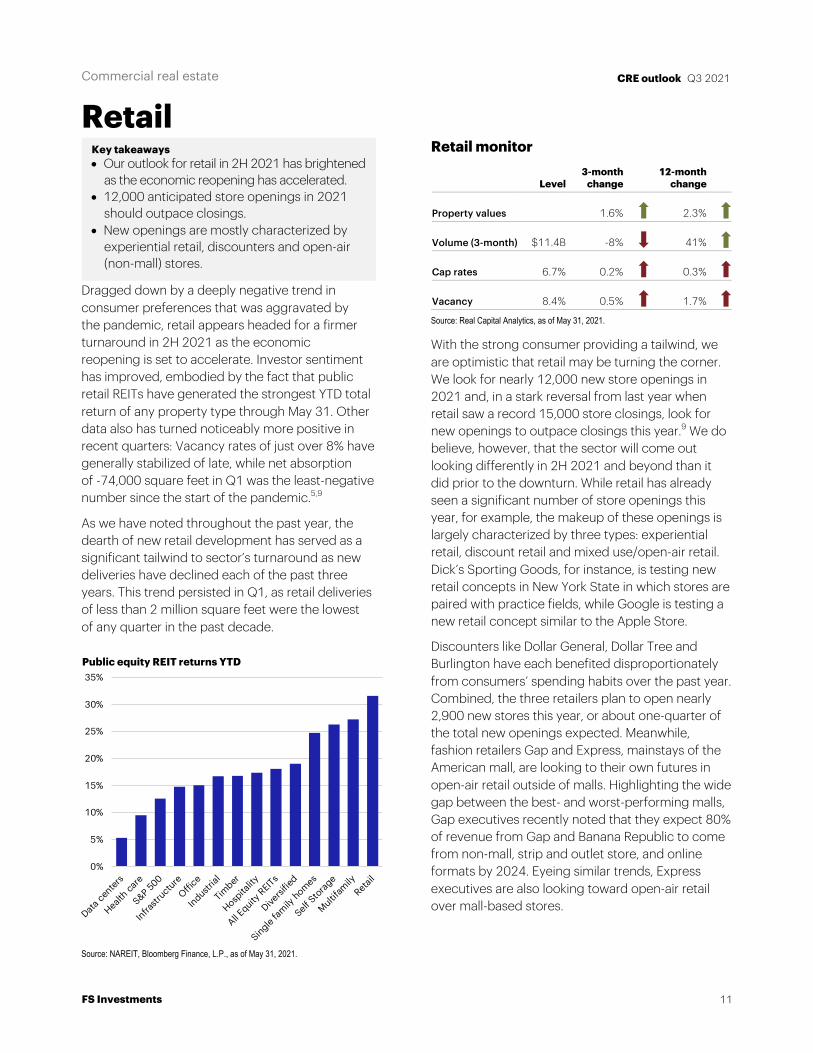
Dragged down by a deeply negative trend in consumer preferences that was aggravated by the pandemic, retail appears headed for a firmer turnaround in 2H 2021 as the economic reopening is set to accelerate. Investor sentiment has improved, embodied by the fact that public retail REITs have generated the strongest YTD total return of any property type through May 31. Other data also has turned noticeably more positive in recent quarters: Vacancy rates of just over 8% have generally stabilized of late, while net absorption of -74,000 square feet in Q1 was the least-negative number since the start of the pandemic.5,9
As we have noted throughout the past year, the dearth of new retail development has served as a significant tailwind to sector’s turnaround as new deliveries have declined each of the past three years. This trend persisted in Q1, as retail deliveries of less than 2 million square feet were the lowest of any quarter in the past decade.
Retail monitor
Source: Real Capital Analytics, as of May 31, 2021.
With the strong consumer providing a tailwind, we are optimistic that retail may be turning the corner. We look for nearly 12,000 new store openings in 2021 and, in a stark reversal from last year when retail saw a record 15,000 store closings, look for new openings to outpace closings this year.9 We do believe, however, that the sector will come out looking differently in 2H 2021 and beyond than it did prior to the downturn. While retail has already seen a significant number of store openings this year, for example, the makeup of these openings is largely characterized by three types: experiential retail, discount retail and mixed use/open-air retail. Dick’s Sporting Goods, for instance, is testing new retail concepts in New York State in which stores are paired with practice fields, while Google is testing a new retail concept similar to the Apple Store.
Discounters like Dollar General, Dollar Tree and Burlington have each benefited disproportionately from consumers’ spending habits over the past year. Combined, the three retailers plan to open nearly 2,900 new stores this year, or about one-quarter of the total new openings expected. Meanwhile, fashion retailers Gap and Express, mainstays of the American mall, are looking to their own futures in open-air retail outside of malls. Highlighting the wide gap between the best- and worst-performing malls, Gap executives recently noted that they expect 80% of revenue from Gap and Banana Republic to come from non-mall, strip and outlet store, and online formats by 2024. Eyeing similar trends, Express executives are also looking toward open-air retail over mall-based stores.
Level 3-month
change 12-month
change
Property values 1.6% 2.3%
Volume (3-month) $11.4B -8% 41%
Cap rates 6.7% 0.2% 0.3%
Vacancy 8.4% 0.5% 1.7%
Key takeaways • Our outlook for retail in 2H 2021 has brightened
as the economic reopening has accelerated. • 12,000 anticipated store openings in 2021
should outpace closings. • New openings are mostly characterized by
experiential retail, discounters and open-air (non-mall) stores.
0%
5%
10%
15%
20%
25%
30%
35%
Data cen
ters
Health ca
re
S&P 500
Infrastr
uctureOffic
e
Industrial
Timber
Hospita
lity
All Equity
REITs
Diversi
fied
Single fam
ily homes
Self Sto
rage
Multifam
ilyRetai
l
Public equity REIT returns YTD
Source: NAREIT, Bloomberg Finance, L.P., as of May 31, 2021.
Commercial real estate
12
CRE outlook Q3 2021
FS Investments
Hotel
If retail was facing a secular decline in 2020 that the pandemic accelerated, the slump for hotels and, more broadly, travel and leisure, could be seen purely as a barometer on the nation’s progress, or lack thereof, in managing the COVID crisis. The hotel sector’s upturn as we enter the second half of 2021 paints a cautiously optimistic portrait of the outlook while still showing signs of remaining distress. YTD transaction volume turned 72% higher compared to the deeply negative figure from May 2020. However, it remains nearly 40% off that of pre-pandemic transaction volume for the period from January through May of 2015–2019.5 Similarly, new hotel transaction prices remained negative in May compared to a year earlier. But at just -0.1% y/y, hotel pricing has shown improvements versus the -2% average annual decline of the past two years.5
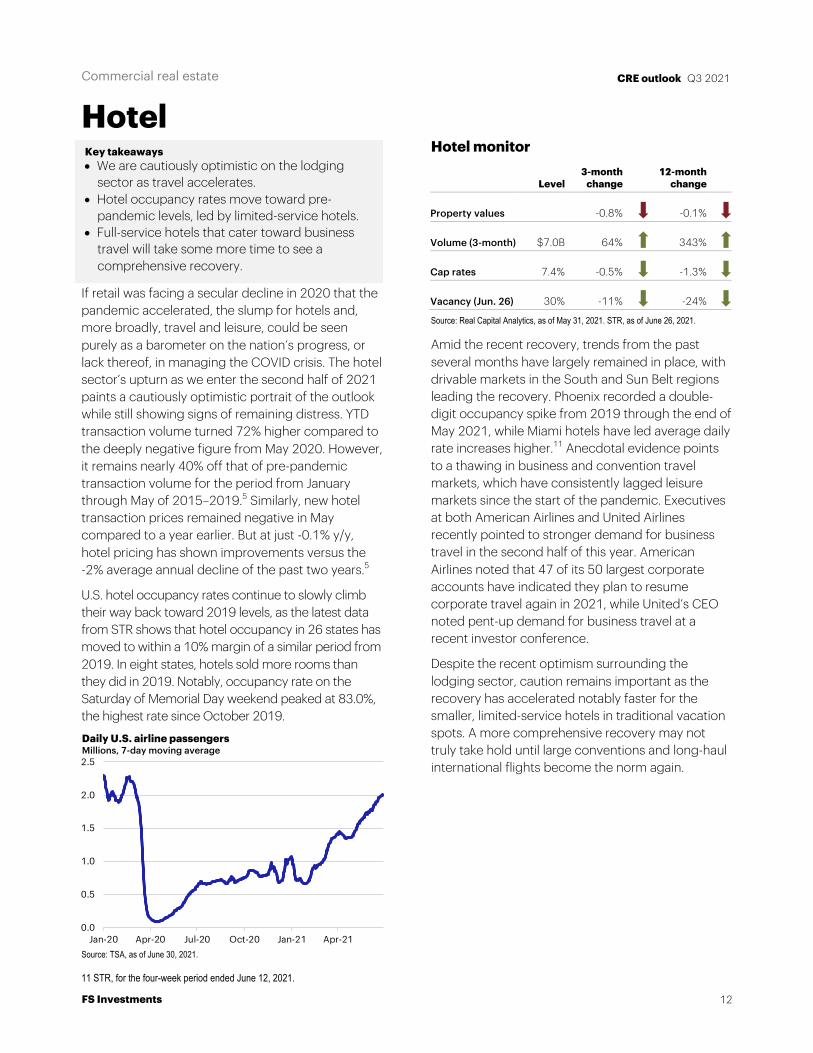
U.S. hotel occupancy rates continue to slowly climb their way back toward 2019 levels, as the latest data from STR shows that hotel occupancy in 26 states has moved to within a 10% margin of a similar period from 2019. In eight states, hotels sold more rooms than they did in 2019. Notably, occupancy rate on the Saturday of Memorial Day weekend peaked at 83.0%, the highest rate since October 2019.
11 STR, for the four-week period ended June 12, 2021.
Hotel monitor
Source: Real Capital Analytics, as of May 31, 2021. STR, as of June 26, 2021.
Amid the recent recovery, trends from the past several months have largely remained in place, with drivable markets in the South and Sun Belt regions leading the recovery. Phoenix recorded a double-digit occupancy spike from 2019 through the end of May 2021, while Miami hotels have led average daily rate increases higher.11 Anecdotal evidence points to a thawing in business and convention travel markets, which have consistently lagged leisure markets since the start of the pandemic. Executives at both American Airlines and United Airlines recently pointed to stronger demand for business travel in the second half of this year. American Airlines noted that 47 of its 50 largest corporate accounts have indicated they plan to resume corporate travel again in 2021, while United’s CEO noted pent-up demand for business travel at a recent investor conference.
Despite the recent optimism surrounding the lodging sector, caution remains important as the recovery has accelerated notably faster for the smaller, limited-service hotels in traditional vacation spots. A more comprehensive recovery may not truly take hold until large conventions and long-haul international flights become the norm again.
Level 3-month
change 12-month
change
Property values -0.8% -0.1%
Volume (3-month) $7.0B 64% 343%
Cap rates 7.4% -0.5% -1.3%
Vacancy (Jun. 26) 30% -11% -24%
Key takeaways • We are cautiously optimistic on the lodging
sector as travel accelerates. • Hotel occupancy rates move toward pre-
pandemic levels, led by limited-service hotels. • Full-service hotels that cater toward business
travel will take some more time to see a comprehensive recovery.
0.0
0.5
1.0
1.5
2.0
2.5
Jan-20 Apr-20 Jul-20 Oct-20 Jan-21 Apr-21
Daily U.S. airline passengersMillions, 7-day moving average
Source: TSA, as of June 30, 2021.