q3 2021 results and outlook
TRANSCRIPT
Q32021RESULTSANDOUTLOOKS t e v e O a k l a n d , C E O a n d P r e s i d e n t
B i l l K e l l e y , E V P a n d C F O
N o v e m b e r 8 , 2 0 2 1

FORWARDLOOKINGSTATEMENTS
From time to time, we and our representatives may provide information, whether orally or in writing, which are deemed to be “forward‐looking” within the meaning of the Private Securities Litigation Reform Act of 1995 (the “Litigation Reform Act”). These forward‐lookingstatements and other information are based on our beliefs as well as assumptions made by us using information currently available.The words “anticipate,” “believe,” “estimate,” “project,” “expect,” “intend,” “plan,” “should,” and similar expressions, as they relate to us, areintended to identify forward‐looking statements. Such statements reflect our current views with respect to future events and are subject tocertain risks, uncertainties, and assumptions. Should one or more of these risks or uncertainties materialize, or should underlying assumptionsprove incorrect, actual results may vary materially from those described herein as anticipated, believed, estimated, expected, or intended. Wedo not intend to update these forward‐looking statements following the date of this presentation.In accordance with the provisions of the Litigation Reform Act, we are making investors aware that such forward‐looking statements, becausethey relate to future events, are by their very nature subject to many important factors that could cause actual results to differ materially fromthose contemplated by the forward‐looking statements contained in this presentation and other public statements we make. Such factorsinclude, but are not limited to: risks related to the impact of the ongoing COVID‐19 outbreak on our business, suppliers, consumers, customersand employees; the success of our growth, reinvestment, and restructuring programs, our level of indebtedness and related obligations;disruptions in the financial markets; interest rates; changes in foreign currency exchange rates; customer concentration and consolidation; rawmaterial and commodity costs; competition; disruptions or inefficiencies in our supply chain and / or operations, including from the ongoingCOVID‐19 outbreak; our ability to continue to make acquisitions in accordance with our business strategy or effectively manage the growthfrom acquisitions; changes and developments affecting our industry, including consumer preferences; the outcome of litigation and regulatoryproceedings to which we may be a party; product recalls; changes in laws and regulations applicable to us; disruptions in or failures of ourinformation technology systems; costs associated with shareholder activism; labor strikes or work stoppages; and other risks that are set forthin the Risk Factors section, the Legal Proceedings section, the Management’s Discussion and Analysis of Financial Condition and Results ofOperations section, and other sections of our Annual Report on Form 10‐K for the year ended December 31, 2020, and from time to time inour filings with the Securities and Exchange Commission.
2

KEYTAKEAWAYS
We Remain Focused on Supporting Our Customers
Demand is Strengthening and We Are Outperforming the Market
Pricing to Offset Inflationary Pressures Has Been Collaborative With Our Customers
2
3
4
3
TreeHouse Board Has Approved a Plan to Explore Strategic Alternatives1
We are Fulfilling As Much Demand As We Can Despite a Significant Near‐Term Impact on Profitability6
Long‐Term Consumer Demand Trends and Fundamentals of Our Underlying Business Are Strong
5

13.1%
9.9%
Q3 2020 Q3 2021
Adjusted EBITDA Margin1 declined 320 basis points year‐over‐year in Q3 2021
$1,046 M
$1,101 M
Q3 2020 Q3 2021
Reported Net Sales growth driven by Pasta acquisition and pricing actions
TOPLINEGROWTHOFFSETBYACCELERATINGINFLATIONANDSUPPLYCHAINDISRUPTION
5.3%
4
(320) bps
Charts not drawn to scale.1 Adjusted EBITDA Margin and Adjusted Diluted EPS are non‐GAAP financial measures. See “Comparison of Adjusted Information to GAAP Information” in the Appendix for the definitions of the non‐GAAP measures, information concerning certain items affecting comparability, and reconciliation of the non‐GAAP measures to the most directly comparable GAAP measures.
$0.71
$0.46
Q3 2020 Q3 2021
Adjusted Diluted EPS1 declined year‐over‐year primarily due to inflation not yet offset by pricing actions
(35.2)%

Source: : U.S. Bureau of Labor Statistics, Job Openings, Unemployment: Nondurable Goods Manufacturing
INFLATIONARY&MACROENVIRONMENTCONTINUESTOBEEXTRAORDINARY
INCREASINGPRICESONKEYINGREDIENTS
LABORMARKETSARETIGHTASTHENUMBEROFJOBOPENINGSEXCEEDS
AVAILABLEWORKERSDry Van Contract Rate Index
5
Source: GCSI
Industry‐wide Supply Chain Disruption
Source: DAT.com; October 6, 2021
Nondurable Goods Manufacturing Job OpeningsNon Durable Goods Industry, Unemployment
Actual Short‐term DAT Forecast Blended Forecast Blended Forecast V2
Rolling
7‐Day Rate Pe
r Mile, ex. Fue
l
$2.00
$2.10
$2.20
$2.30
$2.40
$2.50
$2.60
$2.70
INCREASINGFREIGHTCOSTSASDEMANDOUTPACESSUPPLY

Federal stimulus Expired
Opt‐Out Periods Ranging From June 12th to July 15th
Stimulus #3Mar 2021
PRIVATELABELSALESGROWTHSTRENGTHENING
March April May
High Opt‐Out Regions14%
June July Aug
12%Low Opt‐Out Regions
Sept
Dollar Sales % Change vs 2 Years Ago, Edible PL
Chart not drawn to scale.Source: IRI Monthly POS data through 9/19/2021. High Opt‐Out includes Plains, South Central and Southeast regions; Low Opt‐Out includes California and Northeast regions. 6
7%
8%
9%
10%
11%
12%
13%
14%
15%
16%
17%
18%

UPDATED2021FULLYEARGUIDANCE
7
1 Adjusted Diluted EPS and Free Cash Flow from continuing operations are non‐GAAP financial measures. See “Comparison of Adjusted Information to GAAP Information” in the Appendix for the definitions of the non‐GAAP measures and information concerning certain items affecting comparability.
FY 2021 Guidance1
Reported Net Sales $ 4.20 ‐ $ 4.325 b(Mid‐to‐low end of August Guidance)
Adjusted Diluted EPS $ 1.08 ‐ $ 1.28
Free Cash Flow > $ 100 m
Updated guidance considers:
• Strengthening demand, pricing actions effective in the remainder of the year, and ability to service through supply chain disruption
• Incremental commodity, packaging, and freight inflation which will not be offset with pricing until 2022
• Tight labor availability and supply chain disruption

Q32021RESULTSSCORECARD
Q3 Guidancecommunicated in August Results Result
Reported Net Sales $ 1.05 ‐ $ 1.16 b $ 1.10 b ✓
Interest Expense $ 18 ‐ $ 20 m $ 18.8 m ✓Adjusted Effective Tax Rate1 21 % ‐ 23 % 25.9 % X
Adjusted Diluted EPS1 $ 0.45 ‐ $ 0.60 $ 0.46 ✓
8
1 Adjusted Effective Tax Rate and Adjusted Diluted EPS are non‐GAAP financial measures. See “Comparison of Adjusted Information to GAAP Information” in the Appendix for the definitions of the non‐GAAP measures, information concerning certain items affecting comparability, and reconciliation of the non‐GAAP measures to the most directly comparable GAAP measures.

NETSALESGROWTHDRIVENBYPASTAACQUISITIONANDPRICINGACTIONSTORECOVERINFLATION
Meal Preparation
Volume / Mix 1 (2.8) % 1.1 % (1.3) %
Pricing 4.6 0.5 3.0
Organic Net Sales2 Growth 1.8 % 1.6 % 1.7 %
Volume / Mix (Acquisition) 5.2 ‐ 3.2
Foreign Currency 0.4 0.4 0.4
Net Sales Growth 7.4 % 2.0 % 5.3 %
THSSnacking & Beverages
Change in Q3 Net Sales vs Prior Year
Net Sales by Division
1 Excludes volume / mix related to acquisition
• The Pasta acquisition more than offset the organic volume/mix decline in Meal Preparation
• Pricing impact primarily represents actions to recover soybean oil inflation incurred in H1
9
2 Organic Net Sales is a non‐GAAP financial measure. See “Comparison of Adjusted Information to GAAP Information” in the Appendix for the definition of the non‐GAAP measure, information concerning certain items affecting comparability, and reconciliation of the non‐GAAP measure to the most directly comparable GAAP measure.

RETAILUNMEASUREDCHANNELSCONTINUETOOUTPERFORMRETAILMEASUREDCHANNELS
Q3 20Net Sales
Co‐manufacturing / Other
Q3 21Net Sales
RetailUnmeasured
FAFH
$1,046M ($13)M
$15M$19M
$34M
10Chart not drawn to scale.
Retail Measured: (2)%Retail Unmeasured: 6%Total Retail: 1%
RetailMeasured
$1,101M

INCREMENTALINFLATIONOUTPACEDPRICINGREALIZATIONINQ3
PNOC2 Interest Q3 21 Adjusted
Diluted EPS1
Q3 20Adjusted
Diluted EPS1VOL / MIX
(incl. absorption)Operations SG&A
Chart not drawn to scale.1 Adjusted Diluted EPS is a non‐GAAP financial measure. See “Comparison of Adjusted Information to GAAP Information” in the Appendix for the definition of the non‐GAAP measure, information concerning certain items affecting comparability, and reconciliation of the non‐GAAP measure to the most directly comparable GAAP measure.2 Pricing to recover inflation, net of commodities, freight & warehousing.
11

$2,217 M
$1,910 M
Q3 2020 Q3 2021
($307)M
Total Debt
CONTINUEDIMPROVEMENTINBALANCESHEETANDLIQUIDITY
12
Over the last year, we’ve made significant progress to strengthen our Balance Sheet:
• Reduced total debt outstanding by $307M compared to Q3 2020
• Lowest debt level since 2015
• Q1 2021 successful refinancing• Extended maturities of debt tranches
• Reduced weighted average cost of debt by ~100 basis points resulting in ~$20M in lower interest costs per annum
• Continue to maintain liquidity of $797M between Revolver and Cash

13
REVISING2021FULLYEARGUIDANCE
FY 2021 Guidance1
Reported Net Sales $ 4.20 ‐ $ 4.325 b(Mid‐to‐low end of August Guidance)
Adjusted EBIT $ 155 ‐ $ 175 m
Adjusted EBITDA $ 380 ‐ $ 410 m
Interest Expense $ 80 ‐ $ 82 m
Adjusted Effective Tax Rate 24 % ‐ 26 %
Adjusted Diluted EPS $ 1.08 ‐ $ 1.28
Capital Expenditures ~ $125 m
Free Cash Flow > $100 m
1 Adjusted EBIT, Adjusted EBITDA, Adjusted Effective Tax Rate, Adjusted Diluted EPS, and Free Cash Flow from continuing operations are non‐GAAP financial measures. See “Comparison of Adjusted Information to GAAP Information” in the Appendix for the definitions of the non‐GAAP measures and information concerning certain items affecting comparability.

14
Q42021GUIDANCE
Q4 2021 E1
Reported Net Sales $ 1.04 ‐ $ 1.16 b
Interest Expense $ 18 ‐ $ 20 m
Adjusted Effective Tax Rate 23 % ‐ 25 %
Adjusted Diluted EPS $ 0.00 ‐ $ 0.20
1 Adjusted Effective Tax Rate and Adjusted Diluted EPS are non‐GAAP financial measures. See “Comparison of Adjusted Information to GAAP Information” in the Appendix for the definitions of the non‐GAAP measures and information concerning certain items affecting comparability.
• Demand is strengthening and pricing actions to recover prior inflation are expected to be reflected in Q4 results; ability to service demand may be impacted by labor and supply chain disruption.
• Inflation and incremental costs to serve the customer are expected to significantly compress margins year‐over‐year.
• We are managing our working capital with a focus on serving our customers, which includes building higher cost inventory.

2021MACROENVIRONMENTALFACTORSDISRUPTING“NORMALIZED”EBITOF~$300M
15
FY21 Original Adjusted EBIT Guidance Midpoint
Private Label Demand /
Consumption
Incremental Commodity &
Freight Inflation
Incremental Pricing Actions & Continuous Improvement
FY21 Revised Adjusted EBIT Guidance Midpoint
$165M
($40)M
($125)M
$50M
($75)M Pricing LagAddressing the Disruption
• Strengthening Demand
• Recover inflation over the cycle through pricing and continuous improvement initiatives. Pricing actions in market and confirmed by customers.
• Deploy holistic labor strategy, explore sourcing and transportation opportunities, and leverage lean manufacturing. Prioritizecustomers’ most important SKUs.
1 Includes $100 ‐ $110M commodity inflation, $80M of pricing, as well as impact of continuous improvement initiatives.
$305M1
$35M
Variable Incentive
Compensation Reversal
($60)M
Supply Chain
Disruption
1
1
2
2
3
3
Chart not drawn to scale.

APPENDIX

7 of our 10 largest categories outperformed the Private Label market in the Retail channel1
17
OURINVESTMENTINSERVICINGTHECUSTOMERHASENABLEDSOLIDPERFORMANCEINOURLARGESTCATEGORIES
1 Based on Private Label measured channel data sourced from IRI Syndicated POS Data. TreeHouse net sales data includes measured and unmeasured retail channel data for the three months ended September 30, 2021 compared to 2020.
Hot CerealRefrigerated Dough
Non‐Dairy Creamer Crackers
Pretzel
Broth
Pourable Dressing

18
ComparisonofAdjustedInformationtoGAAPInformationThe Company has included in this release measures of financial performance that are not defined by GAAP (“Non‐GAAP”). A Non‐GAAP financial measure is a numerical measure of financial performance that excludes or includes amounts so as to bedifferent than the most directly comparable measure calculated and presented in accordance with GAAP in the Company’s Condensed Consolidated Balance Sheets, Condensed Consolidated Statements of Operations, Condensed Consolidated Statementsof Comprehensive Income (Loss), and the Condensed Consolidated Statements of Cash Flows. The Company believes these measures provide useful information to the users of the financial statements as we also have included these measures in othercommunications and publications.
For each of these Non‐GAAP financial measures, the Company provides a reconciliation between the most directly comparable GAAP measure and the Non‐GAAP measure, an explanation of why management believes the Non‐GAAP measure providesuseful information to financial statement users, and any additional purposes for which management uses the Non‐GAAP measure. This Non‐GAAP financial information is provided as additional information for the financial statement users and is not inaccordance with, or an alternative to, GAAP. These Non‐GAAP measures may be different from similar measures used by other companies. Given the inherent uncertainty regarding adjusted items in any future period, a reconciliation of forward‐lookingfinancial measures to the most directly comparable GAAP measure is not feasible.
Organic Net SalesOrganic net sales is defined as net sales excluding the impacts of the net sales associated with the pasta acquisition from Riviana Foods, foreign currency, and the net sales associated with the divestiture of the In‐Store Bakery facilities, which closed on April17, 2020. This information is provided in order to allow investors to make meaningful comparisons of the Company's sales between periods and to view the Company's business from the same perspective as Company management.
Adjusted Earnings Per Diluted Share from Continuing Operations, Adjusting for Certain Items Affecting ComparabilityAdjusted earnings per diluted share from continuing operations ("adjusted diluted EPS") reflects adjustments to GAAP earnings (loss) per diluted share from continuing operations to identify items that, in management's judgment, significantly affect theassessment of earnings results between periods. This information is provided in order to allow investors to make meaningful comparisons of the Company's earnings performance between periods and to view the Company's business from the sameperspective as Company management. As the Company cannot predict the timing and amount of charges that include, but are not limited to, items such as acquisition, integration, divestiture, and related costs, mark‐to‐market adjustments on derivativecontracts, foreign currency exchange impact on the re‐measurement of intercompany notes, growth, reinvestment, and restructuring programs, the impact of the COVID‐19 pandemic, and other items that may arise from time to time that would impactcomparability, management does not consider these costs when evaluating the Company's performance, when making decisions regarding the allocation of resources, in determining incentive compensation, or in determining earnings estimates. Thereconciliation of the GAAP measure of diluted earnings (loss) per share from continuing operations as presented in the Condensed Consolidated Statements of Operations, excluding certain items affecting comparability, to adjusted diluted earnings pershare from continuing operations is presented below.
Adjusted Net Income from Continuing Operations, Adjusted EBIT from Continuing Operations, and Adjusted EBITDA from Continuing Operations, Adjusted net income margin from Continuing Operations, Adjusted EBIT margin from Continuing Operations andAdjusted EBITDA margin from Continuing Operations, Adjusting for Certain Items Affecting Comparability Adjusted net income from continuing operations represents GAAP net income (loss) from continuing operations as reported in the CondensedConsolidated Statements of Operations adjusted for items that, in management’s judgment, significantly affect the assessment of earnings results between periods as outlined in the adjusted diluted EPS section from continuing operations above. Thisinformation is provided in order to allow investors to make meaningful comparisons of the Company’s earnings performance between periods and to view the Company’s business from the same perspective as Company management. This measure is alsoused as a component of the Board of Director’s measurement of the Company’s performance for incentive compensation purposes and is the basis of calculating the adjusted diluted EPS from continuing operations metric outlined above. Adjusted EBITfrom continuing operations represents adjusted net income from continuing operations before interest expense, interest income, and income tax expense. Adjusted EBITDA from continuing operations represents adjusted EBIT from continuing operationsbefore depreciation and amortization and non‐cash stock‐based compensation expense. Effective January 1, 2021, non‐cash stock‐based compensation expense was added as an adjustment to our calculation of Adjusted EBITDA in order to better reflect ourcore operating performance. Prior period amounts have been recast to conform to this presentation. Adjusted EBIT from continuing operations and adjusted EBITDA from continuing operations are performance measures commonly used by management toassess operating performance, and the Company believes they are commonly reported and widely used by investors and other interested parties as a measure of a company’s operating performance between periods. Adjusted net income margin fromcontinuing operations, adjusted EBIT margin from continuing operations and adjusted EBITDA margin from continuing operations are calculated as the respective metric defined above as a percentage of net sales as reported in the Condensed ConsolidatedStatements of Operations adjusted for items that, in management’s judgment, significantly affect the assessment of earnings results between periods as outlined in the adjusted diluted EPS from continuing operations section above. A full reconciliationbetween the relevant GAAP measure of reported net income (loss) from continuing operations for the three and nine month periods ended September 30, 2021 and 2020 calculated according to GAAP, adjusted net income from continuing operations,adjusted EBIT from continuing operations, and adjusted EBITDA from continuing operations is presented in the below tables.
Adjusted Effective Tax Rate, Adjusting for Certain Items Affecting ComparabilityAdjusted effective tax rate represents the GAAP effective tax rate adjusted to exclude the effect of items excluded from adjusted net income, such as growth, reinvestment, and restructuring programs and mark‐to‐market impacts, and other tax impacts,including those related to CARES Act. This information is provided in order to allow investors to make meaningful, consistent comparisons of the Company’s effective tax rate and to view the Company’s effective tax rate from the same perspective asCompany management.
Free Cash Flow and Net DebtIn addition to measuring the Company’s cash flow generation and usage based upon the operating, investing, and financing classifications included in the Condensed Consolidated Statements of Cash Flows, we also measure free cash flow from continuingoperations which represents net cash provided by operating activities from continuing operations less capital expenditures. The Company believes free cash flow is an important measure of operating performance because it provides management andinvestors a measure of cash generated from operations that is available for mandatory payment obligations and investment opportunities such as funding acquisitions, repaying debt, repurchasing outstanding senior debt, and repurchasing our commonstock. The Company uses a metric of Net Debt to measure our levered position at any specific point in time. Net Debt is defined as total outstanding debt excluding deferred financing fees, less cash and cash equivalents.
Leverage RatioLeverage ratio is defined as net debt divided by adjusted EBITDA for the last twelve months. This Non‐GAAP measure allows investors to view leverage from the same perspective as Company management.
18

19
TREEHOUSE FOODS, INC.RECONCILIATION OF NET INCOME (LOSS) FROM CONTINUING OPERATIONS TO ADJUSTED NET INCOME,
ADJUSTED EBIT AND ADJUSTED EBITDA FROM CONTINUING OPERATIONSThree Months Ended
September 30,Nine Months Ended
September 30,
2021 2020 2021 2020
(unaudited, in millions)
Net income (loss) from continuing operations (GAAP) $ 6.7 $ 11.4 $ 1.9 $ (24.0)
Growth, reinvestment, restructuring programs & other (1) 17.4 20.2 59.1 53.2Acquisition, integration, divestiture, and related costs (2) 7.6 0.8 19.4 1.9COVID‐19 (3) 3.0 3.4 16.3 12.7Loss on extinguishment of debt (4) — 1.2 14.4 1.2Shareholder activism (5) 0.9 — 4.0 —Tax indemnification (6) 2.7 3.5 2.9 5.2Foreign currency loss (gain) on re‐measurement of intercompany notes (7) 2.1 (3.1) (0.7) 5.3Mark‐to‐market adjustments (8) (5.3) (9.2) (33.1) 50.6Litigation matter (9) — — — 9.0Less: Taxes on adjusting items (9.4) 12.3 (23.2) (20.9)Adjusted net income from continuing operations (Non‐GAAP) 25.7 40.5 61.0 94.2Interest expense 18.8 26.9 62.4 77.9Interest income — — (4.1) (4.0)Income taxes (excluding COVID‐19 income tax adjustments) (0.4) 25.0 (2.0) 9.6Add: Taxes on adjusting items 9.4 (12.3) 23.2 20.9Adjusted EBIT from continuing operations (Non‐GAAP) 53.5 80.1 140.5 198.6Depreciation and amortization (10) 53.4 50.9 160.7 150.3Stock‐based compensation expense (11) 1.7 5.6 10.3 19.9Adjusted EBITDA from continuing operations (Non‐GAAP) $ 108.6 $ 136.6 $ 311.5 $ 368.8
Adjusted net income margin from continuing operations 2.3 % 3.9 % 1.9 % 3.0 %Adjusted EBIT margin from continuing operations 4.9 % 7.7 % 4.4 % 6.3 %Adjusted EBITDA margin from continuing operations 9.9 % 13.1 % 9.9 % 11.6 %
19

20
TREEHOUSE FOODS, INC. FOOTNOTES FOR RECONCILIATION OF NET INCOME (LOSS) FROM CONTINUING OPERATIONS TO
ADJUSTED NET INCOME, ADJUSTED EBIT AND ADJUSTED EBITDA FROM CONTINUING OPERATIONS
Location in CondensedThree Months Ended
September 30,Nine Months Ended
September 30,
Consolidated Statements of Operations 2021 2020 2021 2020
(unaudited, in millions)
(1) Growth, reinvestment, restructuring programs & other Other operating expense, net $ 17.4 $ 19.9 $ 59.2 $ 49.9
General and administrative — 0.2 — 1.2
Cost of sales — 0.1 (0.1) 1.1
Selling and distribution — — — 1.0
(2) Acquisition, integration, divestiture, and related costs General and administrative 7.3 0.6 15.0 1.4
Cost of sales 0.2 0.1 1.6 0.1
Other operating expense, net 0.1 0.1 2.8 0.4(3) COVID‐19 Cost of sales 1.1 17.3 14.4 36.0
General and administrative — 0.1 — 1.7Income tax expense (benefit) 1.9 (14.0) 1.9 (25.0)
(4) Loss on extinguishment of debt Loss on extinguishment of debt — 1.2 14.4 1.2
(5) Shareholder activism General and administrative 0.9 — 4.0 —(6) Tax indemnification Other (income) expense, net 2.7 3.5 2.9 5.2(7) Foreign currency loss (gain) on re‐measurement of intercompany notes Loss (gain) on foreign currency exchange 2.1 (3.1) (0.7) 5.3(8) Mark‐to‐market adjustments Other (income) expense, net (5.3) (9.2) (33.1) 50.6
(9) Litigation matter General and administrative — — — 9.0
Total impact of adjusting items 28.4 16.8 82.3 139.1
(10) Depreciation included as an adjusting item Cost of sales — 0.2 — 0.2
(11) Stock‐based compensation expense included as an adjusting item Other operating expense, net — 0.2 0.8 0.8
20

21
TREEHOUSE FOODS, INC. RECONCILIATION OF DILUTED EARNINGS (LOSS) PER SHARE FROM CONTINUING OPERATIONS TO
ADJUSTED DILUTED EARNINGS PER SHARE FROM CONTINUING OPERATIONS
Three Months EndedSeptember 30,
Nine Months EndedSeptember 30,
2021 2020 2021 2020
(unaudited) (unaudited)
Diluted earnings (loss) per share from continuing operations (GAAP) $ 0.12 $ 0.20 $ 0.03 $ (0.42)Growth, reinvestment, restructuring programs & other 0.31 0.36 1.05 0.94Acquisition, integration, divestiture, and related costs 0.14 0.01 0.34 0.03COVID‐19 0.06 0.06 0.29 0.22
Loss on extinguishment of debt — 0.02 0.26 0.02Shareholder activism 0.02 — 0.07 —Tax indemnification 0.04 0.06 0.05 0.09Foreign currency loss (gain) on re‐measurement of intercompany notes 0.04 (0.06) (0.01) 0.09Mark‐to‐market adjustments (0.09) (0.17) (0.59) 0.89Litigation matter — — — 0.16Taxes on adjusting items (0.18) 0.23 (0.41) (0.36)Adjusted diluted EPS from continuing operations (Non‐GAAP) $ 0.46 $ 0.71 $ 1.08 $ 1.66
21

22
TREEHOUSE FOODS, INC. RECONCILIATION OF EFFECTIVE TAX RATE TO
ADJUSTED EFFECTIVE TAX RATE
1 The pre‐tax impact of adjusting items for the three months ended September 30, 2021 and 2020 excludes the $1.9 million income tax expense and $14.0 million income tax benefit, respectively, recognized due to the enactment of the CARES Act included as part of the COVID‐19 adjustment.
2 The tax impact of adjusting items for the three months ended September 30, 2021 and 2020 include the $1.9 million income tax expense and the $14.0 million income tax benefit, respectively, recognized due to the enactment of the CARES Act included as part of the COVID‐19 adjustment.
Three Months EndedSeptember 30,
2021 2020(unaudited, in millions)
Pre‐Tax Results ($M)Income from continuing operations before income taxes (GAAP) $ 8.2 $ 22.4Less: Impact of adjusting items1 (26.5) (30.8)Adjusted earnings before taxes (Non‐GAAP) $ 34.7 $ 53.2
Taxes ($M)Income tax expense (GAAP) $ 1.5 $ 11.0Less: Impact of adjusting items2 (7.5) (1.7)Adjusted income tax expense (Non‐GAAP) $ 9.0 $ 12.7
Tax Rate (%)Effective tax rate (GAAP) 18.3 % 49.1 %Adjusted effective tax rate (Non‐GAAP) 25.9 % 23.9 %
22

23
TREEHOUSE FOODS, INC. ORGANIC NET SALES RECONCILIATION
Three Months EndedSeptember 30, 2021
Nine Months EndedSeptember 30, 2021
Dollars Percent Dollars Percent
(In millions) (In millions)
2020 Net sales $ 1,045.7 $ 3,172.5Volume/mix excluding acquisitions and divestitures (13.5) (1.3)% (141.5) (4.5)%Pricing 31.8 3.0 30.0 0.9Volume/mix related to divestitures — — (21.4) (0.7)Acquisition 33.2 3.2 106.8 3.5Foreign currency 4.0 0.4 15.3 0.5
2021 Net sales $ 1,101.2 5.3 % $ 3,161.7 (0.3)%
Volume/mix related to divestitures — 0.7Acquisition (3.2) (3.5)Foreign currency (0.4) (0.5)
Percent change in organic net sales 1.7 % (3.6)%
23

24
TREEHOUSE FOODS, INC. SEGMENT ORGANIC NET SALES RECONCILIATION
Three Months Ended September 30, Nine Months Ended September 30,
Meal Preparation Snacking & Beverages Meal Preparation Snacking & Beverages
Dollars Percent Dollars Percent Dollars Percent Dollars Percent
(unaudited, dollars in millions) (unaudited, dollars in millions)
2020 Net sales $ 642.7 $ 403.0 $ 1,984.0 $ 1,188.5
Volume/mix excluding acquisitions and divestitures (17.9) (2.8)% 4.4 1.1 % (111.7) (5.6)% (29.8) (2.5)%Pricing 29.7 4.6 2.1 0.5 27.8 1.3 2.2 0.2Volume/mix related to divestitures — — — — — — (21.4) (1.8)Acquisition 33.2 5.2 — — 106.8 5.4 — —
Foreign currency 2.5 0.4 1.5 0.4 9.4 0.5 5.9 0.5
2021 Net sales $ 690.2 7.4 % $ 411.0 2.0 % $ 2,016.3 1.6 % $ 1,145.4 (3.6)%
Volume/mix related to divestitures — — — 1.8Acquisition (5.2) — (5.4) —
Foreign currency (0.4) (0.4) (0.5) (0.5)
Percent change in organic net sales 1.8 % 1.6 % (4.3)% (2.3)%
24
25
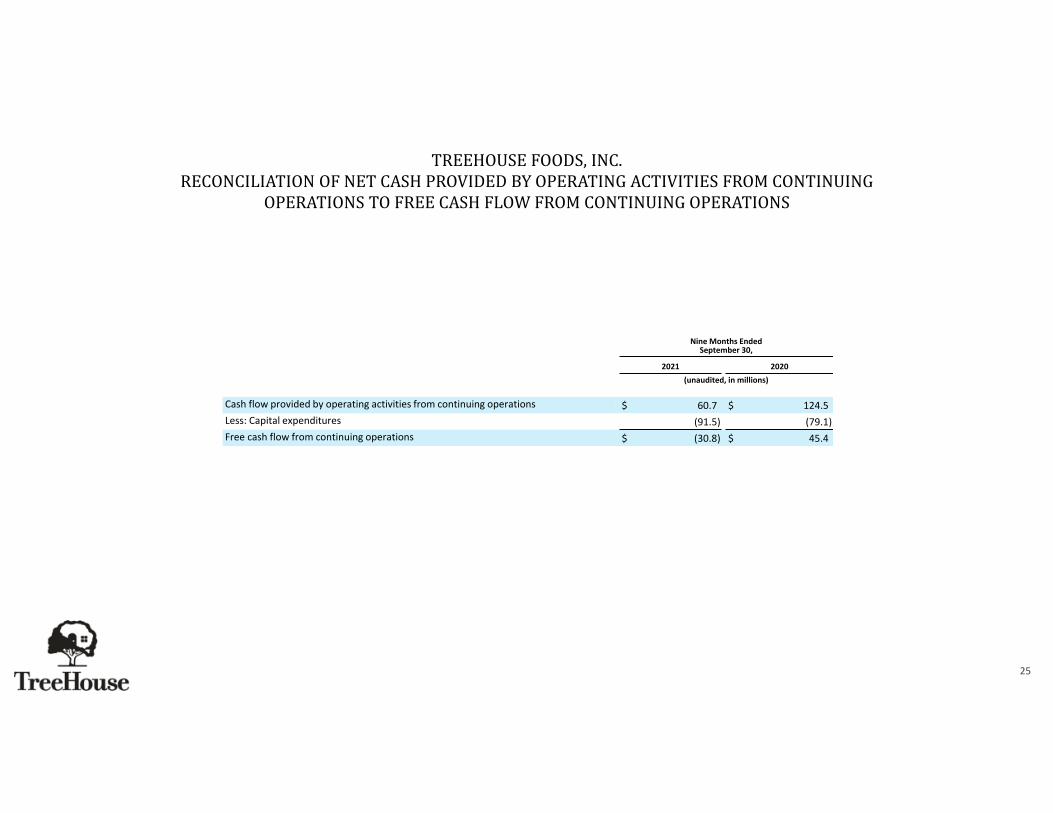
TREEHOUSE FOODS, INC. RECONCILIATION OF NET CASH PROVIDED BY OPERATING ACTIVITIES FROM CONTINUING
OPERATIONS TO FREE CASH FLOW FROM CONTINUING OPERATIONS
Nine Months EndedSeptember 30,
2021 2020(unaudited, in millions)
Cash flow provided by operating activities from continuing operations $ 60.7 $ 124.5Less: Capital expenditures (91.5) (79.1)Free cash flow from continuing operations $ (30.8) $ 45.4
25

26
TREEHOUSE FOODS, INC. NET DEBT RECONCILIATION
26
Condensed Consolidated Balance SheetSeptember 30,
2021
(unaudited, in millions)
Current portion of long‐term debt $ 15.8Long‐term debt 1,893.8Add back deferred financing costs 16.8(Less) Cash and cash equivalents (67.4)Net debt $ 1,859.0

27
TREEHOUSE FOODS, INC. LEVERAGE RATIO RECONCILIATION
271 For the period ended December 31, 2020, the growth, reinvestment, restructuring programs & other adjustment includes the previously reported change in regulatory requirements adjustment.
Three Months EndedLast Twelve
Months Ended
December 31, March 31, June 30, September 30, September 30,2020 2021 2021 2021 2021
(unaudited, in millions)
Net income (loss) from continuing operations (GAAP) $ 73.2 $ 0.4 $ (5.2) $ 6.7 $ 75.1
Growth, reinvestment, restructuring programs & other1 20.9 19.5 22.2 17.4 80.0
COVID‐19 10.5 8.8 4.5 3.0 26.8
Acquisition, integration, divestiture, and related costs 8.5 5.3 6.5 7.6 27.9
Loss on extinguishment of debt — 14.4 — — 14.4
Shareholder activism — 2.1 1.0 0.9 4.0
Tax indemnification (0.1) — 0.2 2.7 2.8
Foreign currency (gain) loss on re‐measurement of intercompany notes (5.7) (1.5) (1.3) 2.1 (6.4)
Mark‐to‐market adjustments (20.7) (21.6) (6.2) (5.3) (53.8)
Less: Taxes on adjusting items (26.2) (6.9) (6.9) (9.4) (49.4)Adjusted net income from continuing operations (Non‐GAAP) 60.4 20.5 14.8 25.7 121.4Interest expense 26.9 25.1 18.5 18.8 89.3Interest income (excluding COVID‐19 interest income) (0.1) (4.1) — — (4.2)Income taxes (excluding COVID‐19 tax adjustments) (11.9) (0.2) (1.4) (0.4) (13.9)Add: Taxes on adjusting items 26.2 6.9 6.9 9.4 49.4Adjusted EBIT from continuing operations (Non‐GAAP) 101.5 48.2 38.8 53.5 242.0Depreciation and amortization 52.7 53.5 53.8 53.4 213.4Stock‐based compensation expense 5.3 4.5 4.1 1.7 15.6Adjusted EBITDA from continuing operations (Non‐GAAP) $ 159.5 $ 106.2 $ 96.7 $ 108.6 $ 471.0
Net Debt $ 1,859.0
Leverage Ratio 3.9