q3 2021 results - itt.com
TRANSCRIPT

ITT Inc.
Q3 2021 Results
November 4, 2021

Safe Harbor and Non-GAAP Disclosures
3 2
Safe Harbor
This presentation contains “forward-looking statements” intended to qualify for the safe harbor from liability established by the Private Securities Litigation Reform Act of
1995. These forward-looking statements are not historical facts, but rather represent only a belief regarding future events based on current expectations, estimates,
assumptions and projections about our business, future financial results and the industry in which we operate, and other legal, regulatory and economic developments. These
forward-looking statements include, but are not limited to, future strategic plans and other statements that describe the company’s business strategy, outlook, objectives,
plans, intentions or goals, and any discussion of future events and future operating or financial performance.
We use words such as “anticipate,” “estimate,” “expect,” “project,” “intend,” “plan,” “believe,” “target,” “future,” “may,” “will,” “could,” “should,” “potential,” “continue” and other
similar expressions to identify such forward-looking statements. Forward-looking statements are uncertain, and, by their nature, many are inherently unpredictable and
outside of ITT’s control, and involve known and unknown risks, uncertainties and other important factors that could cause actual results to differ materially from those
expressed or implied in, or reasonably inferred from, such forward-looking statements.
Where in any forward-looking statement we express an expectation or belief as to future results or events, such expectation or belief is based on current plans and
expectations of our management, expressed in good faith and believed to have a reasonable basis. However, there can be no assurance that the expectation or belief will
occur or that anticipated results will be achieved or accomplished. More information on factors that could cause actual results or events to differ materially from those
anticipated is included in the Risk Factors section of the Company's Annual Report on Form 10-K, Quarterly Reports on Form 10-Q and other documents filed from time to
time with the Securities and Exchange Commission.
The forward-looking statements included in this presentation speak only as of the date hereof. We undertake no obligation (and expressly disclaim any obligation) to update
any forward-looking statements, whether written or oral, as a result of new information, future events or otherwise.
Non-GAAP Disclosures
This presentation and the discussion on the accompanying conference call contain certain financial measures that are not prepared under U.S. GAAP. These non-GAAP
financial measures supplement our GAAP disclosures and are not meant to be considered in isolation or as a substitute for the most directly comparable measures that are
prepared in accordance with GAAP. These measures may not be comparable to similarly titled measures disclosed by other companies. For a reconciliation of these non-
GAAP financial measures to the most directly comparable measures disclosed under GAAP, refer to the supplemental data to this presentation or www.itt.com/investors.

Key Messages
3 3Demand, Resiliency, Execution
11.4%
Adjusted TTM Free
Cash Flow Margin
Q3 Highlights
18%Adjusted
operating
income growth
27%Organic orders
growth
▪ Strong sales growth and execution
‒ Adjusted EPS of $0.99 +21% vs. 2020, +2% vs. 2019
‒ 20% organic growth at Motion Technologies (MT), 17% at Connect & Control Technologies (CCT)
‒ Pricing actions progressing to mitigate raw material and supply chain headwinds
▪ +60 bps adjusted segment operating margin expansion
‒ 16.8% adjusted segment operating margin, +20 bps versus 2019
‒ Managing raw materials inflation of $26M ($0.23) and supply chain disruptions
‒ All hands on deck to drive productivity and price
▪ +27% orders pave way for future outperformance
‒ +41% CCT organic orders growth; +70% aerospace orders growth
‒ +26% Industrial Process (IP) organic orders growth; short-cycle and projects strength
‒ Friction outperformance continues; EV awards feeding long-term growth
▪ Raising FY 2021 adjusted EPS guidance
‒ Adjusted EPS $4.01 - $4.06 (up 25% to 27% vs. PY); +$0.06 increase at the midpoint
‒ 2021 guidance 6% above 2019 adjusted EPS at the midpoint
‒ Effective capital deployment; $50M share repurchases in Q3 ($112M YTD)
16%Organic revenue
growth
All results are unaudited. Comparisons to Q3 2020
unless otherwise noted. For non-GAAP reconciliations,
refer to appendix and www.itt.com/investors

2021 Sustainability Report
3 4ESG Commitment and Progress
▪ ITT released SustainabilITTy – 2021 Supplement, the Company's
comprehensive report on its progress towards environmental,
social, and governance commitments
▪ Current “A” rating on a scale of AAA-CCC in the Morgan Stanley
Capital International (MSCI) ESG assessment
▪ Key highlights
• 25 percent reduction in greenhouse gas (GHG) Scope 1 and 2
emissions
• 23 percent less waste sent to landfills
• 25 percent fewer workplace incidents
• Divestiture of all pending and future legacy asbestos liabilities

Strategic Approach to Capital Deployment
3 5Deployed Capital of >2.8x YTD Adjusted Free Cash Flow in 2021
64%
18%
9%
9%
Share Repurchases$112M total YTD; reduced weighted
average share count by 1%
Capital Expenditures
~$620Myear-to-date
Capital Expenditures for Growth (9%)
▪ Represents 3% of revenue YTD in 2021
▪ Green capex ramping - cogeneration plant and
solar lake projects in Barge, Italy
▪ Friction capacity increase to support EV growth
▪ IP and CCT VA/VE[1] project investments
Sale of Legacy Asbestos Liabilities (64%)
▪ Divested all asbestos obligations
▪ Indemnified for all pending and future claims
Driving M&A Activity
▪ Bartek Makowiecki appointed as Senior VP,
Strategy and Business Development
▪ Increased pipeline of targets, significant cultivation
activity
Dividends30% increase in 2021
Commentary
M&A / Divestiture
[1] VA/VE: Value Analysis / Value Engineering

Q3 Summary Results
3 6Adjusted EPS Above 2019
+16% Organic revenue
+ MT +20% driven by Friction aftermarket;
OE outperformance despite chip shortage
+ IP short-cycle (+10%) - parts demand
+ Industrial connectors (+42%) - strength in
NA distribution
± Flat aerospace shipments, but backlog
strengthening (+70% aero orders growth)
- Supply chain disruptions (~350 bps)
$ in millions, except EPS
15.5% Adjusted op. margin
+ Higher sales volume
+ Shop floor productivity benefits
+ Commercial actions
- Raw materials inflation
- Supply chain disruptions
- Corporate costs
▪ Strategic long-term investments for growth
$0.99 Adjusted EPS
▪ 2% EPS vs 2019 on (3%) less revenue
+ Productivity and commercial actions
- Raw materials inflation
- Supply chain disruptions
- PY temporary cost actions reversal
+ Foreign currency and lower tax rate
$218M YTD Adjusted FCF
excluding Q2 $398M asbestos payment
+ Higher segment operating income
− Higher working capital requirements due to
ongoing supply chain constraints and to
support customer deliveries
+ Adjusted TTM FCF margin of 11.4%
+ Capital deployment - $50M of share
repurchases in Q3 ($112M YTD)
Adjusted Operating
Income and Margin
$108
$91
$107
Q3 2019 Q3 2020 Q3 2021
$0.97
$0.82
$0.99
Q3 2019 Q3 2020 Q3 2021
Adjusted EPS
$152
$271
$218
Q3 2019 Q3 2020 Q3 2021
YTD Adjusted Free Cash
Flow (FCF)
15.4%
$712
$591
$690
Q3 2019 Q3 2020 Q3 2021
Revenue
15.5%15.2%
// // // //
All results are unaudited. Comparisons to Q3 2020
unless otherwise noted. For non-GAAP reconciliations,
refer to appendix and www.itt.com/investors

Q3 Adjusted EPS Bridge
3 7Growth Driven by Volume and Productivity
$0.99
$0.82
$0.42
(-$0.23)
(-$0.09)$0.04
$0.03
Q3 2020 Operational Performance
Material CostInflation
Discretionary /Reinvestments
FX Tax Rate /Share Count
Q3 2021
+ Organic growth
+ Commercial actions ($0.06)
+ Net productivity excl. material
cost inflation
+ Restructuring benefits
- Supply chain disruptions
(expedited freight, inefficiencies)
- Prior year benefits
(environmental, temporary
cost actions)
- Growth investments ($3M)
+21% Growth
+ $50M share
repurchases in Q3 at
attractive prices
+ Strategic tax planning
- Raw materials, mainly
steel
All results are unaudited. Comparisons to Q3 2020
unless otherwise noted. For non-GAAP reconciliations,
refer to appendix and www.itt.com/investors

Q3 Segment Summary Results
3 8Strong Execution Against Supply Chain Headwinds
▪ +8% organic revenue growth driven by short-
cycle demand (+10%), Projects (+1%)
▪ +26% organic orders growth driven by strength
in short-cycle (+23%) and in projects (+36%)
• +6% sequential orders vs Q2; +3% vs Q3 2019
• 1.15x book-to-bill
• Organic backlog up 15% vs. Dec. 31, 2020
▪ Adjusted op margin expansion driven by higher
volume, favorable mix and productivity benefits
▪ 33% adjusted incremental margin
Motion Technologies Industrial Process Connect & Control Technologies
$ millions 2021 vs 2020
Revenue $332 +22%
Adjusted Segment
Operating Income$58 +15%
Adjusted Segment
Operating Margin17.4% (-110) bps
▪ +20% organic revenue growth driven by Friction
aftermarket (+70%)
• Continued Friction OE outperformance, despite chip
shortage impact
• Maintaining Friction OE 99%+ on-time performance
• Exceeded 2019 revenue (+4%)
▪ 6 electric vehicle (EV) platform wins; building
future platform for growth
▪ +15% rail orders growth
▪ Adjusted op margin decline driven by expected
commodities inflation; partially offset by higher
volumes and pricing actions
▪ +17% organic revenue growth driven by +29% in
connectors
▪ +41% organic orders driven by connectors (+46%)
• Aerospace +70%
• Industrial connectors and distribution both over 50%
• Organic backlog up 17% vs. Dec. 31, 2020
• 1.06x book-to-bill
▪ Adjusted op margin expansion driven by
productivity and volume leverage
▪ 35% adjusted incremental margin
$ millions 2021 vs 2020
Revenue $211 +9%
Adjusted Segment
Operating Income$33 +20%
Adjusted Segment
Operating Margin15.6% +150 bps
$ millions 2021 vs 2020
Revenue $147 +17%
Adjusted Segment
Operating Income$25 +42%
Adjusted Segment
Operating Margin17.1% +300 bps
All results are unaudited. Comparisons to Q3 2020
unless otherwise noted. For non-GAAP reconciliations,
refer to appendix and www.itt.com/investors

Growth in Q3 Orders
3 9Strong Backlog
Motion
Technologies
$187
$346
Q2 2020 Q2 2021
Industrial
Process
Connect &
Control
Technologies
▪ Organic orders +27% in Q3 after +47% growth in Q2
▪ 2% above 2019
▪ 13% organic growth in backlog vs. year-end 2020
driven primarily by IP (+15%) and CCT (+17%)
▪ Motion Technologies growth in rail and EV awards
outlook
▪ Short-cycle strength continues in IP and connectors
(distribution)
▪ Pump project activity resuming; recovery in oil & gas
accelerating
▪ Q3 represents third consecutive quarter of
sequential project orders increase
▪ Pent up demand entering 2022
▪ +70% aerospace orders growth in Q3 … continue to
expect 2022 and 2023 recovery
$192
$231
Q2 2020 Q2 2021
$107
$159
Q2 2020 Q2 2021
+22%Organic
growth vs PY
+26%Organic
growth vs PY
+41%Organic
growth vs PY
Commentary$270
$334
Q3 2020 Q3 2021
$193
$243
Q3 2020 Q3 2021
$110
$155
Q3 2020 Q3 2021
All results are unaudited. Comparisons to Q3 2020
unless otherwise noted. For non-GAAP reconciliations,
refer to appendix and www.itt.com/investors

2021 Guidance Update
3 10Raising Adjusted EPS Guidance, Eclipsing 2019
Previous
+11% to +13% Total
+8% to +10% Organic
Revenue
16.9% to 17.4%
+170 to +220 bps
expansion
Adjusted segment
op margin
$3.90 to $4.05
+22% to +27% Growth
Adjusted EPS
$305M to $325M[1]
11% to 12% margin
Adjusted free
cash flow
Updated
+11% to +13% Total
+8% to +10% Organic
16.9% to 17.4%
+170 to +220 bps
expansion
$4.01 to $4.06
+25% to +27% Growth
▪ Strong YTD performance at all segments
▪ Continued Friction OE outperformance and growth in
Connectors
▪ Organic sales growth +600 bps improvement since
original outlook
▪ Continued challenge in supply chain, raw material inflation
▪ Adjusted EPS raise of $0.06 at mid-point
▪ Revised full-year adjusted EPS outlook $0.23 (or 6%) above
2019
▪ Reflects impact of $112M YTD share repurchases and lower
full year effective tax rate (20.75%)
Outlook Assumptions
[1] Excludes $398M one-time, non-recurring cash outflow related
to the divestiture of legacy asbestos liabilities
$305M to $325M[1]
11% to 12% margin
All results are unaudited. Comparisons to Q3 2020
unless otherwise noted. For non-GAAP reconciliations,
refer to appendix and www.itt.com/investors

Strong 2021 performance – continue to outperform
Resilient business and ITTers able to overcome inflationary headwinds
and supply chain disruptions
Orders strength paving way for future growth
Heightened focus on M&A pipeline to take advantage of capital flexibility
Summary of Key Messages
3 11Outperformance Now and Over the Long Term
1
2
3
4

ITT Inc.
Supplemental Data

Q3 Adjusted Segment Operating Margin
3 13Margin Expansion Despite Materials Inflation Impacts
vs. PY
Q3’20 adjusted segment
operating margin16.2%
Volume, mix, price and other +250 bps
Productivity Actions +280 bps
Cost Inflation (-470 bps)
Operational margins subtotal 16.8%
FX impact +40 bps
Strategic investments (-40 bps)
Q3’21 adjusted segment
operating margin16.8%
+ Friction aftermarket
+ Higher volumes in IP and CCT
+ Strategic commercial actions
+ Shop floor productivity
+ Restructuring benefits
- Materials inflation
- Supply chain disruptions
- Strategic growth investments
+60 bps Expansion
All results are unaudited. Comparisons to Q3 2020
unless otherwise noted. For non-GAAP reconciliations,
refer to appendix and www.itt.com/investors

Q3 2021 ITT Adjusted Segment Performance
3 14
Q3 2021 Total Revenue vs PY 22.3% 8.6% 16.8% 16.6%
FX (-2.0%) (-0.5%) 0.2% (-1.0%)
Q3 2021 Organic Revenue vs PY 20.3% 8.1% 17.0% 15.6%
Q3 2020 Adjusted Operating Margin 18.5% 14.1% 14.1% 16.2%
Volume, Mix, Productivity & Other (-1.0%) 1.4% 3.2% 0.6%
Growth Investments (-0.7%) (-0.1%) 0.0% (-0.4%)
FX 0.6% 0.2% (-0.2%) 0.4%
Q3 2021 Adjusted Operating Margin 17.4% 15.6% 17.1% 16.8%
Motion
Technologies
Industrial
Process
Connect &
Control
Technologies
Total
Segments
All results are unaudited. Comparisons to Q3 2020
unless otherwise noted. For non-GAAP reconciliations,
refer to appendix and www.itt.com/investors

Key Performance Indicators & Non-GAAP Measures
15
Management reviews a variety of key performance indicators including revenue, segment operating income and margins, earnings per share, order growth, and backlog, some of which are calculated
on a non-GAAP basis. In addition, we consider certain measures to be useful to management and investors when evaluating our operating performance for the periods presented. These measures
provide a tool for evaluating our ongoing operations and management of assets from period to period. This information can assist investors in assessing our financial performance and measures our
ability to generate capital for deployment among competing strategic alternatives and initiatives, including, but not limited to, acquisitions, dividends, and share repurchases. Some of these metrics,
however, are not measures of financial performance under accounting principles generally accepted in the United States of America (GAAP) and should not be considered a substitute for measures
determined in accordance with GAAP. We consider the following non-GAAP measures, which may not be comparable to similarly titled measures reported by other companies, to be key performance
indicators for purposes of our reconciliation tables.
Organic Revenues and Organic Orders are defined, respectively, as revenue and orders, excluding the impacts of foreign currency fluctuations and acquisitions. The period-over-period change
resulting from foreign currency fluctuations is estimated using a fixed exchange rate for both the current and prior periods. Management believes that reporting organic revenue and organic orders
provides useful information to investors by helping identify underlying trends in our business and facilitating comparisons of our revenue performance with prior and future periods and to our peers.
Adjusted Operating Income and Adjusted Segment Operating Income are defined, respectively, as total operating income and segment operating income, adjusted to exclude special items that
include, but are not limited to, asbestos-related impacts, impairments, restructuring, realignment, certain acquisition-related impacts, and unusual or infrequent operating items. Special items
represent charges or credits that impact current results, which management views as unrelated to the Company's ongoing operations and performance. Adjusted Operating Margin and Adjusted
Segment Operating Margin are defined as adjusted operating income or adjusted segment operating income divided by revenue. Adjusted Segment Decremental or Incremental Operating
Margin is defined as the change in adjusted segment operating income divided by the change in revenue. We believe these financial measures are useful to investors and other users of our financial
statements in evaluating ongoing operating profitability, as well as in evaluating operating performance in relation to our competitors.
Adjusted Income from Continuing Operations and Adjusted EPS are defined, respectively, as income from continuing operations attributable to ITT Inc. and income from continuing operations
attributable to ITT Inc. per diluted share, adjusted to exclude special items that include, but are not limited to, asbestos-related impacts, impairments, restructuring, realignment, pension settlement
and curtailment impacts, certain acquisition-related impacts, income tax settlements or adjustments, and unusual or infrequent items. Special items represent charges or credits, on an after-tax basis,
that impact current results which management views as unrelated to the Company's ongoing operations and performance. The after-tax basis of each special item is determined using the
jurisdictional tax rate of where the expense or benefit occurred. We believe that adjusted income from continuing operations is useful to investors and other users of our financial statements in
evaluating ongoing operating profitability, as well as in evaluating operating performance in relation to our competitors.
Adjusted Free Cash Flow and Adjusted Free Cash Flow Margin are defined as free cash flow (net cash provided by operating activities less capital expenditures), adjusted for the divestiture of
legacy asbestos assets and liabilities and the ratio of adjusted free cash flow to revenue. We believe that adjusted free cash flow and the adjusted free cash flow margin provides useful information to
investors as it provides insight into the primary cash flow metric used by management to monitor and evaluate cash flows generated by our operations.

1616
(A) (B) (C) (D) (E) (F) = A-D-E (G) =C-D-E (H) = G / B
$ Change % Change Revenue / $ Change % Change
Q3 2021 Q3 2020
2021 vs.
2020
2021 vs.
2020
Acquisitions
Q3 2021
FX Impact
Q3 2021
Orders
Q3 2021
Adj. 2021
vs. 2020
Adj. 2021
vs. 2020
Revenue
ITT Inc. 689.6$ 591.2$ 98.4$ 16.6% -$ 5.9$ 683.7$ 92.5$ 15.6%
Motion Technologies 332.3 271.8 60.5 22.3% - 5.3 327.0 55.2 20.3%
Industrial Process 210.7 194.1 16.6 8.6% - 0.8 209.9 15.8 8.1%
Connect & Control Technologies 147.1 125.9 21.2 16.8% - (0.2) 147.3 21.4 17.0%
Orders
ITT Inc. 731.5$ 573.2$ 158.3$ 27.6% -$ 4.4$ 727.1$ 153.9$ 26.8%
Motion Technologies 334.1 270.2 63.9 23.6% - 5.2 328.9 58.7 21.7%
Industrial Process 242.5 193.2 49.3 25.5% - (0.3) 242.8 49.6 25.7%
Connect & Control Technologies 155.4 110.4 45.0 40.8% - (0.5) 155.9 45.5 41.2%
Note: Excludes intercompany eliminations.
Amounts may not calculate due to rounding.
ITT Inc. Non-GAAP Reconciliation
Reported vs. Organic Revenue / Orders
Third Quarter 2021 & 2020(In Millions)
(As Reported - GAAP) (As Adjusted - Organic)
(all amounts unaudited)
Q3 2021 Earnings – All results are unaudited

1717
Q3 2021 Q3 2021 Q3 2021 Q3 2020 Q3 2020 Q3 2020 % Change % Change
As
Reported
Special
Items
As
Adjusted
As
Reported
Special
Items
As
Adjusted
As Reported
2021 vs. 2020
As Adjusted
2021 vs. 2020
Revenue:
Motion Technologies 332.3$ 332.3$ 271.8$ 271.8$ 22.3% 22.3%
Industrial Process 210.7 210.7 194.1 194.1 8.6% 8.6%
Connect & Control Technologies 147.1 147.1 125.9 125.9 16.8% 16.8%
Intersegment eliminations (0.5) (0.5) (0.6) (0.6)
Total Revenue 689.6$ 689.6$ 591.2$ 591.2$ 16.6% 16.6%
Operating Margin:
Motion Technologies 16.1% 130 BP 17.4% 18.5% - BP 18.5% (240) BP (110) BP
Industrial Process 15.4% 20 BP 15.6% 8.8% 530 BP 14.1% 660 BP 150 BP
Connect & Control Technologies 17.1% - BP 17.1% 13.0% 110 BP 14.1% 410 BP 300 BP
Total Operating Segments 16.1% 70 BP 16.8% 14.2% 200 BP 16.2% 190 BP 60 BP
Operating Income:
Motion Technologies 53.6$ 4.1$ 57.7$ 50.4$ -$ 50.4$ 6.3% 14.5%
Industrial Process 32.4 0.5 32.9 17.1 10.3 27.4 89.5% 20.1%
Connect & Control Technologies 25.2 (0.1) 25.1 16.4 1.3 17.7 53.7% 41.8%
Total Segment Operating Income 111.2$ 4.5$ 115.7$ 83.9$ 11.6$ 95.5$ 32.5% 21.2%
Special items include, but are not limited to, restructuring and realignment costs, acquisition-related expenses and other unusual or infrequent items.
ITT Inc. Non-GAAP Reconciliation
(In Millions)
Note: Amounts may not calculate due to rounding.
Reported vs. Adjusted Segment Operating Income & Operating Margin
Third Quarter 2021 & 2020
(all amounts unaudited)
Q3 2021 Earnings – All results are unaudited

1818
Q3 2021 Q3 2021 Q3 2020 Q3 2020
2021
vs. 2020
2021
vs. 2020
As
Reported
Non-GAAP
Adjustments
As
Adjusted
As
Reported
Non-GAAP
Adjustments
As
Adjusted
As
Adjusted ($)
As
Adjusted (%)
Segment operating income 111.2$ 4.5$ #A 115.7$ 83.9$ 11.6$ #A 95.5$
Corporate (expense) income (9.5) 0.6 #B (8.9) (146.4) 141.7 #B (4.7)
Operating income (loss) 101.7 5.1 106.8 (62.5) 153.3 90.8
Interest income (expense) 0.1 - 0.1 0.6 - 0.6
Other income (expense) (0.6) - (0.6) (1.8) 1.4 #C (0.4)
Income from continuing operations before tax 101.2 5.1 106.3 (63.7) 154.7 91.0
Income tax (expense) benefit (14.1) (6.3) #D (20.4) 16.2 (35.2) #D (19.0)
Income from continuing operations 87.1 (1.2) 85.9 (47.5) 119.5 72.0
Less: Income attributable to noncontrolling interests 0.5 - 0.5 0.5 - 0.5
Income from continuing operations - ITT Inc. 86.6$ (1.2)$ 85.4$ (48.0)$ 119.5$ 71.5$
EPS from continuing operations 1.00$ (0.01)$ 0.99$ (0.55)$ 1.37$ 0.82$ 0.17$ 20.7%
#A -
#A -
#B -
#B -
#C - 2020 primarily includes pension termination related charges.
#D -
#D -
Note: Amounts may not calculate due to rounding.
ITT Inc. Non-GAAP Reconciliation
Reported vs. Adjusted Income from Continuing Operations & Adjusted EPS
Third Quarter 2021 & 2020(In Millions, except per share amounts)
(all amounts unaudited)
2020 includes the net tax benefit of special items #A, #B and #C ($35.1M), tax benefit on uncertain tax position release ($3.2M), tax expense on future distribution of foreign earnings
($2.0M) and other tax related special items.
Per share amounts are based on diluted weighted average common shares outstanding.
2021 includes restructuring costs ($4.5M).
2020 includes restructuring and other costs ($11.6M).
2021 includes other costs ($0.6M).
2020 includes asbestos related expense ($141.4M) and other costs ($0.3M). The net asbestos expense includes remeasurement expense ($135.9M) to transition to a full horizon,
extending the projection through 2052, and other asbestos related costs ($5.5M).
2021 includes the net tax benefit of special items #A, #B and #C ($1.6M), tax benefit for valuation allowance impacts ($1.9M) and other tax related special items.
Q3 2021 Earnings – All results are unaudited
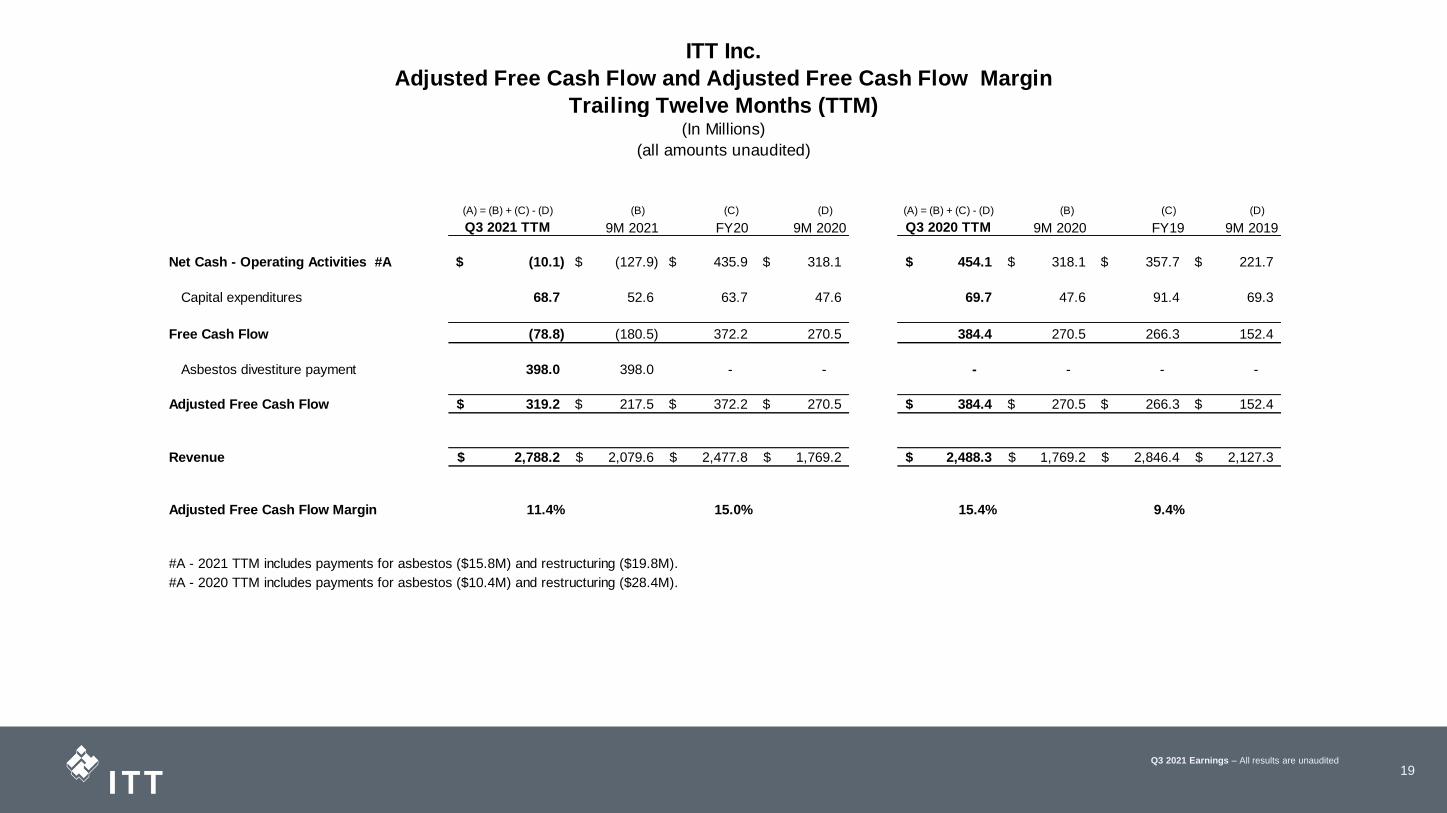
1919
Q3 2021 Earnings – All results are unaudited
(A) = (B) + (C) - (D) (B) (C) (D) (A) = (B) + (C) - (D) (B) (C) (D)
Q3 2021 TTM 9M 2021 FY20 9M 2020 Q3 2020 TTM 9M 2020 FY19 9M 2019
Net Cash - Operating Activities #A (10.1)$ (127.9)$ 435.9$ 318.1$ 454.1$ 318.1$ 357.7$ 221.7$
Capital expenditures 68.7 52.6 63.7 47.6 69.7 47.6 91.4 69.3
Free Cash Flow (78.8) (180.5) 372.2 270.5 384.4 270.5 266.3 152.4
Asbestos divestiture payment 398.0 398.0 - - - - - -
Adjusted Free Cash Flow 319.2$ 217.5$ 372.2$ 270.5$ 384.4$ 270.5$ 266.3$ 152.4$
Revenue 2,788.2$ 2,079.6$ 2,477.8$ 1,769.2$ 2,488.3$ 1,769.2$ 2,846.4$ 2,127.3$
Adjusted Free Cash Flow Margin 11.4% 15.0% 15.4% 9.4%
#A - 2021 TTM includes payments for asbestos ($15.8M) and restructuring ($19.8M).
#A - 2020 TTM includes payments for asbestos ($10.4M) and restructuring ($28.4M).
ITT Inc.
Adjusted Free Cash Flow and Adjusted Free Cash Flow Margin
Trailing Twelve Months (TTM)
(all amounts unaudited)
(In Millions)

2020
2021 Full-Year Guidance
Low High
EPS from Continuing Operations - GAAP 3.47$ 3.54$
Net asbestos related costs, net of tax 0.45 0.45
Pension termination funding, net of tax (0.03) (0.03)
Estimated restructuring, net of tax 0.10 0.08
Other, net of tax 0.02 0.02
EPS from Continuing Operations - Adjusted 4.01$ 4.06$
Note: The Company has provided forward-looking non-GAAP financial measures for organic revenue growth and adjusted
segment operating margin. It is not possible, without unreasonable efforts, to estimate the impacts of foreign currency
fluctuations, acquisitions and certain other special items that may occur in 2021 as these items are inherently uncertain
and difficult to predict. As a result, the Company is unable to quantify certain amounts that would be included in a
reconciliation of organic revenue growth and adjusted segment operating margin to the most directly comparable GAAP
financial measures without unreasonable efforts and has not provided reconciliations for these forward looking non-GAAP
financial measures.
ITT Inc. Non-GAAP Reconciliation
GAAP vs. Adjusted EPS Guidance
Full Year 2021(Per share amounts)
Q3 2021 Earnings – All results are unaudited

2121
2021 Full-Year Guidance
Low High
Net Cash - Operating Activities 7.0$ 27.0$
Capital expenditures 100.0 100.0
Free Cash Flow (93.0) (73.0)
Asbestos divestiture payment 398.0 398.0
Adjusted Free Cash Flow 305.0$ 325.0$
Free Cash Flow margin 11% 12%
(In Millions)
ITT Inc. Non-GAAP Reconciliation
Adjusted Free Cash Flow Guidance
Full Year 2021
Q3 2021 Earnings – All results are unaudited