q3 & 9m fy2015/16 financial results - singapore post following presentation contains forward...
TRANSCRIPT

Q3 & 9M FY2015/16 Financial Results
4 February 2016
1
Agenda
The following presentation contains forward looking statements by the management of Singapore Post Limited (“SingPost”) relating to financial trends for future periods, compared to the results for previous periods.
Some of the statements contained in this presentation that are not historical facts are statements of future expectations with respect to the financial conditions, results of operations and businesses, and related plans
and objectives. Forward looking information is based on management's current views and assumptions including, but not limited to, prevailing economic and market conditions. These statements involve known and
unknown risks and uncertainties that could cause actual results, performance or events to differ materially from those in the statements as originally made. Such statements are not, and should not be construed as a
representation as to future performance of SingPost. In particular, such targets should not be regarded as a forecast or projection of future performance of SingPost. It should be noted that the actual performance of
SingPost may vary significantly from such statements.
“$” means Singapore dollars unless otherwise indicated.
eCommerce-Related Revenues
Segmental Results
Business Update
Overview & 9M FY15/16 Financials

2
Executive Summary
Transformation well on track
eCommerce growth momentum continues, with eCommerce related revenues rising 53% to S$278.1 million
eCommerce related revenues now makes up 33.4% of Group revenue Improved operating profit margins from scale benefits and synergies from post-merger integration
In particular, Logistics margins rose to 7.5% in Q3 FY15/16, up from 5.7% last year
Net profit rose 17.6% to $143.5 million Underlying net profit rose 1.2%, despite investments in transformation into a global eCommerce logistics company Declared quarterly dividend of 1.5 cents per share, up from 1.25 cents in the corresponding quarter last year
All figures for 9M FY2015/16, unless otherwise stated

3
9M FY2015/16: Delivered earnings growth despite investments in transformation
One-off gains on divestments
New acquisitions; eCommerce related growth
In tandem with business growth
Excluding one-off items
9M FY2015/16 P&L, $M
9M FY15/16 9M FY14/15 YoY % change
Revenue 834.0 670.9 +24.3%
Rental and property-related income 29.9 33.0 (9.5%)
Miscellaneous 46.2 8.8 @
Total expenses (737.1) (564.7) +30.5%
Operating profit 176.8 149.2 +18.5%
Share of associated companies & JVs 3.6 3.3 +9.6%
Income tax (30.4) (27.7) +9.7%
Net profit attributable to equity holders
143.5 122.1 +17.6%
Underlying net profit 121.8 120.4 +1.2%
4 February 2016 @ denotes changes exceed 300%
Redevelopment of SPC mall

4
Q3 FY2015/16: Operating profit up 7.2% Q3 FY2015/16 P&L, $M
Q3 FY15/16 Q3 FY14/15 YoY % change
Revenue 316.2 239.6 +32.0%
Rental and property-related income 9.3 10.9 (15.2%)
Miscellaneous 3.0 0.2 @
Total expenses (273.3) (198.1) +37.9%
Operating profit 54.6 50.9 +7.2%
Share of associated companies & JVs 0.2 1.5 (84.1%)
Income tax (10.8) (10.4) +4.0%
Net profit attributable to equity holders
43.5 43.2 +0.6%
Underlying net profit 43.9 43.6 +0.7%
4 February 2016 @ denotes changes exceed 300%

5
Strong revenue growth driven by eCommerce related activities and acquisitions
+39.5%
(1.2%) Cessation of hybrid mail revenue from the disposal of Novation Solutions and DataPost
+50.8%
9M FY2014/15 vs. 9M FY2015/16 Revenue performance, $M
-99.2 Inter-segment eliminations -102.4
Logistics
+24.3%
Retail & eCommerce
372.3
670.9
68.0
9M FY15/16
834.0
102.6
9M FY14/15
458.4
376.8
328.5 Rise in eCommerce Logistics activities, and contribution from acquisitions
Growth in SP eCommerce’s business; Consolidation of TradeGlobal acquisition2
1. Differences in total due to rounding 2. TradeGlobal acquisition was completed on 16 November 2015

6
Expenses rose in tandem with business growth
Mainly from higher warehousing capacity in line with increased business activities
In line with higher traffic volumes and increased business activities
Increase in interest expense on higher average borrowings
Total expenses 9M FY2015/16 breakdown, $M
9M FY15/16 9M FY14/15 YoY % change
Labour & related 220.8 191.8 +15.2%
Volume-related 375.7 265.8 +41.4%
Admin & others 102.5 76.5 +34.0%
Depreciation & amortisation 23.3 20.6 +13.5%
Selling 7.1 6.1 +15.7%
Finance expense 7.6 3.9 +93.8%
Total 737.1 564.7 +30.5%

7
Operating profit up 18.5% on strong growth in Logistics segment and one-off divestment gains
Driven by higher volumes from eCommerce related deliveries
9M FY2014/15 vs. 9M FY2015/16 Operating profit performance, $M
+18.5%
176.8
Logistics
Retail & eCommerce Others
112.7
26.1
32.5
9M FY14/15
107.1
16.6 7.2
18.3
149.2
5.5
9M FY15/16
Improved operating efficiency with integration of new subsidiaries into the Group’s eCommerce Logistics network
Reflects investments in front-end eCommerce capabilities
Divestment gain on sale of Novation Solutions and DataPost
Differences in total due to rounding

8
Healthy balance sheet & financial indicators
Higher receivables & higher settlements for trade payables
Steady operating cash flows
Dividends paid during the period. Last year, the Group received proceeds from share issuance to Alibaba
Due to acquisitions and capex for eCommerce Logistics Hub and SPC Mall
9M FY15/16 9M FY14/15
Operating Cash Flow (before working capital changes) 162.3 163.7
Changes in working capital (60.7) (15.9)
Cash flow used in investing activities (463.9) (199.9)
Cash flow (used in) / provided by financing activities (7.1) 215.7
Net increase / (decrease) in cash & cash equivalents (399.1) 129.7
Dec 2015
Mar 2015
Cash & cash equivalents at end of financial period 185.1 584.1
(Net debt) / Net cash position (176.0) 345.8
EBITDA to interest expense 36.4X 36.4X
Financial Indicators Dec 2015
Mar 2015
$M
Net debt to equity 11.8% Net cash
Due to decline in ending cash balance, with investments in acquisitions and capex
9
Agenda
The following presentation contains forward looking statements by the management of Singapore Post Limited (“SingPost”) relating to financial trends for future periods, compared to the results for previous periods.
Some of the statements contained in this presentation that are not historical facts are statements of future expectations with respect to the financial conditions, results of operations and businesses, and related plans
and objectives. Forward looking information is based on management's current views and assumptions including, but not limited to, prevailing economic and market conditions. These statements involve known and
unknown risks and uncertainties that could cause actual results, performance or events to differ materially from those in the statements as originally made. Such statements are not, and should not be construed as a
representation as to future performance of SingPost. In particular, such targets should not be regarded as a forecast or projection of future performance of SingPost. It should be noted that the actual performance of
SingPost may vary significantly from such statements.
“$” means Singapore dollars unless otherwise indicated.
eCommerce-Related Revenues
Segmental Results
Business Update
Overview & 9M FY15/16 Financials

10
eCommerce related revenues rose 53% year-on-year to S$278.1m Revenue 9M FY2013/14 – 9M FY2015/16, $M
161.5
489.2
627.8 670.9
181.7
9M FY13/14
466.2
9M FY15/16
eCommerce related 278.1
555.8
834.0
9M FY14/15
Non-eCommerce related
25.7% 27.1%
33.4%
Differences in total due to rounding
$105.9M
$55.1M
$117.1M
20%
Retail & eCommerce
38%
42%
Logistics
eCommerce related revenues
$278.1M
Group Revenue

11
Overseas revenue now 41.9% of Group revenue Group revenue footprint 9M FY2013/14 – 9M FY2015/16
670.9
9M FY14/15
Overseas
9M FY15/16
Domestic
349.1
834.0
484.8
174.6 208.2
462.7
9M FY13/14
627.8
453.3
31.0% 41.9%
27.8%
Differences in total due to rounding
Group Revenue

12
Agenda
The following presentation contains forward looking statements by the management of Singapore Post Limited (“SingPost”) relating to financial trends for future periods, compared to the results for previous periods.
Some of the statements contained in this presentation that are not historical facts are statements of future expectations with respect to the financial conditions, results of operations and businesses, and related plans
and objectives. Forward looking information is based on management's current views and assumptions including, but not limited to, prevailing economic and market conditions. These statements involve known and
unknown risks and uncertainties that could cause actual results, performance or events to differ materially from those in the statements as originally made. Such statements are not, and should not be construed as a
representation as to future performance of SingPost. In particular, such targets should not be regarded as a forecast or projection of future performance of SingPost. It should be noted that the actual performance of
SingPost may vary significantly from such statements.
“$” means Singapore dollars unless otherwise indicated.
eCommerce-Related Revenues
Segmental Results
Business Update
Overview & 9M FY15/16 Financials
13
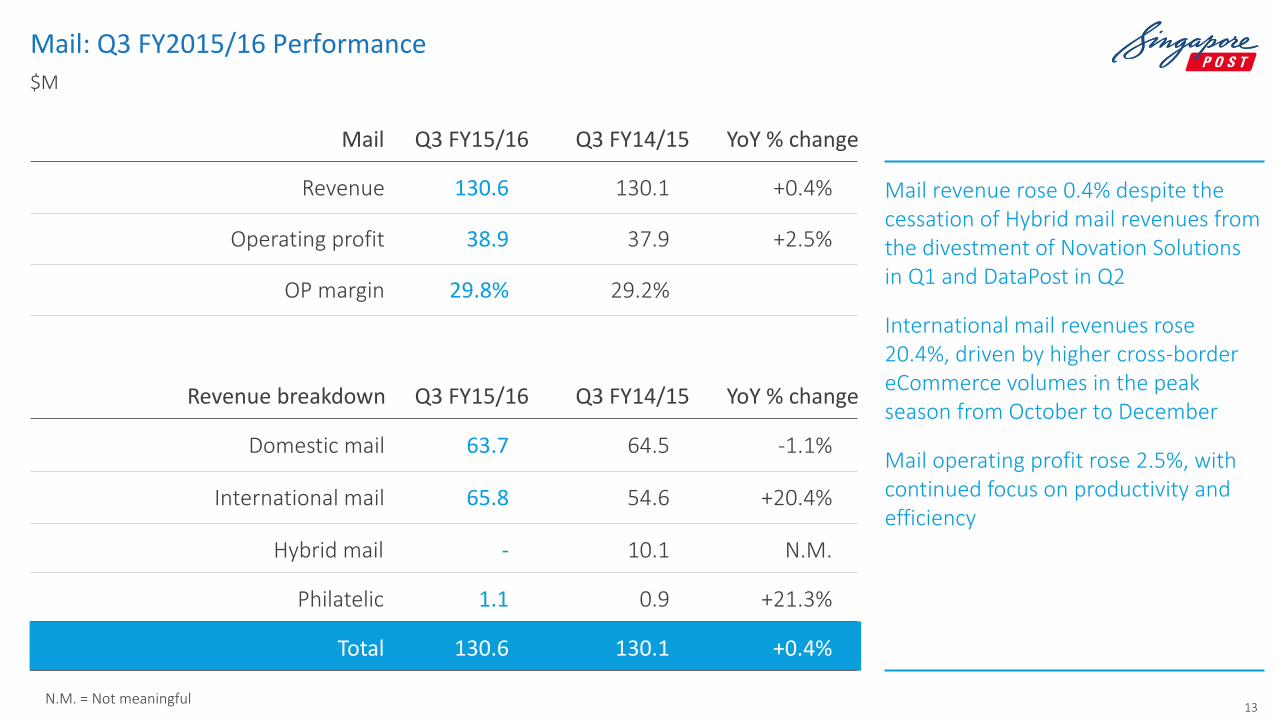
Mail: Q3 FY2015/16 Performance $M
Mail revenue rose 0.4% despite the cessation of Hybrid mail revenues from the divestment of Novation Solutions in Q1 and DataPost in Q2
International mail revenues rose 20.4%, driven by higher cross-border eCommerce volumes in the peak season from October to December
Mail operating profit rose 2.5%, with continued focus on productivity and efficiency
Q3 FY14/15 YoY % change
Revenue 130.6 130.1 +0.4%
Operating profit 38.9 37.9 +2.5%
OP margin 29.8% 29.2%
Q3 FY15/16
Domestic mail 63.7 64.5 -1.1%
International mail 65.8 54.6 +20.4%
Hybrid mail - 10.1 N.M.
Philatelic 1.1 0.9 +21.3%
YoY % change
Total 130.6 130.1 +0.4%
Q3 FY14/15 Q3 FY15/16 Revenue breakdown
N.M. = Not meaningful

14
Mail: 9M FY2015/16 Performance $M
YoY % change
Revenue 372.3 376.8 (1.2%)
Operating profit 112.7 107.1 5.2%
OP margin 30.3% 28.4%
9M FY14/15 9M FY15/16
Domestic mail 192.0 186.9 +2.7%
International mail 165.4 156.0 +6.0%
Hybrid mail 11.3 31.4 (64.1%)
Philatelic 3.6 2.5 +43.5%
YoY % change
Total 372.3 376.8 (1.2%)
Revenue breakdown 9M FY14/15 9M FY15/16

15
Logistics: Q3 FY2015/16 Performance $M
YoY % change
Revenue 162.2 122.1 +32.9%
Operating profit 12.1 6.9 +74.7%
OP margin 7.5% 5.7%
Q3 FY14/15 Q3 FY15/16
Quantium Solutions 74.9 48.6 +54.1%
Famous 59.2 48.4 +22.5%
Others 28.1 25.1 +12.0%
Total 162.2 122.1 +32.9%
YoY % change Revenue breakdown Q3 FY14/15 Q3 FY15/16
Strong revenue growth driven by higher contributions from eCommerce related activities and inclusion of new subsidiaries
Operating profit grew with margin rising to 7.5% on improved operating efficiency and synergies from post-merger integration
All 3 sub-segments recorded operating profit growth year-on-year, benefitting from increased eCommerce Logistics activities during the December quarter
Logistics

16
Logistics: 9M FY2015/16 Performance $M
YoY % change
Revenue 458.4 328.5 +39.5%
Operating profit 26.1 16.6 +57.6%
OP margin 5.7% 5.0%
9M FY14/15 9M FY15/16
Quantium Solutions 216.8 130.7 +65.8%
Famous 166.8 127.4 +30.9%
Others 74.8 70.3 +6.4%
Total 458.4 328.5 +39.5%
YoY % change Revenue breakdown 9M FY14/15 9M FY15/16
Logistics

17
Retail & eCommerce: 3Q FY2015/16 Performance $M
YoY % change
Revenue 54.5 22.9 +138.4%
Operating profit 4.2 1.7 +138.9%
OP margin 7.6% 7.6%
3Q FY14/15 3Q FY15/16
39.2 7.4 @
5.3 5.2 +0.5%
10.1 10.2 (1.6%)
54.5 22.9 +138.4%
YoY % change Revenue breakdown 3Q FY14/15 3Q FY15/16
eCommerce
Financial services
Agency services & retail products
Total
Revenue driven by consolidation of TradeGlobal financials from 14 Nov 2015, as well as growth in SP eCommerce business
SP eCommerce revenue rose 32.4%, as the Group continued to gain traction from its front-end eCommerce capabilities
TradeGlobal contributed S$29.4m in revenue and S$2.1m in operating profit during the quarter, boosted by the peak shopping season
9.8 7.4 +32.4% SP eCommerce
29.4 - N.M.
Retail & eCommerce
1. The acquisition of TradeGlobal was completed on 14 Nov 2015 2. @ denotes changes exceed 300%
TradeGlobal1

18
Retail & eCommerce: 9M FY2015/16 Performance $M
YoY % change
Revenue 102.6 68.0 +50.8%
Operating profit 5.5 7.2 (24.5%)
OP margin 5.3% 10.6%
9M FY14/15 9M FY15/16
55.1 19.3 +184.9%
16.2 17.7 (8.6%)
31.3 31.0 +0.9%
102.6 68.0 +50.8%
YoY % change Revenue breakdown 9M FY14/15 9M FY15/16
eCommerce
Financial services
Agency services & retail products
Total
25.7 19.3 +33.0% SP eCommerce
29.4 - N.M. TradeGlobal1
1. The acquisition of TradeGlobal was completed on 14 Nov 2015 2. @ denotes changes exceed 300%
Retail & eCommerce
19
Agenda
The following presentation contains forward looking statements by the management of Singapore Post Limited (“SingPost”) relating to financial trends for future periods, compared to the results for previous periods.
Some of the statements contained in this presentation that are not historical facts are statements of future expectations with respect to the financial conditions, results of operations and businesses, and related plans
and objectives. Forward looking information is based on management's current views and assumptions including, but not limited to, prevailing economic and market conditions. These statements involve known and
unknown risks and uncertainties that could cause actual results, performance or events to differ materially from those in the statements as originally made. Such statements are not, and should not be construed as a
representation as to future performance of SingPost. In particular, such targets should not be regarded as a forecast or projection of future performance of SingPost. It should be noted that the actual performance of
SingPost may vary significantly from such statements.
“$” means Singapore dollars unless otherwise indicated.
eCommerce-Related Revenues
Segmental Results
Business Update
Overview & 9M FY15/16 Financials

20
eCommerce Logistics Network Development
eCommerce Services
Warehousing & Fulfilment
Last Mile Delivery & Returns
Freight, Customs & Regulations Management
Marcelo Wesseler CEO, SP eCommerce
eCommerce
Sascha Hower Group COO, CEO (Quantium Solutions)
Logistics & Operations
Woo Keng Leong CEO, Postal Services
Postal
Goh Hui Ling Deputy CEO, International Mail
International mail
Mervyn Lim Group CFO, Deputy GCEO (Corporate Services)
Corporate Services, Post-merger integration

21
SP Commerce now offers global eCommerce logistics solutions with the integration of TradeGlobal and Jagged Peak
GROSS MERCHANDISE
VALUE
US$3b ANNUALLY
1. Pending completion of acquisition
1
SingPost Group Global footprint
OPERATING IN
18
END-TO-END SOLUTIONS TO
MORE THAN
100 FULFILMENT
CENTRES GLOBALLY
50+
GENERATING REVENUE & PROFIT
Synergies COUNTRIES
MONOBRANDS
ACROSS SINGPOST GROUP
22
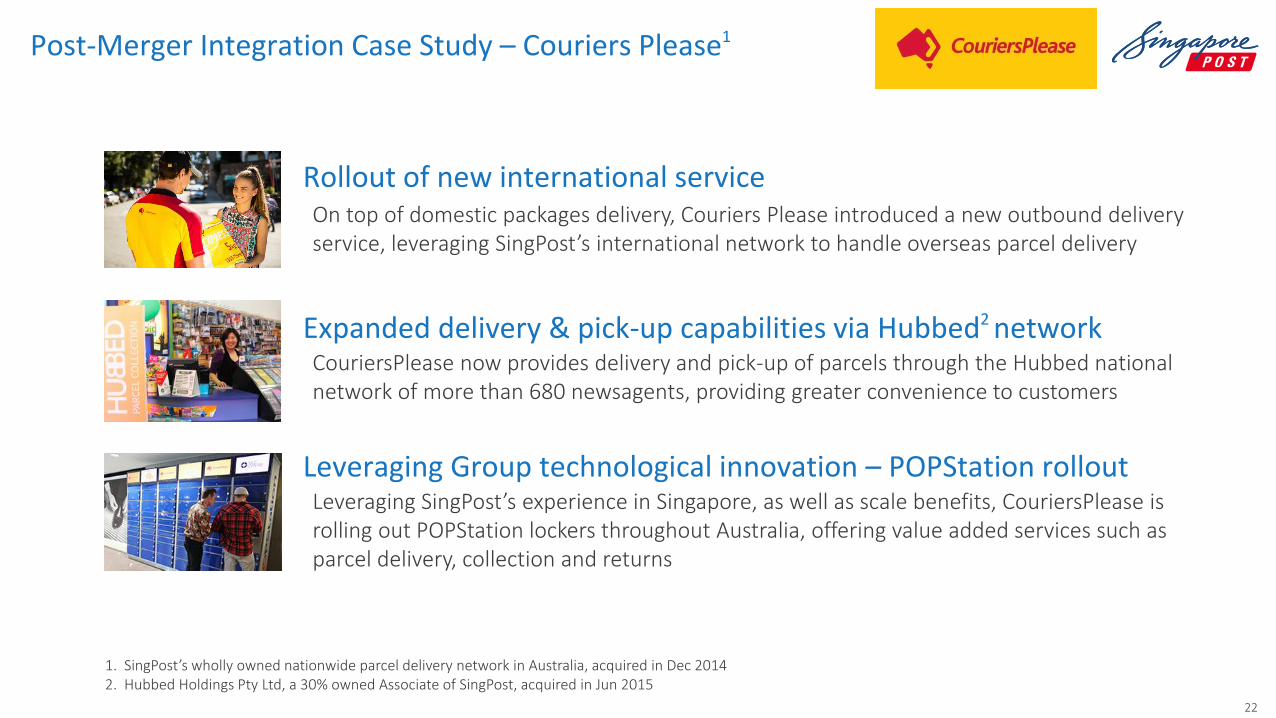
Post-Merger Integration Case Study – Couriers Please1
Rollout of new international service On top of domestic packages delivery, Couriers Please introduced a new outbound delivery service, leveraging SingPost’s international network to handle overseas parcel delivery
Expanded delivery & pick-up capabilities via Hubbed2 network CouriersPlease now provides delivery and pick-up of parcels through the Hubbed national network of more than 680 newsagents, providing greater convenience to customers
Leveraging SingPost’s experience in Singapore, as well as scale benefits, CouriersPlease is rolling out POPStation lockers throughout Australia, offering value added services such as parcel delivery, collection and returns
Leveraging Group technological innovation – POPStation rollout
1. SingPost’s wholly owned nationwide parcel delivery network in Australia, acquired in Dec 2014 2. Hubbed Holdings Pty Ltd, a 30% owned Associate of SingPost, acquired in Jun 2015
23
Summary
Good performance in Q3 and 9M FY2015/16 • Continued eCommerce growth momentum • Declining trend of transactional mail volumes but offset by increasing
international mail volumes Continued momentum in transformation initiatives Focusing on consolidation and post-merger integration for scale benefits and synergies

Thank you