q3 results feb 2015 - ryanair | investor relations · q3 results 10 dec 13 dec 14 traffic 18.3m...
TRANSCRIPT

© Ryanair 2014
Q3 Resul ts Feb 2015

© Ryanair 2014
Eur ope ’s Favour i te A i r l ine
� Europe’s Lowest Fares/Lowest Costs
� Europe’s No 1, Traffic – 100m
� Europe’s No 1, Coverage – 72 Bases
� Europe’s No 1, C’mer Service – Low Fares/On-time/Bags/Canx
– “Always Getting Better” Program
� Fwd Bookings, Ld Factors & Traffic Rising
� 380 new a/c order = growth to 160mpa by FY24
� 30th birthday of low fares in Europe
2
© Ryanair 2014
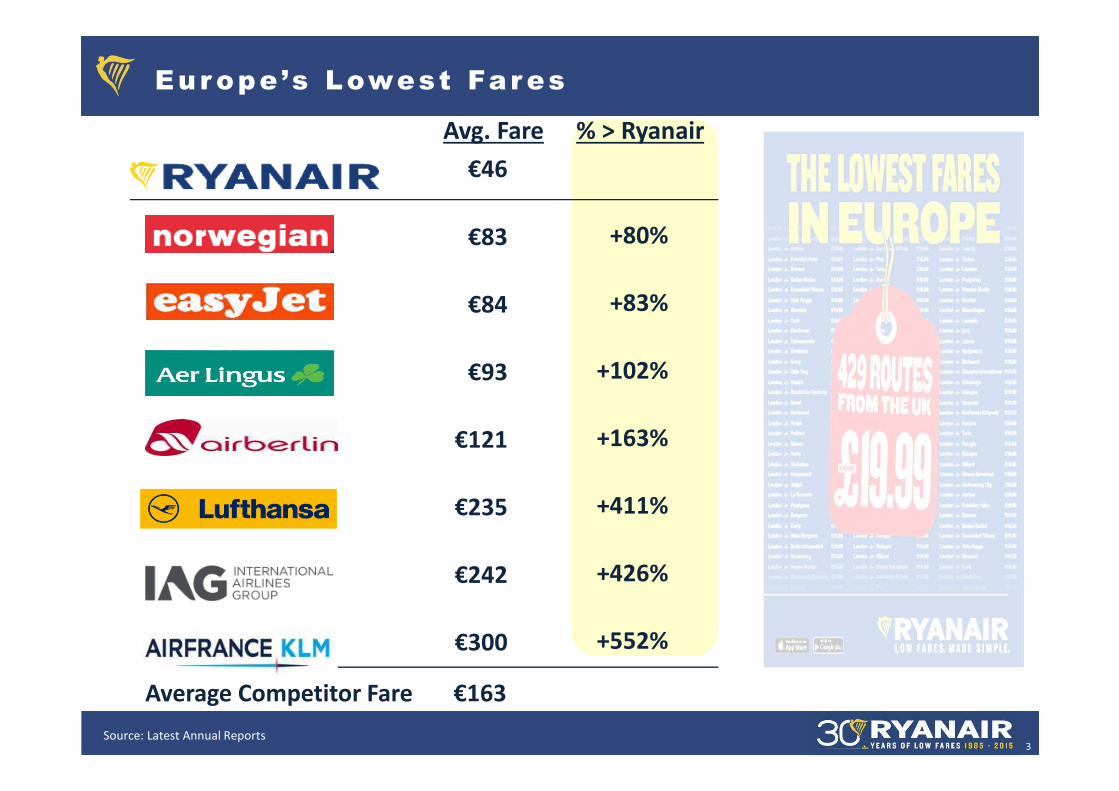
Eur ope ’s Lowest Far es
% > RyanairAvg. Fare
€46
€83
€84
€93
€121
€235
€242
€300
3
Average Competitor Fare €163
+80%
+83%
+102%
+163%
+411%
+426%
+552%
Source: Latest Annual Reports

© Ryanair 2014
RYA EZY NOR
Staff
Airport & hand
Route charges
Own’ship & maint.
S & M other
Total
% > Ryanair
€6
€8
€6
€7
€2
€29
€9
€21
€6
€8
€7
€52
+ 76%
€15
€14
€8
€21
€4
€62
+114%
€35
€8
€0
€16
€15
€74
+155%
LUV Spirit
€19
€6
€0
€19
€15
€59
+103%
€17
€27
€8
€29
€26
€107
+270%
AB1
4
Eur ope ’s Lowest Cost (Ex Fue l )
Source: Latest Annual Reports

© Ryanair 2014
� 72 bases
� 189 airports
� 30 countries
� 1,600+ routes
� 100m c’mers
� 300 x 737-800’s
� 380 x Boeings on order
Eur ope ’s No 1 Cover age
5

© Ryanair 2014
Eur ope ’s No 1 A i r l ine
UK (117)
Germany (112)
Spain (105)
Italy (85)
France (72)
Portugal (19)
Belgium (15)
Ireland (15)
Poland (15)
Morocco (12)
16%
4%
18%
25%
7%
17%
25%
46%
26%
12%
ShareCountry (Cap m)* No. 1 No. 2
BA
Iberia
easyJet
easyJet
Jetairfly
BA
Wizz
easyJet
No. 3
Air Berlin
Vueling
Alitalia
easyJet
SN Brussels
Aer Lingus
LOT
easyjet
Luft
AF- KLM
TAP
RAM
6Source: Cap Stats Departing Seats 2014

© Ryanair 2014
.
FY15 FY16 FY17
FY14
FY20FY18 FY19 FY21 FY22 FY23 FY24
57
62
81.7
62 63
160
90
7
Eur ope ’s No 1 For Tr a f f ic Gr owth
Source: Latest traffic stats for 12 mths to Mar14 and company forecasts
© Ryanair 2014
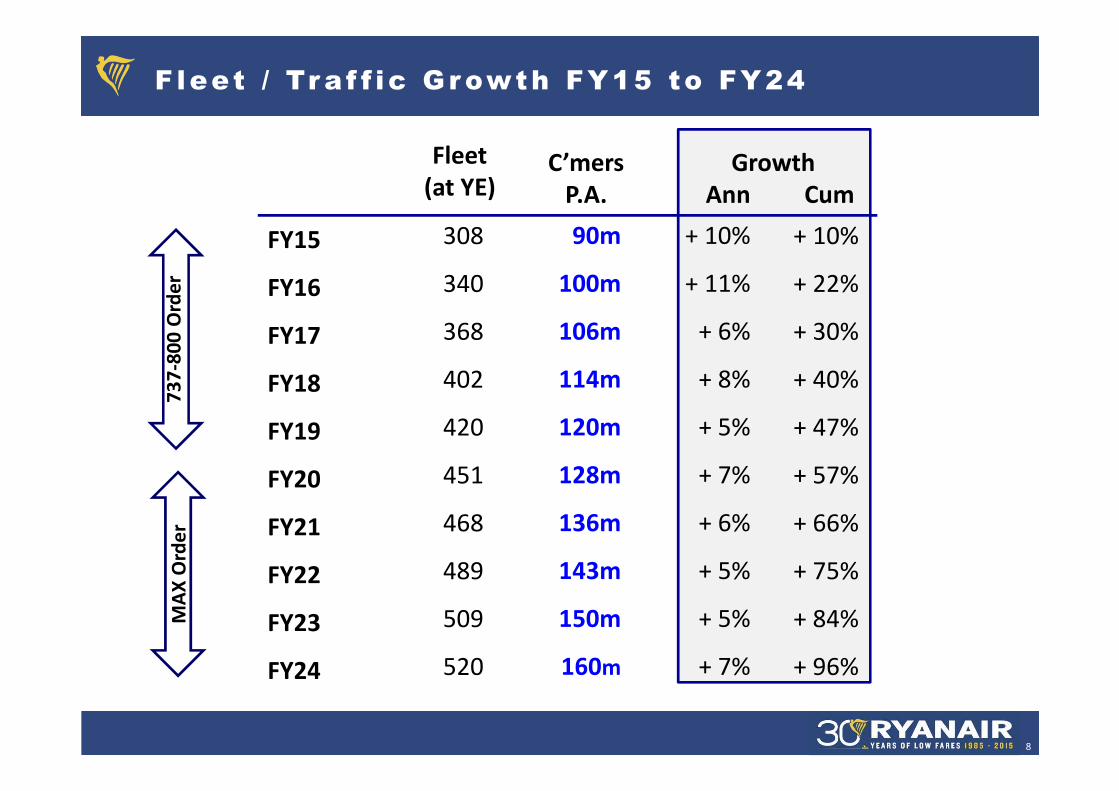
90m
100m
106m
114m
120m
128m
136m
143m
150m
160m
FY15
FY16
FY17
FY18
FY19
FY20
FY21
FY22
FY23
FY24
C’mers
P.A.7
37
-80
0 O
rde
rM
AX
Ord
er
Fleet
(at YE)
308
340
368
402
420
451
468
489
509
520
Growth
Ann Cum
+ 10%
+ 11%
+ 6%
+ 8%
+ 5%
+ 7%
+ 6%
+ 5%
+ 5%
+ 7%
+ 10%
+ 22%
+ 30%
+ 40%
+ 47%
+ 57%
+ 66%
+ 75%
+ 84%
+ 96%
F leet / Tr a f f ic Gr owth FY15 to FY24
8

© Ryanair 2014
� “Always Getting Better” programme
� Business Plus & Family Extra Service
� 90m customers
� Load factor (87% LF)
� 530,000+ flights, over 90% on-time
� First 5 of 380 new B737 aircraft delivered
� 8 new bases: Athens, Brussels, Cologne, Gdansk, Glasgow, Lisbon, Salonika & Warsaw
� 19 new airports incl. Copenhagen, Hamburg, Santorini & Stuttgart
2014 /15 – A Recor d Year for Ryanai r
9

© Ryanair 2014
Q3 Resul ts
10
Dec 13 Dec 14
Traffic 18.3m 20.8m +14%
Load Factor 82% 88% +6%pts
Avg. Fare (incl. bag) €39 €40 +2%
Rev. Per Pax €53 €54 +3%
Revenue €964m €1,132m +17%
Net Profit / (loss) (€35m) €49m +€84m
Net Margin (-4%) +4% +8%pts

© Ryanair 2014
Net Cash
€158m
Q3 Balance Sheet
11
(i) Includes €850m euro bond proceeds (June 2014)
Mar-14 Dec-14
€m €m
Aircraft (inc. dep) 5,570 6,385
Cash 3,242 4,121
Total 8,812 10,506
Liabilities 2,442 2,783
Debt 3,084 3,674
S/H funds 3,286 4,049
Total 8,812 10,506
Net Cash
€447m
(i)
(i)
© Ryanair 2014
Cur r ent Deve lopments
� “Always Getting Better” - drives stronger demand
� Competitors unable to match RYR pricing
� Fwd bookings, LF & traffic rising (Q4 +25%)
� FY traffic raised to 90m FY15 & 100m FY16
� Oil price falling – 90% hedge FY16; 35% FY17
� €520m spec div Feb
� €400m share buyback (Feb-Aug )
12
© Ryanair 2014
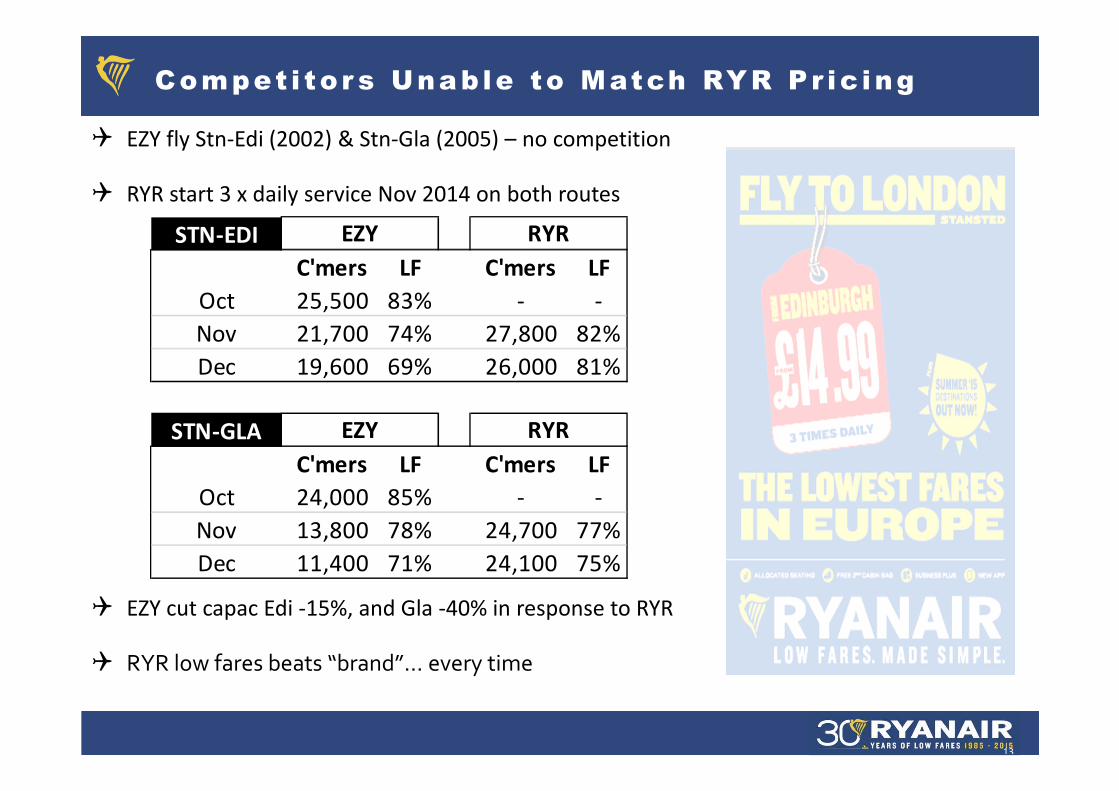
Compet i tor s Unable to Match RYR Pr ic ing
� EZY fly Stn-Edi (2002) & Stn-Gla (2005) – no competition
� RYR start 3 x daily service Nov 2014 on both routes
� EZY cut capac Edi -15%, and Gla -40% in response to RYR
� RYR low fares beats “brand”… every time
13
STN-EDI
C'mers LF C'mers LF
Oct 25,500 83% - -
Nov 21,700 74% 27,800 82%
Dec 19,600 69% 26,000 81%
STN-GLA
C'mers LF C'mers LF
Oct 24,000 85% - -
Nov 13,800 78% 24,700 77%
Dec 11,400 71% 24,100 75%
EZY RYR
EZY RYR

© Ryanair 2014
Fuel Hedging Update Feb 2015 – ( i n d i c a t i ve o n l y )
14
� Above figures are indicative only
� Assumes oil & US$ rates don’t change and flat sector length
� But oil prices and $ rates will vary so above savings indicative only
� RYR expects some/all fuel saving to be passed on in lower fares (“LF active / yield passive”)
Year
% cover Rpbl % cover $/€ Rpbl % redn Oil p/px p/px save
FY14 - $98 - $1.31 €75 - €24.65 -
FY15 90% $95 90% $1.34 €71 - 5% €22.21 €2.44
FY16 90% $92 90% $1.33 €69 - 2% €20.40 €1.81
FY17 35% $68 60% $1.21 €56 -19% €17.10 €3.30
Oil Currency Blended € price Oil per pax
© Ryanair 2014
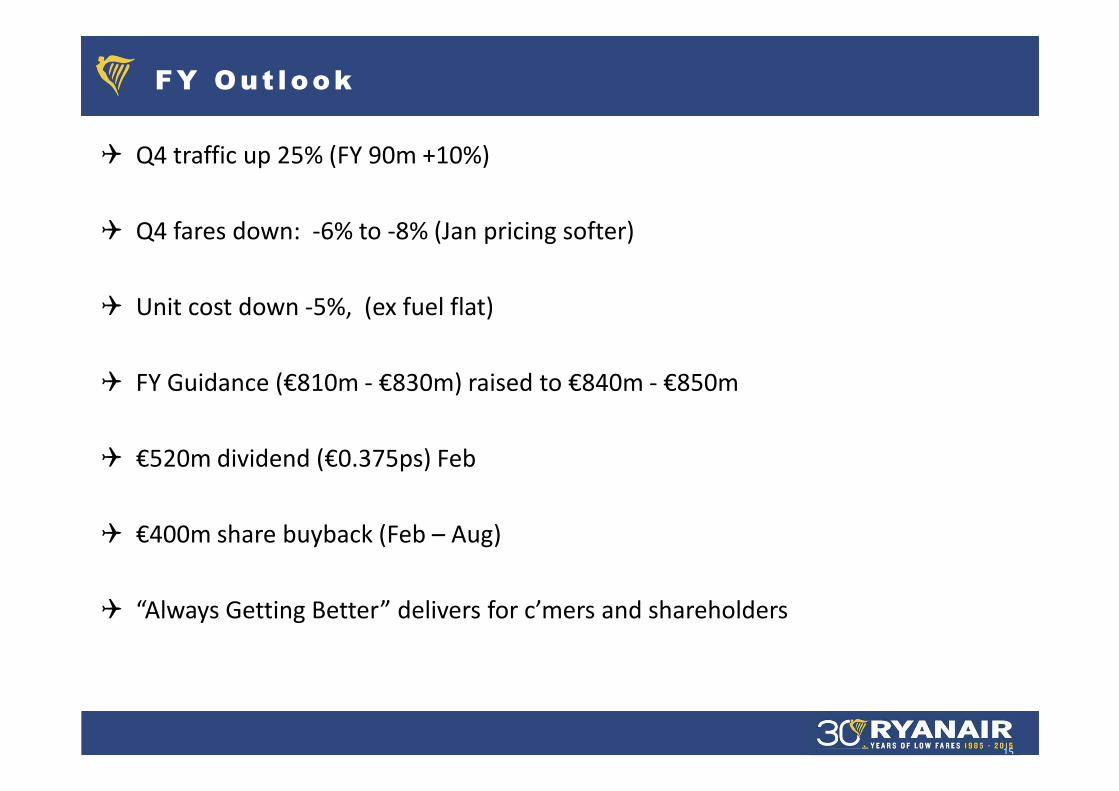
FY Out look
� Q4 traffic up 25% (FY 90m +10%)
� Q4 fares down: -6% to -8% (Jan pricing softer)
� Unit cost down -5%, (ex fuel flat)
� FY Guidance (€810m - €830m) raised to €840m - €850m
� €520m dividend (€0.375ps) Feb
� €400m share buyback (Feb – Aug)
� “Always Getting Better” delivers for c’mers and shareholders
15
© Ryanair 2014
Certain of the information included in this presentation is forward looking and is subject to important risks and uncertainties that could
cause actual results and developments to differ materially from those expressed in or implied by such forward-looking statements. By their
nature, forward-looking statements involve risk and uncertainty because they relate to events and depend upon future circumstances that
may or may not occur. A number of factors could cause actual results and developments to differ materially from those express or implied
by the forward-looking statements including those identified in this presentation and other factors discussed in our Annual Report on
Form 20-F filed with the SEC. It is not reasonably possible to itemise all of the many factors and specific events that could affect the
outlook and results of an airline operating in the European economy. Among the factors that are subject to change and could significantly
impact Ryanair’s expected results are the airline pricing environment, fuel costs, competition from new and existing carriers, market prices
for the replacement aircraft, costs associated with environmental, safety and security measures, actions of the Irish, U.K., European Union
(“EU”) and other governments and their respective regulatory agencies, fluctuations in currency exchange rates and interest rates, airport
access and charges, labour relations, the economic environment of the airline industry, the general economic environment in Ireland, the
UK and Continental Europe, the general willingness of passengers to travel and other economics, social and political factors and flight
interruptions caused by volcanic ash emissions or other atmospheric disruptions. These and other factors could adversely affect the
outcome and financial effects of events or developments referred to in this presentation on the Ryanair Group. Forward looking
statements contained in this presentation based on trends or activities should not be taken as a representation that such trends or
activities will continue in the future.
Except as may be required by the Market Abuse Rules of the Central Bank of Ireland, Listing Rules of the Irish Stock Exchange or by any
other rules of any applicable regulatory body or by law, the Company disclaims any obligation or undertaking to release publicly any
updates or revisions to any forward statements contained herein to reflect any changes in the Company’s expectations with regard to any
change in events, conditions or circumstances on which any such statement is based.
This presentation contains certain forward-looking statements as defined under US legislation. By their nature, such statements involve
uncertainty; as a consequence, actual results and developments may differ from those expressed in or implied by such statements
depending on a variety of factors including the specific factors identified in this presentation and other factors discussed in our Annual
Report on Form 20-F filed with the SEC
Discla imer
16