q4 & fy2019 resultsiclgroupv2.s3.amazonaws.com/.../2020/02/icl-q4-and-fy2019-prese… ·...
TRANSCRIPT
Q4 & FY2019 ResultsRaviv Zoller,
President & CEO

Disclaimer and Safe Harbor for Forward-Looking Statements
The information contained herein in this presentation or delivered or to be delivered to you during our presentation does not constitute an offer, expressed or implied, or arecommendation to do any transaction in Israel Chemicals Ltd. (“ICL” or “Company”) securities or in any securities of its affiliates or subsidiaries.
This presentation and/or other oral or written statements made by ICL during its presentation or from time to time, may contain forward-looking statements within the meaning ofthe United States Private Securities Litigation Reform Act of 1995 and other applicable securities laws. Whenever words such as "believe," "expect," "anticipate," "intend," "plan,""estimate", “predict” or similar expressions are used, the Company is making forward-looking statements. Such forward-looking statements may include, but are not limited to, thosethat discuss strategies, goals, financial outlooks, corporate initiatives, existing or new products, existing or new markets, operating efficiencies, or other non-historical matters.
Because such statements deal with future events and are based on ICL’s current expectations, they could be impacted or be subject to various risks and uncertainties, including thosediscussed in the "Risk Factors" section and elsewhere in our Annual Report on Form 20-F for the year ended December 31, 2018, and in subsequent filings with the Tel Aviv SecuritiesExchange (TASE) and/or the U.S. Securities and Exchange Commission (SEC). Therefore actual results, performance or achievements of the Company could differ materially from thosedescribed in or implied by such forward-looking statements. Although the Company believes that the expectations reflected in such forward-looking statements are based onreasonable assumptions, it can provide no assurance that expectations will be achieved. Except as otherwise required by law, ICL disclaims any intention or obligation to update orrevise any forward-looking statements, which speak only as of the date hereof, whether as a result of new information, future events or circumstances or otherwise. Readers, listenersand viewers are cautioned to consider these risks and uncertainties and to not place undue reliance on such information.
Certain market and/or industry data used in this presentation were obtained from internal estimates and studies, where appropriate, as well as from market research and publiclyavailable information. Such information may include data obtained from sources believed to be reliable, however ICL disclaims the accuracy and completeness of such informationwhich is not guaranteed. Internal estimates and studies, which we believe to be reliable, have not been independently verified. We cannot assure that such data is accurate orcomplete.
Included in this presentation are certain non-GAAP financial measures, such as sales excluding divested businesses, adjusted operating income, adjusted operating income excludingdivested businesses, adjusted EBITDA, adjusted EBITDA excluding divested businesses, adjusted net income, adjusted net income excluding divested businesses, adjusted EPSexcluding divested businesses and free cash flow, designed to complement the financial information presented in accordance with IFRS because management believes such measuresare useful to investors. These non-GAAP financial measures should be considered only as supplemental to, and not superior to, financial measures provided in accordance with IFRS.Please refer to our Q4 2019 press release for the quarter ended December 31, 2019 and the appendix to this presentation for a reconciliation of the non-GAAP financial measuresincluded in this presentation to the most directly comparable financial measures prepared in accordance with IFRS.
2
Important Legal Notes

3
Q4 & FY2019 Highlights(1)
✓ Successfully completed the Dead Sea production capacity upgrade in Q4 2019, resulting in a significant impact on results
✓ Q4 2019 results were also impacted by weak commodity markets as well as the absence of a potash supply contract to China during the quarter
✓ Value of ICL’s specialty businesses reflected in resilience of 2019 adjusted operating income amid the current weak commodity price environment
✓ Continued strong cash generation in Q4 2019 resulted in an annual increase of 60% in operating cash flow.
✓ Extended dividend policy of up to 50% of adjusted net income. Q4 2019 dividend of ~$0.02 per share.
Sales ($M)
2018 2019
760
2018 2019
620
992
2018 2019
Reported OI:
5,2715,556
Operating cash flow ($M)Reported/Adjusted operating income(2) ($M)
Q4/2018 Q4/2019
1,106
1,410 214
88
Q4/2018 Q4/2019
224 212
Q4/2018 Q4/2019
753
(1) 2019 financial information is unaudited. Our audit is ongoing and not complete, particularly our valuation of assets and impairment testing, and accordingly the information presented herein may be subject to change as our audit is complete(2) See reconciliation table in the Q4 2019 PR and the appendix for this presentation
1,519 756
Reported OI: 166 88

Adjusted operating income, adjusted EBITDA and operating cash flow for Q4 and FY2019 include a positive impact of the new IFRS 16 accounting standard. See slides 31 and 32 in the appendix to this presentation.(1) 2019 financial information is unaudited. Our audit is ongoing and not complete, particularly our valuation of assets and impairment testing, and accordingly the information presented herein may be subject to change as our audit is complete(2) Adjusted operating income and adjusted EBITDA are non-GAAP financial measures. See appendix to this presentation for reconciliation tables.(3) EPS and adjusted EPS are calculated as net income and adjusted net income, respectively, divided by weighted-average diluted number of ordinary shares outstanding. Adjusted net income is a non-GAAP measure. See appendix to this presentation for
reconciliation tables.(4) Free cash flow is a non-GAAP financial measure, and consists of cash flow from operations excluding additions to property plant and equipment. See appendix to this presentation for reconciliation tables.(5) Dividend per share related to the corresponding periods
4
Key Financial Metrics(1)
$ millions Q4 2019 Q4 2018 % change FY 2019 FY 2018 % change
Sales 1,106 1,410 (22%) 5,271 5,556 5%))
Operating income 88 166 (47%) 756 1,519 (50%)
Adjusted operating income(2) 88 214 (59%) 760 753 1%
Adjusted EBITDA(2) 201 322 (38%) 1,198 1,164 3%
Net income 48 82 (41%) 475 1,240 (62%)
Adjusted net income(3) 48 124 (61%) 479 477 0%
EPS(3) (Presented in US $) 0.04 0.06 (41%) 0.37 0.97 (62%)
Adjusted EPS(3)(Presented in US$) 0.04 0.10 (61%) 0.37 0.37 0%
Operating cash flow 212 224 5%)) 992 620 60%
Free cash flow(4) 57 47 21% 446 50 792%
Dividend per share(5)(Presented in US$) 0.02 0.05 (63%) 0.18 0.18 0%

5
✓Achieved record operating income and margin for 2019, while reaching strategic goals and positioning the business for growth going forward
✓Q4 2019 sales and OI decreased mainly due to lower bromine production and sales volumes as a result of the facility upgrade shutdown at the Dead Sea and the pending magnesium antidumping claim which lowered chlorine availability
✓Another strong quarter led to a record year for clear brine fluids sales
(1) Including inter-segment sales
Industrial Products Business Performance
$ millions
QUARTERLY RESULTS
SEGMENT PROFITSALES(1)
-8%
-14%
SEGMENT PROFIT
+2%
2018
ANNUAL RESULTS
2019
SALES(1)
+13%1,193
1,296
300338
1,2961,318
320293
7060
2018 2019 2018 2019 2018 2019

6(1) Including inter-segment sales
Potash Business Performance
✓Combination of production shutdown for upgrade at the Dead Sea and weak business environment led to significant profit margin erosion in Q4 2019
✓Facility upgrade is expected to enable a capacity increase of ~200 thousand tonnes per annum
✓Q4 2019 performance was impacted by no sales to China vs. 430 thousand tonnes sold in Q4 2018 and by an $18 decrease in average realized price for the period
✓2019 Polysulphate production grew by 80%, sales increased by over 50% and positive market acceptance is expected to drive sales momentum
✓Magnesium anti-dumping claim settled favorably
QUARTERLY RESULTS
SEGMENT PROFITSALES(1)
-41%
-84%
SEGMENT PROFIT
-8%
2018
ANNUAL RESULTS
2019
SALES(1)
-8%1,623
315289
515
302138
22
2018 2019 2018 2019 2018 2019
1,494
$ millions

7(1) Including inter-segment sales
Phosphate Solutions Business Performance
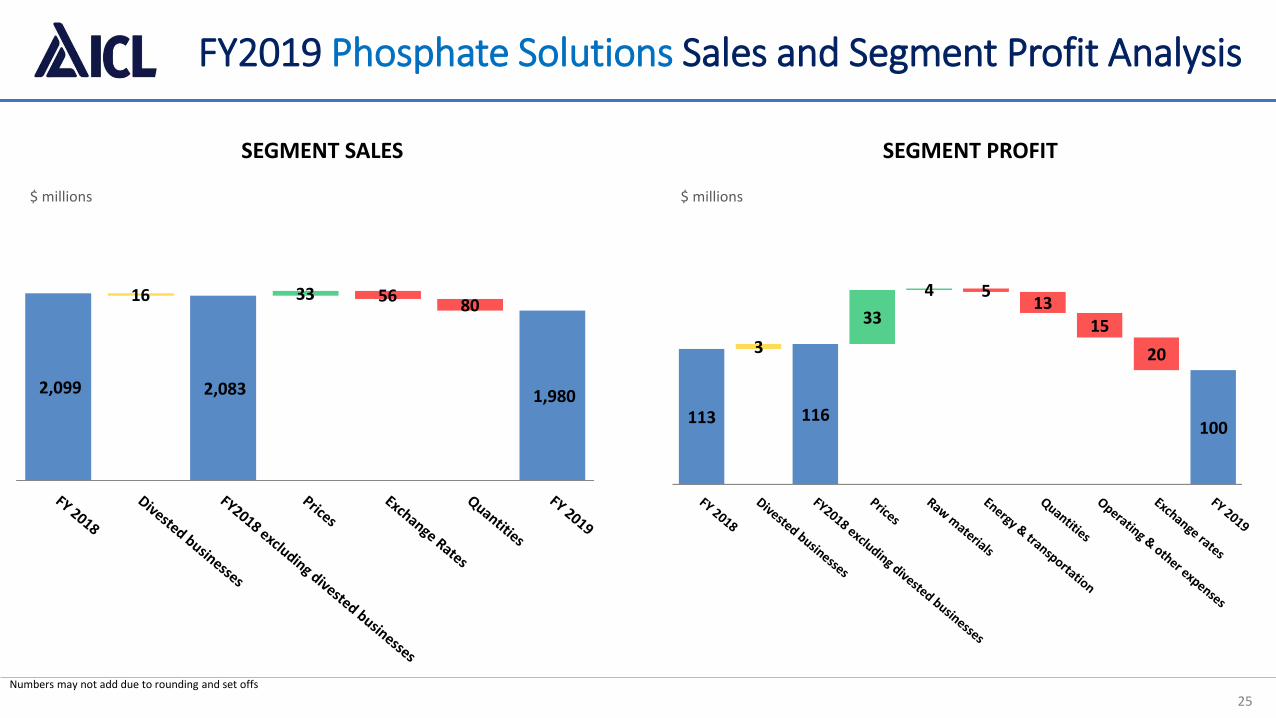
✓Strong performance in specialty phosphates overshadowed by accelerated weakness in commodities and by a negative exchange rate impact
✓The division’s resilience throughout 2019 attributable to ICL’s focus on specialties and the continued improvement of the YPH JV
✓Higher prices and reduced costs led to higher profit in phosphate specialties in Q4 2019, more than offsetting operating loss in phosphate commodities
✓New Food-grade Pure Phosphoric Acid plant in China and a breakthrough solution in plant-based Meat Alternative, position us to execute on our specialty-focused strategy
QUARTERLY RESULTS
SEGMENT PROFITSALES(1)SEGMENT PROFIT
2018
ANNUAL RESULTS
2019
SALES(1)
2018 2019 2018 2019 2018 2019
-6%
2,099
1,980
-12%
113
100
-16%
495
417
-93%
141
$ millions

8(1) Including inter-segment sales
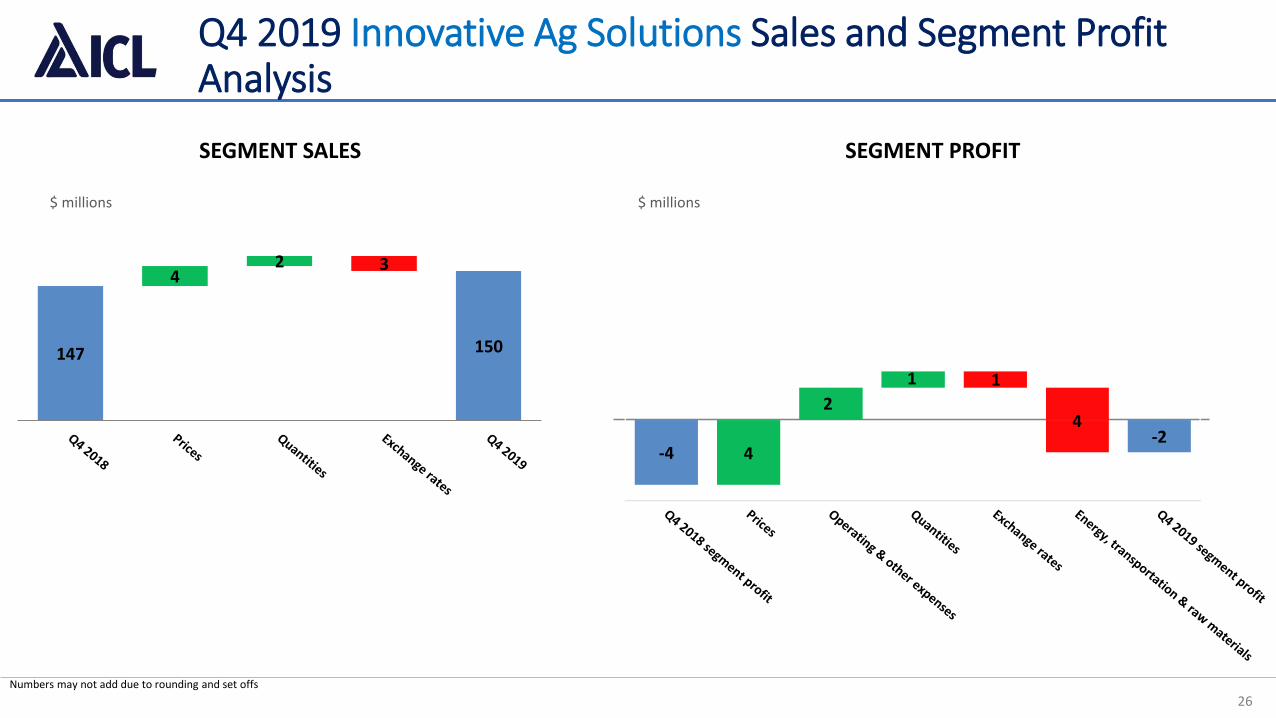
IAS Business Performance
✓Q4 2019 sales increase and reduced operating loss driven by higher prices and increased sales volume to the Turf and Ornamental Horticulture markets
✓2019 results were negatively impacted by a weather-related decrease in sales volumes and unfavorable exchange rates
✓The division continued to reduce lower-margin third party product sales and to focus on high growth markets
QUARTERLY RESULTS
SEGMENT PROFITSALES(1)SEGMENT PROFIT
2018
ANNUAL RESULTS
2019
SALES(1)
2018 2019 2018 2019 2018 2019
-3%
741717
-28%
2921
+2%
147
150
-4 -2
+50%
$ millions

506 507
750 760
2016 2017 2018 2019
9
Annual Growth Trend in Most Main Operational Parameters
Adjusted operating income, adjusted EBITDA and operating cash flow for 2019 include a positive impact of the new IFRS 16 accounting standard. See slides 31 and 32 in the appendix of this presentation.(1) Adjusted operating income excluding divested businesses and adjusted EBITDA excluding divested businesses are non-GAAP financial measures. See Appendix to this presentation for reconciliation tables.
$ millions
Adjusted operating incomeexcluding divested businesses(1)
Adjusted EBITDAexcluding divested businesses(1)
Operating cash flow
Adjusted operating income
Adjusted operating income margin%
Adjusted EBITDA
Adjusted EBITDA margin%
Operating cash flow
968 904
1,160 1,198
2016 2017 2018 2019
966
847
620
992
2016 2017 2018 2019
9.9% 19.0% 17.8% 21.1%14.4% 22.7%10.0% 13.6%

10
ICL’s Commitment to ESG
Interactive, innovative and comprehensive CSR web report
Ongoing initiatives focused on ten SDGs
Production sites ISO CERTIFICATIONS
Included in Bloomberg's Gender-Equality Index
‘Platinum+’ on the Ma’alaSustainability Index
Reducing Air Emissions
RECOGNITIONS
Sustainable Procurement
ICL’S INITIATIVES
Higher score in the 2019 BloombergESG disclosure ranking
IFA’s 2019 Industry Stewardship Champion Gold Medal
A- score for the 2019
CDP carbon report
Corporate governance score upgrade by Entropy
Kobi Altman, CFO
12
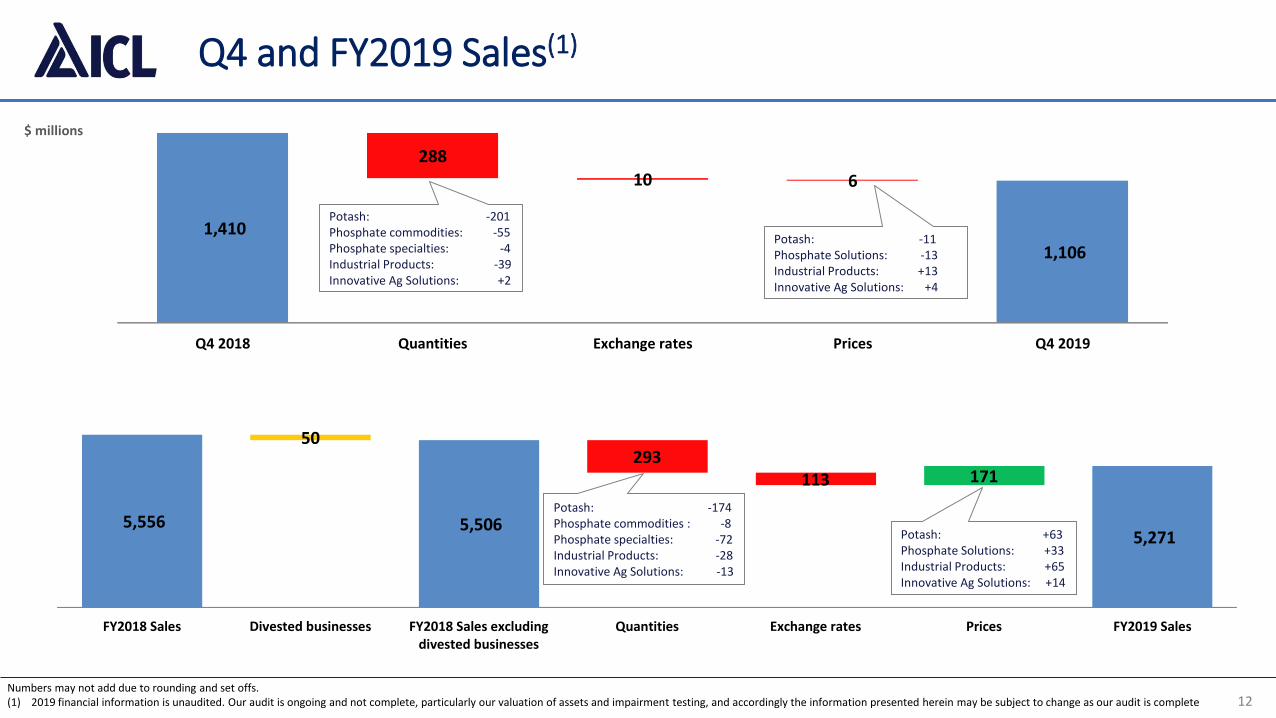
Q4 and FY2019 Sales(1)
Numbers may not add due to rounding and set offs.(1) 2019 financial information is unaudited. Our audit is ongoing and not complete, particularly our valuation of assets and impairment testing, and accordingly the information presented herein may be subject to change as our audit is complete
$ millions
Q4 2018 Quantities Exchange rates Prices Q4 2019
1,410
1,106
288
10 6
FY2018 Sales Divested businesses FY2018 Sales excludingdivested businesses
Quantities Exchange rates Prices FY2019 Sales
5,556 5,506 5,271
50293
113 171
Potash: -201Phosphate commodities: -55Phosphate specialties: -4Industrial Products: -39Innovative Ag Solutions: +2
Potash: -174Phosphate commodities : -8Phosphate specialties: -72Industrial Products: -28Innovative Ag Solutions: -13
Potash: -11Phosphate Solutions: -13Industrial Products: +13Innovative Ag Solutions: +4
Potash: +63Phosphate Solutions: +33Industrial Products: +65Innovative Ag Solutions: +14

13
Q4 and FY2019 Adjusted Operating Income(1)
Numbers may not add due to rounding and set offs. Adjusted operating income is a non-GAAP financial measure. See Q4 2019 PR and the appendix of this presentation for a reconciliation of adjusted operating income to operating income. (1) 2019 financial information is unaudited. Our audit is ongoing and not complete, particularly our valuation of assets and impairment testing, and accordingly the information presented herein may be subject to change as our audit is complete
$ millions
Q4 2018 Operatingincome
Adjustments tooperating income
Q4 2018 Adjustedoperating income
Quantities Exchange rates Product prices Raw material prices Energy, transportation& other operating
expenses
Q4 2019 Operatingincome
166 214
88
48
114
17 6 10 1
FY2018Operating
income
Divestedbusinesses &adjustments
FY2018Adjustedoperating
income
Quantities Exchange rates Operating &other expenses
Raw materialprices
Product prices Energy &transportation
FY2019Adjustedoperating
income
Adjustments tooperating
income
FY2019Operating
income
1,519
750 760 756
769
10633 32 4
17114 4
Potash: -90Phosphate Solutions: -6Industrial Products: -22Innovative Ag Solutions: +1
Potash: -80Phosphate Solutions: -13Industrial Products: -10Innovative Ag Solutions: -3

14
Foreign Exchange Rates Impact
Q4 2019 NIS EUR Other
Sales (1) 10 1
Expenses 17 (9) (1)
Operating income 16 1 -
Finance expenses (14) (1) (1)
Tax 2 - -
Net income 4 - (1)
Numbers may not add due to rounding
Total Q4 2019
10
7
17
(16)
2
3
FY2019 NIS EUR Other
Sales - 95 18
Expenses 2 (68) (14)
Operating income 2 27 4
Finance expenses (13) 4 (1)
Tax 14 - -
Net income 3 31 3
Total FY2019
113
(80)
33
(10)
14
37
3.20
3.30
3.40
3.50
3.60
3.70
3.80
Jan
-18
Feb
-18
Mar
-18
Ap
r-1
8
May
-18
Jun
-18
Jul-
18
Au
g-1
8
Sep
-18
Oct
-18
No
v-1
8
Dec
-18
Jan
-19
Feb
-19
Mar
-19
Ap
r-1
9
May
-19
Jun
-19
Jul-
19
Au
g-1
9
Sep
-19
Oct
-19
No
v-1
9
Dec
-19
USD\NIS
3.593.56
3.70
3.49
1.00
1.05
1.10
1.15
1.20
1.25
Jan
-18
Feb
-18
Mar
-18
Ap
r-1
8
May
-18
Jun
-18
Jul-
18
Au
g-1
8
Sep
-18
Oct
-18
No
v-1
8
Dec
-18
Jan
-19
Feb
-19
Mar
-19
Ap
r-1
9
May
-19
Jun
-19
Jul-
19
Au
g-1
9
Sep
-19
Oct
-19
No
v-1
9
Dec
-19
EUR\USD
1.11
1.14
1.18
1.12
Average exchange rates
2020 2021 2022 2023 2024 2025-30 2031-33 2034 2038
313
123 124
736
46
600
261
Loans & debentures Securitization 2020 G series bond Debt repayment
15
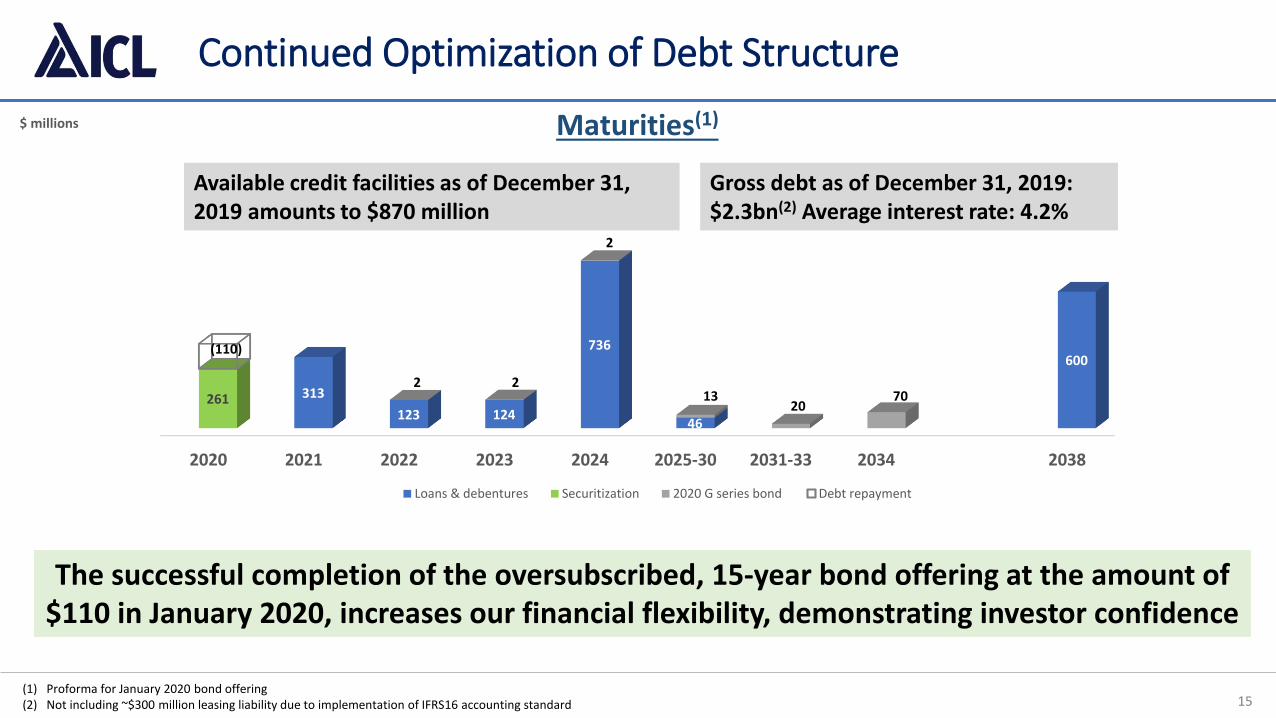
Continued Optimization of Debt Structure
Maturities(1)
Available credit facilities as of December 31, 2019 amounts to $870 million
Gross debt as of December 31, 2019: $2.3bn(2) Average interest rate: 4.2%
(1) Proforma for January 2020 bond offering(2) Not including ~$300 million leasing liability due to implementation of IFRS16 accounting standard
$ millions
The successful completion of the oversubscribed, 15-year bond offering at the amount of $110 in January 2020, increases our financial flexibility, demonstrating investor confidence
7020
13
2
22
(110)

16
2019 Achievements Positioning ICL for the Next Decade
ASSETS & OPERATIONS
LEGAL, COMPLIANCE & ESG
INNOVATING TO DRIVE RESULTS
✓ Dead Sea Potash facility upgrade to add ~5% expected production capacity
✓ Launch of the new terminal at the port of Barcelona
✓ Polysulphate production doubled, strong sales momentum
✓ Strategic LT bromine and bromine compounds supply agreements
✓ Fitch revised ICL’s credit rating outlook to ‘Positive’
✓ Completed a public offering of ~$110m debentures on the TASE
✓ Breakthrough in Meat Alternative solutions
✓ ICL’s digital Ag platform to leverage AWS capabilities
✓ Polysulphate compaction/granulation
✓ New bromine & phosphorus applications
✓ Promoting Industry 4.0 efficiencies
✓ Incubating early-stage technologies, novel materials and cost-effective processes
✓ Final agreement on past royalties
✓ All-time record safety results
✓ Abengoa compensation settlement
✓ Magnesium antidumping claim revoked
✓ Upgrade by Entropy
✓ New WPA plant in China
✓ Bonus derivative action settlement agreement
✓ Circular economy and waste recovery
✓ Employer of Choice commitment
✓ Creating an ESG vision

MARCHLONDON
18,2020
Please join us at the
Investor Day
MARCHNEW YORK CITY
19,2020 MARCH
TEL AVIV22,2020
ICL: Leadership, Innovation and Growth

THANK YOU

APPENDIX

20
Q4 2019 Industrial Products Sales and Segment Profit Analysis
SEGMENT SALES SEGMENT PROFIT
Numbers may not add due to rounding and set offs
$ millions $ millions
70 60
134 5
22
320293
13 139

21
FY2019 Industrial Products Sales and Segment Profit Analysis
SEGMENT SALES SEGMENT PROFIT
Numbers may not add due to rounding and set offs
$ millions $ millions
1,296 1,318
65
1528
300 338
6510 5 6 6

22
Q4 2019 Potash Sales and Segment Profit Analysis
SEGMENT SALES SEGMENT PROFIT$ millions $ millions
Numbers may not add due to rounding and set offs
515
302
201
11 1
138
22
3 511
13
90

23
FY2019 Potash Sales and Segment Profit Analysis
SEGMENT SALES SEGMENT PROFIT$ millions $ millions
Numbers may not add due to rounding and set offs
1,623 1,494
63 18174
315 289
6321 4
80
26

24
Q4 2019 Phosphate Solutions Sales and Segment Profit Analysis
SEGMENT SALES SEGMENT PROFIT
$ millions $ millions
Numbers may not add due to rounding and set offs
495
417
6 13
59
14
1
12
1 25
6
13
25
FY2019 Phosphate Solutions Sales and Segment Profit Analysis
SEGMENT SALES SEGMENT PROFIT
$ millions $ millions
Numbers may not add due to rounding and set offs
2,099 2,083 1,980
16 33 5680
113 116100
3
33
4 513
15
20
-4-2
147 150
42 3
26
Q4 2019 Innovative Ag Solutions Sales and Segment Profit Analysis
SEGMENT SALES SEGMENT PROFIT
$ millions $ millions
Numbers may not add due to rounding and set offs
4
1 1
2
4

27
FY2019 Innovative Ag Solutions Sales and Segment Profit Analysis
SEGMENT SALES SEGMENT PROFIT
$ millions $ millions
Numbers may not add due to rounding and set offs
741 717
14 13 25
2921
143 3
5
11

28
Finance Expenses
$ millions Q4 2019 Q4 2018
Liabilities(1) (including ~$300 million of LT leases in 2019)(2) 2,520 2,420
Interest rate 4.2% 4.1%
Interest expenses(3) 27 25
Interest capitalization (6) (4)
Interest expenses, net 21 20
Total hedging transactions, balance sheet revaluation & other (2) 44
Interest & exchange rate impact on long-term liabilities of leasing and employees(3) 6 (5)
Net financial expenses 25 59
Adjustments to finance expenses(4) - 7
Reported net financial expenses 25 66
1) Average liabilities during the given quarter2) Q4 2019 liabilities includes $300 million impact of IFRS 16, which are not included in the Q4 2018 debt figures3) Q4 2019 finance expenses include a $3 million increase in interest expenses and a $1 million exchange rate differences due to the implementation of IFRS 164) Q4 2018 adjustments relate to prior periods’ royalties interest
Numbers may not add due to rounding

29
Effective Tax Rate
$ millions Q4 19 Q4 18 FY 2019 FY 2018
Adjusted income before tax(1) 63 158 632 608
Normalized tax rate 22% 22% 21% 22%
Normalized tax expenses 14 33 131 138
Carryforward losses not recorded for tax purposes 4 8 8 15
Exchange rate impact and other items (3) (9) 8 (17)
Adjusted tax expenses 15 32 147 136
Adjusted Effective tax rate 24% 20% 23% 22%
(1) See calculation in the appendix of this presentation
Reported income before tax 63 103 628 1,364
Reported provision for income taxes 15 19 147 129

30
Strong Financial Position Support Strategy Execution
(1) Net debt to adjusted EBITDA calculated as short term credit + long term debt & debentures – cash & cash equivalents – short term investments & deposits, divided by last twelve months adjusted EBITDA. Adjusted EBITDA is a non-GAAP measure. See reconciliation table in the Q4 2019 PR and the appendix for this presentation
Net Debt/EBITDA ratio(1)
2.52.4
3.1
2.9
1.92.0
Q4 2014 Q4 2015 Q4 2016 Q4 2017 Q4 2018 Q4 2019
31
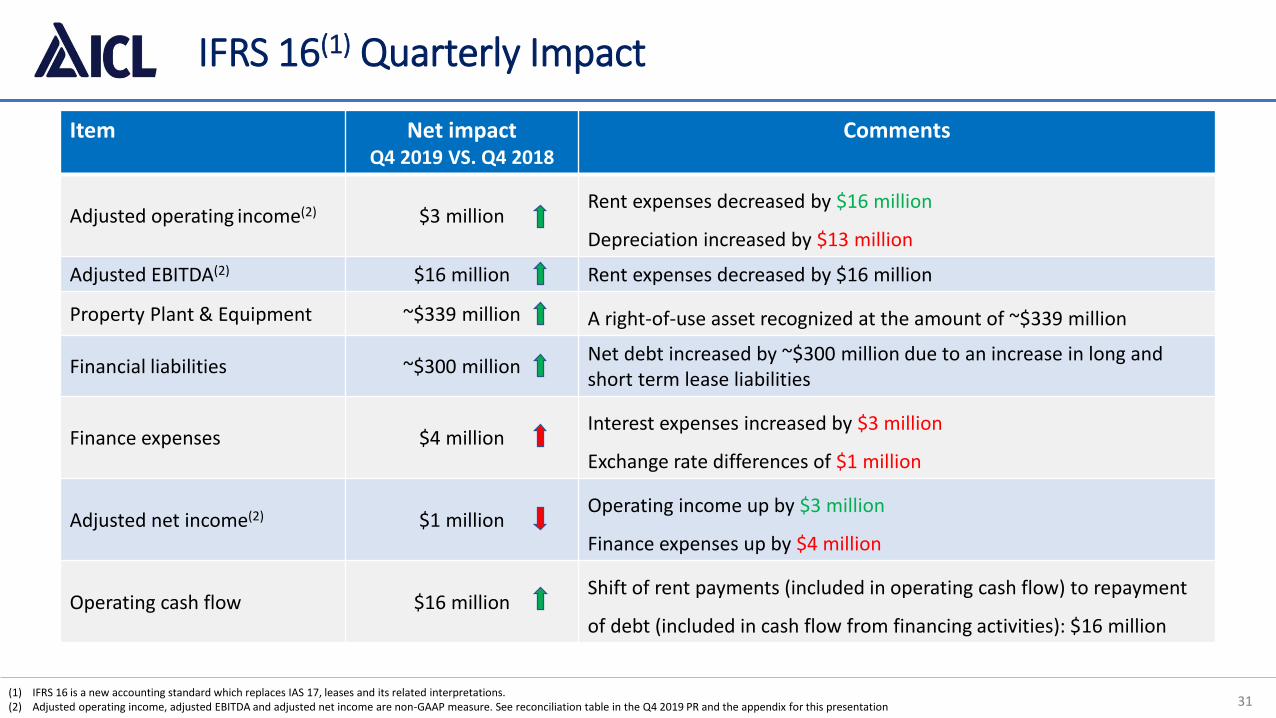
IFRS 16(1) Quarterly Impact
Item Net impactQ4 2019 VS. Q4 2018
Comments
Adjusted operating income(2) $3 millionRent expenses decreased by $16 million
Depreciation increased by $13 million
Adjusted EBITDA(2) $16 million Rent expenses decreased by $16 million
Property Plant & Equipment ~$339 million A right-of-use asset recognized at the amount of ~$339 million
Financial liabilities ~$300 millionNet debt increased by ~$300 million due to an increase in long and short term lease liabilities
Finance expenses $4 millionInterest expenses increased by $3 million
Exchange rate differences of $1 million
Adjusted net income(2) $1 million Operating income up by $3 million
Finance expenses up by $4 million
Operating cash flow $16 million Shift of rent payments (included in operating cash flow) to repayment
of debt (included in cash flow from financing activities): $16 million
(1) IFRS 16 is a new accounting standard which replaces IAS 17, leases and its related interpretations.(2) Adjusted operating income, adjusted EBITDA and adjusted net income are non-GAAP measure. See reconciliation table in the Q4 2019 PR and the appendix for this presentation

32
IFRS 16(1) Annual Impact
Item Net impact2019 VS 2018
Comments
Adjusted operating income(2) $10 millionRent expenses decreased by $61 million
Depreciation increased by $51 million
Adjusted EBITDA(2) $61 million Rent expenses decreased by $61 million
Property Plant & Equipment ~$339 million A right-of-use asset recognized at the amount of ~$339 million
Financial liabilities ~$300 millionNet debt increased by ~$300 million due to an increase in long and short term lease liabilities
Finance expenses $22 millionInterest expenses increased by $13 million
Exchange rate differences of $9 million
Adjusted net income(2) $12 million Operating income up by $10 million
Finance expenses up by $22 million
Operating cash flow $53 million Shift of rent payments (included in operating cash flow) to repayment
of debt (included in cash flow from financing activities): $61 million
(1) IFRS 16 is a new accounting standard which replaces IAS 17, leases and its related interpretations.(2) Adjusted operating income, adjusted EBITDA and adjusted net income are non-GAAP measure. See reconciliation table in the Q4 2019 PR and the appendix for this presentation

33
Additional Data: Segment Profit Before and After G&A Expenses
* Divested businesses incl. Fire Safety and P2S5. In 2018 also including RovitaNumbers may not add due to rounding
Starting from the first quarter of 2019, ICL’s management has measured, and accordingly has presented in its reports, the results of its business divisions (operating segments) after allocation of general and administrative (G&A) expenses per each division. The purpose of the table below is to assist investors and analysts in comparing ICL's performance in prior periods to ICL's results starting in the first quarter of 2019. It should be noted that the allocation of G&A expenses with respect to comparison periods was made for convenience purposes only, and changes may occur in the allocation methodology in future periods.
Operating Income Q1 2017 Q2 2017 Q3 2017 Q4 2017 FY 2017 Q1 2018 Q2 2018 Q3 2018 Q4 2018 FY 2018 Q1 2019 Q2 2019 Q3 2019 Q4 2019 FY 2019
Industrial Products (Bromine)
Profit before allocated G&A expenses 77 76 77 73 303 78 94 95 83 350 108 105 99 72 384
Allocated G&A expenses (income) 11 17 14 14 56 12 13 12 13 50 11 12 11 12 46
Segment profit 66 59 63 59 247 66 81 83 70 300 97 93 88 60 338
Potash
Profit before allocated G&A expenses 37 61 65 119 282 62 76 97 158 393 98 123 99 41 361
Allocated G&A expenses (income) 21 21 21 21 84 19 20 19 20 78 19 18 16 19 72
Segment profit 16 40 44 98 198 43 56 78 138 315 79 105 83 22 289
Phosphate Solutions
Profit before allocated G&A expenses 37 37 52 23 149 52 55 63 38 208 63 58 57 28 206
Allocated G&A expenses (income) 26 22 24 24 96 24 24 23 24 95 28 26 25 27 106
Segment profit 11 15 28 (1) 53 28 31 40 14 113 35 32 32 1 100
Innovative Ag Solutions
Profit before allocated G&A expenses 20 19 9 8 56 25 23 7 2 57 21 21 6 6 54
Allocated G&A expenses (income) 7 6 7 7 27 7 7 8 6 28 8 9 8 8 33
Segment profit 13 13 2 1 29 18 16 (1) (4) 29 13 12 (2) (2) 21
Other & elimination
Profit before allocated G&A expenses 2 - (4) (3) (5) (2) 4 2 (5) (1) 14 (12) 2 5 9
Allocated G&A expenses (income) 1 (1) (6) 4 (2) 8 (2) 1 (1) 6 (3) - 2 (2) (3)
Segment profit 1 1 2 (7) (3) (10) 6 1 (4) (7) 17 (12) - 7 12
ICL
Total adjusted operating income before G&A expenses 173 193 199 220 785 215 252 264 276 1,007 304 295 263 152 1,014
G&A expenses 66 65 60 70 261 70 62 63 62 257 63 65 62 64 254
Adjusted operating income - excl. divestments 107 128 139 150 524 146 190 200 214 750 241 230 201 88 760
Divested businesses' contribution* 9 25 76 18 128 5 (2) - - 3 - - - - -
Adjusted operating income 116 153 215 168 652 151 188 200 214 753 241 230 201 88 760

34
Reconciliation Tables (1/2)
Calculation of adjusted income before tax Q4 19 Q4 18 FY2019 FY2018
Adjusted operating income(1) 88 214 760 753
Finance expenses (25) (66) (129) (158)
Share in earnings (losses) of equity-accounted investees and adjustments to financial expenses
- 10 1 13
Adjusted income before tax 63 158 632 608
(1) See detailed reconciliation table in the Q4 2019 PR(2) Includes $27 million proceeds from sale of Property Plant and EquipmentNumbers may not add due to rounding
Calculation of adjusted net income to net income Q4 2019 Q4 2018 FY2019 FY2018
Net income attributable to the shareholders of the Company 48 82 475 1,240
Total adjustments to operating income(1) - 48 4 (766)
Adjustments to finance expenses(1) - 7 - 10
Total tax impact of the above operating income & finance expenses adjustments(1) - (13) - (7)
Total adjusted net income - shareholders of the Company 48 124 479 477
Weighted-average diluted number of ordinary shares outstanding 1,281,811 1,283,152 1,280,638 1,279,781
Adjusted EPS excluding divested businesses (US dollar) 0.04 0.10 0.37 0.37
$ millions
Calculation free cash flow Q4 19 Q4 18 FY2019 FY2018
Cash flow from operations 212 224 992 620
Additions to property plant and equipment and dividends from equity-accounted investees (155) (177) (546)(2) (570)
Free cash flow 57 47 446 50

35
Reconciliation Tables (2/2)
(1) See detailed reconciliation table “Adjustments to reported operating and net income (Non-GAAP)” in the Q4 2019 PRNumbers may not add due to rounding
Calculation of adjusted EBITDA and adjusted EBITDA excluding divested businesses to net income FY2019 FY2018 FY2017 FY2016
Net income attributable to the shareholders of the Company 475 1,240 364 (122)
Depreciation and Amortization 443 403 390 401
Financing expenses, net 129 158 124 132
Taxes on income 147 129 158 55
Adjustments(1) 4 (766) 23 585
Adjusted EBITDA 1,198 1,164 1,059 1,051
Contribution from divested businesses - (4) (155) (83)
Adjusted EBITDA excluding divested businesses 1,198 1,160 904 968
Calculation of adjusted operating income and adjusted operating income excluding divested businesses
FY2019 FY2018 FY2017 FY2016
Operating income 756 1,519 629 (3)
Capital gain - (841) (54) 1
Impairment loss (reversal) (10) 19 32 489
Provision for early retirement and dismissal of employees - 7 20 39
Provision for legal claims 7 31 25 5
Provision for prior periods waste removal and site closure costs 7 18 - 51
Total adjustments(1) 4 (766) 23 585
Adjusted operating income 760 753 652 582
Divested businesses’ profit - (3) (145) (76)
Adjusted operating income excluding divested businesses 760 750 507 506
$ millions

36
Non-GAAP Financial Measures
We disclose in this Quarterly Report non-IFRS financial measures titled sales excluding divested businesses, adjusted operating income, adjusted operating income excluding divested businesses, adjusted net income
attributable to the Company’s shareholders excluding divested businesses, adjusted EBITDA excluding divested businesses, adjusted EPS excluding divested businesses and free cash flow. Our management uses sales
excluding divested businesses, adjusted operating income, adjusted operating income excluding divested businesses, adjusted net income attributable to the Company’s shareholders excluding divested businesses and
adjusted EBITDA excluding divested businesses to facilitate operating performance comparisons from period to period and present free cash flow to facilitate a review of our cash flows in periods. We calculate our sales
excluding divested businesses by adjusting our sales to exclude results of the divested Fire Safety and Oil Additives business (divested in Q1 2018) and Rovita business (divested in Q3 2018). We calculate our adjusted
operating income by adjusting our operating income to add certain items, as set forth above and in the reconciliation table “Adjustments to reported operating and net income”. Certain of these items may recur. We
calculate our adjusted net income attributable to the Company’s shareholders by adjusting our adjusted operating income excluding divested businesses, net income attributable to the Company’s shareholders to add
certain items, as set forth above and in the reconciliation table “Adjustments to reported operating and net income (Non-GAAP)” in the accompanying press release, excluding the total tax impact of such adjustments
and adjustments attributable to the non-controlling interests. We calculate our adjusted operating income excluding divested businesses by excluding the results of the divested Fire Safety and Oil Additives business
(divested in Q1 2018) and Rovita business (divested in Q3 2018). We calculate our adjusted EBITDA by adding back to the net income attributable to the Company’s shareholders the depreciation and amortization,
financing expenses, net, taxes on income and the items presented in the reconciliation table “Adjustments to reported operating and net income” in the accompanying press release which were adjusted for in
calculating the adjusted operating income excluding divested businesses and adjusted net income attributable to the Company’s shareholders. Adjusted EPS excluding divested businesses is calculated as adjusted net
income excluding divested businesses divided by weighted-average diluted number of ordinary shares outstanding as provided in the reconciliation table under “Calculation of Adjusted EPS”. We calculate our free cash
flow as our cash flows from operating activities net of our purchase of property, plant, equipment and intangible assets, and adding Proceeds from sale of property, plant and equipment and dividends from equity-
accounted investees during such period as presented in the reconciliation table under “Calculation of free cash flow”. You should not view sales excluding divested businesses, adjusted operating income, adjusted
operating income excluding divested businesses, adjusted net income attributable to the Company’s shareholders excluding divested businesses, adjusted EPS excluding divested businesses or adjusted EBITDA excluding
divested businesses as a substitute for operating income or net income attributable to the Company’s shareholders determined in accordance with IFRS, adjusted EPS excluding divested businesses as a substitute for EPS
or free cash flow as a substitute for sales, cash flows from operating activities and cash flows used in investing activities, and you should note that our definitions of adjusted operating income, adjusted net income
attributable to the Company’s shareholders, adjusted EBITDA excluding divested businesses and free cash flow may differ from those used by other companies. However, we believe sales excluding divested businesses,
adjusted operating income, adjusted operating income excluding divested businesses, adjusted net income attributable to the Company’s shareholders excluding divested businesses, adjusted EBITDA excluding divested
businesses, adjusted EPS excluding divested businesses and free cash flow provide useful information to both management and investors by excluding certain expenses that management believes are not indicative of
our ongoing operations , in particular the divested Fire Safety and Oil Additives business (divested in Q1 2018) and the Rovita business (divested in July 2018), as we no longer own these businesses. In particular for free
cash flow, we adjust our Capex to include any Proceeds from sale of property, plant and equipment because we believe such amounts offset the impact of our purchase of property, plant, equipment and intangible
assets. We further adjust free cash flow to add Dividends from equity-accounted investees because receipt of such dividends affects our residual cash flow. Free cash flow does not reflect adjustment for additional items
that may impact our residual cash flow for discretionary expenditures, such as adjustments for charges relating to acquisitions, servicing debt obligations, changes in our deposit account balances that relate to our
investing activities and other non-discretionary expenditures. Our management uses these non-IFRS measures to evaluate the Company's business strategies and management's performance. We believe that these non-
IFRS measures provide useful information to investors because they improve the comparability of the financial results between periods and provide for greater transparency of key measures used to evaluate our
performance.
We present a discussion in the period-to-period comparisons of the primary drivers of changes in the company’s results of operations. This discussion is based in part on management’s best estimates of the impact of
the main trends in its businesses. We have based the following discussion on our financial statements. You should read the following discussion together with our financial statements.
