,qgld·v 8uedq :dvwh 3uriloh - cpcb enviscpcbenvis.nic.in/envis_newsletter/urban waste...
TRANSCRIPT


Newsletter, 2010
Dear Readers,
The high growth rate of our economy, an expanding vast domestic market catering to the needs of gen-next, an active population withincreasing disposable incomes and rapid obsolescence ofconsumer products are the main drivers for improved lifestyles strangely, these factors are increase in the quantum of URBAN WASTE being generated across the country. The most commonly known waste is the MSW which is growing to be even a greater challenge due to several clusters of vertical high rise buildings coming up at the fringe of
affects thequantum of other wastes being generated viz; e-wastes, plasticwastes, packaging wastes, mercury bearing wastes from lighting in homes & commercial places besides construction & demolition debris. The core issue for efficient waste management is to ensure proper segregation of waste at SOURCE.
commonpromoted and accepted too, co-processing by either using it as a co-fuel or co raw material insome manufacturing processes. This has led to rise of public private participation (PPP) in waste management which has
big boon in disguise particularly for regulatory agencies for whom monitoring compliance of a common treatment facility is far simpler than having to monitor individual units generating
Industrial wastes in an urban scenario needs addressal separately.However, it is worthwhile to share that CPCB defines waste as Worthy augemented system for transfer of energy
The wastes have an impact on air, water and land hence this
deserves to be shared as an ENVIS Newsletter. Your valuablefeedback is requested on the TV program,a joint venture with Doordarshan launched on the occasion ofWorld Environment Day on June 5th, 2010.
December, 2010 Chairman, CPCB
FOREWORD
Waste Type
Municipal Solid Waste (MSW) 1
Mercury bearing wastes -
Fluorescent Lamp Sector & Medical
Wastes
3
Packaging wastes 5
Waste paper 6
Plastic Wastes 7
Construction Debris 8
Battery wastes 10
Waste tyres 12
Biomedical Wastes 13
Electronic Wastes 14
CONTENTS
Vertical high rise clusters a challange
to

Urban Waste Profile
1 | P a g eNewsletter
SOME FACTS
Municipal Solid Waste
generates about 48 million tonnes per annum - Delhi
generates: about 7000-8000 tonne per day, the national MSW generation
per capita ranges between : 200 600 grams per capita /day. Municipal
waste comprises of around 40 per cent compostable and around 15-
20 per cent re-
Table 1.1: MSW was carried out jointly in 2004-05 by CPCB with NEERI
Items < 1 lac8 towns
1-5 lacs11 towns
5-10 lacs16 towns
10-20 lacs11 towns
>20 lacs13 towns
Avg. %
%compost-able 29.60-52.02 34.30-62.54 35.49-72.96 39.52-54.54 40.81-62.44 51.28
% recycle-able 13.97-27.67 13.20-36.64 11.20-24.20 10.96-23.31 11.21-22.43 23.8
C/N ratio 17.68-35.58 14.08-36.86 17.71-52.56 18.58-52.17 21.41-43.29 33.32
HCV cal/kg 1234-3414 591-3766 591-2391 804-2762 834-2632 2178.5
% moisture 25-65 24-63 18-64 25-62 21-63 41
MUNICIPAL SOLID WASTE
(MSW)
The Supreme Court in the Almitra
Patel vs Union of India (writ (civil) no.
888/1996) pertaining to Municipal
Wastes stirred the nation.
Management of Municipal Solid
Waste (MSW) has always been
recognized as a major URBAN
environmental
issue. This waste
has always attracted
public attention
because it is the
most visible waste
if left unpicked for
even a day due to its
unpleasant odour,
aesthetics and as
potential disease
carrier. The GoI notified the
Municipal Solid Waste (MSW) Rules
2000, the wastes includes
commercial and residential wastes
generated in a municipal or notified
areas in either solid or semi-solid
form excluding industrial hazardous
-
medical wastes. The treatment
options stipulated under the MSW
Rules for biodegradable wastes are
composting, vermi - composting,
anaerobic digestion (generates
methane gas / bio-gas) or any other
appropriate biological processing for
stabilization of wastes.
Characterization studies on MSW
was carried out jointly in 2004-05 by
CPCB with NEERI in 59
cities of which 35 were metro cities
and 24 state capitals (see table
below).
From the above study the main
observations were : 74.57% house-
to-house collection of MSW existed,
the metro cities and Class I cities
generated over 90%
of MSW , 61% of the
cities practiced no
MSW processing, 96%
of MSW of waste
processing was by
composting
Composting and
organic farming is
very popularly
adopted as they are
environmental friendly and easy for
the common man to appreciate the
benefits of its practice. NGOs and
CBOs (help waste reclaimers
Urban Waste Profile
2 | P a g eNewsletter
SOME FACTS
Municipal Solid Waste
CPCB initiated on a 50:50 cost share basis with the ULBs in 2002-03 to set up demonstration facility for towns for implementation of MSW Rules for which the concerned ULBs expressed their willingness to participate.
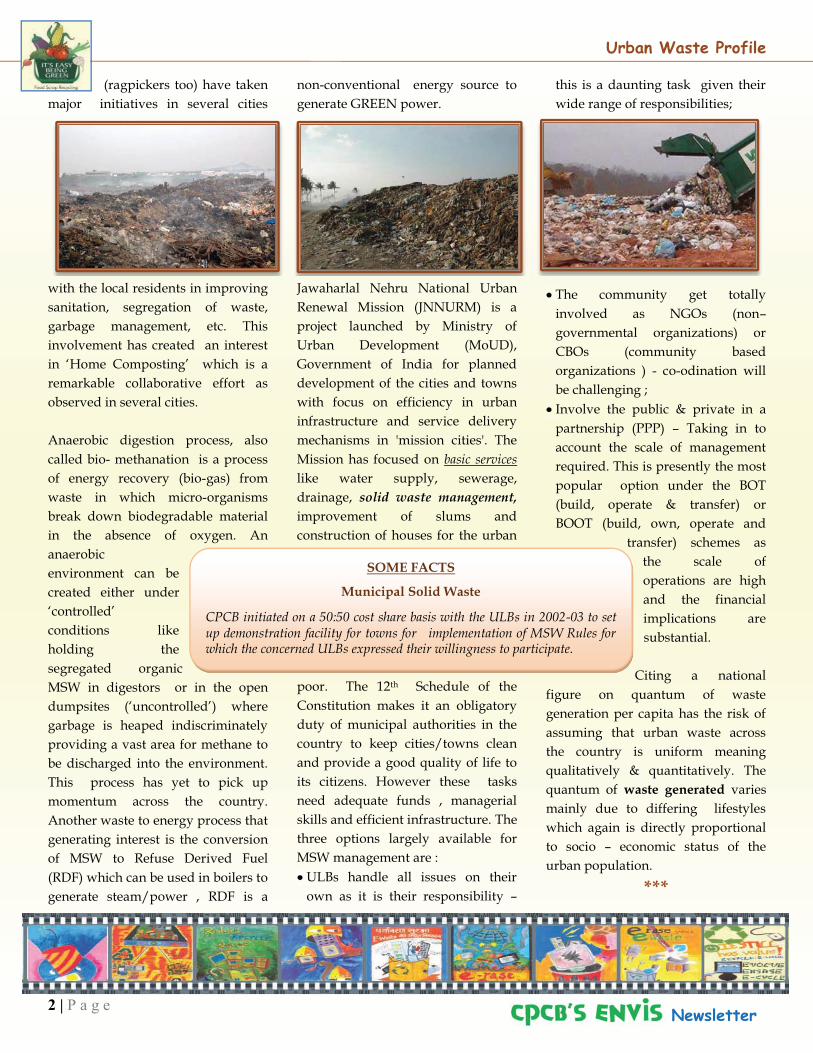
(ragpickers too) have taken
major initiatives in several cities
with the local residents in improving
sanitation, segregation of waste,
garbage management, etc. This
involvement has created an interest
is a
remarkable collaborative effort as
observed in several cities.
Anaerobic digestion process, also
called bio- methanation is a process
of energy recovery (bio-gas) from
waste in which micro-organisms
break down biodegradable material
in the absence of oxygen. An
anaerobic
environment can be
created either under
conditions like
holding the
segregated organic
MSW in digestors or in the open
) where
garbage is heaped indiscriminately
providing a vast area for methane to
be discharged into the environment.
This process has yet to pick up
momentum across the country.
Another waste to energy process that
generating interest is the conversion
of MSW to Refuse Derived Fuel
(RDF) which can be used in boilers to
generate steam/power , RDF is a
non-conventional energy source to
generate GREEN power.
Jawaharlal Nehru National Urban
Renewal Mission (JNNURM) is a
project launched by Ministry of
Urban Development (MoUD),
Government of India for planned
development of the cities and towns
with focus on efficiency in urban
infrastructure and service delivery
mechanisms in 'mission cities'. The
Mission has focused on basic services
like water supply, sewerage,
drainage, solid waste management,
improvement of slums and
construction of houses for the urban
poor. The 12th Schedule of the
Constitution makes it an obligatory
duty of municipal authorities in the
country to keep cities/towns clean
and provide a good quality of life to
its citizens. However these tasks
need adequate funds , managerial
skills and efficient infrastructure. The
three options largely available for
MSW management are :
ULBs handle all issues on their
own as it is their responsibility
this is a daunting task given their
wide range of responsibilities;
The community get totally
involved as NGOs (non
governmental organizations) or
CBOs (community based
organizations ) - co-odination will
be challenging ;
Involve the public & private in a
partnership (PPP) Taking in to
account the scale of management
required. This is presently the most
popular option under the BOT
(build, operate & transfer) or
BOOT (build, own, operate and
transfer) schemes as
the scale of
operations are high
and the financial
implications are
substantial.
Citing a national
figure on quantum of waste
generation per capita has the risk of
assuming that urban waste across
the country is uniform meaning
qualitatively & quantitatively. The
quantum of waste generated varies
mainly due to differing lifestyles
which again is directly proportional
to socio economic status of the
urban population.
***
Urban Waste Profile
3 | P a g eNewsletter
SOME FACTS
Mercury Bearing Wastes
characteristics. Mercury is the only element which is liquid at ambient temperature. It is a heavy, odourless, lustrous liquid metal that sinks in water. It exists in several states : Hg metallic liquid, Hg vapour, inorganic Hg(I)(mercurous salts) ,inorganic Hg(II) (mercuric salts) and gaseous Methyl
Hg. Its density is 13.456 g/cc and boiling point 356.9o C. It has wide commercial and industrial applications.
Approximately one gram of mercury is contained in a typical clinical thermometer ;
Recommended Hg content per Compact fluorescent lamp (CFL) 5 mg Ref. : , Published in Toxics Link; 01/10/2010
MERCURY BEARING WASTES
FLORESCENT LAMP SECTOR &
MEDICAL WASTES
Any discussion on mercury
contamination is incomplete without
referring to the worst aquatic
pollution in history caused by
mercury (Hg) waste that happened
in Japan. Minamata, a small factory
town dominated by the Chisso
Corporation, is located in Kumamoto
facing the Shiranui Sea, and
Minamata Bay is part of this sea.
From 1932 to 1968,
Chisso Corporation
dumped an estimated
27 tonnes of mercury
compounds into
Minamata Bay.
Kumamoto was home
to mostly farmers and
fishermen. When
Chisso Corporation
dumped this huge
amount of mercury
into the bay,
thousands of people
whose normal diet
included fish from the bay,
unexpectedly developed symptoms
of methyl mercury poisoning. The
illness became known as the
"Minamata Disease". Victims were
diagnosed having degeneration of
their nervous systems.
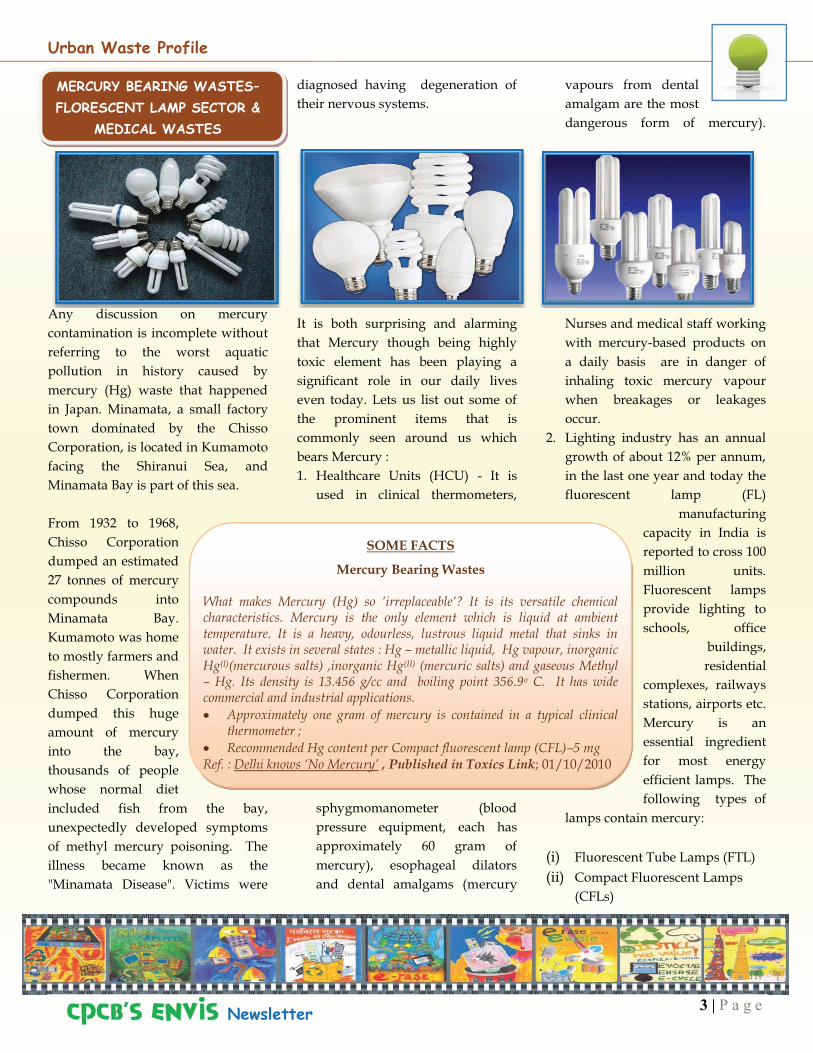
It is both surprising and alarming
that Mercury though being highly
toxic element has been playing a
significant role in our daily lives
even today. Lets us list out some of
the prominent items that is
commonly seen around us which
bears Mercury :
1. Healthcare Units (HCU) - It is
used in clinical thermometers,
sphygmomanometer (blood
pressure equipment, each has
approximately 60 gram of
mercury), esophageal dilators
and dental amalgams (mercury
vapours from dental
amalgam are the most
dangerous form of mercury).
Nurses and medical staff working
with mercury-based products on
a daily basis are in danger of
inhaling toxic mercury vapour
when breakages or leakages
occur.
2. Lighting industry has an annual
growth of about 12% per annum,
in the last one year and today the
fluorescent lamp (FL)
manufacturing
capacity in India is
reported to cross 100
million units.
Fluorescent lamps
provide lighting to
schools, office
buildings,
residential
complexes, railways
stations, airports etc.
Mercury is an
essential ingredient
for most energy
efficient lamps. The
following types of
lamps contain mercury:
(i) Fluorescent Tube Lamps (FTL)
(ii) Compact Fluorescent Lamps
(CFLs)

Urban Waste Profile
4 | P a g eNewsletter
SOME FACTS
Mercury Bearing Wastes
Most hospitals and clinicians feel comfortable with mercury equipment. Physicians are apprehensive about the accuracy of digital equipment. Accurate mercury free products are available, though relatively less readily.
(iii) High Intensity
Discharge (HID) lamps,
including Mercury
(a). Vapour, Metal halide and high
Pressure Sodium
(b). Neon Lamps (some use mercury
and phosphor powder)
Compact Fluorescent lamps (CFL)
and high intensity discharge (HID)
lamps are the two most common
types of lamps that utilize mercury.
CPCB has brought out a report
Technical Guidelines
for Environmentally
Sound Mercury
Management in FL
Sector (February
20 Unlike other
needs to be locally contained and not
promoting Hg-free environment by
In an urban context
the main areas of concerns are in the
laboratories. Monitoring compliance
of Hg in the environment is difficult
because mercury generating sources
are scattered haphazardly and this
makes regulation difficult besides
efficacy of Hg-free viable alternatives
are being apprehensively assessed.
The findings of a study conducted on
the management perspectives of
some heath care units in Delhi is
given below:
Attitudes: Most hospitals felt that
it was difficult to change the
mindset of personnel who were
used to traditional mercury-based
clinical thermometers. However
some hospitals that did extensive
research before introducing the
Hg-free equipment were able to
handle all apprehensions on
accuracy and were able to
convince the doctors.
Finances: Some hospitals felt that
the cost of digital thermometers
was higher than the mercury
equipment although it is a one
time replacement cost from
mercury to non-mercury
instruments. Studies in few
hospitals have shown that the
recurring cost with mercury
instruments far exceeded this cost
difference in addition to the extra
environmental and occupational
hazard cost which the healthcare
system do not acknowledge for
the time being.
Calibration: Some hospitals felt
that if calibrated properly the
non- mercury products work
better. To be mercury-free might
be a voluntary decision.
Recognizing that mercury has a
serious impact on both human
health and the environment, the
need for safe
management of
mercury wastes has
been recognized and
it includes :
i) Sensitizing
HCU to replace/
phase out Hg
bearing products and to ensure
safety & health of medical staff .
ii) Safe collection and recycling of
mercury from products like
florescent lamps from commercial
/ residential complexes.
iii) Safe collection and disposal of
mercury containing batteries and
their production be ultimately
eliminated.
iv) Involve schools & colleges
besides NGOs to highlight the
need to safely handle Hg and
alert safely & health concerns.
***

Urban Waste Profile
5 | P a g eNewsletter
SOME FACTSPackaging Waste
Source : Indian Packaging Industry
PACKAGING WASTES
India is recognized as a dynamic
economic hub with a demanding
market in the packaging industry as
behaviors are being re-defined. Due
to lower manufacturing costs, India
is fast becoming a preferred hub for
packaging production due to rise in
-
tier cities (Class I and II cities)
besides many big companies have
used packaging as a launching tool
for aggressively marketing their
various products. Some aspects for
the rise in packaged products are :
rising consumption of packaged
foodstuff;
the increasing presence of
multinational food and beverage
firms in India;
Personal care
products such as
cosmetics and
toiletries are on the
rise;
Growth in the
pharmaceutical sector;
The trend
towards processing of
food grains and farm
produce;
Some of the
of products in daily
use that are seen
under the packaging
regime are summed
below.
For generality, packaging is
categorized into TWO types
(sometimes three types too) mainly :
Primary packaging: envelopes the
product , this usually constitutes
the smallest unit which is in
direct contact with the content(s).
Secondary packaging : is outside
the primary packaging ;
Tertiary packaging is used for
bulk handling and shipping.
Based on the above
classification some day to day
familiar examples are given below.
products in daily use that are seen under the packaging regime
Bakery Products
Spices
Office Stationary
Drugs and Pharmaceuticals
Cosmetics and Personal Care
Beverages
Edible Oils
Soaps and Detergents
Processed Foods
Confectionary
Chemicals and Fertilizers
Mouth Fresheners (paan masala)
Day to day familiar examplesType of
packaging Examples
Primary Packaging
Aerosol spray can, beverage can, bottles, blister packs, carton, cushioning, envelopes, plastic bags, plastic bottles, tin can , wrappers
Secondary Packaging
boxes, cartons, shrink wrap
Tertiary Packaging
bales, barrel, crate, container, edge protector, flexible intermediate bulk container, big bag, "bulk bags", insulated shipping container, intermediate bulk container stretch wrap
By Material Polyethylene
Polypropylene
Other Plastics

Urban Waste Profile
6 | P a g eNewsletter
SOME FACTS
Waste Paper
During 2007-08 the domestic production of paper and paperboard was estimated to be 7.6 million tonnes, with over all paper consumption (including newsprint) reached 8.86 million tonnes and per capitaconsumption was pegged at 8.3 kg. Paper consumption is estimated to touch 13.95 million tonnes by 2015-16 , an increase in consumption by one kg per capita would lead to an increase in demand of 1 million tonnes.
From the above it would
be unfair to classify
from this sector as most of the
-
source.
***
WASTE PAPER
The paper industry has a large
product mix of all varieties of paper
widely ranging from the use mainly
for writing, printing, packaging,
specialty, paperboards and
newsprint etc. using
conventional fibre
such as wood, bamboo
or also unconventional
raw materials like
recyclable waste paper
(RCP) , agro-residues,
viz. bagasse, rice /
wheat straw.
Approximately 35%
units are based on
chemical pulp, 44% on recycled fibre
and 21% on agro-residues.
The Indian Paper Industry accounts
production of paper and paperboard
as reported by the Indian Paper
Manufacturers Association (IPMA)
which has large ( integrated) units
as its members.
There are over 700 units from the
small and medium enterprises
(SMEs) sector as per data from
Indian Agro & Recycled Paper Mills
Association (IARPMA). At present
about 50 percent of the total
production is based on recycled or
waste-paper, 25 percent based on
agro-fiber and 25 percent based on
wood.
In a recent report the Central Pulp &
Paper Research Institute (CPPRI) has
stated that by 2010 about half of the
global amount of fibers used in
papermaking will be from recycled
fibers. The study report admits that
recycled fibre sourcing in India is a
challenge. Import of waste paper has
increased significantly during 1995-
2003 onwards
dependence is increasing on
imported recycled paper (RCP) due
to inconsistent supply of indigenous
RCP and as the recovery of
indigenous RCP being low due to
unorganized collection system In
India only about 20% waste paper is
being currently recovered annually,
due to lack of organized collection,
sorting and grading system of waste
paper for proper utilization i.e. lack
of source segregation resulting in
waste paper getting soiled and thus
becoming un-usable. 50 % of our
requirement of
waste paper is met
through import.
ITC Paperboards
and Specialty
Papers Division
launched the waste
paper collection
programme called
Wealth Out of
Waste (WOW) in
selected areas in Hyderabad,
Bangalore, Coimbatore and Chennai.
In Chennai it is reported that about
30-40 IT companies including
Infosys, IBM, Wipro sell their waste
paper to ITC

Urban Waste Profile
7 | P a g eNewsletter
SOME FACTS
Plastic Wastes
Recycled plastics : It is estimated that approximately 4,000 to 5,000 metric tons per day of post consumer plastics which is about 4 to 5 percent by weight of MSW is generated in India.
for recycling. Such initiatives can be
extended to cover Residential
Welfare Associations (RWAs), NGOs
and local bodies to expand the waste
paper collection programme.
In view of the above WASTE PAPER
needs our attention and this is
possible if waste segregation is done
***
PLASTIC WASTES
Flexible packaging is
the most widely
adopted packaging
mode. It is popular
particularly as
laminates of plastics
and have unique
properties that
ensure heat seal-
ability, printability, toughness,
moisture resistance, grease
resistance, low odour and taste, and
aroma retention. It is used to pack a
very large spectrum of products
covering processed and convenience
foods, fruit juice, beverages, spices,
tobacco, oils, detergents, soaps,
shampoos, toiletries, cosmetics,
motor oils, and other products.
Material used in
packaging consists of multi-layer
laminated sheets of plastics (PVC,
LDPE, HDPE, BOPP, BOPET), paper,
cloth, or metal foils that are used
separately or in combination for
various packaging applications.
Almost all the raw materials
required in flexible packaging are
made in India.
It is reported that India makes most
of the equipment needed for the
packaging industry includes a full
range of semi-automatic to fully
automated filling, sealing and
wrapping machines . The wide
acceptance of flexible packaging can
be attributed to the following :
It is light fits closely to the
shape of the contents and saves
cost of storage and transport.
provides much more product for
a given amount of packaging,
examples ex. foil packs
and pouches instead of cans or
jars
smaller units possible, thus
options to buy only the required
quantity / volume at any time ;
Environmental concerns continue to
hamper growth of polymer-based
packaging as a profitable industry in
India in the retail and FMCG sectors.
Multi-layered and metallic pouches
used for gutkha and pan masala are
not recyclable and remain as solid
waste, causing serious damage to the
environment. The GoI has proposed
ban of non-recyclable
laminated multi-
layered plastic and
metallic pouches used
for packing shampoo,
gutkha, paan masala
and foodstuff like
wafers and biscuits in
the Plastics
(Manufacture, Usage and Waste
Management) Rules 2009.
The Rules also stipulates that
pouches or multi-layered packaging
from biodegradable plastic films
which meet BIS specifications, will
be allowed .
The major problems in plastics waste
management like any other waste are

Urban Waste Profile
8 | P a g eNewsletter
collection, segregation,
and disposal. The Recycled Plastics
Manufacture and Usage Rules 1999
(as amended in 2003) have been
promulgated to address the problem
of this class of wastes. An important
being actively used
in the road making across the
country besides in recycling.
Converted Flexible Packaging
Demand (tonnnes), India
Source : Indian Packaging Industry
If the above demand is not recycled
/ or not biodegradable the waste will
mount up!! The science on
biodegradable plastics is opening
doors to phase out the use of non
biodegradable plastics in the
packaging industry.
***
CONSTRUCTION &
DEMOLITION (C&D) DEBRIS
According to US EPA (1998)
definition
material produced in the process of
construction, renovation, or
data indicates that approximately
40% of the generated waste portion
is from construction and demolition
(C & D) from structures which
include buildings of all types
(residential / non-residential ), roads
and bridges. C & D waste is bulky,
heavy and is unsuitable for disposal
either by incineration / composting.
This poses a waste management
problem particularly in urban areas
where land availability for disposal
of ANY waste is a big problem. The
components of C&D waste contain
any of the following - concrete,
asphalt, wood, metals, gypsum
wallboard, and roofing. Typical
construction waste in Delhi consists
of concrete (23%), soil and sand
(36%) and bricks and masonry (31%).
Delhi has three civic bodies -
Municipal Corporation Delhi (MCD),
New Delhi Municipal Corporation
(NDMC) and Cantonment Area. The
average daily estimate as per
Municipal Corporation Delhi (MCD)
was 1000-1200 tons , the higher
quantum is reported during July due
to removal of silt from drains.
Mumbai generates 2300 MT of C & D
everyday, information of other cities
are sporadically available.
Though many of us have observed C
& D debris being heaped in vacant
plots or on roadsides oddly there is
scanty data on C&D debris
generation in India. For Delhi there
is a Concept Note for reclamation of
land through a construction debris
management facility at Burari plains
the Indian Army presently owns
land at the Burari Plains which is
about 2.5 km from Bhalaswa Landfill
with an area about 100 acres / 40.65
Ha and the average depth of the site
below the road level is about
8 ft (2.4384 m). This is a mutually
By Market Nonfood
Paper and Foil
Food

Urban Waste Profile
9 | P a g eNewsletter
SOME FACTS
Construction & Demolition
(C&D) Debris
The last census of India reports
that there are about 2.45 million
properties in Delhi of which
roughly 0.9 million are assessed
properties. The Technology
Information Forecasting and
Assessment Council (TIFAC),
Department of Science &
Technology has reported Delhi
produces about 4600 tonnes
daily, post -recycling, the
available quantity was estimated
to be 3300 tonnes.
beneficial project - for both , the Army
[in need of land by reclamation] and
MCD in need of a site for treatment and
disposal of construction debris.
Typical Composition of Indian
C&D waste
Lack of awareness of resource-
efficient construction practices
generally results in excessive use of
natural resources and generation of
large amounts of construction waste
that is barely recycled . As on date,
debris is used as a landfill to a large
extent and the quantity that cannot
be absorbed by the market reaches
the landfills
most municipalities in the scope of
work for private operators include
tons per day (TPD) of work besides
compacting and leveling of the land
to enable civil construction. C & D
can be re-cyled into construction
material as an add-on into concrete
aggregate mixture or in road making
by addition of binders.
Reference :
1. Improving municipal solid waste management in India: By Da Zhu)
2. Construction and Demolition
Waste Management: Current Practices in
Asia, Vilas Nitivattananon and Guilberto BoronganProceedings of the International Conference on Sustainable Solid Waste Management,5 - 7 September 2007, Chennai, India. pp.97-104
3. http://dpcc.delhigovt.nic.in/pdf/construction-demolition.pdf - Concept note for reclamation of land at Burari plains by Indian Army , Delhi
***

Urban Waste Profile
10 | P a g eNewsletter
SOME FACTS
Battery Wastes
By the year 2025, it is expected that India might be among the top five auto component economies.. The market size of automobile battery industry is worth US $ 48 billion a year. China, Hong Kong, United States, India and Taiwan are the major battery manufacturing countries on the global platform. Recycling or rather re-processing waste lead in India is not new where secondary lead is being produced both in the organized and unorganized sector. The industry is important , as even today it supplies almost 70% of the total leadconsumed for various industrial applications.
BATTERY WASTES
Ask any Indian why the traffic snarls
in the cities continue to be on the rise
despite efforts to improve the city
infrastructure such as widening of
existing roads, increase in road
connectivity , flyovers , underpasses ,
metro rail & other modes of mass
rapid transport system ? The answer
automobiles ( 2/3/4 wheelers ).
electrochemical device comprising of
primary and secondary cells that are
used for transforming chemical
energy into mechanical energy. Have
you wondered where the old
batteries go? Most of the vehicles
Batteries are mostly of two types i.e.
non-rechargeable and rechargeable.
Often called as disposable batteries,
non-rechargeable batteries are used
once and then dumped. While
rechargeable batteries are those
devices that can be easily recharged
by applying electrical current that
turns or reverses a chemical reaction.
A normal battery has an initial
voltage of about 1.6 volts and
produces between 500-1000 amps.
Low cost vehicles namely scooters,
motorcycles, mopeds and bicycles
have led to the massive growth of
some of the fastest developing
economies that includes India too.
The automobile and automotive
parts & components manufacturers
constitute a major chunk of
automotive industry which is highly
diversified and cater to the light
truck manufacturers, motor vehicle
body manufacturers, and motor
vehicle parts, suppliers, dealers,
retailers, original equipment
manufacturers (OEMs) , aftermarket
parts manufacturers etc. The
principal driving markets for Asian
automotive industry are China,
India and ASEAN nations. Most of
the major automotive players are
shifting their production facilities to
counties with emerging economies
with the main purpose for gaining
better market access and reduction in
their production costs.
Global Auto Components Forecast
Value
Year US$ billion % Growth
2004 515.5 2.30
2005 526.2 2.10
2006 538.9 2.40
2007 553.4 2.70
2008 569.1 2.80
2009 585.9 3.00
CAGR 2004 - 2009 : 2.6%
A case study from our neighboring
country Sri Lanka is illustrated here
to indicate that lead re-processing
is an accepted industrial practice in
our neighborhood also. The unit
concerned is viz. m/s Navam Lanka
Ltd . (since 1999) is a manufacturing
facility at Plot-
Export Processing Zone, Mirigama
District.- Gampaha. The unit is

Urban Waste Profile
11 | P a g eNewsletter
SOME FACTS
Battery WastesDue to geographically widespread of both battery manufacturing and secondary lead smelting facilities and users of batteries the task of monitoring the activities for environmental compliance is a challenging task.
involved in the prime activity of
"Recycling of Lead Acid Battery
Scrap & Smelting of Lead
Concentrate and producing
Polypropylene chips" to produce
lead ingots & polypropylene chips /
granules. The company is reported
to be collecting local lead battery
scrap through-out the country. Pure
lead ingot was being produced from
lead bearing metallic scrap through
pyro-metallurgical process, the
refining process produced lead
ingots with a minimum purity level
of 99.97% .They have also installed
an automatic casting machine. The
unit also proces
which is made of polypropylene.
Polypropylene is reported to offer
excellent resistance to organic
solvents, degreasing agents and
electrolytic attack. It is light in
weight, resistant to staining, and has
a low moisture absorption rate.
Besides polypropylene is an
economical and adaptable material
that offers a combination of
exceptional chemical, mechanical,
thermal and electrical properties.
Polypropylene or polypropene (PP)
is a thermoplastic polymer, used in a
wide variety of applications, textiles,
laboratory equipment, loudspeakers,
automotive components etc. The
units uses polypropylene chips that
are recovered and separated during
the battery breaking process, they
are thoroughly washed prior to
being dried for extrusion and
granulation.
Recycling of used batteries for
recovery of lead in India is not new.
In India re-processing of battery
scrap particularly for metal lead
comes under the purview of
Hazardous Waste (Management &
Trans-boundary Movement) Rules
2009. Extensive secondary re-
processing has been a feature of the
lead industry in India and abroad. In
India secondary lead is being
produced both in the organized and
unorganized sector by conventional
means. Due to geographically
widespread of both battery
manufacturing and secondary lead
smelting facilities and users of
batteries the task of monitoring the
activities for environmental
compliance is a challenging task.
The secondary re-cycling
industry is important, as even today
it supplies almost 70% of the total
lead consumed for various industrial
applications. With the rapid growth
in the automobile industry and
hence the requirement of batteries,
battery scrap generation will also
increase proportionally and
production of number of batteries is
expected to reach a record 37 million
mark by the turn of the century. In
view of the need for establishing
additional secondary lead smelters to
cope with the increasing amount of
used battery (lead) scrap there is
thereby an urgent need to address
streamlining of the recycling system
of battery scrap for development of a
healthy secondary lead producing
industry.
Reference :
1. Automotive Components & Partshttp://www.automotive-online.com/electrical-system/
2. http://www.navamlanka.com/facilities.html
3. Recovery from scrap batteries : Code No: TMS111 Price: Rs1600/- Category: Energy: Generation
***

Urban Waste Profile
12 | P a g eNewsletter
SOME FACTS
Waste Tyres
It is reported that over 33 million vehicles have come onto Indian roads in last three years. About 80 million tyres are a part of these 33 million vehicles, which include 2 / 3 / 4 /6 wheelers and India manufacturers approx. 97 million tyres annually
WASTE TYRES
Tyres may have the following
composition - natural rubber (also
called virgin rubber), Styrene-
Butadiene Rubber (SBR),
Polybutadiene Rubber (PBR), carbon
black, Nylon tyre cord, rubber
chemicals, steel tyre cord and butyl
rubber. If the number of automobiles
hitting the roads everyday is alarming so
is the number of tyres. Here some are
the crunching stats given below :
It is reported that over 33 million vehicles have come onto Indian roads in last three years.
About 80 million tyres are a part of these 33 million vehicles, which include 2 / 3 / 4 /6 wheelers
India manufacturers approx. 97 million tyres annually
So how are these old tyres proposed to be
disposed off ? Fortunately, although
in scattered form there are
the most
-
cycling old tyres are :
1. Crumb: Rubber comes from
granulating scrap tyres into
uniform rubber granules which
can be mixed with asphalt for
road surfacing; Some plant
removes all metal and
automatically produces various
grades of crumb (colouring
provision available) facility
which is automatically bagged
2. Reclaimed Rubber is recycled old
tyre rubber which can be used as
a substitute of natural & synthetic
rubber/mixed with virgin rubber
to make newer tyres for
automobiles or bicycles. The
methods for reclaiming rubber is
given in next table.
Old tyres are procured from tyre
dealers across the country and tyre
associations.
The market is concentrated in the
trucking centers of India. The
business of re-cycling tyres has not
picked up because of hurdles faced
tyres to recyclers.
Methods for reclaiming rubber
Pan Method
It is the oldest method highly labor-intensive
and polluting too pollution
Digestor Method
It is costlier , used by some recyclers in India.
Reclamation Methods
Being very costly better large-scale production. None of the Indian firms use this method. The minuter processes involves mechanical shredding, mixing, pressing, pyrolysis, etc.
The number of tyre recyclers in
India are very small, approx 15-25 in
India of which the major players are
barely 4 / 5 and are mainly located
in Maharashtra. In UK, The
Environmental Protection Agency
(EPA) has launched an initiative to
encourage businesses to recycle more
tyres. It is estimated that 100,000

Urban Waste Profile
13 | P a g eNewsletter
SOME FACTS
Bio-Medical Wastes
Approximately 75% - 90% of the Bio-Medical waste is non-hazardous and is harmless as any other municipal waste. The remaining 10-25% is hazardous and can be injurious to humans or animals and to the environment. Hence if both the above types of wastes are mixed together then it increases the total volume of the waste to be treated. Lack of segregation practices at the point of generation results in mixing of hospital wastes with general waste renders the whole waste stream hazardous and makes waste treatment difficult and costly too.
vehicles each day, amounting to
40,000 tonnes of waste rubber each
year. Under the scheme, the EPA and
the Waste and Resources Action
Program(WRAP) plan to create
guidelines for the collection,
transportation, storage, recycling and
reuse of the rubber tyres. Some of the
familiar uses of old tyres can any of
the following :
1. Rubber Crumb - floor mats, belts,
gaskets, shoe soles, dock bumpers
and washers
2. Reclaimed Rubber in Vehicles:a)
Automotive Industry) Bicycle
tyre industry
3. Molded products include mats,
hose pipes, conveyor belts, v-
belts, tiles, adhesives, sound
dampers, rubber sheets, battery
containers
4. Footwear shoe soles
5. Cement Industry - In some
countries including India cement
industries are accepting tyres in
their cement kilns. Tyre derived
Fuel (TDF) technology which is
the latest technology being used
in America and Europe. Cement
industry world wide is
contributing to the society by
curtailing use of fossil fuel usage
by utilising waste tyre as
alternate fuel - a case of co-
processing waste.
6. Re-treading in India tyres are
retreaded (mainly trucks) as
much as three to six times, there
are over 100 firms engaged in
tyre retreading in India
Because of their bulk, collecting and
transporting old tyres for recycling
constitutes a large part of the
operating costs which needs to be
addressed by the generator and state
government jointly..
90 percent of the virgin rubber
produced in Kerala is reported to be
sold as high as Rs 140-150 per kg.
Reference:
1. Tyre Recycling : The New Business
on the Block on-line magazine Dare
, 31st March 2010
2. Dr. S N Chakravarty, KPS
Consultants & Impex , Consultant in
tyre, rubber and allied industries
***
BIO-MEDICAL WASTES
Bio-Medical Waste is any waste
generated during the diagnosis,
treatment or immunization of human
beings or in research activity. The
waste produced in the
course of health care activities carries
a higher potential for infection and
injury than any other type of waste.
The source or generators of BMW
are hospitals , nursing homes,
clinics, pathological laboratories,
blood banks, etc.
Bio-Medical waste (BMW) generated
in the healthcare units is classified
into two major categories : Non-
Hazardous and Bio-Hazardous.
Constituents of Non-Hazardous
waste are non-infected plastic,
Urban Waste Profile
14 | P a g eNewsletter
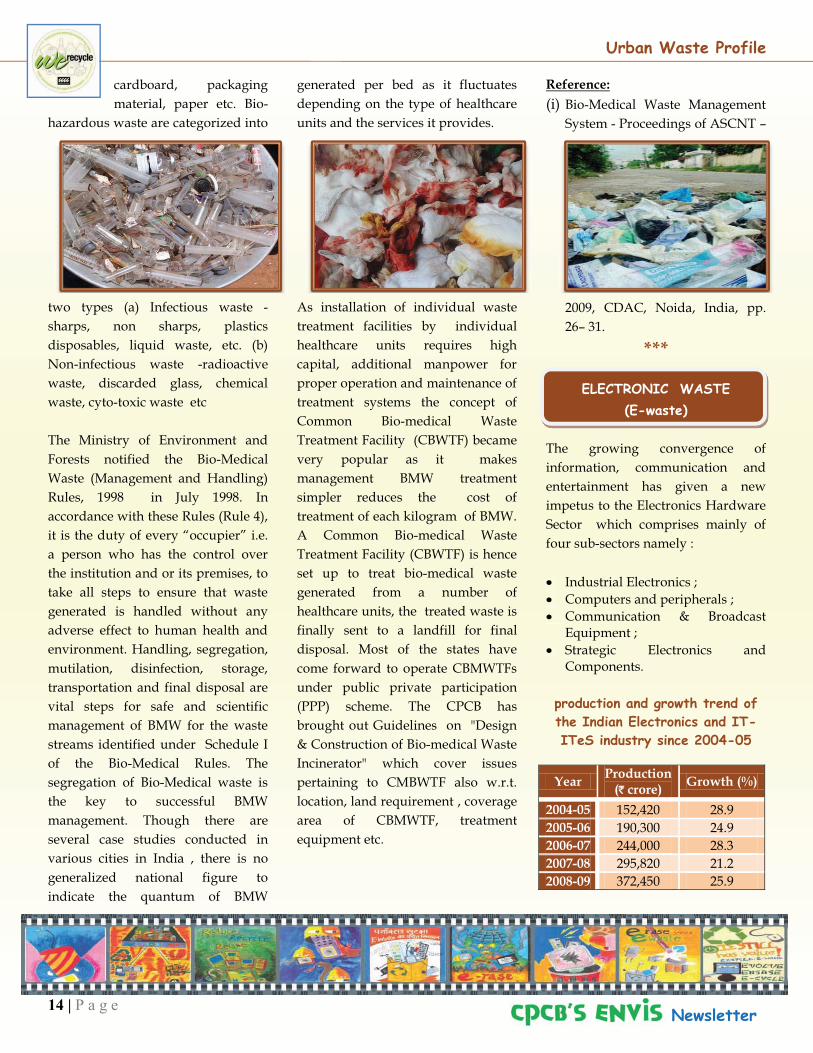
cardboard, packaging
material, paper etc. Bio-
hazardous waste are categorized into
two types (a) Infectious waste -
sharps, non sharps, plastics
disposables, liquid waste, etc. (b)
Non-infectious waste -radioactive
waste, discarded glass, chemical
waste, cyto-toxic waste etc
The Ministry of Environment and
Forests notified the Bio-Medical
Waste (Management and Handling)
Rules, 1998 in July 1998. In
accordance with these Rules (Rule 4),
a person who has the control over
the institution and or its premises, to
take all steps to ensure that waste
generated is handled without any
adverse effect to human health and
environment. Handling, segregation,
mutilation, disinfection, storage,
transportation and final disposal are
vital steps for safe and scientific
management of BMW for the waste
streams identified under Schedule I
of the Bio-Medical Rules. The
segregation of Bio-Medical waste is
the key to successful BMW
management. Though there are
several case studies conducted in
various cities in India , there is no
generalized national figure to
indicate the quantum of BMW
generated per bed as it fluctuates
depending on the type of healthcare
units and the services it provides.
As installation of individual waste
treatment facilities by individual
healthcare units requires high
capital, additional manpower for
proper operation and maintenance of
treatment systems the concept of
Common Bio-medical Waste
Treatment Facility (CBWTF) became
very popular as it makes
management BMW treatment
simpler reduces the cost of
treatment of each kilogram of BMW.
A Common Bio-medical Waste
Treatment Facility (CBWTF) is hence
set up to treat bio-medical waste
generated from a number of
healthcare units, the treated waste is
finally sent to a landfill for final
disposal. Most of the states have
come forward to operate CBMWTFs
under public private participation
(PPP) scheme. The CPCB has
brought out Guidelines on "Design
& Construction of Bio-medical Waste
Incinerator" which cover issues
pertaining to CMBWTF also w.r.t.
location, land requirement , coverage
area of CBMWTF, treatment
equipment etc.
Reference:
(i) Bio-Medical Waste Management
System - Proceedings of ASCNT
2009, CDAC, Noida, India, pp.
26 31.
***
ELECTRONIC WASTE
(E-waste)
The growing convergence of
information, communication and
entertainment has given a new
impetus to the Electronics Hardware
Sector which comprises mainly of
four sub-sectors namely :
Industrial Electronics ;
Computers and peripherals ;
Communication & Broadcast Equipment ;
Strategic Electronics and Components.
production and growth trend of
the Indian Electronics and IT-
ITeS industry since 2004-05
YearProduction
(`̀ crore)Growth (%)
2004-05 152,420 28.9
2005-06 190,300 24.9
2006-07 244,000 28.3
2007-08 295,820 21.2
2008-09 372,450 25.9

Urban Waste Profile
15 | P a g eNewsletter
SOME FACTS
Electronic Waste (E-Waste)
The main sources of electrical and electronic waste generation in India
are government institutions and business houses, accounting for
around 70% of the total waste, while contribution of individual
household is relatively small.
In India the demand for hardware is
fuelled by a variety of drivers which
includes high growth rate of the
economy, emergence of a vast
domestic market catering to the gen-
next and thriving middleclass
populace with increasing disposable
incomes. The production and growth
trend of the Indian Electronics and
IT-ITeS industry since 2004-05 has
been given in above Table.
According to data available with the
Telecom Regulatory
Authority of India (TRAI)
48 million rural
consumers took a new
mobile connection in the
first six months of
calendar 2009 compared
with just 32 million in the
cities, thus taking the mobile
penetration in rural India to around
17%. Increased utilization of
electronics goods due to wide
choices is unable to keep in pace
with the rapid obsolescence thereby
generating voluminous and
unmanageable E-wastes quantities.
Economic growth and Digital
revolution i.e. the Information
Technology (IT) sector has
contributed significantly to the
overall economic growth. The
important aspect of this waste is that
that it is easier and more convenient
to replace than to repair these
products.
E-waste is one of the fastest growing
waste streams today and is growing
almost three times the rate of
municipal waste, globally. E-waste is
highly complex waste to handle due
to its varying constituents, it also
contains precious metals and many
rare materials, which are highly
valuable. A computer contains
highly toxic chemicals like lead,
cadmium, mercury, beryllium,
Brominated Flame Retardants
(BFRs), PVC and phosphorus
compounds. Here are some startling
facts to understand the market drivers
for Electronics Hardware products in
India. There are over 60 million Internet
users as on 31.3.2009, Broadband
subscribers have touched 7.40 million as
on 31.10.2009, over 7 million DVD
players were sold during financial year
2008-09, 6.78 million PCs sold;
installed base of 30 million (as on
31.3.2009), 15.5 million
TVs sold; Installed base of
150 million (as on 31.3.2009), in the
fledgling telecom sector subscription had
reached to 525.65 million at the end of
October 2009, installed base for mobile
phones stand at 488.40 million
subscribers (as on 31.10.2009) with 10-
12 million new mobile subscribers added
every month ! India with population of
over 1 billion with a growing economy
and increasing consumption is estimated
to be generating approximately 4,00,000
tonnes of e-waste
annually (computers,
mobile phone and
television only) and is
expected to grow at a
much higher rate of 10-
15%. As per current
estimates, the global
e-waste market is
forecasted to reach 53 million tonnes
by 2012 from 42 million tonnes in
2008; thus growing at a CAGR of six
percent. While India generates about
4,00,000 tonnes of e-waste annually ,
almost 90% of the available E-waste
continues to be recycled in the
informal sector . Some of the
processes involve burning or direct
heating, use of acid baths, mercury
amalgamation and other chemical
processes to recover materials. These
result in the release of toxic materials

Urban Waste Profile
16 | P a g eNewsletter
into the environment
through as emissions or
effluents. Some of the impacts of the
current informal sector recycling are
Release of toxins into
environment.
Loss of natural resources due to
low recovery of materials
Hazardous health impact to
workers
Some solutions on E-waste
management :
Material substitution or use of
less toxic materials in the
manufacturing process also
brings down the environmental
footprint of the product. The
European regulation -ROHS
(Restriction On use of Hazardous
Substances)- is one regulatory
instrument which has been an
important driver in reducing
toxics in electronic products. This
regulation aims at gradually
reducing the use of Mercury,
Lead, Cadmium, Hexavalent
chromium, PBB and PBDE.
Down stream solution would
essentially attempt to address
technological issues of recycling,
a frame work of responsibility of
stakeholders and setting up of a
reverse supply chain process.
In the Extended Producers
Responsibility (EPR) is
considered an effective tool for
finding solutions to the complex
issue of product disposal and
pollution prevention. It implies
that the responsibility of the
producer extends beyond the post
consumer stage of the product.
Regarding re-cycling infrastructure
E-waste is gradually being viewed as
an important resource due to the
presence of some precious and rare
metals and some entrepreneurs have
come forward to handle this waste
and have been authorized by the
respective Pollution Control Boards
to undertake specific processes based
on their capacities.
Regarding the legal framework
currently E-waste in India is covered
under the Hazardous Waste
(Management, Handling and
Transboundary Movement) Rules,
2008. The existing Hazardous Waste
Rules was primarily drawn up to
address issues of waste generated in
industrial processes and is
inadequate to cover issues specific to
E-waste. The GoI issued Guidelines
for safe management of E-waste in
the country. The guideline is a
voluntary instrument and largely
attempts to address the technological
gap.
Source : Dept of IT, Ministry of Communications & IT, GoI/ Sustainable E-waste Management, Published in Toxics Link, 03/03/2010
***
Important Rules under
Environment (Protection) Act 1986
01. Municipal Solid Wastes
(Management & Handling)
Rules, 2000
02. Hazardous Waste
(Management, Handling &
Transboundary Movement)
Rules, 2008
03. Bio-Medical Waste
(Management and Handling)
Rules, 1998, (Amendment)
Rules, 2003
04. Plastics Manufacture, Sale and
Usage Rules 1999, as Amended
05. E-waste (Management &
Handling) Rule 2010 shall
come into force on 01.01.2012.
For all waste management there is a need for Commitment:
Communication, Accountability and Training JOIN US

Newsletter, 2010
Some CPCB publications -
Series Publications
HAZWAMS/14/99-2000Inventorisation & Management of Hazardous Waste in National Capital Region NOIDA (Gautam Budha Nagar) Ghaziabad, Meerut & Faridabad
HAZWAMS/16/2000-01Proceedings of the Workshop on Environmental Risk Analysis due to Storage and Handling of Hazardous Chemical
HAZWAMS/17/2000-01 Criteria for Hazardous Waste Landfills
HAZWAMS/20/2002-03 Manual for Design Construction and Quality Control of Liners and Covers for Hazardous Waste Landfills
HAZWAMS/21/2002-03 Inventorisation of Hazardous Waste Generation Units in Orissa
HAZWAMS/22/2002-03 Development of Site Selection Methodology for Landfilling
HAZWAMS/23/2002-03 Guidelines for the Selection of Site for Landfilling
HAZWAMS/25/2003-04Guidelines for Conducting Environmental Impact Assessment : Site Selection for Common Hazardous Waste Management Facility
HAZWAMS/28/2004-05Identification of Hazardous Waste Streams their Characterisation and Waste Reduction Options in Pesticides Sector
HAZWAMS/30/2005-06 Guidelines for Common Hazardous Waste Incineration
HAZWAMS/31/2005-06 Management of Hazardous Waste Pre-requisites for Issuing Authorisation by SPCB/PCC
HAZWAMS/32/2005-06 Management of Hazardous Waste Guidelines for Proper Functioning and upkeep of Disposal Sites
HAZWAMS/33/2005-06 Management of Hazardous Waste Guidelines for Transportation of Hazardous Wastes
HAZWAMS/34/2006-07 Guidelines for Environmentally Sound Management of E- Waste
HAZWAMS/35/2009-10 National Inventory of Hazardous Wastes Generating Industries & Hazardous Waste Management in India
HAZWAMS/36/2009-10 Report of the Committee on Evolve Road Map on Management Waste in India
HAZWAMS/37/2009-10 Report of Hazardous Chemicals Investigation in India
CUPS/41/1994-95 Management of Municipal Solid Wastes - Status and Options
CUPS/46/99-2000 Status of Solid Waste Generation, Collection, Treatment and Disposal in Metrocities
CUPS/53/2002-03 Municipal Solid Waste Processing Technologies Review and Guidelines for Local Bodies
PROBES/24/1983-84 Characteristics and Treatment of Wastewater from an Electric Bulb Manufacturing Unit : A case Study
PROBES/80/2001-02 Guidelines for Health & Safety of Workers in Wastewater Treatment Facilities
PROBES/103/2005-06 Assessment of Utilisation of Industrial Waste in Cement Manufacturing
PROBES/111/2007 Bio-Methanation Potential of Agrobased Solid Waste from Agro Based Industries
PROBES/113/2007 Plastic Waste Management Issues and Options
PROBES/132/2009 Assessment of Plastic Waste & Its Management at Air Port & Railway Station in Delhi
LATS/16/2002-03 Manual on Sampling, Analysis and Characterisation of Hazardous Wastes
LATS/17/2004-05 Bio-Medical Waste Management Case Study NCT Delhi
RERES/1/1985-86 Recycling of Sewage & Industrial Waste on Land a Monitoring & Surveillance Report on Chandigarh Sewage farm
RERES/2/2001-02 Constructed Wetlands for Waste Water Treatment
IMPACTS/2/99-2000 Manual on Hospital Waste Management
HAZWAMS/8/1996-97 Inventorisation of Hazardous Waste Generation in Kerala State
HAZWAMS/9/1996-97 Inventorisation of Hazardous Wastes Generating Industries in Orissa
HAZWAMS/10/1996-97 Inventorisation of Hazardous Wastes Generation in Punjab
HAZWAMS/11/1998-99 Guidelines for Setting up of Operating Facility: Hazardous Waste Management
HAZWAMS/13/1998-99 Inventorisation & Management of Hazardous Waste in Andhra Pradesh
HAZWAMS/19/2001-02 Inventorisation and Management of Hazardous Waste Generation in West Bengal
HAZWAMS/24/2002-03Identification of Hazardous Wastes Streams Their Characterisation and Waste Minimisation Options in Petrochemical Sector
HAZWAMS/27/2004-05Identification of Hazardous Waste Streams their Characterisation and Waste Reduction Options in Dyes & Dye Intermediate Sector
HAZWAMS/29/2005-06Identification of Hazardous Waste Streams their Characterisation & Management Options in Bulk Drugs & Pharmaceuticals Sectors
COINDS/47/1993-94 Waste Water Management in Pesticide Industry
COPOCS/32/2005-06 Fish Processing Waste Disposal Practices and Options
PARIVESH Newsletters
Municipal Solid Wastes
Hospital Wastes
Hazardous Waste Management
Plastic Waste Management
ENVIS, CPCB Newsletter 5000 copies
Print & Published by PR Division, Central Pollution Control Board at ENVIS Centre-01
on behalf of Sh. J.S. Kamyotra, Member Secretary, CPCB.
Compiled by ENVIS Team : Shri Premraj, Ms. Hemlata Mishra and Ms. Mita Sharma.