qoe of cross-modally mapped mulsemedia: an assessment
TRANSCRIPT

QoE of cross-modally mapped Mulsemedia:an assessment using eye gaze and heart rate
Gebremariam Mesfin1 & Nadia Hussain1 & Elahe Kani-Zabihi2 & Alexandra Covaci3 &
Estêvão B. Saleme4 & Gheorghita Ghinea1
Received: 8 January 2019 /Revised: 5 September 2019 /Accepted: 12 November 2019
# The Author(s) 2020
AbstractA great deal of research effort has been put in exploring crossmodal correspondences in thefield of cognitive science which refer to the systematic associations frequently made betweendifferent sensory modalities (e.g. high pitch is matched with angular shapes). However, thepossibilities cross-modality opens in the digital world have been relatively unexplored.Therefore, we consider that studying the plasticity and the effects of crossmodal correspon-dences in a mulsemedia setup can bring novel insights about improving the human-computerdialogue and experience. Mulsemedia refers to the combination of three or more senses tocreate immersive experiences. In our experiments, users were shown six video clips associatedwith certain visual features based on color, brightness, and shape. We examined if the pairingwith crossmodal matching sound and the corresponding auto-generated haptic effect, andsmell would lead to an enhanced user QoE. For this, we used an eye-tracking device as well asa heart rate monitor wristband to capture users’ eye gaze and heart rate whilst they wereexperiencing mulsemedia. After each video clip, we asked the users to complete an on-screenquestionnaire with a set of questions related to smell, sound and haptic effects targeting theirenjoyment and perception of the experiment. Accordingly, the eye gaze and heart rate resultsshowed significant influence of the cross-modally mapped multisensorial effects on the users’QoE. Our results highlight that when the olfactory content is crossmodally congruent with thevisual content, the visual attention of the users seems shifted towards the correspondent visualfeature. Crosmodally matched media is also shown to result in an enhanced QoE compared toa video only condition.
Keywords Mulsemedia . Crossmodal correspondence . Quality of experience . Gaze tracking .
Heart rate
https://doi.org/10.1007/s11042-019-08473-5
* Gheorghita [email protected]
Extended author information available on the last page of the article
Published online: 3 January 2020
Multimedia Tools and Applications (2020) 79:7987–8009

1 Introduction
Multisensory experiences have mostly been studied in the psychology field whereinteractions between smell and taste have been explored. Multisensory integration occursbetween two or more sensory modalities including touch, sound, vision, smell and taste.Mulsemedia (Multiple Sensorial Media) incorporates more than visual and audio infor-mation, it includes new media types such as haptics, olfaction and gustatory. It has led tonew opportunities as well as challenges in research, academia, industry, and forimmersive technologies [18, 68].
In this emerging field, there have been several explorations on the practicality and possi-bility of integrating different media types into applications. Thanks to the advent of noveltechnologies and innovative devices to artificially produce sensory effects along with systemsable to deliver this kind of experience to the users [57] the addition of multiple sensory effectshas been essential to improving immersion and presence in the user’s environment.
Ghinea et al. [17] believe it can be achieved by the user’s sensation perception,classifying it as a result of a complex set of processes in which biological sensors sendstructured electrical signals to the brain (except for specific chemoreceptors), which inturn, frame unconscious sensations patterns. Thereby, they help to determinate whetheran upcoming sensory input is authentic. Additionally, Möller and Raake [41] considerthat perception goes through two stages before being completely realized: (i) conversionof stimuli through the respective sensory organ into neural signals, and (ii) processingand transmission of these neural signals from the central nervous system to the cerebralcortex, resulting in specific perceptions in the person’s perceptual world. It all willpermeate what is called Quality of Experience (QoE) of users.
QoE stems from the combination of the achievement of users’ expectations regardingthe utility, the level of enjoyment considering their personalities, and their current state[4]. Users exposed to multisensory experiences have reported a noticeable increase inQoE [27, 42, 46, 47, 49, 71, 76, 79, 80]. Although there have been studies in thecognitive and digital world with regard to the perception of individual senses, there arehitherto unsettled questions when it comes to crossmodal correspondences. Incrossmodal correspondence, a stimulus in one modality can be associated with another.For example, in the non-digital world, the smell of lemon and high pitch audio can beassociated to sharp objects [21, 64]. However, it is not yet clear whether or not themultisensorial effect of the component modalities generated out of such crossmodalassociations would enhance the users’ QoE in the digital world.
In this article, we report on an experiment designed to explore whether cross-modallymapped multisensorial effects (olfaction, sound, and auto-generated haptic) from visualfeatures of videos enhance the users’ QoE. We hypothesize that taking into accountcrossmodal mappings whilst creating mulsemedia systems could lead to more immersiveand effective experiences for the users.
This article is organized as follows. Section 2 brings related work, focusing onauditory-visual crossmodal correspondences research in psychology, computer graphicsand human computer interaction, mulsemedia and QoE. Section 3 presents the user studyon QoE in crossmodal mulsemedia. Section 4 depicts the results and discusses the work.Finally, Section 5 provides a concluding summary and underlines topics for futureinvestigation.
Multimedia Tools and Applications (2020) 79:7987–80097988

2 Related work
2.1 Auditory-visual and olfactory-visual crossmodal correspondences researchin psychology
Past experiences shape unconscious sensations patterns, which in turn, will influence the wayhumans feel the upcoming experiences. Thus, a new stimulus in one modality might be associatedwith another one; for instance, the pitch in audition can be associated to visual features likebrightness. Outside the digital world, crossmodal correspondences have been observed betweendifferent sensory modalities such as visual, sound, touch, smell, and taste [7, 15, 58, 60, 63, 77].
Non-arbitrary crossmodal correspondences mappings between auditory and visual stimuli havebeen found through experimental approaches in simple stimulus dimensions such as loudness andbrightness, as well as in more complex stimuli such as shapes/images and words. Marks [37]detected an association between lighter colorswith higher pitches and louder sounds. Besides, soundhas also been linked to other compound characteristics such as shapes. In the same study,Marks [37]gathers an evidence that high pitched tones are related to angular shapes and low-pitch sounds areconnected to rounder shapes. Hagtvedt and Brasel [20] found an association between the frequencyof music and the lightness of a colored object. With the help of an eye-tracker, they concluded thatvisual attention was steered in the direction of light-colored objects under the influence of high-frequency sounds. It makes evident that sound can be employed to exploit users’ attention.
Nonetheless, over the last decades, researchers have started to document the existence ofcrossmodal corre- spondences also between olfactory and visual stimuli. For instance, in [19], theauthors provided one of the first examples of olfactory-visual correspondences, showing that thereare strong correlations between odors and colors. Bergamot smell was associated with yellow,cinnamon with red, pine with green, etc. In [31], the authors investigated how color lightness varieswith perceived odor intensity and found an inverse correlation. Pleasantness and quality of odorswere also analyzed in studies, such as [54, 66]. In [11], the authors investigated the robustness ofthese crossmodal associations for a random sequence of odors (strawberry vs. spearmint) and colorpatches (pink vs. turquoise) and found these correspondences both systematic and robust. In [58]authors took a different approach and investigated the crossmodal associations between the abstractsymbols designed for the representation of an odor and the correspondent odor. They showed thatthe matching exists and is mediated by hedonic valence of cues. In [10], participants were asked toselect a color they were associating with an odor. They observed that when odors were described inabstract terms it was less likely to find a colormatch, whilewhen the participantswere describing theodor with a source-based term (“smells like banana”) their color choices reflected more accuratelythe odor source. This and other studies like [26, 62] show that the mechanisms underlying theseassociations could be related to semantics, emotions or natural co-occurrence.
If synaesthesia is unidirectional, crossmodal correspondences are bidirectional: e.g., hearinghigh-pitched sound is matched with small objects and seeing small objects is paired with high-pitched sounds. The fact that crossmodal correspondences are bidirectional might mean that at leastsome of the crossmodal correspondences are also transitive, which is again different from synaes-thesia [12]. Though the multidimensionality of the precepts at stake seems to indicate the possibilityto predict the relationship between different attributes, transitivity should not be expected in everycase. For instance, we know that louder sounds correspond to bigger objects and that lower pitchcorresponds to larger size, thus louder sounds should correspond to higher pitch. However, this wasnot observed in related studies [12].
Multimedia Tools and Applications (2020) 79:7987–8009 7989

2.2 Auditory-visual and olfactory-visual crossmodal correspondences researchin computer graphics and human computer interaction
There has been little work related to crossmodal correspondences between visual andauditory media beyond the area of cognitive sciences. The studies of Mastoropoulouet al. [39] and Mastoropoulou [38] on the effect of auditory stimuli over visual percep-tion pointed out that when only sound emitting objects are delivered in high quality andthe rest of the scene in lower quality, the visual quality is not impacted.
In [3], the authors focused on different senses for investigating crossmodal corre-spondences: sight and olfaction. They found out that the scent of fresh cut grass candistract viewers from the task of identifying the animation quality (flyover of a grassterrain). Hulusić et al. [24] aimed at discovering the influence of beat rates in staticscenes. They found out that lower beat rates impact the perception of low frame rates.Thereafter, they investigated how camera movement speed and the sounds influence thesmoothness of the animation [25]. Ramic-Brkic et al. [50] were concerned about howviewers perceive the graphics’ quality in the presence of distinct modalities such asauditory, olfactory, and ambient temperature. What they realized was that strong per-fume, high temperature, and audio noise have an influence on the users’ perceivedrendering quality. Apart from selective rendering, Tanaka and Parkinson [35] studiedthe crossmodal mapping between digital audio and the haptic domain dedicated to audioproducers with visual impairments. To do so, they created a device called Haptic Wave,an input/output interface that renders audio data as kinesthetic information. In [35], theauthors explored the impact of audio on haptic to improve the quality of eating fordenture users. They built a device to increase the food texture using sound. Ranasingheet al. [52] applied crossmodal perception to create Vocktail, a system to introduce flavoras a digitally controllable media involving color, smell, and taste modalities. In [23], theauthors found associations between sweetness and red rounded shapes, and sourness andgreen angular shapes with a fast animation speed in the literature. Then, they also foundout that specific combinations of visualizations and animation types have an influence onyogurt’s taste perception. Tag et al. [70] explored cross-modal correspondence betweenhaptic and audio output for meditation support. The goal of the haptic/audio design wasto guide the user into a particular rhythm of breathing. In [28], the authors discuss theeffect of scented material on physical creations showing that odor-shape correspondenceexists in an active, free association creation session. Moreover, it also indicates thepotential of using crossmodal correspondences for HCI in the design of future interactiveexperiences.
The multisensory user experience is also a semiotic process [29] and designing for it cantake different stances depending on the experimental goals. Positive emotional outcome isdependent on the context of the design and its appraisal is strongly connected to multisensoryintegration. Expectations have an important role in HCI, thus crossmodal correspondencescould be one of the underlying dynamics of a positive experience [53]. As can be seen, studieson crossmodal correspondences research in computer graphics and human-computer interac-tion provide insights about sensory replacement/combination under different circumstances.These mappings have a promising potential in designing interfaces and displays that tap into auser’s mental model [72]. Thus, we believe that crossmodal mappings could reveal insightfulinformation in other contexts to help to understand the users’ perception and therefore improvehuman-computer interaction.
Multimedia Tools and Applications (2020) 79:7987–80097990

2.3 Mulsemedia and QoE
There has been an increasing interest in creating multimedia applications augmented with media ontop of the traditional audio-video (AV) content [18]. They aim at stimulating other senses beyondsight and hearing such as touch [14], smell [16] or taste [51, 52] with the aim to increase the user’sQoE and to explore novel methods for interaction [44]. Therefore, the termmulsemedia refers to theuse of at least three different media types, that is, multimedia and at least one non-traditional media[18].
Mulsemedia systems generally undergo a workflow for (i) production, (ii) distribution, and (i)rendering [6]. First, different sensory effects metadata are produced or automatically generated insynchronizationwith anAV content. This process can be performed by a human or acquired throughvarious sensors (e.g. camera, microphone, motion capture) that capture real-world information, orsynthesized using computers (e.g. a virtual 3D space in a game) [56]. Many tools have beendeveloped to aid this process, such as SEVino [75], SMURF [32], RoSE Studio [5], and Real 4Dstudio [59]. The works of Kim et al. [33] and Oh and Huh [48] are endeavors to automaticallyproduce mulsemedia metadata. Although haptic effects can be captured [9], making a reliable andlasting record of taste and smell from the real world is still a challenge.
Following that, the mulsemedia effects can be encoded for transport, processed and emitted fordistribution to providers, distributed to the end-users and then decoded by systems, and finally,rendered by different devices, which in turn, will deliver them to the end users. Mulsemedia playersand renderers to be usedwith other multimedia applications have also been created to reproduce anddeliver mulsemedia experiences, notably SEMP [75] and PlaySEM [55], which are open-source. Amulsemedia system entails weavingmultiple technologies to connect different entities, distribute thesensory signals, and render sensory effects appropriately Saleme et al. [56]. Whilst developingmulsemedia systems, it is crucial to have ways to deliver different sensory content consistently aswell as of paramount importance to be aware of the challenges that might arise when deliveringmulsemedia [57]. The main motivation behind adding mulsemedia components is to augment thelevel of immersion and QoE of users [44].
QoE is defined as the level of delight or displeasure a user feels whilst experiencing anapplication or a service in computers taking into account mainly subjective measures such astheir personalities and current state. It can be assessed either by conducting subjective surveys[2, 76, 78, 79] or objective evaluation [13, 30]. In addition, technical recommendations havebeen used together such as ITU-R-BT.500–13, ITU-TBT.500, and ITU-T-P.910. Therefore,mulsemedia systems’ evaluations can lead to a high degree of qualitative differentiation interms of QoE. Although objective evaluations are low-cost and carried out faster thansubjective ones, they might put researchers on the wrong track if they consider just a fewparameters. For instance, researchers should know if the user has some heart-related problemsbefore they measure the user’s heart rate because it can lead to misleading conclusions. Thus,taking current emotional states into consideration from different perspectives could revealuseful insights. The work of Egan et al. [13] is a sample of the combination of objective andsubjective QoE evaluations. They correlated the results of both and found out that high valuesfor heart rate and electrodermal activity had to do with physiological arousal- one of the factorsassociated with user QoE. Another work [30], showed the potential and benefits of using theseobjective metrics as indicators of user QoE for immersive experiences in augmented realityapplications. Indeed, if used appropriately, physiological measures can be useful in affectivestate monitoring, chiefly in a multimodal setup [34].
Multimedia Tools and Applications (2020) 79:7987–8009 7991

By satisfying users’ expectations and incrementing the levels of utility/enjoyment ofapplications or services, mulsemedia has not only contributed directly to QoE, but alsoindirectly such as presented in the studies of Yuan et al. [79], Yuan et al. [80], and Ademoyeet al. [2]. They have pointed out that mulsemedia can partially mask an AV sequence’sdecreased quality as well as synchronization skews, thus enhancing the user’s perceivedQoE. Furthermore, mulsemedia has the capacity to aid memory [1], to improve virtual realism,to more easily convey information between physical and digital environments [81], and tocontribute to pattern recognition [67].
The question of how to improve the user experience in immersive systems is still an openone. Adding sensory modalities seems to be a reasonable way according to the literature.However, it is also relevant to pay attention to crossmodal correspondences, which haveseldom been considered when designing mulsemedia systems although our perceptual expe-riences are affected by them. Very little is known about the combination of senses in the digitalworld and what occurs as soon as one stimulus is stronger than the others. Indeed, crossmodalinteractions could be handy when it comes to getting over a specific sensory deprivation orsituational impairment such as to see or feel something in darkness [22]. Given this,mulsemedia appears as a prospective scenario to develop the knowledge on crossmodalcorrespondences hitherto limited to setups on traditional multimedia. By understandingcrossmodality applied to mulsemedia systems, this comprehension could be also beneficialto prepare effective mulsemedia experiences.
3 User study: Quality of experience in crossmodal mulsemedia
The experiments we designed are aimed to investigate the potential influence of usingcrossmodal correspondences concepts in designing mulsemedia on the QoE experienced bythe users. More specifically, we used six videos characterized by dominant visual features:color (blue, yellow), brightness (low, high), shape (round, angular). Participants viewed thesevideos enhanced with crossmodally matching sound while wearing a haptic vest with vibrationmotors. We chose to use the vibrotactile display because literature has shown that participantsexhibit an increased emotional response to media with haptic enhancement [73].
3.1 Participants
Twelve participants (7 males, 5 females) took part in the experiment and were randomlyassigned to either one of an equal-sized Experimental (EG) or Control Group (CG), respec-tively. Users were aged between 18-41 years old and hailed from diverse nationalities andeducational backgrounds (undergraduate and postgraduate students as well as academic staff).All participants spoke English and self-reported as being computer literate.
3.2 Experimental apparatus
\The videos were displayed on a computer monitor with a resolution of 1366x768 pixels, and aviewing area of 1000x700 pixels in the center of the screen. An EyeTribe eye trackercontrolled by a custom written Java code was employed to record eye-gaze patterns on aWindows 10 Laptop with 8GB RAM powered by an IntelCore i5 processor. The viewingscreen was placed between 45-75 cm from the eyes of the participants, as this was the
Multimedia Tools and Applications (2020) 79:7987–80097992

recommended distance for Eye Tribe calibration.1 We chose to use the EyeTribe eye trackerbecause this was demonstrated to be accurate enough in studies on gaze points and fixations[8].Participants sat in a chair without armrests facing the screen. All participants wore i-shine2
headphones, a vibrotactile KOR-FX3 gaming vest, and a Mio Link heart rate wristband.4 Tofacilitate the vibrotactile experience we chose the KOR-FX gaming vest that utilizes 4DFXbased acousto-haptic signals to enable haptic feedback to the upper chest and shoulder regions.The vest is wirelessly connected to a control box meant to accept the standard sound output ofthe sound card of a computer.
The olfactory emitting device was provided by the Exhalia SBi4,5 which was considered byprevious research more reliable and more robust than existing devices [45]. This was placed at0.5 m from the assessor, allowing her/him to detect the smell in 2.7–3.2 s, as shown in [44].The SBi4 can store up to four interchangeable scent cartridges at a time, but we used a singleslot in our experiments to prevent the mixing of scents. These cartridges contain scentedpolymer through which air is blown (through four built-in-fans). The synchronized presenta-tion of the olfactory data was controlled through a program built using Exhalia’s Java-basedSDK. Users of this type of devices obtain additional information about environmental factorswhile becoming more immersed/involved in their experience [43]. A snapshot of the exper-imental setup is shown in Fig. 1.
3.3 Audio visual olfactory content
As illustrated in Table 1 there were six videos selected based on their dominant visualfeatures such as color, brightness and angularity of objects. The olfactory contentconsisted of six scents: bergamot, lilial, clear lavender (low intensity), lavender (highintensity), lemon and raspberry. All videos in our experiment were 120 s long. For theEG, the audio was adjusted to a frequency of 328 Hz (high pitch condition) and 41 Hz(low pitch condition).
The accompanying auditory and olfactory content was modified in line with principlesof auditory-visual and olfactory-visual crossmodal correspondences that were previouslyshown in the literature. The video with dominant yellow images (V1) was watchedaccompanied by high pitch sounds and bergamot odor, while the one dominantly blue(V2) by low pitch sounds and lilial odor [19, 61, 69].
In V3, where brightness was considered the dominant visual cue, low pitch soundsand low intensity lavender odor were delivered concurrently to the users, while in V4,where the brightness was high, the auditory content consisted of high pitch sounds andthe olfactory content of high intensity lavender odor, based on [19, 36]. Finally, V5, thevideo displaying angular shapes, was matched with high pitch sounds and lemon odor,whilst V6, where the dominant shape was round, was delivered with low pitch soundsand raspberry odor [21, 64].
1 http://theeyetribe.com/dev.theeyetribe.com/dev.theeyetribe.com/start/index.html2 https://www.ishine-trade.com/Headphones-Earphones3 http://korfx.com/products4 https://www.mioglobal.com/5 https://www.exhalia.com/
Multimedia Tools and Applications (2020) 79:7987–8009 7993

3.4 Procedure
Pre-experiment study Before the experiments, we carried out a small pilot study with twoparticipants to get feedback on their thoughts and experience while trying our system. This wasaimed to give us feedback on the experimental process and research instruments employed.Since participants reported that the high pitch audio volume was loud, we lowered its intensityto enhance user comfort during the experiment.
Conditions There were two conditions that differed in the provided content:
(1) In the experimental condition (associated with the EG) users were exposed to alteredaudio (modified pitch) which it matched the corresponding dominant visual features. Thedominant visual cue was also accompanied by crossmodally correspondent olfactorycues.
(2) In the placebo condition (carried out by the CG), the users were only exposed to thevisual content. Thus, although they wore headphones and a haptic vest and the fan of theolfactory device was running, no type of content (auditory, vibrotactile nor olfactory) wasdistributed to users.
Eye-tracking calibration At the beginning of the experiment, participants underwent an eye-tracking calibration exercise in which they were asked to focus on 9 equally spaced pointssituated on a 3 × 3 grid. Participants were randomly divided in two groups of 6 each andwatched the six videos in a random order for both EG and CG. All participants used thedevices identified in Fig. 1. The experimental sessions were conducted individually and lastedbetween 24 to 37 min.
Collected data For each participant we collected two objective measures:
Fig. 1 Experimental setup. The users were wearing: (1) i-shine headphone, (2) the KOR-FX haptic vest, their eyegaze was captured with (3) the EyeTribe eye tracker, while their heart rate was measured with (4) Mio Link;olfactory effects were diffused using Exhalia (5)
Multimedia Tools and Applications (2020) 79:7987–80097994

Table 1 Snapshots from the six videos used during the experiment with their themes, dominant visual cues andthe conditions for the EG in each case. The CG experienced only visual content, without any type ofcrossmodally generated content (olfactory, auditory or vibrotactile)
Video Snapshot DescriptionV1
Theme. Waves Visual cue. Color: Blue EG. Auditory: Low pitch, Olfactory: Lilial CG. Only visual content
V2Theme. Sulphur springs Visual cue. Color: Yellow EG. Auditory: High pitch, Olfactory: Bergamot CG. Only visual content
V3Theme. Solar eclipse Visual cue. Brightness: Low
EG. Auditory: Low pitch, Olfactory: Lavender (low intensity) CG. Only visual content
V4Theme. Sunrise upon the Arctic Visual cue. Brightness: High
EG. Auditory: High pitch, Olfactory: Lavender (high intensity) CG. Only visual content
V5Theme. Fly over San Francisco Visual cue. Shape: Angular
EG. Auditory: High pitch, Olfactory: Lemon CG. Only visual content
V6Theme. Bouncing balls
Visual cue. Shape: Round
EG. Auditory: Low pitch, Olfactory: Raspberry
CG. Only visual content
Multimedia Tools and Applications (2020) 79:7987–8009 7995

& Gaze points - as a measure of visual attention and interest. These were collected as a set of(x,y) pixel co-ordinates, with a sampling frequency of 30 Hz, matching the frame rate ofthe videos.
& Heart rate - as a measure of user emotional arousal whilst experiencing the system. TheMio Link wristband consists of an optical heart rate module (OHRM) that utilizesphotoplethysmography (PPG) to measure continuous heart rate alongside an accelerometerunit to measure and correct for movement artifacts [74]. Accelerometer data assessing auser’s movement is entered into an algorithm that compensates for movement artifacts inthe optical signal. The raw data provided comprised heart rate readings sampled onceevery second.
Participants also completed a subjective questionnaire (Table 2) at the end of theexperiment. Each question was answered on a 5-item Likert scale, anchored at one endwith “Strongly Disagree” and with “Strongly Agree” at the other.
4 Results and discussion
In this section, we present analysis and discussion of results of the data obtained fromeye-tracker, heart-rate monitor, and on-screen QoE questionnaire (Table 2). Data wereanalyzed with the IBM Statistical Package for the Social Sciences (SPSS) for Windowsversion (release 23.0). An ANalysis Of VAriance (ANOVA), suitable to test the signif-icant differences of three or more categories, as well as one sample t-test and indepen-dent sample t-test, suitable to check whether a sample mean is statistically different froma hypothesized population mean, and, respectively, to identify significant differences
Table 2 Self-reported QoE questions
Item Description
Q1 The smell was relevant to the video clip I was watching.Q2 The smell came across strong.Q3 The smell was distracting.Q4 The smell was consistent with the video clip when released.Q5 The smell was annoying.Q6 The smell faded away slowly after watching the video clip.Q7 The smell enhanced my viewing experience.Q8 The sound was related to the video clip I was watching.Q9 The sound came across loud.Q10 The sound was distracting.Q11 The sound was annoying.Q12 The sound enhanced the sense of reality whilst watching the video clip.Q13 The sound enhanced my viewing experience.Q14 I enjoyed watching the video clip whilst wearing a Haptic Vest.Q15 The Haptic Vest effects were relevant to the video clip I was watching.Q16 The vibration was distracting.Q17 The vibration was annoying.Q18 The Haptic Vest effects enhanced the sense of reality whilst watching the video clip.Q19 The Haptic Vest effects enhanced my viewing experience.Q20 Overall, I enjoyed the multisensorial experience.
Multimedia Tools and Applications (2020) 79:7987–80097996

between two categories [65], were applied to analyze the participants’ responses. Asignificance level of p < 0.05 was adopted for the study.
4.1 Analysis of eye-gaze data
The eye gaze data was collected at a sampling rate of about the same as the frame rateand hence we obtained a total of 3600 eye gaze (30 eye gaze/s × 120 s) locations pereach video clip. As mentioned in Section 3.2, the viewing area for the videos measures1000 × 700 pixels and it is centered on a 1366 × 768 pixels screen.
∑N
i¼1jΔGazeij;where1 < i < N ;N ¼ 400viewing cells=frame ð1Þ
For analysis purposes, this viewing area is partitioned in 20 equal segments across both the X andYaxes, resulting in a total of 400 eye gaze cells of 50 × 35 pixels each. For each such cell of a particularvideo frame, we first counted the number of individuals, in the CG and EG respectively, whose eyegaze fell into it. We then calculated, for each video frame, the summation of the absolute differencesin eye gaze count between the EG and CG across all cells, as shown in eq. (1).
In this regard, the minimum and maximum eye gaze difference count between the EG and CGare Min Δ= 0 and Max Δ= 12, respectively. For example, Fig. 2 shows the eye gaze count at the50th frame of video 1 observed from participants in both CG and EG.
The eye gaze data for all the videos is represented in heat maps in Fig. 3. This is split into EG (onthe left side) andCG (on the right side). The videos are sequenced in rows fromV1 toV6. As can beseen in V1, the EG seemed to explore the scenario whereas the CG focused in diversified points. Incontrast, EG participants had broader scan patterns in V2. In V3 and V4, which contain lowbrightness and high brightness respectively, the EG focused on the lower part of the viewing areawhere white standouts, although most of the times V3 presents a dark area. V5 presents the angular
Fig. 2 Points where the participants gazed at the 50th frame of video V1 (X ∈ EG, O ∈ CG)
Multimedia Tools and Applications (2020) 79:7987–8009 7997

shapes in dynamic sequences, which means they were spread out. Here, CG participants examinedthe video with more dispersed gaze patterns compared to the EG. The heat map suggested that thelatter wasmore focusedwhen exposed to angular shapes, high pitch, and lemon. Finally, in V6, bothgroups focused their attention on the circular shapes in different positions on the screen.
Fig. 3 General heat map across the video clips. Red means most viewed and most fixated on. Yellow refers tosome views, but less fixation. Green indicates less views and fixations. Blue suggests least viewed and hardly anyfixations. White indicates hardly any views and no fixations
Multimedia Tools and Applications (2020) 79:7987–80097998

In order to analyze the eye gaze data, a one sample t-test of the eye gaze difference count wasperformed and is shown in Table 3. The result reveals that there are statistically significantdifferences in eye gaze between the EG and CG for all the six videos (p< 0.05). However, as thedifference between the groups was the audio soundtrack (the CG had no soundtrack, whilst the EGhad a mapped high/low pitch sound), and smell effects (the CG had no smell whilst the EG hadcongruent smell), we cannot deduce that the difference in eye gaze count is due to the difference inbetween groups in the experienced audio (and haptic effect), smell or both. Thus, further analysis isprovided in the subsequent sections to identify the impact of each.
4.2 Analysis of heart rate data
As a physiologicalmetric, we employed heart rate datawhichwas collected at the rate of one readingper second and measured in beats per minute (bpm). Accordingly, we collected 120 heart ratereadings for each video. The heart rate readings from the CG varied between 60 bpm and 100 bpmwhilst, for the EG, these ranged between 75 bpm and 110 bpm, with the means for each videoillustrated in Fig. 4.
In Fig. 5 we present the mean heart rate gathered every second for each of the six videos in bothCG and EG. We observe a tendency for a higher heart rate in the EG for the whole duration of thevideos In order to understand whether this tendency is statistically significant, we undertook an
Fig. 4 Average heart rate data for all video clips
Table 3 One sample t-test of eye gaze difference count
Video Sig. (2-tailed) Mean difference 95% Confidence
Lower Upper
V1 .000 −3.724 −3.75 −3.70V2 .000 −5.005 −5.03 −4.98V3 .000 −5.284 −5.31 −5.26V4 .000 −4.622 −4.65 −4.60V5 .000 −4.754 −4.78 −4.73V6 .000 −5.700 −5.72 −5.68
Multimedia Tools and Applications (2020) 79:7987–8009 7999

independent samples t-test, the results ofwhich are shown in Table 4. The results in Table 4 evidencea statistically significant difference between the heart rates of the two groups for all the videos. Thisindicates that the two groups experienced a different mood in the two setups: (i) the one usingcrossmodally matching sound and smell (EG) and (ii) the one where no sound and smell wereprovided to the visual dominant features (CG). We remind the reader that the sound served as aninput also for the vibrotactile feedback.
Table 4 Independent samples t-test of heart rate data
Video Sig. (2-tailed) Mean Difference Std. Error Difference 95% Confidence Interval
Lower Upper
V1 .000 23.061 .841 21.404 24.718V2 .000 08.260 .456 07.360 09.159V3 .000 12.518 .368 11.793 13.243V4 .000 15.700 .718 14.286 17.114V5 .000 13.996 .389 13.230 14.761V6 .000 19.371 .553 18.281 20.461
Fig. 5 Average heart rate data (bmp) of the participants for each video
Multimedia Tools and Applications (2020) 79:7987–80098000

4.3 Analysis of self-reported QoE
Participants self-reported QoE by answering a series of 20 Likert scale questions, as shown inTable 2. For analysis, we converted the scores of each negatively-phrased questions (Q2, Q3, Q5,Q6, Q9, Q10, Q11, Q16, and Q17) to the equivalent score associated with a positively-phrasedcounterpart.
Initially, we performed a two way ANOVA with group type and video type as independentvariables and the responses to the 20 QoE questions as the dependent variables, the results of whichare presented in Table 5. As can be seen, there is a statistically significant difference between the EGand CG (Group) for all questions except Q3, Q5, Q14, and Q17; and the difference in QoE betweenthe videos (Video) is statistically insignificant. Table 5 also shows that the interaction of theindependent variables (Group*Video) has generally statistically insignificant effect for all questionson the self-reported QoE (dependent variable) except for Q15. Accordingly, a Post Hoc Tukey testanalysis was conducted on all questions (except Q15), which also resulted in statistically insignif-icant values.
The mean and standard deviation in the self-reported QoE is 3.07 and 1.18 for the EG,respectively; and 2.91 and 1.16 for the CG, respectively. Farther explanation corresponding to eachof the questions with respect to the results in Table 5 and Figure 6 is presented next.
& In the case ofQ1, the mean response is significantly higher (2.69) in EG than the CG. Thisimplies that respondents have noticed the relevance of the various smells rendered for therespective video clips.
& In Q2, the average is significant (3.83) in the CG which shows that there was intensityvariation in the rendering of the smell effect across the video clips.
Table 5 ANOVA multivariate test result for each question
Source Dep.Var.
df F Sig. Source Dep.Var.
df F Sig. Source Dep.Var.
df F Sig.
Group Q1 1 158.401 .000 Video Q1 5 .259 .933 Group *Video
Q1 5 .259 .933Q2 1 16.425 .000 Q2 5 .279 .923 Q2 5 .123 .987Q3 1 .255 .616 Q3 5 .483 .788 Q3 5 .206 .959Q4 1 12.712 .001 Q4 5 .395 .850 Q4 5 .780 .568Q5 1 .048 .828 Q5 5 .679 .641 Q5 5 .134 .984Q6 1 12.859 .001 Q6 5 .321 .898 Q6 5 1.813 .124Q7 1 11.463 .001 Q7 5 .979 .438 Q7 5 1.080 .381Q8 1 34.845 .000 Q8 5 1.299 .276 Q8 5 1.536 .192Q9 1 23.937 .000 Q9 5 .507 .770 Q9 5 .480 .790Q10 1 15.123 .000 Q10 5 .437 .821 Q10 5 1.049 .397Q11 1 8.485 .005 Q11 5 .831 .533 Q11 5 1.602 .173Q12 1 15.961 .000 Q12 5 1.113 .363 Q12 5 .916 .477Q13 1 15.805 .000 Q13 5 .293 .915 Q13 5 .702 .624Q14 1 .890 .349 Q14 5 .235 .946 Q14 5 .655 .659Q15 1 18.211 .000 Q15 5 1.060 .391 Q15 5 2.398 .048Q16 1 11.598 .001 Q16 5 .113 .989 Q16 5 .124 .987Q17 1 3.882 .053 Q17 5 .346 .883 Q17 5 .553 .736Q18 1 18.728 .000 Q18 5 .798 .556 Q18 5 .832 .532Q19 1 11.523 .001 Q19 5 .415 .837 Q19 5 .933 .466Q20 1 5.738 .020 Q20 5 .384 .858 Q20 5 .193 .964
Multimedia Tools and Applications (2020) 79:7987–8009 8001
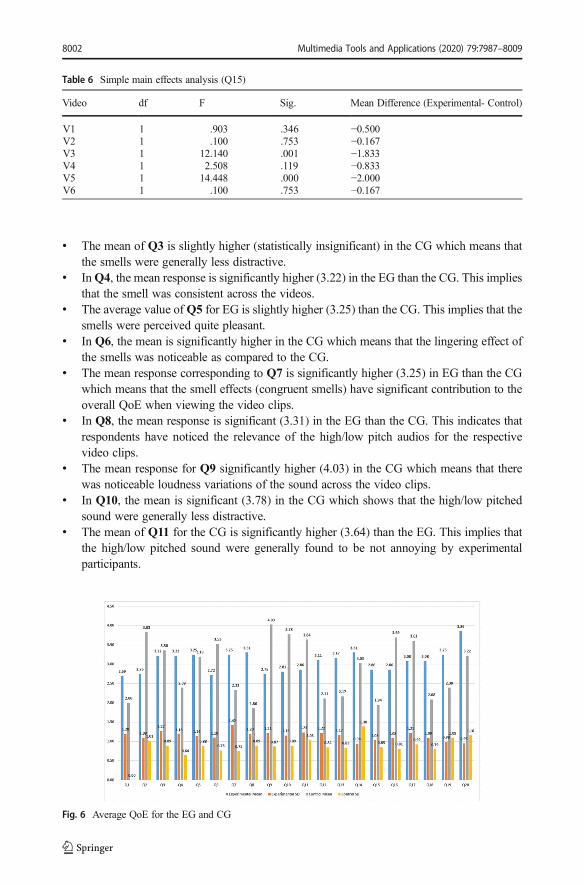
& The mean of Q3 is slightly higher (statistically insignificant) in the CG which means thatthe smells were generally less distractive.
& InQ4, the mean response is significantly higher (3.22) in the EG than the CG. This impliesthat the smell was consistent across the videos.
& The average value ofQ5 for EG is slightly higher (3.25) than the CG. This implies that thesmells were perceived quite pleasant.
& In Q6, the mean is significantly higher in the CG which means that the lingering effect ofthe smells was noticeable as compared to the CG.
& The mean response corresponding to Q7 is significantly higher (3.25) in EG than the CGwhich means that the smell effects (congruent smells) have significant contribution to theoverall QoE when viewing the video clips.
& In Q8, the mean response is significant (3.31) in the EG than the CG. This indicates thatrespondents have noticed the relevance of the high/low pitch audios for the respectivevideo clips.
& The mean response for Q9 significantly higher (4.03) in the CG which means that therewas noticeable loudness variations of the sound across the video clips.
& In Q10, the mean is significant (3.78) in the CG which shows that the high/low pitchedsound were generally less distractive.
& The mean of Q11 for the CG is significantly higher (3.64) than the EG. This implies thatthe high/low pitched sound were generally found to be not annoying by experimentalparticipants.
Fig. 6 Average QoE for the EG and CG
Table 6 Simple main effects analysis (Q15)
Video df F Sig. Mean Difference (Experimental- Control)
V1 1 .903 .346 −0.500V2 1 .100 .753 −0.167V3 1 12.140 .001 −1.833V4 1 2.508 .119 −0.833V5 1 14.448 .000 −2.000V6 1 .100 .753 −0.167
Multimedia Tools and Applications (2020) 79:7987–80098002

& In Q12, the average response is significantly higher (3.11) in the EG than the CG. Thismeans that the high/low pitched sound (which were congruent to the visual features of thevideo clips) has triggered a sense of reality that significantly enhances the overall QoE.
& The mean answer for Q13 is significant (3.17) in the EG which signifies that the soundeffect contributed to the overall QoE when viewing the video clips.
& InQ14, the average response of EG is slightly higher (3.31) than the CG. This denotes thatthe haptic effects which were automatically generated out of the content-congruent soundhave contributed to the enjoyment.
& The mean score of the EG in Q15 is significant (2.86) which shows that respondents havenoticed the relevance of the haptic effect for the respective videos.
& In Q16, the mean QoE is significantly higher (3.69) in the CG than the EG which meansthat the vibrations on the chest while wearing the haptic vest had certain distractive effects.
& The mean of Q17 is slightly higher (3.61) in the CG. This implies that the haptic effectsgenerated out of the high/low pitched sound were generally not significantly annoying.
& In Q18, the mean is significant (3.08) in the EG which indicates that the haptic effect(generated out of the high/low pitched sound which is congruent to the visual features ofthe videos) has significantly enhanced the sense of reality while watching the video clips.
& The mean value corresponding to Q19 is significantly higher (3.25) in EG than the CG.This means that the haptic effects generated out of the content-congruent sound havesignificant contribution to the overall QoE when viewing the video clips.
& InQ20, the mean is significantly higher (3.86) in the EG than the CG. This implies that thecombined multisensorial effect of the content-congruent smell, sound, and the auto-generated haptic has contributed to the enjoyment while watching the video clips.
Because the interaction of the independent variables (Group*Video) for Q15 showed a statisti-cally significant value, we conducted simple main effect analysis (Table 6). Thus, V3 and V5showed statistically significant lower scores obtained from the EG compared to their CG counter-parts (F(1,60) = 12.140, p < .05 and F(1,60) = 14.448, respectively) which implies that the hapticeffects generated out of the content-congruent soundwas significantly less relevant to the video clipshaving more dark and angular features than the other four video clips. However, in the case of V1,V2, V4, and V6, differences in participant scores between the two groups were not significant.
The results corresponding to most of the self-reported QoE questions indicated thatthe content-congruent smell, sound, and the auto-generated haptic effects have enhancedthe users’ QoE while watching the video clips. This is substantiated by the meanresponses of the EG and CG for all the questions (3.07 and 2.91, respectively); andthe statistically significant difference values corresponding to most of the questions in(Table 5) which implies that the cross-modally mapped (overall) multisensorial settinghas enhanced the QoE.
In general, our analysis of the difference in eye gaze count (Table 3) and heat map ofthe eye gaze patterns (Fig. 3) showed that the cross-modally mapped multisensorialeffects have significantly influenced the users’ perception. Significantly high heart raterecording is also observed due to the introduction of multisensorial effects in the EG ofparticipants (Table 4, Fig. 5). Additionally, analysis of the self-reported QoE evidencedthe eye gaze and heart results revealing that the multisensorial effects involving content-congruent high/low pitch sound, smell, and haptic have significantly enhanced the QoE.
Multimedia Tools and Applications (2020) 79:7987–8009 8003
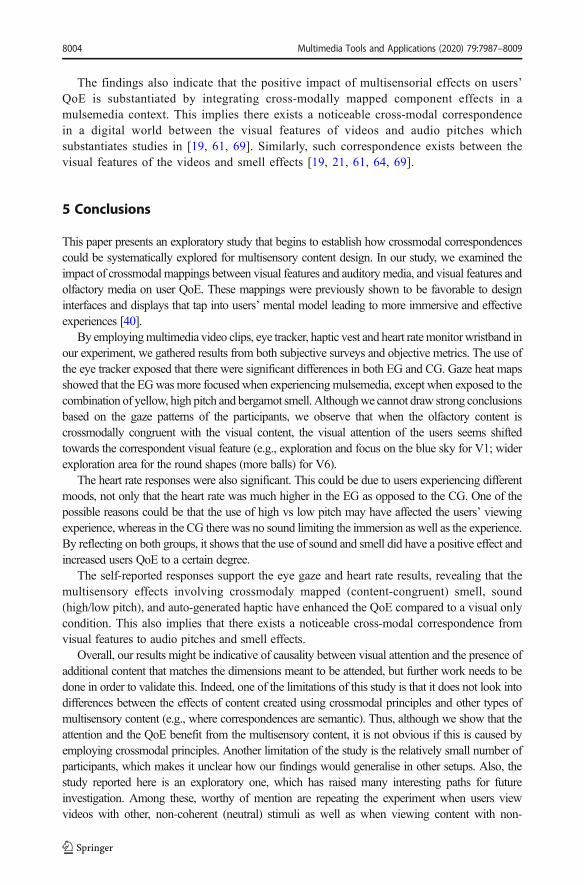
The findings also indicate that the positive impact of multisensorial effects on users’QoE is substantiated by integrating cross-modally mapped component effects in amulsemedia context. This implies there exists a noticeable cross-modal correspondencein a digital world between the visual features of videos and audio pitches whichsubstantiates studies in [19, 61, 69]. Similarly, such correspondence exists between thevisual features of the videos and smell effects [19, 21, 61, 64, 69].
5 Conclusions
This paper presents an exploratory study that begins to establish how crossmodal correspondencescould be systematically explored for multisensory content design. In our study, we examined theimpact of crossmodal mappings between visual features and auditory media, and visual features andolfactory media on user QoE. These mappings were previously shown to be favorable to designinterfaces and displays that tap into users’ mental model leading to more immersive and effectiveexperiences [40].
By employingmultimedia video clips, eye tracker, haptic vest and heart ratemonitorwristband inour experiment, we gathered results from both subjective surveys and objective metrics. The use ofthe eye tracker exposed that there were significant differences in both EG and CG. Gaze heat mapsshowed that the EGwasmore focused when experiencingmulsemedia, except when exposed to thecombination of yellow, high pitch and bergamot smell. Althoughwe cannot draw strong conclusionsbased on the gaze patterns of the participants, we observe that when the olfactory content iscrossmodally congruent with the visual content, the visual attention of the users seems shiftedtowards the correspondent visual feature (e.g., exploration and focus on the blue sky for V1; widerexploration area for the round shapes (more balls) for V6).
The heart rate responses were also significant. This could be due to users experiencing differentmoods, not only that the heart rate was much higher in the EG as opposed to the CG. One of thepossible reasons could be that the use of high vs low pitch may have affected the users’ viewingexperience, whereas in the CG there was no sound limiting the immersion as well as the experience.By reflecting on both groups, it shows that the use of sound and smell did have a positive effect andincreased users QoE to a certain degree.
The self-reported responses support the eye gaze and heart rate results, revealing that themultisensory effects involving crossmodaly mapped (content-congruent) smell, sound(high/low pitch), and auto-generated haptic have enhanced the QoE compared to a visual onlycondition. This also implies that there exists a noticeable cross-modal correspondence fromvisual features to audio pitches and smell effects.
Overall, our results might be indicative of causality between visual attention and the presence ofadditional content that matches the dimensions meant to be attended, but further work needs to bedone in order to validate this. Indeed, one of the limitations of this study is that it does not look intodifferences between the effects of content created using crossmodal principles and other types ofmultisensory content (e.g., where correspondences are semantic). Thus, although we show that theattention and the QoE benefit from the multisensory content, it is not obvious if this is caused byemploying crossmodal principles. Another limitation of the study is the relatively small number ofparticipants, which makes it unclear how our findings would generalise in other setups. Also, thestudy reported here is an exploratory one, which has raised many interesting paths for futureinvestigation. Among these, worthy of mention are repeating the experiment when users viewvideos with other, non-coherent (neutral) stimuli as well as when viewing content with non-
Multimedia Tools and Applications (2020) 79:7987–80098004

congruent stimuli. All are valuable future pursuits. Further work could also be done to explore whatcontent is more appealing to users. Categorizing the content into different topics and carrying out apilot study amongst few users will provide us with what types of media content they would prefer towatch. Moreover, odors influence mood, work performance, and many other forms of behavior andthis has been evidenced in our study. We intend to further investigate in the future by comparingoriginal sound with altered high and low pitch as well as looking at employing additional, differentodors for crossmodal matching.
Acknowledgments This paper was funded by the European Union’s Horizon 2020 Research and Innovationprogramme under Grant Agreement no. 688503. Estêvão B. Saleme thankfully acknowledges support from IFESand CAPES (process no. 88881.187844/2018-01).
Open Access This article is licensed under a Creative Commons Attribution 4.0 International License, whichpermits use, sharing, adaptation, distribution and reproduction in any medium or format, as long as you giveappropriate credit to the original author(s) and the source, provide a link to the Creative Commons licence, andindicate if changes were made. The images or other third party material in this article are included in the article'sCreative Commons licence, unless indicated otherwise in a credit line to the material. If material is not includedin the article's Creative Commons licence and your intended use is not permitted by statutory regulation orexceeds the permitted use, you will need to obtain permission directly from the copyright holder. To view a copyof this licence, visit http://creativecommons.org/licenses/by/4.0/.
References
1. Ademoye OA, Ghinea G (2013) Information recall task impact in olfaction-enhanced multimedia. ACMTransactions on Multimedia Computing, Communications, and Applications (TOMM) 9(3):17
2. Ademoye OA, Murray N, Muntean G-M, Ghinea G (2016, 2016) Audio masking effect on inter-componentskews in olfaction-enhanced multimedia presentations. ACM Transactions on Multimedia Computing,Communications, and Applications (TOMM) 12(4):–51
3. Brkic BR, Chalmers A, Boulanger K, Pattanaik S, Covington J (2009) Cross-modal affects of smell on thereal-time rendering of grass. In Proceedings of the 25th Spring Conference on Computer Graphics. ACM,161–166
4. Brunnström K, Beker SA, De Moor K, Dooms A, Egger S, Garcia M-N, Hossfeld T, Jumisko-Pyykkö S,Keimel C, Larabi M-C et al (2013) Qualinet white paper on definitions of quality of experience
5. Choi B, Lee ES, Yoon K (2011) Streaming media with sensory effect. In: Information Science andApplications (ICISA), 2011 International Conference on. IEEE, 1–6. 10.1109/ICISA.2011.5772390
6. Covaci A, Zhou L, Tal I, Muntean G-M, Ghinea G (2018) Is multimedia multisensorial? - a review ofMulsemedia systems. ACM Computing Surveys (CSUR), 35 pages. In press. https://bura.brunel.ac.uk/bitstream/2438/16449/1/Fulltext.pdf
7. Crisinel A-S, Spence C (2009) Implicit association between basic tastes and pitch. Neurosci Lett 464(1):39–42
8. Dalmaijer A (2014) Is the low-cost EyeTribe eye tracker any good for research? Peer J PrePrints9. Danieau A, Lécuyer A, Guillotel P, Fleureau J, Mollet N, Christie M (2013) Enhancing audiovisual
experience with haptic feedback: a survey on HAV. IEEE Transactions on Haptics 6(2):193–20510. de Valk JM, Wnuk E, Huisman JLA, Majid A (2017) Odor–color associations differ with verbal descriptors
for odors: a comparison of three linguistically diverse groups. Psychon Bull Rev 24(4):1171–1179.https://doi.org/10.3758/s13423-016-1179-2
11. M. L. Demattè, D. Sanabria, and C. Spence. 2006. Cross-Modal Associations Between Odors and Colors.Chemical Senses 31, 6 (2006), 531–538. https://doi.org/10.1093/chemse/bjj057
12. Deroy O, Spence C (2013) Why we are not all synesthetes (not even weakly so). Psychonomic Bulletin &Review 20, 4 (01 Aug 2013), 643–664. https://doi.org/10.3758/s13423-013-0387-2
13. Egan D, Brennan S, Barrett J, Qiao Y, Timmerer C, Murray N (2016) An evaluation of heart rate andElectroDermal activity as an objective QoE evaluation method for immersive virtual reality environments.In: Quality of Multimedia Experience (QoMEX), 2016 Eighth International Conference on. IEEE, 1–6
Multimedia Tools and Applications (2020) 79:7987–8009 8005

14. Eid M, Cha J, El Saddik A (2008) HugMe: A haptic videoconferencing system for interpersonal commu-nication. In Virtual Environments, Human-Computer Interfaces and Measurement Systems. VECIMS 2008.IEEE Conference on IEEE, 5–9
15. Gal D, Wheeler SC, Shiv B (2007) Cross-modal influences on gustatory perception16. Ghinea G, Ademoye O (2012) The sweet smell of success: enhancing multimedia applications with
olfaction. ACM Transactions on Multimedia Computing, Communications, and Applications (TOMM)8(1):2
17. G. Ghinea, F. Andres, and S. R. Gulliver. 2011. Multiple sensorial media advances and applications: newdevelopments in MulSeMedia: new developments in MulSeMedia. Information Science Reference
18. Ghinea G, Timmerer C, Lin W, Gulliver SR (2014) Mulsemedia: State of the art, perspectives, andchallenges. ACM Trans. Multimedia Comput. Commun. Appl., 11(1s):17:1–17:23
19. Gilbert N, Martin R, Kemp SE (1996) Cross-modal correspondence between vision and olfaction: the colorof smells. Am J Psychol 1996:335–351
20. Hagtvedt H, Brasel SA (2016) Cross-Modal Communication: Sound Frequency Influences ConsumerResponses to Color Lightness. J Mark Res 53(4):551–562
21. Hanson-Vaux G, Crisinel A-S, Spence C (2012) Smelling shapes: Crossmodal correspondences betweenodors and shapes. Chem Senses 38(2):161–166
22. Hoggan E, Brewster SA (2006) Mobile crossmodal auditory and tactile displays. In Proceedings of HAID2006: First International Workshop on Haptic and Audio Interaction Design. 9–12
23. Huisman G, Bruijnes M, Heylen DK (2016) A moving feast: effects of color, shape and animation on tasteassociations and taste perceptions. In: Proceedings of the 13th International Conference on Advances inComputer Entertainment Technology. ACM, 13
24. Hulusić V, Czanner G, Debattista K, Sikudova E, Dubla P, Chalmers A (2009) Investigation of the beat rateeffect on frame rate for animated content. In: Proceedings of the 25th Spring Conference on ComputerGraphics. ACM, 151–159
25. Hulusic V, Debattista K, Aggarwal V, Chalmers A (2010) Exploiting audio-visual cross-modal interaction toreduce computational requirements in interactive environments. In: Games and Virtual Worlds for SeriousApplications (VS-GAMES), 2010 Second International Conference on. IEEE, 126–132
26. Jacquot M, Noel F, Velasco C, Spence C (2016) On the Colours of Odours. Chemosens Percept 9(2):79–93.https://doi.org/10.1007/s12078-016-9209-z
27. Jalal L, Anedda M, Popescu V, Murroni M (2018) QoE Assessment for IoT-Based Multi Sensorial MediaBroadcasting. IEEE Trans Broadcast 64(2):552–560. https://doi.org/10.1109/TBC.2018.2823914
28. Jezler O, Gatti E, Gilardi M, Obrist M (2016) Scented Material: Changing Features of Physical CreationsBased on Odors. In Proceedings of the 2016 CHI conference extended abstracts on human factors incomputing systems (CHI EA ‘16). ACM, New York, 1677–1683. 10.1145/2851581.2892471
29. Jokinen JPP (2015) Emotional user experience and feeling of control. In Proceedings of the 19thInternational Academic Mindtrek Conference (AcademicMindTrek ‘15). ACM, New York, 163–166.10.1145/2818187.2818284
30. Keighrey C, Flynn R, Murray S, Murray N (2017) A QoE evaluation of immersive augmented and virtualreality speech & language assessment applications. In: Quality of Multimedia Experience (QoMEX), 2017Ninth International Conference on. IEEE, 1–6
31. Kemp SE, Gilbert AN (1997) Odor intensity and color lightness are correlated sensory dimensions. Am JPsychol 110(1):35
32. Kim S-K (2013) Authoring multisensorial content. Signal Process Image Commun 28(2):162–167.https://doi.org/10.1016/j.image.2012.10.011
33. Kim S-K, Yang S-J, Ahn CH, Joo YS (2014) Sensorial Information Extraction and Mapping to GenerateTemperature Sensory Effects. ETRI J 36(2):224–231. https://doi.org/10.4218/etrij.14.2113.0065
34. Koelstra S, Muhl C, Soleymani M, Lee J-S, Yazdani A, Ebrahimi T, Pun T, Nijholt A, Patras I (2012) Deap:A database for emotion analysis; using physiological signals. IEEE Trans Affect Comput 3(1):18–31
35. Koizumi N, Tanaka H, Uema Y, Inami M (2011) Chewing jockey: augmented food texture by using soundbased on the cross-modal effect. In: Proceedings of the 8th International Conference on Advances inComputer Entertainment Technology. ACM, 21
36. Marks LE (1974) On associations of light and sound: the mediation of brightness, pitch, and loudness. Am JPsychol:173–188
37. Marks LE (1987) On cross-modal similarity: Auditory–visual interactions in speeded discrimination. J ExpPsychol Hum Percept Perform 13(3):384
38. Mastoropoulou G (2007) The effect of audio on the visual perception of high-fidelity animated 3d computergraphics. Ph.D. Dissertation. University of Bristol
Multimedia Tools and Applications (2020) 79:7987–80098006

39. Mastoropoulou G, Debattista K, Chalmers A, Troscianko T (2005) Auditory bias of visual attention forperceptually-guided selective rendering of animations. In: Proceedings of the 3rd international conferenceon Computer graphics and interactive techniques in Australasia and South East Asia. ACM, 363–369
40. Metatla O, Maggioni E, Cullen C, Obrist M (2019) "Like popcorn": Crossmodal correspondences betweenscents, 3D shapes and emotions in children. In Proceedings of the 2019 CHI Conference on Human Factorsin Computing Systems (p. 459). ACM
41. Möller S, Raake A (2014) Quality of Experience: Advanced Concepts, Applications andMethods. Springer,Cham. https://doi.org/10.1007/978-3-319-02681-7
42. Monks J, Olaru A, Tal I, Muntean GM (2017) Quality of experience assessment of 3D video synchronisedwith multisensorial media components. In: 2017 IEEE International Symposium on Broadband MultimediaSystems and Broadcasting (BMSB). 1–6. 10.1109/BMSB.2017.7986129
43. Munster G, Jakel T, Clinton D, Murphy E (2015) Next mega tech theme is virtual reality. Gene 612:303–6452
44. Murray N, Ademoye OA, Ghinea G, Muntean G-M (2017a) A tutorial for olfaction-based multisensorialmedia application design and evaluation. ACM Computing Surveys (CSUR) 50(5):67
45. Murray N, Lee B, Qiao Y, Muntean G-M (2014) Multiple-scent enhanced multimedia synchronization.ACM Trans. Multimedia Comput. Commun. Appl. 11, 1s, article 12, 28 pages. 10.1145/2637293
46. N. Murray, B. Lee, Y. Qiao, and G. M. Muntean. 2016. The influence of human factors on olfaction basedmulsemedia quality of experience. In 2016 Eighth International Conference on Quality of MultimediaExperience (QoMEX). 1–6. 10.1109/QoMEX.2016.7498975
47. Murray N, Lee B, Qiao Y, Muntean G-M (2017b) The Impact of Scent Type on Olfaction-EnhancedMultimedia Quality of Experience. IEEE Transactions on Systems, Man, and Cybernetics: Systems 47(9):2503–2515. https://doi.org/10.1109/TSMC.2016.2531654
48. Oh H-W, Huh J-D (2017) Auto generation system of MPEG-V motion sensory effects based on mediascene. In Consumer Electronics (ICCE), 2017 IEEE International Conference on. IEEE, 160–163. 10.1109/ICCE.2017.7889269
49. B. Rainer, M. Waltl, E. Cheng, M. Shujau, C. Timmerer, S. Davis, I. Burnett, C. Ritz, and H. Hellwagner.2012. Investigating the impact of sensory effects on the quality of experience and emotional response in webvideos. In 4th International Workshop on Quality of Multimedia Experience (QoMEX’12). http://www-itec.uni-klu.ac.at/bib/files/QoMEx2012_UserStudy.pdf
50. Ramic-Brkic B, Chalmers A, Sadzak A, Debattista K, Sultanic S (2013) Exploring multiple modalities forselective rendering of virtual environments. In: Proceedings of the 29th Spring Conference on ComputerGraphics. ACM, 91–98
51. Ranasinghe N, Lee K-Y, Do EYL (2014) FunRasa: an interactive drinking platform. In: Proceedings of the8th International Conference on Tangible, Embedded and Embodied Interaction. ACM, 133–136
52. Ranasinghe N, Nguyen TNT, Liangkun Y, Lin L-Y, Tolley D, Do EYL (2017) Vocktail: AVirtual Cocktailfor Pairing Digital Taste, Smell, and Color Sensations. In: Proceedings of the 2017 ACM on multimediaconference. ACM, 1139–1147
53. Rousi RA, Silvennoinen JM, Perälä PMH, Jokinen JPP (2017) Beyond MAYA for game-changingmultisensory design. In: Proceedings of the 21st International Academic Mindtrek Conference(AcademicMindtrek ‘17). ACM, New York, 147–153. 10.1145/3131085.3131113
54. Sakai N, Imada S, Saito S, Kobayakawa T, Deguchi Y (2005) The effect of visual images on perception ofodors. Chem Senses 30(Suppl 1):i244–i245
55. Saleme EB, Santos CAS (2015) PlaySEM: a platform for rendering MulSeMedia compatible with MPEG-V. In: Proceedings of the 21st Brazilian Symposium on Multimedia and the Web (WebMedia ‘15). ACM,New York, 145–148. 10.1145/2820426.2820450
56. Saleme EB, Santos CAS, Falbo RA, Ghinea G, Andres F (2018b) Towards a reference ontology onMulsemedia systems. In Proceedings of International Conference on Management of Emergent DigitalEcoSystems, Tokyo, (MEDES’18). 8 pages. In press. https://www.dropbox.com/s/vn39mi425a78q3t/4.pdf?dl=0
57. Saleme EB, Santos CAS, Ghinea G (2018a) Coping with the challenges of delivering multiple sensorialmedia. IEEE MultiMedia, 11 pages. In press. https://bura.brunel.ac.uk/handle/2438/16592
58. Seo H-S, Arshamian A, Schemmer K, Scheer I, Sander T, Ritter G, Hummel T (2010) Cross-modalintegration between odors and abstract symbols. Neurosci Lett 478(3):175–178. https://doi.org/10.1016/j.neulet.2010.05.011
59. Shin S-H, Ha K-S, Yun H-O, Nam Y-S (2016) Realistic media authoring tool based on MPEG-Vinternational standard. In: Ubiquitous and Future Networks (ICUFN), 2016 Eighth InternationalConference on. IEEE, 730–732. 10.1109/ICUFN.2016.7537133
60. Simner J, Ludwig V (2009) What colour does that feel? Cross-modal correspondences from touch to colour.Granada, Third International Conference of Synaesthesia and Art
Multimedia Tools and Applications (2020) 79:7987–8009 8007

61. Simpson RH, Quinn M, Ausubel DP (1956) Synesthesia in children: Association of colors with pure tonefrequencies. J Genet Psychol 89(1):95–103
62. Spector FJ, Maurer D (2012) Making sense of scents: the colour and texture of odours. Seeing andPerceiving 25(6):655–677
63. Spence C (2010) The color of wine–part 1. The World of Fine Wine 28(2010):122–12964. Spence C (2011) Crossmodal correspondences: A tutorial review. Attention, Perception, & Psychophysics
73(4):971–99565. Stephen P, Hornby S (1997) Simple statistics for library and information professionals66. Streeter NL, White TL (2011) Incongruent contextual information intrudes on short-term olfactory memory.
Chemosens Percept 4(1–2):1–867. Striner A (2018) Can Multisensory Cues in VR Help Train Pattern Recognition to Citizen Scientists? arXiv
preprint arXiv:1804.0022968. Sulema Y (2016) Mulsemedia vs. Multimedia: state of the art and future trends. In Systems, Signals and
Image Processing (IWSSIP), 2016 International Conference on. IEEE, 1–569. Sun X, Li X, Ji L, Han F, Wang H, Liu Y, Chen Y, Lou Z, Li Z (2018) An extended research of crossmodal
correspondence between color and sound in psychology and cognitive ergonomics. Peer J 6:e4443.https://doi.org/10.7717/peerj.4443
70. Tag B, Goto T, Minamizawa K, Mannschreck R, Fushimi H, Kunze K (2017) atmoSphere: mindfulnessover haptic-audio cross modal correspondence. In: Proceedings of the 2017 ACM International JointConference on Pervasive and Ubiquitous Computing and Proceedings of the 2017 ACM InternationalSymposium on Wearable Computers. ACM, 289–292
71. Tanaka A, Parkinson A (2016) Haptic wave: A cross-modal interface for visually impaired audio producers.In Proceedings of the 2016 CHI conference on human factors in computing systems. ACM, 2150–2161
72. Tsiros A (2017) The parallels between the study of cross-modal correspondence and the design of cross-sensory mappings. In: Proceedings of the conference on Electronic Visualisation and the Arts. BCSLearning & Development Ltd., 175–182
73. Ur Réhman S, Khan MSL, Li L, Li H (2014) Vibrotactile TV for immersive experience. In Signal andInformation Processing Association Annual Summit and Conference (APSIPA), 2014 Asia-Pacific. IEEE,1–4
74. Valenti G, Westerterp KR (2013) Optical heart rate monitoring module validation study. In: ConsumerElectronics (ICCE), 2013 IEEE International Conference on. IEEE, 195–196
75. Waltl M, Rainer B, Timmerer C, Hellwagner H (2013) An end-to-end tool chain for Sensory Experiencebased on MPEG-V. Signal Process Image Commun 28(2):136–150. https://doi.org/10.1016/j.image.2012.10.009
76. Waltl M, Timmerer C, Hellwagner H (2010) Improving the quality of multimedia experience throughsensory effects. In 2010 Second International Workshop on Quality of Multimedia Experience (QoMEX).124–129. 10.1109/QOMEX.2010.5517704
77. Yau JM, Olenczak JB, Dammann JF, Bensmaia SJ (2009) Temporal frequency channels are linked acrossaudition and touch. Curr Biol 19(7):561–566
78. Yuan Z, Bi T, Muntean GM, Ghinea G (2015a) Perceived synchronization of Mulsemedia services. IEEETransactions on Multimedia PP(99):1. https://doi.org/10.1109/TMM.2015.2431915
79. Yuan Z, Chen S, Ghinea G, Muntean G-M (2014) User quality of experience of mulsemedia applications.ACM Transactions on Multimedia Computing, Communications, and Applications (TOMM) 11, 1s: 15.10.1145/2661329
80. Yuan Z, Ghinea G, Muntean G-M (2015b) Beyond multimedia adaptation: Quality of experience-awaremulti-sensorial media delivery. IEEE Transactions on Multimedia 17(1):104–117
81. Zou L, Tal I, Covaci A, Ibarrola E, Ghinea G, Muntean G-M (2017) Can multisensorial media improvelearner experience?. In Proceedings of the 8th ACM on Multimedia Systems Conference. ACM, 315–320
Publisher’s note Springer Nature remains neutral with regard to jurisdictional claims in published maps andinstitutional affiliations.
Affiliations
Gebremariam Mesfin1 & Nadia Hussain1 & Elahe Kani-Zabihi2 & Alexandra Covaci3 &
Estêvão B. Saleme4 & Gheorghita Ghinea1
Multimedia Tools and Applications (2020) 79:7987–80098008

Gebremariam [email protected]
Nadia [email protected]
Elahe [email protected]
Alexandra [email protected]
Estêvão B. [email protected]
1 Brunel University London, London, UK2 University of West London, London, UK3 University of Kent, Canterbury CT2 7NZ, UK4 Federal University of Espírito Santo, Vitória, ES 29075-910, Brazil
Multimedia Tools and Applications (2020) 79:7987–8009 8009