qrowd - because big data integration is humanly...
TRANSCRIPT

QROWD - Because Big Data Integration is Humanly
Possible Innovation action
D3.2 – Crowdsourcing services
Author/s Eddy Maddalena, and Luis-Daniel Ibáñez
(SOTON) Reviewed by Nines Sanguino (ATOS) Due date 31.05.2018 Version 1.1 Dissemination level PU Status Final
Project co-funded under Horizon 2020 Research and Innovation EU programme, grant agreement no. 732194

Crowdsourcing services
Table of contents LIST OF ABBREVIATIONS 3
ABSTRACT 4
EXECUTIVE SUMMARY 5
INTRODUCTION 6
CROWDSOURCING SERVICES 6
2.1 Completing mobility infrastructure (BC2-UC#3) 6
2.1.1 Virtual City Explorer (VCE) Component 7
2.1.1.1 General Description 7
2.1.1.2 Preliminary tests 8
2.1.1.3 Constraining areas 10
2.1.1.4 Pilot in Trento city 11
The “taboo” PoI 12
2.1.1.5 Task deployment 15
The polygon editor 15
Task deployer 16
Monitor 17
2.1.1.6 Next steps 17
2.2 Image annotation - QROWDsmith 18
2.2.1 Main concepts 19
2.2.2 Two approach of task assignment 19
2.2.3 User recruitment 20
2.2.4 Gamification and user customization 21
2.2.5 Available tasks 23
2.2.6 Future work 23
2.3 Modal split verification 23
2.3.1 Question-QROWD (BC2-UC#1) 24
2.4 Participatory sensing (through challenges) 31
Figure 10: Example of challenges 32
CONCLUSIONS 33
REFERENCES 34
D3.2 Page 2 of 34

Crowdsourcing services LIST OF ABBREVIATIONS DBSCAN Density-Based Spatial Clustering of Applications with
Noise POI Point Of Interest VCE Virtual City Explorer
D3.2 Page 3 of 34

Crowdsourcing services
ABSTRACT This deliverable describes the crowdsourcing services prototypes developed in the project, following from the initial design delivered in D3.1 and in connection with the Business Cases elicited in D2.2. The three services discussed are (i) the Virtual City Explorer for reducing the need of sending experts or contributors in place to complete mobility infrastructure maps. The VCE enables massive parallelisation of the task of exploring a city to locate mobility PoIs (ii) the QROWDSmith, a platform to leverage gamification to increase contributors' engagement for general Human Interaction Tasks, with particular focus on image annotation, and Entity Name disambiguation (iii) Question-QROWD, a manager for questions asked to citizens regarding the data traces they contribute towards modal split computation, together with the definition and management of Challenges connected to rewards and incentives to be offered to citizens in exchange for their data or work contribution.
D3.2 Page 4 of 34

Crowdsourcing services
EXECUTIVE SUMMARY This deliverable describes the three crowdsourcing services developed in the frame of the QROWD project: (i) the Virtual City Explorer component that allows discovering static Point of Interest in cities to complete mobility infrastructure; (ii) QROWDSmith: a gamified crowdsourcing platform that leveraging on gamification techniques engages volunteer contributors and improves the user experience of both volunteers and paid crowdworkers; (iii) the citizen questioning and challenges: a platform to manage citizen engagement for data collection activities. The document is of particular interest for any organisation exploring the use of the crowd to outsource data collection tasks to paid crowdworkers or improve the level of engagement with data subjects on which data is collected. In particular, technical leads of smart cities related projects that require direct engagement with citizens would benefit from the services described in this deliverable. Discussing three crowdsourcing solutions, D3.2 helps the readers by offering a view of the challenges that need to be tackled then aiming to a better contributor engagement. Different types of contributors such as paid crowdworkers, online volunteers, or citizens (who are the only ones that can perform in-place crowdsourcing tasks), are driven by different motivations, and for this reason, need to be engaged in different ways also relying on specific incentives. The prototypes presented in this deliverable follow the initial description given in D3.1 (Participatory framework). In the next deliverables, these prototypes will be improved with further time management strategies to increase the effectiveness of the crowdsourcing (D3.3). D3.5 will detail the deployment of the services to public endpoints.
D3.2 Page 5 of 34

Crowdsourcing services
1. INTRODUCTION This deliverable describes the state of advancement of the crowd services designed to support the project's use cases. The prototypes of each service and the results of conducted pilots are discussed. QROWD's crowd services are comprised by three components: (i) a "Virtual City Explorer", developed in the context of BC2-UC#3, that enables the exploration of virtual representations of cities (such as Google Street View) for the mapping of mobility points of interest. We improved the component, that was introduced in D3.1, by providing it with new functionalities which were tested in tasks with real crowdsourcing workers. Also, we describe an interface that will allow the users of the component (that we identified in the data scientists working from European municipalities), to set up and launch exploration tasks in custom areas, without the intervention of crowdsourcing experts. (ii) QROWDsmith (described in D3.1, Sec. 4.4), a platform for the gamification of tasks as a further engagement incentive, both for European citizens and crowdworkers. Particularly, we discuss the instantiation of urban mobility tasks related to the use cases. Finally, (iii) we discuss our platform to manage citizen engagement for data collection tasks via challenges. 2. CROWDSOURCING SERVICES In D3.1, we identified a set of crowdsourcing services based on the use cases of the project, matching specific phases of the Big Data Value Chain:
● Data generation and acquisition: ○ Participatory sensing through i-Log ○ Completing Mobility Infrastructure ○ Ideas competition (Described in D2.1)
● Data Integration: ○ Entity Named Service (Described in D7.2)
● Data Analysis: ○ Image annotation ○ Modal split verification.
This section describes the advancements made in the Crowd components corresponding to completing mobility infrastructure (Section 2.1), image annotation (Section 2.2) modal split verification (Section 2.3) and participatory sensing through challenges (Section 2.4).
2.1 Completing mobility infrastructure (BC2-UC#3) Maps of mobility infrastructure, like bike racks, specific types of parking spots (disabled, freight unload, etc) are not always complete. Records might have been lost, or infrastructure been installed privately, without being integrated with council data. Sending council experts around the city is expensive and time consuming, motivating alternative solutions.
D3.2 Page 6 of 34

Crowdsourcing services In D3.1 we presented a first version a solution that enables humans to explore virtual Street Imagery of cities from their PCs, to locate and report the coordinates of instances of a pre-defined type of mobility infrastructure. By taking advantage of the actions provided by the Street Imagery, i.e, the possibility of making long "jumps" (each jump represente a movement of more than 300m) in the virtual space, or teletransporting to a different location, and the possibility of recruiting a sizeable number of "explorers", our solution is able to scale to whole cities. In the following, we describe two functionalities we added towards the replicability of the approach in further European cities: the possibility to define an area of exploration such that contributors are constrained to find PoIs within it (section 1.2.3), and the implementation of the taboo technique to optimize the covered area per worker (section 1.2.5). We also discuss the results of our experiments in the city of Trento, providing insight about the effectiveness of the approach and the possibilities of combining its output with maps collected by experts and by volunteered geographical information systems, like OpenStreetMaps . 1
2.1.1 Virtual City Explorer (VCE) Component
2.1.1.1 General Description VCE will be accessed and operated by two figures:
● VCE users, who are those that can set up task, launch and monitor them, and eventually collect the results.
● and, VCE contributors who are those that are required to perform the given tasks. Contributors can be paid such as crowd workers from Figure Eight 2
platform, or volunteers supposedly recruited via social media. The core part of the VCE is a Flask application that is a micro web framework 3
written in Python widely used for developing web application. For convenience we run Flask in an Heroku application. Heroku is a cloud platform as a service (PaaS) 4
supporting several programming languages that is used as a web application deployment model. However, the Flask core part of our logic is modular; thus it can be extrapolated from our Heroku architecture and integrated into another python web server. The VCE uses a MongoDB database to store the information to set up a 5
task and the results generated by the task execution. Fig. 1 shows the architecture schema of the VCE.
1 Openstreetmap website: https://www.openstreetmap.org/ 2 Figure Eight crowdsourcing platform website: https://www.figure-eight.com/ 3 Flask web framework website: http://flask.pocoo.org/ 4 Heroku cloud platform as a service (PaaS) website: https://www.heroku.com/ 5 MongoDB free and open-source NoSQL database website: https://www.mongodb.com/
D3.2 Page 7 of 34

Crowdsourcing services
Figure 1: The architecture schema of the Virtual City Explorer (VCE)
2.1.1.2 Preliminary tests To verify the suitability of our approach in making use of crowd workers to detect static POIs (Points Of Interest) in cities, we run a test of our task by using 60 crowd workers that were required to identify bike racks starting the task in random positions inside in the Trento city centre, Italy. Specifically, we placed all the crowd workers inside the Trento ZTL (Limited Traffic Zone) that was the area we were interested in 6
exploring. Each worker was asked to identify three bike racks and there were no limitations on the number of detections that a bike rack could receive. Workers were rewarded with 0.15$ per task and could repeat the task multiple times if desired. Crowd workers were recruited through Figure Eight crowdsourcing platform and then redirected to the VCE where the task was actually performed. The goal of this first test was to check if with the provided interface crowd workers were actually able to detect bike racks. The results of the test were positive, all the bike racks detected were in line with the requirements given to the crowd workers. To understand how workers behave in the virtual space we also logged some actions they performed, such as pictures were taken, changes of positions, and errors (e.g., workers who provide three pictures that do not conform to requirements making thus impossible the coordinate triangulation and then the determination of the final bike rack position). Fig. 2 shows the StreetView screenshots of the bike racks taken by one of the workers who participate the test. Fig. 3 shows the virtual paths walked by five workers, and the relative starting and ending points, coordinates of bike racks detected and taken photos.
6 http://www.comune.trento.it/Aree-tematiche/Ambiente-e-territorio/Mobilita-e-traffico-urbano/ZTL
D3.2 Page 8 of 34

Crowdsourcing services
Figure 2: Nine bike rack shots taken by one of the workers who participate the
initial test. The three shots of each row refer to the same bike rack.
D3.2 Page 9 of 34

Crowdsourcing services
Figure 3: The interface that allow to visualize workers starting and ending points, position of bike racks detected, shots and paths, made by the workers who participated the initial test. 2.1.1.3 Constraining areas When a crowdworker starts the exploration, his/her starting position on the map is determined by three parameters: latitude, longitude, and heading. From that point on, workers can explore the virtual space in any direction they like. This excessive moving freedom can be a problem when the user (city council) is interested in mapping only a specific area of the city. For example, analysing the results of out test described in the previous section, we notice that the crowd workers, who do not have any space constraints, walked outside the desiderata area detecting bike racks where it was not required. For this reason, we provided our task with a constraining function that restricts workers to move inside a predetermined area. To crowd workers being aware of the new spacial limitation, we:
● communicate the introduction of the new spatial constraints explicitly; ● changed the task interface implementing, on the bottom left side of the
exploration panel, a small minimap that shows workers their current position and the restricted area.
When workers tried to go outside of the restricted area, they got stopped and showed a message informing them that they are unable to proceed in that direction. Fig. 4 shows the new version of the interface that includes the minimap.
D3.2 Page 10 of 34

Crowdsourcing services
Figure 4: The new interface, of the microtask used to explore the city to find mobility infrastructure PoIs, includes a minimap who helps workers to orientate inside the restricted area. 2.1.1.4 Pilot in Trento city Once we were confident crowdworkers could effectively use the provided interface to detecting bike racks according to the given instruction, we decided to run a pilot which included 60 workers who were asked to identify five bike racks internally the Trento ZTL. Differently, from the initial test, we decided to contain the crowdworkers inside the area. We rewarded each worker with 0.15$, so the total price for the pilot, (that also include the percentage of 20% due to Crowdflower ), was of 10.80$. Thus 7
we collected a total of 900 bike rack shots (photos), that corresponds to 300 bike rack detections (each bike rack needs three photos to be detected), each of them cost 0.03$. Of the 300 bike racks, the aggregation module resulted in 39 unique bike racks. It means that some bike racks were detected multiple times by different workers. After the aggregation, all the detections received by the same bike rack are merged and the bike racks resulting from the merging are called "unique" bike rack. We noted that a small subset of bike racks got a high number of detections, due to their high visibility and how easy they were to reach. The pilot aimed to understand how efficient workers are. To measure it, we compared the workers' performance with two public available quasi ground-through datasets that contain the coordinates of bike racks in the Trento ZTL. The first of them is the Municipality of Trento bike rack dataset that counts 39 bike racks on-site 8
tracked by an expert from the Municipality. The second dataset we considered is the Trento ZTL subset of an OpenStreetMap map dump, which counts 52 bike racks.
7 Figure Eight changed its name recently, the previous name was Crowdflower. 8 http://www.comune.trento.it/Aree-tematiche/Cartografia/Download/Rastrelliere-per-biciclette
D3.2 Page 11 of 34

Crowdsourcing services Nevertheless, this dataset was created with contributions of volunteers and resulted having a lack of up-to-dateness since it has been created in more than five years and not very updated since its last entry is dated 2015. The result of the pilot was very positive. By spending 10.80$ we could identify a collection of 39 unique bike racks, 31 of them could be matched to bike racks in the Trento Municipality dataset, while 8 were new with respect to them (not exactly an overlap with the Trento Municipality dataset). Additionally, we focused on understanding the reasons why workers missed some bike racks, and we discovered that:
● some bike racks present in the Trento Municipality dataset are not reachable from Google StreetView. This circumstance, that was already know, has to be considered a limitation of the approach;
● some bike racks are partially occluded, or placed in difficult to reach areas of the city. This issue can be tackled with a solution proposed in the next section;
● some bike racks were missing in the Trento Municipality dataset. The “taboo” PoI As noted in the previous section, some bike racks got detected a number of times significantly higher than others that were detected few or even, zero times. This is not an ideal situation since workers are rewarded per detected PoI, and having the same bike rack detected a number of times over the quality assurance threshold leads to an avoidable waste of resources. Bike racks are detected multiple times primarily for two reasons:
● The visibility of the PoI, e.g., bike racks that are big, easy to reach, and in the main street are easiest to be detected that those partially occulted of hidden;
● As shown in the heat map of Fig. 5, is due to some areas of the city are much more covered by the workers in their explorations, despite the workers started their task from random positions in the given area.
D3.2 Page 12 of 34

Crowdsourcing services
Figure 5: Heat map of the crowdworkers' coverage of the Trento ZTL. To have a more balance number of detections among different bike racks, we implemented a new exploration strategy named “Taboo". Taboo was a game, very 9
popular in the 90', in which the participant tried to make teammates guessing words, by giving them suggestions, with no mentioning a few or taboo words. The taboo words were forbidden in the game. We use this analogy for “taboo” PoIs, which are those that have been detected by a sufficient (configurable) number of workers. Once a PoI has been detected by N workers (we set this threshold to 5 for our first pilots), it cannot be reported anymore, encouraging workers to explore further portions of the map. The implementation the “taboo” technique should stimulate workers' exploration to reduce the impact of missing bike racks placed in underexplored areas. Once a worker detects a bike rack, its coordinates are stored in a MongoDB database. Detections of different workers for the same bike rack can be slightly different in term of position. For this reason, to compute the taboo bike racks we need a spatial clustering algorithm capable to identify clusters of points. We opted for using DBSCAN (Density-based spatial clustering of applications with noise) (Birant et al., 2007) algorithm, which allows to identify cluster of point in 2D planes, by specifying two key parameters: (i) ε which specifies how close points should be to each other to be considered a part of a cluster, and (ii) minPts that is the minimum number of points required to form a dense cluster. Since bike racks can be different in term of shape, length and position the determination of the right value of ε to use is not trivial and can maybe be not suitable for all the cases. We plan to set ε to 8 meters, and minPts to 5 in the first bike rack test we are going to perform in the next weeks.
9 https://en.wikipedia.org/wiki/Taboo_(game)
D3.2 Page 13 of 34

Crowdsourcing services
Figure 6: The worker tries to detect a new bike rack too close to a “taboo” one (identified by the red marker) and receives an error message. When a worker starts an exploration task the updated taboo bike rack list is computed and a red marker is placed over the taboo bike racks positions in the Google StreetView panel (markers of bike racks that workers detect during the execution of their task are yellow to avoid ambiguities). Workers are unable to detect bike racks nearby taboos bike racks (the distance threshold can be defined), and if they try to do that, a message is displayed explaining them that the PoI has been already detected (this case is shown in Figure 6). When the workers complete the task, the coordinates of the detected bike rack are sent to the server that compute the new taboo bike racks and update the relative list which is made available for the further workers. Since we do not know a priori the total amount of bike racks that can be discovered in the given area, we can not predict the moment when all the discoverable bike racks have been found. Thus, we converge in a situation in which workers are unable to complete the task because no more bike racks can be found. To avoid this situation, we are implementing some escaping strategies that allow workers to complete their task even if they were unable to discover the minimum amount of bike racks. For these strategies being effective, without encouraging cheating behaviour or lack of interest in carrying out the task workers, appropriate quality checks need to be implemented. We intend to use a combination of virtual distance covered, number of steps walked, and total time spent performing a task, to enable workers being paid even if they were unable to spot out all the required bike racks. They will be described in detail in deliverable D3.3 - Methods for task and time management.
D3.2 Page 14 of 34

Crowdsourcing services
2.1.1.5 Task deployment One of the reasons we choose to develop the VCE was to provide data scientists working for European municipalities with a standalone tool that makes easy the execution of completing mobility infrastructure tasks. Our prototype allows the deployment of tasks where the support of crowdsourcing experts should not be not longer necessary since the component will assist the users in all the phases of the experiment process, from the initial task setup, up to the analysis of the results. The VCE includes three primary tools: a polygon editor, task deployer, and a task monitor, that are described in the three following sections.
The polygon editor The first tool a VCE user can use is the polygon editor, which allows to design a custom area (also called polygon) that can be then used to constrain the crowd worker explorations. Along each area, the editor allows to specify four metadata: name, description, author, and date. When the design of a new area is completed, the polygon is stored in GeoJSON format in the MongoDB database. We opted for 10
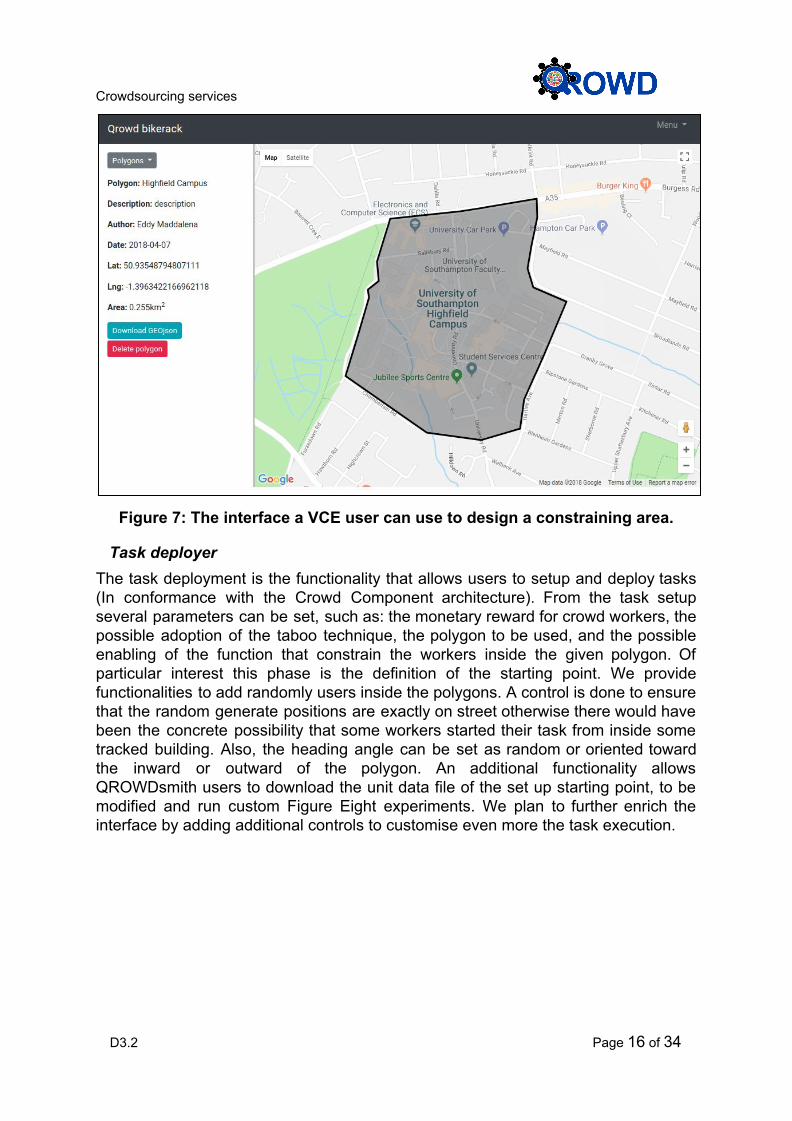
GeoJSON format for our purposes since it is an open standard and widely used format designed for representing simple geographical features. From a proper page (shown in Fig. 7), the list of polygon present in the database can be consulted. For each polygon, it is possible to see all its metadata plus the computed area. Also, from the same page, it is possible to download the GeoJSON of the given polygon.
10 GeoJSON standardisation website: http://geojson.org/
D3.2 Page 15 of 34
Crowdsourcing services
Figure 7: The interface a VCE user can use to design a constraining area.
Task deployer The task deployment is the functionality that allows users to setup and deploy tasks (In conformance with the Crowd Component architecture). From the task setup several parameters can be set, such as: the monetary reward for crowd workers, the possible adoption of the taboo technique, the polygon to be used, and the possible enabling of the function that constrain the workers inside the given polygon. Of particular interest this phase is the definition of the starting point. We provide functionalities to add randomly users inside the polygons. A control is done to ensure that the random generate positions are exactly on street otherwise there would have been the concrete possibility that some workers started their task from inside some tracked building. Also, the heading angle can be set as random or oriented toward the inward or outward of the polygon. An additional functionality allows QROWDsmith users to download the unit data file of the set up starting point, to be modified and run custom Figure Eight experiments. We plan to further enrich the interface by adding additional controls to customise even more the task execution.
D3.2 Page 16 of 34

Crowdsourcing services
Figure 8: A VCE user can use to specify in a task a constrained area and to place crowd workers on it. The current deployment allows the creation of the starting point that need to be manually uploaded to an already set up Figure Eight task. A full automate deployment of the task via Figure Eight API is not supported yet by the platform, but it will be available in the new version of the platform.
Monitor A monitor is a simple page that allows to visualize the results of a task. From a monitor is possible to see the bike racks that have been detected by the crowd workers, which are the taboo ones, and some general stats about the ongoing task. Also the monitor will allow the download of the bike rack coordinates in a standard JSON format. 2.1.1.6 Next steps The next steps concern three directions: (i) We are going to run some test of the implementation of the taboo technique which should allow optimisations of the bike
D3.2 Page 17 of 34

Crowdsourcing services rack detections. The goals are both the reduction of the cost per bike rack discovered and to incentivise a more exhaustive map exploration by workers. (ii) We aim to improve the prototype that allows easy task deployment. We work toward the delivery a standalone component that allows task deployment without the need for the support from crowdsourcing experts. (iii) We want to study the behaviours of workers when finding city items. We believe that a better understanding of the user interactions in the virtual worlds can favour task improvements and lead to a better crowdworkers satisfaction that usually reflects into better performances.
2.2 Image annotation - QROWDsmith Image annotation is one of the more crowdsourced task types. To improve effectiveness on it, we developed QROWDsmith, a crowdsourcing platform that leverages on gamifications to incentives users. The platform which is described in D3.1 allows the participation of contributors either volunteers or crowdworkers required by external crowdsourcing platform.
Figure 9: The QROWDsmith homepage has two side columns with plugins, and a central column showing the list of tasks available for the user.
D3.2 Page 18 of 34

Crowdsourcing services
Figure 10: An example of task instructions.
2.2.1 Main concepts To allow QROWDsmith creating and assigning tasks according to with the input data that needs the need to be human evaluated, we defined three entities named task, execution, and round; where:
● A task general defines the activity that is required to the workers. Tasks have their settings, instructions, payments and general rules for the resolution of the human activity.
● A task is composed of one or more executions, which represent the work that a workers needs is required to carry out in a single task instance (session). Specific executions can my repeated multiple time when aiming to annotate items multiple times from multiple workers in order have more reliable annotations.
● Executions contain rounds which are the atomic unit of works that need to be performed. A single round may require, for example, the tagging of an image, the answering of a question, of the transcription of a sound.
To better explain the mentioned division we discuss an example: A QROWDsmith task requester needs to tag a collection of 1000 images. So s/he setups an “image tagging” task. Since 1000 images are too much to be performed by a single user, the requestor decides to split the task into batches of 50 executions (performable by different users), each of them composed of 20 round. Each round requires precisely one image to be tagged. 2.2.2 Two approach of task assignment The execution of rounds and executions in tasks can be done in two different ways:
● Rigid: the QROWDsmith task requester specifies a priory the number of execution per task and round per execution. It allows having a perfect idea
D3.2 Page 19 of 34

Crowdsourcing services about the work that is going to be performed, and the price that the task will cost. The rigid task assignment is widely used in current crowdsourcing platforms.
● Flexible: the QROWDsmith task requester setup a task by only specifying the data that need to be evaluated, and without specifying how the division of the task in execution and the division of executions is task needs to be done. The only parameter that needs to be specified is the minimum number of rounds a user needs to perform. The users can then start performing the task and decide her/himself when to stop. The payment for the task resolution is fixed a priori. The amount of annotated data collected depends on the users and on their level of engagement. The flexible approach for task assignment strongly relies on the gamification and customisation component implemented.
2.2.3 User recruitment QROWDsmith enables the engagement of different types of crowds: volunteers and crowdworkers. In case of volunteer participation, workers can simply register their profile with a pretty usual registration procedure and then they are enabled to use the platform. Nevertheless, when crowd workers access the platform from external platforms the process becomes more complicated. Since crowdworkers are redirected to out platform after beginning a task on an external platform, the payment needs to be guaranteed to both the crowdworkers and external platform for their brokering service. To do that we implemented a system relies on the key-exchange strategy that works as follow: when a crowd worker of the external platform decides to perform our task s/he is invited to click on a link that redirects her/him to QROWDsmith. The link also encapsulates the parameters that specify the configurations of the QROWDsmith task has to be executed. At this point, the worker can perform the proposed task, and once finished it, he is shown with an alphanumeric key specifically generated for the current task execution. Then, the crowdworker can copy the generated key, go back to the external crowdsourcing platform, input the obtained key, and if the key is correct, getting paid (the payment occurs complement in the external platform). As we said the link generated used to send people from the external platform to QROWDsmith contains also a series of parameters to allow: key exchange, user identification, configuration of the task execution. An example of these parameters is the “hide_other_tasks” parameter, that allows specifying if the worker that reach QROWDsmith from an external platform can perform either only a specific QROWDsmith task (the required one), or also the other tasks currently available into the platform. Fig. 11 shows an example of the QROWDsmith task list when only the required task can be performed by the user, and all the other tasks are blocked.
D3.2 Page 20 of 34

Crowdsourcing services
Figure 11: The QROWDsmith interface for a user who comes from another platform when only the required task is available to be performed. 2.2.4 Gamification and user customization We are providing QROWDsmith with functionalities aimed to improve the user engagements and experience. Some badges and leaderboards give a constant feedback to users about their performance results and achievements. The goal of these components is to engage workers with gamified incentives without relying only on economic rewards for workers. Differently, from traditional microtask crowdsourcing, once workers access for the first time on QROWDsmith a gamified profile is created that keep track of the worker achievements among different task sessions, thus all the scores and badges are cumulate and workers can aim to improve their performances time by time. We are providing QROWDsmith with functionalities that allow users to customize their experience in use not only by taking track of their personal scores, badges and
D3.2 Page 21 of 34

Crowdsourcing services achievements, but also providing them with a profile editing. Figure 12 shows the interface for a new badges achievement.
Figure 12: The worker has just got a new badge for completing the first twenty rounds. Another strategy we adopt to increase user engagement and experience is the profile customisation. Crowdworkers can personalise as they prefer elements of their profile and thus result more identifiable especially when participating in multiplayer tasks. Figure 13 shows a panel which allows QROWDSmith users to choose an user-colour and a profile avatar.
D3.2 Page 22 of 34

Crowdsourcing services
Figure 13: QROWDsmith users can customise their profile to make their experience more engaging. 2.2.5 Available tasks The current version of the demo offers three types of type:
● Image tagging: A task that allows to one or two participants to tags images; ● PoI validation: This task will be used to validate bike racks images collected
by the VCE (presented in Sec. 2.1); ● Image comparison: Tasks which require contributors to establish whether or
not two displayed photos depict the same PoI.
2.2.6 Future work We will keep working on QROWDsmith to:
1. make the prototype a more stable version; 2. carry out tasks with crowd workers or volunteers; 3. add new gamification components such as new badges or a personal user
ability level.
2.3 Modal split verification VCE and QROWDsmith are tools for tasks that can be solved by crowdworkers or contributors independently of their physical location. For example, the VCE enables
D3.2 Page 23 of 34

Crowdsourcing services the mapping of PoIs by a crowdworker not located in the city. However, in the context of a Smart City, there are some data collection tasks that are difficult or impossible to outsource to a contributor that is not "physically there". Two examples are:
1. In the context of the calculation of modal split (BC2-UC#1), data traces generated by citizens through the iLog app are analysed to learn trip segmentation and transportation modes. It is desirable to verify the labels the machine assign to traces in order to incrementally increase the accuracy of the model. However, this is a task that only the citizen that generated them can accomplish with high accuracy. Furthermore, it is also desirable that the interaction of the citizen with the data collection and analysis is driven by an engagement logic, to ensure better quality labels, and avoid drop-outs.
2. In the context of completing mobility infrastructure (BC2-UC#2), it is possible that a mobility infrastructure PoI detected with the Virtual City Explorer comes from a Google StreetView snapshot older than a certain delta (perhaps some years back). To confirm that the bike rack is still there, the only certain way is to send someone physically to those coordinates to check.
In this section, we present Question-QROWD and Challenges services, specifically designed for data collection and labeling tasks that involves citizens. 2.3.1 Question-QROWD (BC2-UC#1)
This component manages the interactions between citizens participating in a modal split computation run and the machine that analyses the traces they generate. We recall that for estimating modal split, the most used technique is a "travel survey" applied on a sample of citizens. In most cities, travel surveys are still paper or phone-based, which is cumbersome and expensive, limiting the number of times they can be run. In the particular case of Trento, due to the high cost of telephone surveying, the last travel survey dates back from 2004. Since the popularisation of smartphones, several efforts have focused in implementing travel surveys as mobile applications, greatly reducing costs and enabling surveying for longer periods of time on more citizens. Most works have focused on the development of automatic transport mode classifiers using different machine learning algorithms. We presented a review of these methods in D6.1. In this section, we focus instead on strategies for interacting and engaging with the citizens that contribute with their data to the travel survey. Although automatic approaches can reach a good accuracy, the noisy nature of the data makes desirable the maintenance of an interaction channel with citizens in order to verify any travel where the machine was not able to correctly segment or classify the transportation mode of a trip. In this respect, previous efforts can be classified in two categories:
1. A first category focuses on interfaces designed for the collection of data by volunteers that are not the same citizens on which the travel survey will be applied. Volunteers are chosen to have maximum representativity of
D3.2 Page 24 of 34

Crowdsourcing services transportation methods, as the data they collect will be used to train the classifiers that will be used in the real surveys. Volunteers are instructed to log every trip they do during the day by selecting in the application when they are about to start moving, on which mode of transport they are about to travel, and when they stop traveling. Although this interface is initially thought for volunteered collection, it is possible to use it with citizens. We call this category "Active" as it requires to actively signal the start and end of an app.
2. A second category aims their interfaces at citizens that will be surveys, for example, to confirm the trips classified by machine algorithms. This may be done inside the same application, or through a web application that could be accessed either through the smartphone browser or through a PC. We call this category "Passive", as a citizen only needs to leave the mobile app collect data, and at a later time, validate trips.
However, an aspect that none of the approaches treat in depths is how to manage the engagement and incentives for citizens, and only (Cottrill et al. 2013) has studied usability concerns. (Susilo et al. 2016) recruited participants by sending invitations as part of the National Travel Survey of Sweden, without any additional incentive. They reported a decrease in the number of responses across time, pointing at the lack of additional incentives as a probable cause. In the case of the field trial conducted by (Montini et al. 2015), participants were recruited for a 150€ incentive for a longer period of time (8 weeks) than common travel surveys, and also instructed to carry a dedicated GPS device to provide measurement. No indication of the incentive management for real travel surveys was reported. Finally, in the case of (Nitsche et al. 2014), 15 volunteers were recruited for three months for extensive data collection for training, but no indication of how to engage citizens in a real use case was made. Concerning usability (Cottrill et al. 2013) conducted two waves of usability tests using "think-aloud" protocols that informed the following design decisions: show a map matching user interactions with the diary, and minimize textual content. However, they were not compared against other decisions. In QROWD we fill this gap by providing a service for managing both the questions and incentives for citizens answering travel surveys. The general workflow of the use case is as follows
1. Citizen data is collected passively, by letting the i-Log application run in the background.
2. When the phone is connected to a wifi network, data is uploaded to QROWD servers.
3. Every night, automated algorithms break down the raw data in segmented trips, assigning a transport mode label to each segment.
4. Questions about each part of each trip may be pushed to the user, depending on the level of confidence that the machine reports on the classification, and the level of engagement detected by the user. The time to push a question depends on when the citizen was able to upload data traces.
5. Answers from previous questions are collected, registering in the component
D3.2 Page 25 of 34

Crowdsourcing services the time taken for a citizen to answer with the purpose of using it as metric of individual engagement.
6. Definition of challenges associated to number of questions answered The Question-QROWD component corresponds to steps 4-6. The main goals of the component can be summarized as follows:
1. Present citizens with a question that enable the easy confirmation of labels assigned by the machine on their trips. In the component architecture described in D3.1, this corresponds to "Question Templates".
2. Monitor the level of engagement of citizens with the task, by measuring the time they take to answer, and how they interact with the verification, with the purpose of suggesting changes in the interface.
3. Present citizens with an appropriate number of questions, based on their perceived level of engagement. In the component architecture described in D3.1, this corresponds to the "Decision component".
4. Track the fulfillment of actions that trigger incentives and rewards for users. In the component architecture described in D3.1, this corresponds to the "Aggregation and quality component"
In the first half of the project, we have tackled points 1) and 4). Concerning question types, we designed three types of questions for validating a trip labels: The first type of question is the stop point question, detailed in the flow diagram of Figure 4. The user is shown the stop point of the detected trip (Figure 5), to confirm if it was an outlier or not. By answering "Reached your destination" or "Briefly stopped to change transportation mode", the user implicitly confirms that the stop point was correct. After that, she receives a question on transportation mode.
Figure 4: Stop point question flow diagram
D3.2 Page 26 of 34

Crowdsourcing services
Figure 5: Stop point question screenshot The second type of question is "Start-Stop points", detailed in Figure 3. The user is presented first with a map showing the starting point of the candidate trip and the approximate start time of the trip (Figure 4, left), where she can judge if it is an outlier or not. If the start point is validated, then the stop point is shown in the map (Figure 4, right). If the stop point is also validated, then two questions ensue: checking if the trip was multimodal or not, and checking the transport mode of the trip.
D3.2 Page 27 of 34

Crowdsourcing services
Figure 3: Start-Stop points question type flow diagram
Figure 4: Screenshots of start point confirmation (left) and stop point confirmation (right)
The third type of question is "Segment", detailed in the flow diagram shown in Figure 5. The user is shown a map with the segment of trip detected (Figure 6, left), on which she can verify if the start or stop points are outliers or not. If the trip
D3.2 Page 28 of 34

Crowdsourcing services segment is verified, then, questions to verify multi-modality and transportation mode of the trip ensue (Figure 6, right).
Figure 5: Segment type question flow diagram
Figure 6: Segment type question trip confirmation (left), and transport mode
confirmation (right)
D3.2 Page 29 of 34

Crowdsourcing services Concerning incentives, we matched the unlocking of a reward to the use of the i-Log application for at least 10 hours, in order to provide enough data for the machine learning components. We also provide an incentive for number of questions answered about the trips. Results of first pilot A first pilot of the overall approach (including all steps of the workflow) was conducted in during two weeks of April 2018 (9th-20th) with 22 users, we focused on "Stop points" questions for two reasons: Test first the reaction of citizens to the lesser complex question, and to provide immediate feedback to WP6 team on the trip segmentation sub-problem. After the end of the pilot, participants were interviewed about their interaction with the system. Concerning questions, three main points were raised:
1. In some occasions, an outlier start point creates a trip that did not exist in reality. A stop point question becomes quite confusing in that scenario.
2. Users were open to the possibility of answering more complex questions. 3. Some users expressed their desire to be able to restrict data collection to the
time interval where they are doing a trip, instead of allowing continuous collection.
A second pilot is on its way during the last week of May and the first week of June (28th May to 7th June). In this pilot, we will compare the Start-Stop points and Segment strategy, to answer the following questions:
1. Which one is better quantitatively? We will measure the time that citizens take to answer questions, and how they interact with the maps embedded in the questions to provide insight if they are struggling with them.
2. Which one is better qualitatively? Based on feedback from participants' interviews
Concerning preferred collection behaviour, the second pilot will distinguish between users trying "continuous collection", i.e., letting iLog run in the background at all times, vs. "on-off behaviour", where the user turns collection on when she is about to start a trip and turns it off when she finishes it. Continuous data collection has the advantage of being easier to process by the machine, easier to reward, as one can simply use the number of hours the application was allowed to log data as a measure for giving a reward, and less prone to human error, as it might be easy to forget to turn on-off. On the other hand, the on-off behaviour has the advantage of reducing battery consumption and being more mindful of the data minimisation principle of the GDPR. In the second half of the project, we will answer the following questions:
1. Is the machine equally effective on the two collection modes? 2. Do users that declare to get into one collection mode tend to maintain it? In
particular, for users declaring an on-off behaviour, do they often forget to turn on and off data collection?
D3.2 Page 30 of 34

Crowdsourcing services The action that triggers the reward for the on-off behaviour is the contribution of at least two trips (work-home and home-work) during the day. Results of both sets of questions will help us to determine if we can offer both types of questions, suggesting users to switch if we detect they are struggling with the type they are currently receiving. In a similar way, we can suggest an user to switch her collection mode if we detect that she is having issues with the current one. Results of the second pilot will be described in deliverable 3.3.
2.4 Participatory sensing (through challenges)
QROWD's uses the concept of challenges to manage citizen engagement. Challenges are defined as functions over the interactions a citizen has with the QROWD platform through the iLog application. By tackling challenges, citizens earn points that then can be exchanged by prizes selected by a municipality. The combination of a prize with further gamification strategies like leaderboards eases the establishment of a bond with the citizen. We distinguish between two types of interactions:
1. Data collection interactions associated to modal split computation. In this case, the citizen is compensated for providing a certain amount of her data for modal split computation, and for answering validation questions about the analysis of the data.
2. Spatial tasks connected with BC2-UC#3. An user is rewarded for verifying in-situ the existence of a mobility infrastructure item that cannot be completely verified with the Virtual City Explorer (e.g., a bike rack detected by crowdworkers on an old Street View snapshot). Furthermore, a citizen can also be asked to count the occupancy of a nearby mobility infrastructure.
A challenge is comprised of:
● A start date ● An end date ● A description of what are the interactions required to fulfill the challenge ● A reward in points, that can then be redeemed by the future.
Inline with the architecture described in D3.1, a set of template challenges are provided:
1. Number of hours of allowed data collection for modal split 2. Number of daily trips contributed for modal split 3. Attributes (picture, number of slots, occupancy) collected for a set of mobility
infrastructure PoIs. Figure 10 shows a prototype of a challenge interface from the point of view of a
D3.2 Page 31 of 34

Crowdsourcing services citizen.
Figure 10: Example of challenges
D3.2 Page 32 of 34

Crowdsourcing services
3. CONCLUSIONS In this deliverable, we discussed the advancements we made in the crowdsourcing solutions proposed to face the challenges given by the project use cases. This advancement mainly focuses on the crowdsourcing contributions described in our previous deliverable D3.1. This deliverable presents three prototypes we are working on. The first one (i), concern the completing mobility infrastructure use case (BC2-UC#3). Our solution makes use of the benefit offered by crowdsourcing to allow human exploration of virtual cities to discover static city items according to given requirements. We run some test and a pilot in which we asked crowdworkers detect bike racks the Trento city by virtually exploring the area through an ad hoc interface that integrates a Google StreetView. The results satisfied the expectations. We also discuss some strategies we are going to implement to optimise the detection phase and to develop of a tool to allow easy task deployment. Then, (ii) we discussed about QROWDsmith, the crowdsourcing platform we are developing which aim to leverage on gamification strategies to better engage users, whether they are volunteers of crowdworkers. Finally, (iii) we describe the Question-Qrowd component to manage the interaction with citizens contributing data to the modal split computation, and the Challenges component, to enable the assignment of participatory sensing tasks and rewards.
D3.2 Page 33 of 34

Crowdsourcing services
4. REFERENCES Birant et al., 2007
Birant, Derya, and Alp Kut. "ST-DBSCAN: An algorithm for clustering spatial–temporal data." Data & Knowledge Engineering 60, no. 1 (2007): 208-221.
Cottrill et al., 2013
Caitlin Cottrill et al., “Future Mobility Survey,” Transportation Research Record: Journal of the Transportation Research Board 2354 (October 22, 2013): 59–67, https://doi.org/10.3141/2354-07.
Nitsche et al., 2014
Philippe Nitsche et al., “Supporting Large-Scale Travel Surveys with Smartphones – A Practical Approach,” Transportation Research Part C: Emerging Technologies, Special Issue with Selected Papers from Transport Research Arena, 43 (June 1, 2014): 212–21, https://doi.org/10.1016/j.trc.2013.11.005.
Susilo et al., 2016
Yusak Octavius Susilo et al., “Lessons from a Trial of MEILI, a Smartphone Based Semi-Automatic Activity-Travel Diary Collector, in Stockholm City, Sweden,” DIVA, 2016, http://urn.kb.se/resolve?urn=urn:nbn:se:kth:diva-187489.
Montini et al., 2015
Lara Montini et al., “Comparison of Travel Diaries Generated from Smartphone Data and Dedicated GPS Devices,” Transportation Research Procedia, Transport Survey Methods: Embracing Behavioural and Technological Changes Selected contributions from the 10th International Conference on Transport Survey Methods 16-21 November 2014, Leura, Australia, 11 (January 1, 2015): 227–41, https://doi.org/10.1016/j.trpro.2015.12.020.
D3.2 Page 34 of 34