qualitative pm2.5 hot spot analysis pm2.5 hot spot analysis interstate 80/interstate 680/state route...
TRANSCRIPT

Interstate 80/Interstate 680/State Route 12 Interchange Project
Qualitative PM2.5 Hot Spot Analysis
Near the Cities of Fairfield and Suisun City
Solano County, California
04-SOL-80 PM 10.8–17.0; 04-SOL-680 PM 10.0–13.1; 04-SOL-SR 12W PM 1.7–2.8; and 04-SOL-SR 12E PM 1.8–4.8
EA-04-0A5300
December 2010
STATE OF CALIFORNIA Department of Transportation
Prepared By: Date: 12/10/10 Shannon Hatcher, Air Quality Specialist
916-737-3000 ICF International

Qualitative PM2.5 Hot Spot Analysis Interstate 80/Interstate 680/State Route 12 Interchange Project
December 2010 1-1
Chapter 1 Introduction
This project-level particulate matter impact hot spot analysis for the Interstate 80/Interstate 680/State Route 12 Interchange Project responds to the United States Environmental Protection Agency’s (EPA) requirement for a hot spot analysis for particulate matter of diameter less than or equal to 2.5 microns (PM2.5), as required in the EPA’s March 10, 2006 Final Transportation Conformity Rule (71 FR 12468). The effects of localized PM2.5 hot spots were evaluated using the EPA and FHWA’s guidance manual, Transportation Conformity Guidance for Qualitative Hot-spot Analyses in PM2.5 and PM10 Nonattainment and Maintenance Areas (Federal Highway Administration, and U.S. Environmental Protection Agency 2006).
This PM2.5 and PM10 analysis addresses the construction of the proposed project, including the following components identified in the Metropolitan Transportation Commission’s (MTC) Transportation 2035 Plan for the San Francisco Bay Area (Transportation 2035 RTP), which the MTC adopted on April 22, 2009. The FHWA made the conformity determination for the Transportation 2035 RTP on May 29, 2009.
In the adopted 2035 RTP, the proposed project Alternative C, Phase 1 is listed in Appendix 1, page 126 as reference number 230326 (Metropolitan Transportation Commission 2009).
The MTC adopted the 2009 Transportation Improvement Program (2009 TIP) on May 28, 2008, and FHWA/FTA adopted the 2009 TIP Program on November 17, 2008. In the adopted 2009 TIP, Alternative C, Phase 1 is listed as TIP ID SOL070020, RTP ID 22701, and CTIPS ID 20600004066.
The project is currently listed in the Transportation-Air Quality Conformity Analysis for the Transportation 2035 Plan & 2009 Transportation Improvement Program Amendment #09-06 as Reference Number 230326, and will be complete and operational by 2015.

Qualitative PM2.5 Hot Spot Analysis Interstate 80/Interstate 680/State Route 12 Interchange Project
December 2010 2-1
Chapter 2 Project Description
The project to improve the Interstate 80 (I-80)/Interstate 680 (I-680)/State Route 12 (SR 12) interchange and relocate the westbound truck scales facility is located in the vicinity of the city of Fairfield, Solano County, California (see Figure 1-1). The project area covers some 13 miles encompassing all three highways. The project involves improvements on an approximate 4.5-mile-long segment of I-80 between Red Top Road and Abernathy Road, an approximate 3.5-mile-long segment of I-680 between Gold Hill Road and I-80, 2.0-mile-long segment of SR 12 West (SR 12W) between 0.5 mile west of Red Top Road and I-80, and an approximate 2.5-mile-long segment of SR 12 East (SR 12E) between I-80 and Main Street in Suisun City.
2.1 Alternative C, Phase 1
Alternative C, Phase 1 is the fundable first phase of Alternative C which has been identified by the Department as the Agency Preferred Alternative. A fundable first phase was developed to comply with the Departments NEPA regulations and is the project for which a Record of Decision will be issued.
2.1.1 Western Segment
2.1.1.1 Mainline Improvements
Westbound I-80 would be realigned between a point west of Suisun Valley Road to just west of the SR 12W/I-680 interchange by constructing a new six-lane highway alignment north of the existing highway alignment. The realignment would create space in the median for direct HOV connector ramps to be built between I-80 and I-680, as well as future widening of the eastbound lanes. The realigned westbound I-80 would have six lanes, including an HOV lane and an auxiliary lane matching the existing cross section at the existing Suisun Valley Road overcrossing. Immediately west of the Suisun Valley Road overcrossing, a seventh lane would be added, as well as an eighth lane with the on-ramp from Suisun Valley Road. A ninth lane would be added immediately west of the Green Valley Road off-ramp. The four right lanes would exit from I-80 to connect to SR 12W and I-680. There would be a left exit from the HOV lane to an HOV connector to I-680. A wider, single-span bridge would replace the existing bridge over Green Valley Creek. The existing loop on-ramp from northbound I-680 to westbound I-80 would be removed. The connector from northbound I-680 to SR 12W would be constructed to replace this movement. The segment of I-680 north of Red Top Road would be realigned.
2.1.1.2 Freeway-to-Freeway Interchange Improvements
The I-80/I-680/SR 12W interchange would be consolidated in the location of the existing I- 80/SR 12W interchange. Both I-680/SR 12W movements would be via direct connectors. The proposed westbound I-80 to southbound I-680 connector would cross over I-80, the eastbound SR 12W connector to eastbound I-80, the UPRR tracks, Fulton Drive, and the realigned Lopes

Chapter 2. Project Description
Qualitative PM2.5 Hot Spot Analysis Interstate 80/Interstate 680/State Route 12 Interchange Project
December 2010 2-2
Road. Access from westbound I-80 to westbound SR 12W would be braided with (cross over) the Green Valley Road on-ramp to westbound I-80. A separate direct connector structure would be built to carry the HOV lanes in both directions between I-680 and I-80 east of the I-80/I-680/SR 12 interchange. Direct connectors between northbound I-680 and westbound I-80 and eastbound I- 80 and southbound I-680 would be constructed similar to those described under Alternative C. Motorist access from northbound I-680 to westbound I-80 would be served by a loop ramp off the I-680 to SR 12W connector. Traffic from eastbound I-80 to southbound I-680 would use a new two-lane ramp.
The direct connection from SR 12W to southbound I-680 would not be built as part of Phase 1; traffic would use Red Top Road from the new SR 12W/Red Top Road interchange to the new I- 680/Red Top Road interchange. Motorists traveling eastbound on SR 12W who wish to go to southbound I-680 would exit SR 12W at the proposed SR 12W/Red Top Road interchange and continue along Red Top Road to an on-ramp at the new I-680/Red Top Road interchange.
2.1.1.3 Interchange Improvements
The I-80/Green Valley Road interchange would have a tight diamond configuration westbound and a partial cloverleaf (loop on-ramp) configuration eastbound. The same interchange and
overcrossing would provide access to the existing alignment of I-680 (which would be relinquished as a local arterial, as described earlier in this chapter).
The connection from eastbound SR 12W and eastbound I-80 to southbound I-680 would be removed, with traffic expected to use Red Top Road from the new SR 12W/Red Top Road interchange to the new I-680/Red Top Road interchange. A new on-ramp at Green Valley Road would provide access to the new westbound I-80 alignment.
A new interchange would be constructed at I-680/Red Top Road, consisting of an extension of Red Top Road from Lopes Road to an overcrossing over I-680 connecting to on- and off-ramps. Southbound I-680 on- and off-ramps would be located within the existing curve at Lopes Road. Ramsey Road would be realigned to accommodate the northbound on- and off-ramps, but would not be connected to the interchange. There would be a loop on-ramp to northbound I-680. Access between the interchange and Ramsey Road would not be provided.
The I-80/Red Top Road interchange would be partially reconstructed to have a westbound exit loop. Red Top Road would be realigned to connect this interchange on I-80 with a new diamond interchange at SR 12W/Red Top Road.
2.1.1.4 Local Road Improvements
During the initial construction of Phase 1, a bicycle path would be relocated along the western boundary of the business park at the west end of the existing Business Center Drive parking lot, and along the north side of the new connector from westbound I-80 to westbound SR 12W to maintain access between the existing bicycle path along Jameson Canyon Road (SR 12W) and Business Center Drive. This path would be removed when Business Center Drive is extended to the SR 12W/Red Top Road interchange because bicyclists would be able to utilize the extension of Business Center Drive to reach Red Top Road and points west. The existing Green Valley

Chapter 2. Project Description
Qualitative PM2.5 Hot Spot Analysis Interstate 80/Interstate 680/State Route 12 Interchange Project
December 2010 2-3
Road overcrossing at I-80 would be removed, and a new four-lane overcrossing would be constructed on a different alignment.
A new road would be constructed to connect the I-80/Red Top Road interchange with Business Center Drive. Between I-80 and SR 12W, Red Top Road would be realigned to cross over the UPRR tracks and SR 12W approximately 0.25 mile west of the existing SR 12W/Red Top Road intersection. From SR 12W to Business Center Drive, the new road would be an extension of Business Center Drive, originally proposed as part of the overall North Connector project. However, improvements to the interchange at SR 12W would necessitate a slight realignment of the extended road. Therefore, this improvement is included as a component in this proposed project. Construction of the new road would necessitate considerable excavation, and the excavated soils would be used as fill in the construction of embankment associated with the proposed project.
2.1.2 Western Segment
2.1.2.1 Mainline Improvements
A third lane would be added to eastbound SR 12E. This lane would connect (start) at the eastbound SR 12E/Chadbourne Road interchange and would extend east, connecting and ending at the eastbound SR 12E/Webster Street exit.

Qualitative PM2.5 Hot Spot Analysis Interstate 80/Interstate 680/State Route 12 Interchange Project
December 2010 3-1
Chapter 3 PM2.5 Hot Spot Analysis
The following is the PM2.5 hot spot analysis for the Interstate 80/Interstate 680/State Route 12 Interchange Project. In accordance with the final Transportation Conformity Rule, 40 CFR 93.116 and 93.123 (b)(1), this project is defined as a Project of Air Quality Concern (POAQC) and requires a qualitative PM2.5 hot spot analysis.
3.1 Regulatory Background
Under 1990 Clean Air Act Amendments, the U.S. Department of Transportation (DOT) cannot fund, authorize, or approve Federal actions to support programs or projects that are not first found to conform to the State Implementation Plan (SIP) for achieving the goals of the Clean Air Act requirements Conformity with the Clean Air Act takes place on two levels—first, at the regional level and second, at the project level. The proposed project must conform at both levels to be approved.
Regional level conformity in California is concerned with how well the region is meeting the standards set for carbon monoxide (CO), nitrogen dioxide (NO2), ozone (O3), and particulate matter (PM). California is in attainment for the other criteria pollutants. At the regional level, Regional Transportation Plans (RTPs) are developed that include all of the transportation projects planned for a region over a period of years, usually at least 20. Based on the projects included in the RTP, an air quality model is run to determine whether or not implementation of those projects would conform to emission budgets or other tests showing that attainment requirements of the Clean Air Act are met. If the conformity analysis is successful, the regional planning organization, such as the Metropolitan Transportation Commission (MTC) for Solano County and the appropriate federal agencies, such as the Federal Highway Administration, make the determination that the RTP is in conformity with the State Implementation Plan for achieving the goals of the Clean Air Act. Otherwise, the projects in the RTP must be modified until conformity is attained. If the design and scope of the proposed transportation project are the same as described in the RTP, then the proposed project is deemed to meet regional conformity requirements for purposes of project-level analysis.
Conformity at the project-level also requires “hot spot” analysis if an area is “nonattainment” or “maintenance” for carbon monoxide (CO) and/or particulate matter. A region is a “nonattainment” area if one or more monitoring stations in the region fail to attain the relevant standard. Areas that were previously designated as nonattainment areas but have recently met the standard are called “maintenance” areas. “Hot spot” analysis is essentially the same, for technical purposes, as CO or particulate matter analysis performed for NEPA purposes. Conformity does include some specific standards for projects that require a hot spot analysis. In general, projects must not cause the CO standard to be violated, and in “nonattainment” areas the project must not cause any increase in the number and severity of violations. If a known CO or particulate matter violation is located in the project vicinity, the project must include measures to reduce or eliminate the existing violation(s) as well.

Chapter 3. PM2.5 Hot Spot Analysis
Qualitative PM2.5 Hot Spot Analysis Interstate 80/Interstate 680/State Route 12 Interchange Project
December 2010 3-2
The concept of transportation conformity was introduced in the CAA 1977 amendments. Transportation conformity requires that no federal dollars be used to fund a transportation project unless it can be clearly demonstrated that the project would not cause or contribute to violations of the NAAQS. Conformity requirements were made substantially more rigorous in the 1990 CAAA, and the transportation conformity regulation that details implementation of the new requirements was issued in November 1993.
DOT and the EPA developed guidance for determining conformity of transportation plans, programs, and projects in November 1993 in the Transportation Conformity Rule (40 Code of Federal Regulations [CFR] 51 and 40 CFR 93). The demonstration of conformity to the SIP is the responsibility of the local Metropolitan Planning Organization (MPO), which is also responsible for preparing RTPs and associated demonstration of SIP conformity. Section 93.114 of the Transportation Conformity Rule, states that “there must be a currently conforming regional transportation plan and transportation improvement plan at the time of project approval.”
The MTC is the designated federal MPO and state regional transportation planning agency for Solano County. As such, MTC coordinates the region’s major transportation projects and programs, and promotes regionalism in transportation investment decisions.
3.1.1 Statutory Requirements for PM Hotspot Analyses
On March 10, 2006, the EPA issued a final transportation conformity rule (40 CFR 51.390 and Part 93) that addresses local air quality impacts in PM10 and PM2.5 nonattainment and maintenance areas. The final rule requires a hot spot analysis to be performed for a POAQC or any other project identified by the PM2.5 SIP as a localized air quality concern. Transportation conformity, under CAA section 176(c) (42 U.S.C. 7506(c)), requires that federally supported highway and transportation project activities conform to the State Implementation Plan (SIP). The rule provides criteria and procedures to ensure that these activities will not create new violations or “worsen” existing violations, or prevent adherence to relevant NAAQS as described in 40 CFR 93.101.

Chapter 3. PM2.5 Hot Spot Analysis
Qualitative PM2.5 Hot Spot Analysis Interstate 80/Interstate 680/State Route 12 Interchange Project
December 2010 3-3
EPA’s final rule, 40 CFR 93.123(b)(1) defines a POAQC as: (i) New or expanded highway projects that have a significant number of or significant increase in diesel vehicles;
(ii) Projects affecting intersections that are at Level-of-Service D, E, or F with a significant number of diesel vehicles, or those that will change to Level-of-Service D, E, or F because of increased traffic volumes from a significant number of diesel vehicles related to the project;
(iii) New bus and rail terminals and transfer points that have a significant number of diesel vehicles congregating at a single location;
(iv) Expanded bus and rail terminals and transfer points that significantly increase the number of diesel vehicles congregating at a single location; and
(v) Projects in or affecting locations, areas, or categories of sites which are identified in the PM2.5 or PM10 applicable implementation plan or implementation plan submission, as appropriate, as sites of violation or possible violation.
In March 2006, the Federal Highway Administration (FHWA) and EPA issued a guidance document entitled Transportation Conformity Guidance for Qualitative Hot-Spot Analyses in PM2.5 and PM10 Nonattainment and Maintenance Areas (Federal Highway Administration and U.S. Environmental Protection Agency 2006). This guidance details a qualitative step-by-step screening procedure to determine whether project-related particulate emissions have a potential to generate new air quality violations, worsen existing violations, or delay attainment of NAAQS for PM2.5 or PM10. The PM10 hot spot analysis is not required for project-level conformity because the area is in attainment or unclassified for the national PM10 standards.
For the assessment of PM10 hotspots, the final rule is that a hotspot analysis is to be performed only for POAQCs. POAQCs are certain highway and transit projects that involve significant levels of diesel traffic or any other project identified in the PM2.5 or PM10 SIP as a localized air quality concern. The following list provides examples of POAQCs.
A project on a new highway or expressway that serves a significant volume of diesel truck traffic, such as facilities with greater than 125,000 annual average daily traffic (AADT) where 8% or more of such AADT is diesel truck traffic.
New exit ramps and other highway facility improvements to connect a highway or expressway to a major freight, bus, or intermodal terminal.
Expansion of an existing highway or other facility that affects a congested intersection (operated at LOS D, E, or F) that has a significant increase in the number of diesel trucks.
Similar highway projects that involve a significant increase in the number of diesel transit busses and/or diesel trucks.

Chapter 3. PM2.5 Hot Spot Analysis
Qualitative PM2.5 Hot Spot Analysis Interstate 80/Interstate 680/State Route 12 Interchange Project
December 2010 3-4
The list below provides examples of projects that are not an air quality concern.
Any new or expanded highway project that primarily services gasoline vehicle traffic (i.e., does not involve a significant number or increase in the number of diesel vehicles), including such projects involving congested intersections operating at LOS D, E, or F.
An intersection channelization project or interchange configuration project that involves either turn lanes or slots or lanes or movements that are physically separated. These kinds of projects improve freeway operations by smoothing traffic flow and vehicle speeds by improving weave and merge operations, which would not be expected to create or worsen PM2.5 or PM10 violations.
Intersection channelization projects, traffic circles or roundabouts, intersection signalization projects at individual intersections, and interchange reconfiguration projects that are designed to improve traffic flow and vehicle speeds, and do not involve any increases in idling. Thus, they would be expected to have a neutral or positive influence on PM2.5 or PM10 emissions.
For projects identified as not being a POAQC, qualitative PM2.5 and PM10 (for regions without an approved conformity SIP) hotspot analyses are not required. For these types of projects, state and local project sponsors should briefly document in their project-level conformity determinations that CAA and 40 CFR 93.116 requirements were met without a hotspot analysis, since such projects have been found to not be of air quality concern under 40 CFR 93.123(b)(1). Because this analysis assumes the area is classified as a nonattainment area for the federal PM2.5 standard, a determination must be made as to whether it would result in a PM2.5 hotspot.
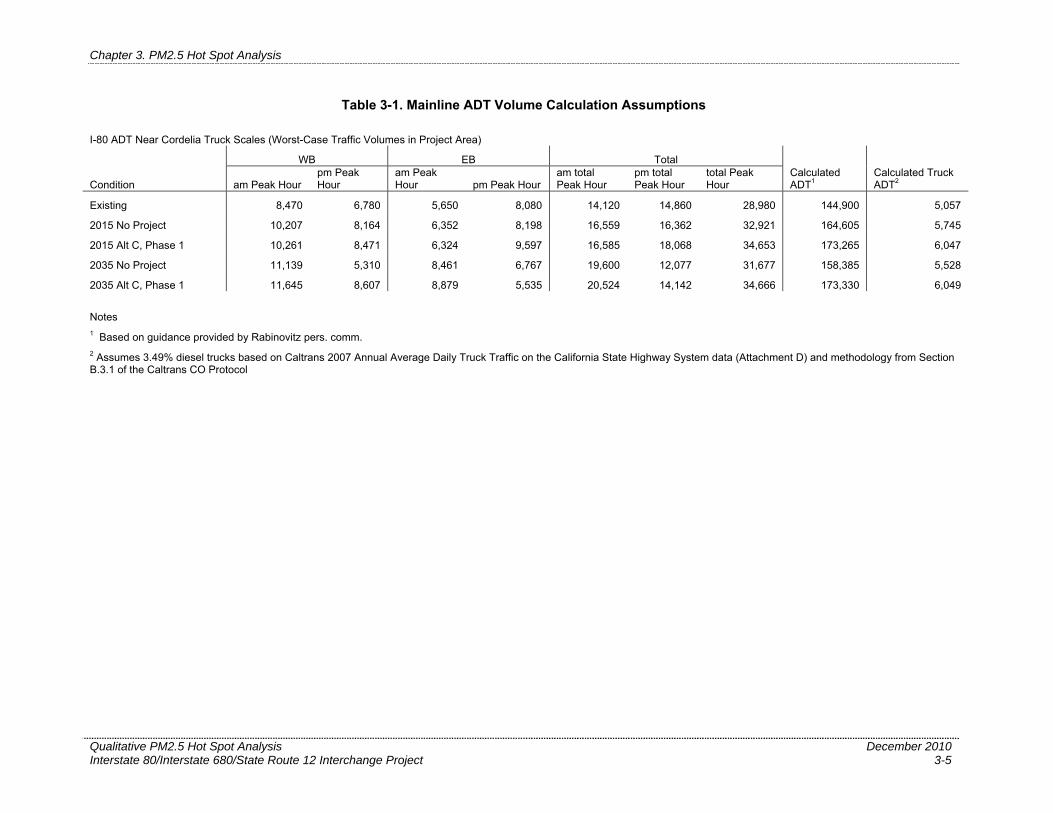
Of these five POAQC types identified above, the project most likely falls into the first category of a “new or expanded highway projects that have a significant number of or significant increase in diesel vehicles.” As indicated in Table 3-1, traffic volumes along I-80 are anticipated to exceed the EPA and FHWA’s POAQC guidelines of 125,000, although truck percentages are expected to remain below the POAQC guidelines of 8% (i.e., 10,000 truck ADT). Consequently, the project is considered to be a POAQC and a qualitative project-level PM2.5 hot spot analysis was conducted to assess whether the project would cause or contribute to any new localized PM2.5 violations, or increase the frequency or severity of any existing violations, or delay timely attainment of the PM10 or PM2.5 national ambient air quality standards (NAAQS).
Chapter 3. PM2.5 Hot Spot Analysis
Qualitative PM2.5 Hot Spot Analysis Interstate 80/Interstate 680/State Route 12 Interchange Project
December 2010 3-5
Table 3-1. Mainline ADT Volume Calculation Assumptions
I-80 ADT Near Cordelia Truck Scales (Worst-Case Traffic Volumes in Project Area)
WB EB Total
Condition am Peak Hour pm Peak Hour
am Peak Hour pm Peak Hour
am total Peak Hour
pm total Peak Hour
total Peak Hour
Calculated ADT1
Calculated Truck ADT2
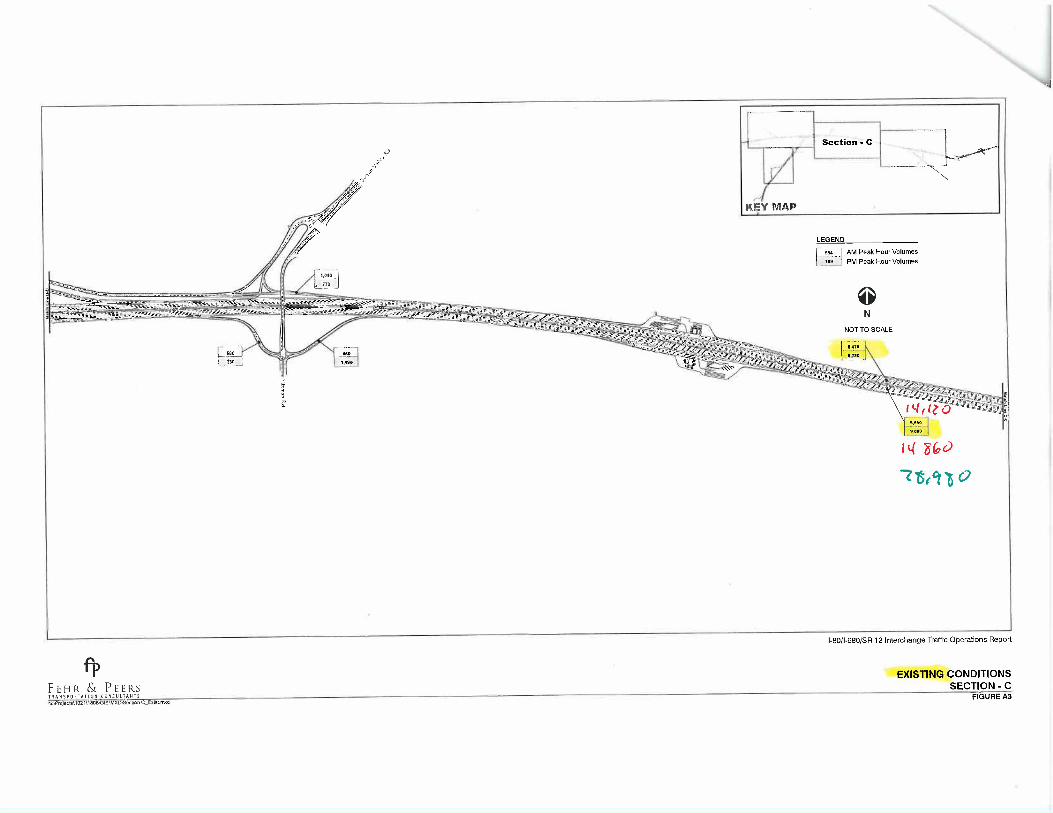
Existing 8,470 6,780 5,650 8,080 14,120 14,860 28,980 144,900 5,057
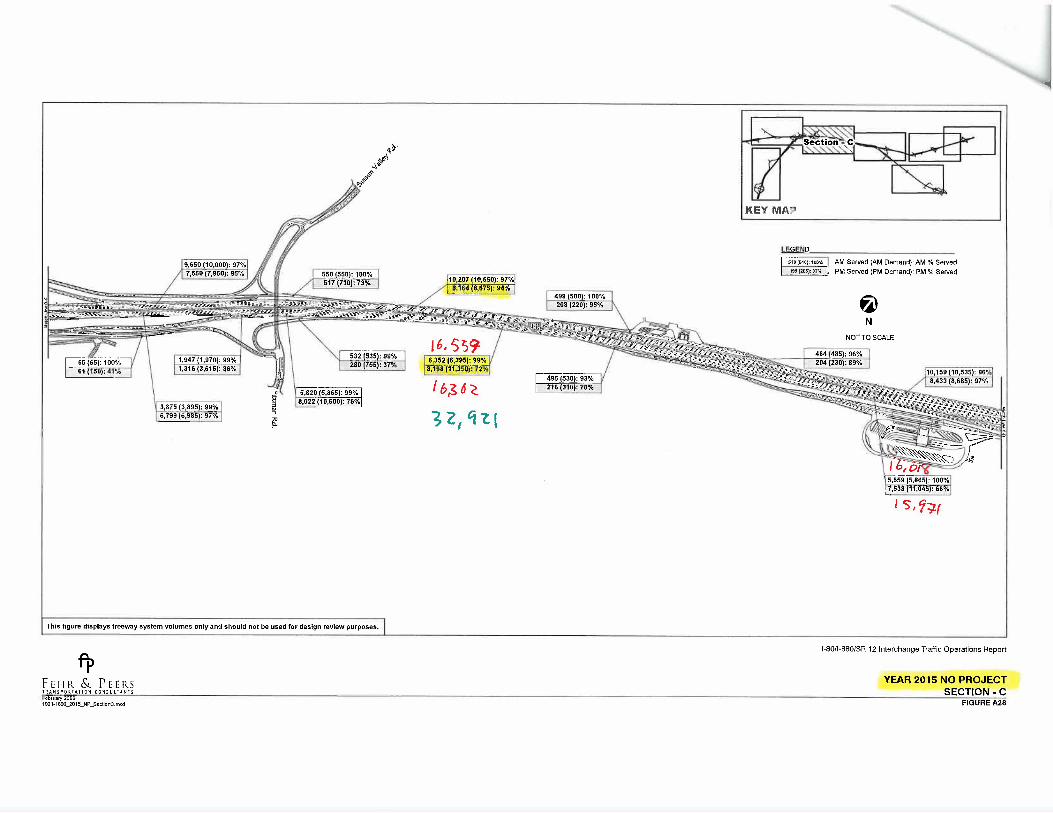
2015 No Project 10,207 8,164 6,352 8,198 16,559 16,362 32,921 164,605 5,745
2015 Alt C, Phase 1 10,261 8,471 6,324 9,597 16,585 18,068 34,653 173,265 6,047
2035 No Project 11,139 5,310 8,461 6,767 19,600 12,077 31,677 158,385 5,528
2035 Alt C, Phase 1 11,645 8,607 8,879 5,535 20,524 14,142 34,666 173,330 6,049
Notes
1 Based on guidance provided by Rabinovitz pers. comm.
2 Assumes 3.49% diesel trucks based on Caltrans 2007 Annual Average Daily Truck Traffic on the California State Highway System data (Attachment D) and methodology from Section B.3.1 of the Caltrans CO Protocol

Chapter 3. PM2.5 Hot Spot Analysis
Qualitative PM2.5 Hot Spot Analysis Interstate 80/Interstate 680/State Route 12 Interchange Project
December 2010 3-6
3.1.2 Ambient Air Quality Standards
24-hour Standard: The old 1997 standard of 65 µg/m3 was revised in 2006 to 35 µg/m3
Annual Standard: 15 µg/m3
The Bay Area was designated as a nonattainment area for the federal PM2.5 standard on October 8, 2009, with an effective date of December 14, 2009. The BAAQMD must submit a SIP to the EPA by December 14, 2012 demonstrating how the Bay Area will achieve the PM2.5 NAAQS by December 14, 2014. (Bay Area Air Quality Management District 2009.)
The 24-hour PM2.5 standard is based on 3-year average of the 98th percentile of 24-hour recorded concentrations; the annual standard is based on 3-year average of the annual arithmetic mean PM2.5 recorded at the monitoring station. A PM2.5 hot-spot analysis must consider both standards, unless it is determined for a given area that meeting the controlling standard would ensure that CAA requirements are met for both standards. The interagency consultation process should be used to discuss how the qualitative PM2.5 hot-spot analysis meets statutory and regulatory requirements for both standards, depending on the factors that are evaluated for a given project
3.2 PM2.5 Hot Spot Analysis
The final Transportation Conformity Rule requires a hot spot analysis to be performed for POAQC, while projects identified as not being a POAQC are not required to undergo a hot spot analysis. As indicated above, data from Table 3-1 indicates that the project is a POAQC and a qualitative PM2.5 hot spot analysis is required.
A hot-spot analysis is defined in Section 93.101 of 40 CFR as an estimation of likely future localized pollutant concentrations and a comparison of those concentrations to the relevant air quality standards. A hot-spot analysis assesses the air quality impacts on a project-level – a scale smaller than an entire nonattainment or maintenance area, such as for congested roadway intersections and highways or transit terminals. Such an analysis is a means of demonstrating that a transportation project meets the federal CAA conformity requirements to support state and local air quality goals with respect to achieving the attainment status in a timely manner. When a hot-spot analysis is required, it is included within the project-level conformity determination that is made by FHWA or the Federal Transit Administration (FTA).
3.2.1 Analysis Methodology and Types of Emissions Considered
The EPA and FHWA established in the Transportation Conformity Guidance for Qualitative Hot-Spot Analyses in PM2.5 and PM10 Nonattainment and Maintenance Areas (Federal Highway Administration and U.S. Environmental Protection Agency 2006) the following two methods for completing a PM2.5 and PM10 hot-spot analysis:

Chapter 3. PM2.5 Hot Spot Analysis
Qualitative PM2.5 Hot Spot Analysis Interstate 80/Interstate 680/State Route 12 Interchange Project
December 2010 3-7
1. Comparison to another location with similar characteristics – (pollutant trend within the air basin)
2. Air quality studies for the proposed project location – (ambient PM trend analysis in the project area)
This analysis uses a combined approach to demonstrate that the proposed project would not result in a new or worsened PM2.5 or PM10 violation. Method 1 was used to establish that the proposed project area will meet the NAAQS. Method 2 was used to demonstrate that implementation of the proposed project would not delay attainment of the NAAQS.
The analysis was based on directly emitted PM2.5 and PM10 emissions, including tailpipe, brake wear, and tire wear.
The hot spot analysis does not consider PM2.5 re-entrained road dust emissions, since there has been no finding of significance made by the EPA or the California Air Resources Board.
Re-entrained dust caused by vehicles traveling over paved and unpaved roads was not included in the qualitative analysis, as the California Air Resources Board has not made a determination that re-entrained road dust is a significant contributor to ambient PM2.5 concentrations in the project region.
Secondary particles formed through PM2.5 and PM10 precursor emissions from a transportation project take several hours to form in the atmosphere, giving emissions time to disperse beyond the immediate project area of concern for localized analyses; therefore, they were not considered in this hot-spot analysis. Secondary emissions of PM2.5 and PM10 are considered as part of the regional emission analysis prepared for the conforming RTP and Federal Transportation Improvement Program (FTIP).
No phase of construction is anticipated to last more than 5 years at any one location. In addition, the project must comply with Bay Area Air Quality Management District (BAAQMD) construction-related fugitive dust control measures, which will ensure that fugitive dust from construction activities are minimized. Consequently, construction-related PM2.5 emissions were not included in the hot spot analysis per 40 CFR 93123(c)(5).
3.2.2 Air Quality Trend Analysis
Local air quality data was obtained from the Berkeley 6th Street and Vallejo Tuolumne Street monitoring stations to characterize existing air quality and predict future conditions in the project area. In addition to monitoring data, this analysis presents project-level PM2.5 emissions in the future (2015 and 2035) years to help characterize the project’s impact on total PM2.5 emissions generated in the project area and the impacts of the project and the likelihood of these impacts interacting with the ambient PM2.5 levels to cause hot spots are discussed.
Chapter 3. PM2.5 Hot Spot Analysis
Qualitative PM2.5 Hot Spot Analysis Interstate 80/Interstate 680/State Route 12 Interchange Project
December 2010 3-8
3.2.2.1 Data Considered
The nearest air quality monitoring station is Fairfield station (1010 Chadbourne Road, Fairfield, California, 94585), which is located approximately 2.25 miles east of the I-80 segment analyzed. However, the Fairfield monitoring station only measures for 1-hour and 8-hour ozone and does not monitor for PM2.5. The next closest stations that monitor for PM2.5 are the Vallejo station (304 Tuolumne St, Vallejo CA, 94590), which is over 10 miles southwest of the project location and the Napa station (26552 Jefferson Av, CA, 94558), which is over 10 miles northwest of the project location. The Napa station is not representative of the project area due to differing geographic characteristics and the lack of a major interstate highway in close proximity to the monitoring station. However, given the proximity to I-80, the Vallejo station is considered representative of the project area.
Based on consultation with the Air Monitoring Manager in the BAAQMD’s Air Monitoring Division to identify a monitoring location representative of the project site, it was determined that the Berkeley monitoring station (1340 Sixth St., Berkeley CA, 94710) could serve as an adequate proxy monitoring station to characterize PM2.5 concentrations at the project site. While the Berkeley monitoring station is located approximately 25 miles to the southwest, the proximity of the Berkeley monitoring station to I-80 would be similar to the conditions in the project site and the westerly wind direction at Berkeley is similar to the conditions in the project site, sufficient to serve as a surrogate monitoring station for the project area. (Colwell pers. comm.) Given this, the trend analysis in section 3.2.2.3 primarily concerns data from the Berkeley station, but monitoring data from Vallejo are presented for illustrative purposes.
3.2.2.2 Climate and Topography
The proposed project lies within the Carquinez Strait region of the San Francisco Bay Area Air Basin (SFBAAB). The Carquinez Strait is the only sea-level gap between the San Francisco Bay and the Central Valley. Within the region, the prevailing winds are from the west, during the summer and fall months, marine air flows eastward through the Carquinez Strait due to high pressure off shore and low pressure in the Central Valley. Figure 3-1indicates the predominant wind direction in the region based on meteorological data from Travis Air Force Base (California Air Resources Board 2009). These west-southwesterly winds usually contain more pollutants from the Sacramento and San Joaquin Valleys in the east than the cleaner marine air from the west. During summer and fall months, this condition can result in elevated pollutant levels as pollutants move through the strait into the central Bay Area from surrounding areas.
The high-pressure periods during the summer and fall months often are accompanied by low wind speeds, shallow mixing depths, higher temperatures, and little or no rainfall. During the summer, mean maximum temperatures reach about 32.2º C (90º F), while mean minimum temperatures in the winter are typically 1.6 º–4.4º C (35 º–40º F). In distant areas like Fairfield, where the region is sheltered from the moderating effects of the strait, temperature extremes are especially pronounced.
Many industrial facilities, such as chemical plants and refineries, are located within the Carquinez Strait region and generate significant air pollutant emissions. However, the high wind speeds in the region often help moderate the pollution potential of this area. Occasionally, short-

Chapter 3. PM2.5 Hot Spot Analysis
Qualitative PM2.5 Hot Spot Analysis Interstate 80/Interstate 680/State Route 12 Interchange Project
December 2010 3-9
term pollution episodes can result from upsets at industrial facilities, while unpleasant odors may occur at any time. The result is that receptors downwind of these facilities could suffer more long-term exposure to air contaminants than individuals elsewhere. Areas of the region that are traversed by major roadways, such as I-80, also may be subject to higher local concentrations of CO and particulate matter, as well as certain toxic air contaminants (TACs), such as benzene. Figure 3-1. Predominant Wind Direction at Travis Air Force Base
Source: California Air Resources Board 2009

Chapter 3. PM2.5 Hot Spot Analysis
Qualitative PM2.5 Hot Spot Analysis Interstate 80/Interstate 680/State Route 12 Interchange Project
December 2010 3-10
3.2.2.3 Trends in PM2.5 Concentrations
Monitored PM2.5 concentrations at the Berkeley 6th Street monitoring station for the past 3 years (2007-2009) are presented in Table 3-2. The period of 2007-2009 represents the full time period in which the Berkeley monitoring station has been operational; annual PM2.5 data is not available for 2007. This data indicate that the 24-hour average PM2.5 concentrations have exceeded the NAAQS for the past two years. However, the national annual average standard was not exceeded at the monitoring station in any of the past three years. While not indicated in Table 3-2, the Berkeley monitor recorded two days in 2008 in which the national 24-hour PM2.5 standard was exceeded, and one day in 2009. Because the Berkeley station is not a federally recognized monitoring station, the data cannot be used to determine violations of the national PM2.5 standards, or its attainment status. However, based on the Berkeley station is an appropriate proxy station to characterize PM2.5 concentrations and evaluate emission trends in the vicinity of the project area.
Monitored PM2.5 concentrations at the Vallejo Tuolumne Street monitoring station for the past 3 years (2007-2009) are also presented in Table 3-2. This data indicate that the 24-hour average PM2.5 concentrations exceeded the NAAQS for in 2007 and 2008 but not in 2009. However, the national annual average standard was not exceeded at the monitoring station in any of the past three years. While not indicated in Table 3-2, the Vallejo monitor recorded national 24-hour PM2.5 standards exceeded for four days in 2007, seven days in 2008, and five days in 2009. The Vallejo station is a federally recognized monitoring station and is used to determine violations of the national PM2.5 standards. In addition, the Vallejo station is another proxy station to characterize PM2.5 concentrations and evaluate emission trends in the vicinity of the project area.
Table 3-2. Ambient PM2.5 Monitoring Data (μg/m3) at the Berkeley 6th Street and Vallejo Tuolumne Street Monitoring Stations (2007-2009)
Metric 2007 2008 2009 Berkeley 6th Street 24-Hour Standard 98th Percentile 23.1 39.2 39.5 Exceeds the federal 24-hour standard (35 μg/m3)? No Yes Yes National annual average NA 12.9 9.9 Exceeds the federal annual average standard (15 μg/m3)? No No No Vallejo Tuolumne Street 24-Hour Standard 98th Percentile 38.6 36.3 33.5 Exceeds the federal 24-hour standard (35 μg/m3)? Yes Yes No National annual average 9.7 9.9 9.9 Exceeds the federal annual average standard (15 μg/m3)? No No No Source: California Air Resources Board NA
As required by the applicable transportation conformity regulations for PM2.5, a trend analysis has been conducted and compared to the current 24-hour and annual average NAAQS. The current 24-hour standard is based on the 3-year average of the 98th percentile of 24-hour average PM2.5 concentrations. The current annual standard is based on a three-year average of annual mean PM2.5 concentrations.

Chapter 3. PM2.5 Hot Spot Analysis
Qualitative PM2.5 Hot Spot Analysis Interstate 80/Interstate 680/State Route 12 Interchange Project
December 2010 3-11
As shown in Figure 3-2, 24-hour average PM2.5 concentrations at the Berkeley 6th Street monitoring station increases between 2007 (23.1 μg/m3) and 2008(39.2 μg/m3), and remained relatively constant between 2008 (39.2 μg/m3) and 2009 (39.5 μg/m3). These values have remained above the current national standard of 35 μg/m3, but below the old standard of 65 μg/m3.
Figure 3-2. 24-Hour Average PM2.5 Concentrations (μg/m3) at the Berkeley 6th Street Monitoring Station (2007-2009)
Source: California Air Resources Board 2010

Chapter 3. PM2.5 Hot Spot Analysis
Qualitative PM2.5 Hot Spot Analysis Interstate 80/Interstate 680/State Route 12 Interchange Project
December 2010 3-12
Figure 3-3 indicates that Annual average PM2.5 concentrations recorded at the Berkeley 6th Street motioning station decreased from 2008 (12.9 μg/m3) to 2009 (9.9 μg/m3). These values have remained below the current national standard of 15.0 μg/m3.
Figure 3-3. Annual Average PM2.5 Concentrations (μg/m3) at the Berkeley 6th Street Monitoring Station (2007-2009)
Source: California Air Resources Board 2010

Chapter 3. PM2.5 Hot Spot Analysis
Qualitative PM2.5 Hot Spot Analysis Interstate 80/Interstate 680/State Route 12 Interchange Project
December 2010 3-13
3.2.2.4 Surrounding Land Uses
The Bay Area Air Quality Management District (BAAQMD) generally defines a sensitive receptor as a facility or land use that houses or attracts members of the population, such as children, the elderly, and people with illnesses, who are particularly sensitive to the effects of air pollutants.
Various sensitive receptors are located in the vicinity of the project area are summarized in Figure 3-4 and include: residences, schools, playgrounds, child care facilities, athletic facilities, health care facilities, convalescent centers, or rehabilitation centers. Land use compatibility issues relative to the siting of pollution-emitting sources or the siting of sensitive receptors must be considered. In the case of schools, state law requires that siting decisions consider the potential for toxic or harmful air emissions in the surrounding area. Figure 3-4 does not include the locations of scattered or individual sensitive receptors.
Surrounding land uses include a school and residential developments. As shown in Figure 3-4, sensitive land uses include the high school and residences west of I-680, residences north of I-80 northeast of the SR 12 West connector and north along most of I-80, residences just east of the current I-80/I-680 interchange, and residences north of SR 12 East.
SR 12 East would not be widened northward: therefore these residences would not be closer to the freeway. Also, the build alternative would construct the new interchange further away from the residences that are currently located just east of the I-80/I-680 interchange.
However, the build alternative would construct (realign) the I-680 freeway closer to a high school west of I-680. The realigned I-680 freeway would be located approximately 1000 feet from the northeast corner of the high school property, which is approximately 500 feet closer than the existing alignment at the same location. However, realigning I-680 and constructing the build alternative would help to reduce congestion and improve traffic flow, especially in the opening year. Since motor vehicle emissions tend to be reduced with increased speed and reduced congestion, the project would result in improvements to air quality in the vicinity of these nearby receptors. In addition, given that the prevailing wind direction in the area is from the west-southwest (see Figure 3-1), emissions from I-680 would likely be carried and dispersed the east-northeast of the roadway, and away from the high school.

Chapter 3. PM2.5 Hot Spot Analysis
Qualitative PM2.5 Hot Spot Analysis Interstate 80/Interstate 680/State Route 12 Interchange Project
December 2010 3-14
Figure 3-4. Sensitive Land Uses in the Project Vicinity

Chapter 3. PM2.5 Hot Spot Analysis
Qualitative PM2.5 Hot Spot Analysis Interstate 80/Interstate 680/State Route 12 Interchange Project
December 2010 3-15
Figure 3-4. Sensitive Land Uses in the Project Vicinity (cont.)

Chapter 3. PM2.5 Hot Spot Analysis
Qualitative PM2.5 Hot Spot Analysis Interstate 80/Interstate 680/State Route 12 Interchange Project
December 2010 3-16
3.2.2.5 Future Trends
Emission trend data for the San Francisco Bay Area Air Basin published in the 2009 edition of The California Almanac of Emissions and Air Quality published by the ARB was used to provide an estimate of potential PM2.5 trends in the vicinity of the project area. While the ARB’s Almanac does not provide emission trend data on the county level, the regional trend data can be used to provide insight on the general trends of air quality in the region, as implementation of emission standards and control requirements that have an effect on regional pollutant concentrations are likely to result in similar trends at the local level.
Table 3-3 presents emission trends in the San Francisco Bay Area Air Basin for the years 1975-2020. Total PM2.5 emissions, emissions from on-road gasoline vehicles, on-road diesel vehicles, and total on-road emissions are presented in Table 3-3.
Table 3-3. PM2.5 Emission Trends in the San Francisco Bay Area Air Basin (tons per day)
Year Total Emissions Total On-Road Mobile Source
Diesel Vehicles Mobile Source
Gasoline Vehicles Mobile Source
1975 80 5 2 3
1980 78 7 4 3
1985 78 8 6 2
1990 84 10 7 3
1995 82 7 4 3
2000 84 7 4 3
2005 81 7 3 4
2010 82 7 3 4
2015 83 7 2 5
2020 85 7 1 5
Source: California Air Resources Board 2010
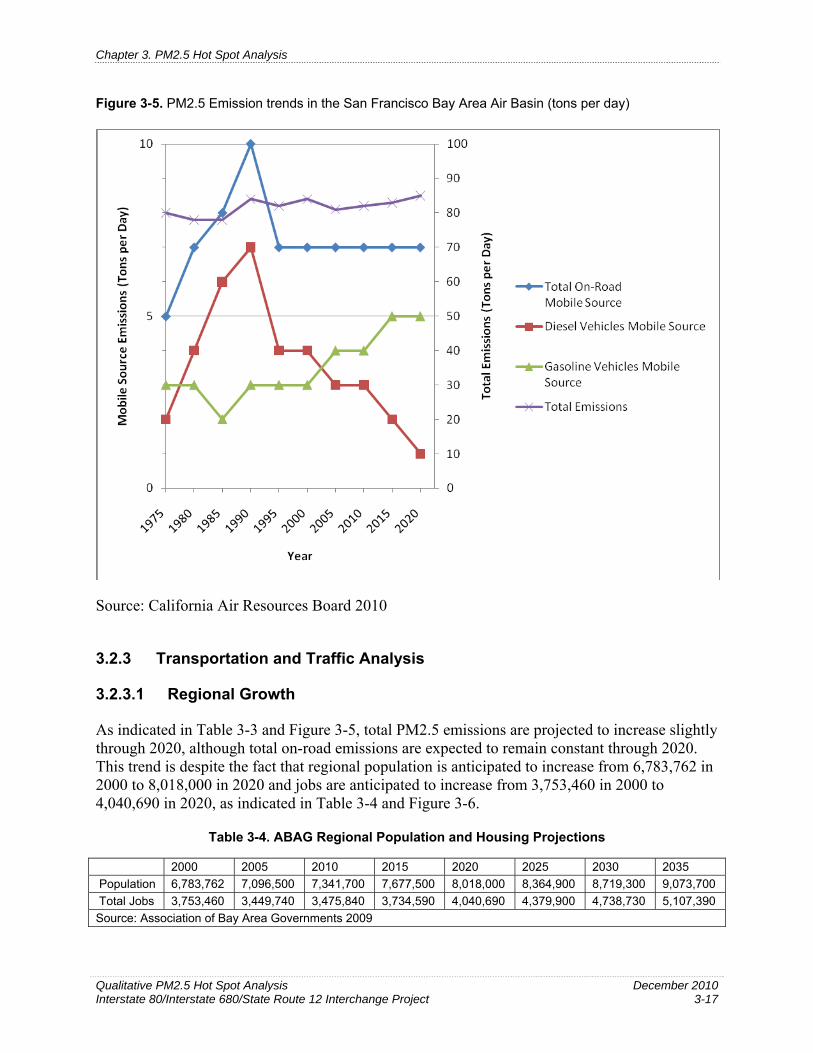
Figure 3-5 presents emissions associated with on-road emissions and indicates that total on-road emissions are expected to remain constant through 2020, with increases in emissions from on-road gasoline vehicles offset by substantial decreases in emissions from on-road diesel vehicles. Emissions of directly emitted PM2.5 from diesel motor vehicles have been decreasing since 1990 even though population and vehicles miles traveled (VMT) are increasing, due to adoption of more stringent emission standards. Figure 3-5 indicates that total PM2.5 emissions have remained relatively constant in the San Francisco Bay Area Air Basin between 1975 and 2005 and are projected to increase slightly through 2020. However, because total on-road emissions are expected to remain constant, the slight increases expected in overall PM2.5 are likely not the result of on-road sources.
Chapter 3. PM2.5 Hot Spot Analysis
Qualitative PM2.5 Hot Spot Analysis Interstate 80/Interstate 680/State Route 12 Interchange Project
December 2010 3-17
Figure 3-5. PM2.5 Emission trends in the San Francisco Bay Area Air Basin (tons per day)
Source: California Air Resources Board 2010
3.2.3 Transportation and Traffic Analysis
3.2.3.1 Regional Growth
As indicated in Table 3-3 and Figure 3-5, total PM2.5 emissions are projected to increase slightly through 2020, although total on-road emissions are expected to remain constant through 2020. This trend is despite the fact that regional population is anticipated to increase from 6,783,762 in 2000 to 8,018,000 in 2020 and jobs are anticipated to increase from 3,753,460 in 2000 to 4,040,690 in 2020, as indicated in Table 3-4 and Figure 3-6.
Table 3-4. ABAG Regional Population and Housing Projections
2000 2005 2010 2015 2020 2025 2030 2035
Population 6,783,762 7,096,500 7,341,700 7,677,500 8,018,000 8,364,900 8,719,300 9,073,700
Total Jobs 3,753,460 3,449,740 3,475,840 3,734,590 4,040,690 4,379,900 4,738,730 5,107,390
Source: Association of Bay Area Governments 2009

Chapter 3. PM2.5 Hot Spot Analysis
Qualitative PM2.5 Hot Spot Analysis Interstate 80/Interstate 680/State Route 12 Interchange Project
December 2010 3-18
Figure 3-6. ABAG Regional Population and Housing Projections
3.2.3.2 Transportation and Traffic
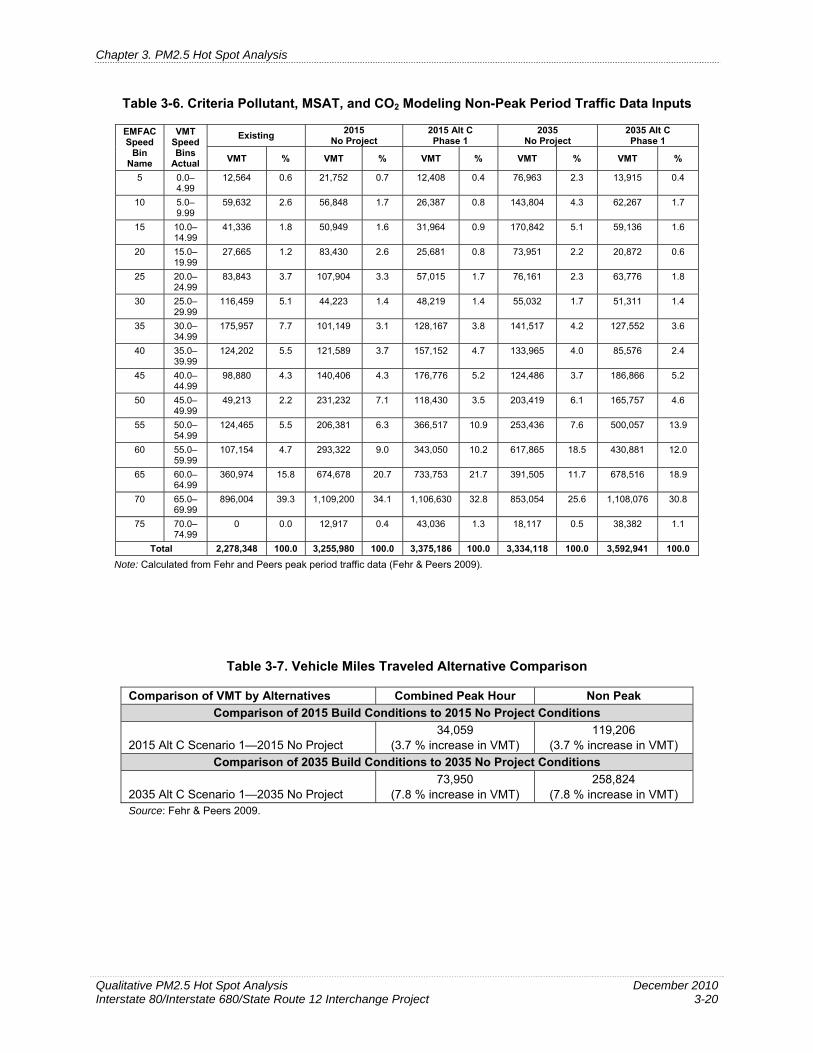
With population and employment growth expected to occur regionally (Table 3-4 and Figure 3-6), it is anticipated that this anticipated growth could result in increased traffic within the project area. Modeled traffic volumes and operating conditions were obtained from the traffic data prepared by the project traffic engineers, Fehr & Peers (Fehr & Peers 2009). Fehr & Peers provided peak hour VMT data and VMT distribution by 5-mph speed bins1 (5 mph to 75 mph). VMT data included vehicle activity for affected roadways in the immediate project region. Off peak VMT was calculated from peak hour VMT data using a peak hour to daily VMT conversion multiplier of 5, provided by Fehr & Peers (Rabinovitz pers. comm.). The traffic data used for emissions modeling is summarized in Tables 3-5 through 3-7. Table 3-5 presents peak period VMT distribution by speed bin, while Table 3-6 presents non-peak period VMT distribution by speed bin. Table 3-7 presents a comparison of VMT associated with Alternative C, Phase 1 to no project conditions. Table 3-7 indicates that implementation of the build alternative is expected to result in increases in VMT when compared to no-project conditions. While the build
1 Traffic data are apportioned into separate 5 mph categories between the speeds of 5 to 75 mph. Each 5 mph
category is known as a speed bins.

Chapter 3. PM2.5 Hot Spot Analysis
Qualitative PM2.5 Hot Spot Analysis Interstate 80/Interstate 680/State Route 12 Interchange Project
December 2010 3-19
alternative would slightly increase VMT, congested speeds are also increasing, indicating that implementation of the project is causing improved traffic operations and overall system efficiency.
Table 3-5. Criteria Pollutant, MSAT, and CO2 Modeling Peak Period Traffic Data Inputs
EMFAC Speed
Bin Name
VMT Speed Bins
Actual
Existing 2015
No Project 2015 Alt C Phase 1
2035 No Project
2035 Alt C Phase1
VMT % VMT % VMT % VMT % VMT %
5 0.0–4.99
3,590 0.6 6,215 0.7 3,545 0.4 21,989 2.3 3,976 0.4
10 5.0– 9.99
17,038 2.6 16,242 1.7 7,539 0.8 41,087 4.3 17,791 1.7
15 10.0– 14.99
11,810 1.8 14,557 1.6 9,132 0.9 48,812 5.1 16,896 1.6
20 15.0– 19.99
7,904 1.2 23,837 2.6 7,337 0.8 21,129 2.2 5,964 0.6
25 20.0– 24.99
23,955 3.7 30,830 3.3 16,290 1.7 21,760 2.3 18,222 1.8
30 25.0– 29.99
33,274 5.1 12,635 1.4 13,777 1.4 15,723 1.7 14,660 1.4
35 30.0– 34.99
50,273 7.7 28,900 3.1 36,619 3.8 40,434 4.2 36,444 3.6
40 35.0– 39.99
35,486 5.5 34,740 3.7 44,901 4.7 38,276 4.0 24,450 2.4
45 40.0– 44.99
28,251 4.3 40,116 4.3 50,507 5.2 35,568 3.7 53,390 5.2
50 45.0– 49.99
14,061 2.2 66,066 7.1 33,837 3.5 58,120 6.1 47,359 4.6
55 50.0– 54.99
35,562 5.5 58,966 6.3 104,719 10.9 72,410 7.6 142,873 13.9
60 55.0– 59.99
30,615 4.7 83,806 9.0 98,014 10.2 176,533 18.5 123,109 12.0
65 60.0– 64.99
103,135 15.8 192,765 20.7 209,644 21.7 111,859 11.7 193,862 18.9
70 65.0– 69.99
256,001 39.3 316,914 34.1 316,180 32.8 243,730 25.6 316,593 30.8
75 70.0– 74.99
0 0.0 3,691 0.4 12,296 1.3 5,176 0.5 10,966 1.1
Total 650,956 100.0 930,280 100.0 964,339 100.0 952,605 100.0 1,026,555 100.0
Note: Calculated from Fehr and Peers peak period traffic data (Fehr & Peers 2009).
Chapter 3. PM2.5 Hot Spot Analysis
Qualitative PM2.5 Hot Spot Analysis Interstate 80/Interstate 680/State Route 12 Interchange Project
December 2010 3-20
Table 3-6. Criteria Pollutant, MSAT, and CO2 Modeling Non-Peak Period Traffic Data Inputs
EMFAC Speed
Bin Name
VMT Speed Bins
Actual
Existing 2015
No Project 2015 Alt C Phase 1
2035 No Project
2035 Alt C Phase 1
VMT % VMT % VMT % VMT % VMT %
5 0.0– 4.99
12,564 0.6 21,752 0.7 12,408 0.4 76,963 2.3 13,915 0.4
10 5.0– 9.99
59,632 2.6 56,848 1.7 26,387 0.8 143,804 4.3 62,267 1.7
15 10.0– 14.99
41,336 1.8 50,949 1.6 31,964 0.9 170,842 5.1 59,136 1.6
20 15.0– 19.99
27,665 1.2 83,430 2.6 25,681 0.8 73,951 2.2 20,872 0.6
25 20.0– 24.99
83,843 3.7 107,904 3.3 57,015 1.7 76,161 2.3 63,776 1.8
30 25.0– 29.99
116,459 5.1 44,223 1.4 48,219 1.4 55,032 1.7 51,311 1.4
35 30.0– 34.99
175,957 7.7 101,149 3.1 128,167 3.8 141,517 4.2 127,552 3.6
40 35.0– 39.99
124,202 5.5 121,589 3.7 157,152 4.7 133,965 4.0 85,576 2.4
45 40.0– 44.99
98,880 4.3 140,406 4.3 176,776 5.2 124,486 3.7 186,866 5.2
50 45.0– 49.99
49,213 2.2 231,232 7.1 118,430 3.5 203,419 6.1 165,757 4.6
55 50.0– 54.99
124,465 5.5 206,381 6.3 366,517 10.9 253,436 7.6 500,057 13.9
60 55.0– 59.99
107,154 4.7 293,322 9.0 343,050 10.2 617,865 18.5 430,881 12.0
65 60.0– 64.99
360,974 15.8 674,678 20.7 733,753 21.7 391,505 11.7 678,516 18.9
70 65.0– 69.99
896,004 39.3 1,109,200 34.1 1,106,630 32.8 853,054 25.6 1,108,076 30.8
75 70.0– 74.99
0 0.0 12,917 0.4 43,036 1.3 18,117 0.5 38,382 1.1
Total 2,278,348 100.0 3,255,980 100.0 3,375,186 100.0 3,334,118 100.0 3,592,941 100.0
Note: Calculated from Fehr and Peers peak period traffic data (Fehr & Peers 2009).
Table 3-7. Vehicle Miles Traveled Alternative Comparison
Comparison of VMT by Alternatives Combined Peak Hour Non Peak
Comparison of 2015 Build Conditions to 2015 No Project Conditions
2015 Alt C Scenario 1—2015 No Project 34,059
(3.7 % increase in VMT) 119,206
(3.7 % increase in VMT)
Comparison of 2035 Build Conditions to 2035 No Project Conditions
2035 Alt C Scenario 1—2035 No Project 73,950
(7.8 % increase in VMT) 258,824
(7.8 % increase in VMT) Source: Fehr & Peers 2009.

Chapter 3. PM2.5 Hot Spot Analysis
Qualitative PM2.5 Hot Spot Analysis Interstate 80/Interstate 680/State Route 12 Interchange Project
December 2010 3-21
Mainline Average Daily Traffic Volumes
Table 3-1 presents calculated Average Daily Traffic (ADT) volumes for the I-80 corridor in the vicinity of the Cordelia truck scales. This segment was analyzed because it represents a worst-case scenario, as this segment has the greatest traffic volumes of any segment along I-80, I 680, and SR 12in the project area, and projected PM2.5 concentrations and impacts are anticipated to be highest in this area.
The ADT data presented in Table 3-1 was calculated from a.m. and p.m. peak hour volumes along the I-80, as the project traffic study only presented an analysis of mainline peak hour traffic volumes and did not present mainline ADT volumes (Fehr & Peers 2009). Appendix A presents peak hour data for the I-80 segment that were used to calculate ADT volumes.
Based on consultation with the project traffic engineers, Fehr & Peers, ADT volumes were calculated from peak hour volumes presented in Appendix A by summing total a.m. and p.m. peak hour volumes and multiplying the resulting total peak hour volumes by a factor of 5 (Rabinovitz pers. comm.).
MainlineTruck Volumes
An evaluation of truck percentages and truck ADT was not conducted as part of the project traffic study. Consequently, based on guidance from Caltrans staff (Kinoshita pers. comm.), truck percentages were estimated using truck data for the study region published in Caltrans 2007 Annual Average Daily Truck Traffic on the California State Highway System (California Department of Transportation 2008) using methodology from Section B.3.1 of the Caltrans Transportation Project-Level Carbon Monoxide Protocol (CO Protocol) (Garza et. Al. 1997). Section B.3.1 from Caltrans’ CO Protocol presents a methodology to estimate vehicle mix, including heavy duty diesel trucks (HDDT) for use in emissions modeling. Table 3-8 presents the traffic volumes used to estimate truck percentages, while Table 3-9 presents the truck percentage calculations based on methodology from the Caltrans CO Protocol. Based on the calculations presented in Table 3-9, it is anticipated that diesel trucks would represent 3.49% of the total traffic volumes in the area.
Because the build alternative involves improvements to existing freeways and local roadways, it is not anticipated to have an effect on truck volumes and fleet mix in the region, and that the percentage of diesel trucks would remain constant at 3.49% for the no-build and build scenarios, as well as for future years. Consequently, Table 3-1 presents the calculated truck ADT data based anticipated mainline ADT volumes and the calculated truck percentages and indicates that implementation of the build alternatives is expected to result in increases in ADT when compared to no-project conditions.

Chapter 3. PM2.5 Hot Spot Analysis
Qualitative PM2.5 Hot Spot Analysis Interstate 80/Interstate 680/State Route 12 Interchange Project
December 2010 3-22
Table 3-8. Caltrans Truck Percentage Data
Route Route Suffix District County
Postmile Prefix Postmile Leg
AADT Total
Total Trucks
Total Truck %
2 Axle Volume
2 Axle Percent
3 Axle Volume
3 Axle Percent
4 Axle Volume
4 Axle Percent
5 Axle Volume
5 Axle Percent Description
12 4 SOL R 2.794 B 32500 2340 7.2 719 30.71 214 9.13 118 5.05 1290 55.11 JCT. RTE. 80 WEST 12 4 SOL L 1.801 A 35500 1807 5.09 460 25.47 150 8.32 36 2 1160 64.22 JCT. RTE. 80 EAST 80 4 SOL R 11.976 B 120000 6720 5.6 2218 33 551 8.2 222 3.3 3730 55.5 JCT. RTE. 12 WEST 80 4 SOL R 11.976 A 156000 8112 5.2 2344 28.9 625 7.7 251 3.1 4892 60.3 JCT. RTE. 12 WEST 80 4 SOL 12.839 B 156000 10234 6.56 2576 25.17 677 6.62 788 7.7 6193 60.51 JCT. RTE. 680 SOUTH 80 4 SOL 12.839 A 197000 11308 5.74 2925 25.87 704 6.23 1083 9.58 6596 58.33 JCT. RTE. 680 SOUTH 80 4 SOL 15.815 B 213000 9819 4.61 2905 29.59 633 6.45 468 4.77 5813 59.2 FAIRFIELD, EAST JCT. RTE. 12
680 4 SOL 13.126 B 60000 3126 5.21 1097 35.1 273 8.72 258 8.25 1498 47.93 CORDELIA WYE, JCT. RTE. 80 Total 970,000 53,466 15,244 3,827 3,224 31,172

Chapter 3. PM2.5 Hot Spot Analysis
Qualitative PM2.5 Hot Spot Analysis Interstate 80/Interstate 680/State Route 12 Interchange Project
December 2010 3-23
Table 3-9. Diesel Truck Calculations

Chapter 3. PM2.5 Hot Spot Analysis
Qualitative PM2.5 Hot Spot Analysis Interstate 80/Interstate 680/State Route 12 Interchange Project
December 2010 3-24
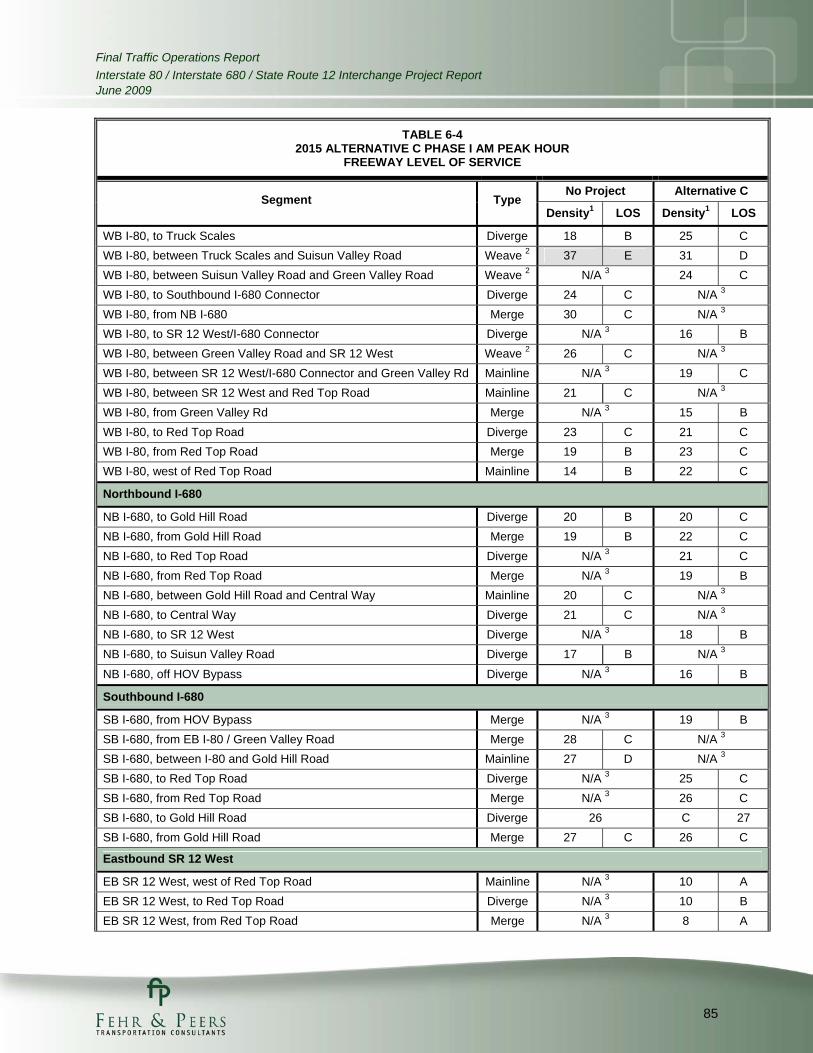
Mainline Level of Service
Appendix B presents mainline LOS data for the years 2015 and 2035 and indicates that implementation of project would have a negligible impact on overall a.m. peak hour operations but would dramatically improve system-wide operations in the p.m. peak hour.
Intersection Average Daily Traffic Volumes and Level of Service
Appendix C presents intersection ADT and LOS and indicates that in 20015, overall intersection AADT would decrease at both ramp and non-ramp intersections with project implementation. Intersection volumes would decrease at the majority of intersections, with a 4.5% decrease in overall intersection AADT and the biggest reductions at ramp intersections. LOS and delay would improve further due to signalization. Overall, AADT would generally decrease at other intersections (non-ramp terminals) and LOS and delay would generally remain the same or improve. In 2035, overall intersection AADT would decrease at both ramp and non-ramp intersections with project implementation. Intersection volumes would decrease at just over half of the intersections, with a 4.7% decrease in overall intersection AADT, with the biggest reductions at ramp terminals. LOS and delay would improve slightly at both ramp and non-ramp intersections.
Congestion Relief and System-Wide Improvements
The project would provide congestion relief and improve system-wide operations relief by improving traffic flow and reducing vehicle hours of delay. The project would reduce system-wide travel times and increase overall speeds during both the opening and horizon years (see Table 3-5 and 3-6). For example, opening year average system-wide travel time in the p.m. peak hour would decrease by about four minutes while average speeds would increase by approximately five miles per hour for the build scenario over the no build scenario. Similarly, the horizon year build scenario would result in approximately a six minute savings in travel time and would increase average speeds by approximately nine miles per hour during the p.m. peak hour. System-wide congestion would improve in both the horizon year a.m. and p.m. peak hours as delay would decrease with increased average network speeds over no build conditions. Appendix D provides a summary of travel times and speeds for the different scenario, while Appendix E provides a discussion of congestion relief benefits associated with the project.
3.2.4 Transportation and Traffic Analysis
Vehicle emission rates were determined using the Department’s CT-EMFAC model2. VMT distribution by speed bin are presented in Table 3-5 and Table 3-6. The CT-EMFAC program assumed the SFBAAB Solano County regional traffic data, operating during the summer months. Vehicle fleet mixes on I-80, I-680, and SR 12 were based on traffic count data collected by the
2 CT-EMFAC is a California-specific project-level analysis tool for modeling criteria pollutant and carbon dioxide emissions from on-road mobile sources. The model uses the latest version of the California Mobile Source Emission Inventory and Emission Factors model, EMFAC2007. While regulations and emissions controls adopted after 2007 are not reflected in the model emission factors, CT-EMFAC is the latest on-road emissions modeling tool and is used as standard practice in air quality technical analyses.

Chapter 3. PM2.5 Hot Spot Analysis
Qualitative PM2.5 Hot Spot Analysis Interstate 80/Interstate 680/State Route 12 Interchange Project
December 2010 3-25
Department (California Department of Transportation 2008), and MSAT speciation factors were based on CARB factors.
Table 3-10 summarizes the modeled yearly emissions. The differences in emissions between with- and without-project conditions represent emissions generated directly as a result of implementation of the build alternatives. Vehicular emission rates are anticipated to lessen in future years due to continuing improvements in engine technology and the retirement of older, higher-emitting vehicles.
Table 3-10. I-80/I-680/SR 12 Project-Related Emissions (pounds per day)
Scenario ROG NOX CO PM10 PM2.5 CO2a
Existing (2004) 2,720 7,671 39,631 191 176 493,410
2015 No Project 1,424 4,386 19,025 206 187 694,836
2015 Alt C Phase 1 1,388 4,522 19,355 202 184 701,297
2035 No Project 814 1,330 8,492 182 169 743,685
2035 Alt C Phase 1 776 1,425 9,077 166 154 749,447
Comparison of Alternatives to Existing
2015 Alt C Phase 1 - Existing -1,332 -3,150 -20,276 11 8 207,887
2035 Alt C Phase 1 - Existing -1,944 -6,247 -30,554 -25 -22 256,037
Comparison of Alternatives to No Project
2015 Alt C Phase 1 - 2015 No Project
-36 136 330 -4 -3 6,461
2035 Alt C Phase 1 - 2035 No Project
-38 95 585 -16 -15 5,763
Note: Emissions calculations based on CT-EMFAC. a CO2 presented in metric tons per year.
Emissions associated with implementation of the proposed project were obtained by comparing future with-project emissions to future without-project emissions for both the construction-interim year (2015) and design-future year (2035) scenarios. As indicated in Table 3-10, in 2015 and 2035, PM2.5 emissions would decrease when compared to the No-Build Alternative due to improvements in traffic operations and overall system efficiency.
3.3 Conclusion
Design year ADT on I-80 is expected to exceed the FHWA and EPA’s POAQC threshold of 125,000. However truck percentages are not in excess of the FHWA and EPA’s POAQC threshold of 8 percent (10,000 diesel truck ADT), as the current diesel truck percentage of approximately 3.49% within the project area equates to truck AADT between 6,047 and 6,049, It should also be noted that implementation of the build alternative would not significantly affect diesel truck volumes and percentages between build and no build alternatives (i.e., effects to truck percentages are below 5% between the no-build and build alternatives). As indicated in Table 3-10, in 2015 and 2035, PM2.5 emissions would decrease when compared to the No-Build Alternative. This is primarily due to travel time savings, decreases in hours of delay, and improvements in average network speed under the build alternative when compared to the no build alternative. Finally, the project would not result in increased congestion at nearby intersections resulting from increased diesel vehicle traffic, as diesel traffic would remain the
Chapter 3. PM2.5 Hot Spot Analysis
Qualitative PM2.5 Hot Spot Analysis Interstate 80/Interstate 680/State Route 12 Interchange Project
December 2010 3-26
same between the no build and build alternatives. Modeling of PM2.5 exhaust emissions indicate that implementation of Alternative C, Phase 1 would result in decreases in daily PM2.5 exhaust emissions over no build conditions in 2015 and 2035.
Transportation conformity is required under CAA section 176(c) (42 U.S.C. 7506(c)) and requires that no federal dollars be used to fund a transportation project unless it can be clearly demonstrated that the project would not cause or contribute to violations of the NAAQS. As required by Final EPA rule published on March 10, 2006, this qualitative assessment demonstrates that the Interstate 80/Interstate 680/State Route 12 Interchange Project meets the CAA conformity requirements and will not conflict with state and local measures to improve regional air quality.
Implementation of the propose project will not result in new violations of the federal PM2.5 air quality standards for the following reasons:
Based on representative monitoring data, ambient PM2.5 concentrations are remaining relatively constant (24-hour PM2.5 standard) or declining (annual PM2.5 standard) (see Figures 3-2 and 3-3).
Based on representative monitoring data, monitored annual average PM2.5 concentrations have not exceed the national standard of 15.0 μg/m3 in the past three years (2007-2009) (see Table 3-2).
Based on representative monitoring data, monitored 24-hour average PM2.5 concentrations exceeded the federal standard of 35 μg/m3 twice in 2008 and once in 2009, indicating that 24-hour PM2.5 concentrations are likely decreasing.
Construction of the build alternative would have a negligible impact on overall a.m. peak hour operations but would dramatically improve system-wide operations in the p.m. peak hour.
In general, construction of the build alternative would result in improved level of service and reduced delay at local intersections.
Construction of the build alternative would reduce system-wide travel times and increase overall speeds during both the opening and horizon years.
Project-related PM2.5 emissions are expected to decrease under future build conditions (2015 and 2035) when compared to no build conditions for Alternative C, Phase 1, thereby reducing total PM2.5 emissions generated within the project region (see Table 3-10).
Maximum truck AADT volume is 6,049, well below the EPA’s guidance of 10,000.
Implementation of the proposed project would not significantly affect diesel truck volumes and percentages between build and no build alternatives (i.e., effects to truck percentages are below 5% between the no-build and build alternatives).
For these reasons, future or worsened PM2.5 violations of any standards are not anticipated. Therefore, the proposed Interstate 80/Interstate 680/State Route 12 Interchange Project meets the conformity hot spot requirements in 40 CFR 93.116 and 93.126 for PM2.5.

Qualitative PM2.5 Hot Spot Analysis Interstate 80/Interstate 680/State Route 12 Interchange Project
December 2010 4-1
Chapter 4 References Cited
4.1 Printed References
Association of Bay Area Governments. 2009. ABAG Projections 2009: Regional Projections. Last Revised: 2009. Available at: <http://www.abag.ca.gov/planning/currentfcst/regional.html>. Accessed November 3, 2010.
Bay Area Air Quality Management District. 2009. Air Quality Plans. Last Revised: October 4, 2010. Available at: <http://www.baaqmd.gov/Divisions/Planning-and-Research/Plans.aspx>. Accessed November 2, 2010.
Bay Area Air Quality Management District. 1910. 2009 Air Monitoring Network Report. July 1. Prepared by Technical Services Division.
California Air Resources Board. 2009. Meteorological Files. Last Revised: August 5, 2009. Available at <http://www.arb.ca.gov/toxics/harp/metfiles.htm>. Accessed November 2, 2009.
California Air Resources Board. 2010. ARB Databases: Aerometric Data Analysis and Management System (ADAM). Last Revised: Unavailable. Available at <http://www.arb.ca.gov/adam/topfour/topfour1.php>. Accessed November 3, 2009.
California Air Resources Board. 2010. The California Almanac of Emissions and Air Quality: 2009 Edition. Planning and Technical Support Division.
California Department of Transportation. 2008. 2007 Annual Average Daily Truck Traffic on the California State Highway System. State of California, Business, Transportation and Housing Agency. Sacramento, CA, Division of Traffic Operations Office of System Planning Management Traffic Data Branch.
Federal Highway Administration, and U.S. Environmental Protection Agency. 2006. Transportation Conformity Guidance for Qualitative Hot-spot Analyses in PM2.5 and PM10 Nonattainment and Maintenance Areas.
Fehr & Peers. 2009. Draft Traffic Operations Report for the I-80/I-680/SR 12 Interchange Project Report. February 2009. Prepared for Caltrans, Solano Transportation Authority, and Mark Thomas/Nolte JV. Walnut Creek, CA.
Garza, V. J., P. Graney, and D. Sperling. 1997. Transportation Project-Level Carbon Monoxide Protocol. Davis, CA: Institute of Transportation Studies, University of California, Davis.

Chapter 4. References Cited
Qualitative PM2.5 Hot Spot Analysis Interstate 80/Interstate 680/State Route 12 Interchange Project
December 2010 4-2
4.2 Personal Communications
Colwell, Glen. Air Monitoring Manager. Bay Area Air Quality ManagementDistrict. California Department of Transportation, District 4. Oakland, CA. November 3, 2010—telephone conversation.
Kinoshita, Glenn. District Branch Chief-Air/Noise Studies. California Department of Transportation, District 4. Oakland, CA. June 23, 2010—email.
Rabinovitz, Joel. Transportation Engineer. Fehr & Peers. Walnut Creek, CA. January 29, 2009 —telephone conversation.

Appendix A
Mainline Peak Hour Volumes used to Calculate Average Daily Traffic


Appendix B
Mainline LOS

Final Traffic Operations Report
Interstate 80 / Interstate 680 / State Route 12 Interchange Project Report June 2009
84
TABLE 6-4 2015 ALTERNATIVE C PHASE I AM PEAK HOUR
FREEWAY LEVEL OF SERVICE
No Project Alternative C Segment Type
Density1 LOS Density1 LOS
Eastbound I-80
EB I-80, west of Red Top Road Mainline 17 B 17 B
EB I-80, to Red Top Road Diverge 14 B 14 B
EB I-80, from Red Top Road Merge 9 A N/A 3
EB I-80, between Red Top Road and SR 12 West Mainline 22 C 14 B
EB I-80, between SR 12 West and Green Valley Road / I-680 SB Weave 2 17 B N/A 3
EB I-80, from SR 12 West Connector Merge N/A 3 11 B
EB I-80, from NB I-680 Connector Merge 18 B 19 B
EB I-80, between I-680 and Green Valley Road Mainline N/A 3 18 B
EB I-80, from Green Valley Road Merge 11 B N/A 3
EB I-80, between Green Valley Road and Pittman Road Weave 2 N/A 3 19 B
EB I-80, between Pittman Road and Truck Scales Weave 2 18 B 19 B
EB I-80, to EB SR 12 East Connector Diverge 11 B 15 B
EB I-80, between SR 12 East and Truck Scales Mainline N/A 3 16 B
EB I-80, between Truck Scales and Abernathy Road Weave 2 19 B 17 B
EB I-80, between Abernathy Road and West Texas Street Weave 2 16 B 17 B
EB I-80, between Beck Avenue and Travis Boulevard Weave 2 15 B 16 B
EB I-80, from Travis Boulevard Merge 10 B 11 B
EB I-80, between Travis Blvd. and Air Base Prkwy. / Waterman Blvd. Mainline 14 B 15 B
EB I-80, to Air Base Parkway / Waterman Boulevard Diverge 12 B 13 B
EB I-80, from Air Base Parkway / Waterman Boulevard Merge 13 B 14 B
EB I-80, east of Air Base Parkway / Waterman Boulevard Mainline 18 C 17 B
Westbound I-80
WB I-80, east of Waterman Boulevard / Air Base Parkway Mainline 31 D 30 D
WB I-80, to Waterman Boulevard Diagonal Diverge 24 C 24 C
WB I-80, to Air Base Parkway Loop Diverge 22 C 22 C
WB I-80, from Air Base Parkway / Waterman Boulevard Merge 30 D 32 D
WB I-80, between Waterman Blvd. / Air Base Pkwy. and Travis Blvd. Mainline 34 D 34 D
WB I-80, to Travis Boulevard Diverge 30 D 33 D
WB I-80, from Travis Boulevard Merge 24 C 25 C
WB I-80, between Travis Boulevard Loop and Oliver Road Weave 2 30 D 30 D
WB I-80, from Oliver Road / West Texas Street Merge 31 D 33 D
WB I-80, to Abernathy Road Diverge 34 D 33 D
WB I-80, from Abernathy Road Merge 23 C 22 C
WB I-80, from SR 12 East Merge 22 C 24 C
WB I-80, between SR 12 East Connector and Truck Scales Mainline 33 D 32 D
Final Traffic Operations Report
Interstate 80 / Interstate 680 / State Route 12 Interchange Project Report June 2009
85
TABLE 6-4 2015 ALTERNATIVE C PHASE I AM PEAK HOUR
FREEWAY LEVEL OF SERVICE
No Project Alternative C Segment Type
Density1 LOS Density1 LOS
WB I-80, to Truck Scales Diverge 18 B 25 C
WB I-80, between Truck Scales and Suisun Valley Road Weave 2 37 E 31 D
WB I-80, between Suisun Valley Road and Green Valley Road Weave 2 N/A 3 24 C
WB I-80, to Southbound I-680 Connector Diverge 24 C N/A 3
WB I-80, from NB I-680 Merge 30 C N/A 3
WB I-80, to SR 12 West/I-680 Connector Diverge N/A 3 16 B
WB I-80, between Green Valley Road and SR 12 West Weave 2 26 C N/A 3
WB I-80, between SR 12 West/I-680 Connector and Green Valley Rd Mainline N/A 3 19 C
WB I-80, between SR 12 West and Red Top Road Mainline 21 C N/A 3
WB I-80, from Green Valley Rd Merge N/A 3 15 B
WB I-80, to Red Top Road Diverge 23 C 21 C
WB I-80, from Red Top Road Merge 19 B 23 C
WB I-80, west of Red Top Road Mainline 14 B 22 C
Northbound I-680
NB I-680, to Gold Hill Road Diverge 20 B 20 C
NB I-680, from Gold Hill Road Merge 19 B 22 C
NB I-680, to Red Top Road Diverge N/A 3 21 C
NB I-680, from Red Top Road Merge N/A 3 19 B
NB I-680, between Gold Hill Road and Central Way Mainline 20 C N/A 3
NB I-680, to Central Way Diverge 21 C N/A 3
NB I-680, to SR 12 West Diverge N/A 3 18 B
NB I-680, to Suisun Valley Road Diverge 17 B N/A 3
NB I-680, off HOV Bypass Diverge N/A 3 16 B
Southbound I-680
SB I-680, from HOV Bypass Merge N/A 3 19 B
SB I-680, from EB I-80 / Green Valley Road Merge 28 C N/A 3
SB I-680, between I-80 and Gold Hill Road Mainline 27 D N/A 3
SB I-680, to Red Top Road Diverge N/A 3 25 C
SB I-680, from Red Top Road Merge N/A 3 26 C
SB I-680, to Gold Hill Road Diverge 26 C 27
SB I-680, from Gold Hill Road Merge 27 C 26 C
Eastbound SR 12 West
EB SR 12 West, west of Red Top Road Mainline N/A 3 10 A
EB SR 12 West, to Red Top Road Diverge N/A 3 10 B
EB SR 12 West, from Red Top Road Merge N/A 3 8 A

Final Traffic Operations Report
Interstate 80 / Interstate 680 / State Route 12 Interchange Project Report June 2009
86
TABLE 6-4 2015 ALTERNATIVE C PHASE I AM PEAK HOUR
FREEWAY LEVEL OF SERVICE
No Project Alternative C Segment Type
Density1 LOS Density1 LOS
Westbound SR 12 West
WB SR 12 West, from I-680 Merge N/A 3 18 B
WB SR 12 West, from Red Top Road Merge N/A 3 22 C
WB SR 12 West, west of Red Top Road Mainilne N/A 3 24 C
Eastbound SR 12 East
EB SR 12 East, between Truck Scales and Chadbourne Road Weave 2 10 A 10 B
EB SR 12 East, from Chadbourne Road Merge 12 B 12 B
EB SR 12 East, to Webster Street Diverge 15 B 15 B
EB SR 12 East, between Webster Street and Civic Center Boulevard Weave 2 11 B 11 B
EB SR 12 East, from Civic Center Boulevard Merge 14 B 14 B
Westbound SR 12 East
WB SR 12 East, to Main Street Diverge 68 F 79 F
WB SR 12 East, between Main Street and Jackson Street Weave 2 74 F 85 F
WB SR 12 East, from Jackson Street Merge 105 F 111 F
WB SR 12 East, to Abernathy Road Diverge 26 C 26 C
WB SR 12 East, from Abernathy Road Merge 21 C 24 C
Notes: [No Shading] = Under Capacity, = Near Capacity, = At/Over Capacity, = 25% Over Capacity, = More than 50% Over Capacity
BOLD = segment operates unacceptably. * = Denotes segment operates at capacity. 1. Density is expressed in vehicles per hour per lane. Speed is expressed in miles per hour and is the speed over all lanes (excluding
HOV). 2. Level of service thresholds for weaving sections are different than mainline sections. Refer to Table 1 for thresholds. 3. N/A – This segment is not applicable for this scenario. It is a ramp or freeway segment that isn’t present in one scenario, but is in the
other. Source: Fehr & Peers, May 2009.

Attachment C
2015 PM Freeway LOS

Final Traffic Operations Report
Interstate 80 / Interstate 680 / State Route 12 Interchange Project Report June 2009
90
TABLE 6-6 2015 ALTERNATIVE C PHASE I PM PEAK HOUR
FREEWAY LEVEL OF SERVICE
No Project Alternative C Segment Type
Density1 LOS Density1 LOS
Eastbound I-80
EB I-80, west of Red Top Road Mainline 25 C 25 C
EB I-80, to Red Top Road Diverge 20 B 20 B
EB I-80, from Red Top Road Merge 18 B N/A 3
EB I-80, between Red Top Road and SR 12 West Mainline 18 C 23 C
EB I-80, between SR 12 West and Green Valley Road / I-680 SB Weave 2 29 D N/A 3
EB I-80, from SR 12 West Connector Merge N/A 3 32 D
EB I-80, from NB I-680 Connector Merge 100 F 49 F
EB I-80, between I-680 and Green Valley Road Mainline N/A 3 47 F
EB I-80, from Green Valley Road Merge 50 F N/A 3
EB I-80, between Green Valley Road and Pittman Road Weave 2 N/A 3 53 F
EB I-80, between Pittman Road and Truck Scales Weave 2 96 F 64 F
EB I-80, to EB SR 12 East Connector Diverge 136 F 71 F
EB I-80, between SR 12 East and Truck Scales Mainline N/A 3 23 C
EB I-80, between Truck Scales and Abernathy Road Weave 2 22 C 26 C
EB I-80, between Abernathy Road and West Texas Street Weave 2 21 C 25 C
EB I-80, between Beck Avenue and Travis Boulevard Weave 2 21 C 25 C
EB I-80, from Travis Boulevard Merge 21 C 23 C
EB I-80, between Travis Blvd. and Air Base Prkwy. / Waterman Blvd. Mainline 24 C 27 D
EB I-80, to Air Base Parkway / Waterman Boulevard Diverge 20 B 22 C
EB I-80, from Air Base Parkway / Waterman Boulevard Merge 26 C 27 C
EB I-80, east of Air Base Parkway / Waterman Boulevard Mainline 28 D 29 D
Westbound I-80
WB I-80, east of Waterman Boulevard / Air Base Parkway Mainline 24 C 24 C
WB I-80, to Waterman Boulevard Diagonal Diverge 21 C 21 C
WB I-80, to Air Base Parkway Loop Diverge 15 B 15 B
WB I-80, from Air Base Parkway / Waterman Boulevard Merge 26 C 26 C
WB I-80, between Waterman Blvd. / Air Base Pkwy. and Travis Blvd. Mainline 26 D 27 D
WB I-80, to Travis Boulevard Diverge 25 C 26 C
WB I-80, from Travis Boulevard Merge 20 C 20 C
WB I-80, between Travis Boulevard Loop and Oliver Road Weave 2 24 C 24 C
WB I-80, from Oliver Road / West Texas Street Merge 25 C 25 C
WB I-80, to Abernathy Road Diverge 26 C 27 C
WB I-80, from Abernathy Road Merge 19 B 20 B
WB I-80, from SR 12 East Merge 20 B 18 B
WB I-80, between SR 12 East Connector and Truck Scales Mainline 27 D 26 D

Final Traffic Operations Report
Interstate 80 / Interstate 680 / State Route 12 Interchange Project Report June 2009
91
TABLE 6-6 2015 ALTERNATIVE C PHASE I PM PEAK HOUR
FREEWAY LEVEL OF SERVICE
No Project Alternative C Segment Type
Density1 LOS Density1 LOS
WB I-80, to Truck Scales Diverge 34 D 21 C
WB I-80, between Truck Scales and Suisun Valley Road Weave 2 40 E 25 C
WB I-80, between Suisun Valley Road and Green Valley Road Weave 2 N/A 3 19 B
WB I-80, to Southbound I-680 Connector Diverge 19 B N/A 3
WB I-80, from NB I-680 Merge 15 B N/A 3
WB I-80, to SR 12 West/I-680 Connector Diverge N/A 3 14 B
WB I-80, between Green Valley Road and SR 12 West Weave 2 19 B N/A 3
WB I-80, between SR 12 West/I-680 Connector and Green Valley Rd Mainline N/A 3 15 B
WB I-80, between SR 12 West and Red Top Road Mainline 17 B N/A 3
WB I-80, from Green Valley Rd Merge N/A 3 15 B
WB I-80, to Red Top Road Diverge 18 B 19 B
WB I-80, from Red Top Road Merge 17 B 22 C
WB I-80, west of Red Top Road Mainline 23 C 20 C
Northbound I-680
NB I-680, to Gold Hill Road Diverge 98 F 37 E
NB I-680, from Gold Hill Road Merge 105 F 39 E
NB I-680, to Red Top Road Diverge N/A 3 35 D
NB I-680, from Red Top Road Merge N/A 3 30 D
NB I-680, between Gold Hill Road and Central Way Mainline 115 F N/A 3
NB I-680, to Central Way Diverge 124 F N/A 3
NB I-680, to SR 12 West Diverge N/A 30 D
NB I-680, to Suisun Valley Road Diverge 126 F N/A
NB I-680, off HOV Bypass Diverge N/A 28 D
Southbound I-680
SB I-680, from HOV Bypass Merge N/A 3 18 B
SB I-680, from EB I-80 / Green Valley Road Merge 24 C N/A 3
SB I-680, between I-80 and Gold Hill Road Mainline 22 C N/A 3
SB I-680, to Red Top Road Diverge N/A 3 23 C
SB I-680, from Red Top Road Merge N/A 3 22 C
SB I-680, to Gold Hill Road Diverge 22 C 23 C
SB I-680, from Gold Hill Road Merge 22 C 23 C
Eastbound SR 12 West
EB SR 12 West, west of Red Top Road Mainline N/A 3 22 C
EB SR 12 West, to Red Top Road Diverge N/A 3 22 C
EB SR 12 West, from Red Top Road Merge N/A 3 14 B

Final Traffic Operations Report
Interstate 80 / Interstate 680 / State Route 12 Interchange Project Report June 2009
92
TABLE 6-6 2015 ALTERNATIVE C PHASE I PM PEAK HOUR
FREEWAY LEVEL OF SERVICE
No Project Alternative C Segment Type
Density1 LOS Density1 LOS
Westbound SR 12 West
WB SR 12 West, from I-680 Merge N/A 3 11 B
WB SR 12 West, from Red Top Road Merge N/A 3 12 B
WB SR 12 West, west of Red Top Road Mainline N/A 3 12 B
Eastbound SR 12 East
EB SR 12 East, between Truck Scales and Chadbourne Road Weave 2 159 F 130 F
EB SR 12 East, from Chadbourne Road Merge 144 F 145 F
EB SR 12 East, to Webster Street Diverge 20 C 27 C
EB SR 12 East, between Webster Street and Civic Center Boulevard Weave 2 18 B 22 C
EB SR 12 East, from Civic Center Boulevard Merge 24 C 28 C
Westbound SR 12 East
WB SR 12 East, to Main Street Diverge 19 B 19 B
WB SR 12 East, between Main Street and Jackson Street Weave 2 15 B 15 B
WB SR 12 East, from Jackson Street Merge 67 F 83 F
WB SR 12 East, to Abernathy Road Diverge 19 B 19 B
WB SR 12 East, from Abernathy Road Merge 18 B 18 B
Notes: [No Shading] = Under Capacity, = Near Capacity, = At/Over Capacity, = 25% Over Capacity, = More than 50% Over Capacity
BOLD = segment operates unacceptably. * = Denotes segment operates at capacity.
1. Density is expressed in vehicles per hour per lane. Speed is expressed in miles per hour and is the speed over all lanes (excluding HOV).
2. Level of service thresholds for weaving sections are different than mainline sections. Refer to Table 1 for thresholds.
3. N/A – This segment is not applicable for this scenario. It is a ramp or freeway segment that isn’t present in one scenario, but is in the other.
Source: Fehr & Peers, May 2009.

Final Traffic Operations Report
Interstate 80 / Interstate 680 / State Route 12 Interchange Project Report June 2009
119
TABLE 7-4 2035 ALTERNATIVE C PHASE I AM PEAK HOUR
FREEWAY LEVEL OF SERVICE
No Project Alternative C
Phase I Segment Type
Density1 LOS Density1 LOS
Eastbound I-80
EB I-80, west of Red Top Road Mainline N/A 3 23 C
EB I-80, to Red Top Road Diverge 44 F 23 C
EB I-80, from Red Top Road Merge 12 B N/A 3
EB I-80, between SR 12 West and Green Valley Road / I-680 SB Weave 2 22 C N/A 3
EB I-80, from SR 12 West Connector Merge N/A 3 13 B
EB I-80, from NB I-680 Connector Merge 26 C 27 C
EB I-80, between I-680 and Green Valley Road Mainline N/A 3 24 C
EB I-80, from Green Valley Road Merge 14 B N/A 3
EB I-80, between Green Valley Road and Pittman Road Weave 2 N/A 3 26 C
EB I-80, between Pittman Road and Truck Scales Weave 2 26 C 27 C
EB I-80, to EB SR 12 East Connector Diverge 13 B 18 B
EB I-80, between SR 12 East and Truck Scales Mainline N/A 3 21 C
EB I-80, between Truck Scales and Abernathy Road Weave 2 25 C 24 C
EB I-80, between Abernathy Road and West Texas Street Weave 2 21 C 23 C
EB I-80, between Beck Avenue and Travis Boulevard Weave 2 21 C 22 C
EB I-80, from Travis Boulevard Merge 13 B 15 B
EB I-80, between Travis Blvd. and Air Base Pkwy. / Waterman Blvd. Mainline 20 C 21 C
EB I-80, to Air Base Parkway / Waterman Boulevard Diverge 16 B 18 B
EB I-80, from Air Base Parkway / Waterman Boulevard Merge 17 B 19 B
EB I-80, east of Air Base Parkway / Waterman Boulevard Mainline 23 C 23 C
Westbound I-80
WB I-80, east of Waterman Boulevard / Air Base Parkway Mainline 35 D 35 D
WB I-80, to Waterman Boulevard Diagonal Diverge 30 D 30 D
WB I-80, to Air Base Parkway Loop Diverge 26 C 26 C
WB I-80, from Air Base Parkway / Waterman Boulevard Merge 36 E 33 D
WB I-80, between Waterman Blvd. / Air Base Pkwy. and Travis Blvd. Mainline 38 E 36 E
WB I-80, to Travis Boulevard Diverge 34 D 31 D
WB I-80, from Travis Boulevard Merge 38 E 34 D
WB I-80, between Travis Boulevard Loop and Oliver Road Weave 2 43 E 39 E
WB I-80, from Oliver Road / West Texas Street Merge 31 D 30 D
WB I-80, to Abernathy Road Diverge 33 D 32 D
WB I-80, from Abernathy Road Merge 35 D 30 D
WB I-80, from SR 12 East Merge 46 F 32 D
WB I-80, between SR 12 East Connector and Truck Scales Mainline 58 F 38 E

Final Traffic Operations Report
Interstate 80 / Interstate 680 / State Route 12 Interchange Project Report June 2009
120
TABLE 7-4 2035 ALTERNATIVE C PHASE I AM PEAK HOUR
FREEWAY LEVEL OF SERVICE
No Project Alternative C
Phase I Segment Type
Density1 LOS Density1 LOS
WB I-80, to Truck Scales Diverge 31 D 28 D
WB I-80, between Truck Scales and Suisun Valley Road Weave 2 63 F 37 E
WB I-80, between Suisun Valley Road and Green Valley Road Weave 2 N/A 3 29 D
WB I-80, to Southbound I-680 Connector Diverge 27 C N/A 3
WB I-80, from NB I-680 Merge 44 E* N/A 3
WB I-80, to SR 12 West/I-680 Connector Diverge N/A 3 19 B
WB I-80, between Green Valley Road and SR 12 West Weave 2 33 D N/A 3
WB I-80, between SR 12 West/I-680 Connector and Green Valley Rd Mainline N/A 3 21 C
WB I-80, from Green Valley Rd Merge N/A 3 18 B
WB I-80, to Red Top Road Diverge 25 C 23 C
WB I-80, from Red Top Road Merge 20 C 26 C
WB I-80, west of Red Top Road Mainline N/A 26 C
Northbound I-680
NB I-680, to Gold Hill Road Diverge 36 E 40 E
NB I-680, from Gold Hill Road Merge 36 E 43 E
NB I-680, to Red Top Road Diverge N/A 3 36 E
NB I-680, from Red Top Road Merge N/A 3 31 D
NB I-680, between Gold Hill Road and Central Way Mainline 36 E N/A 3
NB I-680, to Central Way Diverge 36 E N/A 3
NB I-680, to SR 12 West Diverge N/A 3 29 D
NB I-680, to Suisun Valley Road Diverge 27 C N/A 3
NB I-680, off HOV Bypass Diverge N/A 3 26 C
Southbound I-680
SB I-680, from HOV Bypass Merge N/A 3 22 C
SB I-680, from EB I-80 / Green Valley Road Merge 32 D N/A 3
SB I-680, between I-80 and Gold Hill Road Mainline 31 D N/A 3
SB I-680, to Red Top Road Diverge N/A 3 29 D
SB I-680, from Red Top Road Merge N/A 3 34 D
SB I-680, to Gold Hill Road Diverge 31 D 33 D
SB I-680, from Gold Hill Road Merge 38 E 36 E
Eastbound SR 12 West
EB SR 12 West, west of Red Top Road Mainline N/A 3 10 A
EB SR 12 West, to Red Top Road Diverge N/A 3 11 B
EB SR 12 West, from Red Top Road Merge N/A 3 8 A
Westbound SR 12 West

Final Traffic Operations Report
Interstate 80 / Interstate 680 / State Route 12 Interchange Project Report June 2009
121
TABLE 7-4 2035 ALTERNATIVE C PHASE I AM PEAK HOUR
FREEWAY LEVEL OF SERVICE
No Project Alternative C
Phase I Segment Type
Density1 LOS Density1 LOS
WB SR 12 West, from I-680 Merge N/A 3 21 C
WB SR 12 West, from Red Top Road Merge N/A 3 27 C
WB SR 12 West, west of Red Top Road Mainline N/A 3 29 D
Eastbound SR 12 East
EB SR 12 East, between Truck Scales and Chadbourne Road Weave 2 13 B 14 B
EB SR 12 East, from Chadbourne Road Merge 15 B 16 B
EB SR 12 East, to Webster Street Diverge 20 B 20 B
EB SR 12 East, between Webster Street and Civic Center Boulevard Weave 2 15 B 15 B
EB SR 12 East, from Civic Center Boulevard Merge 18 B 17 B
Westbound SR 12 East
WB SR 12 East, to Main Street Diverge 111 F 115 F
WB SR 12 East, between Main Street and Jackson Street Weave 2 101 F 103 F
WB SR 12 East, from Jackson Street Merge 115 F 120 F
WB SR 12 East, to Abernathy Road Diverge 26 C 26 C
WB SR 12 East, from Abernathy Road Merge 20 C 23 C
Notes: [No Shading] = Under Capacity, = Near Capacity, = At/Over Capacity, = 25% Over Capacity, = More than 50% Over Capacity
BOLD = segment operates unacceptably. * = Denotes segment operates at capacity.
1. Density is expressed in vehicles per hour per lane. Speed is expressed in miles per hour and is the speed over all lanes (excluding HOV).
2. Level of service thresholds for weaving sections are different than mainline sections. Refer to Table 1 for thresholds.
3. N/A – This segment is not applicable for this scenario. It is a ramp or freeway segment that isn’t present in one scenario, but is in the other.
Source: Fehr & Peers, May 2009.

Attachment G
2035 PM Freeway LOS

Final Traffic Operations Report
Interstate 80 / Interstate 680 / State Route 12 Interchange Project Report June 2009
125
TABLE 7-6 2035 ALTERNATIVE C PHASE I PM PEAK HOUR
FREEWAY LEVEL OF SERVICE
No Project Alternative C
Phase I Segment Type
Density1 LOS Density1 LOS
Eastbound I-80
EB I-80, west of Red Top Road Mainline N/A 3 85 F
EB I-80, to Red Top Road Diverge 92 F 98 F
EB I-80, from Red Top Road Merge 90 F N/A 3
EB I-80, between SR 12 West and Green Valley Road / I-680 SB Weave 2 67 F N/A 3
EB I-80, from SR 12 West Connector Merge N/A 3 144 F
EB I-80, from NB I-680 Connector Merge 96 F 172 F
EB I-80, between I-680 and Green Valley Road Mainline N/A 3 124 F
EB I-80, from Green Valley Road Merge 64 F N/A 3
EB I-80, between Green Valley Road and Pittman Road Weave 2 N/A 3 135 F
EB I-80, between Pittman Road and Truck Scales Weave 2 103 F 130 F
EB I-80, to EB SR 12 East Connector Diverge 124 F 140 F
EB I-80, between SR 12 East and Truck Scales Mainline N/A 3 13 B
EB I-80, between Truck Scales and Abernathy Road Weave 2 24 C 16 B
EB I-80, between Abernathy Road and West Texas Street Weave 2 19 B 18 B
EB I-80, between Beck Avenue and Travis Boulevard Weave 2 20 B 18 B
EB I-80, from Travis Boulevard Merge 19 B 21 C
EB I-80, between Travis Blvd. and Air Base Prkwy. / Waterman Blvd. Mainline 23 C 23 C
EB I-80, to Air Base Parkway / Waterman Boulevard Diverge 18 B 19 B
EB I-80, from Air Base Parkway / Waterman Boulevard Merge 23 C 26 C
EB I-80, east of Air Base Parkway / Waterman Boulevard Mainline 28 D 25 C
Westbound I-80
WB I-80, east of Waterman Boulevard / Air Base Parkway Mainline 57 F 32 D
WB I-80, to Waterman Boulevard Diagonal Diverge 66 F 29 D
WB I-80, to Air Base Parkway Loop Diverge 67 F 20 C
WB I-80, from Air Base Parkway / Waterman Boulevard Merge 88 F 28 D
WB I-80, between Waterman Blvd. / Air Base Pkwy. and Travis Blvd. Mainline 78 F 30 D
WB I-80, to Travis Boulevard Diverge 86 F 26 C
WB I-80, from Travis Boulevard Merge 93 F 29 D
WB I-80, between Travis Boulevard Loop and Oliver Road Weave 2 89 F 33 D
WB I-80, from Oliver Road / West Texas Street Merge 107 F 32 D
WB I-80, to Abernathy Road Diverge 103 F 33 D
WB I-80, from Abernathy Road Merge 122 F 38 F
WB I-80, from SR 12 East Merge 138 F 49 F
WB I-80, between SR 12 East Connector and Truck Scales Mainline 120 F 57 F

Final Traffic Operations Report
Interstate 80 / Interstate 680 / State Route 12 Interchange Project Report June 2009
126
TABLE 7-6 2035 ALTERNATIVE C PHASE I PM PEAK HOUR
FREEWAY LEVEL OF SERVICE
No Project Alternative C
Phase I Segment Type
Density1 LOS Density1 LOS
WB I-80, to Truck Scales Diverge 144 F 64 F
WB I-80, between Truck Scales and Suisun Valley Road Weave 2 58 E* 70 E*
WB I-80, between Suisun Valley Road and Green Valley Road Weave 2 N/A 3 20 B
WB I-80, to Southbound I-680 Connector Diverge 12 B N/A 3
WB I-80, from NB I-680 Merge 9 A N/A 3
WB I-80, to SR 12 West/I-680 Connector Diverge N/A 3 15 B
WB I-80, between Green Valley Road and SR 12 West Weave 2 13 B N/A 3
WB I-80, between SR 12 West/I-680 Connector and Green Valley Rd Mainline N/A 3 15 B
WB I-80, from Green Valley Rd Merge N/A 3 14 B
WB I-80, to Red Top Road Diverge 46 F 18 B
WB I-80, from Red Top Road Merge 8 A 21 C
WB I-80, west of Red Top Road Mainline N/A 3 19 C
Northbound I-680
NB I-680, to Gold Hill Road Diverge 143 F 138 F
NB I-680, from Gold Hill Road Merge 148 F 141 F
NB I-680, to Red Top Road Diverge N/A 3 142 F
NB I-680, from Red Top Road Merge N/A 3 169 F
NB I-680, between Gold Hill Road and Central Way Mainline 148 F N/A 3
NB I-680, to Central Way Diverge 131 F N/A 3
NB I-680, to SR 12 West Diverge N/A 3 167 F
NB I-680, to Suisun Valley Road Diverge 104 F N/A 3
NB I-680, off HOV Bypass Diverge N/A 3 157 F
Southbound I-680
SB I-680, from HOV Bypass Merge N/A 3 19 B
SB I-680, from EB I-80 / Green Valley Road Merge 15 B N/A 3
SB I-680, between I-80 and Gold Hill Road Mainline 14 B N/A 3
SB I-680, to Red Top Road Diverge N/A 3 24 C
SB I-680, from Red Top Road Merge N/A 3 24 C
SB I-680, to Gold Hill Road Diverge 14 B 24 C
SB I-680, from Gold Hill Road Merge 14 B 23 C
Eastbound SR 12 West
EB SR 12 West, west of Red Top Road Mainline N/A 3 163 F
EB SR 12 West, to Red Top Road Diverge N/A 3 157 F
EB SR 12 West, from Red Top Road Merge N/A 3 171 F

Final Traffic Operations Report
Interstate 80 / Interstate 680 / State Route 12 Interchange Project Report June 2009
127
TABLE 7-6 2035 ALTERNATIVE C PHASE I PM PEAK HOUR
FREEWAY LEVEL OF SERVICE
No Project Alternative C
Phase I Segment Type
Density1 LOS Density1 LOS
Westbound SR 12 West
WB SR 12 West, from I-680 Merge N/A 3 11 B
WB SR 12 West, from Red Top Road Merge N/A 3 12 B
WB SR 12 West, west of Red Top Road Mainline N/A 3 12 B
Eastbound SR 12 East
EB SR 12 East, between Truck Scales and Chadbourne Road Weave 2 157 F 163 F
EB SR 12 East, from Chadbourne Road Merge 147 F 154 F
EB SR 12 East, to Webster Street Diverge 17 B 20 B
EB SR 12 East, between Webster Street and Civic Center Boulevard Weave 2 17 B 17 B
EB SR 12 East, from Civic Center Boulevard Merge 26 C 27 C
Westbound SR 12 East
WB SR 12 East, to Main Street Diverge 158 F 119 F
WB SR 12 East, between Main Street and Jackson Street Weave 2 134 F 106 F
WB SR 12 East, from Jackson Street Merge 161 F 131 F
WB SR 12 East, to Abernathy Road Diverge 164 F 24 C
WB SR 12 East, from Abernathy Road Merge 191 F 36 F
Notes: [No Shading] = Under Capacity, = Near Capacity, = At/Over Capacity, = 25% Over Capacity, = More than 50% Over Capacity
BOLD = segment operates unacceptably. * = Denotes segment operates at capacity.
1. Density is expressed in vehicles per hour per lane. Speed is expressed in miles per hour and is the speed over all lanes (excluding HOV).
2. Level of service thresholds for weaving sections are different than mainline sections. Refer to Table 1 for thresholds.
3. N/A – This segment is not applicable for this scenario. It is a ramp or freeway segment that isn’t present in one scenario, but is in the other.
Source: Fehr & Peers, May 2009.

Appendix C
Intersection Average Daily Traffic Volumes and LOS

2015 Intersection Delay, LOS, and Volumes
RAMP TERMINALS
Intersection # Delay LOS ADT Delay LOS ADT AADT Delay LOS ADT Delay LOS ADT AADTChange vs No
Build
1 I‐680 NB Ramps & Gold Hill Rd 10 B 1075 20 C 1320 11,975 8 A 590 17 B 875 7,325 ‐38.8%3 I‐680 SB Ramps & Gold Hill Rd 6 A 1665 6 A 1315 14,900 4 A 1270 3 A 1275 12,725 ‐14.6%7 I‐80 EB Ramps & Red Top Rd 20 B 1960 12 B 1745 18,525 16 B 1630 16 B 1835 17,325 ‐6.5%8 I‐80 WB Ramps & Red Top Rd 19 B 1630 14 B 1225 14,275 29 C 1525 39 D 1520 15,225 6.7%9 Jameson Canyon Rd (SR12 West) & Red Top Rd 28 C 3910 49 D 3785 38,475 10 B 760 9 A 925 8,425 ‐78.1%
15 I‐680 NB Off‐Ramp & Central Way 2 A 670 1 A 980 8,250 NA NA 0 NA NA 0 0 0.0%16 I‐680 SB Onramp (I‐80 EB Off‐Ramp) & Lopes Rd 16 B 1710 12 B 1845 17,775 15 B 2245 17 B 1825 20,350 14.5%17 I‐80 (SR 12) WB On‐Ramp & Green Valley Rd 4 A 1945 2 A 2080 20,125 19 B 2610 10 B 2340 24,750 23.0%21 I‐80 EB Ramps & Pittman Rd 16 B 1780 >80 F 1970 18,750 21 C 1705 30 C 2070 18,875 0.7%22 Suisin Valley Rd & Neitzel Rd 5 A 1245 21 C 1420 13,325 2 A 1220 8 A 1425 13,225 ‐0.8%24 SR 12 East EB Ramps & Chadbourne Rd 4 A 1100 39 D 2440 17,700 4 A 1115 19 B 2430 17,725 0.1%25 SR 12 East WB Ramps & Chadbourne Rd 16 B 1610 35 D 2600 21,050 9 A 1385 15 B 2605 19,950 ‐5.2%27 I‐80 EB Ramps & Abernathy Rd 7 A 1675 61 E 2730 22,025 7 A 1355 17 B 2690 20,225 ‐8.2%28 I‐80 WB Ramps & Abernathy Rd 18 B 2125 >80 F 2425 22,750 19 B 1815 20 B 2385 21,000 ‐7.7%29 I‐80 EB Ramps & Magellan Rd NA NA 0 NA NA 0 0 NA NA 0 NA NA 0 0 0.0%30 I‐80 EB Off‐Ramp & West Texas St 5 A 2130 10 B 2995 25,625 5 A 2110 14 B 2990 25,500 ‐0.5%31 I‐80 EB On‐Ramp ‐ Beck Ave & West Texas St 18 B 2805 >80 F 4365 35,850 17 B 2765 >80 F 4365 35,650 ‐0.6%33 I‐80 WB On‐Ramp ‐ Oliver Rd & Rockville Rd 26 C 2420 31 C 2750 25,850 26 C 2435 31 C 2775 26,050 0.8%34 I‐80 WB Off‐Ramp & Oliver Rd 15 B 1655 12 B 1775 17,150 16 B 1710 13 B 1795 17,525 2.2%38 SR 12 East & Beck Ave 80 F 7035 >80 F 6445 67,400 80 F 5325 80 F 6450 58,875 ‐12.6%39 SR 12 East & Pennsylvania Ave 49 D 4780 >80 F 6440 56,100 50 D 4765 80 F 6445 56,050 ‐0.1%43 I‐80 WB Ramps & Travis Blvd 4 A 2640 6 A 3720 31,800 4 A 2615 7 A 3720 31,675 ‐0.4%44 I‐80 EB Ramps & Travis Blvd 2 A 2755 6 A 5055 39,050 2 A 2765 6 A 5055 39,100 0.1%51 I‐80 WB On‐Ramp ‐ Hilborne Rd & Waterman Blvd 28 C 4010 42 D 5190 46,000 27 C 3970 43 D 5190 45,800 ‐0.4%53 I‐80 EB Ramps & Air Base Pkwy 11 B 4295 41 B 5090 46,925 10 B 4270 16 B 5090 46,800 ‐0.3%99 Red Top Rd & EB SR 12 West Ram NA NA 0 NA NA 0 0 10 B 680 20 B 1180 9,300 0.0%
555 I‐680 SB Ramps & Red Top Rd NA NA 0 NA NA 0 0 2 A 615 2 A 970 7,925 0.0%
Total for all Ramp Terminals 651,650 617,375Change versus Same Year No Build ‐5.26%
Delay LOS ADT Delay LOS ADT AADT Delay LOS ADT Delay LOS ADT AADTChange vs No
Build2 Ramsey Rd & Gold Hill Rd 11 B 585 14 B 700 6,425 9 A 240 10 A 300 2,700 ‐58.0%4 Lopes Rd & Gold Hill Rd 39 D 2225 20 C 1915 20,700 31 C 2095 23 C 2055 20,750 0.2%5 Lopes Rd & Red Top Rd 18 B 1055 12 B 1065 10,600 11 B 1835 12 B 1935 18,850 77.8%
10 Ramsey Rd & Bridgeport Ave 12 B 600 13 B 645 6,225 9 A 350 10 A 325 3,375 ‐45.8%11 Bridgeport Ave & Cordelia Rd 10 B 920 15 C 1130 10,250 10 A 790 14 B 1025 9,075 ‐11.5%12 Lopes Rd & Cordelia Rd 80 F 1930 80 F 2180 20,550 41 D 810 21 C 1020 9,150 ‐55.5%13 Lopes Rd & Bridgeport Ave 80 F 1545 80 F 1675 16,100 41 D 675 21 C 705 6,900 ‐57.1%14 Central Wy & Cordelia Rd 43 E 1200 50 F 1595 13,975 14 B 720 50 F 1145 9,325 ‐33.3%18 Green Valley Rd & Business Center Dr 28 C 2670 30 C 3655 31,625 31 C 2490 34 C 3520 30,050 ‐5.0%19 Green Valley Rd & Mangels Blvd 21 C 1365 22 C 1610 14,875 21 C 1355 22 C 1610 14,825 ‐0.3%20 Pittman Rd & Central Way 22 C 1335 19 B 1515 14,250 24 C 1260 19 B 1600 14,300 0.4%23 Suisin Valley Rd & Mangels Blvd 20 B 2710 18 B 3375 30,425 21 C 2660 18 B 3435 30,475 0.2%26 Abernathy Rd & Magellan (Auto Ma 12 B 1705 18 B 2575 21,400 13 B 1450 18 B 2570 20,100 ‐6.1%32 Beck Ave & Driveway/Cadenas 21 C 1505 29 C 2730 21,175 21 C 1515 19 B 2735 21,250 0.4%35 Neitzel Rd & Business Center Dr 8 A 1655 9 A 1775 17,150 NA NA 0 NA NA 0 0 0.0%36 Suisin Valley Rd & Rockville Rd 20 B 1095 10 B 1370 12,325 20 B 1095 10 B 1370 12,325 0.0%37 Rockville Rd & Abernathy Rd 11 B 1380 12 B 1635 15,075 9 A 1330 10 A 1635 14,825 ‐1.7%40 Pennsylvania Ave & Cordelia Rd 11 B 575 50 F 1325 9,500 11 B 540 50 F 1325 9,325 ‐1.8%41 Oliver Rd & Travis Blvd 15 B 1670 22 C 2205 19,375 15 B 1695 22 C 2390 20,425 5.4%42 Holiday Ln & Travis Blvd 18 B 1840 28 C 2840 23,400 18 B 1835 28 C 2845 23,400 0.0%45 Gateway Shopping Center ‐ 2nd Street & Travis Blvd 18 B 2775 35 D 4845 38,100 18 B 2770 35 D 4845 38,075 ‐0.1%46 Pennsylvania Ave & Travis Blvd 30 C 3380 32 C 4545 39,625 30 C 3380 32 C 4545 39,625 0.0%47 Oliver Rd & Wood Creek Dr 15 B 1355 12 B 1775 15,650 17 B 1370 12 B 1775 15,725 0.5%48 Oliver Rd & Waterman Blvd 20 C 1755 26 D 1970 18,625 20 C 1710 26 C 1970 18,400 ‐1.2%49 Capitola Way & Waterman Blvd 10 B 1560 13 B 1570 15,650 10 B 1565 13 B 1570 15,675 0.2%50 Barbour Dr & Waterman Blvd 11 B 1835 18 B 2110 19,725 11 B 1850 18 B 2110 19,800 0.4%54 Health Dr & Air Base Pkwy 32 C 4705 38 D 5230 49,675 32 C 4705 38 D 5230 49,675 0.0%55 Gateway Shopping Center & Travis Blvd 6 A 2335 8 A 3165 27,500 6 A 2330 8 A 3165 27,475 ‐0.1%58 Green Valley Rd & Lopes Rd NA NA 0 NA NA 0 0 14 B 2375 16 B 2365 23,700 0.0%
Total for all Non‐Ramp Terminals 559,950 539,575Change versus Same Year No Build ‐3.64%
Total Volume For All Intersections 1,211,600 1,156,950Change versus Same Year No Build ‐4.51%
Source: Appendix B, Draft TRAFFIC OPERATIONS REPORT FOR THE I‐80/ I‐680/SR 12 INTERCHANGE PROJECT REPORT. June 2009�AADT assumed a peak hour multiplier of 5, based on guidance provided by Rabinovitz pers. comm.�Shaded cells are interesections with less traffic volumes for the Build scenario
2015 No Build 2015 Build Alternative C1
Intersection Name
AM PM AM PMNON‐RAMP TERMINALS
2015 No BuildAM PM PM
2015 Build Alternative C1AM

Attachment H
2035 Intersection LOS, Delay, and Volumes
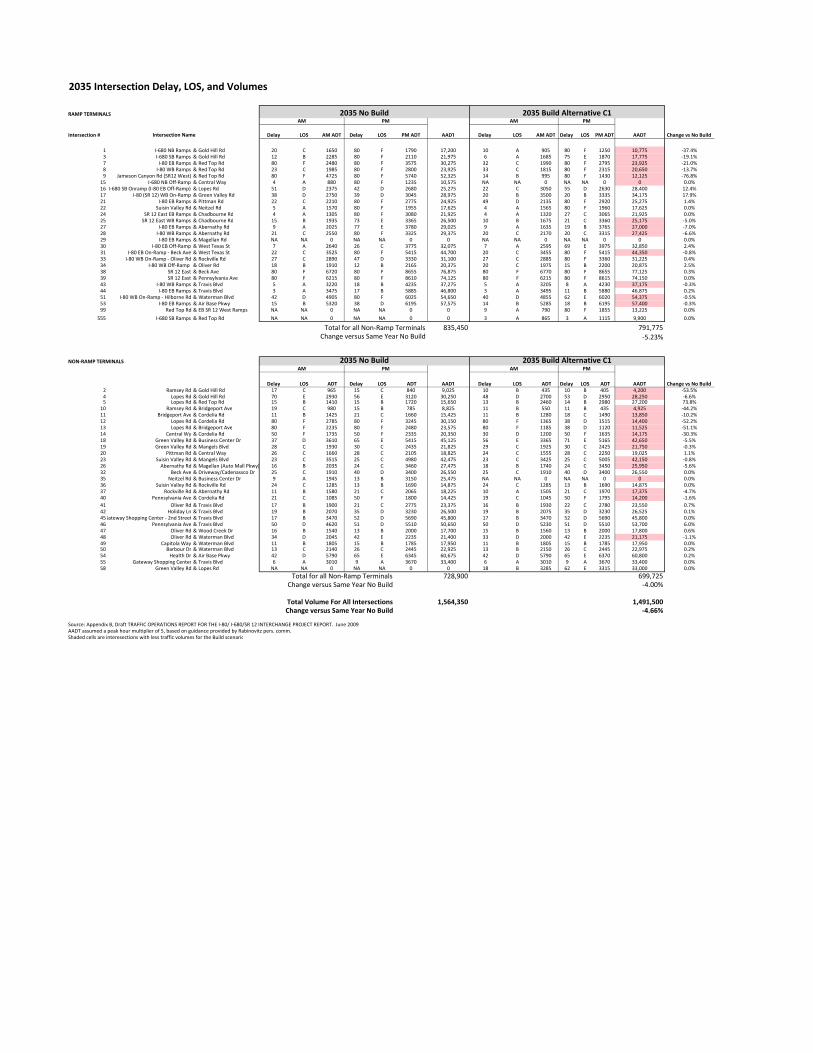
2035 Intersection Delay, LOS, and Volumes
RAMP TERMINALS
Intersection # Delay LOS AM ADT Delay LOS PM ADT AADT Delay LOS AM ADT Delay LOS PM ADT AADT Change vs No Build
1 I‐680 NB Ramps & Gold Hill Rd 20 C 1650 80 F 1790 17,200 10 A 905 80 F 1250 10,775 ‐37.4%3 I‐680 SB Ramps & Gold Hill Rd 12 B 2285 80 F 2110 21,975 6 A 1685 75 E 1870 17,775 ‐19.1%7 I‐80 EB Ramps & Red Top Rd 80 F 2480 80 F 3575 30,275 32 C 1990 80 F 2795 23,925 ‐21.0%8 I‐80 WB Ramps & Red Top Rd 23 C 1985 80 F 2800 23,925 33 C 1815 80 F 2315 20,650 ‐13.7%9 Jameson Canyon Rd (SR12 West) & Red Top Rd 80 F 4725 80 F 5740 52,325 14 B 995 80 F 1430 12,125 ‐76.8%
15 I‐680 NB Off‐Ramp & Central Way 4 A 880 80 F 1235 10,575 NA NA 0 NA NA 0 0 0.0%16 I‐680 SB Onramp (I‐80 EB Off‐Ramp) & Lopes Rd 51 D 2375 42 D 2680 25,275 22 C 3050 55 D 2630 28,400 12.4%17 I‐80 (SR 12) WB On‐Ramp & Green Valley Rd 38 D 2750 39 D 3045 28,975 20 B 3500 20 B 3335 34,175 17.9%21 I‐80 EB Ramps & Pittman Rd 22 C 2210 80 F 2775 24,925 49 D 2135 80 F 2920 25,275 1.4%22 Suisin Valley Rd & Neitzel Rd 5 A 1570 80 F 1955 17,625 4 A 1565 80 F 1960 17,625 0.0%24 SR 12 East EB Ramps & Chadbourne Rd 4 A 1305 80 F 3080 21,925 4 A 1320 27 C 3065 21,925 0.0%25 SR 12 East WB Ramps & Chadbourne Rd 15 B 1935 73 E 3365 26,500 10 B 1675 21 C 3360 25,175 ‐5.0%27 I‐80 EB Ramps & Abernathy Rd 9 A 2025 77 E 3780 29,025 9 A 1635 19 B 3765 27,000 ‐7.0%28 I‐80 WB Ramps & Abernathy Rd 21 C 2550 80 F 3325 29,375 20 C 2170 20 C 3315 27,425 ‐6.6%29 I‐80 EB Ramps & Magellan Rd NA NA 0 NA NA 0 0 NA NA 0 NA NA 0 0 0.0%30 I‐80 EB Off‐Ramp & West Texas St 7 A 2640 26 C 3775 32,075 7 A 2595 69 E 3975 32,850 2.4%31 I‐80 EB On‐Ramp ‐ Beck Ave & West Texas St 22 C 3525 80 F 5415 44,700 20 C 3455 80 F 5415 44,350 ‐0.8%33 I‐80 WB On‐Ramp ‐ Oliver Rd & Rockville Rd 27 C 2890 47 D 3330 31,100 27 C 2885 80 F 3360 31,225 0.4%34 I‐80 WB Off‐Ramp & Oliver Rd 18 B 1910 12 B 2165 20,375 20 C 1975 15 B 2200 20,875 2.5%38 SR 12 East & Beck Ave 80 F 6720 80 F 8655 76,875 80 F 6770 80 F 8655 77,125 0.3%39 SR 12 East & Pennsylvania Ave 80 F 6215 80 F 8610 74,125 80 F 6215 80 F 8615 74,150 0.0%43 I‐80 WB Ramps & Travis Blvd 5 A 3220 18 B 4235 37,275 5 A 3205 8 A 4230 37,175 ‐0.3%44 I‐80 EB Ramps & Travis Blvd 3 A 3475 17 B 5885 46,800 3 A 3495 11 B 5880 46,875 0.2%51 I‐80 WB On‐Ramp ‐ Hilborne Rd & Waterman Blvd 42 D 4905 80 F 6025 54,650 40 D 4855 62 E 6020 54,375 ‐0.5%53 I‐80 EB Ramps & Air Base Pkwy 15 B 5320 38 D 6195 57,575 14 B 5285 18 B 6195 57,400 ‐0.3%99 Red Top Rd & EB SR 12 West Ramps NA NA 0 NA NA 0 0 9 A 790 80 F 1855 13,225 0.0%
555 I‐680 SB Ramps & Red Top Rd NA NA 0 NA NA 0 0 3 A 865 3 A 1115 9,900 0.0%
Total for all Non‐Ramp Terminals 835,450 791,775Change versus Same Year No Build ‐5.23%
Delay LOS ADT Delay LOS ADT AADT Delay LOS ADT Delay LOS ADT AADT Change vs No Build2 Ramsey Rd & Gold Hill Rd 17 C 965 15 C 840 9,025 10 B 435 10 B 405 4,200 ‐53.5%4 Lopes Rd & Gold Hill Rd 70 E 2930 56 E 3120 30,250 48 D 2700 53 D 2950 28,250 ‐6.6%5 Lopes Rd & Red Top Rd 15 B 1410 15 B 1720 15,650 13 B 2460 14 B 2980 27,200 73.8%
10 Ramsey Rd & Bridgeport Ave 19 C 980 15 B 785 8,825 11 B 550 11 B 435 4,925 ‐44.2%11 Bridgeport Ave & Cordelia Rd 11 B 1425 21 C 1660 15,425 11 B 1280 18 C 1490 13,850 ‐10.2%12 Lopes Rd & Cordelia Rd 80 F 2785 80 F 3245 30,150 80 F 1365 38 D 1515 14,400 ‐52.2%13 Lopes Rd & Bridgeport Ave 80 F 2235 80 F 2480 23,575 80 F 1185 38 D 1120 11,525 ‐51.1%14 Central Wy & Cordelia Rd 50 F 1735 50 F 2335 20,350 30 D 1200 50 F 1635 14,175 ‐30.3%18 Green Valley Rd & Business Center Dr 37 D 3610 65 E 5415 45,125 56 E 3365 71 E 5165 42,650 ‐5.5%19 Green Valley Rd & Mangels Blvd 28 C 1930 30 C 2435 21,825 29 C 1925 30 C 2425 21,750 ‐0.3%20 Pittman Rd & Central Way 26 C 1660 28 C 2105 18,825 24 C 1555 28 C 2250 19,025 1.1%23 Suisin Valley Rd & Mangels Blvd 23 C 3515 25 C 4980 42,475 23 C 3425 25 C 5005 42,150 ‐0.8%26 Abernathy Rd & Magellan (Auto Mall Pkwy) 16 B 2035 24 C 3460 27,475 18 B 1740 24 C 3450 25,950 ‐5.6%32 Beck Ave & Driveway/Cadenassco Dr 25 C 1910 40 D 3400 26,550 25 C 1910 40 D 3400 26,550 0.0%35 Neitzel Rd & Business Center Dr 9 A 1945 13 B 3150 25,475 NA NA 0 NA NA 0 0 0.0%36 Suisin Valley Rd & Rockville Rd 24 C 1285 13 B 1690 14,875 24 C 1285 13 B 1690 14,875 0.0%37 Rockville Rd & Abernathy Rd 11 B 1580 21 C 2065 18,225 10 A 1505 21 C 1970 17,375 ‐4.7%40 Pennsylvania Ave & Cordelia Rd 21 C 1085 50 F 1800 14,425 19 C 1045 50 F 1795 14,200 ‐1.6%41 Oliver Rd & Travis Blvd 17 B 1900 21 C 2775 23,375 16 B 1930 22 C 2780 23,550 0.7%42 Holiday Ln & Travis Blvd 19 B 2070 35 D 3230 26,500 19 B 2075 35 D 3230 26,525 0.1%45Gateway Shopping Center ‐ 2nd Street & Travis Blvd 17 B 3470 52 D 5690 45,800 17 B 3470 52 D 5690 45,800 0.0%46 Pennsylvania Ave & Travis Blvd 50 D 4620 51 D 5510 50,650 50 D 5230 51 D 5510 53,700 6.0%47 Oliver Rd & Wood Creek Dr 16 B 1540 13 B 2000 17,700 15 B 1560 13 B 2000 17,800 0.6%48 Oliver Rd & Waterman Blvd 34 D 2045 42 E 2235 21,400 33 D 2000 42 E 2235 21,175 ‐1.1%49 Capitola Way & Waterman Blvd 11 B 1805 15 B 1785 17,950 11 B 1805 15 B 1785 17,950 0.0%50 Barbour Dr & Waterman Blvd 13 C 2140 26 C 2445 22,925 13 B 2150 26 C 2445 22,975 0.2%54 Health Dr & Air Base Pkwy 42 D 5790 65 E 6345 60,675 42 D 5790 65 E 6370 60,800 0.2%55 Gateway Shopping Center & Travis Blvd 6 A 3010 9 A 3670 33,400 6 A 3010 9 A 3670 33,400 0.0%58 Green Valley Rd & Lopes Rd NA NA 0 NA NA 0 0 18 B 3285 62 E 3315 33,000 0.0%
Total for all Non‐Ramp Terminals 728,900 699,725Change versus Same Year No Build ‐4.00%
Total Volume For All Intersections 1,564,350 1,491,500Change versus Same Year No Build ‐4.66%
Source: Appendix B, Draft TRAFFIC OPERATIONS REPORT FOR THE I‐80/ I‐680/SR 12 INTERCHANGE PROJECT REPORT. June 2009�AADT assumed a peak hour multiplier of 5, based on guidance provided by Rabinovitz pers. comm.�Shaded cells are interesections with less traffic volumes for the Build scenario
AM PM
AM PM2035 Build Alternative C1
2035 Build Alternative C1AM PM
2035 No BuildAM PM
2035 No Build
Intersection Name
NON‐RAMP TERMINALS

Appendix D
System-Wide Improvements
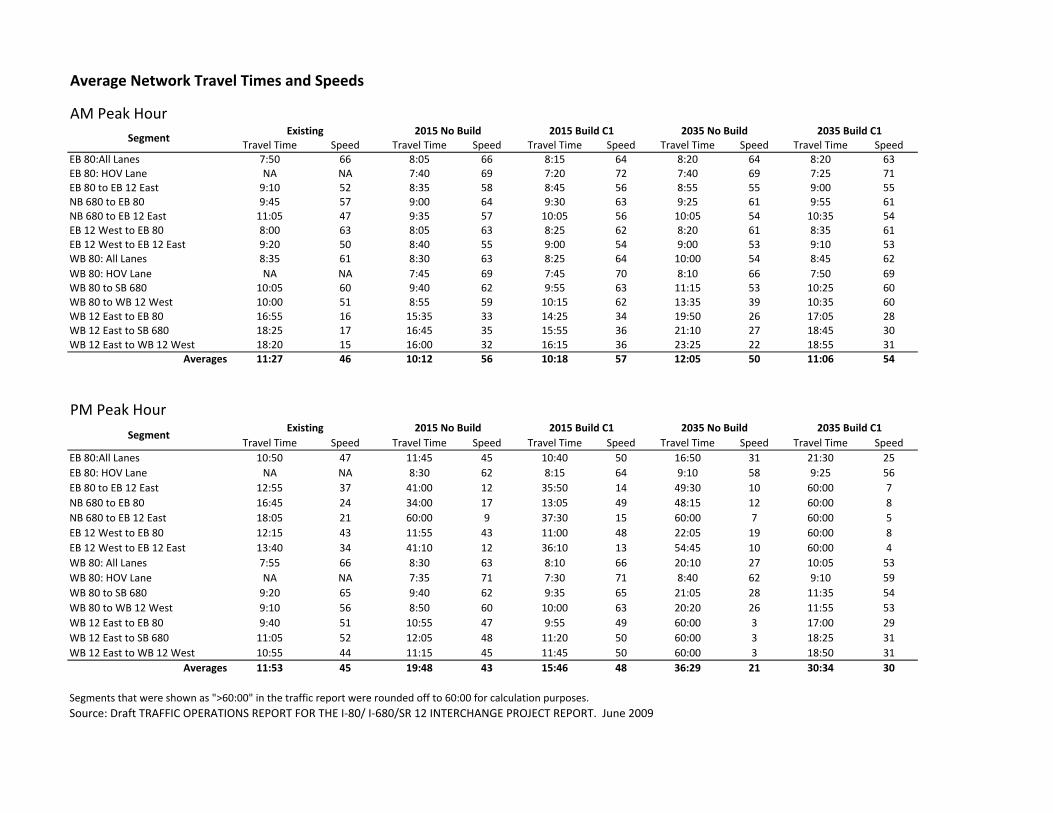
AM Peak Hour
Travel Time Speed Travel Time Speed Travel Time Speed Travel Time Speed Travel Time SpeedEB 80:All Lanes 7:50 66 8:05 66 8:15 64 8:20 64 8:20 63EB 80: HOV Lane NA NA 7:40 69 7:20 72 7:40 69 7:25 71EB 80 to EB 12 East 9:10 52 8:35 58 8:45 56 8:55 55 9:00 55NB 680 to EB 80 9:45 57 9:00 64 9:30 63 9:25 61 9:55 61NB 680 to EB 12 East 11:05 47 9:35 57 10:05 56 10:05 54 10:35 54EB 12 West to EB 80 8:00 63 8:05 63 8:25 62 8:20 61 8:35 61EB 12 West to EB 12 East 9:20 50 8:40 55 9:00 54 9:00 53 9:10 53WB 80: All Lanes 8:35 61 8:30 63 8:25 64 10:00 54 8:45 62WB 80: HOV Lane NA NA 7:45 69 7:45 70 8:10 66 7:50 69WB 80 to SB 680 10:05 60 9:40 62 9:55 63 11:15 53 10:25 60WB 80 to WB 12 West 10:00 51 8:55 59 10:15 62 13:35 39 10:35 60WB 12 East to EB 80 16:55 16 15:35 33 14:25 34 19:50 26 17:05 28WB 12 East to SB 680 18:25 17 16:45 35 15:55 36 21:10 27 18:45 30WB 12 East to WB 12 West 18:20 15 16:00 32 16:15 36 23:25 22 18:55 31
Averages 11:27 46 10:12 56 10:18 57 12:05 50 11:06 54
PM Peak Hour
Travel Time Speed Travel Time Speed Travel Time Speed Travel Time Speed Travel Time SpeedEB 80:All Lanes 10:50 47 11:45 45 10:40 50 16:50 31 21:30 25EB 80: HOV Lane NA NA 8:30 62 8:15 64 9:10 58 9:25 56EB 80 to EB 12 East 12:55 37 41:00 12 35:50 14 49:30 10 60:00 7NB 680 to EB 80 16:45 24 34:00 17 13:05 49 48:15 12 60:00 8NB 680 to EB 12 East 18:05 21 60:00 9 37:30 15 60:00 7 60:00 5EB 12 West to EB 80 12:15 43 11:55 43 11:00 48 22:05 19 60:00 8EB 12 West to EB 12 East 13:40 34 41:10 12 36:10 13 54:45 10 60:00 4WB 80: All Lanes 7:55 66 8:30 63 8:10 66 20:10 27 10:05 53WB 80: HOV Lane NA NA 7:35 71 7:30 71 8:40 62 9:10 59WB 80 to SB 680 9:20 65 9:40 62 9:35 65 21:05 28 11:35 54WB 80 to WB 12 West 9:10 56 8:50 60 10:00 63 20:20 26 11:55 53WB 12 East to EB 80 9:40 51 10:55 47 9:55 49 60:00 3 17:00 29WB 12 East to SB 680 11:05 52 12:05 48 11:20 50 60:00 3 18:25 31WB 12 East to WB 12 West 10:55 44 11:15 45 11:45 50 60:00 3 18:50 31
Averages 11:53 45 19:48 43 15:46 48 36:29 21 30:34 30
Segments that were shown as ">60:00" in the traffic report were rounded off to 60:00 for calculation purposes. Source: Draft TRAFFIC OPERATIONS REPORT FOR THE I‐80/ I‐680/SR 12 INTERCHANGE PROJECT REPORT. June 2009
Average Network Travel Times and Speeds
Existing 2015 No Build 2015 Build C1 2035 No Build 2035 Build C1
Existing 2015 No Build
Segment
Segment2015 Build C1 2035 Build C12035 No Build

Appendix E
Congestion Relief
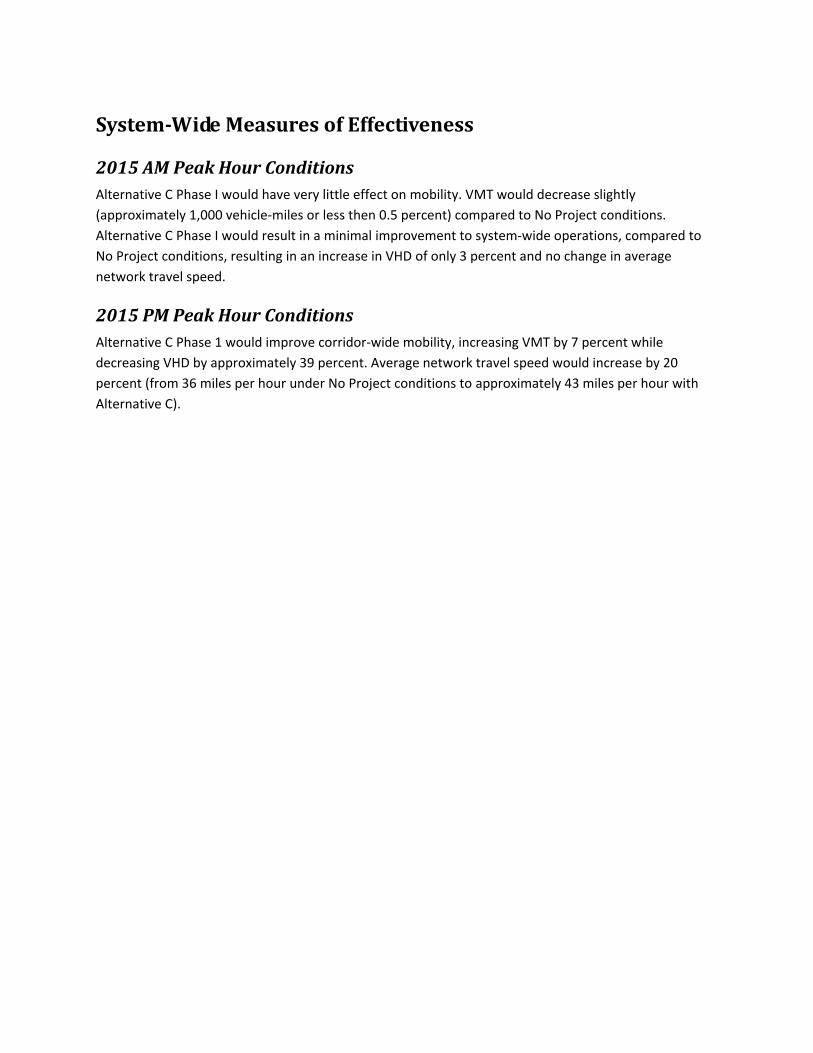
SystemWide Measures of Effectiveness
2015 AM Peak Hour Conditions Alternative C Phase I would have very little effect on mobility. VMT would decrease slightly (approximately 1,000 vehicle‐miles or less then 0.5 percent) compared to No Project conditions. Alternative C Phase I would result in a minimal improvement to system‐wide operations, compared to No Project conditions, resulting in an increase in VHD of only 3 percent and no change in average network travel speed.
2015 PM Peak Hour Conditions Alternative C Phase 1 would improve corridor‐wide mobility, increasing VMT by 7 percent while decreasing VHD by approximately 39 percent. Average network travel speed would increase by 20 percent (from 36 miles per hour under No Project conditions to approximately 43 miles per hour with Alternative C).

Draft Traffic Operations Report
Interstate 80 / Interstate 680 / State Route 12 Interchange Project Report February 2009
65
TABLE 6-1 2015 PHASE 1 AM PEAK HOUR
SYSTEM WIDE MEASURES OF EFFECTIVENESS1
MOE Existing No Project Alternative B2
Phase 1 Alternative C2
Phase 1
Vehicle Miles of Travel (Vehicle Miles / Hour)
316,220 449,870 451,325 (< 1%) 448,800 (< 1%)
Vehicle Hours of Delay
(Hours of Delay / Hour)
1,140 1,075 840 (- 22%) 1,105 (+ 3%)
Average Network Travel Speed
46 mph 51.2 mph 52.6 mph (+ 3%) 51.0 mph (< 1%)
1. The study area extends on I-80 from west of Red Top Road to east of Air Base Parkway / Waterman and on I-680 south of Gold Hill Road to I-80. The study area also includes SR 12 east of Pennsylvania Road and west of Red Top Road and all local arterials within the project study area.
2. (%) indicates change relative to the No Project condition
Source: Fehr & Peers, February 2009.
TABLE 6-2 2015 PHASE 1 PM PEAK HOUR
SYSTEM WIDE MEASURES OF EFFECTIVENESS1
MOE Existing No Project Alternative B2
Phase 1 Alternative C2
Phase 1
Vehicle Miles of Travel (Vehicle Miles / Hour)
334,755 480,410 531,935 (+ 11%) 516,055 (+ 7%)
Vehicle Hours of Delay
(Hours of Delay / Hour)
1,885 5,100 2,150 (- 58%) 3,110 (- 39%)
Average Network Travel Speed
33 mph 36.2 mph 47.6 mph (+ 32%) 43.3 mph (+ 20%)
1. The study area extends on I-80 from west of Red Top Road to east of Air Base Parkway / Waterman and on I-680 south of Gold Hill Road to I-80. The study area also includes SR 12 east of Pennsylvania Road and west of Red Top Road and all local arterials within the project study area.
2. (%) indicates change relative to the No Project condition
Source: Fehr & Peers, February 2009.

CONSTRUCTION YEAR 2015 - PEAK HOUR CONDITIONS SYSTEM WIDE MEASURES OF EFFECTIVENESS1
MOE Route No Project Alt. C, Phase 1
2015 AM Peak Hour 2015 PM Peak Hour 2015 AM Peak Hour 2015 PM Peak Hour
Bottleneck locations
• Bottleneck WB on I‐80 between truck scales and Suisun Valley Road.
• Bottleneck WB and EB on SR 12 East at the Beck Avenue and Pennsylvania Avenue signalized intersections.
• Major bottleneck EB on SR 12 East at the Beck Avenue and Pennsylvania Avenue signalized intersections; impacts EB I‐ 80 and NB I‐680.
• Bottleneck on WB I‐80 at Suisun Valley Road
Bottleneck WB and EB on SR 12 East at the Beck Avenue and Pennsylvania Avenue signalized intersections.
Major bottleneck EB on SR 12 East Pennsylvania Avenue signalized intersection; impacts EB I‐80 and NB I‐680.
Duration of congestion
Congestion would decrease to near existing conditions, lasting approximately 1.5 hours.
Congestion would significantly increase compared to existing conditions, lasting beyond 3 hours
Congestion would decrease to near existing conditions, lasting approximately 1.5 hours.
Congestion would decrease to near existing conditions, lasting approximately 2 hours.
Queue lengths WB SR 12 East from Beck Avenue to east of Main Street (2+ miles).
EB SR 12 East from Pennsylvania Avenue intersection to NB I‐680 (south of Gold Hill Road), 7+ miles, and EB I‐80 (Green Valley Road onramp), 4.5 miles.
WB SR 12 East from Beck Avenue to east of Main Street (2+ miles).
EB SR 12 East from Pennsylvania Avenue intersection to NB I‐680 connector ramp and EB I‐ 80 (I‐680 merge), 5 miles.
Travel times WB I‐80 to SB I‐680 6:40 34:00 9:55 13:05 WB I‐80 8:30 11:45 8:25 10:40 SR‐12 East to WB I‐80 15:35 11:55 14:25 11:00 Maximum Individual delay WB I‐80 to SB I‐680 25 seconds 26 minutes 40 seconds 5 minutes WB I‐80 30 seconds 4 minutes 25 seconds 3 minutes SR‐12 East to WB I‐80 7 minutes 4 minutes 6 minutes 3 minutes Speed WB I‐80 to SB I‐680 62 mph 17 mph 62 mph 49 mph WB I‐80 63 mph 45 mph 60 mph 50 mph SR‐12 East to WB I‐80 35 mph 43 mph 34 mph 48 mph Flows (volume) WB I‐80 to SB I‐680 3,305 2,168 3,378 4,327 WB I‐80 5,466 7,272 5,227 7,937 SR‐12 East to WB I‐80 2,202 1,548 2,532 1,334 1 The study area extends on I‐80 from west of Red Top Road to east of Air Base Parkway / Waterman and on I‐680 south of Gold Hill Road to I‐80. The study area also includes SR 12 east of Pennsylvania Road and west of Red Top Road and all local arterials within the project study area.
Source: Fehr & Peers 2009

2035 AM Peak Hour Conditions Alternative C Phase I would improve corridor‐wide mobility by increasing VMT approximately 1 percent, while decreasing VHD by 18 percent. Average network travel speeds would increase 6 percent (from 42 mph under No Project conditions to approximately 44 mph).
2035 PM Peak Hour Conditions Alternative C Phase I would improve corridor‐wide mobility by increasing VMT by 16 percent, while decreasing VHD by 16 percent. Average network travel speed would increase 25 percent (from 16 mph to 20 mph).

Draft Traffic Operations Report
Interstate 80 / Interstate 680 / State Route 12 Interchange Project Report February 2009
98
TABLE 7-1 2035 PHASE 1 AM PEAK HOUR
SYSTEM WIDE MEASURES OF EFFECTIVENESS1
MOE Existing No Project Alternative B2
Phase 1 Alternative C2
Phase 1
Vehicle Miles of Travel (Vehicle Miles / Hour)
316,220 539,445 564,605 (+ 5%) 546,624 (+ 1%)
Vehicle Hours of Delay
(Hours of Delay / Hour)
1,140 3,695 1,845 (- 100%) 3,021 (- 18%)
Average Network Travel Speed
46 mph 41.8 mph 48.9 mph (+ 17%) 44.2 mph (+ 6%)
1. The study area extends on I-80 from west of Red Top Road to east of Air Base Parkway / Waterman and on I-680 south of Gold Hill Road to I-80. The study area also includes SR 12 east of Pennsylvania Road and west of Red Top Road and all local arterials within the project study area.
2. (%) indicates change relative to the No Project condition
Source: Fehr & Peers, February 2009.
TABLE 7-2 2035 PHASE 1 PM PEAK HOUR
SYSTEM WIDE MEASURES OF EFFECTIVENESS1
MOE Existing No Project Alternative B2
Phase 1 Alternative C2
Phase 1
Vehicle Miles of Travel (Vehicle Miles / Hour)
334,755 413,160 575,815 (+ 39%) 480,410 (+ 16%)
Vehicle Hours of Delay
(Hours of Delay / Hour)
1,885 19,065 10,155 (- 47%) 16,095 (- 16%)
Average Network Travel Speed
33 mph 15.9 mph 28.9 mph (+ 82%) 19.8 mph (+ 25%)
1. The study area extends on I-80 from west of Red Top Road to east of Air Base Parkway / Waterman and on I-680 south of Gold Hill Road to I-80. The study area also includes SR 12 east of Pennsylvania Road and west of Red Top Road and all local arterials within the project study area.
2. (%) indicates change relative to the No Project condition
Source: Fehr & Peers, February 2009.

CONSTRUCTION YEAR 2035 - PEAK HOUR CONDITIONS SYSTEM WIDE MEASURES OF EFFECTIVENESS1
MOE Route No Project Alt. C, Phase 1
2035 AM Peak Hour 2035 PM Peak Hour 2035 AM Peak Hour 2035 PM Peak Hour
Bottleneck locations
• Bottleneck WB on I‐80 between truck scales and Suisun Valley Road.
• Bottleneck WB and EB on SR 12 East at the Beck Avenue and Pennsylvania Avenue signalized intersections.
• Bottleneck WB on SR 12 west at the Red Top Road signalized intersection; impacts I‐80 WB.
• Major bottleneck EB on SR 12 East at the Beck Avenue and Pennsylvania Avenue signalized intersections; impacts EB I‐80 and NB I‐680.
• Breakdown of I‐80 / Suisun Valley Road and SR 12 East / Chadbourne Road interchanges; impacts WB I‐80 and WB SR 12 East.
Bottleneck WB and EB on SR 12 East at the Beck Avenue and Pennsylvania Avenue signalized intersections.
• Major bottleneck EB on SR 12 East Pennsylvania Avenue signalized intersection; impacts EB I‐80 and NB I‐ 680.
• Bottleneck on SR 12 East / Chadbourne Road interchanges; impacts WB I‐80 and WB SR 12 East.
Duration of congestion
Congestion would significantly increase compared to existing conditions, lasting approximately 3 hours.
Congestion would significantly increase compared to existing conditions, lasting beyond 6 hours
Congestion would significantly increase compared to existing conditions, lasting approximately 2.5 hours
Congestion would significantly increase compared to existing conditions, lasting beyond 5 hours
Queue lengths
• WB I‐80 from Suisun Valley Road to SR 12 East (almost 2 miles).
• WB SR 12 East from Beck Avenue to east of Main Street (2+ miles).
• EB SR 12 East from Pennsylvania Avenue to Beck Avenue (1 mile).
• WB SR 12 West from Red Top Road to I‐ 80 east of I‐680 on‐ramp (1 mile).
• EB SR 12 East from Pennsylvania Avenue intersection to NB I‐680 (south of Gold Hill Road), 7+ miles, EB I‐80 (west of Red Top Road), 9+ miles, and EB SR 12 West (west of Red Top Road), 9+ miles.
• WB I‐80 from Suisun Valley Road back beyond Air Base Parkway (7+ miles).
• WB SR 12 East from Beck Avenue to east of Main Street (2+ miles).
• EB SR 12 East from Pennsylvania Avenue to Chadbourne Road (2 miles).
• EB SR 12 East from Pennsylvania Avenue intersection to NB I‐680 (south of Gold Hill Road), 7+ miles, EB I‐80 (west of Red Top Road), 9+ miles, and EB SR 12 West (west of Red Top Road), 9+ miles
• WB I‐80 from Suisun Valley Road to Abernathy Road (3 miles).
Travel times WB I‐80 to SB I‐680 11:15 48:15 8:45 Greater than 60:00
WB I‐80 10:00 16:50 10:25 21:30
SR‐12 East to WB I‐80 19:50 22:05 14:25 Greater than 60:00
Maximum Individual delay WB I‐80 to SB I‐680 2 minutes 40 minutes None More than 52 minutes
WB I‐80 2 minutes 9 minutes 2 minutes 13 minutes
SR‐12 East to WB I‐80 12 minutes 14 minutes 6 minutes More than 52 minutes
Speed WB I‐80 to SB I‐680 53 mph 12 mph 62 mph 8 mph
WB I‐80 54 mph 31 mph 60 mph 25 mph
SR‐12 East to WB I‐80 26 mph 19 mph 34 mph 8 mph
Flows (volume) WB I‐80 to SB I‐680 3,699 746 3,929 1,549
WB I‐80 6,121 5,411 6,074 6,422
SR‐12 East to WB I‐80 2,139 234 2,466 342 1 The study area extends on I‐80 from west of Red Top Road to east of Air Base Parkway / Waterman and on I‐680 south of Gold Hill Road to I‐80. The study area also includes SR 12 east of Pennsylvania Road and west of Red Top Road and all local arterials within the project study area.
Source: Fehr & Peers 2009

System Operations and Travel Speeds
2015 AM Peak Hour Travel Times During the AM peak hour, Alternative C Phase I would result in minimal improvement to travel times in the peak westbound direction, with increases or decreases of less than 30 seconds compared to No Project conditions. It should be noted that one travel time route (WB I‐80 to WB SR 12 West) would increase by more than ten percent. This is due to the relocation of Red Top Road 1,500 feet west of the current intersection location, and thus a slightly longer travel path. Travel times from westbound SR 12 East to westbound I‐80 and southbound I‐680 would decrease slightly by seven and five percent, respectively, because of the improvements to freeway flows in the right two lanes on westbound I‐80 west of the SR 12 East connector.
2015 AM Freeway Operations Construction of Alternative C Phase I would improve AM peak hour operations by adding capacity to westbound I‐80, but would not alleviate either the Beck Avenue or Pennsylvania Avenue intersection bottlenecks on westbound SR 12 East. The combination of added capacity on I‐80 westbound, and continuation of the bottlenect on westbound SR 12 East, would result in a reduction in congestion on westbound I‐80.
Alternative C Phase I would also improve SR 12 West, including replacing the at‐grade intersection at Red Top Road with a grade separated interchange approximately 1,500 feet west of the current location. This would reduce congestion and queuing on SR 12 West and reduce the queue spillback to I‐80, which would improve operations on westbound I‐80 approaching the SR 12 west connector.
All the freeway mainline and weaving sections within the project study area, except for those on westbound SR 12 East, would operate at LOS D conditions or better during the AM peak hour. Locations east of Beck Avenue on westbound SR 12 East would continue to experience LOS F conditions. Only three locations would operate over capacity (LOS F) as a result of the Beck Avenue and Pennsylvania Avenue intersection bottlenecks on westbound SR 12 East.
2015 PM Peak Hour Travel Times The benefits of constructing Alternative C Phase I during the PM peak hour include travel time savings in the peak eastbound direction ranging from 0 to 60 percent. The travel time savings would result in travel times comparable to, or even better than, existing travel times. Those travel time routes that would be better than existing conditions include those starting on northbound I‐680. In the westbound direction, Alternative C Phase I would result in reductions for most travel times; two travel times that would increase slightly are the two that end on westbound SR 12 West. The increased travel time would be due to the relocation of interchanges (the current at‐grade intersection at Red Top Road on SR 12 West would be replaced with a grade separated interchange located approximately 1,500 feet west of the existing intersection location), which would result in longer travel distances.

2015 PM Freeway Operations With construction of Alternative C Phase I, the queuing on westbound I‐80 would be eliminated and vehicles would travel at free flow speeds. The bottleneck on eastbound SR 12 East, however, would continue to result in congestion spilling back onto eastbound I‐80. The addition of the third lane on eastbound SR 12 East would increase the queuing capacity and throughput on SR 12 East, but would only slightly improve the amount of traffic served at the Beck Avenue and Pennsylvania Avenue intersections. The queue from SR 12 East would continue to spill back to the connector ramp from northbound I‐680, which is comparable to the extent of the queue under No Project conditions. This queue would also cause congestion along Abernathy Road and other local streets, as vehicles would not be able to enter I‐80 and SR 12 East heading eastbound.
The bottleneck on SR 12 East would constrain the amount of traffic exiting the project on eastbound I‐80 and thus the freeway downstream of SR 12 East would operate at LOS D or better, as with No Project conditions. The number of vehicles served would improve slightly with Alternative C Phase I (55 to 70 percent of the demand), as compared to No Project conditions.
With Alternative C Phase I, westbound SR 12 East would continue to experience congestion and queuing as far back as Jackson Street, as with No Project conditions, due to the at‐grade intersections. With construction of Alternative C Phase I, two freeway segments within the project study area would operate at capacity (LOS E), but would not cause queue spillback into adjacent locations. Those locations are as follows:
• NB I‐680, off‐ramp to Gold Hill Road
• NB I‐680, on‐ramp from Gold Hill Road
2035 AM Peak Hour Travel Times Constructing of Alternative C Phase I during the AM peak hour would result in travel time savings in the peak westbound direction of 5 to 20 percent compared to No Project conditions. In the eastbound direction travel times would be similar to No Project conditions, increasing by 30 seconds or less. The increase in travel time to eastbound SR 12 East is due to an increase in demand served, and therefore more vehicles arriving at the bottleneck, while the increase in travel times to I‐80 eastbound is due to the lengthening of some travel time paths due to the location of new interchanges.
2035 AM Freeway Operations Construction of Alternative C Phase I would improve operations by adding capacity to westbound I‐80, but would not alleviate either the Beck Avenue or Pennsylvania Avenue intersection bottlenecks on westbound SR 12 East. The improvements, however, would reduce congestion and queuing on westbound I‐80 on several segments, including between the SR 12 East connector and the I‐680 and SR 12 West connectors.

Alternative C Phase I would also improve SR 12 West, including replacing the at‐grade intersection at Red Top Road/North Connector with a grade separated interchange approximately 1,500 feet west of the current location. This would reduce congestion and queuing on SR 12 West and reduce the queue spillback to I‐80, which would improve operations on westbound I‐80 approaching the SR 12 west connector.
All the freeway mainline and weaving sections within the project study, except for those on westbound SR 12 East, would operate at LOS E conditions or better during the AM peak hour. Locations east of Pennsylvania Avenue on westbound SR 12 East would continue to experience LOS F conditions. Only three locations would operate over capacity (LOS F) as a result of the Beck Avenue and Pennsylvania Avenue intersection bottlenecks on westbound SR 12 East.
With construction of Alternative C Phase I, eight freeway segments within the project study area would operate at capacity (LOS E), but would not cause queue spillback into adjacent locations. Those locations are as follows:
• WB I‐80, mainline between Waterman Boulevard/Air Base Parkway and Travis Boulevard
• WB I‐80, weave between Travis Boulevard Loop and Oliver Road
• WB I‐80, mainline between SR 12 East Connector and Truck Scales
• WB I‐80, weave between Truck Scales and Suisun Valley Road
• NB I‐680, off‐ramp to Gold Hill Road
• NB I‐680, on‐ramp from Gold Hill Road
• NB I‐680, off‐ramp to Red Top Road
• SB I‐680, on‐ramp from Gold Hill Road
2035 PM Peak Hour Travel Times During the PM peak hour, Alternative C Phase I would result in a worsening of travel times in the peak eastbound direction of up to 200 percent. Some of the increase in the eastbound direction is due to an increase in travel distances because of new ramp locations. However, most of the increase is due to the two lane drops between I‐680 and the Suisun Valley Road overcrossing, the short distance between the SR 12 West and I‐680 on‐ramps, and the heavy demand for the right‐most lanes on I‐80. In the westbound direction, travel time savings would approach 70 percent compared to No Project conditions.
2035 PM Freeway Operations With construction of Alternative C Phase I, the length of the queue on westbound I‐80 that starts at the weave between the Truck Scales and Suisun Valley Road would significantly reduce from beyond the

project study area east of Air Base Parkway to Abernathy Road. The severity of the congestion on westbound I‐80 would also reduce significantly and the volume served would increase from 48 to 82 percent (a 70 percent increase) as compared to the No Project condition. The queue spillback from I‐80 to westbound SR 12 East queue would also be reduced significantly.
The bottleneck on eastbound SR 12 East would continue to result in severe congestion spilling back to eastbound I‐80. The addition of the third lane on eastbound SR 12 East would increase the queuing capacity of SR 12 East and would slightly increase the amount of traffic served at the Beck Avenue and Pennsylvania Avenue intersections. However, the queue from SR 12 East would still spill as far back as in the No Project case, to beyond the project study area on eastbound I‐80, northbound I‐680 and eastbound SR 12 West. This queue would also cause congestion t adjacent ramp terminal intersections, as vehicles would not be able to enter I‐80 and SR 12 East. Most local streets would also become congested due to queue spillback from the freeway and due to motorists diverting to alternative routes.
The bottlenecks on eastbound SR 12 East would continue to constrain the amount of traffic exiting the project on eastbound I‐80 and thus the freeway downstream of SR 12 East would operate at LOS D or better, as with No Project conditions.