quality 4.0 impact and strategy handbook · 2017-11-28 · getting digitally connected to transform...
TRANSCRIPT

Getting Digitally Connected to Transform Quality Management
QUALITY 4.0 IMPACT AND STRATEGY HANDBOOK
lnsresearch.com
CONNECT:

QUALITY 4.0 IMPACT AND STRATEGY HANDBOOKGetting Digitally Connected to Transform Quality Management
lnsresearch.com
TABLE OF CONTENTS
SECTION 1: Executive Summary . . . . . . . . . . . . . . . . . . . . . . . . . . . . . . . . . . . . . . . . . . . . . . . . . . . . . . . . . . . . . . . . . . . . . . . . . . . . . 3
SECTION 2: Defining Quality 4.0 . . . . . . . . . . . . . . . . . . . . . . . . . . . . . . . . . . . . . . . . . . . . . . . . . . . . . . . . . . . . . . . . . . . . . . . . . . . . . 7
SECTION 3: Understanding the 11 Axes of Quality 4.0 . . . . . . . . . . . . . . . . . . . . . . . . . . . . . . . . . . . . . . . . . . . . . . . . . . . . . . 11
SECTION 4: Summary and Recommendations . . . . . . . . . . . . . . . . . . . . . . . . . . . . . . . . . . . . . . . . . . . . . . . . . . . . . . . . . . . . . . 26
ACRONYMQUICK REFERENCE
VIEW ON BLOG

SECTION 1
Executive Summary

4
QUAL
ITY
4.0
IMPA
CTAN
D ST
RATE
GY H
ANDB
OOK
SECTION
TABLE OF CONTENTS
PAGE
1 23 4
Executive Summary
The most recent decade has seen rapid advances in connectivity, mo-
bility, analytics, scalability, and data, spawning what has been called
the fourth industrial revolution, or Industry 4.0. This fourth industrial
revolution has digitalized operations and resulted in transformations
in manufacturing efficiency, supply chain performance, product in-
novation, and in some cases enabled entirely new business models.
This transformation should be top of mind for quality leaders, as
quality improvement and monitoring are among the top use cases
for Industry 4.0. Quality 4.0 is closely aligning quality management
with Industry 4.0 to enable enterprise efficiencies, performance, in-
novation and business models. However, much of the market isn’t
focusing on Quality 4.0, since many quality teams are still trying to
solve yesterday’s problems: inefficiency caused by fragmented sys-
tems, manual metrics calculations, quality teams independently per-
forming quality work with minimal cross-functional ownership, and
ineffective supplier communication, among others.
Remote monitoring
Energy efficiency
Asset reliability
Quality improvement
Production visibility
Internet enabled products
Business model transformation, e.g. selling capacity
Asset and material tracking
Traceability and serialization
Customer access to information
Improving safety
Supplier visibility
Improving environmental performance
0% 5% 10% 15% 20% 25% 30% 35%
29%25%
24%
23%23%
22%19%
19%17%
15%12%
6%
5%
What are the top IIoT use cases your company is pursuing today? (N=252, all respondents)
0% 5% 10% 15% 20% 25% 30%
26%23%
22%
21%21%
20%19%
18%18%
15%12%
8%
5%
What are the top IIoT use cases your company will start pursuing in the next year? (N=249, all respondents)
Remote monitoring
Asset reliability
Business model transformation, e.g. selling capacity
Asset and material tracking
Quality monitoring
Customer access to information
Production visibility
Energy efficiency
Internet enabled products
Traceability and serialization
Supplier visibility
Improving safety
Improving environmental performance
5
QUAL
ITY
4.0
IMPA
CTAN
D ST
RATE
GY H
ANDB
OOK
SECTION
TABLE OF CONTENTS
PAGE
1 23 4
Executive Summary (Cont.)
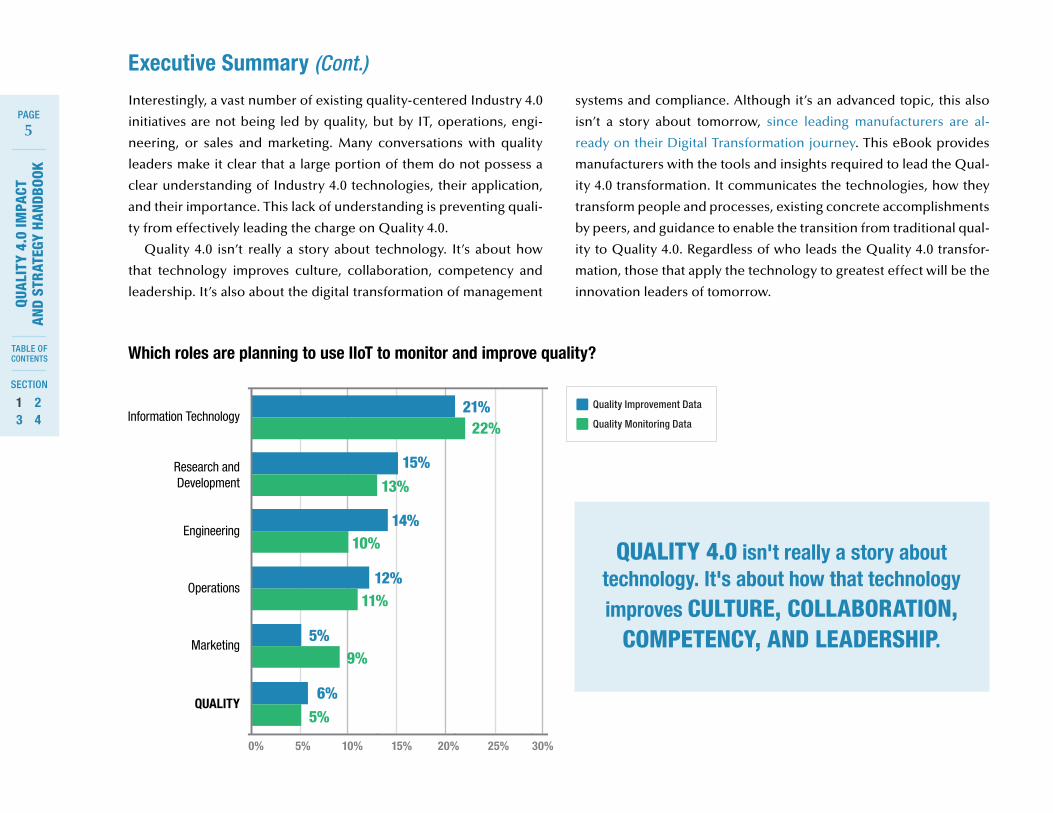
Interestingly, a vast number of existing quality-centered Industry 4.0
initiatives are not being led by quality, but by IT, operations, engi-
neering, or sales and marketing. Many conversations with quality
leaders make it clear that a large portion of them do not possess a
clear understanding of Industry 4.0 technologies, their application,
and their importance. This lack of understanding is preventing quali-
ty from effectively leading the charge on Quality 4.0.
Quality 4.0 isn’t really a story about technology. It’s about how
that technology improves culture, collaboration, competency and
leadership. It’s also about the digital transformation of management
systems and compliance. Although it’s an advanced topic, this also
isn’t a story about tomorrow, since leading manufacturers are al-
ready on their Digital Transformation journey. This eBook provides
manufacturers with the tools and insights required to lead the Qual-
ity 4.0 transformation. It communicates the technologies, how they
transform people and processes, existing concrete accomplishments
by peers, and guidance to enable the transition from traditional qual-
ity to Quality 4.0. Regardless of who leads the Quality 4.0 transfor-
mation, those that apply the technology to greatest effect will be the
innovation leaders of tomorrow.
0% 5% 10% 15% 20% 25% 30%
21%
15%
14%
12%
5%
5%6%
22%
13%
10%
11%
9%
Which roles are planning to use IIoT to monitor and improve quality?
Information Technology
Research and Development
Engineering
Operations
Marketing
QUALITY
Quality Improvement Data
Quality Monitoring Data
QUALITY 4.0 isn't really a story about technology. It's about how that technology improves CULTURE, COLLABORATION,
COMPETENCY, AND LEADERSHIP.

6
QUAL
ITY
4.0
IMPA
CTAN
D ST
RATE
GY H
ANDB
OOK
SECTION
TABLE OF CONTENTS
PAGE
1 23 4
Why Quality 4.0?
Quality 4.0 is a reference to Industry 4.0. The First (real) Industrial
Revolution embodied three revolutionary changes: machine manufac-
turing, steam power and the move to city living for people who had
previously been agriculturalists. During the Second Industrial Revolu-
tion, the production line and mass manufacturing drastically reduced
the cost of consumer and industrial products. The Third Industrial
Revolution was barely a revolution as electronics and control systems
gradually penetrated manufacturing, allowing greater flexibility and
more sophisticated products at a significantly lower cost. The Fourth
Industrial Revolution is happening around us right now. It extends the
digital impact of the third revolution and merges it with the physical
and natural worlds. Several critical technology changes have enabled
this, including advances in data, analytics, connectivity, scalability, and
collaboration. As the fourth revolution takes hold, it will impact every-
thing that we do. It connects people, machines and data in new ways,
it democratizes technologies that were previously only accessible to
the specialized few, and ushers in transformative capabilities such as
those in material science and 3D Printing. For quality, these technol-
ogies are important because they enable transformation of culture,
leadership, collaboration, and compliance. Quality 4.0 is truly not
about technology, but the users of that technology, and the processes
they use to maximize value.
FROM INDUSTRY 1.0 TO INDUSTRY 4.0
1800 1900 2000 Today
FIRSTIndustrial Revolution
Through the introduction of mechanical production facilities with the help of water and steam power
SECONDIndustrial Revolution
Through the introduction of a division of labor and mass production with the help of electrical energy
THIRDIndustrial Revolution
Through the use of electronic and IT systems that further automate production
FOURTHIndustrial Revolution
Through the use of cyber-physical systems
First mechanical loom, 1784 First assembly line, Cincinnati slaughter houses, 1870
First programmable logic controller (PLC), Modicon 084, 1969
DEGREE OF COMPLEXITY
© DFKI, 2011

SECTION 2
Defining Quality 4.0

8
QUAL
ITY
4.0
IMPA
CTAN
D ST
RATE
GY H
ANDB
OOK
SECTION
TABLE OF CONTENTS
PAGE
1 23 4
MAN
AGEM
ENT SYSTEM
PROC
ESS
TECHNO
LOG
YPEOPLE
DATA
CONN
ECTIVITYSCALABILITY
COMPETENCYLEADERSHIP
CULT
URE
COM
PLIA
NCE
APP DEVELOPMENT
COLLABORATION
ANALYTICS
What is Quality 4.0?
Quality 4.0 certainly includes the digitalization of quality
management. More importantly it is the impact of that
digitalization on quality technology, processes and
people. LNS has identified 11 axes of Quality
4.0, which companies can use to educate,
plan, and act. Using this framework and re-
search, leaders identify how Quality 4.0
can transform existing capabilities and
initiatives. The framework also pro-
vides a perspective on traditional
quality. Quality 4.0 doesn’t replace
traditional quality methods, but
rather builds and improves upon
them. Manufacturers should use
the framework to interpret their
current state and identify what
changes are needed to move to
the future state.
QUALITY 4.0
TRADITIONALQUALITY

9
QUAL
ITY
4.0
IMPA
CTAN
D ST
RATE
GY H
ANDB
OOK
SECTION
TABLE OF CONTENTS
PAGE
1 23 4
USE CASE 1: Managing Recipe Variation
Let’s bring the framework to life with some examples. Brewing beer
is a touchy process that must balance the relationships between
live cultures, bacteria, time, ambient and equipment temperatures,
ingredients, equipment, elevation, and much more. The inherent
variation can cause quality issues.
One of the largest craft brewers in the US recently implement-
ed machine learning (ML), artificial intelligence (AI) and historical
process data to solve a batching problem that was causing a major
quality issue and the loss of entire batches.
The brewmasters thought the problem was the relationship be-
tween pressure and temperature; instead it was an issue with the tim-
ing of batch processes determined by natural variances in yeast. They
used ML/AI to build a model to alter the recipe and optimize batches
on previously unknown relationships. By establishing a new process,
the brewer eliminated lost batches associated with this quality issue
and recaptured two weeks of extra capacity per lost batch.
Mash 1000 lb. pale 2-row malt with flaked and honey malts at 152° F for one hour.
Drain, rinse grains, and dissolve 50 lb. pale malt extract syrup into resulting wort.
Top off with reverse osmosis or distilled water to desired boil volume and proceed as above.
1000 lb. pale malt
250 lb. honey oats
40 lb. honey malt
40 oz. hop pellets 8%
150 oz. Citra hop pellets 12%
Original Pale Ale
INGREDIENTS FOR 1000 GALLONS
DIRECTIONS
FAVORITE SAVE PRINT
200 oz. Amarillo hop pellets
200 oz. Citra hop pelletsdry hop after FG
Mash 3 lb. pale 2-row malt with flaked and honey malts at 152° F for one hour. Drain, rinse grains, and dissolve 5 lb. pale malt extract syrup into resulting wort. Top off with reverse osmosis or distilled water to desired boil volume and proceed as above.
Original Pale Ale10 lbs. pale malt2.5 lb
half pound Malt1 ounce.half-ounce hops 8%
hop pellets
honey oats
2 lb mashed maltdry hop after FG
TAKEAWAY:The brewmasters applied Quality 4.0 analytics to traditional data and processes to drive quality improvement and new competencies.

10
QUAL
ITY
4.0
IMPA
CTAN
D ST
RATE
GY H
ANDB
OOK
SECTION
TABLE OF CONTENTS
PAGE
1 23 4
USE CASE 2: Supplier Quality Management
Supplier quality management (SQM) is a leading roadblock to achiev-
ing quality objectives. Suppliers continue to grow in importance as
their percentage of end products grows, and quality teams have been
working diligently to adopt mature SQM processes and technology.
One large contract manufacturer has a Digital Transformation
strategy that encompasses manufacturing and it has deployed Cloud,
big data and ML/AI to improve tracking of machine performance. Us-
ing the new approaches, the manufacturer can predict and remedy
machine downtime and product quality issues before they happen.
As a result, the company increased up yield and reduced manufac-
turing cycle time.
The company also expanded this approach to the supply chain to
analyze data in its existing enterprise SQM technology and manufac-
turing execution systems with ML/AI. The ML/AI analyzes incoming
inspection data, and in some cases data from final testing performed
at supplier facilities. The contract manufacturer can now identify is-
sues with their suppliers’ manufacturing processes before suppliers
do, which enhances non-conforming material process and impacts
supplier risk profiles.
TAKEAWAY:Quality 4.0 is a journey; there’s value in a common data model and analytics, and Quality 4.0 has an impact on management system processes and culture.

SECTION 3
Understanding the 11 Axes of Quality 4.0

12
QUAL
ITY
4.0
IMPA
CTAN
D ST
RATE
GY H
ANDB
OOK
SECTION
TABLE OF CONTENTS
PAGE
1 23 4
Data
Data-driven decisions have been at the heart of quality improve-
ments for decades. Many recently updated standards re-emphasize
the importance of evidence-based decision making. However, indus-
try has a long way to go. As shown in the chart, much of the market
continues to struggle with evidence while more mature companies
have mastered traditional data and are now leveraging big data.
Let's break down what data is and how to think about it. Data has
five important elements to consider:
VOLUME: Traditional systems have a large quantity of transac-
tional records (e.g. corrective and preventive action (CAPA),
quality events, etc.). However, the volume of data from con-
nected devices is many orders greater, requiring special ap-
proaches such as data lakes.
VARIETY: Systems gather three types of data: structured, un-
structured, and semi-structured. Structured data is highly or-
ganized (CAPAs, quality events). Unstructured data is unorga-
nized (e.g. semantics data, data from sensors and connected
devices). Semi-structured data is unstructured and has had
structure applied to it (e.g. metadata tags).
VELOCITY: This is the rate at
which a company gathers data.
CAPAs are low velocity, while
statistical process control (SPC)
data is high velocity, and a glob-
al fleet of connected devices
streaming data is even higher
velocity.
VERACITY: This refers to data
accuracy. Quality system data is often low veracity due to frag-
mented systems and lack of automation.
TRANSPARENCY: Consider for a moment the ease of access-
ing and working with data no matter where it resides or what
application created it. Leaders should work to develop a com-
mon data model to combine structured business system data
like inventory transactions and financial transactions with
structured operational system data like alarms, process pa-
rameters, and quality
events, with unstruc-
tured internal and
external data like
customer, supplier,
Web, and machine
data to provide high
veracity and trans-
parency.
Real time visibility of quality metrics in...
Customer service
Supplier performance
Engineering
Manufacturing
Across all four areas
Median adoption by innovation leaders All others
Volu
me
(low
to h
igh)
Velo
city
(low
to h
igh)
Vera
city
(low
to h
igh)
Tran
spar
ency
(lo
w to
hig
h)
Vari
ety
(low
to h
igh)
Stru
ctur
ed
Sem
i-St
ruct
ured
Un-s
truc
ture
d
TRADITIONAL DATA
BIG DATA
TRA
DITI
ONA
L QU
ALI
TYQU
ALI
TY 4
.0
In God we trust; all others bring data. —W. Edwards Deming
43%
19%
17%
9%
22%
83%
69%
55%
52%
65%

13
QUAL
ITY
4.0
IMPA
CTAN
D ST
RATE
GY H
ANDB
OOK
SECTION
TABLE OF CONTENTS
PAGE
1 23 4
Analytics
Analytics unlock the insights captured within data. Today, analytics
are often a stumbling block for quality – 37% of the market identifies
poor metrics as a top roadblock to accomplishing quality objectives.
As shown earlier, there is insufficient adoption of real-time metrics
by most of the market.
Analytics fall into four categories, maturing from left to right. De-
scriptive are the most traditional metrics to monitor known or sus-
pected correlations. Quality generates descriptive metrics (number
of open quality events), diagnostic metrics (quality process cycle
times to identify bottlenecks), and predictive metrics such as trend
analysis (application of trend rules to SPC data).
Companies can apply Big Data analytics, or ML/AI to traditional
data or Big Data to determine correlations based on patterns in the
data, which result in new insights. These insights are often much
more specific than traditional analytics, such as predicting the failure
of each specific machine. ML can identify, diagnose, and eventually
predict a pattern that will result in a negative outcome such as prod-
uct or process failure. Prescriptive analytics are more advanced; they
predict failure and specify what should be done to address or change
the outcome, and usually include some level of autonomous behav-
ior. Descriptive, Diagnostic and Predictive analytics are performed in
traditional quality with traditional data, but new insights are realized
with ML/AI. Prescriptive analytics are exclusively in the ML/AI domain.
Visualization has evolved right along with data, and enables more
effective human interpretation. Traditional visualizations include re-
ports, charts, and dashboards, where big data visualizations include
mashup apps, which will be discussed in detail later.
Companies striving toward Quality 4.0 should build their analytics
strategy after or concurrently with a data strategy. Powerful analytics
applied to low veracity data yields poor veracity insights.
ANALYTICS FRAMEWORK
DESCRIPTIVE DIAGNOSTIC PREDICTIVE PRESCRIPTIVE
What happened
What willhappen
What actionto take
Why it happened
37%37%of companies say POOR
METRICS is a top roadblock to accomplishing
quality objectives.

14
QUAL
ITY
4.0
IMPA
CTAN
D ST
RATE
GY H
ANDB
OOK
SECTION
TABLE OF CONTENTS
PAGE
1 23 4
Connectivity
Broadly stated, “connectivity” is the connection between business
information technology (IT) and operational technology (OT), where
business technology includes the enterprise quality management sys-
tem (EQMS), enterprise resource planning (ERP), and product lifecy-
cle management (PLM), and OT is the technology used in laborato-
ry, manufacturing, and service. Industry 4.0 transforms connectivity
through a proliferation of inexpensive connected sensors that provide
near real-time feedback from connected people,
products and edge devices, and processes.
• Connected people can leverage personal smart
devices or intelligent wearable devices that
sense workers. Connected worker initiatives
typically have goals of increased efficiency
and safety.
• Connected products can provide feedback on
their performance across their lifecycle. They
can communicate use conditions, perfor-
mance, and failure to perform.
• Connected edge devices efficiently connect
sensed equipment. This approach helps to
avoid overburdening central OT systems by
streaming large volume of sensor data. In this
way, edge devices often perform analytics at
the device, make predictive/prescriptive deci-
sions (shut this machine down, and come for
repair), and decide which data to send to cen-
tral OT systems.
MAN
AGE,
PLA
N, A
ND IM
PROV
E
OT: Operations Management and Quality Execution
IT: Quality Management
IT/OT CONVERGENCE EXPLAINED WITH ISA-95
VALUE CHAIN Discovery Development Supply Chain ManufacturingIn-lab Test / Clinical Trials
Service / Support
L3
L2
OPERATIONSMANAGEMENT
DECISIONS: Minutes/Hours
AUTOMATION
L4 BUSINESSOPERATIONS
DECISIONS: Days/Weeks
EXECUTE, INFORM, AND IM
PROVE
Quality Management System
Non-Conformance
Results and Statistics
Execution Processes
Execution Systems
Connected and Edge Devices
Quality Processes
Critical Attributes / Parameters
Quality Plan
Work Instructions
DECISIONS: Sub-Seconds
Shared Process and Data Masteryin TRADITIONAL QUALITY
CONNECTEDPROCESSES
Shared Process and Data Masteryin TRADITIONAL QUALITY
CONNECTEDPROCESSES
• Connected processes provide feedback from connected people,
products, and equipment into processes. Important applications
of these concepts include Connected Products, Connected Lab-
oratories, Connected Supply Chain, Connected Operations, and
the Connected Worker.
15
QUAL
ITY
4.0
IMPA
CTAN
D ST
RATE
GY H
ANDB
OOK
SECTION
TABLE OF CONTENTS
PAGE
1 23 4
Connectivity (Cont.)
How does a leader leverage this information to maximum effect? Qual-
ity Management often sits in the IT domain, while Quality Execution
is in the OT domain. The market has struggled to build an effective
bridge between management and execution due to a divide between
IT and OT. This gap results in challenges during design transfer and
continuous improvement. Leaders should ensure that data, processes,
and people work together to enable effective, data-driven, and bidi-
rectional communication across the IT/OT divide.
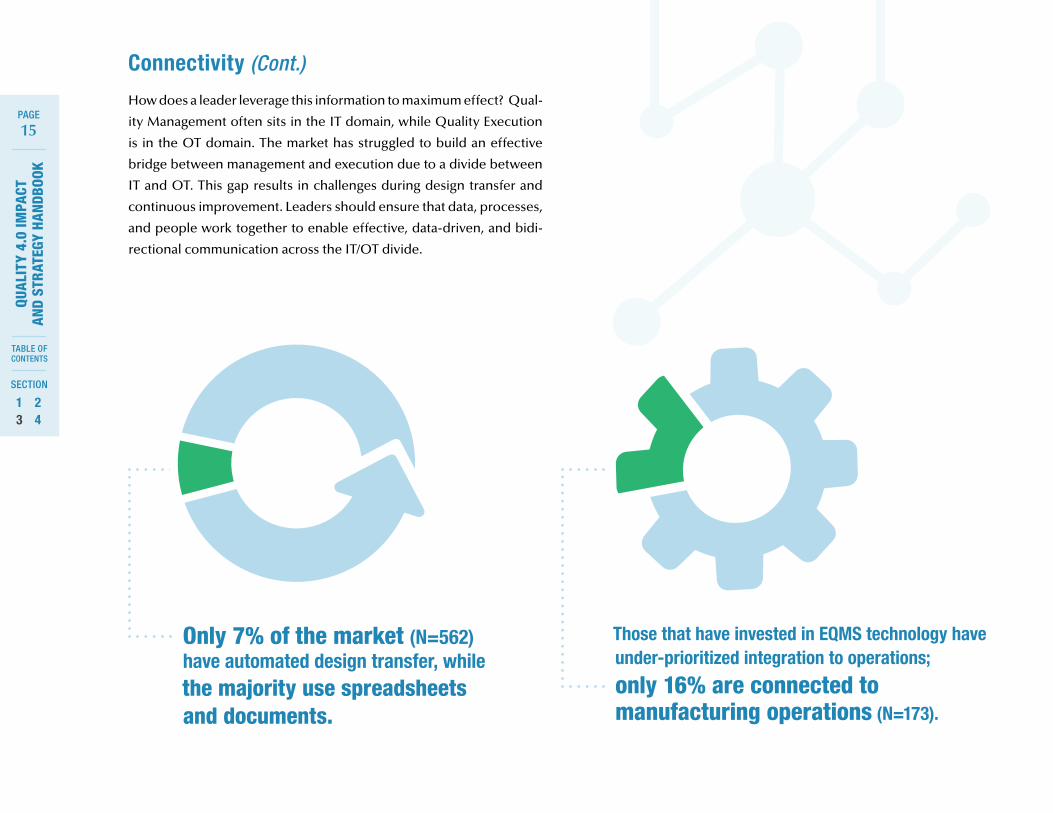
Only 7% of the market (N=562) have automated design transfer, while the majority use spreadsheets and documents.
Those that have invested in EQMS technology have under-prioritized integration to operations;
only 16% are connected to manufacturing operations (N=173).
16
QUAL
ITY
4.0
IMPA
CTAN
D ST
RATE
GY H
ANDB
OOK
SECTION
TABLE OF CONTENTS
PAGE
1 23 4
Collaboration
Collaboration is critical for quality management, as quality is by
nature cross-functional and global. Companies execute traditional
quality business processes with the help of digital messaging (email),
automated workflows, and portals. Much of the market has yet to
take advantage of automated workflows and portals, and in fact, only
21% have adopted a core EQMS.
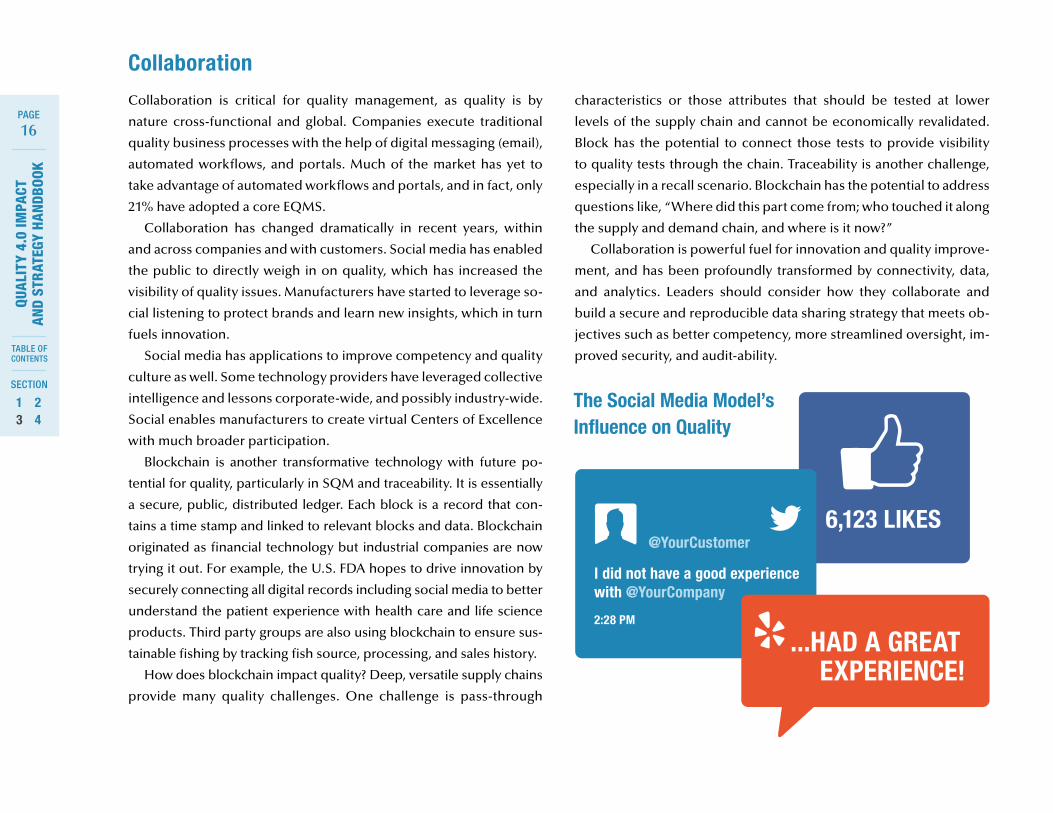
Collaboration has changed dramatically in recent years, within
and across companies and with customers. Social media has enabled
the public to directly weigh in on quality, which has increased the
visibility of quality issues. Manufacturers have started to leverage so-
cial listening to protect brands and learn new insights, which in turn
fuels innovation.
Social media has applications to improve competency and quality
culture as well. Some technology providers have leveraged collective
intelligence and lessons corporate-wide, and possibly industry-wide.
Social enables manufacturers to create virtual Centers of Excellence
with much broader participation.
Blockchain is another transformative technology with future po-
tential for quality, particularly in SQM and traceability. It is essentially
a secure, public, distributed ledger. Each block is a record that con-
tains a time stamp and linked to relevant blocks and data. Blockchain
originated as financial technology but industrial companies are now
trying it out. For example, the U.S. FDA hopes to drive innovation by
securely connecting all digital records including social media to better
understand the patient experience with health care and life science
products. Third party groups are also using blockchain to ensure sus-
tainable fishing by tracking fish source, processing, and sales history.
How does blockchain impact quality? Deep, versatile supply chains
provide many quality challenges. One challenge is pass-through
characteristics or those attributes that should be tested at lower
levels of the supply chain and cannot be economically revalidated.
Block has the potential to connect those tests to provide visibility
to quality tests through the chain. Traceability is another challenge,
especially in a recall scenario. Blockchain has the potential to address
questions like, “Where did this part come from; who touched it along
the supply and demand chain, and where is it now?”
Collaboration is powerful fuel for innovation and quality improve-
ment, and has been profoundly transformed by connectivity, data,
and analytics. Leaders should consider how they collaborate and
build a secure and reproducible data sharing strategy that meets ob-
jectives such as better competency, more streamlined oversight, im-
proved security, and audit-ability.
The Social Media Model’s Influence on Quality

17
QUAL
ITY
4.0
IMPA
CTAN
D ST
RATE
GY H
ANDB
OOK
SECTION
TABLE OF CONTENTS
PAGE
1 23 4
App Development
App development is something everyone can relate to – there are
apps for everything. Apps are the mechanisms through which com-
panies fulfill processes, collect and expose data, visualize analytics,
and establish collaboration.
Traditional quality apps are most commonly web-based, and near-
ly all of them have been optimized for mobile, although it usually re-
quires a large mobile device such as a tablet. As software has become
more powerful, the trend has been to develop role-based apps for a
better, simpler experience through multiple interfaces divided by role.
Technology providers are increasingly providing native mobile
apps downloadable on Android, iOS, and possibly other platforms,
to provide a higher quality experience that works on smartphones.
Mobile app platforms extend this still further by allowing companies
to create and publish apps themselves. Mobility provides greater
accessibility, participation, adoption, and efficiency. While we often
connect the idea of mobile apps with smartphones and other mobile
devices, companies can write apps for a wide array of hardware.
MOBILITY AND INTERACTIVE APPS FUEL QUALITY MANAGEMENT
WEARABLES are devices that sense and connect human perfor-mance. Widely used by consumers (e.g. Fitbit™), wearables also are applied in industrial settings to improve safety and efficiency.
AUGMENTED REALITY (AR) is an overlay of virtual content on physical assets or surroundings. This has many applications in op-erations, allowing workers to “see” machines earmarked as pre-dicted to fail soon and how to fix them, or the same with product.
VIRTUAL REALITY (VR) simulates the real world and offers value for operations and management. It can be used to improve com-petency and reduce risk by simulating operations prior to exe-cuting in the physical world. Recently, companies have launched mashup apps that combine content (video, weather, text, sched-ules, etc.) from multiple sources into a single view and interface. This trend is important for quality, which touches all facets of management and operations, and will include data streams from multiple sources.

18
QUAL
ITY
4.0
IMPA
CTAN
D ST
RATE
GY H
ANDB
OOK
SECTION
TABLE OF CONTENTS
PAGE
1 23 4
App Development (Cont.)
Apps can be much more than a simple
web-based User Interface (UI) – they play
an important role in the delivery of intel-
ligence, participation, and adoption. As
apps advance in terms of presenting rel-
evant content to the user, where the user
is, and in context with the world around
him or her, they become increasingly
powerful enablers of collaboration, com-
petency, and efficiency.
Big Data Analytics, Collaboration, and Mash-Up Apps
Connectivity and Data Model
ANALYTICS & APPSANALYTICS & APPSANALYTICS & APPS
SUPPLIERS OPERATIONS CUSTOMERS & PRODUCTS
EDGE ANALYTICS AND APPLICATIONS
EDGE ANALYTICS AND APPLICATIONS
EDGE ANALYTICS AND APPLICATIONS
EDGE ANALYTICS AND APPLICATIONS
EDGE ANALYTICS AND APPLICATIONS
EDGE ANALYTICS AND APPLICATIONS
EDGE ANALYTICS AND APPLICATIONS
EDGE ANALYTICS AND APPLICATIONS
EDGE ANALYTICS AND APPLICATIONS

19
QUAL
ITY
4.0
IMPA
CTAN
D ST
RATE
GY H
ANDB
OOK
SECTION
TABLE OF CONTENTS
PAGE
1 23 4
Scalability
Scalability is the ability to support data volume, users, devices, and
analytics on a global scale. Without global scale, traditional qual-
ity and Quality 4.0 are much less effective, unable to harmonize
processes, best practices, competencies, and lessons learned cor-
porate-wide. Thirty-seven percent of companies struggle with frag-
mented data sources and systems as a top challenge in achieving
quality objectives. Cloud computing is an important contributor to
scalability. Through Cloud, manufacturers can acquire Software as
a Service (SaaS), easily adding capabilities and users, data, analyt-
ics, and devices without the need to acquire, install, and manage
the software on premise. Cloud also provides Infrastructure as a
Service (IaaS) by enabling globally accessible and high availabil-
ity (high uptime) solutions. Some providers deliver a Platform as
a Solution (PaaS), providing the
core software plus an extended
ecosystem of partners that all con-
nect to enrich the core software.
Data scalability is also import-
ant, particularly with connected
devices. Data lake technologies
have been developed to support
the voluminous data sets inherent
with connected devices and Big
Data
Vol
ume
Proc
esse
s
Anal
ytic
s
User
s
Devi
ces
Plat
form
TRADITIONAL, ON PREMISE
BIG DATA, CONNECTED, CLOUD
TRA
DITI
ONA
L QU
ALI
TYQU
ALI
TY 4
.0
Data. These non-traditional databases enable storage and correla-
tion across many disparate types of data.
Scalability is critical when industrializing solutions. Assess the cur-
rent scalability of in-house systems, and be sure to consider both
global reach and data complexity when deploying either traditional
quality or Quality 4.0.
37%of companies cite FRAGMENTED DATA SOURCES AND SYSTEMS
as a top challenge in achieving quality
objectives.
20
QUAL
ITY
4.0
IMPA
CTAN
D ST
RATE
GY H
ANDB
OOK
SECTION
TABLE OF CONTENTS
PAGE
1 23 4
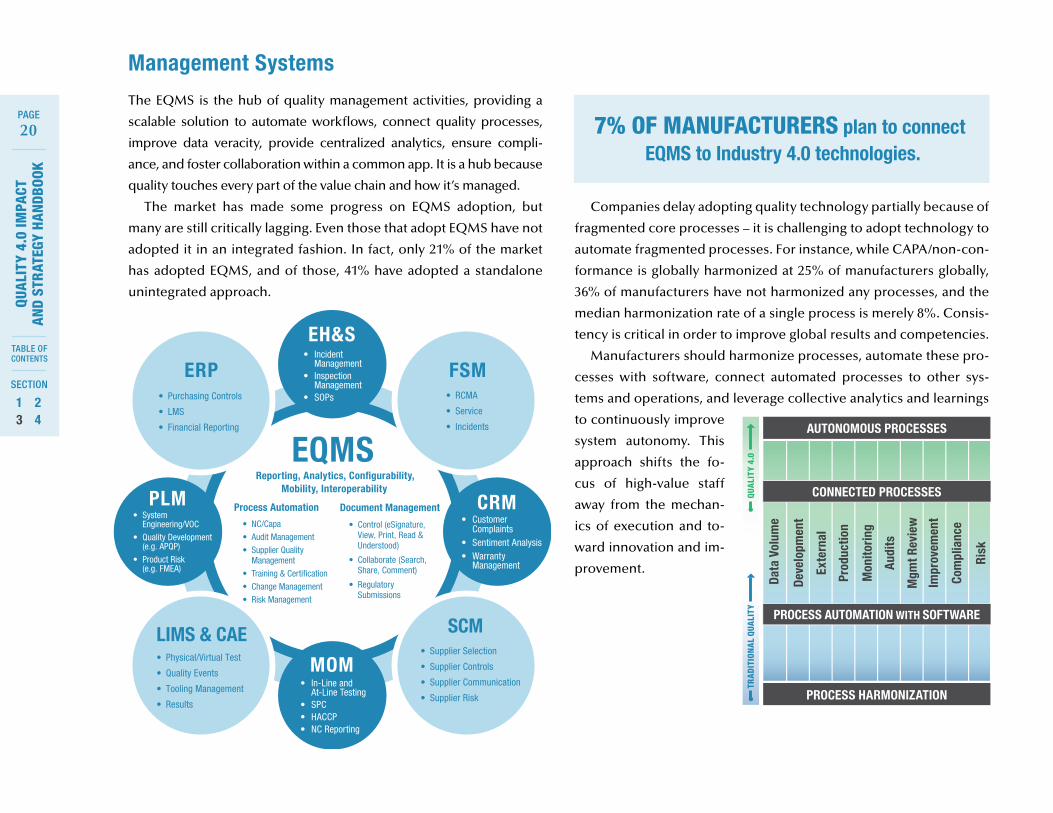
Management Systems
The EQMS is the hub of quality management activities, providing a
scalable solution to automate workflows, connect quality processes,
improve data veracity, provide centralized analytics, ensure compli-
ance, and foster collaboration within a common app. It is a hub because
quality touches every part of the value chain and how it’s managed.
The market has made some progress on EQMS adoption, but
many are still critically lagging. Even those that adopt EQMS have not
adopted it in an integrated fashion. In fact, only 21% of the market
has adopted EQMS, and of those, 41% have adopted a standalone
unintegrated approach.
Companies delay adopting quality technology partially because of
fragmented core processes – it is challenging to adopt technology to
automate fragmented processes. For instance, while CAPA/non-con-
formance is globally harmonized at 25% of manufacturers globally,
36% of manufacturers have not harmonized any processes, and the
median harmonization rate of a single process is merely 8%. Consis-
tency is critical in order to improve global results and competencies.
Manufacturers should harmonize processes, automate these pro-
cesses with software, connect automated processes to other sys-
tems and operations, and leverage collective analytics and learnings
to continuously improve
system autonomy. This
approach shifts the fo-
cus of high-value staff
away from the mechan-
ics of execution and to-
ward innovation and im-
provement.
• NC/Capa• Audit Management• Supplier Quality Management• Training & Certification• Change Management• Risk Management
• Control (eSignature, View, Print, Read & Understood)
• Collaborate (Search, Share, Comment)
• Regulatory Submissions
EQMSProcess Automation Document Management
Reporting, Analytics, Configurability, Mobility, Interoperability
MOM• In-Line and At-Line Testing• SPC• HACCP• NC Reporting
CRM• Customer Complaints• Sentiment Analysis• Warranty Management
PLM
EH&S• Incident Management• Inspection Management• SOPs
• System Engineering/VOC• Quality Development (e.g. APQP)• Product Risk (e.g. FMEA)
FSM• RCMA
• Service
• Incidents
ERP• Purchasing Controls
• LMS
• Financial Reporting
LIMS & CAE• Physical/Virtual Test
• Quality Events
• Tooling Management
• Results
SCM• Supplier Selection
• Supplier Controls
• Supplier Communication
• Supplier Risk
7% OF MANUFACTURERS plan to connect EQMS to Industry 4.0 technologies.
Data
Vol
ume
Deve
lopm
ent
Exte
rnal
Prod
uctio
n
Mon
itorin
g
Mgm
t Rev
iew
Impr
ovem
ent
Com
plia
nce
Risk
Audi
ts
PEOPLE
PROCESS HARMONIZATION
AUTONOMOUS PROCESSES
CONNECTED PROCESSES
PROCESS AUTOMATION WITH SOFTWARE
TRA
DITI
ONA
L QU
ALI
TYQU
ALI
TY 4
.0

21
QUAL
ITY
4.0
IMPA
CTAN
D ST
RATE
GY H
ANDB
OOK
SECTION
TABLE OF CONTENTS
PAGE
1 23 4
Compliance
Compliance activities include conforming to regulatory, industry,
customer, and internal requirements. Life science manufacturers
have a particularly heavy compliance burden. However, compliance
is important to quality teams across industry since quality often takes
a lead role in ensuring that processes, products, and services con-
form with requirements. Manufacturers already leverage technology
to reduce the cost and effort to comply. Technology to aid in com-
pliance has evolved by platform and process area. Early compliance
technology required substantial custom code to address require-
ments. While compliant, custom code was difficult to upgrade and
revalidate. This has often resulted in "version lock", a scenario where
companies postpone upgrades by many years to avoid the cost and
effort of migrating and revalidating code and data.
Technology providers have worked to improve flexibility and re-
duce the cost and effort associated with initial deployments and
future upgrades. The first step in the market was to greatly expand
configurability, and therefore nearly eliminate the need to custom-
ize. More recently, technology providers invested in building robust
pre-configurations to common processes (CAPA, eight disciplines
(8D), non-conformance, etc.). These now require much less configu-
ration to deploy, improving time to value. Pre-configuration scope
continues to expand. Technology providers have tools to automate
life science validation and reduce the effort required to execute
performance qualification (PQ).
Quality 4.0 introduces even more opportunities to automate com-
pliance. Social collaboration provides a mechanism to share success-
ful and failed approaches to compliance across groups, sites, and
regions. Analytics can be used to alert organizations to potential
compliance breaches or act to prevent the breaches. Integrated IT/
OT data models and/or collaboration technologies like blockchain
can provide a data-driven approach that automates audit-ability.
Today’s technology plays an important role in compliance manage-
ment, reducing compliance burden and risk, which will continue to
expand with the proliferation of Quality
4.0. Manufacturers should re-assess their
current compliance strategy and identify
improvement opportunities.
Top Strategic Objective for Quality Management40%
35%
30%
25%
20%
15%
10%
5%
0%Reduce the total cost of quality
Better manage operational risks
Improve customer experience
Preserve brand equity
Reduce non- conformances in manufacturing
Improve design for quality
Ensure compliance
Improve performance of
suppliers
All
Life Sciences
30%
23%
14% 14%
7% 5% 5%2%
22%
13% 12%8%
4%6%
1%
36%
PEOPLE
EDM
Com
plia
nt B
PM
Elec
tron
ic S
ubm
issi
on
Com
plia
nce
Serv
ices
CUSTOM
CONNECTED
AUTOMATED
PRECONFIGURED
CONFIGURABLE
TRA
DITI
ONA
L QU
ALI
TYQU
ALI
TY 4
.0

22
QUAL
ITY
4.0
IMPA
CTAN
D ST
RATE
GY H
ANDB
OOK
SECTION
TABLE OF CONTENTS
PAGE
1 23 4
Culture
Many leaders have an initiative to develop a culture of quality, since
quality often owns process execution with insufficient participation
and ownership from other functions. A company that has "a culture
of quality" exhibits four key elements: process participation, respon-
sibility, credibility, and empowerment. Traditionally, companies set
goals for cross-functional process participation, cross-functional
responsibility for quality, credibility for quality and its work across
functions, and cross-functional empowerment. Empowerment is
competency to perform quality plus ownership of quality success.
This is quite difficult to accomplish in traditional settings, in part due
to regulatory burden, poor metrics and metric visibility, fragmented
data systems and sources, and fragmented processes. Quality can
seem like a labyrinth to outsiders; more like a policing engine than a
vehicle for improvement and performance. Only 13% of cross-func-
tional teams clearly understand how quality contributes to strate-
gic success. Quality 4.0 makes a
culture of quality more attainable
through better connectivity, visibili-
ty, insights, and collaboration. Con-
nected data, processes, analytics,
apps, etc., improve the culture of
quality through shared/connected
information, insights, and collab-
oration. Quality 4.0 makes quality
processes and outcomes more visi-
ble, connected, and relevant.
36% OF COMPANIES cite a lack of culture of quality
as a top challenge to achieve quality objectives.
ONLY 13% of cross-functional teams clearly understand how quality
contributes to strategic success.
Proc
ess
Part
icip
atio
n
Resp
onsi
bilit
y
Cred
ibili
ty
Cros
s-fu
nctio
nal E
mpo
wer
men
t
CROSS-FUNCTIONAL
CONNECTED
TRA
DITI
ONA
L QU
ALI
TYQU
ALI
TY 4
.0

23
QUAL
ITY
4.0
IMPA
CTAN
D ST
RATE
GY H
ANDB
OOK
SECTION
TABLE OF CONTENTS
PAGE
1 23 4
Leadership
The quality function has an image and credibility gap with the rest of
the organization. In part, this is because quality is seen as a depart-
ment, as the quality police, and as a group with unclear alignment to
corporate success. Conversely, leaders in many other functions are
planning to use Industry 4.0 technologies to drive quality improve-
ment. Quality improvement is clearly interesting to many, and qual-
ity is often a corporate value, but the work that the quality function
does isn’t clearly connected to quality improvement or the corporate
value by other functions and top management.
This gap starts with objectives. The quality team must realign its ob-
jectives and initiatives so that they clearly link to strategic objectives.
Objectives guide which initiatives receive attention and resources,
and initiatives drive actions. An organization with compliance-relat-
ed objectives and initiatives will prioritize compliance-related prac-
tices, whereas an organization with performance initiatives will pri-
oritize performance-related practices. By resetting objectives, the
quality team repositions its value proposition to other functions and
top management. In fact, performance-based quality can have a sub-
stantial impact on R&D, manufacturing, service, and finance.
Quality ownership should shift from quality-only to cross-func-
tional to executive. Quality leaders should lead quality across the
organization, with increasingly broad ownership by cross-functional
ONLY 13% of companies say QUALITY IS A PRIORITY FOR TOP MANAGEMENT.
ONLY 37% say that QUALITY IS CRITICAL FOR CUSTOMER SATISFACTION.
ONLY 26% say that THE QUALITY FUNCTION HAS A CLEAR AND COMPELLING ROLE in delivering
corporate strategy.

24
QUAL
ITY
4.0
IMPA
CTAN
D ST
RATE
GY H
ANDB
OOK
SECTION
TABLE OF CONTENTS
PAGE
1 23 4
Leadership (Cont.)
executives and top management to broaden the focus on quality and
enable effective corporate-wide quality. KPIs play an important role
in this effort.
Quality 4.0 has already drawn interest from cross-functional lead-
ers. As mentioned previously, leaders outside quality see the poten-
tial of Quality 4.0’s to improve quality, and they are building initia-
tives around improving quality with 4.0 technology. In many ways,
this is a positive shift and one that quality leadership should support,
reinforce, and lead, to improve outcomes.
Best practice Best practice
Manufacturers with Compliance Objectives Manufacturers with Performance Objectives
Increased likelihood of adoption
Increased likelihood of adoption
33%
21%
21%
20%
18%
164%
126%
77%
42%
40%
Automated Risk Management with software
Supplier quality data collected automaticallythrough web-based portal
Automated Chance Management with software
Automated Compliance Management with software
Automated Employee Training with software
Automated Quality Product Realization processes with software
Automated Statistical Process Control (SPC) with software
Automated Supplier Quality Managementwith software
Real-time visibility of quality metrics in manufacturing
Real-time visibility of quality metrics in supplier performance
Obje
ctiv
e Al
ignm
ent
Exec
utiv
e Ow
ners
hip
Qual
ity K
PI
DEPARTMENTAL
CONNECTED
EXECUTIVE
CROSS-FUNCTIONAL
TRA
DITI
ONA
L QU
ALI
TYQU
ALI
TY 4
.0
PEOPLE

25
QUAL
ITY
4.0
IMPA
CTAN
D ST
RATE
GY H
ANDB
OOK
SECTION
TABLE OF CONTENTS
PAGE
1 23 4
Competency
Competence is an individual’s ability to complete a task effectively
and efficiently. Organizations have battled to improve the baseline
competency of personnel, and to scale specialized knowledge. The
least mature organizations rely on individuals to share knowledge
among themselves.
Many have deployed structured approaches, which include Learn-
ing Management Systems to train competencies, assess competency
through certification and Training Management, scale experience
through centralized groups such as centers of practice/centers of ex-
cellence, and develop expertise. Quality leaders looking to improve
upon the structured approach of traditional quality can use several
Quality 4.0 approaches:
EXPERIENCE: Leverage social media to share experiences and les-
sons learned across internal groups, or even across industry.
EXPERTISE: Develop new expertise through learnings from ML/
AI. Leverage mashup apps and AR/VR to improve the expertise of
workers.
APPRAISAL: Deploy connected worker strategies to sense worker
actions, ensuring compliance, competency, efficiency, and safety.
MANAGEMENT: Encapsulate these learnings in Learning Management
Systems, and provide VR experiences to improve training delivery.
Workers and their skills are critical to the success of business. In
fact, three of Deming’s 14 points directly relate to training (#6, #13, #14).
While competency may not be top of mind in Quality 4.0 initiatives, it
could be the most powerful improvement resulting from Quality 4.0.
50%50% 35%35% 8%8%
of companies say that EMPLOYEE TRAINING is one of the most critical process areas
in their enterprise.
of companies have AUTOMATED
TRAINING MANAGEMENT with software.
of companies have HARMONIZED
TRAINING MANAGEMENT across the company.
PEOPLE
Expe
rien
ces
Expe
rtis
e
Appr
aisa
l
Man
agem
ent
INDIVIDUAL
CONNECTED
STRUCTURED
TRA
DITI
ONA
L QU
ALI
TYQU
ALI
TY 4
.0

SECTION 4
Summary and Recommendations

27
QUAL
ITY
4.0
IMPA
CTAN
D ST
RATE
GY H
ANDB
OOK
SECTION
TABLE OF CONTENTS
PAGE
1 23 4
Manufacturers looking to improve quality should assess where
they stand on each of the 11 axes of Quality 4.0, and pri-
oritize investments. Given the state of the market, it
is likely that many companies will need to make
investments first in traditional quality, before
they can fully leverage Quality 4.0. There
are clearly interrelationships among the
axes, and adding new capabilities to
certain axes enables new applica-
tions on other axes.
PROC
ESS
AUTO
MAT
ION WITH SOFTWARE
MAN
AGEM
ENT SYSTEM
PROC
ESS
TECHNO
LOG
YPEOPLE
Quality Plans
Work InstructionsNon-ConformanceExecution AnalysisExecution Results
Execution Process
DescriptiveConnected
Products
ConnectedTesting
ConnectedSupply ChainConnectedOperationsConnectedWorker
Diagnostic
Predictive
Prescriptive
Visualization
Data Volume
Expe
rien
ces
Expe
rtis
e
Appr
aisa
l
Indi
vidu
al
ProcessesAnalyticsUsers
Devices
Platform
Workflow
Digital
Messaging
Secure
Portal
Volume (Low
to High)
Variety
Structured, Semi-Structured,
Unstructured
Veracity (Low to High)
Transparency (Low to High)
DATA
CONN
ECTIVITYSCALABILITY
COMPETENCYLEADERSHIP
CULT
URE
COM
PLIA
NCE
ANALYTICSTRADITIONAL
DATA
TRADITIONAL
ON-PREMISE
TRADITIONAL,
PROCESS
HARM
ONIZATION
Velocity (Low to High)
APP DEVELOPMENT
COLLABORATION
Mashup
Native Mobile
Browser
Agnostic
Web
Client
EDG
E DEVICES
Blockchain
Social Media
INDIVIDUAL
STRUCTURED
Obje
ctiv
e Al
ignm
ent
Exec
utive
Owne
rshi
p
Process Partic
ipation
EDM
Compliant BPM
ElectronicSubmission
ComplianceServices
Credibility
Responsibility
Cross-Functional Empowerment
Quality
KPI
EXECUTIVE
AUTO
MAT
ED
PREC
ONFI
GURE
D
CON
FIGU
RAB
LE
CROSS-
FUNCTIONAL
CROS
S-
FUNC
TION
AL
CUST
OM
MENTAL
Requirements
Development
External
Production
Monitoring
AuditsIm
provement
Compliance
Risk
Managem
ent Review
ANALYTICSCONNECTED
CONN
ECTE
D
CONN
ECTE
D
BIG DATA, CONNECTED, CLOUD
BIG DATA
CONNECTED
BIG DATA ANALYTICS
AUTO
NOMOUS PROCESSES
CONNEC
TE
D PROCESSES
QUALITY 4.0
TRADITIONALQUALITY
Quality 4.0: A Big Picture View

28
QUAL
ITY
4.0
IMPA
CTAN
D ST
RATE
GY H
ANDB
OOK
SECTION
TABLE OF CONTENTS
PAGE
1 23 4
Recommendations
Quality 4.0 is the digitalization of quality leveraging the technologies
of Quality 4.0. People and processes are important to all areas of
business but are particularly key to quality. Therefore, while Qual-
ity 4.0 makes critical new technologies affordable and accessible
to the broad market, its story is really about the application of
these technologies to solve long-standing quality challenges and
to re-optimize to provide novel solutions. Quality 4.0 is real, gain-
ing momentum, and a technological gift to quality. Quality leaders
should prioritize Quality 4.0 plans; those that stay on the sideline
are at risk of being marginalized.
1. Given the current state of the market, manufacturers should as-
sess quality maturity, and if necessary improve traditional qual-
ity capabilities to fully leverage Quality 4.0. Those that do will
differentiate themselves in performance, whereas those that do
not run the risk of being inundated with data or drawing erro-
neous conclusions based on poor data veracity.
2. Recognize the reality and powerful potential of Quality 4.0 on en-
terprise performance. Companies have already deployed Qual-
ity 4.0 analytics, apps, data, and connectivity strategies, and are
realizing benefits and achieving differentiation.
3. Many manufacturers already have a Digital Transformation strategy
and are already acting on it. Quality leaders should immedi-
ately determine if this strategy exists in their organization and
interpret the company’s approach using the information in this
ebook. The next step is to align quality objectives around those
strategies, and develop, communicate, and gain support for
supporting initiatives. Structure quality initiatives to improve
traditional quality and to deploy Quality 4.0.
© LNS Research, 2017. All Rights Reserved.
Author:Dan JacobPractice Director and Principal Analyst
Presented by:
Connect:
License to distribute this researchreport has been granted to:
ACRONYMQUICK REFERENCE
VIEW ON BLOG
SAS and all other SAS Institute Inc. product or service names are registered trademarks or trademarks of SAS Institute Inc. in the USA and other countries. ® indicates USA registration. Other brand and product names are trademarks of their respective companies. 109087_G60998.1017