quality and process control in pe and pp manufacturing
TRANSCRIPT

Quality and Process control in PE and PPManufacturingSeparation Solutions for Plants and QC Laboratories

Contents
6
AN OVERVIEW:
NEWLY DEVELOPED RESINS ARE MORE CHALLENGING TO CONTROL IN PRODUCTION PLANTS
15 CRSYTEX® QC
18
APPLICATION NOTE: SOLUBLE FRACTION FOR POLYPROPYLENE PRODUCTION PLANTS
25
CRYSTEX® 42
29GPC-QC
32
APPLICATION NOTE: GPC FOR PROCESS AND QUALITY CONTRON IN PE AND PP MANUFACTURING
39INTRINSIC VISCOSITY ANALYZER, IVA
42
APPLICATION NOTE: INTRINSIC VISCOSITY DETERMINATION FOR POLYMERIC MATERIALS
49UPCOMING INNOVATION: CEF QC

GPC-QC
Quality Control for Polyolefins
05
SEPARATION SOLUTIONS FORPLANTS AND QC LABORATORIES
This intrument shares the same analytical concept as
CRYSTEX® QC, but it uses a high-temperature autosampler
with 42 positions, ideal for a central laboratory, where large
batches of pelletized, more homogeneous samples need to
be analyzed in sequence (Page 25).
A simplified CEF for production plants to obtain the complete
chemical composition distribution curve for one sample in
less than 1h (incl. dissolution). The Density results facilitate
a direct correlation with traditional process controls. The
instrument can be operated as a CEF, TREF or TGIC (Page 49).
Simplified and fully-automated GPC instrument for control
laboratories in polyolefin production plants. Provides robust
and precise Molar Mass Distribution data for process
control, in a simplified and automated wrokflow, for one
sample at-a-time in 30 minutes (Page 29).
Fully-automated instrument for the Intrinsic Viscosity
analysis of all polymeric materials, even the very challenging
ones that can require temperatures of up to 200ºC for
dissolution. The autosampler allows up to 42 samples to be
sequentially analyzed without user intervention (Page 39).
Complete automation of the Soluble Fraction measurement
in polypropylene while quantifying the ethylene content
and intrinsic viscosity in the whole sample, and the soluble
and crystallyne fractions. Analysis of one sample at-a-time
in approximately 2.5 hours (Page 15).
IVA
CRYSTEX® QC
CRYSTEX® 42
CEF QC (upcoming)
AMORPHOUS FRACTION
CHEMICAL COMPOSITION DISTRIBUTION
MOLAR MASS DISTRIBUTION
INTRINSIC VISCOSITY

Quality Control for Polyolefins
An Overview 07
An OverviewI S Y O U R P O L Y O L E F I N R E S I N P E R F O R M I N G A S E X P E C T E D ?
The introduction of single-site catalysts and the use of multiple reactors in
the polyolefins industry has opened new routes to design resins with the
desirable microstructure to optimize performance in specific applications.
While this is good news for manufacturing, it presents a greater challenge
for quality control because the currently used parameters show only partial
information of the resin microstructure.
Melt Index (MI) and density are common parameters in process control
and product definition that represent average molar mass and average
composition respectively. However, with today’s sophisticated industrial
resins, these parameters are very far from defining resin performance. A set
of analytical techniques has been recently developed to detail additional
parameters relevant to the resin performance.
Will a competitor resin with the same Melt Index
and density perform equally? I am recycling
polyolefin resins. How can I optimize my product’s
performance? The resin I have used in the past is
now performing/processing differently. Why?
Within the Polyethylene (PE) family, the added
information is essential, especially in the case of
dual reactor resins, as with pipe and blow molding
products, or in the broad spectrum of linear low
density polyethylene (LLDPE) resins.
Figure 1 shows three different PE that, in spite of having
the same Melt Index, they have completely different
Molar Mass Distribution (MMD), and thus, completely
different performance and processing behavior.
This reveals that a separation technique such as Gel
Permeation-Size Exclusion Chromatography (GPC/SEC)
is needed to have unequivocal characterization of the
resin chemical structure. These techniques, which in the
past demanded operation expertise and sophisticated
equipment, are available today with simplified design
for quality control purposes (GPC-QC). A similar
situation is that of PE copolymers, such as the three
LLDPE resins shown in Figure 2. They all have the
same comonomer content, expressed with the density
parameter, but reveal completely different Chemical
Composition Distribution (CCD) and thus, different
performance and processing behavior. Once more,
this shows that a separation technique is demanded
to have unequivocal characterization; in this case,
using Temperature Rising Elution Fractionation (TREF),
Crystallization Analysis Fractionation (CRYSTAF) or
Crystallization Elution Fractionation (CEF).
Melt Index and density
have not changed, so
why is the “same” resin
performing differently?
Fig 1. Three different resins with the same Melt Index but completely different MWD and thus, different performance.
Fig 2. Three different PE resins with the same density but completely different CCD and thus, different performance.

Quality Control for Polyolefins
An Overview 09
Although MMD and CCD represent the most significant
microstructural information, on occasions, this data
alone is not enough due to the interdependence
of molar mass and composition. A good example
is that of Pipe resins, which contain small amounts
of comonomer but for good performance, the
comonomer (branching) is required to be incorporated
within the larger molecules. The analysis of branching
at different molar masses can be today obtained
in a quality control lab by a simplified but sensitive
GPC system with an additional IR composition sensor
(GPC-QC IR5).
Within the Polypropylene (PP) family, the most
demanding structure is that of heterophasic or High-
Impact Polypropylene (HIPP). The routine analysis
of the amorphous content (“xylene solubles”) is
important but the analysis of the ethylene content and
intrinsic viscosity in the two phases (crystalline and
amorphous) provides additional information that can
be critical to optimize the product’s performance. All
these parameters can now be obtained automatically
with the new CRYSTEX® instrumentation based on
a TREF (Temperature Rising Elution Fractionation)
separation process (CRYSTEX® QC and CRYSTEX® 42).
No Longer a Nice-to-have, Now a Must-have in
Production
The increasing throughput of the new polyolefin
manufacturing plants and the incorporation of
complex multiple reactor-catalyst processes demand
a closer control of the microstructure to prevent
product variation with significant losses in off-grade
production. The analysis of average properties such as
MI, density, and amorphous fractions by rheological or
spectroscopic techniques, although important in stable
process conditions, on many occasions is not enough.
The measurement of the distributions by separation
techniques such as GPC-QC or CRYSTEX® QC is
required. This is especially important during grade
changes, where reaching the desired microstructure in
the shortest possible time is crucial to reduce off-grade
production. Simplified separation techniques capable
of obtaining results in short time are essential.
Improving Performance
by Fully Revealing the
Resin Microstructure
The industry has also shown an increased interest and production of very high and Ultra High
Molar Mass (UHMW) resins in the last years. However, a full characterization of these resins is a
challenging task and demands method and materials adaptation to prevent precipitation of the
resin in the analytical process. The GPC-QC at low flow rate, has been developed to analyze the
MMD of very high molar mass resins, one at a time. Additionally, a dedicated Intrinsic Viscosity
Analyzer (IVA) was also designed to automatically analyze multiple samples of UHMW resins
through a capillary relative viscometer without memory effects or plugging.
Newly developed resins are increasingly challenging to control in production plants.

Soluble Fraction Crystalline Fraction Whole Sample%weight Ethylene % Int. Visc.* Ethylene % Int. Visc.* Ethylene % Int. Visc.*
Sample A 4.06 14.8 0.96 3.4 2.74 4.2 2.86
Sample B 2.73 16.3 0.90 3.9 2.33 4.4 2.30
Sample C 7.66 53.9 1.67 2.8 2.04 6.9 2.01
std 0.07 1.7 0.07 0.26 0.08 0.6 0.09
*Intrinsic Viscosity measured with TCB at 165
Quality Control for Polyolefins
An Overview 11
CRYSTEX® QC is a fully-automated instrument that
separates crystalline and amorphous fractions by
means of a proprietary Temperature Rising Elution
Fractionation (TREF) column where a small aliquot
of homogeneous polymer solution is crystallized, in
di- or tri-chlorobenzene (o-DCB / TCB), on a support
under reproducible and well-controlled conditions.
The polymer solution is loaded into the column at
elevated temperature; it is crystallized to near ambient
temperature with no flow and then solvent is moved
through the column to elute the amorphous soluble
material towards the online detectors. Finally, the
column temperature is increased again to re-dissolve
the crystalline material which is eventually eluted to
the detectors.
The analytical workflow is also very simple: all the
analyst is required to do is put an approximate amount
of sample in a disposable bottle, place it in the stirred-
heated plate, and lower a handle to pierce the bottle’s
septum with a needle (Figure 3). The automated
process proceeds under computer control, including
filling of the bottle with pre-heated solvent, controlling
the dissolution time, temperature and stirring and
taking an aliquot of the solution from the bottle into
the instrument column.
Unparalleled
Separation of the
Soluble Fraction in PP
Fig. 3 Safe and efficient operation of the single-sample dissolution station in GPC-QC and CRYSTEX® QC instruments: 1) Remove the previous bottle and place a new one with an approximate sample weight; 2) Manual Injection and press START.
The amorphous/crystalline fractions are quantified with a sensitive filter-type Infrared (IR) detector
that delivers equivalent values to the xylene solubles test, obtained with outstanding precision.
In addition, the IR detector measures the ethylene incorporation in the case of copolymers. The
integration of a capillary viscometer provides an automated measurement of intrinsic viscosity
of the whole sample and both amorphous and crystalline fractions.
Table 1 shows data obtained from seven replicate analyses using four grams of sample for a
set of three polypropylene products with average standard deviations shown for each type of
measurement. No additional experimental effort is required, since all the data is collected by
the IR and viscometer detectors during the automated analysis, with one equipment in a single
2-hour experiment.
Table 1. Analysis of amorphous/crystalline fractions of three PP products by CRYSTEX® QC.
The GPC-QC instrument is built with the same single-sample dissolution station described
above, and simplified hardware design including only one valve at high temperature, an external
HPLC pump and robust detectors, which help in achieving the required level of reliability and
minimizing potential downtime. The main detector is infrared, which provides a concentration
signal based on absorbance of total CH, being very appropriate for a QC environment thanks to
the fast stabilization time, stable baseline and good sensitivity. In addition, IR detection provides
complementary information on chemical composition (short-chain branching, comonomer
content) along the MMD.

dW
/dLo
g M
SCB
/100
0TC
0.50
9.0
8.0
7.0
6.0
5.0
4.0
3.0
2.0
1.0
0.0
10.0
0.40
0.30
0.20
0.10
0.00
100 1,000 10,000 100,000 1,000,000 10,000,000
0.932 g/cc
0.940 g/cc
MMD
SCB
Molar mass (g/mol)
Quality Control for Polyolefins
An Overview 13
The analytical workflow is quite simple and requires
minimum manual work. When a sample of polymer
is received in the laboratory, it is weighed into a
disposable bottle which is placed into the dissolution
station oven. Then the analyst lowers a handle to
insert the needle through the septum. The analysis is
started from the computer and proceeds automatically
according to the pre-set method conditions. Once the
analysis is finished, the chromatograms are processed
to generate the MMD and any calculated parameters
of interest. When a new sample comes in, a new
bottle is prepared with it and the analyst just discards
the previous one placing the new one in the station.
Following this workflow, the GPC-QC can be operated
continuously with a cycle time of one hour or less,
which is found appropriate for controlling the start-up
of reactors, or when a change of grade is conducted.
Once the process is stable, production may need to be
controlled at a slower pace, one or several times per
day.
An application example is provided in Figure 4 for a
bimodal high-density polyethylene made in a dual-
reactor process. A lower molar mass high-density
component is typically produced, together with a
second component of larger molar mass with a small
amount of added comonomer. That balance results
GPC for Quality Control
and Process Control in PE
and PP Manufacturing
Fig 4. MMD and short chain branching (SCB) frequency measured by GPC-QC for a bimodal HDPE. The density of each of the modes was calculated from an average of the SCB frequency in each molar mass range.
in enhanced mechanical properties, such as ESCR,
for pipe applications. From a single GPC-QC analysis,
and in less than one hour with minimum operator
intervention, it is possible to obtain an estimation on
the density being produced in each of the two reactors
(based on measured SCB level), as well as the molar
mass and the weight fraction of each component.
The level of control on the process is thus, greatly
enhanced over the alternative methods based on bulk
properties (MI and density).
Measuring Intrinsic
Viscosity for All
Polymeric Materials
References:
Automated Soluble fraction analysis in PP (CRYSTEX®
QC) – The Column (LC/GC), November 2013
Soluble fraction analysis in polypropylene for QC
(CRYSTEX® QC) LCGC – LCGC EU and NA The
Applications Notebook, December 2013
Gel Permeation Chromatography (GPC) for Process
Control and Quality Control – The Column (LC/GC),
September 2015
Solution Viscosity in Polymeric Materials by IVA –
Petro Industry News, April/May Issue 2015
The optimized dissolution and separation processes
open the door to high-temperature GPC analysis
within 30 minutes in most cases, including the sample
preparation step with an efficient dissolution process
under nitrogen atmosphere, and less than one hour
even for the most difficult products. This is a step
forward in this kind of technology and enables its
practical application in manufacturing plants as a
process control /quality control tool.
The Intrinsic Viscosity Analyzer, IVA, is a dedicated
instrument for determination of intrinsic viscosity of
polymeric materials, based on the same QC platform.
The relative viscosity of a dilute polymer solution with
reference to the pure solvent is measured by means of
a robust serial capillary viscometer. From it, the intrinsic
viscosity of the polymer can be calculated using a
single-point estimation method. Due to the popularity
of dilute solution viscosity measurements and the
availability of such methods in many laboratories, the
IV of polymers has been traditionally used to specify
and to control the production grades.
Different polymers in various solvents have been
analyzed in this system, including PAN (polyacrylonitrile)
in DMF (N,N-dimethylformamide), PET polyethylene
terephthalate) in phenol/o-DCB, PLA (polylactic acid)
in TCB as well as polypropylene and polyethylene
(even high and ultra-high molar mass) in TCB and
o-DCB. The intrinsic viscosity results obtained by the
IVA are in good agreement with reference methods
(ISO 1628-3:2010 f.i.) in all cases.

Quality Control for Polyolefins
15
Soluble Fraction for Polyolefin Production Plants
CRYSTEX® QC

CRYSTEX® QCKEY FEATURES
CRYSTEX® QC is a step forward in technology for automating the Soluble Fraction
determination in polypropylene and other polyolefin resins. This is a reliable instrument
for continuous operation in the manufacturing plant laboratory, with minimum bench
space and utilities requirements.
This is a modern alternative to the traditional wet chemistry method based on xylene
solubility, known for being very time consuming and for requiring constant manual
handling of solvent at high temperature. In comparison, CRYSTEX® QC is very easy to
operate and obtains the amorphous phase content in a shorter time. It also eliminates
the need to handle solvent manually and it operates with less flammable solvents than
Xylene (TCB or oDCB), increasing the safety level in the laboratory.
The only manual task required is to put a representative amount of sample (up to 4g)
in a disposable bottle, without the need of accurate weighing. The instrument then
automates the entire analysis process, including precise dosing of solvent, sample
dissolution, separation of the soluble fraction from the crystalline matrix, and analysis by
the online detectors. This whole process takes 2.5 hours.
The crystalline and amorphous fractions are separated through a crystallization and re-
dissolution temperature cycle within a proprietary TREF column. Precise quantification is
achieved by means of an infrared detector that also delivers ethylene content information.
Moreover, the instrument measures intrinsic viscosity by means of a built-in dual capillary
viscometer. All results (concentration, ethylene content and intrinsic viscosity) are obtained
for the whole sample, the amorphous fraction, and the crystalline fraction.
RELIABLE AND AUTOMATED INSTRUMENT FOR SOLUBLE FRACTION
DETERMINATION IN QUALITY CONTROL LABORATORIES OF
POLYPROPYLENE PLANTS
17
Fully-automated analysis of the soluble (amorphous fraction) in polypropylene and other polyolefins.
A sample can be analyzed every 2.5 hours (including dissolution) without manual operation.
No need for accurate weighing of sample or manual solvent handling. No external filtration or solvent evaporation required.
Additional measurement of ethylene content and intrinsic viscosity for the amorphous fraction, the crystalline fraction, and whole sample.
For Process/QC laboratories in production plants.
Compatible with other polyolefin materials such as LDPE, and adaptable to other solubility tests (heptane or hexane solubles).

CRYSTEX® QC APPLICATION NOTE
Soluble Fraction Analysis in Polypropylene:
Characterization of the whole polymer,
amorphous and crystalline fractions in a Quality
Control Laboratory
Introduction
The analysis of the amorphous fraction in polypropylene
resins is considered a fundamental task in the production
of polypropylene; it provides a measurement of the
small amounts of undesirable low tacticity and low
molar mass fractions in the homopolymer resins, which
have significant influence on the polymer properties
and processing. The presence of amorphous fraction
is required for certain applications, as in the case of
high-impact polypropylene copolymer resins. The
incorporation of the amorphous material is usually done
within the same production plant in a second stage of
the polymerization process by adding ethylene to the
continuous reaction, which results in the formation of
amorphous ethylene-propylene copolymer.
The continuous measurement of the overall amount
of this rubbery fraction, which can range between 0
and 30% of the total polymer, is essential for plant
control in order to obtain the desired specifications
and performance of the polymer resin. In addition
to the measurement of the total rubber percentage
(soluble fraction), the analysis of its molar mass and
ethylene content are of major importance in this type
of manufacturing process.
Historically, the amorphous or soluble content has
been measured by solubility in xylene using manual wet
chemistry methods, as described in the next section,
which demand significant manpower, solvent volume,
and analysis time. Later on, it was shown that the
amorphous content in polypropylene can be measured
by crystallization (1) and a method was prepared based
on the Crystallization Analysis Fractionation (CRYSTAF)
technique (2-4).
A new approach has now been developed to analyze
polypropylene samples, one at a time, in Quality Control
plant laboratories. CRYSTEX® QC consists on a fully
automated system based on a proprietary Temperature
Rising Elution Fractionation (TREF) column where
a small aliquot of homogeneous polymer solution
is crystallized on a support under reproducible and
well-controlled conditions. The amorphous fraction
is measured with a highly sensitive filter-type Infrared
(IR) detector delivering equivalent values to the xylene
solubles measurement, obtained with outstanding
precision.
CRYSTEX® QCAPPLICATION NOTE
Quality Control for Polyolefins
19
In addition to measuring the amorphous or soluble
fraction percentage, CRYSTEX® QC quantifies the
ethylene incorporation and intrinsic viscosity in the
original sample and in both, the amorphous and
crystalline fractions. Total analysis time per sample is
approximately two hours.
Natta and coworkers (5) were among the first
to understand the importance of separating the
polypropylene produced according to stereo regularity.
In those years (1950s) fractionation was only accessible
by extraction, using a Soxhlet apparatus with solvents
of different boiling points. The atactic polymer was
obtained by the extraction in boiling ether, the stereo
block fraction corresponded to the material which
was insoluble in boiling ether but soluble in boiling
heptane, and the isotactic fraction was what remained
insoluble in those solvents. Most importantly in these
extraction procedures was the determination of the
amorphous atactic fraction, although reproducibility
was not as good as desired.
A few years later (1960s), a new approach was
proposed by P.M. Kamath, L. Wild (6) and others,
by fully dissolving the sample in a good solvent and
allowing it to precipitate according to its crystallizability.
Carrying out the test in this manner and establishing
the equilibrium in the opposite direction provided a
significant advantage over the extraction procedure:
The amorphous fraction did not have to migrate from
the interior of the solid material to the surface, which
could be influenced by the size of the particles and
the molecular structure of the matrix. Solvent selection
was not so important in this procedure, and from a
variety of solvents, xylene was chosen due to the ease
of filtration of the crystallized polymer and ease of
drying. This procedure, which they named Fractional
Crystallization, resulted in a significant improvement
in reproducibility over the extraction method and it
showed that separation was barely affected by molar
mass or by the initial concentration in a rather broad
range.
The Fractional Crystallization approach finally evolved
into the current standard procedures (7-8) which can
be summarized as follows:
“The polypropylene is dissolved in hot xylene, then
cooled under controlled conditions down to 25ºC,
which results in the precipitation of the insoluble
fraction. The soluble matter remains in the xylene. The
suspension is filtered and an aliquot of the solution
is then evaporated, dried and the residue weighed.”
(7-8)
The Classic
Gravimetric
Procedure

TREF Analysis
T
Amorphous Fraction
PP
Correlation CRYSTEX - XS gravimetric method
CRYSTEX
00
5
5
10
10
15
15
20
20
25
25
30
30
Gra
vim
etri
c
Heated/stirrer plate
TREF column in Micro Oven
Visco.
Dispenser
IR
Solvent Waste
Quality Control for Polyolefins
21CRYSTEX® QC APPLICATION NOTE
A schematic analytical process is depicted in Figure 1.
This procedure, which we will refer to as the classic
gravimetric method,has been extensively used in the
industry and has proven to be of great value to the
manufacturing of polypropylene (PP). The analysis
of the xylene soluble with this approach however,
demands significant manpower, solvent consumption,
and an analysis time of around five to six hours. Just as
significant is the fact that the precision of the method
suffers from the required controlled precipitation
conditions as discussed in the ASTM and ISO methods.
In the last years, new methods have been developed
to quantify the amorphous fraction attempting to
overcome previous time-consuming procedures by
automating the analytical process and, at the same
time, provide extended characterization of the
amorphous and crystalline phases.
Automated Crystallization methods
The classic gravimetric method, as discussed above,
is based on a crystallization process where the
crystalline matrix is segregated from the amorphous
soluble fraction by cooling the solution according
to a specified method with a fixed crystallization
temperature and time. The selection of solvent did not
Fig 1. Schematic representation of the analytical steps equired in the classic gravimetric method for the determination of the xylene solubles.
Fig 2. Chemical Composition Distribution of a polypropylene copolymer analyzed by TREF where the amorphous and crystalline fractions are well segregated.
In the early 2000s, it was shown that the amorphous
content in polypropylene can be measured by an
automated crystallization technique (1 ) and a method
(CRYSTEX®) was developed based on CRYSTAF (2-4)
using a chlorinated solvent (di or tri-chlorobenzene)
combined with the use of an IR detector.
appear to be of significant importance as the intention
is to separate two different polymer phases quite apart
in crystallinity as shown in Figure 2, where the soluble
fraction corresponds to the distinctive peak in a PP
resin characterized by TREF or CRYSTAF analysis.
Fig 3. Correlation between the xylene solubles ISO/ASTM methods and the new crystallization approach.
Fig 4. Schematic diagram of the new CRYSTEX® QC instrument.
The correlation with the classic gravimetric method was
excellent for a wide selection of PP resins as shown in
Figure 3, while obtaining better reproducibility thanks
to the full automation of CRYSTEX®.
An extension of the CRYSTEX® technique for application
in quality control laboratories of polypropylene plants
has now been developed. The new analytical process,
named CRYSTEX® QC, is based on TREF, rather than the
CRYSTAF approach, with the intention of speeding up
the analysis of a single sample while maintaining the
system’s same capability to measure intrinsic viscosity
and ethylene incorporation. The new method analyzes
one sample at a time and is capable to dissolve up to
4 g of sample, thus, minimizing error due to the poor
homogeneity of powder samples.
The schematics of the system are presented in Figure
4. The only task done by the analyst consists in putting
an approximate amount of sample into a bottle,
placing the bottle in an oven, lowering a handle to
pierce the bottle’s septum, and initiate the automated
run. There is no need of weighing the sample since
the IR detection of the full solution will provide
accurate measurement of the amount of resin used,
(which does not need to be in a dry form as residual
water will not be detected by the IR). The IR detector
is used to measure as well, the concentration of the
amorphous and crystalline fractions and their ethylene
incorporation. The crystallization in a TREF column,
on an inert support, eliminates the filtration step, and
the integration of a capillary viscometer provides an
automated measurement of intrinsic viscosity of the
whole sample and both amorphous and crystalline
fractions.

Whole Sample
C2%[η]s
Soluble FractionSF %C2%[η]s
Dissolution
1st load
Precipitation
2nd load
Re-dissolution
Crystalline FractionNon Sol. %C2%[η]s
Whole Sample Soluble Fraction Crystalline Fraction
Soluble Fraction Ethylene Content Intrinsic Viscosity*
% std % std dL/g std
Sample A 4.06 0.04 4.2 1.0 2.86 0.12
Sample B 2.73 0.05 4.4 0.4 2.30 0.04
Sample C 7.66 0.12 6.9 0.3 2.01 0.12
*Intrinsic Viscosity measured TCB at 165°
Ethylene Content Intrinsic Viscosity*
Soluble Fraction Crystalline Fraction Soluble Fraction Crystalline Fraction
% std % std dL/g std dL/g std
Sample A 14.8 2.1 3.4 0.3 0.96 0.06 2.74 0.11
Sample B 16.3 1.5 3.9 0.2 0.90 0.11 2.33 0.02
Sample C 53.9 1.4 2.8 0.3 1.67 0.05 2.04 0.12
*Intrinsic Viscosity measured TCB at 165°
Quality Control for Polyolefins
23CRYSTEX® QC APPLICATION NOTE
A major advantage of this approach is that the
crystallization step is done with a small but
representative aliquot of the solution and takes place
in a packed column where the crystallization kinetics
are fast and very well-controlled; thus, providing very
reproducible results. The overall analytical process lasts
two hours including automated solvent dispensing into
the bottle to dissolve the sample, and column cleaning
in order to be ready for the next sample analysis.
Once the powder or pelletized polymer is put into the
bottle and the automated run is initiated, the analysis
proceeds as follows:
a) Filling the disposable bottle up to 100 or 200 mL
with preheated solvent at 160ºC (depending on
whether pellets or powder samples are analyzed)
and initiate stirring. The deep vortex formed in the
dissolution process prevents the polymer from sticking
to the glass walls and speeds up dissolution.
b) An aliquot of the solution is pumped through
the TREF column at 160ºC towards the detectors to
measure the whole sample concentration, ethylene
incorporated and intrinsic viscosity (first eluted peak
in Figure 5).
c) A new aliquot of the solution is injected into the
middle of the column at 160ºC, the flow is stopped
and the column temperature is reduced rapidly down Fig 5. Schematic diagram of the new CRYSTEX@ QC instrument.
to controlled ambient temperature, staying there
for an specified amount of time to precipitate the
crystalline fraction; the column is then flushed to elute
the amorphous soluble fraction peak (second peak in
Figure 5). The ratio of this peak area by the one of the
whole sample provides the soluble percentage in the
sample. As the soluble material passes through the IR
and Viscometer detectors, the ethylene content and
intrinsic viscosity of this fraction are also measured.
d) Temperature is raised rapidly up to 160ºC with stop
flow to re-dissolve the crystalline fraction and after a
pre-set time of a few minutes, this fraction is eluted
through both IR and viscometer detectors.
e) The column is washed and the instrument remains
ready for a new sample analysis.
Automated
Crystallization
Methods
Full analytical results are obtained in two hours,
including not only the soluble fraction percentage,
but also the ethylene content and intrinsic viscosity
of whole sample, as well as of the soluble and
crystalline fractions. Reproducibility in the soluble
fraction percentage determination is remarkable;
typically standard deviation (std) is lower than 0.1%,
as seen in Table 1, much lower than indicated for the
standard gravimetric methods.(7) In the same Table,
whole sample ethylene and intrinsic viscosity are also
reported, along with standard deviation (std) values.
The precision achieved, also in those determinations,
proves the reliability of this method.
Ethylene content and intrinsic viscosity data along
with their std values for the analysis of soluble and
crystalline fractions are shown in Table 2. It must be
emphasized that no additional experimental effort
is required, since the data is collected by the IR and
viscometer detectors during the automated analysis.
The precision in ethylene content for the crystalline
fraction is as good as for the whole sample, while for
the amorphous fraction the standard deviation will
depend on the amount of soluble material. On the
other hand, the intrinsic viscosity is determined with
good precision for all the fractions.
Table 1. Soluble fraction, total ethylene content and Intrinsic Viscosity for three different PP products. Data obtained from seven replicate analyses using 4 g of sample.
Table 2. Ethylene content and Intrinsic Viscosity in the amorphous/soluble and the crystalline fractions for three different PP products. Same analysis as in Table 1.

Quality Control for Polyolefins
25CRYSTEX® QC APPLICATION NOTE
Conclusions
CRYSTEX® QC is a new method to measure the
soluble fraction in polypropylene resins that has been
developed based on a TREF crystallization approach.
The analytical process is fully automated with no need
of weighing, filtration or solvent handling. This new
method is especially interesting for quality control
(product and process) in polypropylene plants.
The total analysis time is two hours, and samples are
analyzed one at a time in disposable bottles. The total
volume consumption is as low as 180 mL for a 2-g
sample analysis. The analysis of 4 g of resin in the
form of powder can be done for enhanced sample
representativeness.
Besides the soluble fraction (equivalent to xylene
solubles), CRYSTEX® QC measures automatically and
simultaneously, the ethylene content and intrinsic
viscosity in both amorphous and crystalline fractions,
and in the whole sample.
The possibility to measure a sample in two hours allows
a fast response in process control during product grade
changes reducing off grade production. The new
system can be used with other polyolefin type resins
as well.
References
1) B. Monrabal , Encyclopedia of Analytical Chemistry,
John Wiley & Sons, 2000 pages 8074-8094.
2) L. Romero, B. Monrabal, A. Ortín, Pittcon 2001
U.S.A.
3) A.. Ortín, B. Monrabal, M. D. Romero, LCGC Europe
Vol 19 Issue Suppl., March 2006, 32.
4) A. Ortín, L. Romero, B. Monrabal. Polyolefin
Characterization (ICPC) November 7 - 10, Shanghai,
China 2010
5) G. Natta et al. Chim. e Ind. (Milano) 39, 275, 1957
6) P.M. Kamath and L. Wild, Polymer Engineering &
Science, 6, Issue 3, 213–216, 1966
7) ASTM standard D5492-10, ASTM
8) ISO standard 6427, 1992, ISO standard 16152, 2005
CRYSTEX® 42

CRYSTEX® 42KEY FEATURES
CRYSTEX® 42 is a high-throughput and fully-automated approach for obtaining the
soluble fraction in polypropylene and other polyolefin resins. It is based on the same
TREF separation concept as CRYSTEX® QC, in which the sample is loaded into a TREF
column twice. The first injection serves to measure the whole polymer and the second
one remains within the column for a crystallization ramp that results in the separation
of the soluble from the crystalline fraction.
CRYSTEX® 42 incorporates a high temperature autosampler with 42 positions to analyze
samples in 20mL vials (max. sample amount of 160mg). This system eliminates the need
to handle solvent manually and it operates with less flammable solvents than Xylene
(TCB or oDCB), increasing the safety level in the laboratory.
Results are very precise thanks to its full automation and to its integrated infrared
detector (IR4), which measures precisely the amount of sample analysed as well as
providing ethylene content information. Moreover, for a truly complete analysis, the
instrument measures intrinsic viscosity by means of a built-in dual capillary viscometer.
All results (concentration, ethylene content, and intrinsic viscosity) are obtained for the
whole sample, the soluble fraction, and the crystalline fraction.
While CRYSTEX® QC was designed to be installed in each production plant to monitor
in real time the process analyzing a significant amount of powder sample (up to 4g),
CRYSTEX® 42, thanks to the incorporation of the high temperature autosampler,
becomes a perfect complement to be used in a central lab, where large batches of
pelletized, more homogeneous samples need to be analyzed.
HIGH-THROUGHPUT SYSTEM FOR SIMULTANEOUS MEASUREMENT
OF THE SOLUBLE FRACTION, ETHYLENE CONTENT AND INTRINSIC
VISCOSITY
27
Fully-automated analysis of the soluble fraction in polypropylene and other polyolefins.
Additional analysis of ethylene content and intrinsic viscosity for the amorphous fraction, the crystalline fraction and whole sample.
Fully-automated process for 42 samples: No need for accurate weighing of the sample or manual solvent handling. No external filtration and no solvent evaporation required.
Dissolution and full analysis of the first sample completed in 3 hours. Following samples results are obtained every 2 hours.
Compatible with other polyolefin materials such as LDPE and adaptable to other solubility tests (heptane or hexane solubles).

Quality Control for Polyolefins
29
HT GPC for Process Control and Quality Control in PE and PP Production
GPC-QC

GPC-QCKEY FEATURES
GPC-QC is a compact, high-temperature GPC instrument for quality control in polyolefin
manufacturing lines. The instrument has a simple and reliable approach based on
Polymer Char’s recently developed QC platform, to provide robust and precise Molar
Mass Distribution for process control.
For quality control purposes, the industry has traditionally relied on physical parameters
related to an average of the MMD, such as melt flow index (MFI) and density. These
parameters are not enough when producing complex multiple reaction products, some
of them having multimodal MMD. It is in these occasions when GPC-QC can provide
significant value by measuring the whole MMD.
GPC-QC delivers the complete Molar Mass Distribution for one sample through
a simplified workflow, while keeping a fully automated sample preparation and an
analysis free of manual solvent handling throughout the entire process. The complete
analysis takes 30 minutes including dissolution.
The IR detection, implemented in the instrument through Polymer Char’s integrated
IR4 or IR5 MCT detectors, is highly stable, contributing to the overall reliability of
the instrument. The IR detector also provides simultaneous chemical composition
information, which is key for controlling the production of heterogeneous resins.
Moreover, for a truly complete analysis, the instrument can also measure intrinsic
viscosity by means of a built-in dual capillary viscometer that can be incorporated as an
additional feature.
SIMPLIFIED AND FULLY-AUTOMATED HIGH-TEMPERATURE GPC
INSTRUMENT AIMED AT CONTROL LABORATORIES IN THE POLYOLEFIN
INDUSTRY
31
Full automation of the entire analytical process.
One sample analyzed in 30 minutes including dissolution.
IR4 or IR5 MCT detectors for Concentration and Short Chain Branching information.
Optional incorporation of a dual-capillary viscometer.
Simple and reliable design for Quality Control environments.
Comprehensive results (MMD, SCB, IVD).
Outstanding precision thanks to the full automation and the detectors’ robustness.

Quality Control for Polyolefins
33GPC-QC APPLICATION NOTE
Introduction
Polyolefin (PO) constitutes the largest volume
industrial polymer group in the world in terms of
economic impact and production. They are used for
making a wide range of commercial products that
touch nearly every aspect of our daily lives, such as
automobile parts, pipes, packaging films, household
bottles, and many more. PO as a group includes high-
density and low-density polyethylene (HDPE, LDPE),
polypropylene (PP), ethylene-propylene (EP) rubber,
and linear low density (LLDPE) copolymers of ethylene
with alpha olefins (propylene, 1-butene, 1-hexene,
1-octene). They are poly-disperse materials, meaning
that a single product is made of a range of chains with
different chain-lengths and possibly different chemical
compositions when more than one monomer type is
used in the synthesis. Moreover, different molecular
architectures (linear or branched) and stereo-structures
(tacticity in PP) are also possible in these products. All
that complexity, together with the semi-crystalline
nature of most PO materials, helps to understand the
expanding application range of these products.
A range of reactor configurations and catalyst systems
are used nowadays by different manufacturers to
produce thousands of tons of polyethylene and
polypropylene every year, in huge petrochemical
complexes around the world. Even if the material being
produced is in fact characterized by a distribution
of molar masses (MMD) and possibly a distribution
of chemical compositions (CCD), due to historical
and practical reasons, the production is typically
controlled based on bulk properties, which can be
measured with relatively simple equipment. Melt flow
rate (MFI) is maybe the most important of such bulk
parameters, being related mainly to the average molar
mass. Density, which is more related to the average of
chemical compositions, is another parameter typically
used for controlling the reactor and the product.
With the development of more complex PO, such a
multimodal polyethylene or heterophasic PP, and
the requirement for a more uniform production and
tighter specification ranges demanded by a global
and competitive market, the classical approach of
relying on bulk physical properties for control of the
manufacturing process starts to find its limits. A new
paradigm needs to be implemented based on acquiring
complete information about the full distributions
that characterize the products, in order to replace
or complement the control based on single average
parameters.
GPC-QCAPPLICATION NOTE
Design Principles
and Operation
Gel permeation chromatography (GPC/SEC)
is extensively used in the industry’s analytical
laboratories to obtain the MMD. The requirement
of high temperature operation, given the semi-
crystalline nature of polyolefin, together with the
inherent complexity of the technique and fragility of
columns, has prevented in the past the availability of
MMD analysis as a routine process control tool in the
manufacturing plant laboratory. In order to fulfill this
need in the industry, a compact GPC-QC instrument
has been developed to provide robust and precise
MMD data for process control. In addition to a high-
reliability hardware design, the operation workflow
has been simplified while keeping full automation of
sample dissolution and analysis.
Given that the application for GPC-QC follows the
process changes in manufacturing, there are no
batches of samples coming together to be analyzed.
Instead, the analysis of a single sample of the
material produced at a particular time is required,
in a continuous operation cycle. That means there is
no need for an auto-sampler, but a single dissolution
station optimized to shorten the dissolution time
is used instead. This is a fundamental difference in
the design for QC, compared to the instrumentation
dedicated to research.
A simplified hardware design including only one
valve at high temperature, an external HPLC pump
and robust detectors, helps in achieving the required
level of reliability and minimizing potential downtime.
The main detector is infrared, which provides a
concentration signal based on absorbance of total CH,
being very appropriate for the QC environment thanks
to the fast stabilization time, stable baseline and good
sensitivity.
Depending on the process homogeneity, a significant
amount of sample may be required to obtain a good
representativeness, so large capacity vials of 100 or
200 mL are used compared to the typical 2 – 10 mL
used in research grade instruments. Up to 200 mg of
polymer can be dissolved for analysis, although 50 mg
is the typical sample size.
The analytical workflow is quite simple and requires
minimum manual work. When a sample of polymer is
received in the laboratory, it is weighed into the vial
and a small magnetic bar is placed (a small amount of
a flow rate marker, or internal standard, can be added
to the vial). The vial is placed in the dissolution station
oven. Then the analyst lowers a handle to insert the
needle into the vial through the septum.

-0.0100.0
100 1,000 10,000 100,000 1,000,0000.00 1.00 2.00 3.00 4.00
0.0100.2
0.030
0.4
0.050
0.6
0.070
0.8
0.090
1.0
IR
Ab
sorb
ance
dW
/dLo
gM
Retention time (min) Molar Mass (g/mol)
15-0365
15-0364
15-0363
15-0362
15-0361
15-0360
15-0359
15-0365
15-0364
15-0363
15-0362
15-0361
15-0360
15-0359
a) b)
injection Mw (g/mol) Mn (g/mol) Mw / Mn
15-0365 190,158 46,638 4.08
15-0364 189,939 47,122 4.03
15-0363 189,840 46,936 4.04
15-0362 190,592 47,155 4.04
15-0361 191,754 47,057 4.07
15-0360 190,258 47,335 4.02
15-0359 190,630 47,622 4.00
average 190,453 47,124 4.04
std 647 308 0.03
RSD (%) 0.34% 0.65% 0.68%
Quality Control for Polyolefins
35GPC-QC APPLICATION NOTE
Fig. 1. Chromatograms (left) and molar mass distribution (right) for seven injections of a PE sample, showing excellent precision in the injection and analysis process in GPC-QC. Smaller peak at 2.6 min is a flow rate marker.
The analysis is started from the computer, and
proceeds automatically according to the pre set
method conditions. Once the analysis is finished, the
chromatograms are processed to generate the MMD
and any calculated parameters of interest. When a
new sample comes in, a new vial is prepared with it
and the analyst just discards the previous one placing
the new one in the station. Following this workflow,
the GPC-QC can be operated continuously with a cycle
time of one hour or less, which is found appropriate
for controlling the start-up of reactors, or when a
change of grade is conducted. Once the process is
stable, production may need to be controlled at a
slower pace, several times per day.
Precision in the molar mass results is key in the
application of this technology in manufacturing
control, so some experiments were conducted to
assess whether the performance was satisfactory.
A series of replicate analyses of an LLDPE material
(density 0.868 g/cm3) were performed in a GPC-QC
instrument, using typical analysis conditions: mobile
phase was 1,2,4-trichlorobenzene (TCB) with 300
ppm of butylhydroxytoluene (BHT) as antioxidant,
chromatographic pump flow rate of 2.0mL/min,
column and detectors temperature 150ºC, injection
200 μL, and the column was a PL Rapide H 150 x
7.5 mm (Agilent, Waldbronn, Germany). For sample
preparation, 40 mg of polymer were put in the vial
Results
and Discussion
Table 1. Summary of molar mass averages and poly-dispersity index showing excellent precision obtained by GPC-QC.
and filling volume was set to 80 mL taken from the
same reservoir as the mobile phase, dissolution time
was 60 minutes at 160ºC with 400 rpm stirring. The
IR detector concentration chromatograms are shown
in Figure 1 (left) for the seven replicates, which overlay
perfectly. It should also be noted that the separation
was achieved in a time slightly over 2 minutes. The
total analysis time can be reduced to around 3 minutes,
and solvent consumption to around 50 mL per sample.
The good precision in the collected chromatograms is
translated to the calculated MMD as seen in the same
Figure (right). The molar mass averages Mw and Mn
from all individual distributions are presented in Table
1, together with the poly-dispersity index calculated
as the ratio Mw/Mn. This index is related to the
broadness of the distribution, and that information is
not available when only bulk properties are measured.
The precision in the molar mass averages and poly-
dispersity index expressed as standard deviation (std)
and relative standard deviation (RSD %) is remarkable
for GPC analysis.
For the implementation of this new technology in
manufacturing plants for process control, the total
cycle time, from sample reception to delivery of results,
is a crucial parameter. Thanks to the use of a single
fast-GPC column and increased pump flow rate, the
actual GPC separation is performed in less than three
min. However, the polymer needs to be brought in
solution before analysis, which in the case of most PO,
it is considered a time-consuming process.
The single-vial dissolution station in the GPC-QC was
optimized in order to shorten the dissolution time, by
ensuring good heat-transfer to the vial and providing
vigorous stirring. Besides that, the vial is filled with
preheated solvent, so no additional time is required
to increase its temperature once in the vial. The
optimized dissolution and separation processes opens
the door to HT-GPC analysis within 30 minutes in most
cases, including the sample preparation step, and less
than one hour even for the most difficult products.
This means a breakthrough in this kind of technology
and enables the practical application in manufacturing
plants as a process control /quality control tool.
Additional detection to enhance the information
gained by GPC-QC: chemical composition by IR
and viscometry
The use of an IR detector in these instruments can
also generate useful information on the chemical
composition of the sample being analyzed. This is
relevant in the case of copolymers, which account for
a large part of the PO produced nowadays, such as
LLDPE, some HDPE and also the important group of EP
copolymers.

dW
/dLo
g M
SCB
/100
0TC
0.50
9.0
8.0
7.0
6.0
5.0
4.0
3.0
2.0
1.0
0.0
10.0
0.40
0.30
0.20
0.10
0.00
100 1,000 10,000 100,000 1,000,000 10,000,000
0.932 g/cc
0.940 g/cc
MMD
SCB
Molar mass (g/mol) SCB
/100
0TC
Log M
0.10
0.00
2.0 3.0 4.0 5.0
0.0
1.0
2.0
3.0
4.0
5.0
6.0
7.0
8.0
9.0
10.0
6.0 7.0
0.05
0.15
0.20
0.25
0.30
0.35
0.40
0.45
0.50
dW
/dLo
g M
Quality Control for Polyolefins
37GPC-QC APPLICATION NOTE
Fig. 2. MMD and short chain branching (SCB) frequency measured by GPC-QC for a bimodal HDPE. The density of each of the modes was calculated from an average of the SCB frequency in each molar mass range.
The information generated by the IR detector can be
translated to either comonomer weight fraction or
to density units for a given product range. A single
value representing the bulk composition/density can
be reported, but possible variations along the molar
mass distribution can also be measured in the case of
heterogeneous multicomponent resins.
An example is provided in Figure 2 for a bimodal
HDPE made in a dual-reactor process. A lower molar
mass high-density component is typically produced,
together with a second component of higher molar
mass with a small amount of added comonomer. That
balance results in enhanced mechanical properties,
such as ESCR, for pipe applications. From a single
GPC-QC analysis, and in in less than one hour with
minimum operator intervention, it is possible to obtain
an estimation on the density being produced in each
of the two reactors, as well as the molar mass and
the weight fraction of each component. The level of
control on the process is thus greatly enhanced over
the alternative methods based on bulk properties (MI
and density).
All that capability is readily available using the GPC-
QC technology, given that the built-in IR detector can
deliver it without any analytical complexity. In order
to obtain quantitative results from the IR, a simple
calibration can be used with a small set of reference
products with known chemical composition.
When required, a 2-capillary serial viscometer can be
included in GPC-QC to collect data on the polymer
intrinsic viscosity and its distribution, and also on long
chain branching. Intrinsic viscosity is more directly
related to the processing behavior and properties of
the polymer and so it may be preferred in some cases
as an alternative to molar mass. The 2-capillary serial
design used in GPC-QC is robust and well suited for
this environment.
It can be said that GPC-QC is a very powerful tool
for process control and QC, given that by means of
a GPC separation, it provides enhanced and more
detailed information than the bulk property methods
used nowadays. In order to optimize the application of
this technology, specific data processing procedures,
based on multivariate analysis or modeling may be
developed, targeted to a given process or product
range. Additionally, robust data processing methods,
based on viscosity distribution, are being developed
as a means to enhance the precision and long-term
reliability of GPC-QC as a process control tool.
MMD and SCB results of a bimodal HDPE sample Overlay of 5 injections
Dissolution PolyethyleneMw=200,000 g/moL
d=0.940 g/cm3
Important applications for GPC-QC are:
· Pilot plants
· Plant start-ups
· Monitoring grade changes in multi-reactor
processes
· Monitoring the microstructure of pipe resins
· Processors laboratories
Conclusions
The control of the reactors for manufacturing of PE
and PP is nowadays still based on measuring physical
properties of the bulk material (Melt Index, density),
which is quite limited information on the product itself.
An enhanced, more refined, control on the process and
the product can be realized by using more complete
information given by the molar mass distribution
(MMD).
Instrumentation specifically aimed at measuring the
MMD in a manufacturing plant laboratory has been
developed. It has been proved that the total cycle time,
including the sample dissolution step can be reduced
to around 30 minutes, well in line with the process
control requirements.
Important
Applications
for GPC-QC
Reproducibility of this technology is very good in
both average molar mass and poly-dispersity index
(RSD around 0.5%). Additional detection of chemical
composition, which can be related to density, is given
by the built-in IR detector, while an online viscometer
can also be incorporated.
Quality Control for Polyolefins
39
Intrinsic Viscosity Determination forPolymeric Materials
IVA
IVAKEY FEATURES
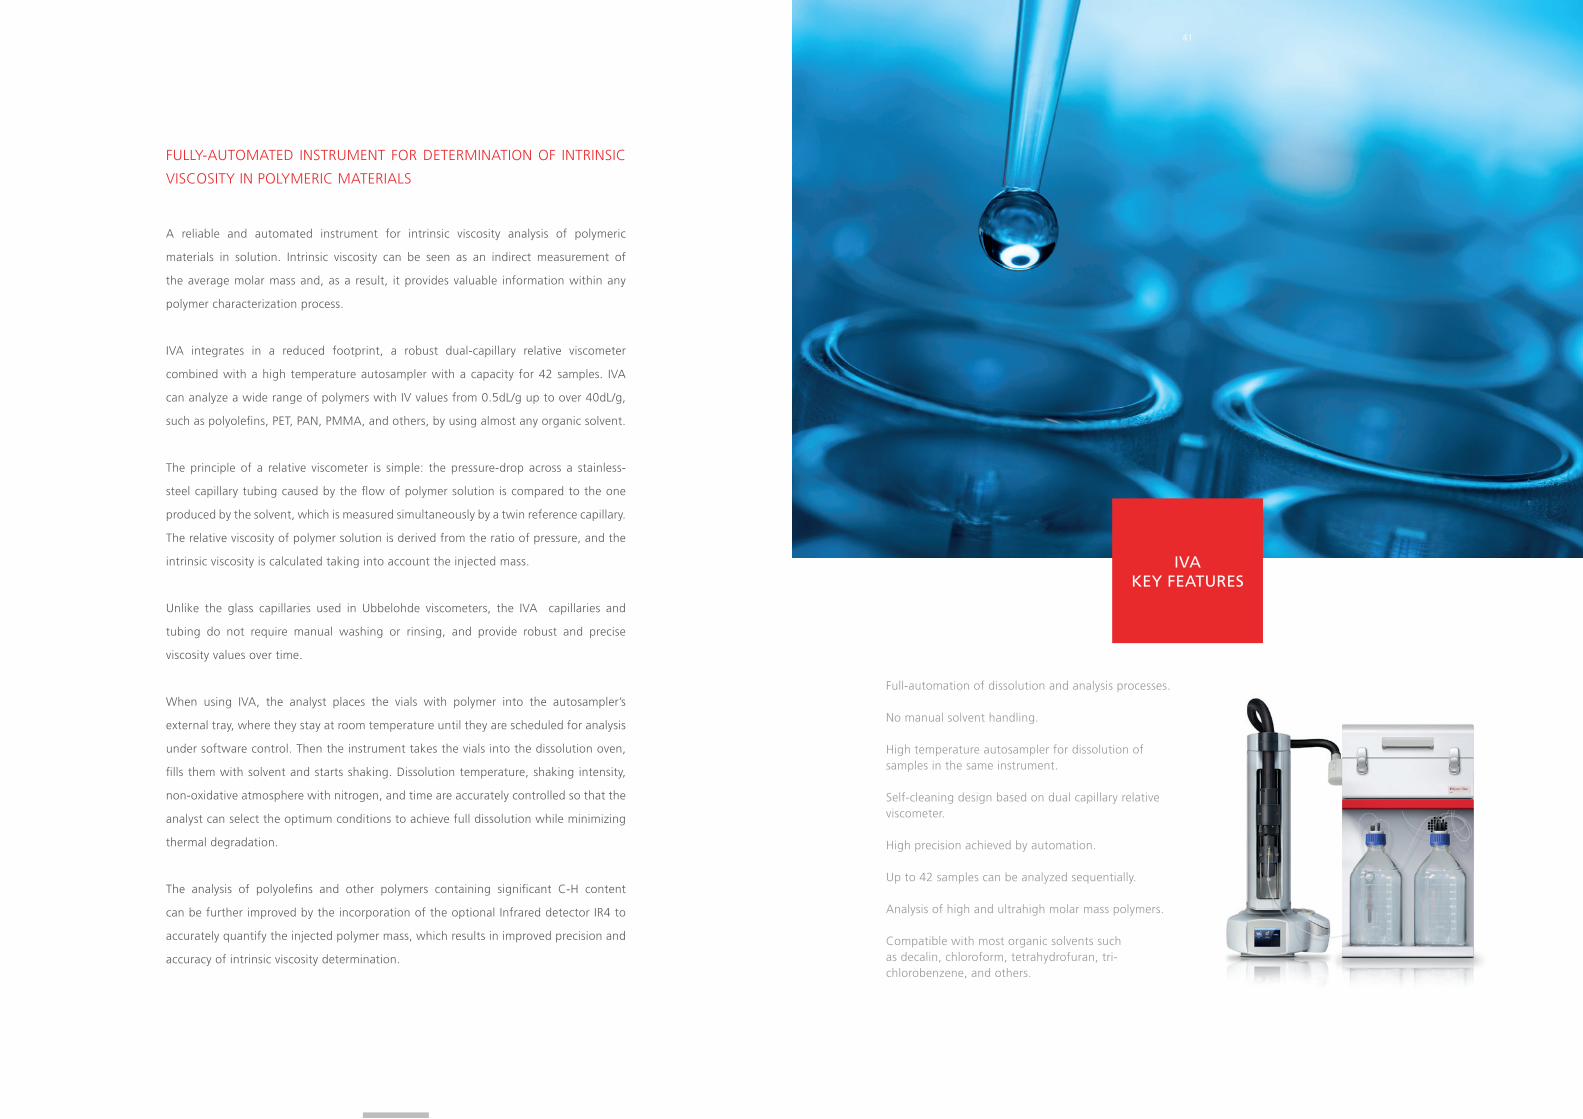
A reliable and automated instrument for intrinsic viscosity analysis of polymeric
materials in solution. Intrinsic viscosity can be seen as an indirect measurement of
the average molar mass and, as a result, it provides valuable information within any
polymer characterization process.
IVA integrates in a reduced footprint, a robust dual-capillary relative viscometer
combined with a high temperature autosampler with a capacity for 42 samples. IVA
can analyze a wide range of polymers with IV values from 0.5dL/g up to over 40dL/g,
such as polyolefins, PET, PAN, PMMA, and others, by using almost any organic solvent.
The principle of a relative viscometer is simple: the pressure-drop across a stainless-
steel capillary tubing caused by the flow of polymer solution is compared to the one
produced by the solvent, which is measured simultaneously by a twin reference capillary.
The relative viscosity of polymer solution is derived from the ratio of pressure, and the
intrinsic viscosity is calculated taking into account the injected mass.
Unlike the glass capillaries used in Ubbelohde viscometers, the IVA capillaries and
tubing do not require manual washing or rinsing, and provide robust and precise
viscosity values over time.
When using IVA, the analyst places the vials with polymer into the autosampler’s
external tray, where they stay at room temperature until they are scheduled for analysis
under software control. Then the instrument takes the vials into the dissolution oven,
fills them with solvent and starts shaking. Dissolution temperature, shaking intensity,
non-oxidative atmosphere with nitrogen, and time are accurately controlled so that the
analyst can select the optimum conditions to achieve full dissolution while minimizing
thermal degradation.
The analysis of polyolefins and other polymers containing significant C-H content
can be further improved by the incorporation of the optional Infrared detector IR4 to
accurately quantify the injected polymer mass, which results in improved precision and
accuracy of intrinsic viscosity determination.
FULLY-AUTOMATED INSTRUMENT FOR DETERMINATION OF INTRINSIC
VISCOSITY IN POLYMERIC MATERIALS
41
Full-automation of dissolution and analysis processes.
No manual solvent handling.
High temperature autosampler for dissolution of samples in the same instrument.
Self-cleaning design based on dual capillary relative viscometer.
High precision achieved by automation.
Up to 42 samples can be analyzed sequentially.
Analysis of high and ultrahigh molar mass polymers.
Compatible with most organic solvents such as decalin, chloroform, tetrahydrofuran, tri-chlorobenzene, and others.

Quality Control for Polyolefins
43IVA APPLICATION NOTE
New research leads to the development of an
automated and versatile technique for solution
viscosity determination of a wide range of
polymeric materials in different solvents, from
ambient temperature up to 200ºC.
Introduction
The determination of the solution viscosity of
polymeric materials is very important to the industry,
both to research and manufacturing, since it can be
used to estimate the molar mass, providing important
information relating to the physical properties of
polymers. The relative viscosity of a dilute polymer
solution to that of the pure solvent itself is measured
and from it, the intrinsic viscosity (IV or [η]) of the
polymer is calculated. Due to the popularity of dilute
solution viscosity measurements and the availability of
those methods in many manufacturing laboratories,
the IV of polymers has been traditionally used to specify
and to control the production grades. It must be noted
however, that IV is not a property of the polymer itself,
as molar mass is, but rather a property of the polymer
solution, influenced by the solvent and temperature.
The recently developed technique is an automated
process for viscosity measurements of polymeric
materials in solution. It is compatible with typically
used organic solvents such as decalin, tetralin, tri-
chlorobenzene (TCB) and ortho-dichlorobenzene
among many others. Dissolution temperature and
analysis temperature can be set independently, from
ambient to 200ºC, so that a wide range of polymers,
even the most crystalline ones, can be analyzed with
convenience and safety with this alternative approach.
Intrinsic Viscosity Determination
The proposed new method performs the polymer
intrinsic viscosity measurement by means of a two-
capillary relative viscosity detector, which concept
was developed and patented by Yau in the 80s
(US 4,793,174), as a robust method in contrast to
temperature, pressure or solvent flow rate variations.
Capillary viscometers rely on the principle that under
a forced flow (Q), the pressure drop (∆P) due to a
fluid traveling along a capillary tubing of length L and
radius r, is proportional to the absolute viscosity of the
flowing fluid [η], according to Poiseuille’s law:
IVAAPPLICATION NOTE
Absolute viscosity of fluids is important to many
industries and can be measured using different types
viscometers. However, in polymeric materials the
interest is on the relative viscosity of a dilute polymer
solution compared to that of the pure solvent, given
that from it, the intrinsic viscosity, related to molar
mass of the polymeric material, can be derived. In the
first place, the relative viscosity [ηrel] is defined as:
This is a dimensionless quantity which represents to
what extent the added polymeric material increases
the viscosity of the solvent. The relative viscosity of the
solution is proportional to the amount or concentration
(C) of polymer it contains, while the intrinsic viscosity
is independent of concentration. The specific viscosity
[ηsp] of the solution and the polymer intrinsic viscosity
[η] are calculated according to the Equations:
The intrinsic viscosity has units of inverse density (dL/g
for instance). It is defined at the limit of infinite dilution
(zero concentration), and sometimes calculated by
extrapolation of data at different concentration levels.
A more practical and efficient approach is based on
a single-point relative viscosity measurement, taken
at a defined concentration low enough to eliminate
the need for extrapolation, or using a model equation
to estimate the extrapolated value. Among several
models and equations, the Solomon-Ciutà Equation,
which does not require additional parameters, can be
used:
A serial viscometer design has been implemented
for the new method: two pieces of capillary tubing
are connected in series in such a way that the first
one experiments the flow of pure solvent while the
second one simultaneously receives the flow of the
dilute polymer solution. The pressure drop across
each capillary is measured continuously as a function
of time by high sensitivity differential pressure
transducers. According to Equations (1) and (2),
the relative viscosity is proportional to the ratio of
differential pressures, being independent of the flow
rate. An instrumental constant is easily measured by
y= 0.8230xR2= 0.9989
ISO
162
8-3:
2010
dec
alin
@13
5°C
(d
L/g
)
IVA method, TCB @150°C (dL/g)
0.00
0.00
0.50
1.00
1.00
1.50
2.00
2.00
2.50
3.00
3.00
3.50
4.00
4.00 5.00
4.501.20
1.00
1.00
y= 1.161xR2= 0.995
Gla
ss c
apil
lary
@25
°C (
dL/
g)
IVA method, 35°C (dL/g)
0.80
0.80
0.60
0.60
0.40
0.40
0.20
0.20
0.00
0.00
Quality Control for Polyolefins
45IVA APPLICATION NOTE
flowing pure solvent through the two capillaries. The
constant is automatically measured with every injection
thus, compensating for small, long-term variations
in capillaries (self-calibrating). It also accounts for
differences in tubing dimensions, so in this design,
it is not required that the capillaries stay accurately
matched.
The relative viscosity is calculated as a function of
time as the injected solution goes through the system,
and any influence of flow-rate variations (such as
high frequency pump pulsations) or thermal effects
are cancelled out directly by the reference capillary,
resulting in very high sensitivity and long-term stability.
An automated technique for Intrinsic Viscosity
Analysis
The proposed method constitutes a precise and
convenient approach to IV measurement, due to the
automation of all the analytical procedures, from
filling of vials to the reporting of results. Samples are
put in solid form into 20 mL vials and brought to an
autosampler tray with capacity of 42 vials. The operator
enters the samples identification data, selects the
analytical method and starts the analysis that proceeds
unattended until all the vials defined in the instrument
run queue are analyzed. Under software control,
solvent is added to the vials, controlling the dissolution
time per vial, injecting each solution and rinsing of the
capillary lines. The solution travels safely throughout
all the system without any risk of precipitation because
there are no cold spots. A new run can be immediately
started after finishing the previous one, achieving a
throughput of 40 samples a day in standard operation
conditions.
In order to maintain the polymeric sample integrity
along the dissolution and measurement processes,
Sample Care protocols have been implemented as part
of the method. Those include the ability to purge the
vial atmosphere with an inert gas (Nitrogen) before
dissolution starts, and controlling accurately the time
spent at high temperature by keeping every vial inside
of the oven only for the programmed dissolution
time. The vials remain in an external tray at room
temperature until the scheduling software requests
their transfer to the dissolution oven. Efficient heat
transfer to the vial, together with preheating of the
solvent prior to delivery to the vial, help in shortening
the time required for dissolution. Oxidative and
thermal degradation is thus minimized, ensuring that
accurate intrinsic viscosity is measured even for the
most challenging ultra-high molar mass materials, or
oxidation-prone polymers, such as polypropylene.
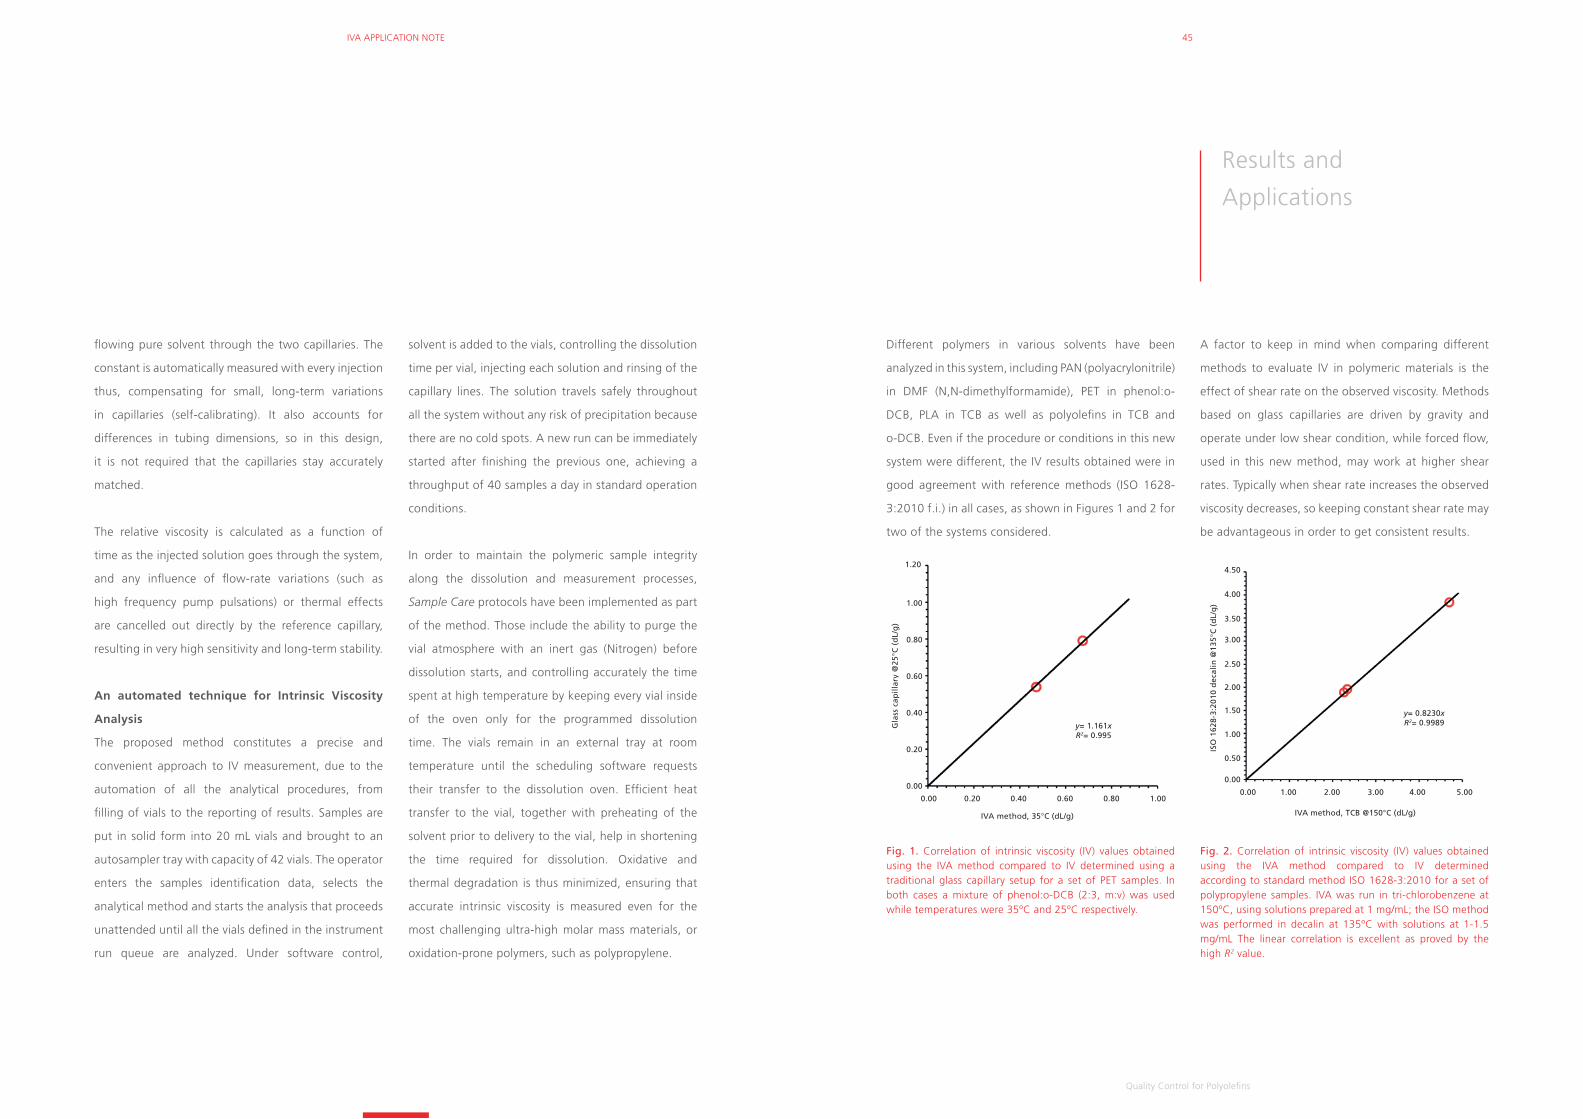
Different polymers in various solvents have been
analyzed in this system, including PAN (polyacrylonitrile)
in DMF (N,N-dimethylformamide), PET in phenol:o-
DCB, PLA in TCB as well as polyolefins in TCB and
o-DCB. Even if the procedure or conditions in this new
system were different, the IV results obtained were in
good agreement with reference methods (ISO 1628-
3:2010 f.i.) in all cases, as shown in Figures 1 and 2 for
two of the systems considered.
A factor to keep in mind when comparing different
methods to evaluate IV in polymeric materials is the
effect of shear rate on the observed viscosity. Methods
based on glass capillaries are driven by gravity and
operate under low shear condition, while forced flow,
used in this new method, may work at higher shear
rates. Typically when shear rate increases the observed
viscosity decreases, so keeping constant shear rate may
be advantageous in order to get consistent results.
Fig. 1. Correlation of intrinsic viscosity (IV) values obtained using the IVA method compared to IV determined using a traditional glass capillary setup for a set of PET samples. In both cases a mixture of phenol:o-DCB (2:3, m:v) was used while temperatures were 35ºC and 25ºC respectively.
Fig. 2. Correlation of intrinsic viscosity (IV) values obtained using the IVA method compared to IV determined according to standard method ISO 1628-3:2010 for a set of polypropylene samples. IVA was run in tri-chlorobenzene at 150ºC, using solutions prepared at 1 mg/mL; the ISO method was performed in decalin at 135ºC with solutions at 1-1.5 mg/mL The linear correlation is excellent as proved by the high R2 value.
Results and
Applications

0.00
0.00
5.00
5.00
10.00
10.00
15.00
15.00
20.00
20.00
25.00
25.00
30.00
IV o
bse
rved
at
low
flo
w r
ate
IV observed at high flow rate
y= 1.200xR2= 0.998
17.00
14.00
14.50
15.00
15.50
16.00
16.50
17.00
90 min
Ob
serv
ed I
V (
dL/
g)
180 min Dissolution time
No purge Nitrogen purge
Dissolution vial atmosphere
Sample IV (dL/g) std (IR) std (balance)
A 11.38 0.2 0.7
B 21.00 0.4 2.6
C 28.67 0.7 3.8
Quality Control for Polyolefins
47IVA APPLICATION NOTE
A study was conducted for a set of PE materials
spanning a very wide range in IV, in order to compare
the observed viscosity at two different flow rates.
Results depicted in Figure 3 show that an excellent
correlation was found, and therefore a high flow rate
determination can be performed in order to reduce
the analysis time, and still obtain data comparable to
lower shear conditions. The analysis time per sample
was reduced from half an hour to 4 minutes with the
increased flow rate.
Application example: Intrinsic Viscosity of
UHMWPE
Maybe one of the most challenging polymers for
analysis is ultra-high molar mass polyethylene
(UHMWPE). Those are high crystallinity materials with
extremely high values of IV, only soluble at elevated
temperatures in organic solvents. Special care must be
taken in sample preparation to prevent degradation,
which would reduce the apparent viscosity, and also
in the analysis, given the high viscosity of the [ηsp]
solutions.
Fig. 3. Observed intrinsic viscosity for a series or polyethylene
materials, in tri-chlorobenzene at 150ºC, using high and low
flow rate through the two-capillary viscometer. Fig. 4. Observed viscosity for an UHMWPE sample with
different dissolution time, with and without nitrogen purge
of the dissolution vial.
Dissolution temperature and time must be chosen
so that the polymer dissolves completely but also to
give the very long molecular chains enough time to
disentangle completely and obtain reliable viscosity
values. In Figure 4, data collected after 90 minutes or
180 minutes of dissolution show that longer time is
required to achieve that full disentanglement condition;
otherwise, the intrinsic viscosity is underestimated.
When the polymer stays at elevated temperature for
such long time, a nitrogen atmosphere is also required
to prevent oxidative degradation which also decreases
the observed viscosity a seen in the same Figure 4.
An infrared (IR) detector can be optionally used for
online accurate quantification of the injected mass,
which otherwise needs to be entered as weighed
using an analytical balance. The IR detector is
suitable for detection of polymers with aliphatic CH
groups, dissolved and analyzed in solvents that are IR
transparent, such as the important class of polyolefins
(polyethylene, polypropylene and copolymers), in TCB
or o-DCB.
In order to demonstrate the advantage in precision
when applying online IR quantification compared to
the offline balance, three different high molar mass PE
materials were analyzed at a low concentration level
of 0.25 or 0.15 mg/mL in TCB. Dissolution time was
1 hour with gentle shaking, at 140ºC under nitrogen
atmosphere, in order to minimize thermal and oxidative
degradation. Results are presented in Table 1, together
with standard deviation, when using the IR detector
for quantifying the injected mass, and when using
the nominal weight given by the analytical balance,
in the IV calculation. An improvement in the precision
is clearly seen when the actual mass measured by the
IR detector is considered, given it eliminates any errors
associated with handling small amounts of polymer by
the operator, but also due to the possible presence of
non-soluble particles.
Conclusions
A new technique has been developed for dilute solution
viscosity that is proven to be efficient, precise and safe.
A wide range of polymers soluble from ambient to
200ºC can be analyzed in a variety of solvents.
The proposed method takes an automated approach,
and performs all the needed steps without user
intervention nor solvent handling throughout the
whole process, paying special attention to the sample
condition, minimizing the degradation, as well as
to laboratory health and safety considerations.
Appropriate dissolution time control and purging of the
vial atmosphere with nitrogen both help in enhanced
reliability of the data, by reducing degradation
possibilities. The application of a fixed forced flow rate
for the IV determination maybe also help in improving
consistency of data by keeping constant shear in all
determinations, while increased flow rate provides
a net gain in efficiency while maintaining good
correlation of the method with lower shear values.
When applicable, the online IR detection helps in
improving the accuracy and precision of the method,
through the direct quantification of the true amount
of sample injected.
Table 1. Intrinsic viscosity (IV) for three industrial UHMWPE samples analyzed by IVA in TCB at 140ºC. Standard deviation based on 6 replicates when using the measured injected mass by IR, or using the nominal mass given by the analytical balance.
A technique that is
proven to be efficient,
precise, and safe
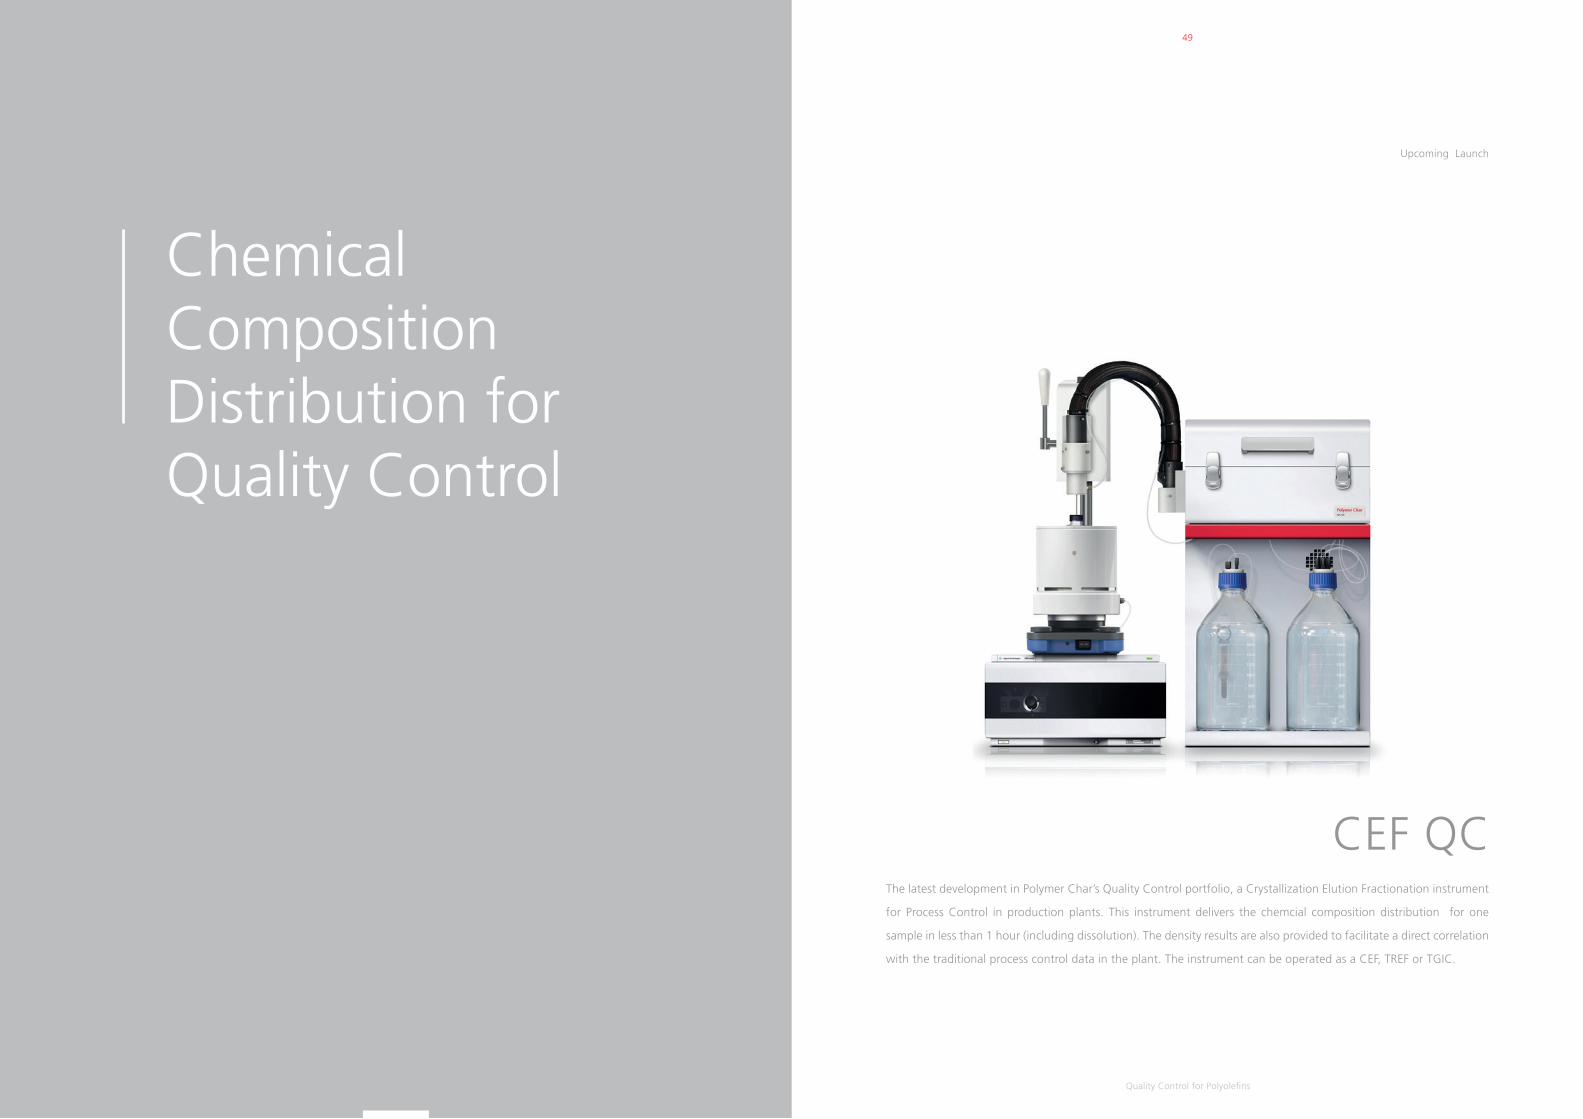
Quality Control for Polyolefins
49
Chemical Composition Distribution for Quality Control
CEF QCThe latest development in Polymer Char’s Quality Control portfolio, a Crystallization Elution Fractionation instrument
for Process Control in production plants. This instrument delivers the chemcial composition distribution for one
sample in less than 1 hour (including dissolution). The density results are also provided to facilitate a direct correlation
with the traditional process control data in the plant. The instrument can be operated as a CEF, TREF or TGIC.
Upcoming Launch

CONTACT USFor more on
Polymer Analysis
General Information
Telephone: +34 96 131 81 20
Email: [email protected]
Website: polymerchar.com
Other Inquiries
Sales
Email: [email protected]
Official Distributors: polymerchar.com/official_distributors
Analytical Services
Email: [email protected]
Services and rates: polymerchar.com/analytical_services
Service and Support
Email: [email protected]
Support: polymerchar.com/support
Literature and Events
Email: [email protected]
Online Library: polymerchar.com/library
Training and Events: polymerchar.com/training_and_events
Polymer Characterization, S.A.
Gustave Eiffel 8, Paterna
Valencia Technology Park
E-46980, Valencia, Spain
T.: +34 96 131 81 20
© 2018. Polymer Char is a Trademark of Polymer Characterization, S.A. Printed in Valencia, Spain.